Evaluation of Satellite-Derived Surface Soil Moisture Products over Agricultural Regions of Canada


Abstract
1. Introduction
2. Data and Methods
2.1. In Situ Soil Moisture Data
2.2. Satellite-Derived Soil Moisture Products
2.2.1. SMOS Products
2.2.2. ESA CCI Soil Moisture
2.2.3. Evaluation Strategy and Comparison Metrics
3. Results
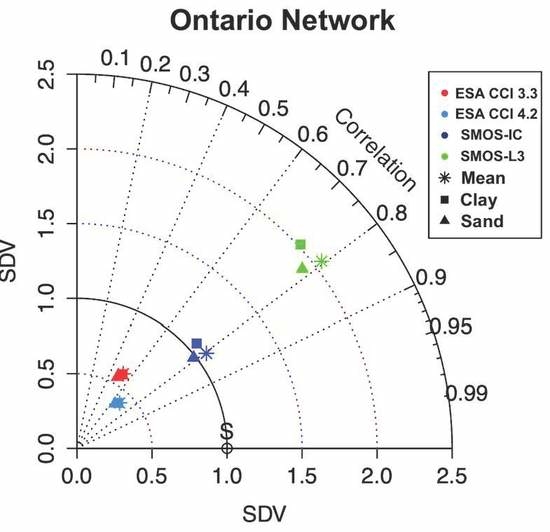
3.1. Comparison of the Satellite-Derived Products with In Situ Networks
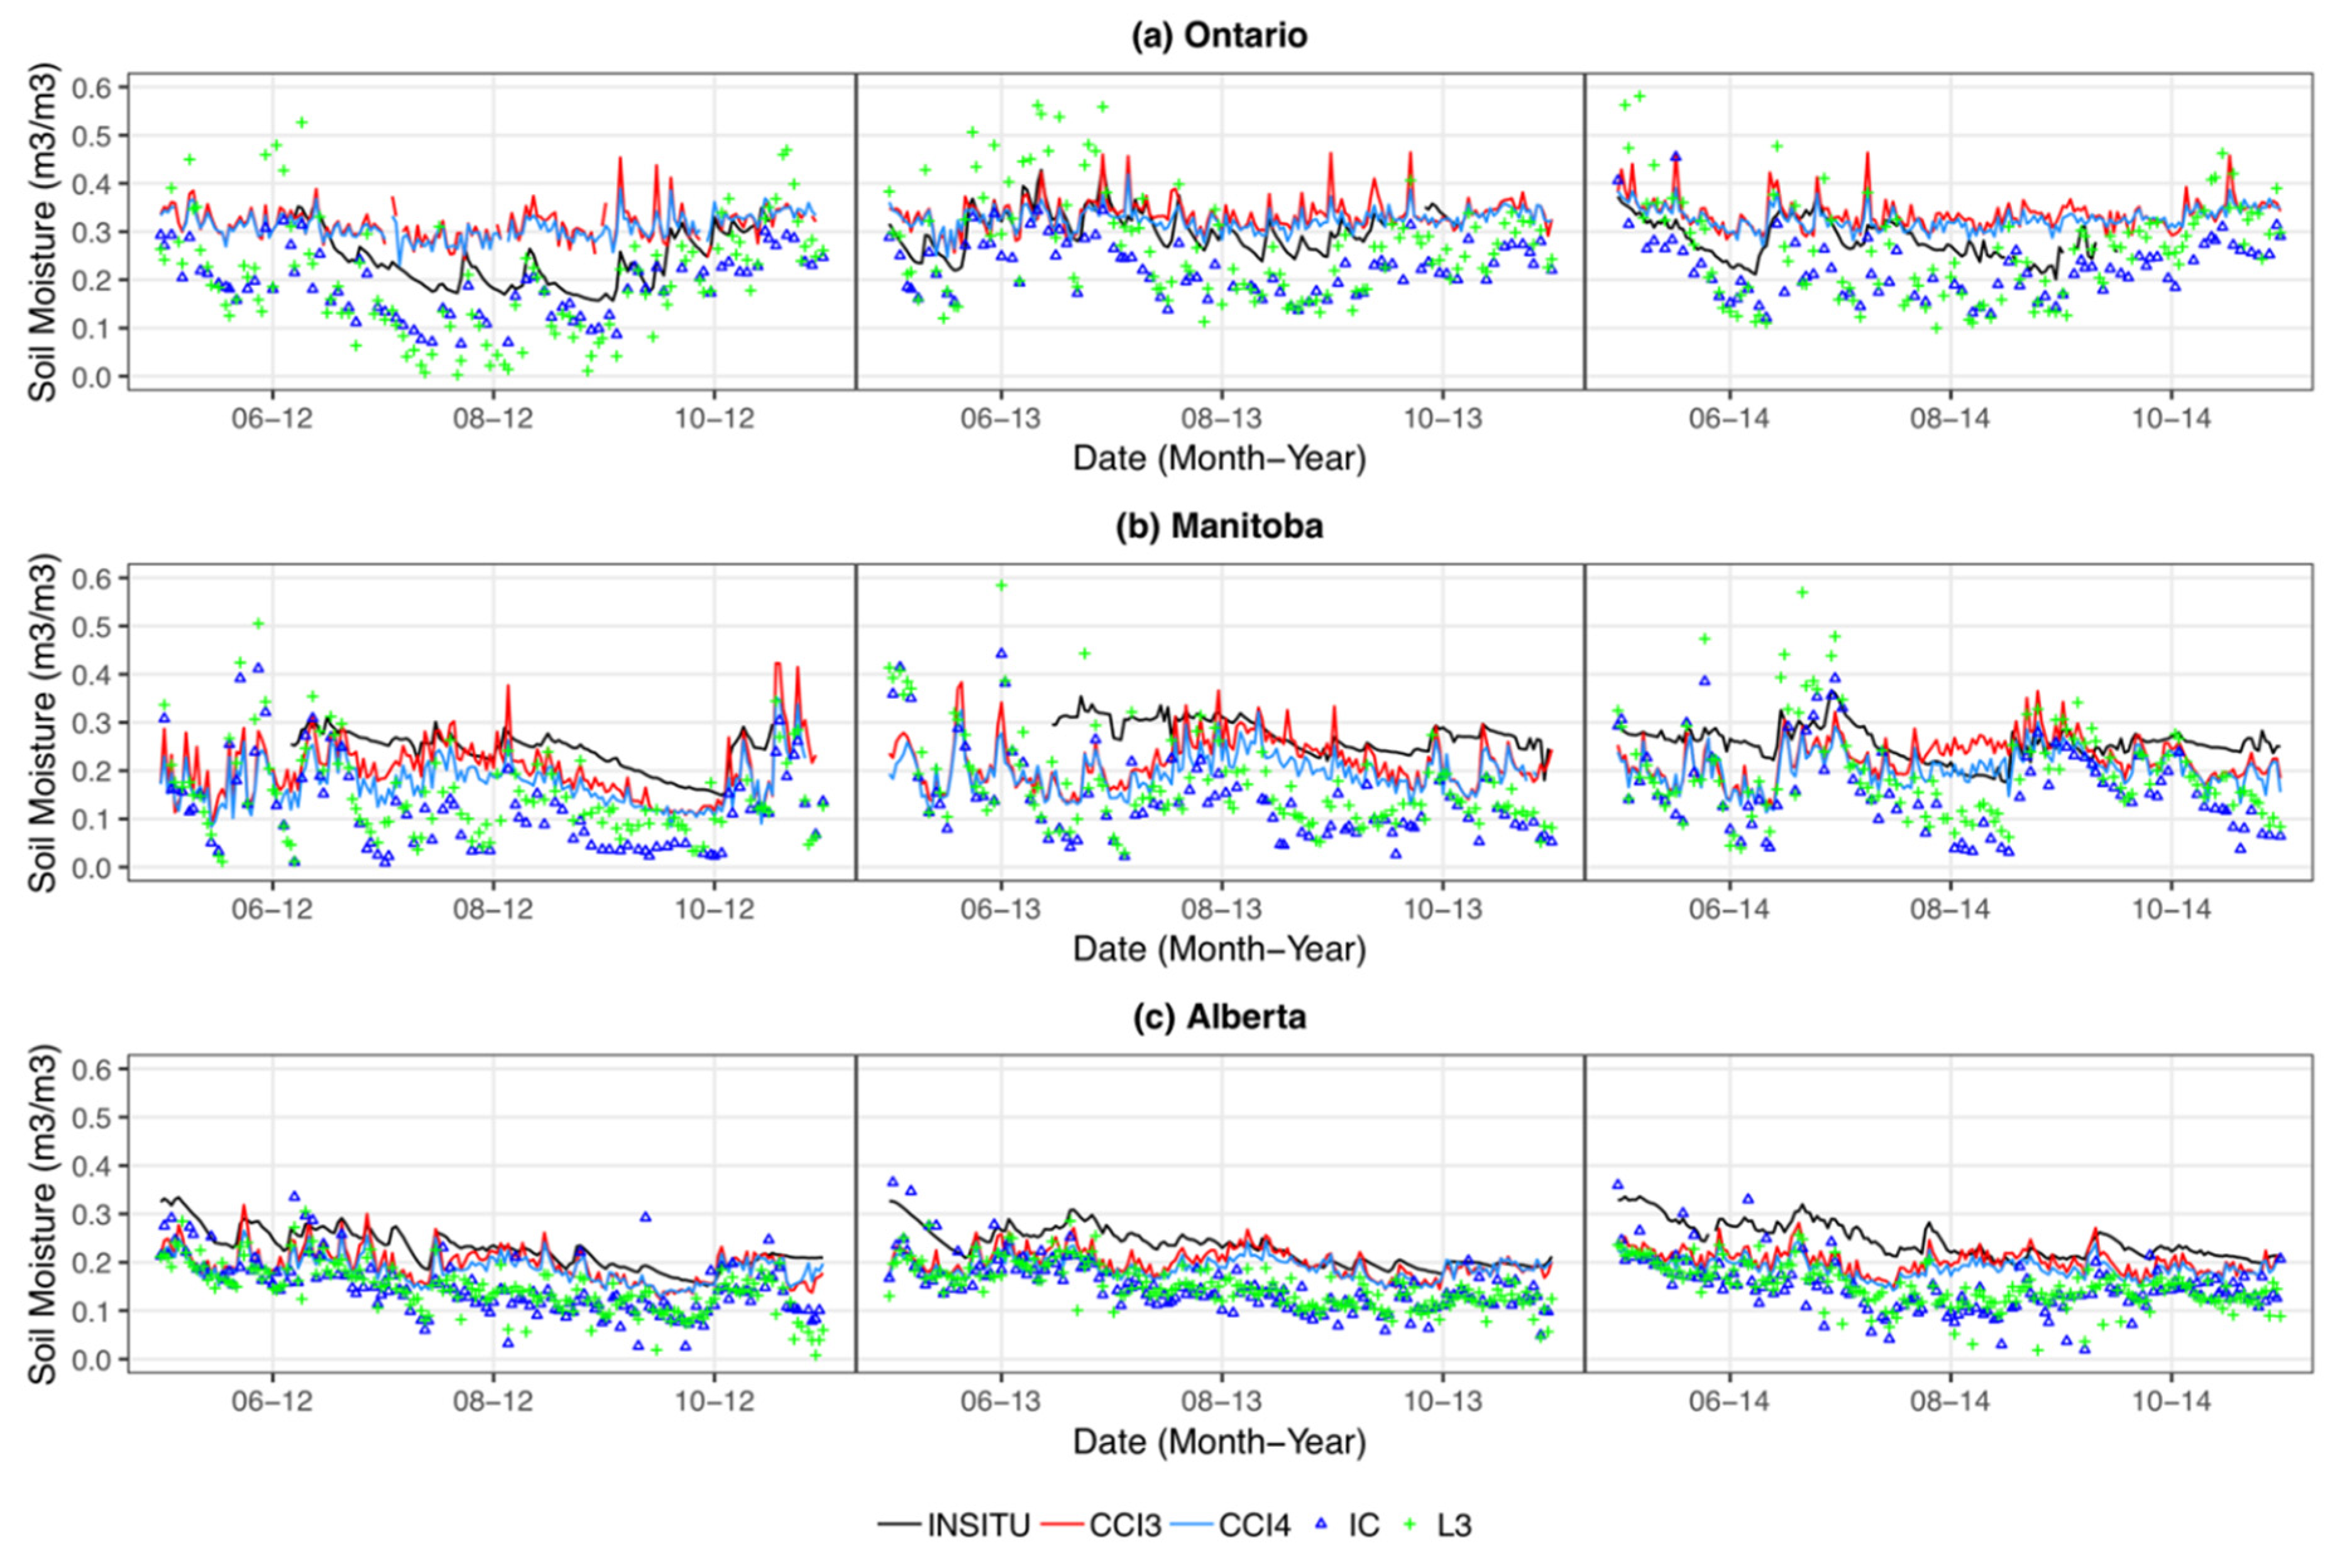
3.2. Capturing Wetting and Drying Events over Agricultural Landscapes Using Satellite-Based SM
4. Discussion and Conclusions
Author Contributions
Funding
Acknowledgments
Conflicts of Interest
References
- Koster, R.D. Regions of Strong Coupling Between Soil Moisture and Precipitation. Science 2004, 305, 1138–1140. [Google Scholar] [CrossRef] [PubMed]
- Wang, A.; Lettenmaier, D.P.; Sheffield, J. Soil Moisture Drought in China, 1950–2006. J. Clim. 2011, 24, 3257–3271. [Google Scholar] [CrossRef]
- Koster, R.D.; Mahanama, S.P.P.; Livneh, B.; Lettenmaier, D.P.; Reichle, R.H. Skill in streamflow forecasts derived from large-scale estimates of soil moisture and snow. Nat. Geosci. 2010, 3, 613–616. [Google Scholar] [CrossRef]
- Brocca, L.; Moramarco, T.; Melone, F.; Wagner, W.; Hasenauer, S.; Hahn, S. Assimilation of Surface- and Root-Zone ASCAT Soil Moisture Products Into Rainfall–Runoff Modeling. IEEE Trans. Geosci. Remote Sens. 2012, 50, 2542–2555. [Google Scholar] [CrossRef]
- Hollmann, R.; Merchant, C.J.; Saunders, R.; Downy, C.; Buchwitz, M.; Cazenave, A.; Chuvieco, E.; Defourny, P.; de Leeuw, G.; Forsberg, R.; et al. The ESA Climate Change Initiative: Satellite Data Records for Essential Climate Variables. Bull. Am. Meteorol. Soc. 2013, 94, 1541–1552. [Google Scholar] [CrossRef]
- McGinn, S.M.; Shepherd, A. Impact of climate change scenarios on the agroclimate of the Canadian prairies. Can. J. Soil Sci. 2003, 83, 623–630. [Google Scholar] [CrossRef]
- Parry, M.L. Climate change and world agriculture; Earthscan Publications Ltd.: London, UK, 1990. [Google Scholar]
- Dobriyal, P.; Qureshi, A.; Badola, R.; Hussain, S.A. A review of the methods available for estimating soil moisture and its implications for water resource management. J. Hydrol. 2012, 458–459, 110–117. [Google Scholar] [CrossRef]
- Cosh, M.; Jackson, T.J.; Bindlish, R.; Prueger, J. Watershed scale temporal and spatial stability of soil moisture and its role in validating satellite estimates. Remote Sens. Environ. 2004, 92, 427–435. [Google Scholar] [CrossRef]
- Krajewski, W.F.; Anderson, M.C.; Eichinger, W.E.; Entekhabi, D.; Hornbuckle, B.K.; Houser, P.R.; Katul, G.G.; Kustas, W.P.; Norman, J.M.; Peters-Lidard, C.; et al. A remote sensing observatory for hydrologic sciences: A genesis for scaling to continental hydrology. Water Resour. Res. 2006, 42. [Google Scholar] [CrossRef]
- Adams, J.R.; McNairn, H.; Berg, A.A.; Champagne, C. Evaluation of near-surface soil moisture data from an AAFC monitoring network in Manitoba, Canada: Implications for L-band satellite validation. J. Hydrol. 2015, 521, 582–592. [Google Scholar] [CrossRef]
- Ulaby, F.T.; Moore, R.K.; Fung, A.K. Microwave Remote Sensing: Active and Passive. Volume 2-Radar Remote Sensing and Surface Scattering and Emission Theory; NASA: Washington, DC, USA, 1982.
- Wagner, W.; Lemoine, G.; Borgeaud, M.; Rott, H. A study of vegetation cover effects on ERS scatterometer data. IEEE Trans. Geosci. Remote Sens. 1999, 37, 938–948. [Google Scholar] [CrossRef]
- Oliva, R.; Daganzo, E.; Kerr, Y.H.; Mecklenburg, S.; Nieto, S.; Richaume, P.; Gruhier, C. SMOS Radio Frequency Interference Scenario: Status and Actions Taken to Improve the RFI Environment in the 1400–1427-MHz Passive Band. IEEE Trans. Geosci. Remote Sens. 2012, 50, 1427–1439. [Google Scholar] [CrossRef]
- Parinussa, R.M.; Meesters, A.G.C.A.; Liu, Y.Y.; Dorigo, W.; Wagner, W.; de Jeu, R.A.M. Error Estimates for Near-Real-Time Satellite Soil Moisture as Derived From the Land Parameter Retrieval Model. IEEE Geosci. Remote Sens. Lett. 2011, 8, 779–783. [Google Scholar] [CrossRef]
- Jackson, T.J. III. Measuring surface soil moisture using passive microwave remote sensing. Hydrol. Process. 1993, 7, 139–152. [Google Scholar] [CrossRef]
- Moran, M.S.; Peters-Lidard, C.D.; Watts, J.M.; McElroy, S. Estimating soil moisture at the watershed scale with satellite-based radar and land surface models. Can. J. Remote Sens. 2004, 30, 805–826. [Google Scholar] [CrossRef]
- Kerr, Y.H.; Waldteufel, P.; Wigneron, J.-P.; Martinuzzi, J.; Font, J.; Berger, M. Soil moisture retrieval from space: The Soil Moisture and Ocean Salinity (SMOS) mission. IEEE Trans. Geosci. Remote Sens. 2001, 39, 1729–1735. [Google Scholar] [CrossRef]
- Kerr, Y.H.; Waldteufel, P.; Wigneron, J.-P.; Delwart, S.; Cabot, F.; Boutin, J.; Escorihuela, M.-J.; Font, J.; Reul, N.; Gruhier, C.; et al. The SMOS Mission: New Tool for Monitoring Key Elements ofthe Global Water Cycle. Proc. IEEE 2010, 98, 666–687. [Google Scholar] [CrossRef]
- Entekhabi, D.; Njoku, E.G.; O’Neill, P.E.; Kellogg, K.H.; Crow, W.T.; Edelstein, W.N.; Entin, J.K.; Goodman, S.D.; Jackson, T.J.; Johnson, J.; et al. The Soil Moisture Active Passive (SMAP) Mission. Proc. IEEE 2010, 98, 704–716. [Google Scholar] [CrossRef]
- Jackson, T.J.; Cosh, M.H.; Bindlish, R.; Starks, P.J.; Bosch, D.D.; Seyfried, M.; Goodrich, D.C.; Moran, M.S.; Du, J. Validation of Advanced Microwave Scanning Radiometer Soil Moisture Products. IEEE Trans. Geosci. Remote Sens. 2010, 48, 4256–4272. [Google Scholar] [CrossRef]
- Chanzy, A.; Schmugge, T.J.; Calvet, J.-C.; Kerr, Y.; van Oevelen, P.; Grosjean, O.; Wang, J.R. Airborne microwave radiometry on a semi-arid area during HAPEX-Sahel. J. Hydrol. 1997, 188–189, 285–309. [Google Scholar] [CrossRef]
- Schmugge, T.; Jackson, T.J. Mapping surface soil moisture with microwave radiometers. Meteorol. Atmos. Phys. 1994, 54, 213–223. [Google Scholar] [CrossRef]
- Champagne, C.; Davidson, A.; Cherneski, P.; L’Heureux, J.; Hadwen, T. Monitoring Agricultural Risk in Canada Using L-Band Passive Microwave Soil Moisture from SMOS. J. Hydrometeorol. 2015, 16, 5–18. [Google Scholar] [CrossRef]
- Champagne, C.; Rowlandson, T.; Berg, A.; Burns, T.; L’Heureux, J.; Tetlock, E.; Adams, J.R.; McNairn, H.; Toth, B.; Itenfisu, D. Satellite surface soil moisture from SMOS and Aquarius: Assessment for applications in agricultural landscapes. Int. J. Appl. Earth Obs. Geoinf. 2016, 45, 143–154. [Google Scholar] [CrossRef]
- Al Bitar, A.; Leroux, D.; Kerr, Y.H.; Merlin, O.; Richaume, P.; Sahoo, A.; Wood, E.F. Evaluation of SMOS Soil Moisture Products Over Continental U.S. Using the SCAN/SNOTEL Network. IEEE Trans. Geosci. Remote Sens. 2012, 50, 1572–1586. [Google Scholar] [CrossRef]
- dall’Amico, J.T.; Schlenz, F.; Loew, A.; Mauser, W. First Results of SMOS Soil Moisture Validation in the Upper Danube Catchment. IEEE Trans. Geosci. Remote Sens. 2012, 50, 1507–1516. [Google Scholar] [CrossRef]
- Djamai, N.; Magagi, R.; Goïta, K.; Hosseini, M.; Cosh, M.H.; Berg, A.; Toth, B. Evaluation of SMOS soil moisture products over the CanEx-SM10 area. J. Hydrol. 2015, 520, 254–267. [Google Scholar] [CrossRef]
- Jackson, T.J.; Bindlish, R.; Cosh, M.H.; Zhao, T.; Starks, P.J.; Bosch, D.D.; Seyfried, M.; Moran, M.S.; Goodrich, D.C.; Kerr, Y.H.; et al. Validation of Soil Moisture and Ocean Salinity (SMOS) Soil Moisture Over Watershed Networks in the U.S. IEEE Trans. Geosci. Remote Sens. 2012, 50, 1530–1543. [Google Scholar] [CrossRef]
- Lacava, T.; Matgen, P.; Brocca, L.; Bittelli, M.; Pergola, N.; Moramarco, T.; Tramutoli, V. A First Assessment of the SMOS Soil Moisture Product With In Situ and Modeled Data in Italy and Luxembourg. IEEE Trans. Geosci. Remote Sens. 2012, 50, 1612–1622. [Google Scholar] [CrossRef]
- Al Bitar, A.; Mialon, A.; Kerr, Y.H.; Cabot, F.; Richaume, P.; Jacquette, E.; Quesney, A.; Mahmoodi, A.; Tarot, S.; Parrens, M.; et al. The global SMOS Level 3 daily soil moisture and brightness temperature maps. Earth Syst. Sci. Data 2017, 9, 293–315. [Google Scholar] [CrossRef]
- Fernandez-Moran, R.; Al-Yaari, A.; Mialon, A.; Mahmoodi, A.; Al Bitar, A.; De Lannoy, G.; Rodriguez-Fernandez, N.; Lopez-Baeza, E.; Kerr, Y.; Wigneron, J. SMOS-IC: An Alternative SMOS Soil Moisture and Vegetation Optical Depth Product. Remote Sens. 2017, 9, 457. [Google Scholar] [CrossRef]
- Liu, Y.Y.; Parinussa, R.M.; Dorigo, W.A.; De Jeu, R.A.M.; Wagner, W.; van Dijk, A.I.J.M.; McCabe, M.F.; Evans, J.P. Developing an improved soil moisture dataset by blending passive and active microwave satellite-based retrievals. Hydrol. Earth Syst. Sci. 2011, 15, 425–436. [Google Scholar] [CrossRef]
- Mudryk, L.R.; Derksen, C.; Kushner, P.J.; Brown, R. Characterization of Northern Hemisphere Snow Water Equivalent Datasets, 1981–2010. J. Clim. 2015, 28, 8037–8051. [Google Scholar] [CrossRef]
- Dorigo, W.; Wagner, W.; Albergel, C.; Albrecht, F.; Balsamo, G.; Brocca, L.; Chung, D.; Ertl, M.; Forkel, M.; Gruber, A.; et al. ESA CCI Soil Moisture for improved Earth system understanding: State-of-the art and future directions. Remote Sens. Environ. 2017, 203, 185–215. [Google Scholar] [CrossRef]
- González-Zamora, A.; Sánchez, N.; Pablos, M.; Martínez-Fernández, J. CCI soil moisture assessment with SMOS soil moisture and in situ data under different environmental conditions and spatial scales in Spain. Remote Sens. Environ. 2019, 225, 469–482. [Google Scholar]
- Pratola, C.; Barrett, B.; Gruber, A.; Dwyer, E. Quality assessment of the CCI ECV soil moisture product using ENVISAT ASAR wide swath data over Spain, Ireland and Finland. Remote Sens. 2015, 7, 15388–15423. [Google Scholar] [CrossRef]
- Ikonen, J.; Vehviläinen, J.; Rautiainen, K.; Smolander, T.; Lemmetyinen, J.; Bircher, S.; Pulliainen, J. The Sodankylä in situ soil moisture observation network: An example application of ESA CCI soil moisture product evaluation. Geosci. Instrum. Methods Data Syst. 2016, 5, 95–108. [Google Scholar] [CrossRef]
- An, R.; Zhang, L.; Wang, Z.; Quaye-Ballard, J.A.; You, J.; Shen, X.; Gao, W.; Huang, L.J.; Zhao, Y.; Ke, Z. Validation of the ESA CCI soil moisture product in China. Int. J. Appl. Earth Obs. Geoinf. 2016, 48, 28–36. [Google Scholar] [CrossRef]
- Peng, J.; Niesel, J.; Loew, A.; Zhang, S.; Wang, J. Evaluation of satellite and reanalysis soil moisture products over southwest China using ground-based measurements. Remote Sens. 2015, 7, 15729–15747. [Google Scholar] [CrossRef]
- Cui, C.; Xu, J.; Zeng, J.; Chen, K.S.; Bai, X.; Lu, H.; Chen, Q.; Zhao, T. Soil moisture mapping from satellites: An intercomparison of SMAP, SMOS, FY3B, AMSR2, and ESA CCI over two dense network regions at different spatial scales. Remote Sens. 2018, 10, 33. [Google Scholar] [CrossRef]
- Zhu, L.; Wang, H.; Tong, C.; Liu, W.; Du, B. Evaluation of ESA Active, Passive and Combined Soil Moisture Products Using Upscaled Ground Measurements. Sensors (Basel). 2019, 19, 2718. [Google Scholar] [CrossRef]
- Champagne, C.; White, J.; Berg, A.; Belair, S.; Carrera, M. Impact of Soil Moisture Data Characteristics on the Sensitivity to Crop Yields Under Drought and Excess Moisture Conditions. Remote Sens. 2019, 11, 372. [Google Scholar] [CrossRef]
- EODC. Algorithm Theoretical Baseline Document (ATBD) Merging Active and Passive Soil Moisture Retrievals D2.1 Version 04.2. EODC, 2018. [Google Scholar]
- Roy, A.; Royer, A.; Derksen, C.; Brucker, L.; Langlois, A.; Mialon, A.; Kerr, Y.H. Evaluation of Spaceborne L-Band Radiometer Measurements for Terrestrial Freeze/Thaw Retrievals in Canada. IEEE J. Sel. Top. Appl. Earth Obs. Remote Sens. 2015, 8, 4442–4459. [Google Scholar] [CrossRef]
- Kędzior, M.; Zawadzki, J. Comparative study of soil moisture estimations from SMOS satellite mission, GLDAS database, and cosmic-ray neutrons measurements at COSMOS station in Eastern Poland. Geoderma 2016, 283, 21–31. [Google Scholar] [CrossRef]
- Peterson, A.M.; Helgason, W.D.; Ireson, A.M. Estimating field-scale root zone soil moisture using the cosmic-ray neutron probe. Hydrol. Earth Syst. Sci. 2016, 20, 1373–1385. [Google Scholar] [CrossRef]
- ESA. Land Cover CCI Product User Guide Version 2.0; ESA: Paris, France, 2017. [Google Scholar]
- AAFC. Real-Time In-Situ Soil Monitoring for Agriculture (RISMA) Network Metadata; Agriculture and Agri-Food Canada: Burnaby, BC, Canada, 2019.
- Kerr, Y.H.; Waldteufel, P.; Richaume, P.; Wigneron, J.P.; Ferrazzoli, P.; Mahmoodi, A.; Al Bitar, A.; Cabot, F.; Gruhier, C.; Juglea, S.E.; et al. The SMOS Soil Moisture Retrieval Algorithm. IEEE Trans. Geosci. Remote Sens. 2012, 50, 1384–1403. [Google Scholar] [CrossRef]
- Wigneron, J.-P.; Kerr, Y.; Waldteufel, P.; Saleh, K.; Escorihuela, M.-J.; Richaume, P.; Ferrazzoli, P.; de Rosnay, P.; Gurney, R.; Calvet, J.-C.; et al. L-band Microwave Emission of the Biosphere (L-MEB) Model: Description and calibration against experimental data sets over crop fields. Remote Sens. Environ. 2007, 107, 639–655. [Google Scholar] [CrossRef]
- Fernandez-Moran, R.; Wigneron, J.-P.; De Lannoy, G.; Lopez-Baeza, E.; Mialon, A.; Mahmoodi, A.; Parrens, M.; Al Bitar, A.; Richaume, P.; Kerr, Y. Calibrating the effective scattering albedo in the SMOS algorithm: Some first results. In Proceedings of the 2016 IEEE International Geoscience and Remote Sensing Symposium (IGARSS), Beijing, China , 10–15 July 2016 ; pp. 826–829. [Google Scholar]
- Parrens, M.; Wigneron, J.-P.; Richaume, P.; Mialon, A.; Al Bitar, A.; Fernandez-Moran, R.; Al-Yaari, A.; Kerr, Y.H. Global-scale surface roughness effects at L-band as estimated from SMOS observations. Remote Sens. Environ. 2016, 181, 122–136. [Google Scholar] [CrossRef]
- Owe, M.; de Jeu, R.; Holmes, T. Multisensor historical climatology of satellite-derived global land surface moisture. J. Geophys. Res. 2008, 113, F01002. [Google Scholar] [CrossRef]
- Naeimi, V.; Scipal, K.; Bartalis, Z.; Hasenauer, S.; Wagner, W. An Improved Soil Moisture Retrieval Algorithm for ERS and METOP Scatterometer Observations. IEEE Trans. Geosci. Remote Sens. 2009, 47, 1999–2013. [Google Scholar] [CrossRef]
- Wagner, W.; Lemoine, G.; Rott, H. A Method for Estimating Soil Moisture from ERS Scatterometer and Soil Data. Remote Sens. Environ. 1999, 70, 191–207. [Google Scholar] [CrossRef]
- Liu, Y.Y.; Dorigo, W.A.; Parinussa, R.M.; de Jeu, R.A.M.; Wagner, W.; McCabe, M.F.; Evans, J.P.; van Dijk, A.I.J.M. Trend-preserving blending of passive and active microwave soil moisture retrievals. Remote Sens. Environ. 2012, 123, 280–297. [Google Scholar] [CrossRef]
- Wagner, W.; Dorigo, W.; de Jeu, R.; Fernandez-Prieto, D.; Benveniste, J.; Haas, E.; Ertl, M. Fusion of active and passive microwave observations to create an essential climate variable data record on soil moisture. In Proceedings of the ISPRS Annals of the Photogrammetry, Remote Sensing and Spatial Information Sciences; XXII ISPRS Congress, Melbourne, Australia, 25 August–1 September 2012; pp. 1–7. [Google Scholar]
- Wagner, W.; Hahn, S.; Kidd, R.; Melzer, T.; Bartalis, Z.; Hasenauer, S.; Figa-Saldaña, J.; de Rosnay, P.; Jann, A.; Schneider, S.; et al. The ASCAT Soil Moisture Product: A Review of its Specifications, Validation Results, and Emerging Applications. Meteorol. Zeitschrift 2013, 22, 5–33. [Google Scholar] [CrossRef]
- Rodell, M.; Houser, P.R.; Jambor, U.; Gottschalck, J.; Mitchell, K.; Meng, C.-J.; Arsenault, K.; Cosgrove, B.; Radakovich, J.; Bosilovich, M.; et al. The Global Land Data Assimilation System. Bull. Am. Meteorol. Soc. 2004, 85, 381–394. [Google Scholar] [CrossRef]
- Gruber, A.; Su, C.-H.; Zwieback, S.; Crow, W.; Dorigo, W.; Wagner, W. Recent advances in (soil moisture) triple collocation analysis. Int. J. Appl. Earth Obs. Geoinf. 2016, 45, 200–211. [Google Scholar] [CrossRef]
- Parinussa, R.M.; Holmes, T.R.H.; Wanders, N.; Dorigo, W.A.; de Jeu, R.A.M. A Preliminary Study toward Consistent Soil Moisture from AMSR2. J. Hydrometeorol. 2015, 16, 932–947. [Google Scholar] [CrossRef]
- van der Schalie, R.; de Jeu, R.; Parinussa, R.; Rodríguez-Fernández, N.; Kerr, Y.; Al-Yaari, A.; Wigneron, J.-P.; Drusch, M. The Effect of Three Different Data Fusion Approaches on the Quality of Soil Moisture Retrievals from Multiple Passive Microwave Sensors. Remote Sens. 2018, 10, 107. [Google Scholar] [CrossRef]
- Crow, W.T.; Koster, R.D.; Reichle, R.H.; Sharif, H.O. Relevance of time-varying and time-invariant retrieval error sources on the utility of spaceborne soil moisture products. Geophys. Res. Lett. 2005, 32, L24405. [Google Scholar] [CrossRef]
- R-core@R-project.org, R. kruskal.test. Available online: https://www.rdocumentation.org/packages/stats/versions/3.6.2/topics/kruskal.test (accessed on 1 February 2020).
- R-core@R-project.org, R. wilcox.test. Available online: https://www.rdocumentation.org/packages/stats/versions/3.6.2/topics/wilcox.test (accessed on 1 February 2020).
- Al-Yaari, A.; Wigneron, J.-P.; Dorigo, W.; Colliander, A.; Pellarin, T.; Hahn, S.; Mialon, A.; Richaume, P.; Fernandez-Moran, R.; Fan, L.; et al. Assessment and inter-comparison of recently developed/reprocessed microwave satellite soil moisture products using ISMN ground-based measurements. Remote Sens. Environ. 2019, 224, 289–303. [Google Scholar] [CrossRef]
- Qiu, J.; Gao, Q.; Wang, S.; Su, Z. Comparison of temporal trends from multiple soil moisture data sets and precipitation: The implication of irrigation on regional soil moisture trend. Int. J. Appl. Earth Obs. Geoinf. 2016, 48, 17–27. [Google Scholar] [CrossRef]
- Taylor, K.E. Summarizing multiple aspects of model performance in a single diagram. J. Geophys. Res. Atmos. 2001, 106, 7183–7192. [Google Scholar] [CrossRef]
- Escorihuela, M.J.; Chanzy, A.; Wigneron, J.P.; Kerr, Y.H. Effective soil moisture sampling depth of L-band radiometry: A case study. Remote Sens. Environ. 2010, 114, 995–1001. [Google Scholar] [CrossRef]
- Miller, C.J.; Yesiller, N.; Yaldo, K.; Merayyan, S. Impact of Soil Type and Compaction Conditions on Soil Water Characteristic. J. Geotech. Geoenvironmental Eng. 2002, 128, 733–742. [Google Scholar] [CrossRef]
- El Hajj, M.; Baghdadi, N.; Zribi, M.; Rodríguez-Fernández, N.; Wigneron, J.; Al-Yaari, A.; Al Bitar, A.; Albergel, C.; Calvet, J.-C. Evaluation of SMOS, SMAP, ASCAT and Sentinel-1 Soil Moisture Products at Sites in Southwestern France. Remote Sens. 2018, 10, 569. [Google Scholar] [CrossRef]
- Loew, A.; Stacke, T.; Dorigo, W.; De Jeu, R.; Hagemann, S. Potential and limitations of multidecadal satellite soil moisture observations for selected climate model evaluation studies. Hydrol. Earth Syst. Sci. 2013, 17, 3523–3542. [Google Scholar] [CrossRef]
- Dorigo, W.A.; Gruber, A.; De Jeu, R.A.M.; Wagner, W.; Stacke, T.; Loew, A.; Albergel, C.; Brocca, L.; Chung, D.; Parinussa, R.M.; et al. Evaluation of the ESA CCI soil moisture product using ground-based observations. Remote Sens. Environ. 2015, 162, 380–395. [Google Scholar] [CrossRef]
- Hersbach, H.; Dee, D. ERA5 reanalysis is in production, ECMWF Newsletter. Spring 2016, 147, 7. [Google Scholar]
- Champagne, C.; Zhang, Y.; Cherneski, P.; Hadwen, T. Estimating Regional Scale Hydroclimatic Risk Conditions from the Soil Moisture Active-Passive (SMAP) Satellite. Geosciences 2018, 8, 127. [Google Scholar] [CrossRef]


| Soil texture type | Ontario | Manitoba |
|---|---|---|
| Sand (Sand, Sand Loam, Loam) | ON2, ON5 | MB1, MB4, MB7, MB9 |
| Clay (Clay, Heavy Clay, Clay Loam, Sandy Clay Loam) | ON1, ON3, ON4 | MB2, MB3, MB5, MB6, MB8 |
| In situ | Location | CCI3 | CCI4 | IC | L3 |
|---|---|---|---|---|---|
| SM’ > 0 (Wetting) | Ontario | 0.62 | 0.69 | 0.7 | 0.72 |
| Manitoba | 0.6 | 0.61 | 0.57 | 0.58 | |
| Alberta | 0.65 | 0.65 | 0.73 | 0.73 | |
| SM’ < 0 (Drying) | Ontario | 0.74 | 0.79 | 0.86 | 0.85 |
| Manitoba | 0.55 | 0.61 | 0.75 | 0.75 | |
| Alberta | 0.66 | 0.69 | 0.75 | 0.73 |
| Sign of Anomaly | Location | Median of SM anomaly values | Kruskal–Wallis Test (P-values) | ||||
|---|---|---|---|---|---|---|---|
| In Situ | CCI3 | CCI4 | IC | L3 | |||
| SM’ > 0 (Wetting) | Ontario | 0.63 | 0.23 | 0.28 | 0.36 | 0.37 | < 0.05 |
| Manitoba | 0.67 | 0.21 | 0.22 | 0.11 | 0.15 | <0.05 | |
| Alberta | 0.92 | 0.32 | 0.33 | 0.49 | 0.44 | <0.05 | |
| SM’ < 0 (Drying) | Ontario | −0.82 | −0.54 | −0.54 | −0.75 | −0.68 | <0.05 |
| Manitoba | −0.68 | −0.09 | −0.26 | −0.67 | −0.52 | <0.05 | |
| Alberta | −0.80 | −0.34 | −0.42 | −0.56 | −0.48 | <0.05 | |
© 2020 by the authors. Licensee MDPI, Basel, Switzerland. This article is an open access article distributed under the terms and conditions of the Creative Commons Attribution (CC BY) license (http://creativecommons.org/licenses/by/4.0/).
Share and Cite
Oozeer, Y.; Fletcher, C.G.; Champagne, C. Evaluation of Satellite-Derived Surface Soil Moisture Products over Agricultural Regions of Canada. Remote Sens. 2020, 12, 1455. https://doi.org/10.3390/rs12091455
Oozeer Y, Fletcher CG, Champagne C. Evaluation of Satellite-Derived Surface Soil Moisture Products over Agricultural Regions of Canada. Remote Sensing. 2020; 12(9):1455. https://doi.org/10.3390/rs12091455
Chicago/Turabian StyleOozeer, Yaasiin, Christopher G. Fletcher, and Catherine Champagne. 2020. "Evaluation of Satellite-Derived Surface Soil Moisture Products over Agricultural Regions of Canada" Remote Sensing 12, no. 9: 1455. https://doi.org/10.3390/rs12091455
APA StyleOozeer, Y., Fletcher, C. G., & Champagne, C. (2020). Evaluation of Satellite-Derived Surface Soil Moisture Products over Agricultural Regions of Canada. Remote Sensing, 12(9), 1455. https://doi.org/10.3390/rs12091455