Article

Near-Field Remote Sensing of Surface Velocity and River Discharge Using Radars and the Probability Concept at 10 U.S. Geological Survey Streamgages

by
John W. Fulton
1,*,
Christopher A. Mason
1,
John R. Eggleston
1,
Matthew J. Nicotra
1,
Chao-Lin Chiu
2,
Mark F. Henneberg
1,
Heather R. Best
1,
Jay R. Cederberg
1,
Stephen R. Holnbeck
1,
R. Russell Lotspeich
1,
Christopher D. Laveau
1,
Tommaso Moramarco
3,
Mark E. Jones
1,
Jonathan J. Gourley
4 and
Daniel Wasielewski
4
1
U.S. Geological Survey, U.S. Geological Survey, Denver Federal Center, Box 25046, MS 415, Denver, CO 80225, USA
2
Civil and Environmental Engineering, University of Pittsburgh, 724 Field Club Rd, Pittsburgh, PA 15238, USA
3
IRPI-Consiglio Nazionale delle Ricerche, Research Institute for Hydrogeological Protection, National Research Council, via della Madonna Alta 126, 06128 Perugia, Italy
4
NOAA National Severe Storms Laboratory, NOAA/National Severe Storms Laboratory, National Weather Center, 120 David L. Boren Blvd., Norman, OK 73072 USA
*
Author to whom correspondence should be addressed.
Remote Sens. 2020, 12(8), 1296; https://doi.org/10.3390/rs12081296
Submission received: 15 February 2020 / Revised: 16 April 2020 / Accepted: 17 April 2020 / Published: 20 April 2020

Abstract

:
Near-field remote sensing of surface velocity and river discharge (discharge) were measured using coherent, continuous wave Doppler and pulsed radars. Traditional streamgaging requires sensors be deployed in the water column; however, near-field remote sensing has the potential to transform streamgaging operations through non-contact methods in the U.S. Geological Survey (USGS) and other agencies around the world. To differentiate from satellite or high-altitude platforms, near-field remote sensing is conducted from fixed platforms such as bridges and cable stays. Radar gages were collocated with 10 USGS streamgages in river reaches of varying hydrologic and hydraulic characteristics, where basin size ranged from 381 to 66,200 square kilometers. Radar-derived mean-channel (mean) velocity and discharge were computed using the probability concept and were compared to conventional instantaneous measurements and time series. To test the efficacy of near-field methods, radars were deployed for extended periods of time to capture a range of hydraulic conditions and environmental factors. During the operational phase, continuous time series of surface velocity, radar-derived discharge, and stage-discharge were recorded, computed, and transmitted contemporaneously and continuously in real time every 5 to 15 min. Minimum and maximum surface velocities ranged from 0.30 to 3.84 m per second (m/s); minimum and maximum radar-derived discharges ranged from 0.17 to 4890 cubic meters per second (m3/s); and minimum and maximum stage-discharge ranged from 0.12 to 4950 m3/s. Comparisons between radar and stage-discharge time series were evaluated using goodness-of-fit statistics, which provided a measure of the utility of the probability concept to compute discharge from a singular surface velocity and cross-sectional area relative to conventional methods. Mean velocity and discharge data indicate that velocity radars are highly correlated with conventional methods and are a viable near-field remote sensing technology that can be operationalized to deliver real-time surface velocity, mean velocity, and discharge.

Graphical Abstract

1. Introduction

The U.S. Geological Survey (USGS) operates approximately 10,330 streamgages in the United States (U.S.), Puerto Rico, and Virgin Islands. The streamgage network constitutes one of the largest in the world [1]. Approximately 80,000 river discharge (discharge or streamflow) measurements are made annually to create or maintain stage-discharge ratings, which relate a stage (water-level elevation) to a discharge. These data are used by various end users for water-resources planning, water-supply/flood/drought forecasting, and early warning networks [1]. Traditional measurements of velocity and discharge are recorded using sensors that are deployed in the water column. At most of these sites, water levels are measured using stilling wells or pressure transducers and converted to discharges that are empirically derived from a rating curve. Because of temporal changes in hydraulics and channel morphology, periodic measurements are needed to maintain the stage-discharge ratings. Typically, data are collected every 6 weeks and during select hydraulic events using mechanical current meters [2,3] or hydroacoustic instrumentation [4,5,6,7,8,9,10,11], including acoustic Doppler velocimeters (ADVs) and acoustic Doppler current profilers (ADCPs). These measurements record velocity and cross-sectional area, which are used to compute discharge.
The near-field remote sensing of streams and rivers has the potential to transform streamgaging operations in the USGS and other agencies around the world. Traditional remote sensing studies focus on satellite-based platforms—which rely largely on imagery, radar altimeters, and physically based fluvial models—to measure top widths and surface-water elevations and compute reach-based river discharge. This research focuses on near-field remote sensing, which offers an alternative worldview, to measure surface velocities and compute at-a-section river discharge using an efficient algorithm based on the probability concept (PC). The probability concept solves the assumption of a monotonic velocity distribution, which serves as the basis for other remote sensing studies such as particle image velocimetry (PIV) and particle tracking velocimetry (PTV). This research demonstrates that regardless of the method selected (physically based, field based, or probability based) computing river discharge can be achieved using multiple methods. It is the end user’s choice to decide which methods are most appropriate for their application.
Particle image and tracking velocimetry has emerged as a method for measuring surface velocity and computing discharge from the ground [12,13,14], from small, unmanned aircraft systems (sUAS) [15,16,17], and from manned aircraft systems [18]. Satellite-based sensors [19,20,21,22,23,24,25,26,27,28,29,30,31,32,33,34,35,36,37,38,39,40,41,42,43,44,45,46,47] can be used to derive parameters such as water elevation, slope, and top width. These parameters are used to compute discharge in regions where streamgage networks are lacking. Pulsed Doppler and coherent Doppler velocity radars have been deployed from river banks [48], helicopters [49], sUAS [50], and can be coupled with pulsed (stage) radars from portable and fixed platforms such as bridges and cable stays [51,52,53]. Although this collection of research has advanced the field of remote sensing of rivers, their principle objective was not to operationalize the process and deliver real-time, continuous time series of velocity and discharge. Rather, this research demonstrates that the real-time delivery of mean-channel (mean) velocity and discharge is possible by combining radars with an efficient discharge algorithm, the probability concept.
The advantages of velocity and stage radars combined with the probability concept include: (1) improved safety, (2) reduced operational costs, (3) improved data delivery, and (4) increased operational efficiency. Safety is improved because hydrographers spend less time in the water and are able to work from stable platforms such as bridges, cable ways, and cable stays. Operational costs are less than stage-discharge streamgages, because fewer site visits are required. Data delivery is improved with radars, because discharge is computed immediately after radar siting and installation. Some stage-discharge ratings require months or years of data collection to establish the requisite number of stage and discharge values to develop a reliable rating. Operational efficiency is increased, because site visits are driven by event, rather than frequency. It should be noted that event-based and a nominal number of visits are needed: (a) to confirm stage-area ratings, (b) to confirm the location (stationing) of the maximum velocity in a cross section, (c) to confirm ϕ, which represents the ratio between the mean velocity and maximum velocity, and (d) to maintain operational functionality, including trouble shooting data transmission mishaps and power checks. The disadvantages of radars include: (1) initial capital costs ($5K to $10K U.S. dollars), (2) restrictive siting requirements, including the need for infrastructure such as a bridge or light cableway, (3) measurement uncertainty associated with poor-surface scattering, (4) wind-influenced (drift) surface velocities, and (5) an inability to reliably detect low surface-water (surface) velocities (less than 0.15 m/s).
This study examines the results of 10 fixed-mount velocity and stage radars collocated with USGS continuous streamgages and addresses the following questions: (1) Can radars accurately measure surface velocities? (2) Can velocity and stage radars be used to accurately compute the mean velocity and discharge when compared to conventional methods that serve as validation (truth)? (3) Can near-field remote sensing deliver real-time mean velocity, stage, and discharge operationally and in the absence of historical data? (4) What environmental and hydraulic factors influence radar-derived surface velocities?

2. Materials and Methods

2.1. Site Selection

The radar gages used in this study are located in the U.S. (Figure 1), and their characteristics are summarized in Table 1, Table 2 and Table 3. The sites were selected using the following criteria: (1) radars were collocated with existing USGS continuous streamgages, (2) radar locations, cross-sectional areas, velocities, and heights above the water surface (air gap) support radar operations, and (3) radars were operated for a sufficient duration of time to capture low and high streamflow conditions. The basins, where the 10 radar gages are located, range in size from 381 to 66,200 kilometers (Table 1) and are characterized by: (1) a variety of land-use types, including agricultural, desert, forest, mixed, and high-gradient mountain environments, (2) operating periods ranging from 2 weeks to 19 months, (3) river top widths (Table 2) ranging from 7 to 380 meters (m), and (4) river hydraulic depths ranging from 0.09 to 7 m. Each of these characteristics has a profound effect on velocity and discharge.
To demonstrate the extensibility of the radar methods, streamflow exceedances were calculated as the percentage of the daily streamflow recorded at a continuous USGS streamgage during the radar deployment relative to the maximum discharge recorded for the historical period of record (Table 3). Streamflow exceedances range from approximately 0% to 5.4%. These metrics indicate the sites and streamflows represent relevant variations in discharge for various hydrologic and hydraulic conditions.

2.2. Doppler Radar Technology

Radars measure velocity and stage remotely [51,52]. When sited properly, near-field remote sensing compares favorably to conventional methods described in Section 2.1. Velocity radars leverage the Doppler effect to translate radar frequencies to a surface velocity [50]. For example, velocity radars used for this research transmit a prescribed, 24-gigahertz (GHz) electromagnetic wave, which encounters small-scale surface waves (scatterers). These small-scale scatterers ride advectively on top of larger surface waveforms. If they are incident to the transmitted radar signal, the movement of these scatterers modify the frequency of the transmitted signal [51], and the frequency of the backscattered signal is shifted. The difference in the transmitted and returned frequencies is the Doppler shift; however, to detect the complete spectrum, the transmitted signal must be coherent where there are no phase discontinuities [51]. A spectral analysis is performed on the reflected signal to assess the quality of the spectrum and compute a value for the surface velocity.
To collect useful surface-velocity measurements, the radar signal is transmitted at an angle to the water surface. This angle is measured internally and is automatically corrected to compute the velocity. Only waves traveling toward or away from the radar serve as effective scatterers. The surface velocity represents the mean value over the footprint of the radar on the water surface and is calculated using Equation (1):
vh = (λ fc)/(2 sin θ)
where vh = the wave velocity in the look (streamwise) or along-track direction of the radar antenna; λ = wavelength of the transmitted radar signal; fc = shifted frequency; and θ = incidence angle of the radar [51].
When the transmitted signal originating from the radar encounters small-scale waves at incidence angles that are not too large or small, the signal is scattered back to the antennae. Scatterer size and quality is a function of the frequency of the transmitted radar and environmental factors such as wind drift, turbulence, and rain. The length of these small-scale surface waves can be computed using Equation (2):
λb = λ/(2 sin θ)
where λb= wavelength of the water wave; GHz, λ = wavelength of the transmitted radar signal; GHz, θ = incidence angle, λ = c/v, c = speed of light = 3 × 10⁸ m per second in meter per second (m/s), v = frequency in hertz (Hz), given a K-band radar transmission frequency = 24 GHz, which has a wavelength of approximately 1.25 centimeters (cm) and an incidence angle of 56 degrees from horizontal. The small-scale surface waves that serve as scatterers are computed using Equation (3):
λb = 3 × 10⁸ m/s × 100 cm/m/24E9 Hz/(2 × sin 56 degrees) = 0.75 cm

2.3. Validation Measurements

Velocity, stage (stage-area ratings) and discharge were measured using conventional methods to assist with: (1) siting the radars and (2) serving as truth to determine the accuracy of the radar-derived discharge at the time of installation and during operation. Vertical velocity profiles were recorded to compute the PC parameters, mean velocity, and discharge described in subsequent sections. Stage-discharge, time-series data were recorded simultaneously with radar data.
Conventional methods were used to assess the accuracy of the radar data and include: (1) instantaneous measurements—in-water, event-based conventional mechanical current meter and hydroacoustic measurements of velocity, stage, and discharge and (2) continuous measurements—empirical stage-discharge measurements of river stage and discharge. The USGS requires the standard error for stage to be ± 3 mm accuracy or better, which is needed to calculate discharge [54]. Of the two conventional methods, instantaneous measurements deliver the lowest expected error in velocity, stage, and discharge. Standard errors for individual discharge measurements vary from 2% for ideal conditions to 19% and greater for conditions dominated by flood flows, wind, ice, boundary effects, streamflow obstructions, or improper equipment and procedures [55,56,57,58]. However, most measurements exhibit standard errors ranging from 3 to 6% [54]. Continuous measurements of stage-discharge offer validation; however, they possess an inherent measure of uncertainty depending on the stability of the stage-discharge rating [57] where uncertainties (95% uncertainty intervals) can range from ±50 to 100% for low streamflow, ±10 to 20% for medium to high streamflow, and ±40% for out-of-bank flow [58].

2.4. Radar Siting

Velocity, cross-sectional area, and discharge were measured and analyzed to assist with data processing [3,4,59,60,61] and siting [62,63]. The same principles used to site conventional streamgages [4] were adopted for siting radar gages, which: (1) consist of straight channels with parallel streamlines, (2) include streambeds free of large rocks, weeds, or obstructions that would create turbulence or slack water, (3) comprise cross sections that are parabolic, trapezoidal, or rectangular, (4) avoid variable streamflow conditions downstream from piers or channel obstructions, (5) avoid highly turbulent conditions, (6) target sections where stream velocities exceed 0.15 m/s and depths greater than 0.15 m, (7) avoid tributaries or contributing drainage, and (8) avoid wind-dominated reaches, eddies, secondary flows, and macroturbulence.

2.4.1. Velocity

Velocity data were collected at cross sections of interest and in the vicinity of the radar footprint. The radar’s ability to record a surface velocity is influenced by: (1) the quality of scatterers or waveforms on the water surface, (2) the air gap or the distance between the bridge deck and the water surface, and (3) the potential bias imposed by wind drift, eddies, secondary flows, and macroturbulence. Current meters, ADVs, ADCPs, and surface velocity radars can be used to characterize the velocity distribution and assist in the computation of the PC parameters discussed in Section 2.6.2. A template for siting and collecting channel and hydraulic data associated with radar deployments was developed to assist with data collection [62].
The SonTek FlowTracker® (FT) is a handheld ADV that is (1) used widely for wading measurements, (2) capable of measuring velocity with an accuracy of ±0.25 cm/s, and (3) capable of sampling a 25-cubic-centimeter (cm3) water volume, which permits velocity sampling close to the air–water interface. When wading was possible, the FT was used to collect velocity and depth data from 25 to 30 verticals that comprise the measured section. The vertical that contains the maximum velocity is referred to as the y-axis and was revisited during each site visit. A vertical velocity profile was acquired at the y-axis location beginning near the channel bottom and extending to the water surface. Depending on the water depth (Di), a minimum of 6 point velocities were measured (channel bottom, 0.2 Di, 0.3 Di, …, 0.8 Di, and near the water surface, while minimizing air entrainment). This procedure was repeated to river left (LEW, to the left facing downstream) and river right (REW, to the right facing downstream) of the y-axis to confirm its location.
When wading was not possible, velocities were collected at the y-axis using an ADCP and a Stationary Bed Test (SBT) by boat, light cableway, or tethered from a bridge or a river bank. When possible, surface velocities were collected concurrently with SBTs using a handheld or portable velocity radar. As with the FT, SBTs were conducted to river left and river right of the y-axis. Discharge was computed using QRev software [10] or an equivalent. Alternatively, when coupled with a Global Positioning System (GPS) receiver, the latitude and longitude of the y-axis can be established using tools such as the Velocity Mapping Toolbox [64,65]. The SBT is processed in WinRiver II software [63] and is used to assess the velocity distribution, which is ingested by R-scripts to compute the PC parameters described in Section 2.6.2. The WinRiver II workflow for processing SBTs included the following steps: (1) select “Moving Bed Test” of interest, (2) select “Playback” and “Reprocess Selected Transect,” (3) select “Configure” and “Averaging Data” and identify the number of ensembles needed to average the SBT to reduce noise in the data, (4) select “View” and “Tabular,” and “Earth Velocity Magnitude and Direction,” and (5) copy the depth and velocity data to a .txt or .csv file.

2.4.2. y-axis

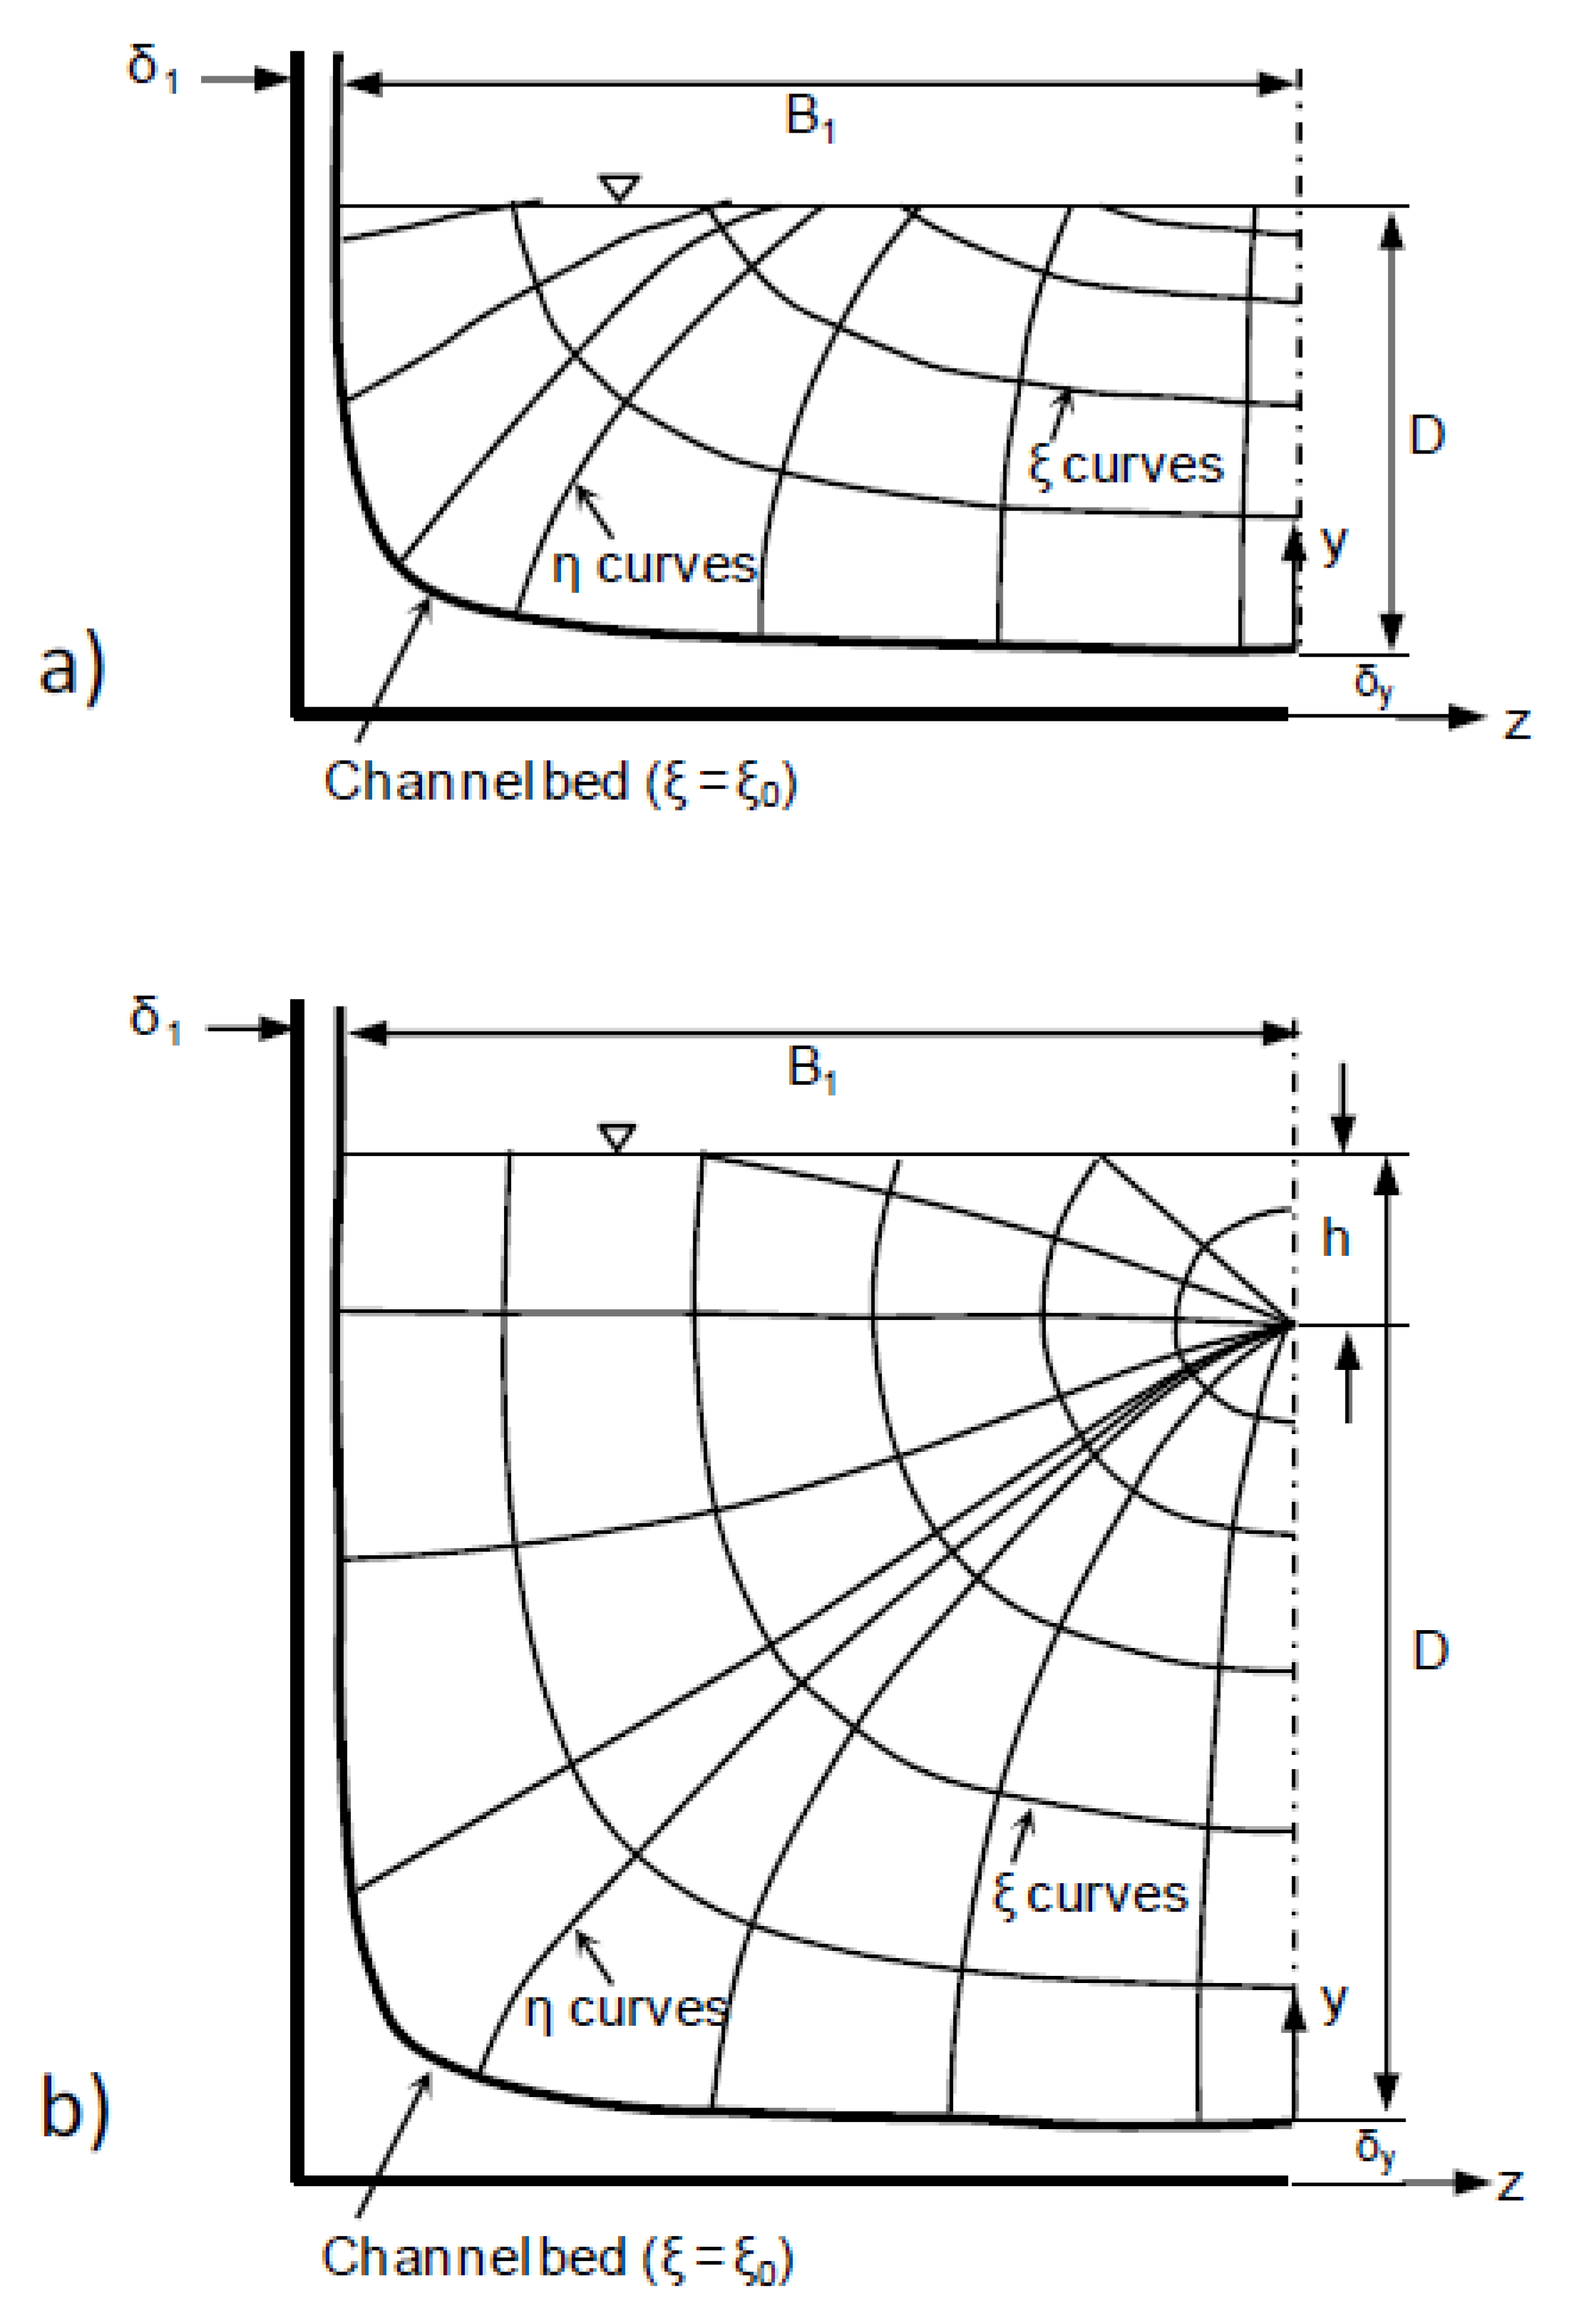
The y-axis (Figure 2) is the location in a stream cross section that contains the maximum velocity and maximum surface velocity [65,66,67,68,69,70,71,72,73,74,75,76]. More importantly, once established, all velocity and depth data, which are needed to translate a surface velocity to a mean velocity [71], are obtained at the y-axis location. It is important to note that the y-axis location rarely coincides with the channel thalweg in open or engineered channels and is determined during the siting phase [62]. Assuming site selection is well posed, research indicates the location of the y-axis is stable and does not vary with stage, velocity, discharge, changes in channel geometry, bed form and material, slope, or alignment [73]. During this research, periodic field verification was conducted to verify the location of the y-axis [62].

2.4.3. Cross-sectional Area

Cross-sectional area surveys were conducted during the siting phase to establish a stage-area rating, which is maintained throughout the radar gage operation. Included in the surveys were the wetted perimeter and above-water points of interest in the floodplain. The stage-area rating is used to compute area, based on the stage recorded by a pulsed radar, bubbler, or pressure transducer. Horizontal and vertical surveys were acquired relative to the collocated USGS streamgage datum using a total station survey, GPS receiver, or an equivalent. AreaComp2 software [77] was used to generate a synthetic stage-area rating to account for areas above the water surface that were measured during the day of siting.

2.4.4. Wind Drift

Wind-corrected discharge can be computed for sites where the surface velocity is affected by wind. The correction (1) relies on measurements from a wind sensor located at a nominal height (10 m) above the water surface and adjacent to the radar, (2) assumes a vertical wind profile based on the Prandtl von Karman (PvK) velocity distribution equation, and (3) assumes a surface-roughness height for water equal to 0.01 cm [78]. Wind-drift corrections are based on the measured wind speed and direction recorded by the sensor every 15 min and are temporal with velocity and stage data. A theoretical wind speed can be computed near the water surface using the PvK distribution and a roughness height of 0.01 cm. Based on the orientation of the river reach (e.g., azimuth equal to 130 degrees), the resultant wind vector can be subtracted from the surface velocity if the winds are concordant (in the direction) of streamflow. If the winds are counter (in the opposite direction) to streamflow, wind velocity is added to the surface velocity.

2.5. Radar Deployments

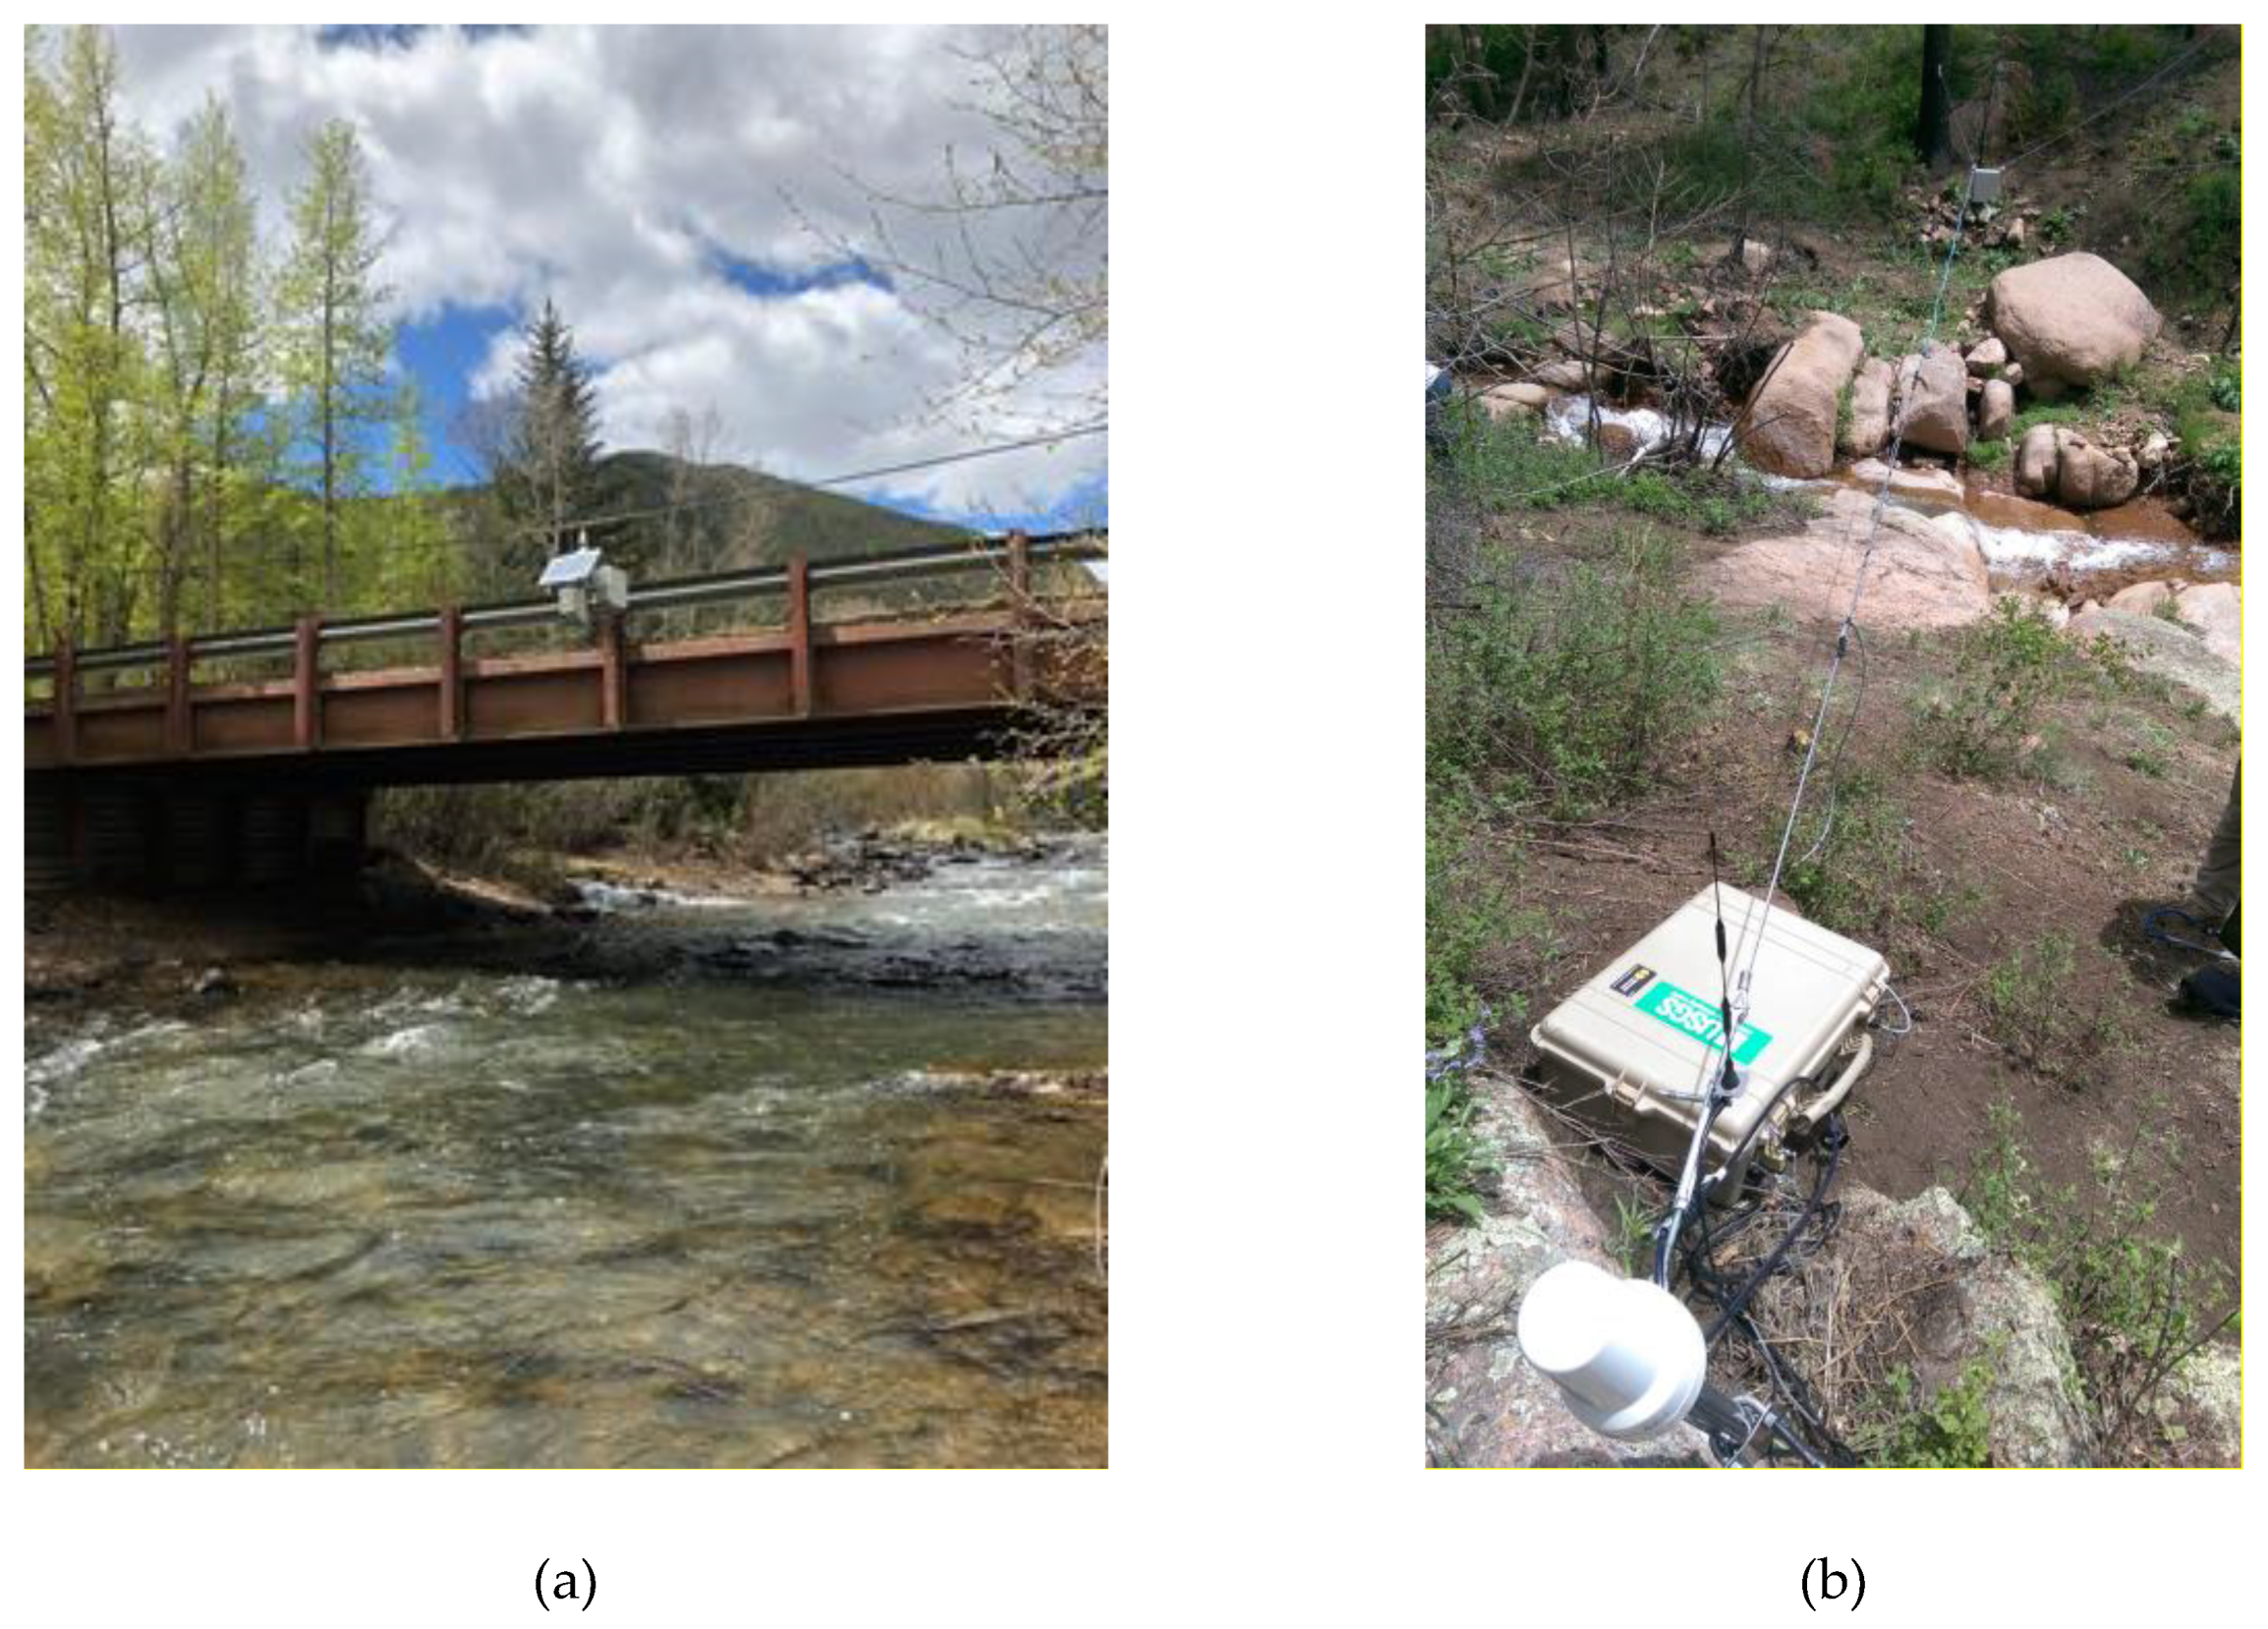
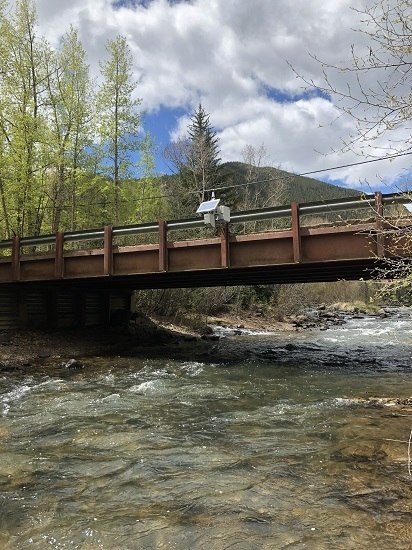
Radars were installed on bridges at the y-axis location coincident with the maximum surface velocity established during the siting phase. Generally, the maximum velocity will occur at the same vertical as the maximum surface velocity [53,71]. The location of the y-axis was determined initially using a hand-held velocity radar and confirmed using mechanical current meters or hydroacoustics. A minimum of three surface velocities were collected to confirm the y-axis location and magnitude of the maximum surface velocity by sampling river left and river right of the y-axis. Velocity radars can point upstream or downstream from a bridge or walkway. For this research, eight of the 10 deployments were oriented facing upstream to avoid complex streamflow patterns including eddies, secondary flows, and macroturbulence. The remaining two sites were not influenced by bridge piers or streamflow complexities and were deployed facing downstream. Radar deployments can occur from bridges, light cableways, or cable stays (Figure 3). Fixed-mount radars (RQ-30 and RG-30 models) were manufactured and provided by Sommer Messtechnik, and the hand-held radar was manufactured by Applied Concepts, Inc.
Reaches dominated by wind fetch were avoided in an effort to minimize uncertainties in surface velocities influenced by wind drift. Radar locations were geo-referenced using a GPS receiver or measured from known bridge stationing, were oriented parallel to steamflow lines to avoid the need for a cosine correction based on the angle of attack, and were tilted downward (from horizontal) at a nominal 56-degree incidence angle.

2.6. Discharge Algorithms

2.6.1. Conventional Methods

Conventional methods (stage-discharge ratings; current meters/ADVs/mid-section method; and ADCPs) are widely accepted as industry standards [2,3,4,5,6,7,8,9,10,11,63,79] and were used as validation of the velocity and stage radar results. If surface velocities are measured at 25 to 30 verticals from LEW to REW, the mean vertical velocity (uvertical) or depth-averaged velocity at a vertical in a cross section can be computed using Equation (4):
uvertical = uD × coefficient (typically ranging from 0.84 to 0.90)
where uvertical = mean vertical velocity at a given station in a cross section and uD = surface velocity. This equation assumes the vertical velocity profile can be characterized by a logarithmic or 1/6th or 1/7th power law [11,79]. The coefficient referenced in Equation (4) is needed to convert a surface velocity to a mean vertical velocity [3,4]; however, these coefficients are generally difficult to determine reliably and may vary with stage, depth, and stationing in the cross section. Experience has shown that the coefficient generally ranges from about 0.84 to about 0.90, depending on the shape of the vertical velocity curve [3] and the proximity of the vertical to channel walls where secondary currents may develop causing the maximum velocity to dip below the water surface [80,81,82,83,84,85,86]. In these instances, the velocity distribution is non-standard, and an alternative velocity distribution is needed to characterize the velocity profile and compute the mean vertical velocity, mean velocity, or discharge.

2.6.2. Probability Concept

The probability concept (radar-derived mean velocity and discharge) in many ways is similar to conventional, physically based methods, which rely on integrating depth and velocity data to compute the mean velocity and discharge. For example, velocity and depth are recorded at 25 to 30 verticals in a cross section using mechanical current meters and ADVs [3]; whereas, ADCPs record velocity and depth at tens to hundreds of verticals in a cross section. The probability concept relies on these same instruments to measure velocity and corresponding depth at a single vertical; however, only that vertical, which contains the most information content (umin = 0 and u = umax) in a cross section, is used.
Surface velocities derived from radars are translated to a mean velocity using a velocity distribution equation based on the probability concept [66,67,68,69,70,71,72,73,74,75,76], which was pioneered by C.-L. Chiu and is based on Shannon’s Information Entropy [87]. Equation (5) through Equation (10) offer a summary of the Chiu velocity distribution equation, and the workflow needed to compute a mean velocity. The velocity distribution at the y-axis in probability space is represented by Equation (5):
u = u m a x M   l n [ 1 + ( e M 1 )   F ( u ) ]
where u = velocity as a function of depth at the y-axis; umax = maximum velocity at the y-axis; M = parameter of the probability distribution used to describe the velocity distribution; and   F ( u ) = 0 u f ( u ) d u , which represents the cumulative distribution function, or the probability of a randomly sampled point velocity that is less than or equal to u. At those cross sections where umax occurs below the water surface, the velocity distribution at the y-axis can be characterized by Equation (6):
u = u m a x M   l n [ 1 + ( e M 1 )   y D h   e x p ( 1 y D h ) ]
where D = total distance from the channel bottom to the water surface at the y-axis, y = incremental distance from the channel bottom to water surface, h = distance from the water surface to the maximum velocity. The orthogonal coordinate system (Figure 2) is used to translate the velocity distribution from probability space to physical space and is used to describe the variables h, D, and y in Equation (6) through Equation (8). In those instances when umax occurs at the water surface, the velocity distribution at the y-axis can be characterized by Equation (7):
u = u m a x M   l n [ 1 + ( e M 1 )   y D   e x p ( 1 y D ) ]
The probability distribution f(u) is resilient and is invariant with time and water level at a channel cross section and subsequently M and h/D are constant at a channel cross section [66,67,68,69,70,71,72,73]. In practice, Equation (6) is used only when there is a clear and observed velocity distribution where umax occurs below the water surface. In those instances, radar-derived surface velocities are used to estimate umax and assumes u is equal to uD, which is the velocity at which y equals D [71] and is represented by Equation (8):
u m a x = u D × M × { l n   [ 1 + ( e M 1 )   1 1 h D e x p ( 1 1 1 h D ) ] } 1
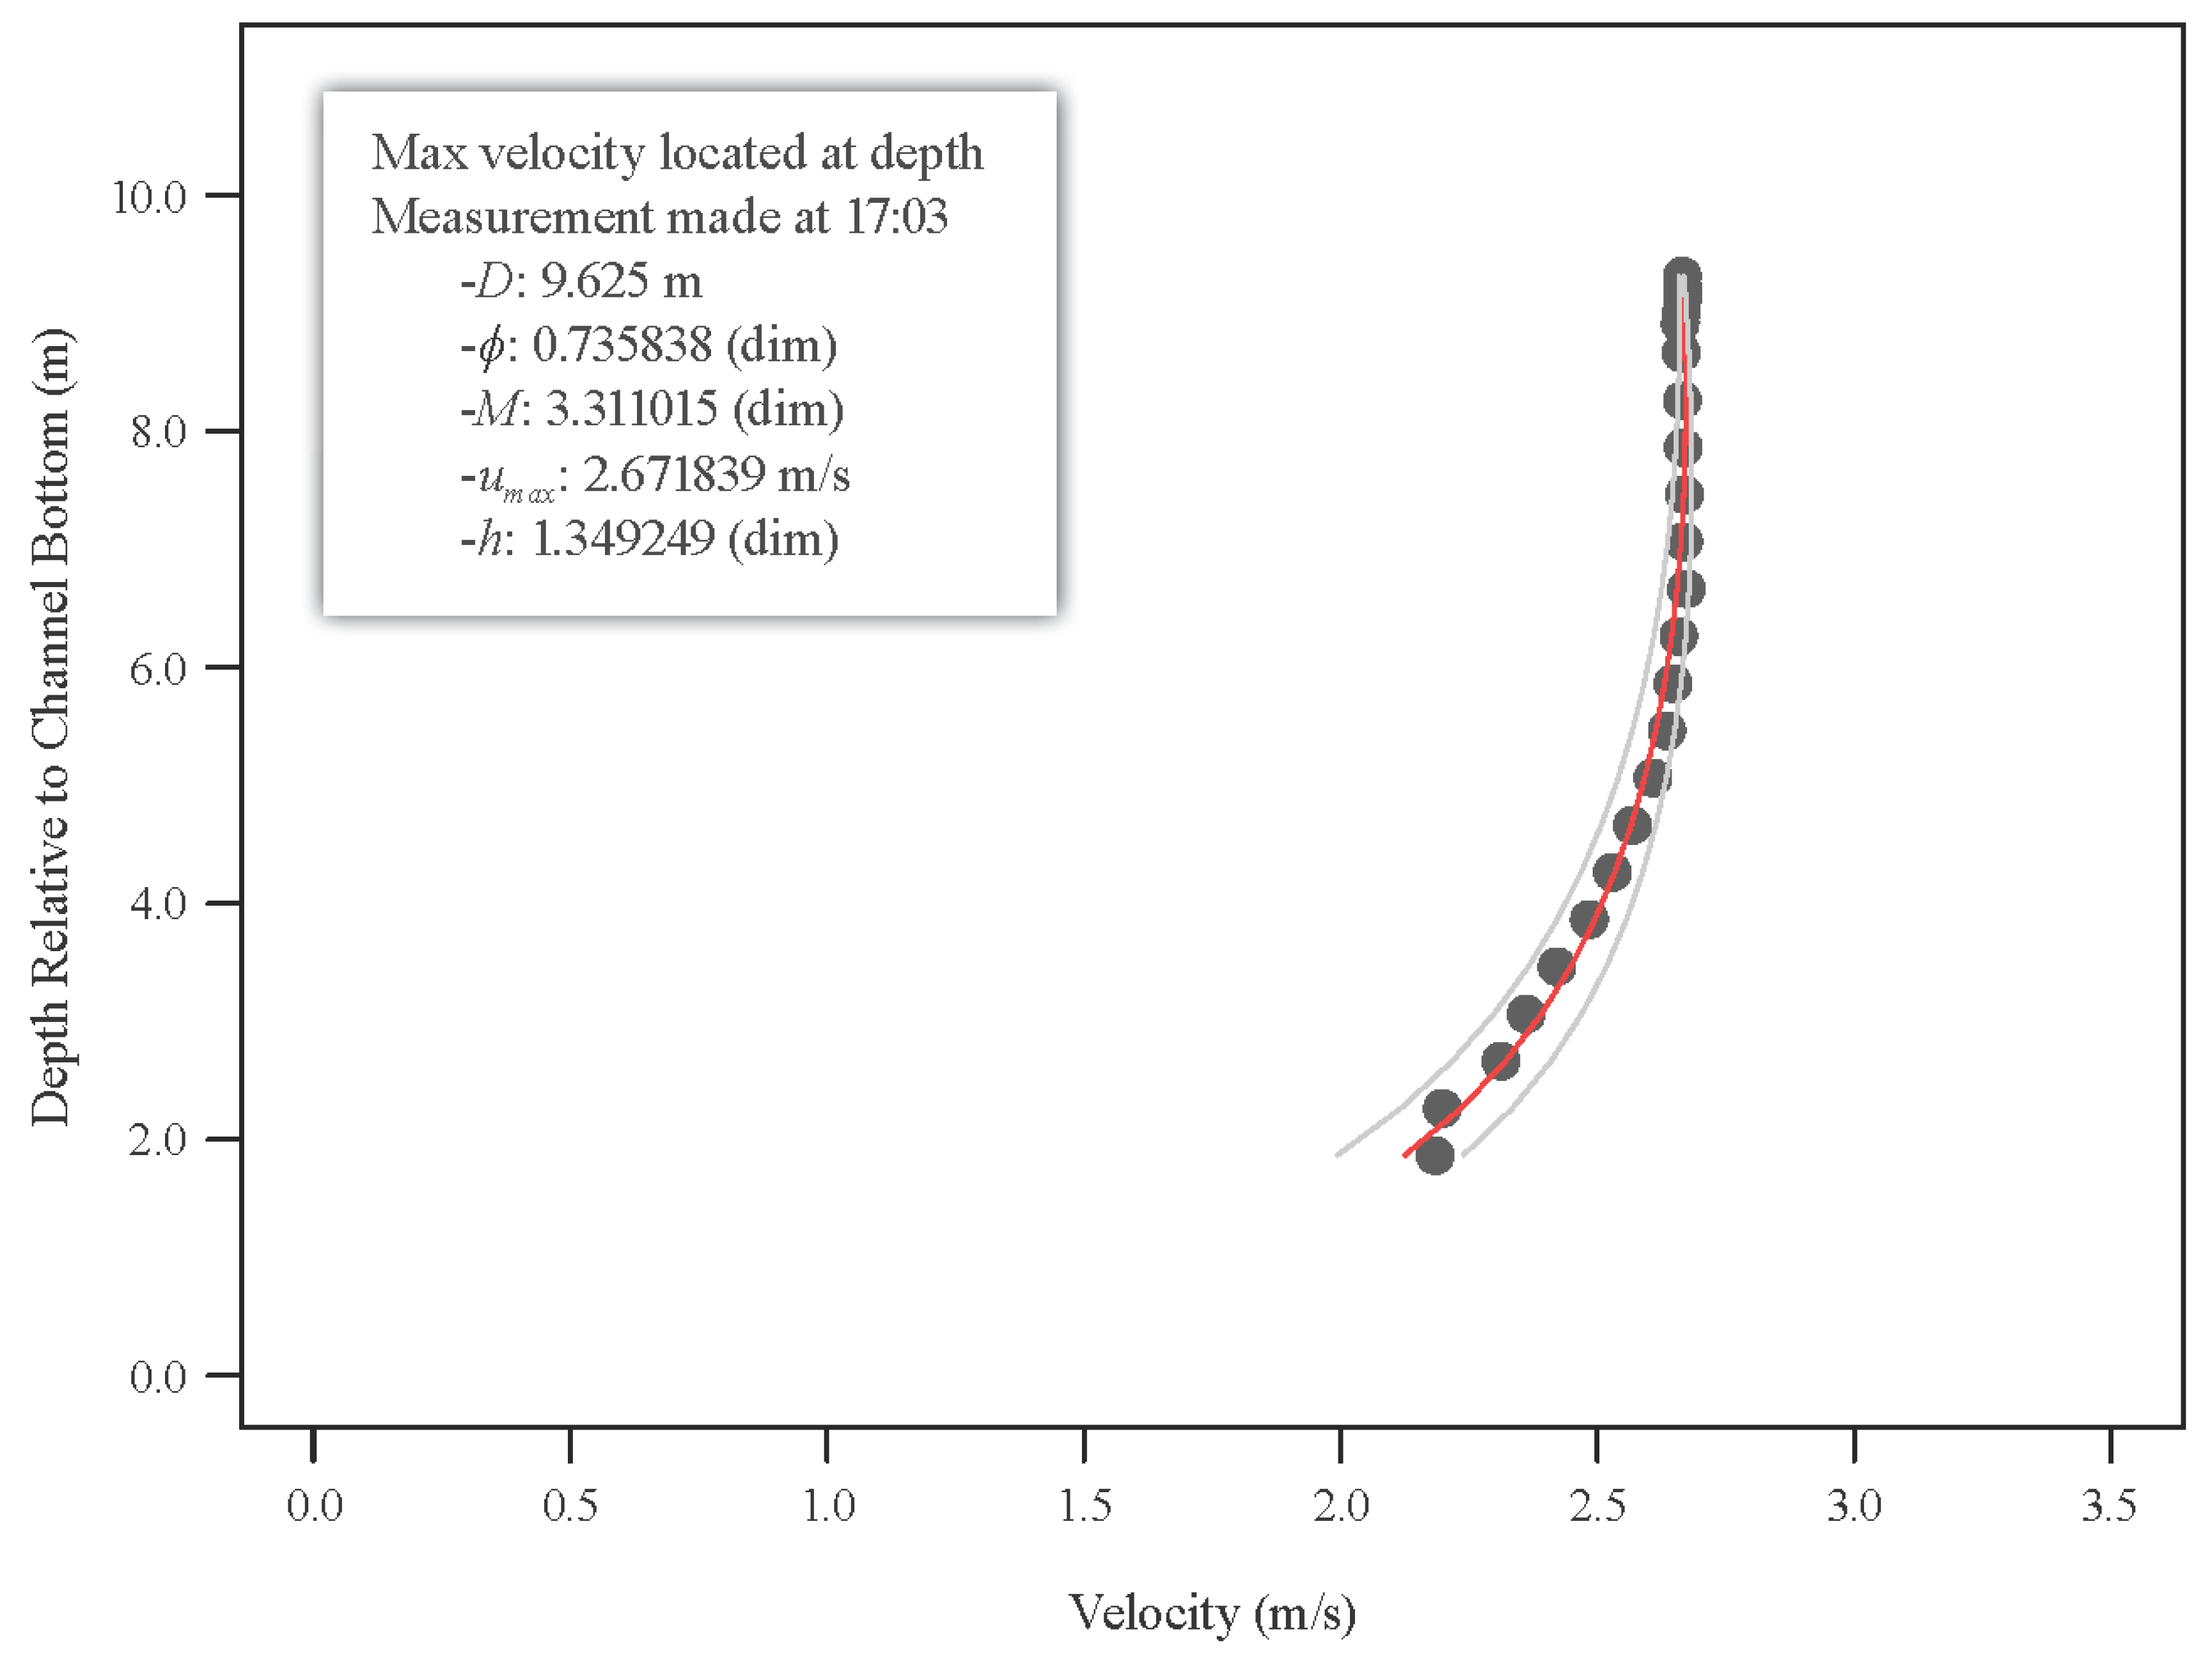
The parameter ϕ , which is a function of M, can be computed using two methods. First, point velocities are measured along the y-axis beginning near the channel bed and extending to the water surface. An R-script was developed to compute umax, M(ϕ), and h/D by incorporating the depth and velocity data recorded by conventional instruments. The “nls” algorithm [88,89] is a nonlinear (weighted) least-squares estimator of the parameters umax, M(ϕ), and h/D. By default, Equations (6) and (7) are solved using a Gauss–Newton nonlinear least-squares method. A typical velocity profile located at the y-axis is illustrated in Figure 4 for the Tanana River at Nenana, Alaska. Second, historical pairs of mean and maximum velocities are plotted, where ϕ represents the slope of the pairs and is the preferred method for computing ϕ [74,75] and is represented by Equation (9):
ϕ = u m e a n u m a x = e M ( e M 1 ) 1 M
Discharge is computed using ϕ, umax and the cross-sectional area derived from a stage-area rating using Equation (10):
Q = ϕ × u m a x × A
where, Q = discharge; ϕ = umean/umax = function of M; umax = maximum velocity; A = cross-sectional area. The parameter ϕ generally ranges from 0.58 to 0.82 [69].

3. Results

During the siting and validation phase, channel hydraulics and cross-sectional area were measured to: (1) parameterize the PC algorithm, (2) validate the resiliency of ϕ and location of the y-axis, and (3) establish a stage-area rating. During the operational phase, a workflow was established to: (1) record, compute, and transmit a radar-derived discharge in real-time and (2) compare the findings against the stage-discharge, which served as validation [90].

3.1. Siting and Validation Phase

3.1.1. Velocity

Instantaneous surface, maximum, and mean velocities were measured using velocity radars and conventional measurements and represent a variety of hydraulic conditions from small, high-gradient mountain and urban streams to wide, low gradient large rivers (Table 4). Radar-derived surface velocities ranged from 0.45 to 2.96 m/s for the NF Shenandoah River and the Yellowstone River; maximum velocities ranged from 0.09 to 2.96 m/s for the Red River of the North and the Yellowstone River; and mean velocities ranged from 0.05 to 2.11 m/s for the Red River of the North and the Yellowstone River. The lowest maximum velocity (0.09 m/s) was measured at the Red River of the North and was expected given the low hydraulic gradient associated with the site. The highest maximum velocity (2.96 m/s) was reported at the Yellowstone River, which is a high-gradient mountain stream. Percent differences in the radar and conventional mean velocities ranged from −0.1% to −11% for the Red River of the North and the Tanana River, respectively. The composite average percent error and absolute percent error of the mean velocity for the 10 sites was biased low −1.1% and high 3.6%, respectively. A velocity radar was not available during the siting phase at Clear Creek. Subsequently, a surface velocity was not recorded concurrently with the hydroacoustic data. Similarly, the Red River of the North was ice affected, and a surface velocity was not possible during the siting visit.
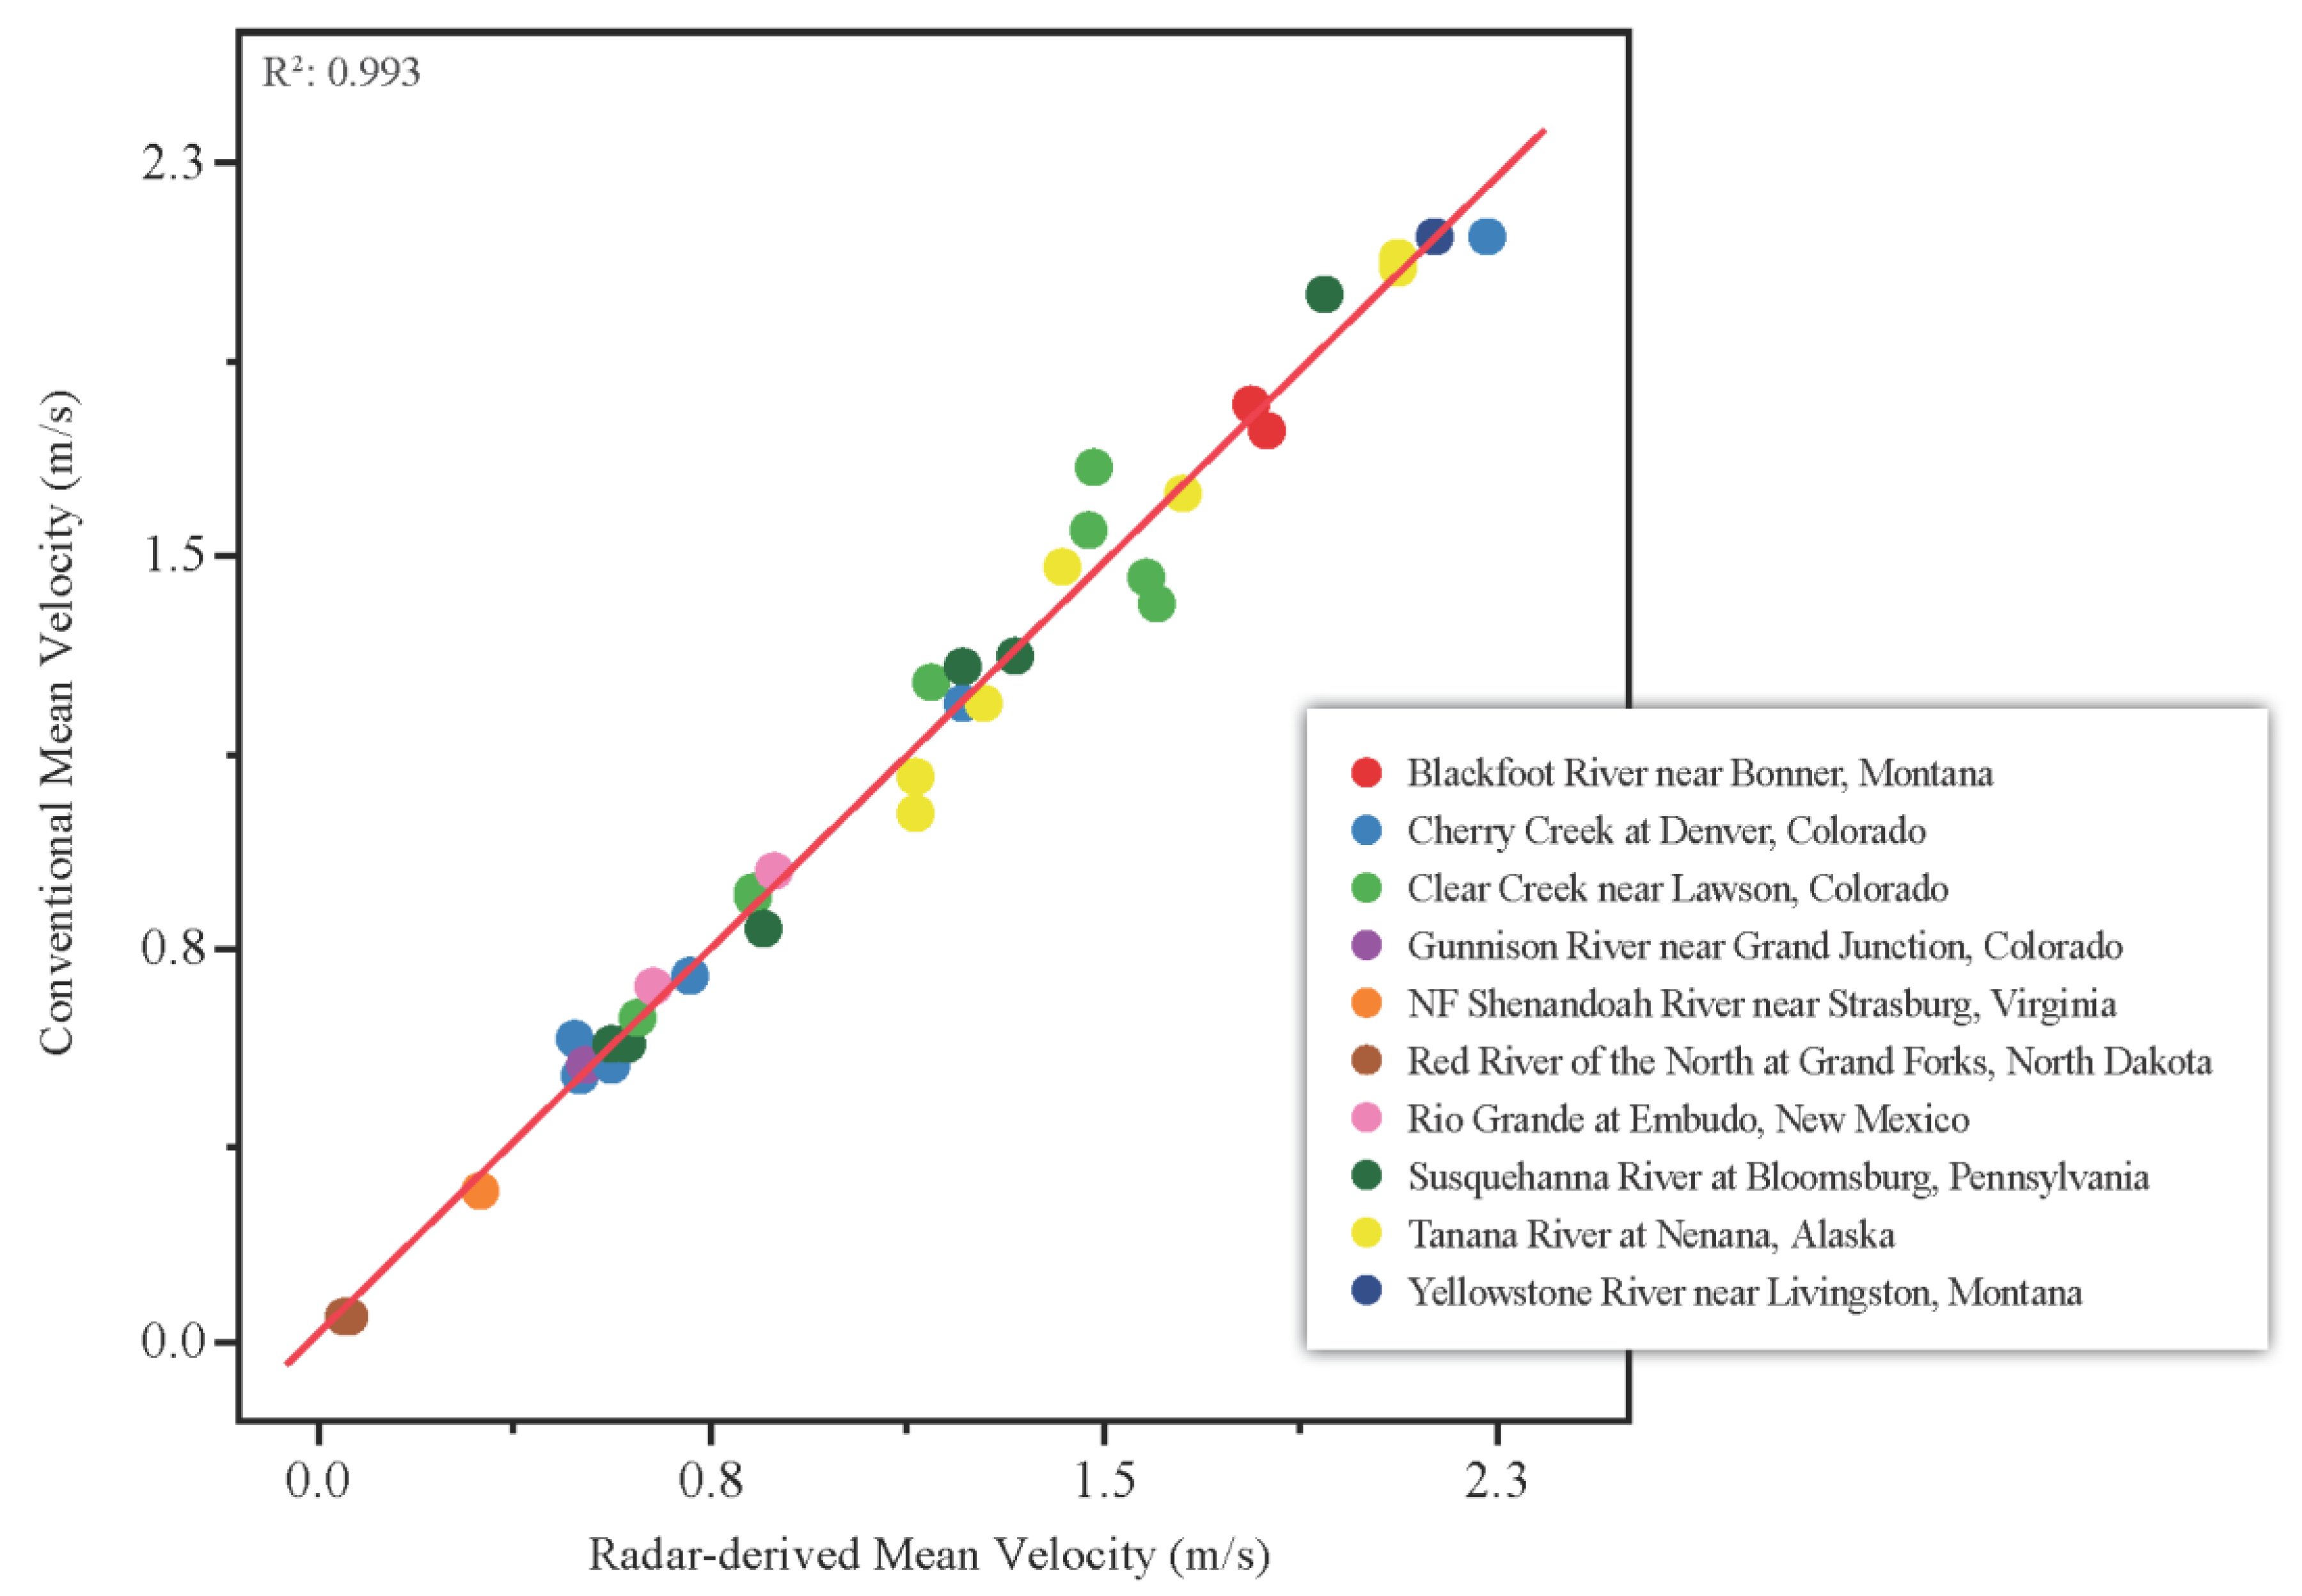
Subsequent validation visits were conducted at each of the 10 USGS streamgages to collect event-based instantaneous measurements. Figure 5 summarizes the results of 36 site visits (10 siting and 26 validation) and demonstrates general agreement between radar and conventional mean velocities. The average and absolute percent error was computed for the Blackfoot River (−1.4% and 2.5%), Cherry Creek (1.1% and 5.6%), Clear Creek (2.1% and 6.9%), Gunnison River (4.9% and 4.9%), NF Shenandoah River (−8.0% and 8.0%), Red River of the North (−8.6% and 8.6%), Rio Grande (4.6% and 4.6%), Susquehanna River (−0.4% and 3.8%), Tanana River (−2.5% and 3.9%), and Yellowstone River (−0.7% and 0.7%). The composite average and absolute percent error of all 36 site visits was −0.3% and 5.1%. The data show strong agreement (correlation coefficient, R2, equal to 0.993) between instantaneous radar-derived and conventional mean velocities (Figure 5).

3.1.2. Values of ϕ and Location of the y-axis

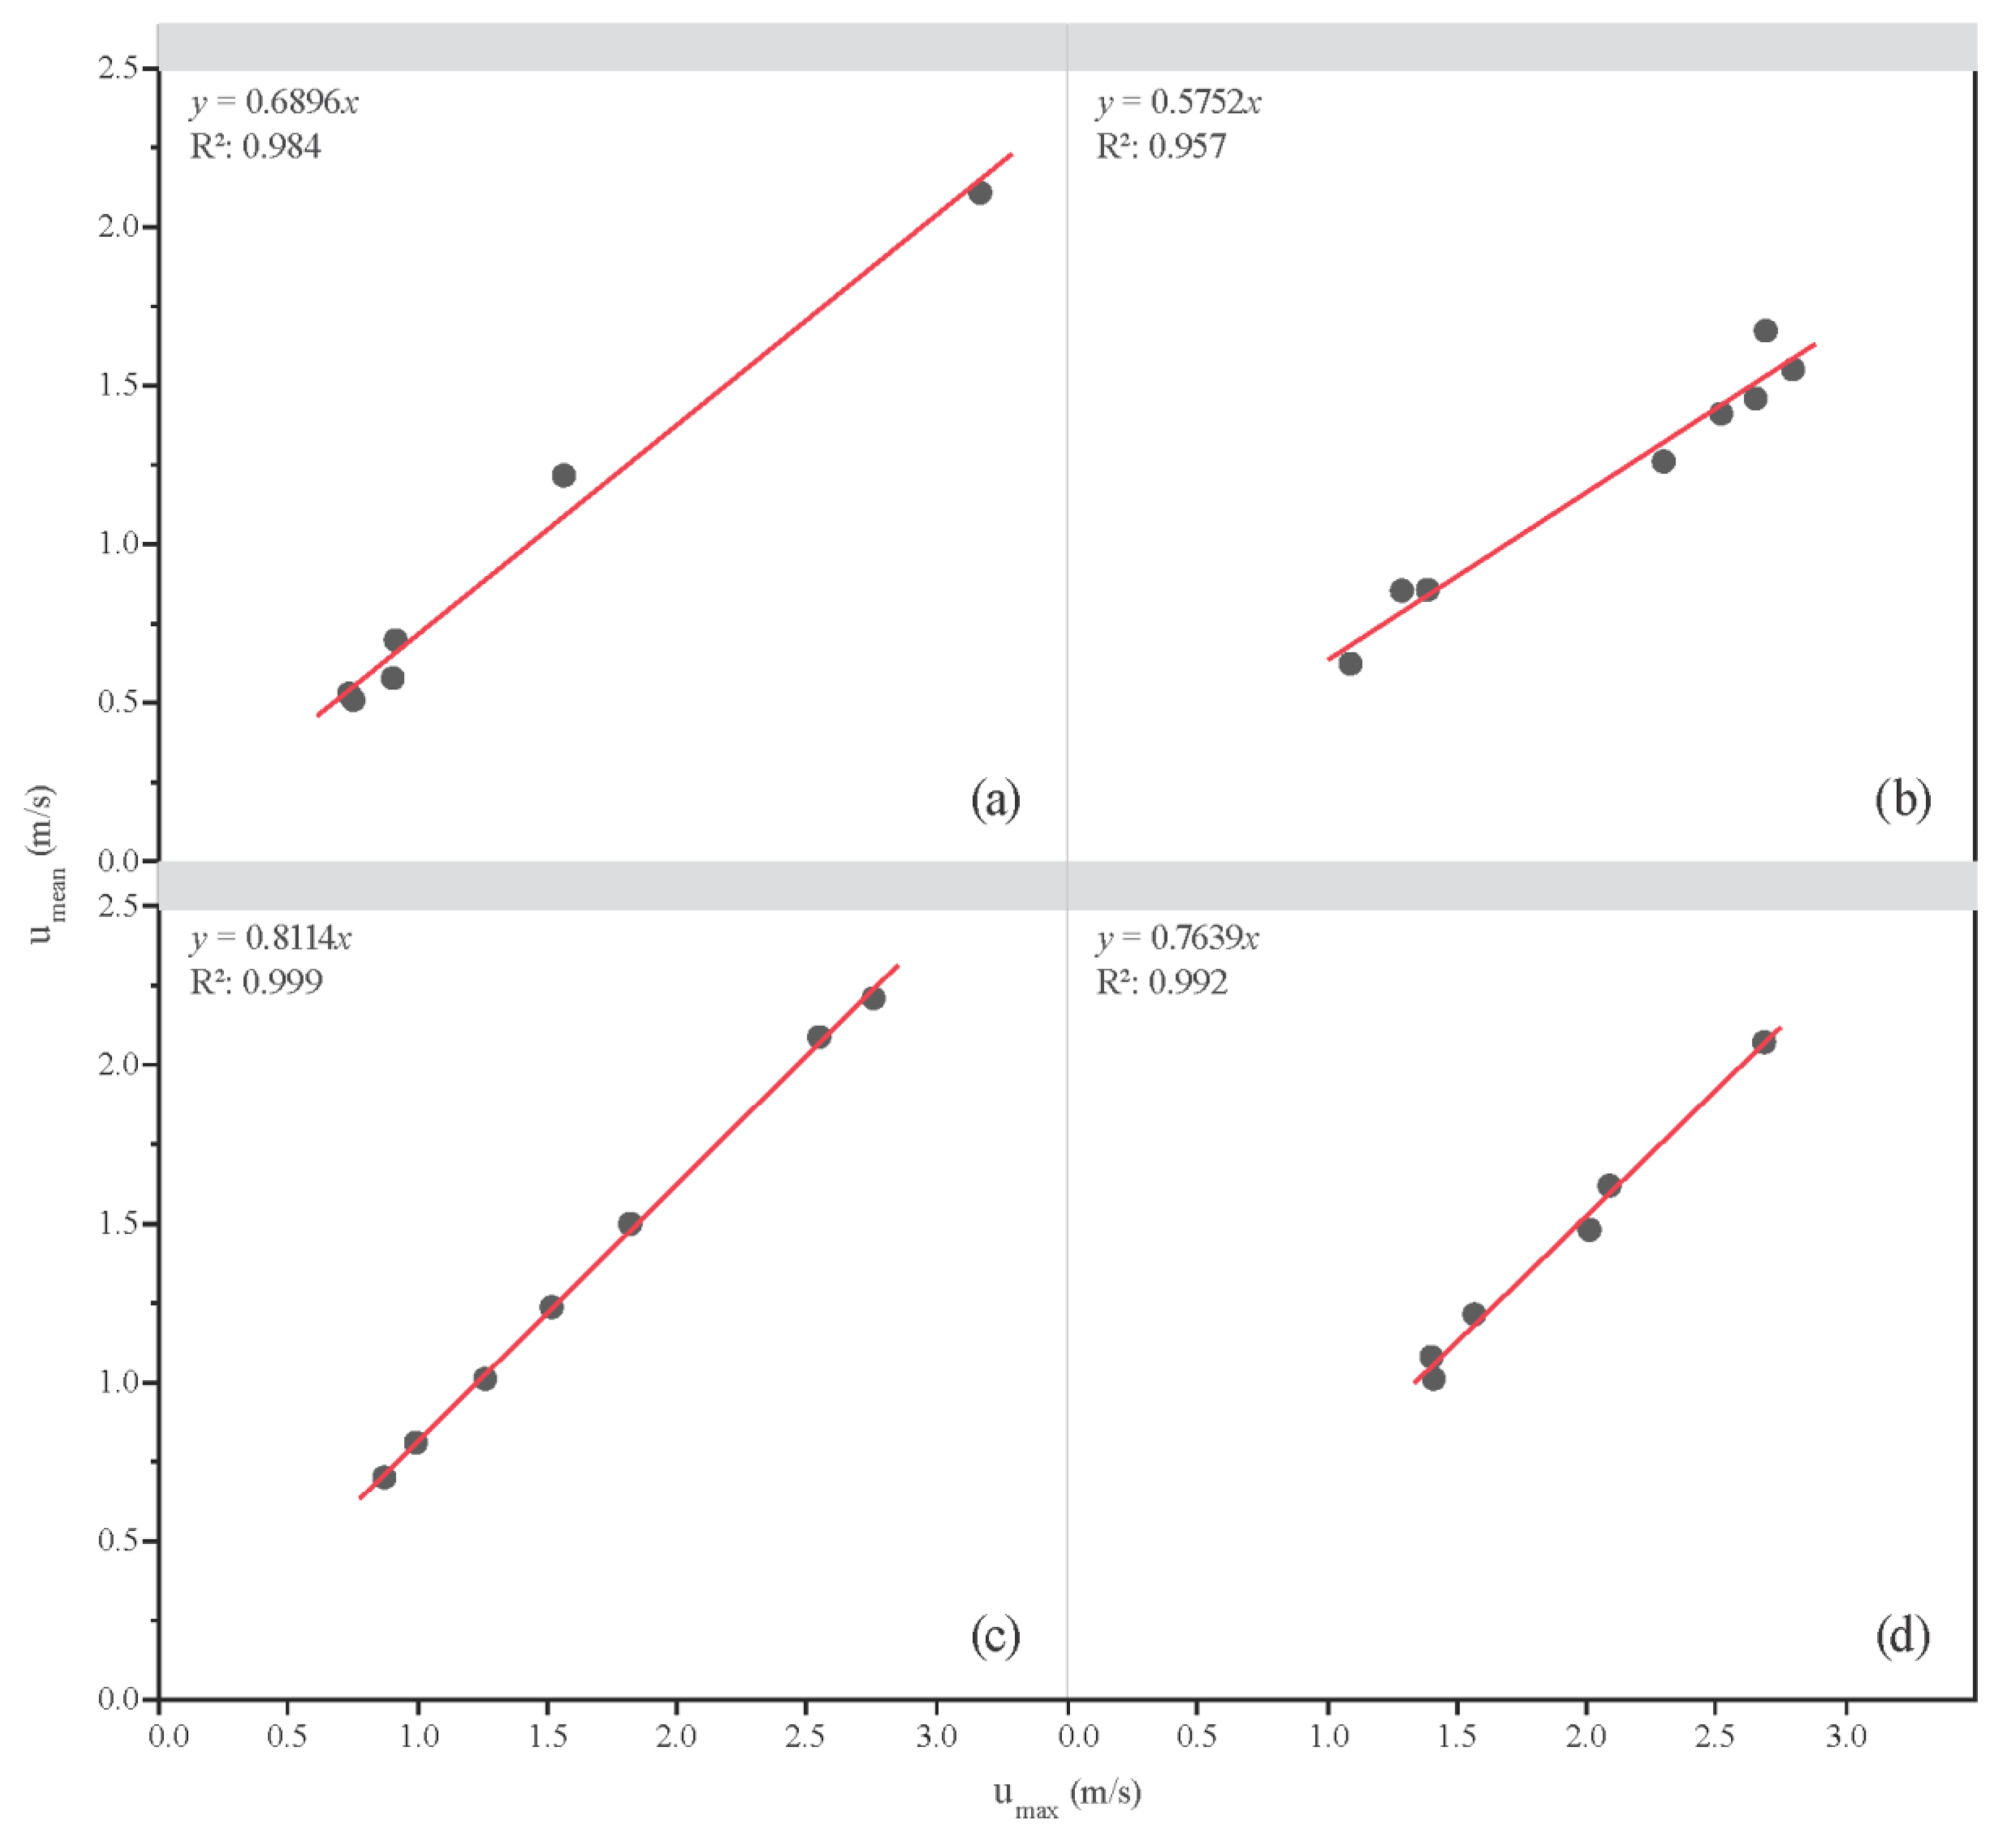
The values of ϕ were computed for all 10 gages and were derived using vertical velocity profiles obtained during the siting phase. Values ranged from 0.522 to 0.783 (Table 4) for the Gunnison River and the Susquehanna River, respectively, and are generally consistent with the findings of other researchers [62,63,64,65,66,67,68,69,70,71,72,73,74,75,76,86], who report ϕ values ranging from 0.58 to 0.82. In addition, ϕ was derived using historical pairs of the mean and maximum velocities for Cherry Creek (0.6896), Clear Creek (0.5752), Susquehanna River (0.8114), and Tanana River (0.7639). These values were obtained from site visits and the USGS National Water Information System: Web Interface NWISWeb [91], which is a database available to USGS cooperators and the general public. The ϕ values derived during the siting phase and historical pairs for Cherry Creek (0.678 and 0.6896), Clear Creek (0.573 and 0.5752), Susquehanna River (0.783 and 0.8114), and Tanana River (0.718 and 0.7639) resulted in percent differences equal to −1.7%, −0.3%, −3.5%, and −6.0% and exhibited strong agreement based on R2 values equal to 0.984, 0.957, 0.999, and 0.992, respectively. Figure 6a–d illustrates the variability of mean and maximum velocities for Cherry Creek (0.51 to 2.1 m/s and 0.74 to 3.2 m/s), Clear Creek (0.62 to 1.7 m/s and 1.1 to 2.8 m/s), Susquehanna River (0.56 to 2.0 m/s and 0.72 to 2.5 m/s), and Tanana River (1.0 to 2.1 m/s and 1.4 to 2.7 m/s) and the stability of ϕ with time and velocity.
The location of the y-axis at each radar gage was verified during each site visit using the methods described in Section 2.4.1. At no time or during no specific streamflow condition did the y-axis differ from the siting phase. In addition, previous research [66,67,68,69,70,71,72,73,74,75,76] indicates the location of the y-axis in stable reaches is resilient and does not vary with stage, velocity, discharge, changes in channel geometry, bed form and material, slope, or alignment.

3.1.3. Discharge

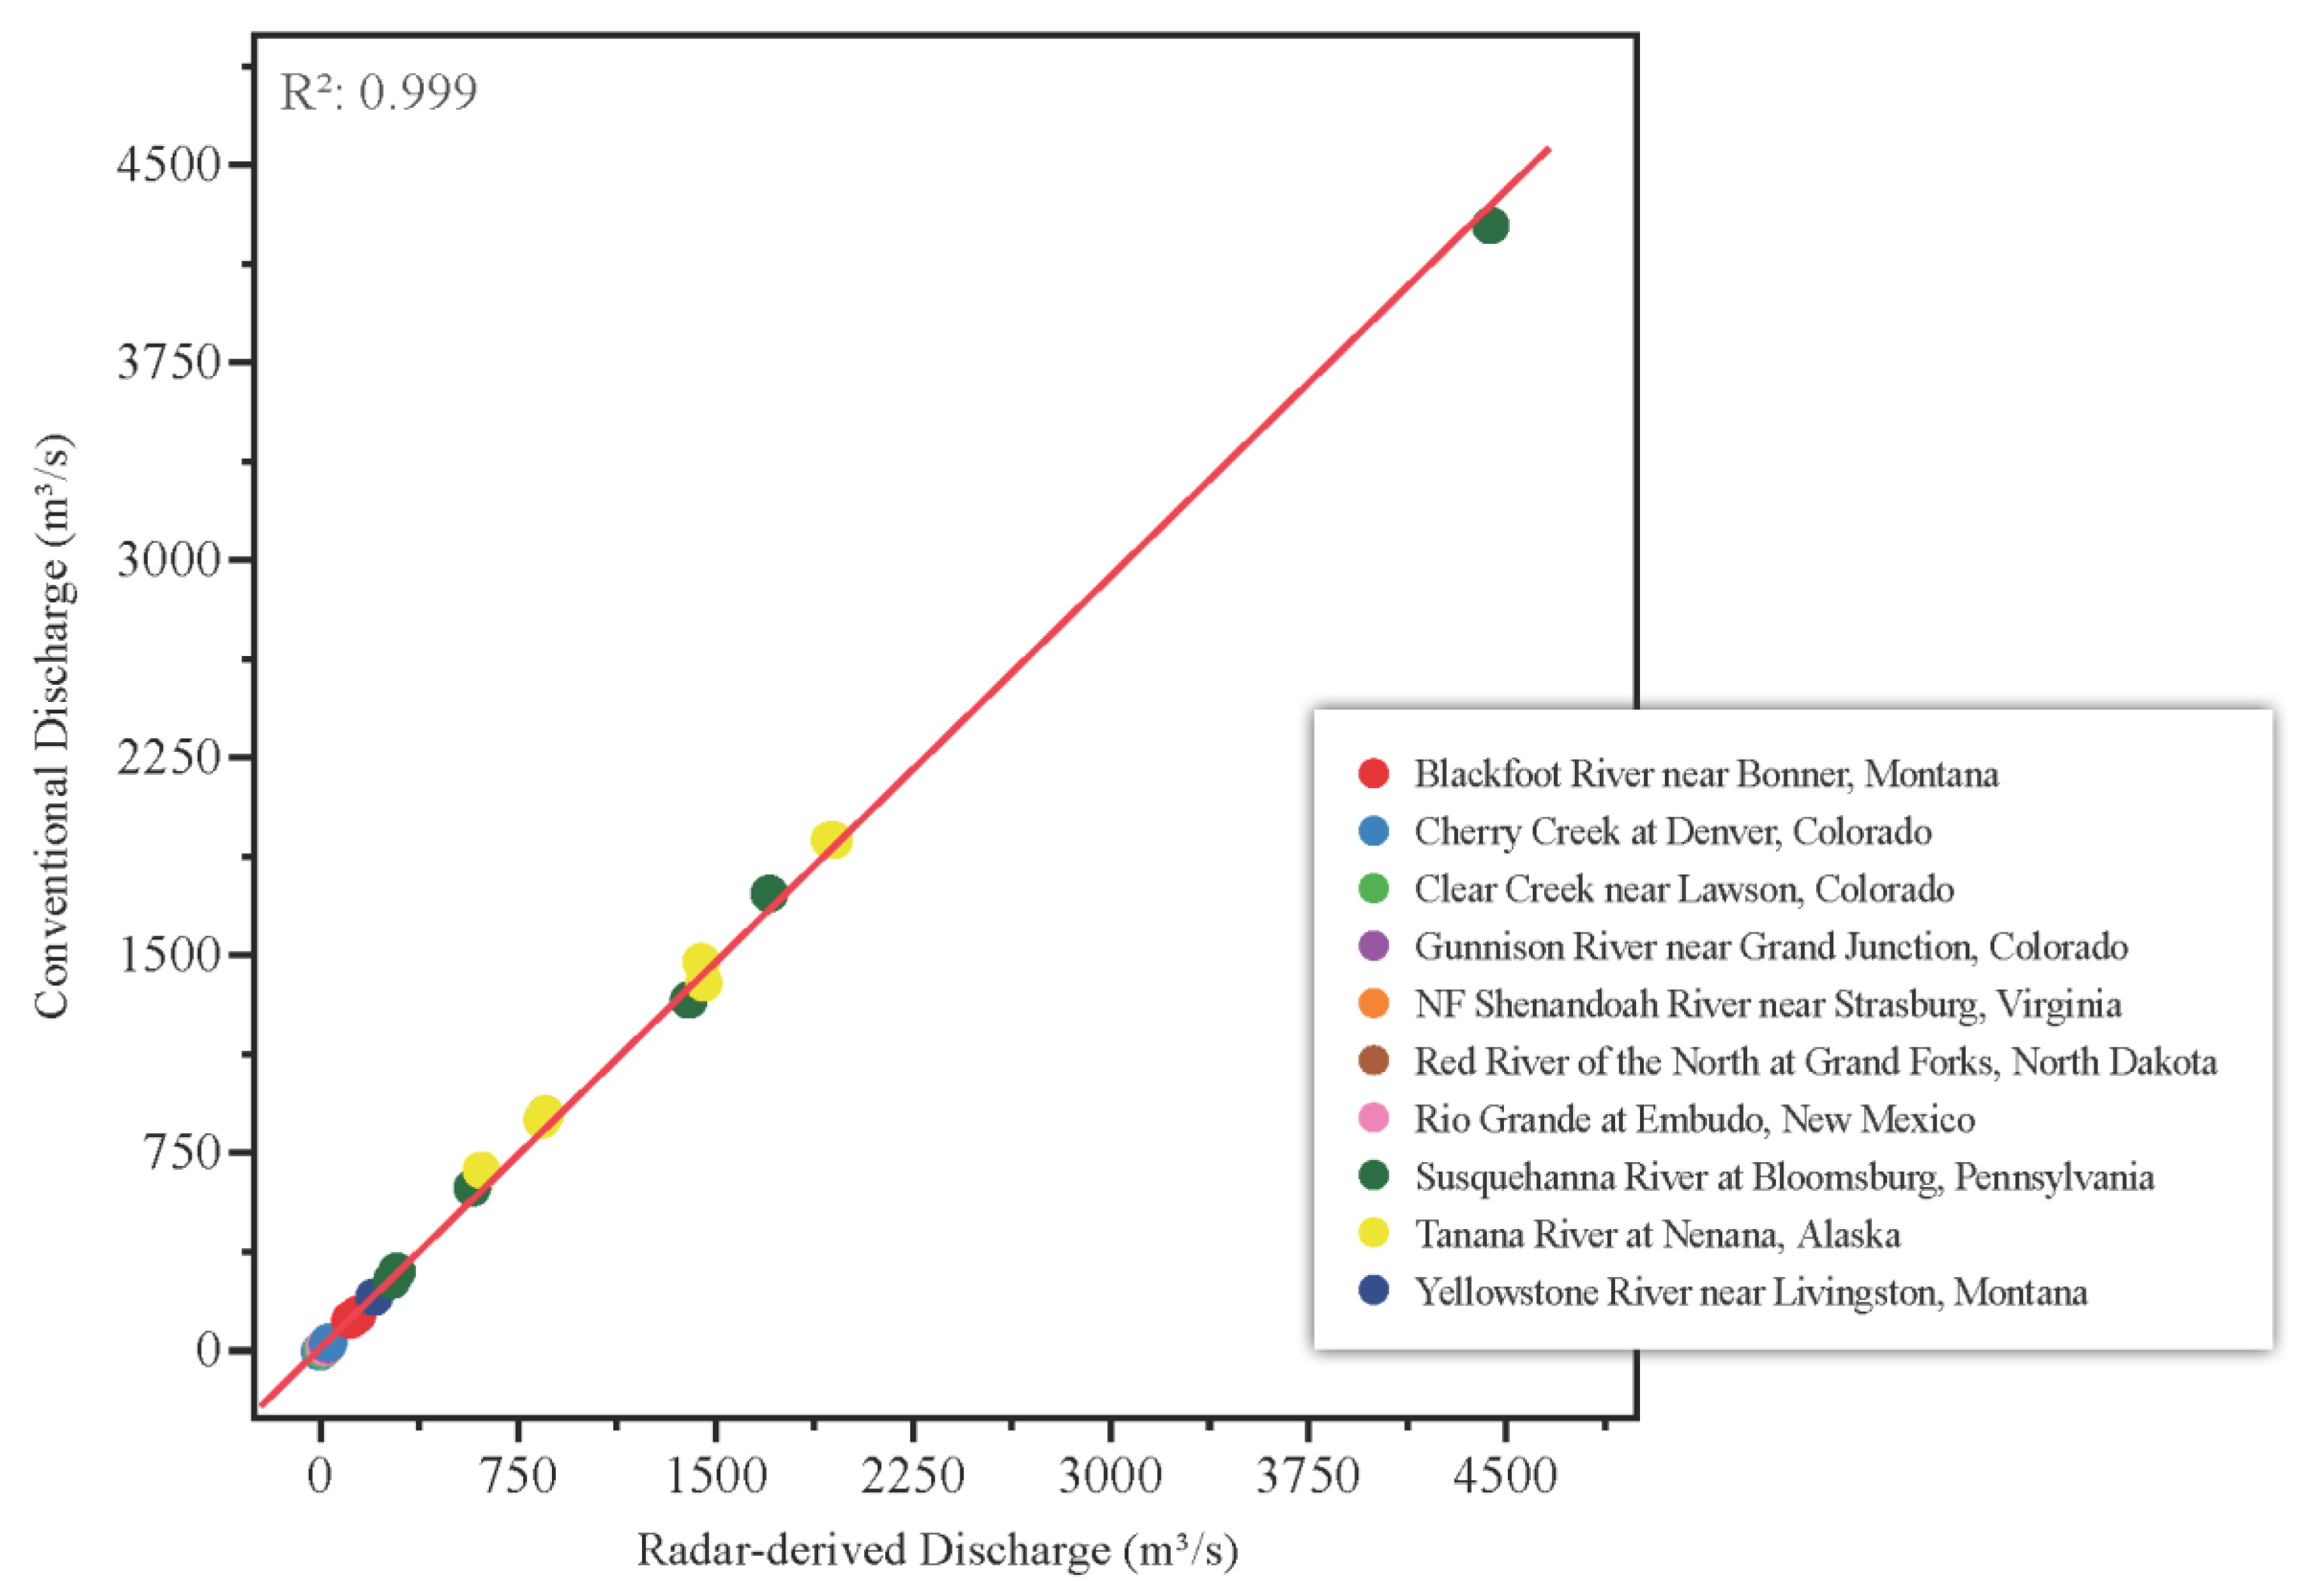
Radar-derived discharges (Table 5) ranged from 0.85 to 615 cubic meters per second (m3/s) at Cherry Creek and the Tanana River. Similarly, stage-discharges (Table 5) ranged from 0.84 to 690 m3/s at Cherry Creek and the Tanana River. Because radar-derived discharge is calculated as a linear function of velocity (Equation (10)), discharge biases were identical to the mean velocity findings, where the composite average percent error was biased low −1.1%, and the absolute percent error was biased high 3.6% (Table 5). Figure 7 summarizes the results of 36 site visits (10 siting and 26 validation), where the data show strong agreement between the radar-derived and conventional methods, as demonstrated by an R2 = 0.999.

3.2. Operational Phase

3.2.1. Velocity and Discharge

Radar-derived surface velocities (Table 6) and discharges (Table 7) ranged from 0.30 to 3.84 m/s at Cherry Creek and the Yellowstone River, respectively, and 0.17 to 4890 m3/s at Cherry Creek and the Susquehanna River, respectively. Similar to the radar gages, stage-discharges (Table 7) ranged from 0.12 to 4950 m3/s at Cherry Creek and the Susquehanna River. The lowest radar-derived surface velocity (0.30 m/s) and discharge (0.17 m3/s) was reported at Cherry Creek, which is an engineered urban channel with upstream streamflow regulation. The greatest radar-derived surface velocity (3.84 m/s) was reported at the Yellowstone River, a high-gradient mountain stream. The greatest radar-derived discharge (4890 m3/s) was recorded at the Susquehanna River, a large river system. The lowest stage-discharge (0.12 m3/s) was reported at Cherry Creek, and the highest stage-discharge (4950 m3/s) was reported for the Susquehanna River. These results support the contention that the velocity and stage radars captured a broad range of streamflow conditions.
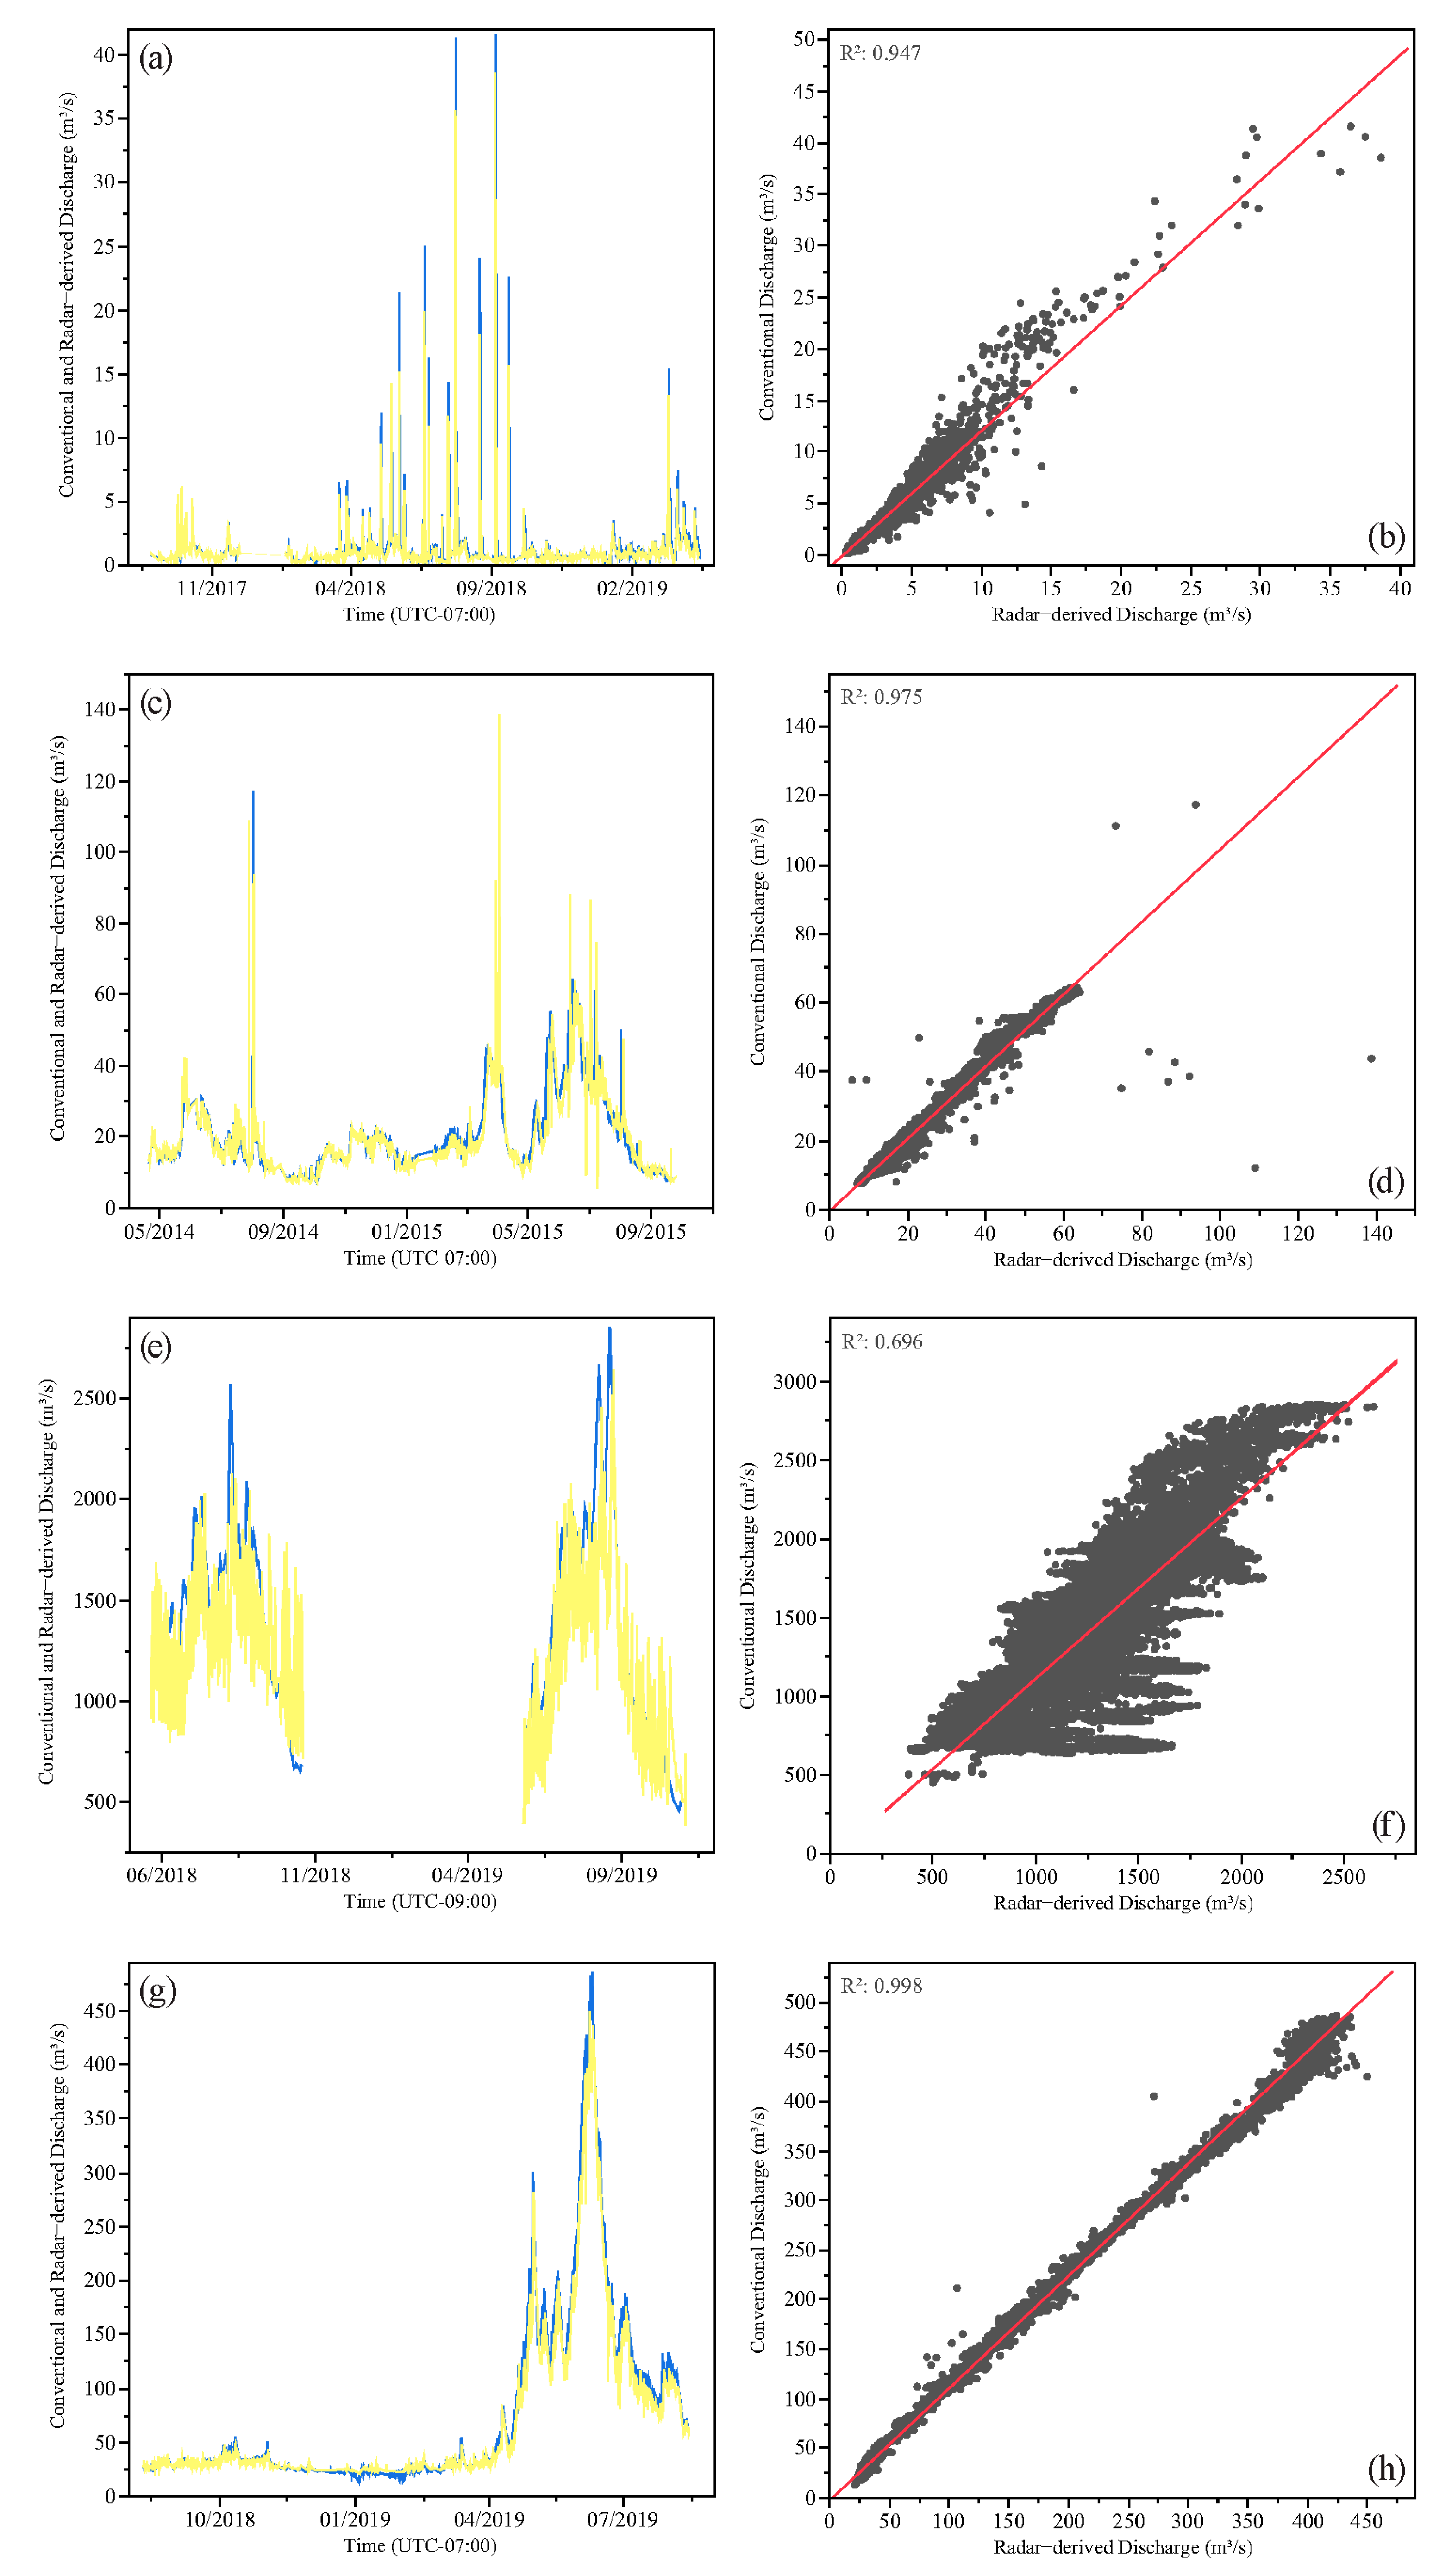
The radar gages were operated continuously for various time periods ranging from 2 weeks to 19 months. Discharge time series and companion scatter plots for Cherry Creek, Rio Grande, Tanana River, and Gunnison River demonstrate the utility of applying the PC method to small, moderate, and large river systems by comparing radar-derived discharges to stage-discharges (Figure 8a–h). It is important to note that hindcasting was not conducted. Subsequently, continuous radar discharges share the same time stamp as stage-discharges and were transmitted contemporaneously to the USGS NWIS database [91]. The minimum, median, maximum, and the number of radar-derived discharges are summarized in Table 8. The general timing and magnitude of peak and low-streamflow recorded by the radars and stage-discharge ratings were similar for all 10 sites based on the goodness-of-fit (GOF) metrics; however, only Cherry Creek, Rio Grande, Tanana River, and Gunnison River are illustrated graphically, because they span the hydraulic extremes tested. Several radar-peak discharges for Cherry Creek and the Rio Grande are biased low when compared to the stage-discharge ratings, and the radar-derived discharge for the Tanana River is biased low. To assess the value of radars to measure velocity and stage and the probability concept to compute discharge, GOF metrics were compiled for each gage, including the mean absolute error (MAE), percent bias (PBIAS), log-transformed Nash–Sutcliffe efficiency (logNSE), Nash–Sutcliffe efficiency (NSE), and volumetric efficiency (VE). These metrics represent accepted standards for comparing truth to modeled data [92,93,94]. For this application, the radar-derived discharge represents the model, and the stage-discharge represents truth. Discharge was transmitted every 5 to 15 min for each radar gage resulting in data populations ranging from 448 to 151,161 samples. The entire record of each radar and conventional streamgage was analyzed for GOF, except for the Yellowstone River, where a split in streamflow occurred at discharges greater than approximately 113 m3/s. Although the conventional Yellowstone River streamgage measures the entire streamflow regime, the radar gage measures streamflow less than 113 m3/s. Subsequently, the record size was reduced from 7655 to 3099 samples. In general, model simulations can be considered satisfactory if the NSE exceeds 0.50 [93,94,95], PBIAS are within ±25% for streamflow [92,93,94], and VE approaches 1.0 [92,93,94]. The MAE and VE are most effective when used as an objective function for both low flows and high flows. The MAE ranged from 0.13 m3/s for Cherry Creek to 286 m3/s for the Susquehanna River. PBIAS ranged from 13.5% for the Blackfoot River to −13.9% for the NF Shenandoah River. The values for NSE varied from 0.59 for the Tanana River to 0.98 for the Gunnison River. The logNSE, which accounts for data bias, varied from 0.60 for the Tanana River to 0.99 for the Gunnison River. The VE ranged from 0.81 for Clear Creek to 0.94 for the Rio Grande. The scatter plots provide a measure of agreement and identify outliers between the radar-derived and stage-discharges. The data show strong agreement for Cherry Creek (R2 = 0.947), Rio Grande (R2 = 0.975), and the Gunnison River (R2 = 0.998) and moderate agreement for the Tanana River (R2 = 0.696).

3.2.2. Wind Drift

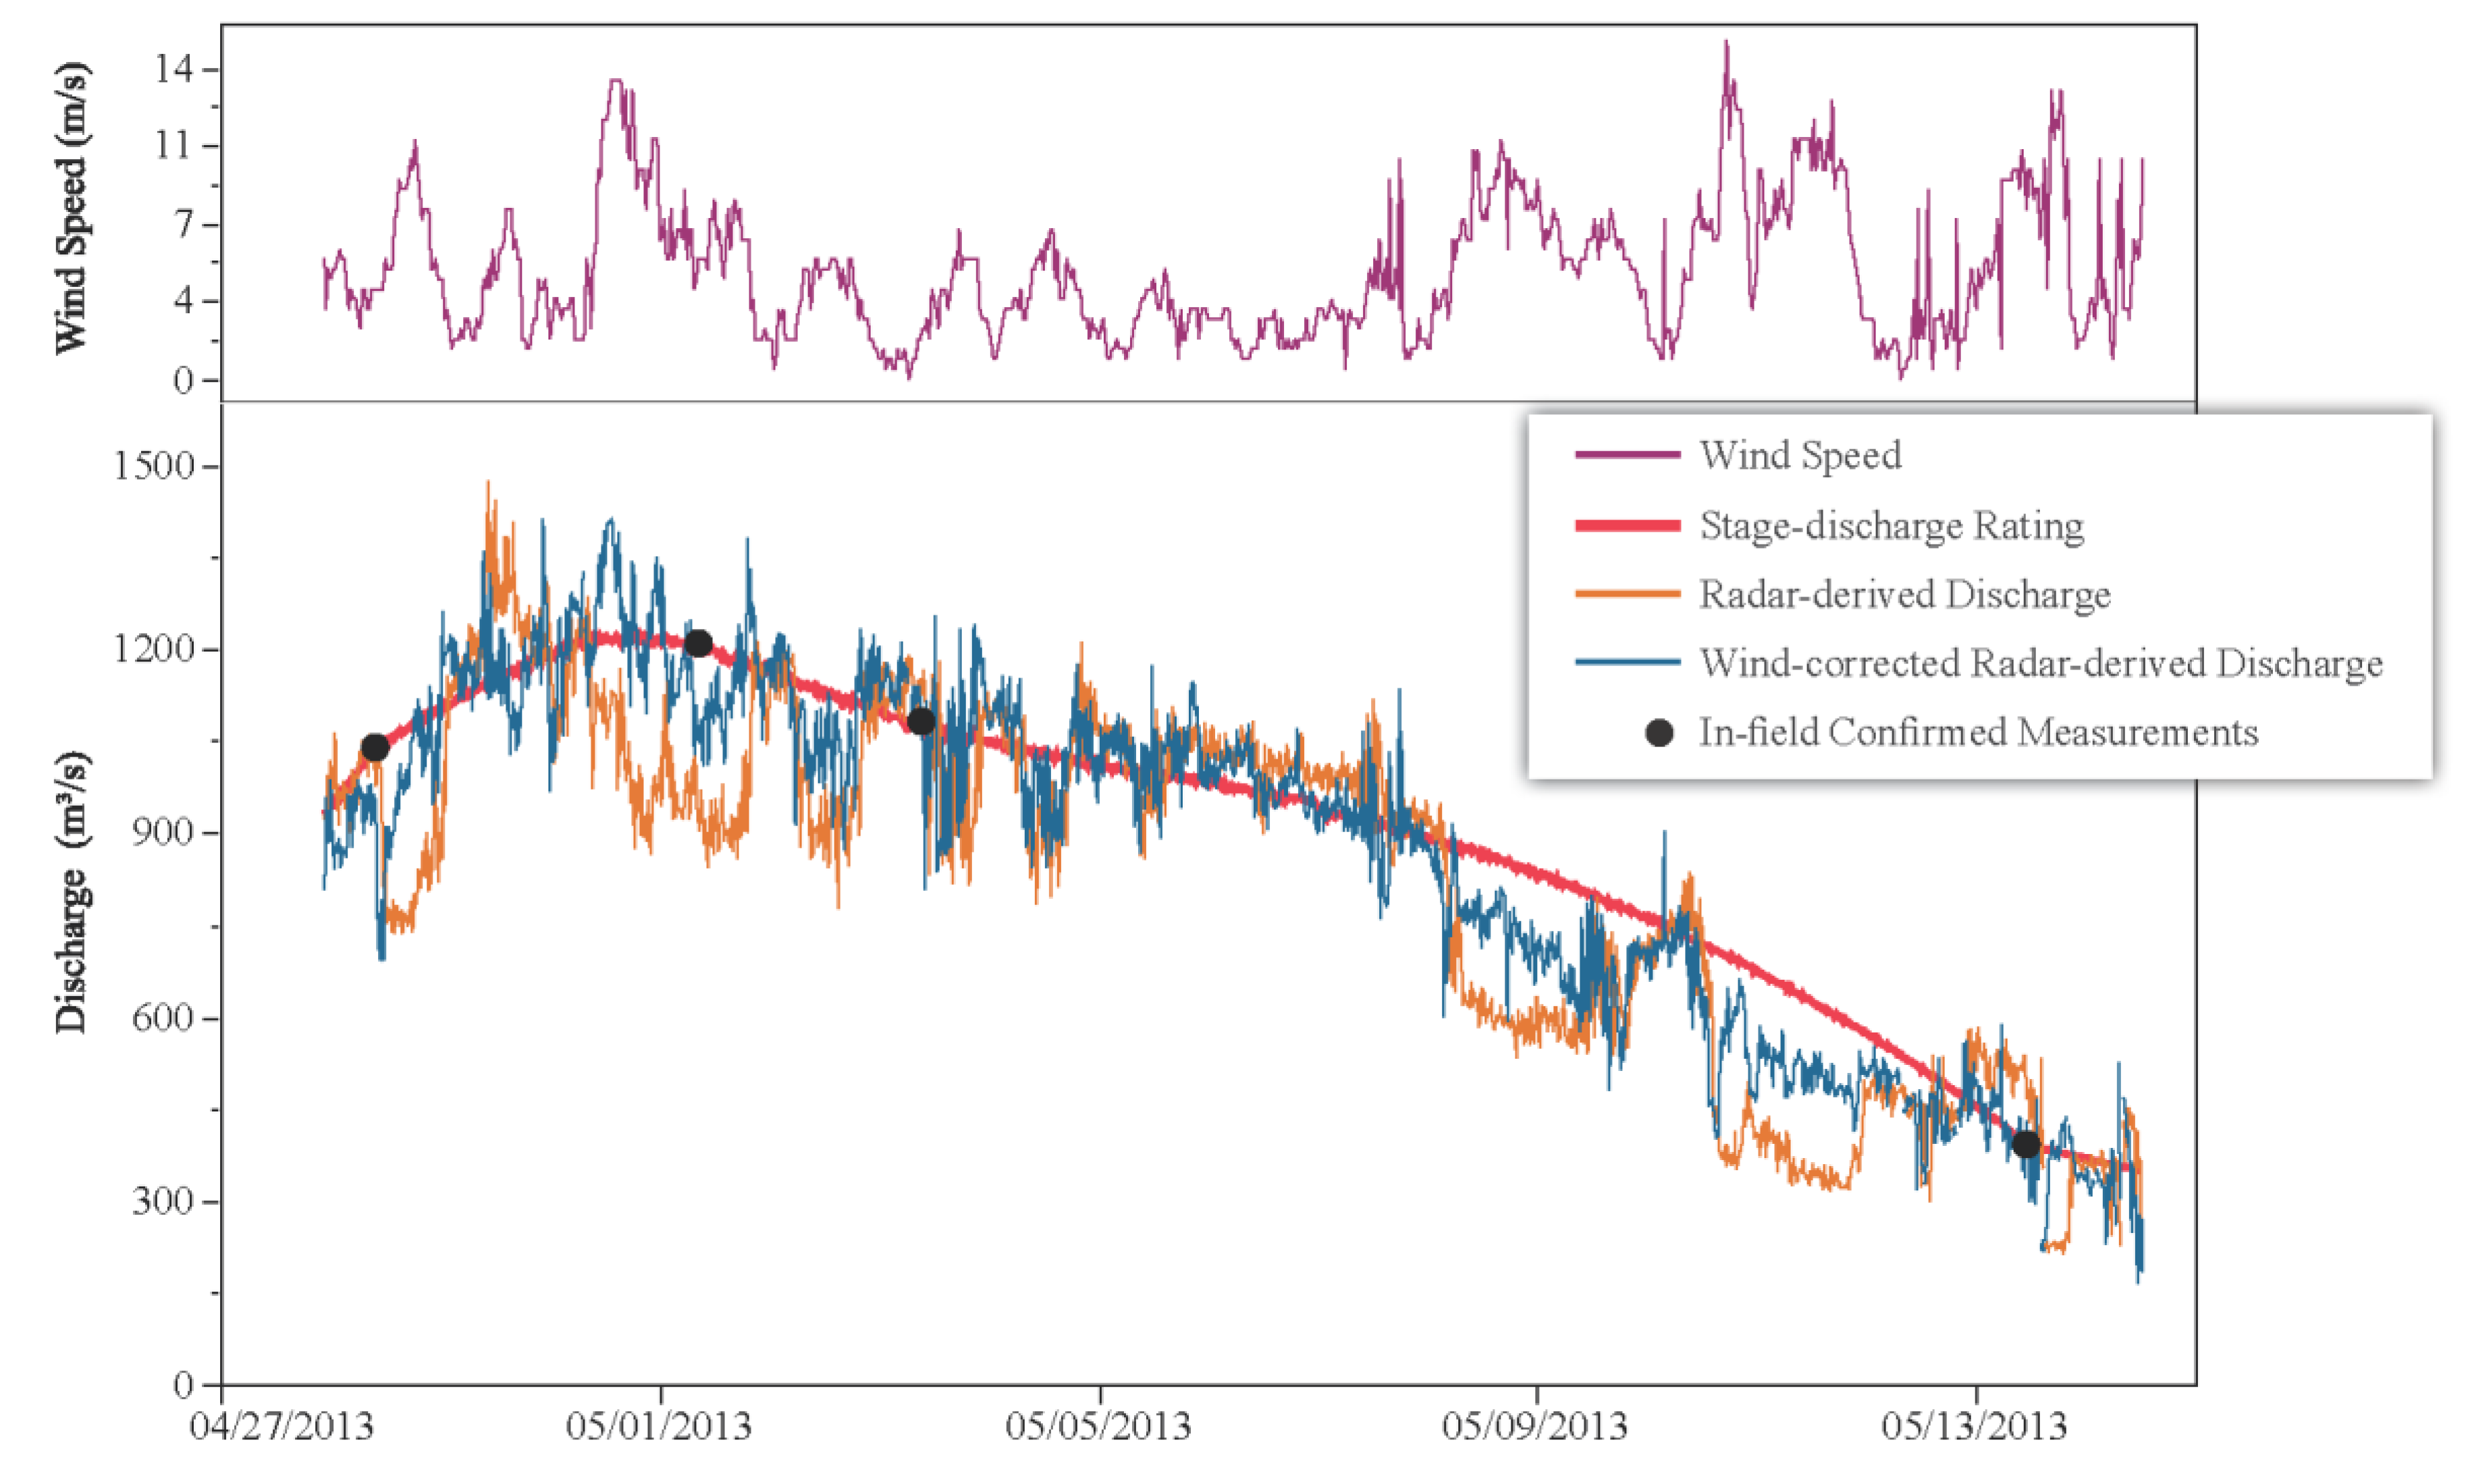
Wind can bias surface velocity measurements depending on site characteristics (e.g., incised river valley), hydraulics (e.g., low hydraulic gradient), and surface velocities (less than 0.15 m/s). A wind sensor was deployed at the Red River of the North and recorded wind magnitudes ranging from near zero to 15.2 m/s and variable wind direction [90]. The Red River of the North flows generally south to north at an azimuth of approximately 130 degrees. Winds originating from the north (220 degrees < wind direction < 40 degrees) would impede surface velocities and produce a low bias in discharge. Conversely, winds originating from the south (220 degrees > wind direction > 40 degrees) would promote greater than expected surface velocities and produce a high bias in discharge. Figure 9 illustrates the wind-corrected radar-derived discharge (blue line) relative to (1) the stage-discharge rating (red line), (2) instantaneous confirmation measurements (black dots), which were made during the radar deployment, (3) radar-derived discharge (orange line), and (4) wind speed (purple line). Using the wind-correction algorithm described in Section 2.4.4., the wind-corrected radar-derived discharge is an improvement when compared to the uncorrected radar-derived discharge.

4. Discussion

4.1. Velocity and Discharge Computations

The composite average and absolute percent error in the instantaneous radar-derived mean velocities and discharges as compared to conventional methods for all 36 site visits was −0.3% and 5.1%, respectively. The data show strong agreement between the mean velocities (R2 = 0.993) and discharges (R2 = 0.999). Subsequently, when radars are properly sited, and the PC algorithm is properly parameterized, the near-field remote sensing of mean velocity and discharge can be computed and telemetered in real-time. Parameter calibration and hindcasting is not necessary. Both the timing and magnitude of peak and low-streamflow compared favorably to stage-discharge time series. An ensemble approach, which relied on a suite of GOF metrics including MAE, PBIAS, logNSE, NSE, and VE, was used to assess the potential for radars to measure discharge within an acceptable range of uncertainty. The extensibility of near-field remote sensing is based on the contention that: (1) 10 radar gages operated for sufficiently long periods of time and (2) hydraulic extremes were captured by radar gages deployed in a variety of hydrologic basins. On the basis of data presented, Doppler velocity and pulsed stage radars coupled with the PC algorithm can be operationalized to deliver real-time velocity and discharge within acceptable uncertainties common to all streamgaging methods.
The range of radar-derived surface, maximum, and mean velocities were expected based on the hydraulic settings, which were gaged. Low velocities were common in rivers that have low hydraulic gradients such as the Red River of the North. High velocities were reported in engineered urban and high-gradient mountain streams such as Cherry Creek, Clear Creek, Blackfoot River, and Yellowstone River. Because radar-derived discharge is a function of ϕ, maximum velocity, and the cross-sectional area, errors in any of these parameters will introduce uncertainties in the computed discharge, and it is important to acknowledge those biases. Although the results indicate that ϕ is generally resilient and invariant to changes with time or hydraulic conditions, temporal variations in ϕ were nominal and percent differences between the siting and operational phases were minimal for Cherry Creek (0.678 and 0.6896, −1.7%), Clear Creek (0.573 and 0.5752, −0.3%), Susquehanna River (0.783 and 0.8114, −3.5%), and Tanana River (0.718 and 0.7639, −6.0%), respectively. For the Tanana River, the results indicate that the mean velocity and discharge can be computed in the absence of historical data to within an average percent error of about −6.0%. This assumes that the stage-area rating is stable, which must be periodically confirmed. Any deviation in the rating will affect the reported discharge. There is an operational advantage with radars relative to conventional methods, because a radar gage can be stood-up immediately after siting is complete, rather than waiting for a stage-discharge rating to be established. This has profound implications for ungaged basins, which lack historical stage and discharge measurements. Rather than wait months or years to develop a stage-discharge rating, real-time discharge can be delivered straight away using near-field remote sensing radars and the PC algorithm. The level of effort associated with radar gage operation and maintenance can be reduced to event-based visits only. Site visits would be justified prior to, during, and after extreme events to validate ϕ, the location of the y-axis (does its location vary with discharge), and the stage-area rating. This approach is consistent with conventional USGS methods, where periodic site visits are used to maintain stage-discharge ratings.
Based on the GOF metrics [92,93,94], the remote sensing of the mean velocity, stage, and discharge via radars is a reality. The PBIAS for each site was less than the ± 25% recommended for streamflow prediction; the logNSE and NSE exceeded the recommended value of 0.50; and the VE approaches a value of 1.0, indicating the predictive potential of radars to measure surface velocity and stage and to compute discharge using the probability concept. Cherry Creek (R2 = 0.947), Rio Grande (R2 = 0.975), and the Gunnison River (R2 = 0.998) demonstrate that radar gages are capable of measuring streamflow in real-time. Outliers exist at Cherry Creek and the Gunnison River at greater discharges and may be related to unsteady streamflow conditions. In general, the Tanana River exhibited the lowest GOF metrics, and the time-series comparisons and scatter plots (R2 = 0.696) support that contention. The Tanana River is dominated by large-scale, secondary currents that may bias surface velocities and subsequently discharge. This is reflected by the spikey nature of the time-series data illustrated in Figure 8e,f. Additional research is needed for large river systems, which may be influenced by environmental factors such as wind drift and hydraulic factors such as eddies, secondary flows, and macroturbulence. The Gunnison River and the Rio Grande are moderate-sized river systems and exhibited some of the highest logNSE, NSE, and VE values. It is important to note that hindcasting or model calibration was not conducted for any of the 10 radar gages. Rather, continuous, radar-derived velocity, stage, and discharge were transmitted contemporaneously to the USGS NWIS database [91] and shared the same time stamp as stage-discharge.

4.2. Uncertainty

4.2.1. Variability in ϕ

It was demonstrated that ϕ is relatively constant for a channel cross section regardless of discharge or other hydraulic factors (Figure 6a–d). When operationalizing a radar gage, it was assumed that the PC model (umax occurs at the water surface versus umax occurs at depth) selected during the siting phase was used to forecast streamflow during the operational phase. Additional research is needed to quantify the uncertainty in ϕ in the event that umax occurs at the surface for specific discharges, and if umax occurs at depth for other streamflow events at the same cross-section. Based on Table 1, Table 2 and Table 4, no correlation exists between the magnitude of ϕ and drainage area; rather, ϕ is a function of the velocity distribution measured at a cross-section of interest.

4.2.2. Variability in y-axis

As discussed in Section 3.1.2., the location of the y-axis at each radar gage was verified during each site visit using the methods described in Section 2.4.1. At no time or during no specific streamflow condition did the y-axis differ from the siting phase. For example, the location of the y-axis at the Susquehanna River was inferred from historical streamgaging records based on conventional 0.2D and 0.8D velocity measurements, which were used to compute the theoretical maximum velocity. The location of the y-axis at Cherry Creek, Clear Creek, and the Tanana River was confirmed in the field using mechanical current meters or hydroacoustics. Previous investigations indicate the location of the y-axis is stable [66,67,68,69,70,71,72,73,74,75,76,95]; however, additional research is needed to corroborate the uncertainty of the shifts in the y-axis as a function of discharge. As such, research is being conducted on the Gunnison River, where video images are being collected and processed for PIV. The camera and velocity radar footprint intersect, and the resulting velocity data will provide data to validate the y-axis variability.

4.2.3. Wind drift, Sample Duration and Frequency, and Minimum-Surface Velocities

Wind drift is caused by shear at the air–water interface and can serve as a source of error [51,62,96,97,98,99]. The coherent, continuous-wave radars that were deployed are capable of measuring surface scatterers; however, the energy transmitted by the radar is attenuated rapidly after it encounters the water surface. The effective depth at which the velocity is measured is a function of the scatterer wavelength or approximately 0.044 λ, where λ = the wavelength of the resonant water wave [96]. For λ = 0.75 cm, this depth is about 0.03 cm. The wind drift layer at this depth has not completely decayed, and the surface velocity requires correction or qualification to accurately estimate discharge. The results from the Red River of the North demonstrate the need to (1) implement theoretical correction such as the one described in Section 3.2.2, (2) qualify the data as excellent, good, fair, or poor depending on the magnitude of wind versus the surface velocity, or (3) develop an empirical relation to correct the wind-affected surface velocities as a function of other metrics such as a change in water level. Regardless, wind can be a prominent bias in radar-derived velocities and discharges.
The sample duration and frequency has an effect on the radar return and can be optimized in the field based on the quality of the radar spectrum. Typically, when deploying velocity radars and depending on variations in velocity with time, spot dwells should range from 30 s to 2 min to achieve stable measurements [59,62]. For example, the PBIAS, NSE, and logNSE reported for the Tanana River may be a function of the radar sample duration and frequency. The Tanana River is dominated by large-scale secondary currents that exhibit themselves as eddies on the water surface. If the eddies are sufficiently large, and the sample duration is small, the radar will sample the eddy-dominated velocities rather than the scatterers that ride on the surface of large-scale waves characteristic of ambient velocities. This effect may bias the velocities depending on the magnitude and direction of the eddy-dominated currents and deviate from truth. Similarly, the noise (data spikes) data observed in Figure 8a,c,e,g and Figure 9 may be a composite of each of these factors.
Various filters are being investigated to reduce the noise observed in some radar gages, which may be physically correct or may be associated with wind drift, sample duration, and temporal and spatial variability in surface velocities. Filters could include high- and low-pass filters, moving average, LOESS, Savitsky-Golay, and Kalman filters. The Savitsky-Golay filter has been incorporated in the USGS NWIS database [91] for Cherry Creek, Clear Creek, and the Tanana River; however, the filtered results are exploratory and were not included in this research.
Velocity radars operate best when surface velocities are greater than 0.15 m/s; particularly when surface-water scatterers (small waveforms) are ill-defined and wind drift is dominant.

5. Conclusions

To evaluate the efficacy of radars and algorithms used to measure and compute real-time discharge, 10 radar gages representing a wide range of hydraulic conditions were selected. The radars were deployed in near-field environments from fixed platforms on bridge decks. A range of hydrologic and hydraulic characteristics were considered in the study design and include basin variability (flashy-urban basins, high-gradient mountain streams, mixed use, and large rivers), drainage area (381 to 66,200 km2), top width (7 to 380 m), surface velocities (0.3 to 3.84 m/s), and discharge (0.12 to 4950 m3/s). Each of these characteristics has a profound effect on velocity and discharge magnitudes. To demonstrate the extensibility of near-field remote sensing, extremes in surface velocity and discharge were sought when siting a radar gage. All radar gages were collocated with an existing USGS streamgage, which served as truth, and were deployed for a sufficient period of time so that streamflow extremes could be captured and analyzed. Streamflow exceedances were computed and ranged from approximately 0% to 5.4%. These metrics indicate that the radar deployments are representative of the streamflow magnitudes and temporal variations, which were monitored at the collocated USGS streamgages.
The results show that Doppler velocity and stage-radar gages can produce continuous time series of mean velocity, stage, and discharges that: (1) compare favorably to stage-discharge streamgages and (2) can be computed in the absence of historical data. This assumes that the stage-area ratings developed for each site are stable or can be maintained. These methods offer an operational advantage relative to conventional methods, because unlike stage-discharge streamgages, they do not require months or years of rating development and maintenance. Rather, real-time data can be collected, computed, and transmitted immediately after the radars are deployed. This has profound implications for data analysis, delivery, and costs in settings such as ungaged basins, burn scars, flood-alert networks, and infrastructure design projects. Real-time discharge can be delivered using the PC algorithm and near-field remote sensing via radars. The level of effort associated with radar gage operation and maintenance can be reduced to event-based visits only, rather than recurring visits that are common with conventional streamgage maintenance. For example, a site visit would be conducted to validate ϕ, the location of the y-axis (does its location vary with discharge), and the stage-area rating during and after an extreme streamflow event.
Caution must be followed when deploying radars at sites where: (1) surface velocities are less than 0.15 m/s, (2) surface scatterers (small waveforms) are lacking, (3) wind is dominant, and (4) cross sections of interest are not compliant with traditional streamgaging methods. Although there is an operational advantage to near-field remote sensing, sources of uncertainty include gravity driven waves, wind drift, and sample duration, all of which can bias surface velocities and subsequently discharge.
During the siting phase, the composite average and absolute percent error in the instantaneous radar-derived mean velocities and discharges as compared to conventional methods for all 36 site visits was −0.3% and 5.1%, respectively. The data show strong agreement between the mean velocities (R2 = 0.993) and discharges (R2 = 0.999). During the operational phase, it is important to note the velocity, stage, and discharge time series represent two data streams—near-field remote sensing data and conventional data—that are independent and transmitted concurrently under the same time stamp. Hindcasting of the remote-sensing data was not conducted; rather, these two data streams represent independent, temporally equivalent, real-time products. The timing and magnitude of peak and low-streamflows measured by the velocity radar and reported in the USGS NWIS database [91] were comparable. The GOF metrics were compiled to demonstrate the comparability of the radar- and stage-discharge time series and included the number of samples, MAE, PBIAS, logNSE, NSE, and VE. Site operations for the 10 radar gages ranged from 2 weeks to 19 months, and the number of sample points per radar varied from 448 to 151,161. For the GOF parameters, MAE ranged from 0.13 to 286 m3/s; PBIAS ranged from 13.5% to -13.9%; NSE varied from 0.59 to 0.98; logNSE varied from 0.60 to 0.99; and VE ranged from 0.81 to 0.94. In general, this research answers the following questions: (1) radars can accurately measure surface velocities, (2) velocity and stage radars can be used to accurately compute mean velocities and discharges when compared to conventional methods that serve as truth, (3) near-field remote sensing can deliver real-time mean velocity, stage, and discharge operationally and in the absence of historical data, and (4) environmental and hydraulic factors must be considered when processing radar-derived surface velocities. The results support the contention that the probability concept coupled with velocity and stage radars are a viable technology that can be operationalized to deliver real-time velocity, stage, and discharge.

Author Contributions

Conceptualization, J.W.F.; methodology, J.W.F.,C.-L.C., T.M., software, C.A.M., J.W.F.; validation, TheTeam; formal analysis, J.W.F.; investigation, TheTeam; resources, J.J.G, D.W.; writing—original draft preparation, J.W.F., J.R.E., C.A.M.; writing—review and editing, J.W.F., J.R.E., C.A.M.; visualization, C.A.M.; supervision, J.W.F.; project administration, J.W.F.; funding acquisition, TheTeam. All authors have read and agreed to the published version of the manuscript.

Funding

This research was supported by the U.S. Geological Survey’s Water Mission Area Hydrologic Remote Sensing Branch and the U.S. Geological Survey Colorado Water Science Center.

Acknowledgments

The authors would like to recognize Jeff Conaway (USGS), Michelle Kang (USGS), Mike Kohn (USGS) and Jason Lambrecht (USGS) for their support in the field. Peter Ward (Hydrological Services America) provided the Doppler velocity and stage radars. Without these contributions, this work would not have been possible. The field measurements and image datasets used in this study are available in a USGS data release [90]. Any use of trade, firm, or product names is for descriptive purposes only and does not imply endorsement by the U.S. Government.

Conflicts of Interest

The authors declare no conflict of interest, and the funders had no role in the design of the study; in the collection, analyses, or interpretation of data; in the writing of the manuscript, or in the decision to publish the results.

References

  1. Eberts, S.; Woodside, M.; Landers, M.; Wagner, C. Monitoring the Pulse of our Nation’s Rivers and Streams—The U.S. Geological Survey Streamgaging Network; U.S. Geological Survey Fact Sheet 2018–3081; 2018. Available online: https://pubs.er.usgs.gov/publication/fs20183081 (accessed on 19 April 2020).
  2. Buchanan, T.J.; Somers, W.P. Discharge Measurements at Gaging Stations; U.S. Geological Survey Techniques of Water-Resources Investigations, Book 3, Chap A8; 1969; p. 65. Available online: http://pubs.usgs.gov/twri/twri3a8/ (accessed on 30 December 2019).
  3. Rantz, S. Measurement and Computation of Streamflow: Volume 1. Measurement of Stage and Discharge; U.S. Geological Survey Water Supply Paper 2175; United States Government Printing Office: Washington, DC, USA, 1982; p. 284.
  4. Turnipseed, D.P.; Sauer, V.B. Discharge Measurements at Gaging Stations; U.S. Geological Survey Techniques and Methods Book 3, Chap. A8; 2010; p. 87. Available online: http://pubs.usgs.gov/tm/tm3-a8/ (accessed on 30 December 2019).
  5. Christensen, J.L.; Herrick, L.E. Mississippi River Test: Volume 1. Final Rep.; DCP4400/300; the U.S. Geological Survey, AMETEK/Straza Division: El Cajon, CA, USA, 1982.
  6. Simpson, M.R. Evaluation of a vessel-mounted acoustic Doppler current profiler for use in rivers and estuaries. In Proceedings of the 3rd Working Conference on Current Measurement, IEEE, Washington, DC, USA, 22–24 January 1986; pp. 106–121. [Google Scholar]
  7. Gordon, R.L. Acoustic measurement of river discharge. J. Hydraul. Eng. 1989, 115, 925–936. [Google Scholar] [CrossRef]
  8. Simpson, M.R.; Oltmann, R.N. Discharge-Measurement System Using an Acoustic Doppler Current Profiler with Applications to Large Rivers and Estuaries; U.S. Geological Survey Water Supply Paper 2395; U.S. Geological Survey: Reston, VA, USA, 1993; p. 32.
  9. Oberg, K.A.; Morlock, S.E.; Caldwell, W.S. Quality Assurance Plan for Discharge Measurements Using Acoustic Doppler Current Profilers; U.S. Geological Survey Scientific Investigations Report 2005–5135; U.S. Geological Survey: Reston, VA, USA, 2005; p. 35.
  10. Mueller, D.S. QRev—Software for Computation and Quality Assurance of Acoustic Doppler Current Profiler Moving-Boat Streamflow Measurements—User’s Manual for Version 2.8; U.S. Geological Survey Open-File Report 2016–1052; USGS: Reston, VA, USA, 2016; p. 50. Available online: https://pubs.er.usgs.gov/publication/ofr20161052 (accessed on 30 December 2019).
  11. Mueller, D.S. Extrap: Software to assist the selection of extrapolation methods for moving-boat ADCP streamflow measurements. Comput. Geosci. 2013, 54, 211–218. [Google Scholar] [CrossRef]
  12. Lin, D.; Grundmann, J.; Eltner, A. Evaluating Image Tracking Approaches for Surface Velocimetry With Thermal Tracers. Water Resour. Res. 2019, 55, 3122–3136. [Google Scholar] [CrossRef]
  13. Hauet, A.; Morlot, T.; Daubagnan, L. Velocity Profile and Depth-Averaged to Surface Velocity in Natural Streams: A Review over a Large Sample of Rivers. E3S Web of Conferences 40 06015 River Flow, EDP Sciences, France. 2018. Available online: https://www.e3s-conferences.org/articles/e3sconf/abs/2018/15/e3sconf_riverflow2018_06015/e3sconf_riverflow2018_06015.html (accessed on 20 January 2020).
  14. Fujita, I.; Komura, S. Application of video image analysis for measurements of river-surface flows. Proc. Hydraul. Eng. JSCE 1994, 38, 733–738. [Google Scholar] [CrossRef]
  15. Tauro, F.; Pagano, C.; Phamduy, P.; Grimaldi, S.; Porfiri, M. Large-scale particle image velocimetry from an unmanned aerial vehicle. IEEE/ASME Trans. Mechatron. 2015, 20, 3269–3275. [Google Scholar] [CrossRef]
  16. Tauro, F.; Porfiri, M.; Grimaldi, S. Surface flow measurements from drones. J. Hydrol. 2016, 540, 240–245. [Google Scholar] [CrossRef] [Green Version]
  17. Kinzel, P.J.; Legleiter, C.J. sUAS-based remote sensing of river discharge using thermal particle image velocimetry and bathymetric lidar. Remote Sens. 2019, 11, 2317. [Google Scholar] [CrossRef] [Green Version]
  18. Dugan, J.P.; Anderson, S.P.; Piotrowski, C.C.; Zuckerman, S.B. Airborne infrared remote sensing of riverine currents. IEEE Trans. Geosci. Remote Sens. 2014, 52, 3895–3907. [Google Scholar] [CrossRef]
  19. Smith, L.C.; Isacks, B.L.; Bloom, A.L.; Murray, A.B. Estimation of discharge from three braided rivers using synthetic aperture radar satellite imagery. Water Resour. Res. 1996, 32, 2021–2034. [Google Scholar] [CrossRef]
  20. Leon, J.G.; Calmant, S.; Seyler, F.; Bonnet, M.P.; Cauhope, M.; Frappart, F. Rating curves and estimation of average water depth at the upper Negro River based on satellite altimeter data and modeled discharges. J. Hydrol. 2006, 328, 481–496. [Google Scholar] [CrossRef] [Green Version]
  21. Getirana, A.C.V.; Bonnet, M.P.; Calmant, S.; Roux, H.; Filho, O.C.R.; Mansur, W.J. Hydrological monitoring of poorly gauged basins based on rainfall–runoff modeling and spatial altimetry. J. Hydrol. 2009, 379, 205–219. [Google Scholar] [CrossRef]
  22. Birkinshaw, S.J.; O’Donnell, G.M.; Moore, P.; Kilsby, C.G.; Fowler, H.J.; Berry, P.A.M. Using satellite altimetry data to augment flow estimation techniques on the Mekong River. Hydrol. Process. 2010, 24, 3811–3825. [Google Scholar] [CrossRef]
  23. Getirana, A.C.V.; Peters-Lidard, C. Estimating water discharge from large radar altimetry datasets. Hydrol. Earth Syst. Sci. 2013, 17, 923–933. [Google Scholar] [CrossRef] [Green Version]
  24. Paiva, R.C.D.; Buarque, D.C.; Colischonn, W.; Bonnet, M.-P.; Frappart, F.; Calmant, S.; Mendes, C.A.B. Large-scale hydrological and hydrodynamics modelling of the Amazon River basin. Water Resour. Res. 2013, 49, 1226–1243. [Google Scholar] [CrossRef] [Green Version]
  25. Tarpanelli, A.; Barbetta, S.; Brocca, L.; Moramarco, T. River discharge estimation by using altimetry data and simplified flood routing modeling. Remote Sens. 2013, 5, 4145–4162. [Google Scholar] [CrossRef] [Green Version]
  26. Birkinshaw, S.J.; Moore, P.; Kilsby, C.G.; O’Donnell, G.M.; Hardy, A.J.; Berry, P.A.M. Daily discharge estimation at ungauged river sites using remote sensing. Hydrol. Process. 2014, 28, 1043–1054. [Google Scholar] [CrossRef]
  27. Pavelsky, T.M. Using width-based rating curves from spatially discontinuous satellite imagery to monitor river discharge. Hydrol. Process. 2014, 28, 3035–3040. [Google Scholar] [CrossRef]
  28. Paris, A.; Dias de Paiva, R.; Santos da Silva, J.; Medeiros Moreira, D.; Calmant, S.; Garambois, P.-A.; Collischonn, W.; Bonnet, M.-P.; Seyler, F. Stage-discharge rating curves based on satellite altimetry and modeled discharge in the Amazon basin. Water Resour. Res. 2016, 52, 3787–3814. [Google Scholar] [CrossRef] [Green Version]
  29. Bjerklie, D.M.; Birkett, C.M.; Jones, J.W.; Carabajal, C.; Rover, J.A.; Fulton, J.W.; Garambois, P.-A. Satellite remote sensing estimation of river discharge: Application to the Yukon River Alaska. J. Hydrol. 2018, 561, 1000–1018. [Google Scholar] [CrossRef] [Green Version]
  30. Bogning, S.; Frappart, F.; Blarel, F.; Niño, F.; Mahé, G.; Bricquet, J.-P.; Seyler, F.; Onguéné, R.; Etamé, J.; Paiz, M.-C.; et al. Monitoring water levels and discharges using radar altimetry in an ungauged river basin: The case of the Ogooué. Remote Sens. 2018, 10, 350. [Google Scholar] [CrossRef] [Green Version]
  31. Moramarco, T.; Barbetta, S.; Bjerklie, D.M.; Fulton, J.W.; Tarpanelli, A. River bathymetry estimate and discharge assessment from remote sensing. Water Resour. Res. 2019, 55, 6692–6711. [Google Scholar] [CrossRef]
  32. Birkett, C.M. Contribution of the TOPEX NASA radar altimeter to the global monitoring of large rivers and wetlands. Water Resour. Res. 1998, 34, 1223–1239. [Google Scholar] [CrossRef]
  33. Birkett, C.M.; Mertes, L.A.K.; Dunne, T.; Costa, M.H.; Jasinski, M.J. Surface water dynamics in the Amazon Basin: Application of satellite radar altimetry. J. Geophys. Res. 2002, 107, 8059. [Google Scholar] [CrossRef]
  34. Kouraev, A.V.; Zakharova, E.A.; Samain, O.; Mognard, N.M.; Cazenave, A. Ob’ river discharge from TOPEX/Poseidon satellite altimetry (1992–2002). Remote Sens. Environ. 2004, 93, 238–245. [Google Scholar] [CrossRef] [Green Version]
  35. Papa, F.; Bala, S.K.; Kumar Pandey, R.; Durand, F.; Rahman, A.; Rossow, W.B. Ganga-Brahmaputra River discharge. Geophys. Res. 2012, 117, C11021. [Google Scholar] [CrossRef] [Green Version]
  36. Tulbure, M.G.; Broich, M. Spatiotemporal dynamic of surface water bodies using Landsat time-series data from 1999 to 2011. ISPRS J. Photogramm. Remote Sens. 2013, 79, 44–52. [Google Scholar] [CrossRef]
  37. Gleason, C.J.; Smith, L.C. Toward global mapping of river discharge using satellite images and at-many-stations hydraulic geometry. Proc. Natl. Acad. Sci. USA 2014, 111, 4788–4791. [Google Scholar] [CrossRef] [Green Version]
  38. Kim, J.-W.; Lu, Z.; Jones, J.W.; Shum, C.K.; Lee, H.; Jia, Y. Monitoring Everglades freshwater marsh water level using L-band synthetic aperture radar backscatter. Remote Sens. Environ. 2014, 150, 66–81. [Google Scholar] [CrossRef]
  39. Jones, J.W. Efficient wetland surface water detection and monitoring via Landsat: Comparison with in situ data from the Everglades Depth Estimation Network. Remote Sens. 2015, 7, 12503–12538. [Google Scholar] [CrossRef] [Green Version]
  40. Carroll, M.; Wooten, M.; DiMiceli, C.; Sohlberg, R.; Kelly, M. Quantifying surface water dynamics at 30 meter spatial resolution in the North American high northern latitudes 1991–2011. Remote Sens. 2016, 8, 622. [Google Scholar] [CrossRef] [Green Version]
  41. Brakenridge, G.R.; Nghiem, S.V.; Anderson, E.; Mic, R. Orbital microwave measurement of river discharge and ice status. Water Resour. Res. 2007, 43, W04405. [Google Scholar] [CrossRef]
  42. Durand, M.; Neal, J.; Rodríguez, E.; Andreadis, K.M.; Smith, L.C.; Yoon, Y. Estimating reach-averaged discharge for the River Severn from measurements of river water surface elevation and slope. J. Hydrol. 2014, 511, 92–104. [Google Scholar] [CrossRef]
  43. Biancamaria, S.; Lettenmaier, D.P.; Pavelsky, T. The SWOT Mission and its capabilities for land hydrology. Surv. Geophys. 2015, 37, 307–337. [Google Scholar] [CrossRef] [Green Version]
  44. Garambois, P.-A.; Monnier, J. Inference of effective river properties from remotely sensed observations of water surface. Adv. Water Resour. 2015, 79, 103–120. [Google Scholar] [CrossRef]
  45. Bonnema, M.G.; Sikder, S.; Hossain, F.; Durand, M.; Gleason, C.J.; Bjerklie, D.M. Benchmarking wide swath altimetry-based river discharge estimation algorithms for the Ganges river system. Water Resour. Res. 2016, 52, 2439–2461. [Google Scholar] [CrossRef] [Green Version]
  46. Durand, M.; Gleason, C.J.; Garambois, P.A.; Bjerklie, D.M.; Smith, L.C.; Roux, H.; Rodriguez, E.; Bates, P.D.; Pavelsky, T.M.; Monnier, J.; et al. An intercomparison of remote sensing river discharge estimation algorithms from measurements of river height, width, and slope. Water Resour. Res. 2016, 52, 4527–4549. [Google Scholar] [CrossRef] [Green Version]
  47. National Aeronautics and Space Administration (NASA). SWOT Surface Water and Ocean Topography. Available online: https://swot.jpl.nasa.gov/home.htm (accessed on 17 July 2018).
  48. Costa, J.E.; Spicer, K.R.; Cheng, R.T.; Haeni, F.P.; Melcher, N.B.; Thurman, E.M.; Plant, W.J.; Keller, W.C. Measuring stream discharge by non-contact methods: A Proof-of-Concept Experiment. Geophys. Res. Lett. 2000, 27, 553–556. [Google Scholar] [CrossRef]
  49. Melcher, N.B.; Costa, J.E.; Haeni, F.P.; Cheng, R.T.; Thurman, E.M.; Buursink, M.; Spicer, K.R.; Hayes, E.; Plant, W.J.; Keller, W.C. River discharge measurements by using helicopter-mounted radar. Geophys. Res. Lett. 2002, 29, 41–44. [Google Scholar] [CrossRef] [Green Version]
  50. Fulton, J.W.; Anderson, I.E.; Chiu, C.-L.; Sommer, W.; Adams, J.D.; Moramarco, T.; Bjerklie, D.M.; Fulford, J.M.; Sloan, J.L. sUAS-based remote sensing of velocity and discharge using Doppler radar. (manuscript in preparation).
  51. Plant, W.J.; Keller, W.C.; Hayes, K. Measurement of river surface currents with coherent microwave systems. IEEE Trans. Geosci. Remote Sens. 2005, 43, 1242–1257. [Google Scholar] [CrossRef]
  52. Costa, J.E.; Cheng, R.T.; Haeni, F.P.; Melcher, N.; Spicer, K.R.; Hayes, E.; Plant, W.; Hayes, K.; Teague, C.; Barrick, D. Use of radars to monitor stream discharge by noncontact methods. Water Resour. Res. 2006, 42, 14. [Google Scholar] [CrossRef]
  53. Fulton, J.W.; Ostrowski, J. Measuring real-time streamflow using emerging technologies: Radar, hydroacoustics, and the probability concept. J. Hydrol. 2008, 357, 1–10. [Google Scholar] [CrossRef]
  54. Boning, C.W. Policy Statement on Stage Accuracy; U.S. Geological Survey, Office of Surface Water Technical Memorandum 93.07; 1992. Available online: https://water.usgs.gov/admin/memo/SW/sw93.07.html (accessed on 14 February 2020).
  55. Sauer, V.B.; Meyer, R.W. Determination of Error in Individual Discharge Measurements; U.S. Geological Survey Open-File Report 92–144; U.S. Geological Survey: Reston, VA, USA, 1992; p. 21. [CrossRef] [Green Version]
  56. Kiang, J.E.; Gazoorian, C.; McMillan, H.; Coxon, G.; Le Coz, J.; Westerberg, I.K.; Belleville, A.; Sevrez, D.; Sikorska, A.E.; Petersen-Øverleir, A.; et al. A Comparison of Methods for Streamflow Uncertainty Estimation. Water Resour. Res. 2018, 54, 7149–7176. [Google Scholar] [CrossRef] [Green Version]
  57. Cohn, T.A.; Kiang, J.E.; Mason, R.R. Estimating Discharge Measurement Uncertainty Using the Interpolated Variance Estimator. J. Hydraul. Eng. 2013, 139, 502–510. [Google Scholar] [CrossRef]
  58. McMillan, H.; Krueger, T.; Freer, J. Benchmarking observational uncertainties for hydrology: Rainfall, river discharge and water quality. Hydrol. Process. 2012, 26, 4078–4111. [Google Scholar] [CrossRef]
  59. Welber, M.; Le Coz, J.; Laronne, J.B.; Zolezzi, G.; Zamler, D.; Dramais, G.; Hauet, A.; Salvaro, M. Field assessment of noncontact stream gauging using portable surface velocity radars (SVR). Water Resour. Res. 2016, 2, 1108–1126. [Google Scholar] [CrossRef] [Green Version]
  60. Sauer, V.B. Standards for the Analysis and Processing of Surface-Water Data and Information Using Electronic Methods; U.S. Geological Survey Water-Resources Investigations Report 01–4044; U.S. Geological Survey: Reston, VA, USA, 2002; p. 91.
  61. Levesque, V.A.; Oberg, K.A. Computing Discharge Using the Index Velocity Method; U.S. Geological Survey Techniques and Methods 3–A23; 2012; p. 148. Available online: https://pubs.usgs.gov/tm/3a23/ (accessed on 20 January 2019).
  62. Fulton, J.W. Guidelines for Siting and Operating Surface-Water Velocity Radars. Available online: https://my.usgs.gov/confluence/display/SurfBoard/Guidelines+for+Siting+and+Operating+Surface-water+Velocity+Radars (accessed on 25 June 2018).
  63. Moramarco, T.; Barbetta, S.; Tarpanelli, A. From surface flow velocity measurements to discharge assessment by the entropy theory. Water. 2017, 9, 120. [Google Scholar] [CrossRef] [Green Version]
  64. Parsons, D.R.; Jackson, P.R.; Czuba, J.A.; Engel, F.L.; Rhoads, B.L.; Oberg, K.A.; Best, J.L.; Mueller, D.S.; Johnson, K.K.; Riley, J.D. Velocity Mapping Toolbox (VMT): A processing and visualization suite for moving-vessel ADCP measurements. Earth Surf. Process. Landf. 2013, 38, 1244–1260. [Google Scholar] [CrossRef]
  65. U.S. Geological Survey (USGS), Office of Surface Water Hydroacoustics Page. Available online: https://hydroacoustics.usgs.gov/movingboat/WinRiverII.shtml (accessed on 30 January 2020).
  66. Chiu, C.-L.; Chiou, J.-D. Structure of 3-D Flow in rectangular open channels. J. Hydraul. Eng. 1986, 112, 1050–1068. [Google Scholar] [CrossRef]
  67. Chiu, C.-L. Entropy and probability concepts in hydraulics. J. Hydraul. Eng. 1987, 113, 583–600. [Google Scholar] [CrossRef]
  68. Chiu, C.-L. Velocity distribution in open channel flow. J. Hydraul. Eng. 1989, 115, 576–594. [Google Scholar] [CrossRef]
  69. Chiu, C.-L. Probability and Entropy Concepts in Fluid Flow Modeling and Measurement; National Taiwan University: Taipei, Taiwan, 15 March 1995. [Google Scholar]
  70. Chiu, C.-L.; Tung, N.C.; Hsu, S.M.; Fulton, J.W. Comparison and Assessment of Methods of Measuring Discharge in Rivers and Streams; Research Report No. CEEWR-4; Dept. of Civil & Environmental Engineering, University of Pittsburgh: Pittsburgh, PA, USA, 2001. [Google Scholar]
  71. Chiu, C.-L.; Tung, N.C. Velocity and regularities in open-channel flow. J. Hydraul. Eng. 2002, 128, 390–398. [Google Scholar] [CrossRef]
  72. Chiu, C.-L.; Hsu, S.M.; Tung, N.C. Efficient methods of discharge measurements in rivers and streams based on the probability concept. Hydrol. Process. Wiley Intersci. 2005, 19, 3935–3946. [Google Scholar] [CrossRef]
  73. Chiu, C.-L.; Hsu, S.-M. Probabilistic approach to modeling of velocity distributions in fluid flows. J. Hydrol. 2006, 316, 28–42. [Google Scholar] [CrossRef]
  74. Moramarco, T.; Dingman, S.L. On the theoretical velocity distribution and flow resistance in natural channels. J. Hydrol. 2017, 555, 777–785. [Google Scholar] [CrossRef]
  75. Moramarco, T.; Saltalippi, C.; Singh, V.P. Estimation of mean velocity in natural channel based on Chiu’s velocity distribution equation. J. Hydrol. Eng. 2004, 9, 42–50. [Google Scholar] [CrossRef]
  76. Fulton, J.W. Comparison of Conventional and Probability-Based Modeling of Open-Channel Flow in The Allegheny River, Pennsylvania, USA. Unpublished Thesis, Department of Civil and Environmental Engineering, University of Pittsburgh, Pittsburgh, PA, USA, April 1999. [Google Scholar]
  77. Lant, J.; Mueller, D.S. Stage Area Rating Application – AreaComp2, USGS. Office of Surface Water. 2012. Available online: http://hydroacoustics.usgs.gov/software/AreaComp2_Users_Guide.pdf (accessed on 21 January 2020).
  78. Chow, V.T.; Maidment, D.R.; Mays, L.W. Applied Hydrology, International Edition 1988; McGraw-Hill Inc.: Singapore, 1988; pp. 42–47. [Google Scholar]
  79. González, J.A.; Melching, C.S.; Oberg, K.A. Analysis of open-channel velocity measurements collected with an acoustic Doppler current profiler. Reprint from RIVERTECH 96. In Proceedings of the 1st International Conference On New/Emerging Concepts for Rivers Organized by the International Water Resources Association, Chicago, IL, USA, 22–26 September 1996. [Google Scholar]
  80. Murphy, E.C. Accuracy of Stream Measurements; Water-Supply and Irrigation Paper No. 95, Series M, General Hydrographic Investigations 10; United States Government Printing Office: Washington, DC, USA, 1904; pp. 58–163.
  81. Guo, J.; Julien, P.Y. Application of the modified log-wake law in open-Channels. J. Appl. Fluid Mech. 2008, 1, 17–23. [Google Scholar]
  82. Jarrett, R.D. Wading measurements of vertical velocity profiles. Geomorphology 1991, 4, 243–247. [Google Scholar] [CrossRef]
  83. Kundu, S.; Ghoshal, K. Velocity Distribution in Open Channels: Combination of Log-law and Parabolic-law. World Acad. Sci. Eng. Technol. Int. J. Math. Comput. Phys. Electr. Comput. Eng. 2012, 6, 1234–1241. [Google Scholar]
  84. Wiberg, P.L.; Smith, J.D. Velocity distribution and bed roughness in high-gradient streams. Water Resour. Res. 1991, 27, 825–838. [Google Scholar] [CrossRef]
  85. Yang, S.-Q.; Xu, W.-L.; Yu, G.-L. Velocity distribution in gradually accelerating free surface flow. Adv. Water Resour. 2006, 29, 1969–1980. [Google Scholar] [CrossRef]
  86. Blodgett, J.C. Rock Riprap Design for Protection of Stream Channels Near Highway Structures, Volume 1: Hydraulic Characteristics of Open Channels; U.S. Geological Survey Water-Resources Investigations Report 86–4127; U.S. Geological Survey: Reston, VA, USA, 1986; p. 60. [CrossRef]
  87. Shannon, C.E. A mathematical theory of communication. Bell Syst. Tech. J. 1948, 27, 623–656. [Google Scholar] [CrossRef]
  88. R Core Team. R: A Language and Environment for Statistical Computing; R Foundation for Statistical Computing: Vienna, Austria, 2019; Available online: https://www.R-project.org/ (accessed on 9 February 2020).
  89. Zambrano-Bigiarini, M. HydroGOF: Goodness-of-Fit Functions for Comparison of Simulated and Observed Hydrological Time Series. R Package Version 0.3–10. 2017. Available online: http://hzambran.github.io/hydroGOF/ (accessed on 9 February 2020).
  90. Fulton, J.W.; Mcdermott, W.R.; Mason, C.A. Radar-based field measurements of surface velocity and discharge from 10 USGS streamgages for various locations in the United States, 2002–2019. U.S. Geological Survey data release, (manuscript in review).
  91. U.S. Geological Survey. USGS Water Data for the Nation; U.S. Geological Survey National Water Information System Database; 2016. Available online: https://waterdata.usgs.gov/nwis (accessed on 15 November 2016).
  92. Criss, R.E.; Winston, W.E. Do Nash values have value? Discussion and alternate proposals. Hydrol. Process. 2008, 22, 2723–2725. [Google Scholar] [CrossRef]
  93. Moriasi, D.N.; Arnold, J.G.; Van Liew, M.W.; Bingner, R.L.; Harmel, R.D.; Veith, T.L. Model evaluation guidelines for systematic quantification of accuracy in watershed simulations. Am. Soc. Agric. Biol. Eng. 2007, 50, 885–900. Available online: http://citeseerx.ist.psu.edu/viewdoc/download?doi=10.1.1.532.2506&rep=rep1&type=pdf (accessed on 14 February 2020).
  94. Muleta, M.K. Model performance sensitivity to objective function during automated Calibrations. J. Hydrol. Eng. 2012, 17, 756–767. [Google Scholar] [CrossRef]
  95. Bechle, A.J.; Wu, C.H. An entropy-based surface velocity method for estuarine discharge measurement. Water Resour. Res. 2014, 50, 6106–6128. [Google Scholar] [CrossRef]
  96. Plant, W.J.; Keller, W.C. Evidence of Bragg scattering in microwave Doppler spectra of sea return. J. Geophys. Res. 1990, 95, 16299–16310. [Google Scholar] [CrossRef]
  97. Plant, W.J. Bragg Scattering of Electromagnetic Waves from The air/sea Interface, in Surface Waves and Fluxes: Current Theory and Remote Sensing; Geernaert, G.L., Plant, W.J., Eds.; Kluwer: Dordrecht, The Netherlands, 1990; Volume 2, p. 336. [Google Scholar]
  98. Wright, J.W. A new model for sea clutter. IEEE Trans. Antennas Propag. 1968, AP-16, 217–223. [Google Scholar] [CrossRef]
  99. Plant, W.J.; Wright, J.W. Phase speeds of upwind and downwind traveling short gravity waves. J. Geophys. Res. 1980, 85, 3304–3310. [Google Scholar] [CrossRef]
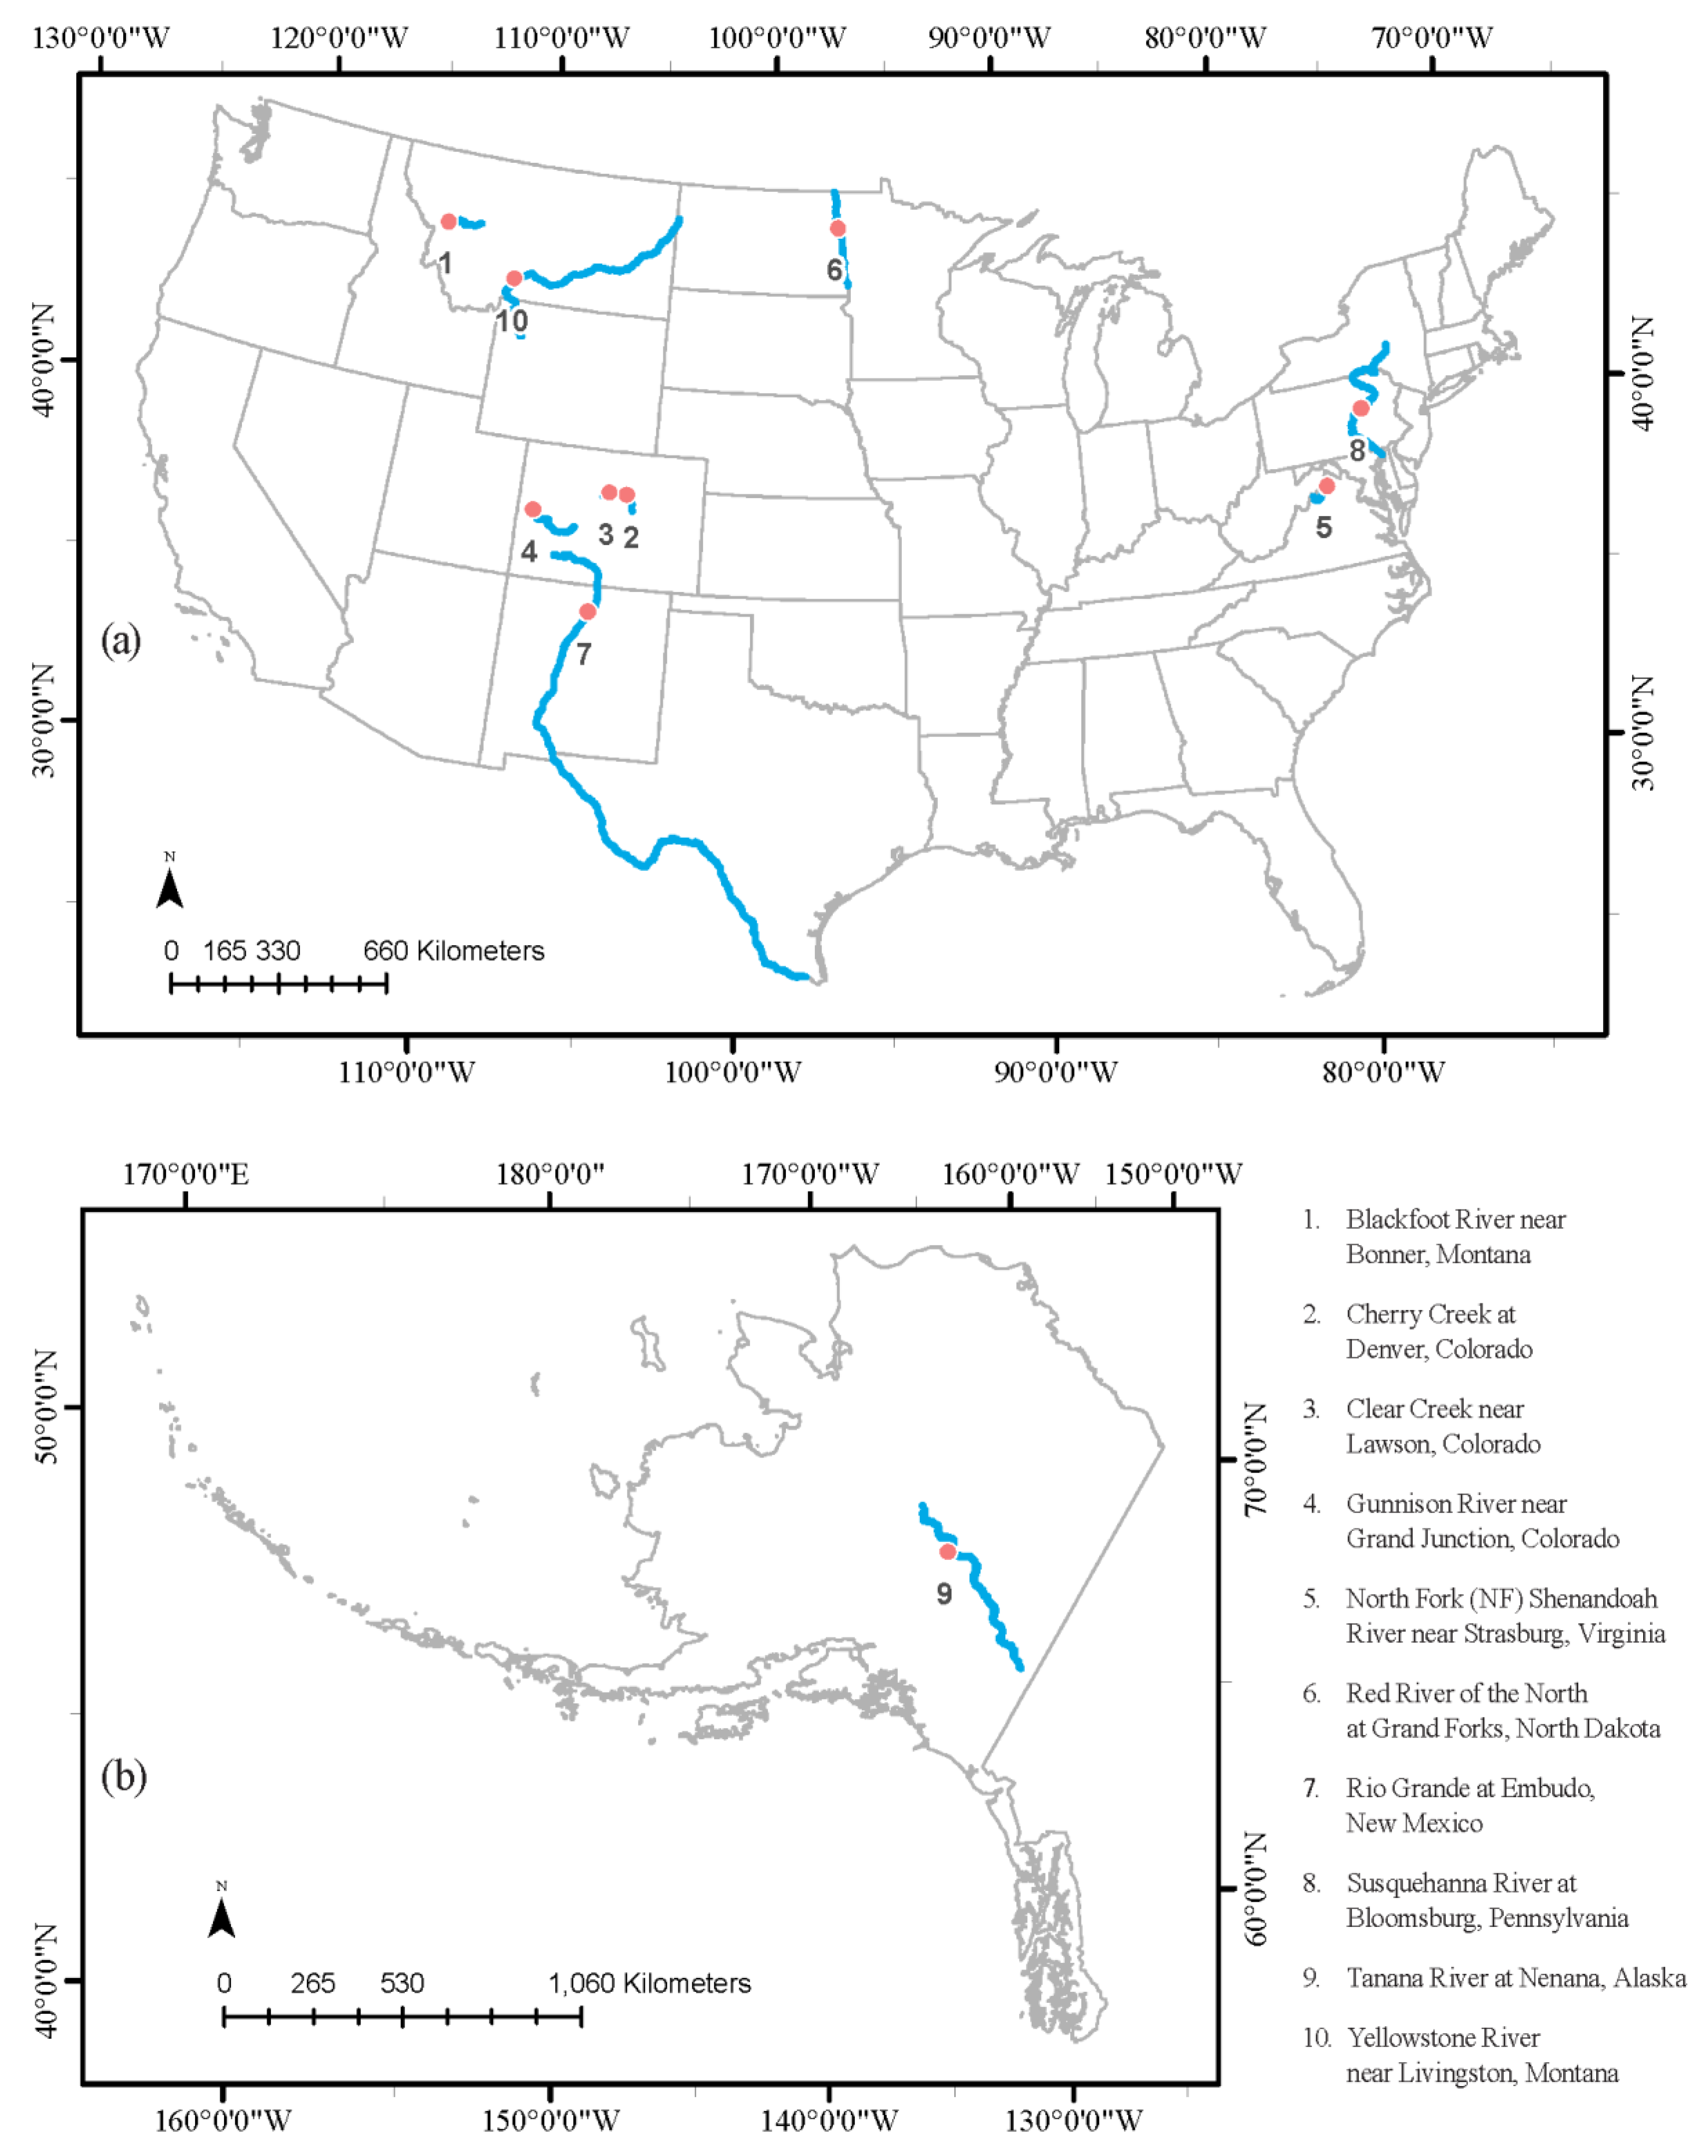
Figure 1. Map illustrating the 10 velocity and stage radars deployed by the U.S. Geological Survey (USGS) in the (a) conterminous United States and (b) Alaska. Each was collocated with an existing USGS streamgage. The blue line represents the river reach, and the red dots represent the radar gage and USGS streamgage location.
Remotesensing 12 01296 g001
Figure 2. Location of the y-axis and maximum velocity and maximum surface velocity in a channel cross section defined by the x-h orthogonal coordinate system [66], when (a) h0 and (b) h30. (y = incremental distance from the channel bottom to water surface; D = total distance from the channel bottom to the water surface at the y-axis; y-axis = the vertical in a cross section that contains the maximum velocity; h = distance from the water surface to the maximum velocity, umax; h = orthogonal trajectory of x; x = dimensionless coordinate related to velocity and h; ξ0 is the value of ξ in the point (or points) where the velocity u = 0; Bi = top-half width of channel).
Remotesensing 12 01296 g002
Figure 3. Photographs of typical radar deployments from (a) bridge along Clear Creek near Lawson, Colorado, and (b) cable stays in Waldo Canyon, Colorado, USA.
Remotesensing 12 01296 g003
Figure 4. Typical velocity distribution profile measured using an acoustic Doppler current profiler (ADCP) in July 2018 for the Tanana River at Nenana, Alaska, USA. The dots represent the mean velocities derived from the binned ADCP velocities recorded during the stationary bed test at the y-axis, the red line represents the nonlinear curve fit based on Equation (6), and the gray lines represent the 95% confidence interval.
Remotesensing 12 01296 g004
Figure 5. Line of agreement of conventional mean velocity (mechanical current meters or hydroacoustics) versus radar-derived mean velocity for 10 velocity and stage radars deployed by the U.S. Geological Survey (USGS) and collocated with USGS streamgages in the United States.
Remotesensing 12 01296 g005
Figure 6. Historical pairs of mean (umean) and maximum (umax) velocities obtained during site visits at (a) Cherry Creek at Denver, Colorado, (b) Clear Creek at Lawson, Colorado, (c) Susquehanna River at Bloomsburg, Pennsylvania, and (d) Tanana River at Nenana, Alaska, where velocity radars were deployed by the U.S. Geological Survey (USGS) and collocated with USGS streamgages in the United States. (R2 = correlation coefficient, dim; m/s, meters per second; y = mean velocity = umean, in m/s; x = maximum velocity = umax, m/s; 0.6896, 0.5752, 0.8114, 0.7639 = slope = ϕ = umean/umax).
Remotesensing 12 01296 g006
Figure 7. Conventionally measured discharge versus radar-derived discharge for 10 velocity and stage radars deployed by the U.S. Geological Survey (USGS) and collocated with USGS streamgages in the United States. These data were collected during siting and validation visits (m3/s = cubic meters per second).
Remotesensing 12 01296 g007
Figure 8. Continuous time series (a,c,e,g) and scatter plots (b,d,f,h) of radar-derived discharge and stage-discharge (conventional discharge) recorded concurrently during the operational period for (a,b) Cherry Creek at Denver, Colorado, (c,d) Rio Grande at Embudo, New Mexico, (e,f) Tanana River at Nenana, Alaska, and (g,h) Gunnison River near Grand Junction, Colorado. The velocity radars were deployed by the U.S. Geological Survey and collocated with existing USGS streamgages in the United States. (yellow line = radar-derived discharge; blue line = stage-discharge; red line = line of agreement; black dots = radar-derived and conventional discharges).
Remotesensing 12 01296 g008
Figure 9. Time series of radar-derived discharge, without wind-drift correction (orange line), with wind-drift correction (blue line) relative to stage-discharge (red line) and confirmation measurements (black dots) and wind speed (purple line) recorded concurrently during the operational period for the Red River of the North at Grand Forks, North Dakota.
Remotesensing 12 01296 g009
Table 1. U.S. Geological Survey (USGS) streamgages with radar gages used in this study in the United States. Note: Streamgage identification numbers will be omitted from subsequent tables. (DA = basin drainage area; km2 = square kilometers; mtn = mountain).
USGS StreamgageUSGS Streamgage Identification NumberSettingDA
(km2)
Radar Deployment Period
Start End Duration (Months)
Blackfoot River near Bonner, Montana12340000High-gradient
mtn stream
5930May 2013Aug 20134
Cherry Creek at Denver, Colorado06713500Urban1060Aug 2017Apr 201919
Clear Creek near Lawson, Colorado06716500High-gradient
mtn stream
381Apr 2019Sep 20196
Gunnison River near Grand Junction, Colorado09152500Mixed20,500Aug 2018Aug 201912
NF Shenandoah River near Strasburg, Virginia01634000Mixed1990Feb 2015Jan 201611
Red River of the North at Grand Forks, North Dakota05082500Agricultural66,100Apr 2013May 2013< 1
Rio Grande at Embed, New Mexico08279500Desert19,300Apr 2014Sep 201517
Susquehanna River at Bloomsburg, Pennsylvania01538700Mixed27,400Apr 2011May 2011< 1
Tanana River at Nenana, Alaska15515500Forest66,200May 2018Oct 201918
Yellowstone River near Livingston, Montanan06192500High-gradient
mtn stream
9200May 2013Aug 20134
Table 2. Minimum and maximum river top widths and hydraulic depths measured during radar gage deployments in the United States based on periodic measurements with conventional methods. (m = meters; min = minimum; max = maximum).
USGS StreamgageNumber
of Visits
Top Width (m)Hydraulic Depth (m)
minmaxminmax
Blackfoot River near Bonner, Montana244580.522.1
Cherry Creek at Denver, Colorado67.3130.190.82
Clear Creek near Lawson, Colorado87.0190.340.88
Gunnison River near Grand Junction, Colorado149850.092.9
NF Shenandoah River near Strasburg, Virginia156670.401.9
Red River of the North at Grand Forks, North Dakota2871605.57.0
Rio Grande at Embed, New Mexico220370.610.85
Susquehanna River at Bloomsburg, Pennsylvania63203402.75.2
Tanana River at Nenana, Alaska7383801.33.7
Yellowstone River near Livingston, Montana1401040.981.9
Table 3. Minimum, median, and maximum stage-discharge measured during the operational phase of the radar gage deployments. Streamflow exceedance represents the magnitude of the peak streamflow measured while the radar was deployed. Streamflow exceedances were calculated as the percentage of the daily streamflow recorded at a continuous USGS streamgage during the radar deployment relative to the maximum discharge recorded for the historical period of record. (m3/s = cubic meters per second; min = minimum; med = median; max = maximum).
USGS StreamgageStage-Discharge (m3/s)Streamflow
Exceedance
minmedmax% exceeded
Blackfoot River near Bonner, Montana17.852.61685.10
Cherry Creek at Denver, Colorado0.120.7941.60.00
Clear Creek near Lawson, Colorado1.196.4132.10.48
Gunnison River near Grand Junction, Colorado13.232.44860.67
NF Shenandoah River near Strasburg, Virginia2.1011.21900.46
Red River of the North at Grand Forks, North Dakota3088751,2400.40
Rio Grande at Embudo, New Mexico7.6517.11173.00
Susquehanna River at Bloomsburg, Pennsylvania1,2501,9704,9500.00
Tanana River at Nenana, Alaska4521,4102,8500.48
Yellowstone River near Livingston, Montana57.178.11135.40
Table 4. Probability-concept-based and conventional-based metrics and velocities measured during the siting phase at 10 U.S. Geological Survey streamgages in the United States. (PC = probability concept; Conv = Conventional; M = parameter characterizing the velocity distribution and is dimensionless, dim; ϕ = a function of M equal to the ratio of the mean velocity to the maximum velocity; uD = surface velocity in meters per second, m/s; umax = maximum velocity; y-axis = vertical depth in a cross section that contains the maximum velocity in meters, m; umean = mean velocity = ϕ × umax or stage-discharge/area;% error = percent error = (PC discharge – Conventional Discharge)/Conventional Discharge × 100; na = data not available).
USGS StreamgageDate
Collected
PC MetricsPC Conv%
error in umean
M
(dim)
ϕ
(dim)
uD
(m/s)
umax
(m/s)
Water Depth at y-axis
(m)
umean
(m/s)
umean
(m/s)
Blackfoot River near Bonner, Montana05-20-20132.100.6642.702.702.571.791.781.1
Cherry Creek at Denver, Colorado08-25-20172.320.6780.750.750.260.510.501.2
Clear Creek near Lawson, Colorado04-19-20190.8830.573na1.090.430.620.612.3
Gunnison River near Grand Junction, Colorado03-27-20190.2660.5221.121.021.550.530.514.9
NF Shenandoah River near Strasburg, Virginia12-04-20141.030.5840.450.490.770.290.31−8.0
Red River of the North at Grand Forks, North Dakota02-05-20040.600.550na0.096.340.050.05−0.1
Rio Grande at Embudo, New Mexico03-21-20141.490.6201.451.450.700.900.873.2
Susquehanna River at Bloomsburg, Pennsylvania06-27-20024.350.7830.730.731.830.570.59−4.0
Tanana River at Nenana, Alaska05-07-20152.980.7181.411.412.841.011.14−11
Yellowstone River near Livingston, Montana05-22-20132.920.7152.962.962.862.112.13−0.7
Average percent error−1.1
Absolute average percent error3.6
Table 5. Probability concept (PC)-based and stage-discharge measured during the siting phase of the velocity-radar installation at 10 USGS streamgages in the United States. (m3/s = cubic meters per second; ADCP = acoustic Doppler current profiler; FT = FlowTracker velocimeter;% error = percent error = (PC discharge – Conventional Discharge)/Conventional Discharge × 100).
USGS StreamgageDate CollectedMethodDischarge (m3/s)%
Error in
Discharge
PC Conventional
Blackfoot River near Bonner, Montana05-20-2013ADCP1441421.1
Cherry Creek at Denver, Colorado08-25-2017FT0.850.841.2
Clear Creek near Lawson, Colorado04-19-2019FT1.431.392.3
Gunnison River near Grand Junction, Colorado03-27-2019ADCP30.529.14.9
NF Shenandoah River near Strasburg, Virginia12-04-2014ADCP11.712.7−8.0
Red River of the North at Grand Forks, North Dakota02-05-2004ADCP12.612.6−0.1
Rio Grande at Embudo, New Mexico03-21-2014ADCP19.318.73.2
Susquehanna River at Bloomsburg, Pennsylvania06-27-2002AA292306−4.0
Tanana River at Nenana, Alaska05-07-2015ADCP615690−11
Yellowstone River near Livingston, Montana05-22-2013ADCP208209−0.7
Average percent error−1.1
Absolute average percent error3.6
Table 6. Radar-derived surface velocities recorded during the operational phase at 10 U.S. Geological Survey streamgages in the United States. (m/s = meters per second; min = minimum; med=median; max = maximum).
USGS StreamgageRadar-Derived Surface Velocity (m/s)
minmedMax
Blackfoot River near Bonner, Montana0.662.033.01
Cherry Creek at Denver, Colorado0.300.623.33
Clear Creek near Lawson, Colorado0.841.853.78
Gunnison River near Grand Junction, Colorado0.991.163.37
NF Shenandoah River near Strasburg, Virginia0.410.661.76
Red River of the North at Grand Forks, North Dakota0.551.191.78
Rio Grande at Embudo, New Mexico0.510.922.88
Susquehanna River at Bloomsburg, Pennsylvania0.641.622.53
Tanana River at Nenana, Alaska0.701.813.02
Yellowstone River near Livingston, Montana1.392.493.84
Table 7. Radar-derived discharge and stage-discharge recorded during the operational phase at 10 U.S. Geological Survey streamgages in the United States. (m3/s = cubic meters per second; min = minimum; med=median; max = maximum).
USGS StreamgageRadar-Derived Discharge (m3/s)Stage-Discharge (m3/s)
minmedmaxminmedmax
Blackfoot River near Bonner, Montana14.363.517717.852.6168
Cherry Creek at Denver, Colorado0.170.7338.60.120.7941.6
Clear Creek near Lawson, Colorado1.406.9838.21.196.4132.1
Gunnison River near Grand Junction, Colorado21.031.145013.232.4486
NF Shenandoah River near Strasburg, Virginia2.879.691672.1011.2190
Red River of the North at Grand Forks, North Dakota21391614703088751250
Rio Grande at Embudo, New Mexico5.7716.81387.6517.1117
Susquehanna River at Bloomsburg, Pennsylvania60317804890125019704950
Tanana River at Nenana, Alaska3811280264045214102850
Yellowstone River near Livingston, Montana53.371.910257.178.1113
Table 8. Goodness-of-fit statistics between operationally measured stage-discharge (Table 7) and radar-derived discharge based on the probability concept at 10 USGS streamgages in the United States. (n = number of samples; MAE = mean absolute error; PBIAS = percent bias, dimensionless; NSE = Nash-Sutcliffe Efficiency, dimensionless; logNSE = log-transformed Nash-Sutcliffe Efficiency, dimensionless; VE = Volumetric Efficiency, dimensionless; 1= number of samples were reduced from the complete discharge time series prior to the goodness-of-fit analysis to account for a split in streamflow caused by an island).
USGS streamgagenMAE
(m3/s)
PBIASNSE(log)
NSE
VE
Blackfoot River near Bonner, Montana74999.1213.50.950.880.86
Cherry Creek at Denver, Colorado151,1610.13−9.20.910.900.86
Clear Creek near Lawson, Colorado13,2221.91120.850.960.81
Gunnison River near Grand Junction, Colorado34,6287.85−8.60.980.990.90
NF Shenandoah River near Strasburg, Virginia29,5632.53−13.90.950.970.85
Red River of the North at Grand Forks, North Dakota1558122−3.00.710.700.86
Rio Grande at Embudo, New Mexico41,2191.13−2.90.970.970.94
Susquehanna River at Bloomsburg, Pennsylvania448286−10.60.790.610.87
Tanana River at Nenana, Alaska28,047247−10.60.590.600.82
Yellowstone River near Livingston, Montana3099 16.17−7.80.790.810.92