Case Study of a Retrieval Method of 3D Proxy Reflectivity from FY-4A Lightning Data and Its Impact on the Assimilation and Forecasting for Severe Rainfall Storms


Abstract
1. Introduction
2. Lightning Data Detected by FY-4A LMI
3. Retrieval Methods
3.1. Lightning Density
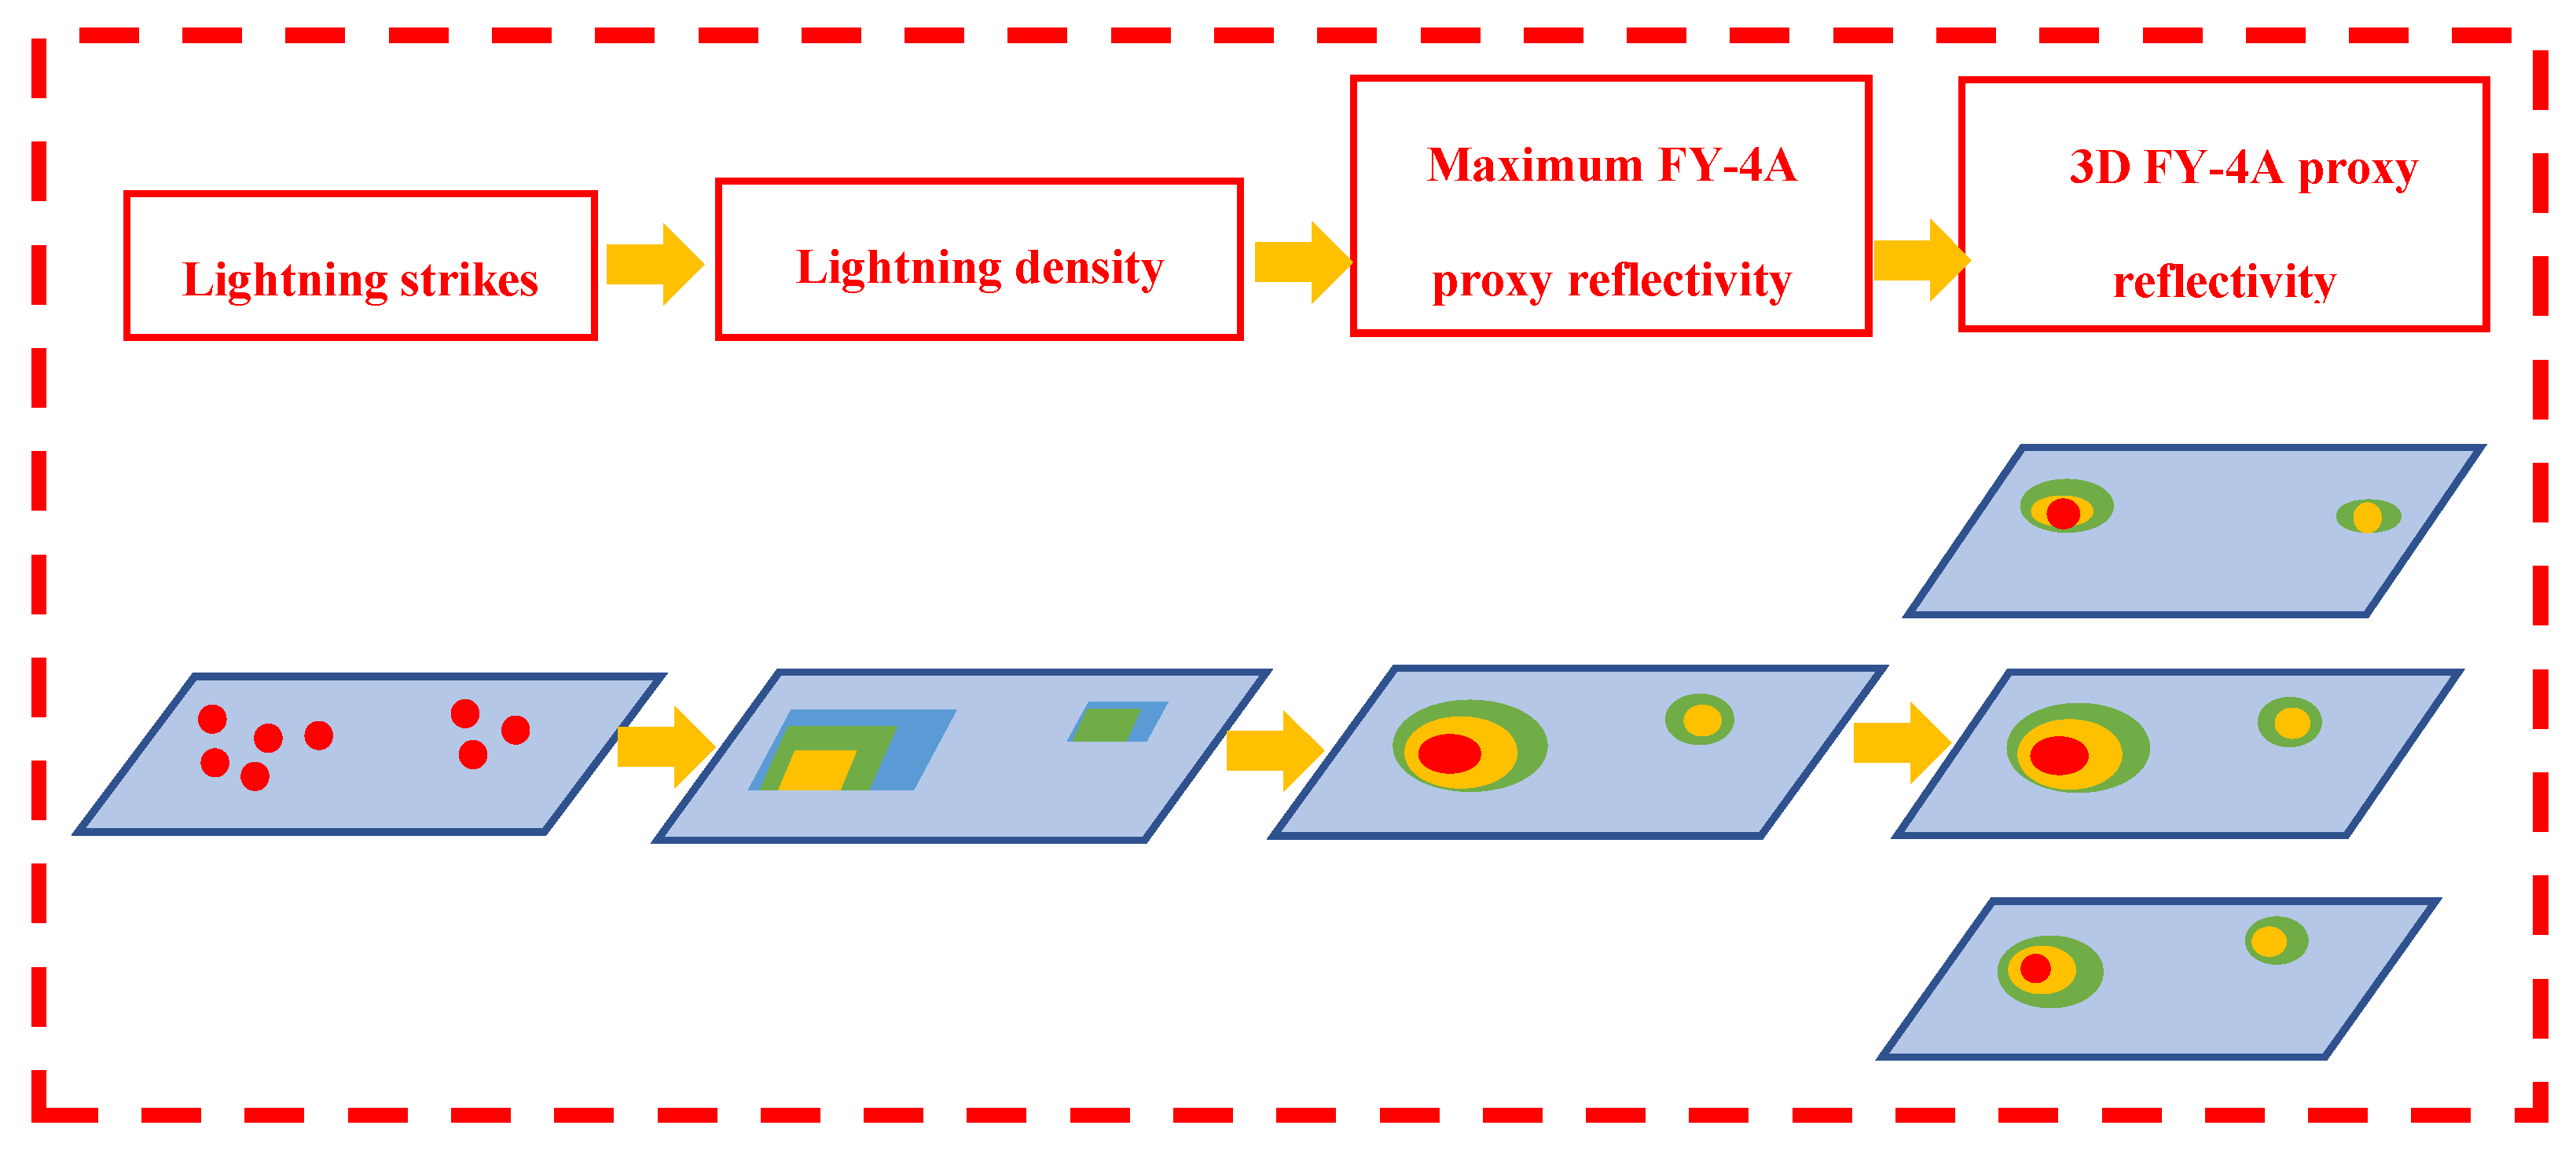
3.2. Proxy Radar Reflectivity Retrieval
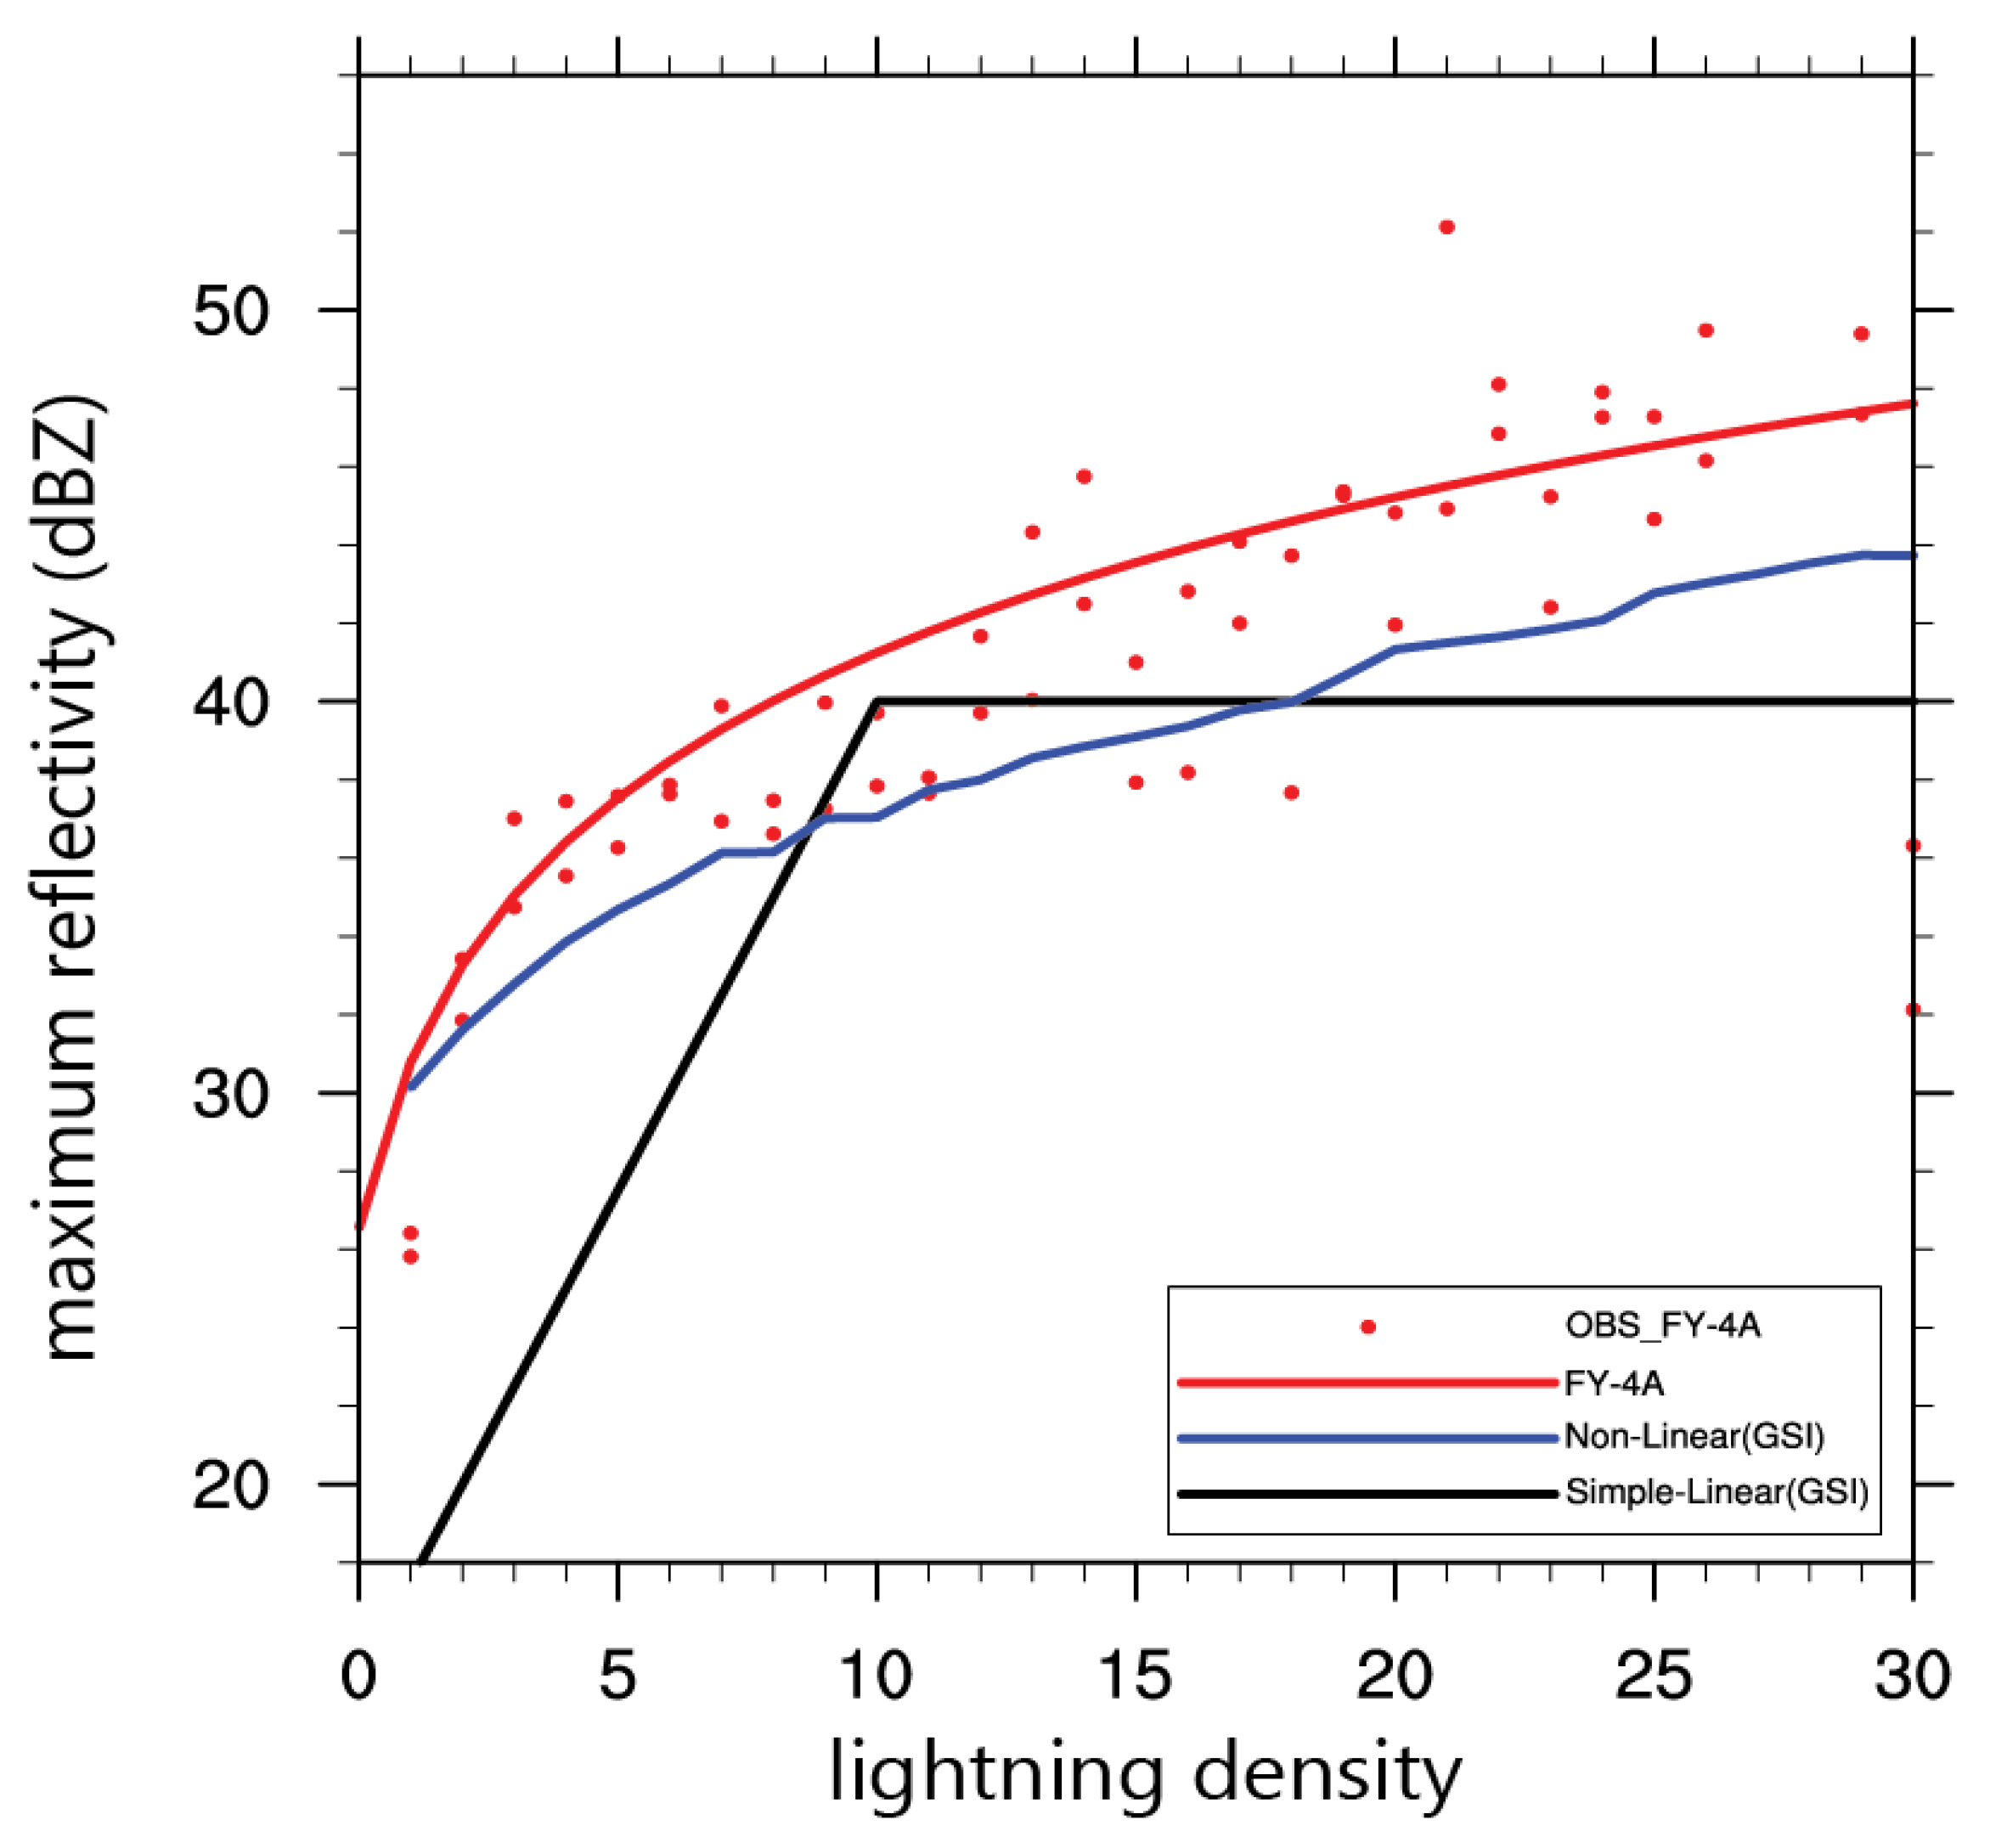
3.2.1. Proxy Maximum Radar Reflectivity
3.2.2. D FY-4A Proxy Reflectivity
4. Lighting Assimilation Experiments Compared with Radar Assimilation
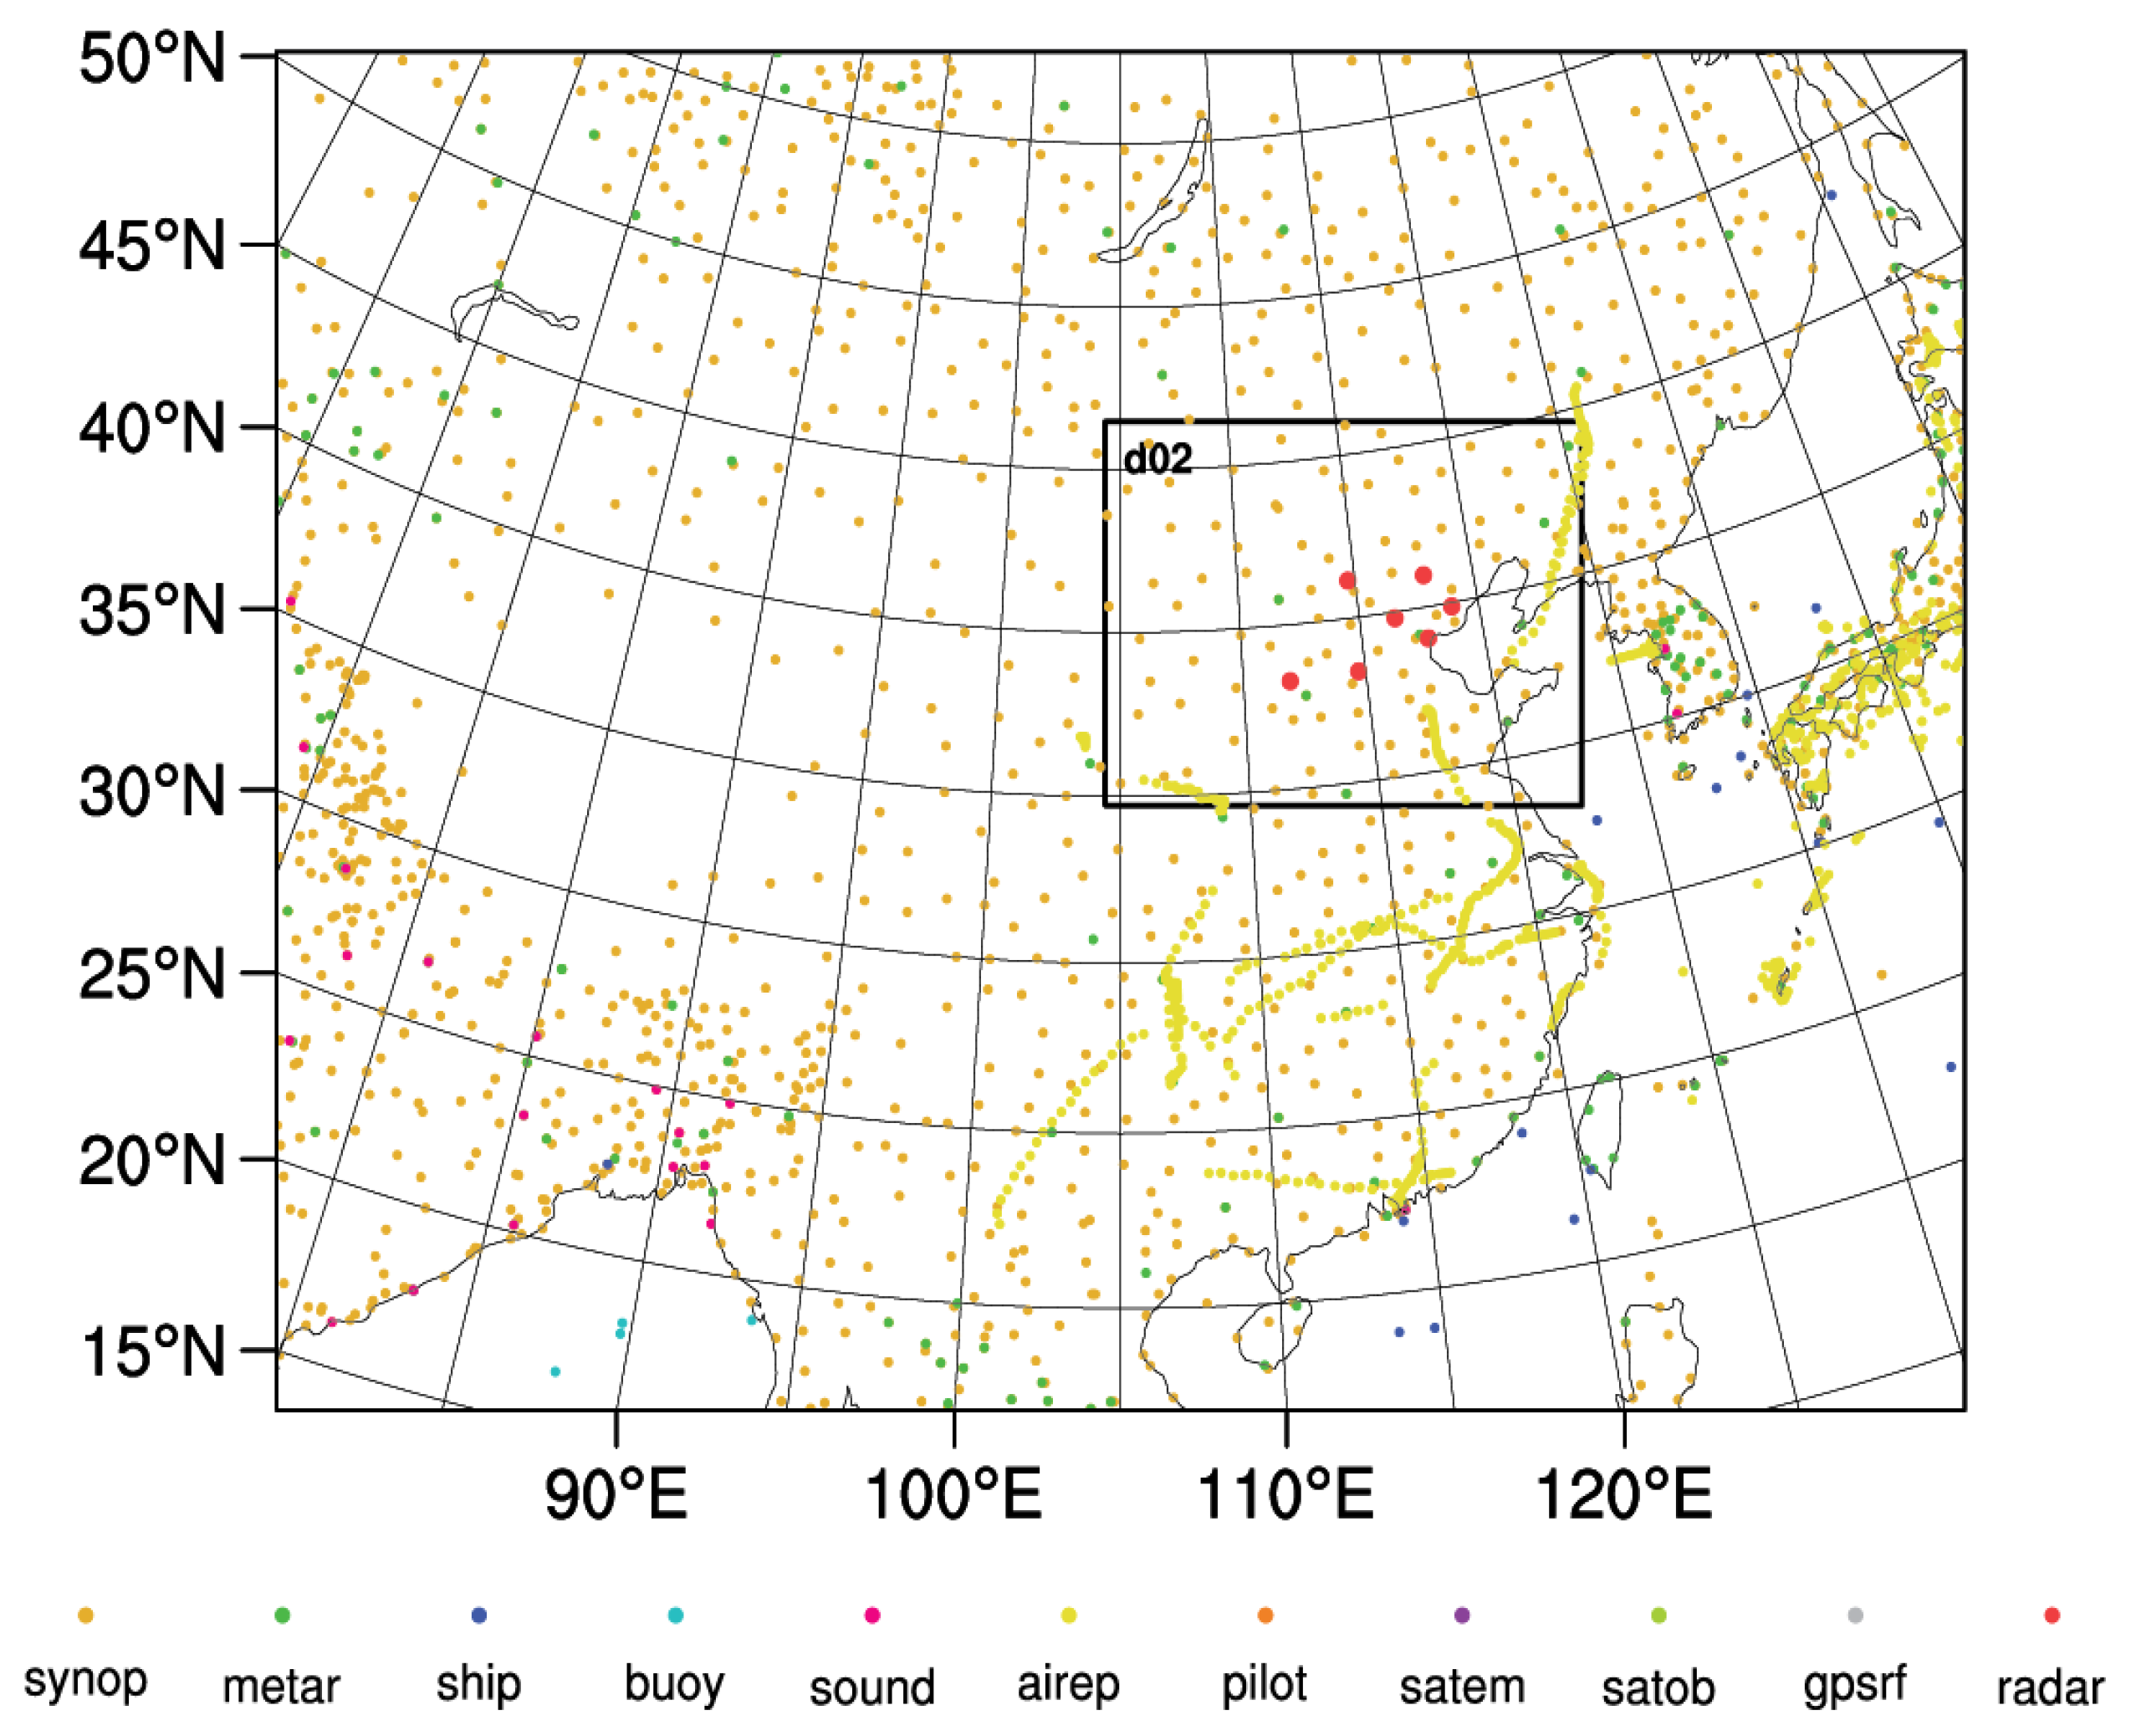
4.1. Experiments Set Up
4.2. The Rainfall Case
4.3. Results
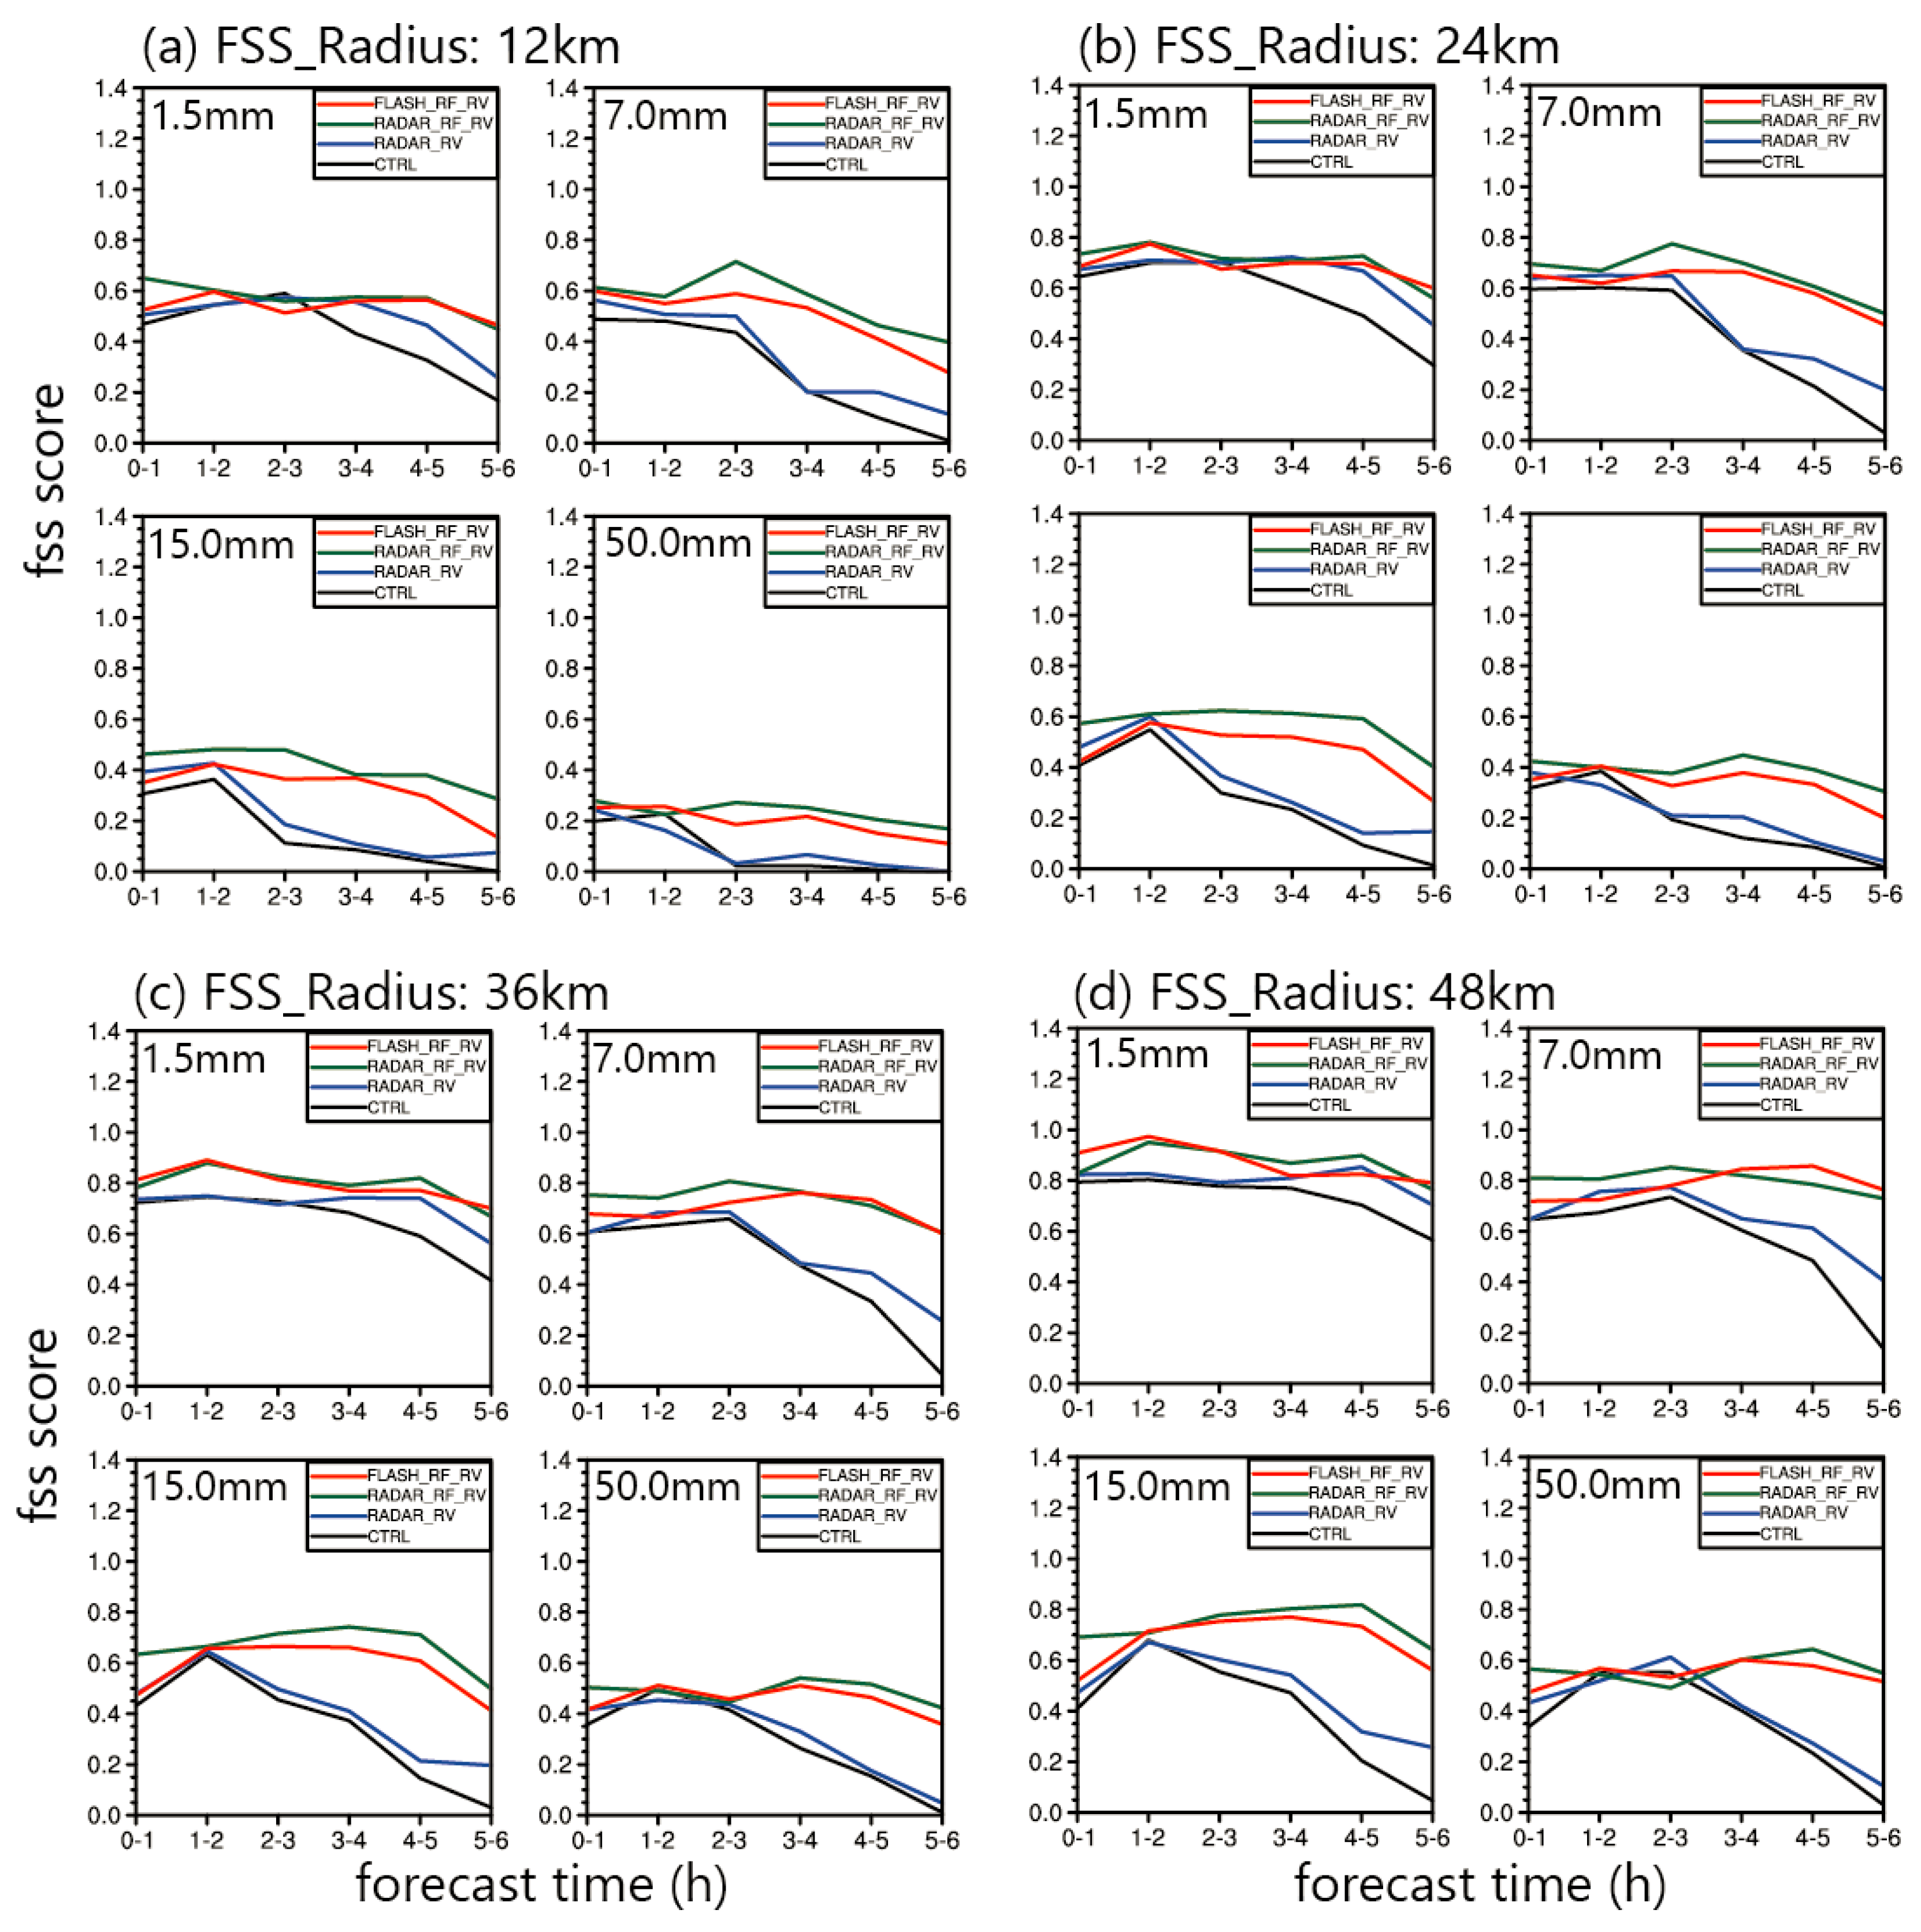
4.3.1. Rainfall Forecast Skill Scores
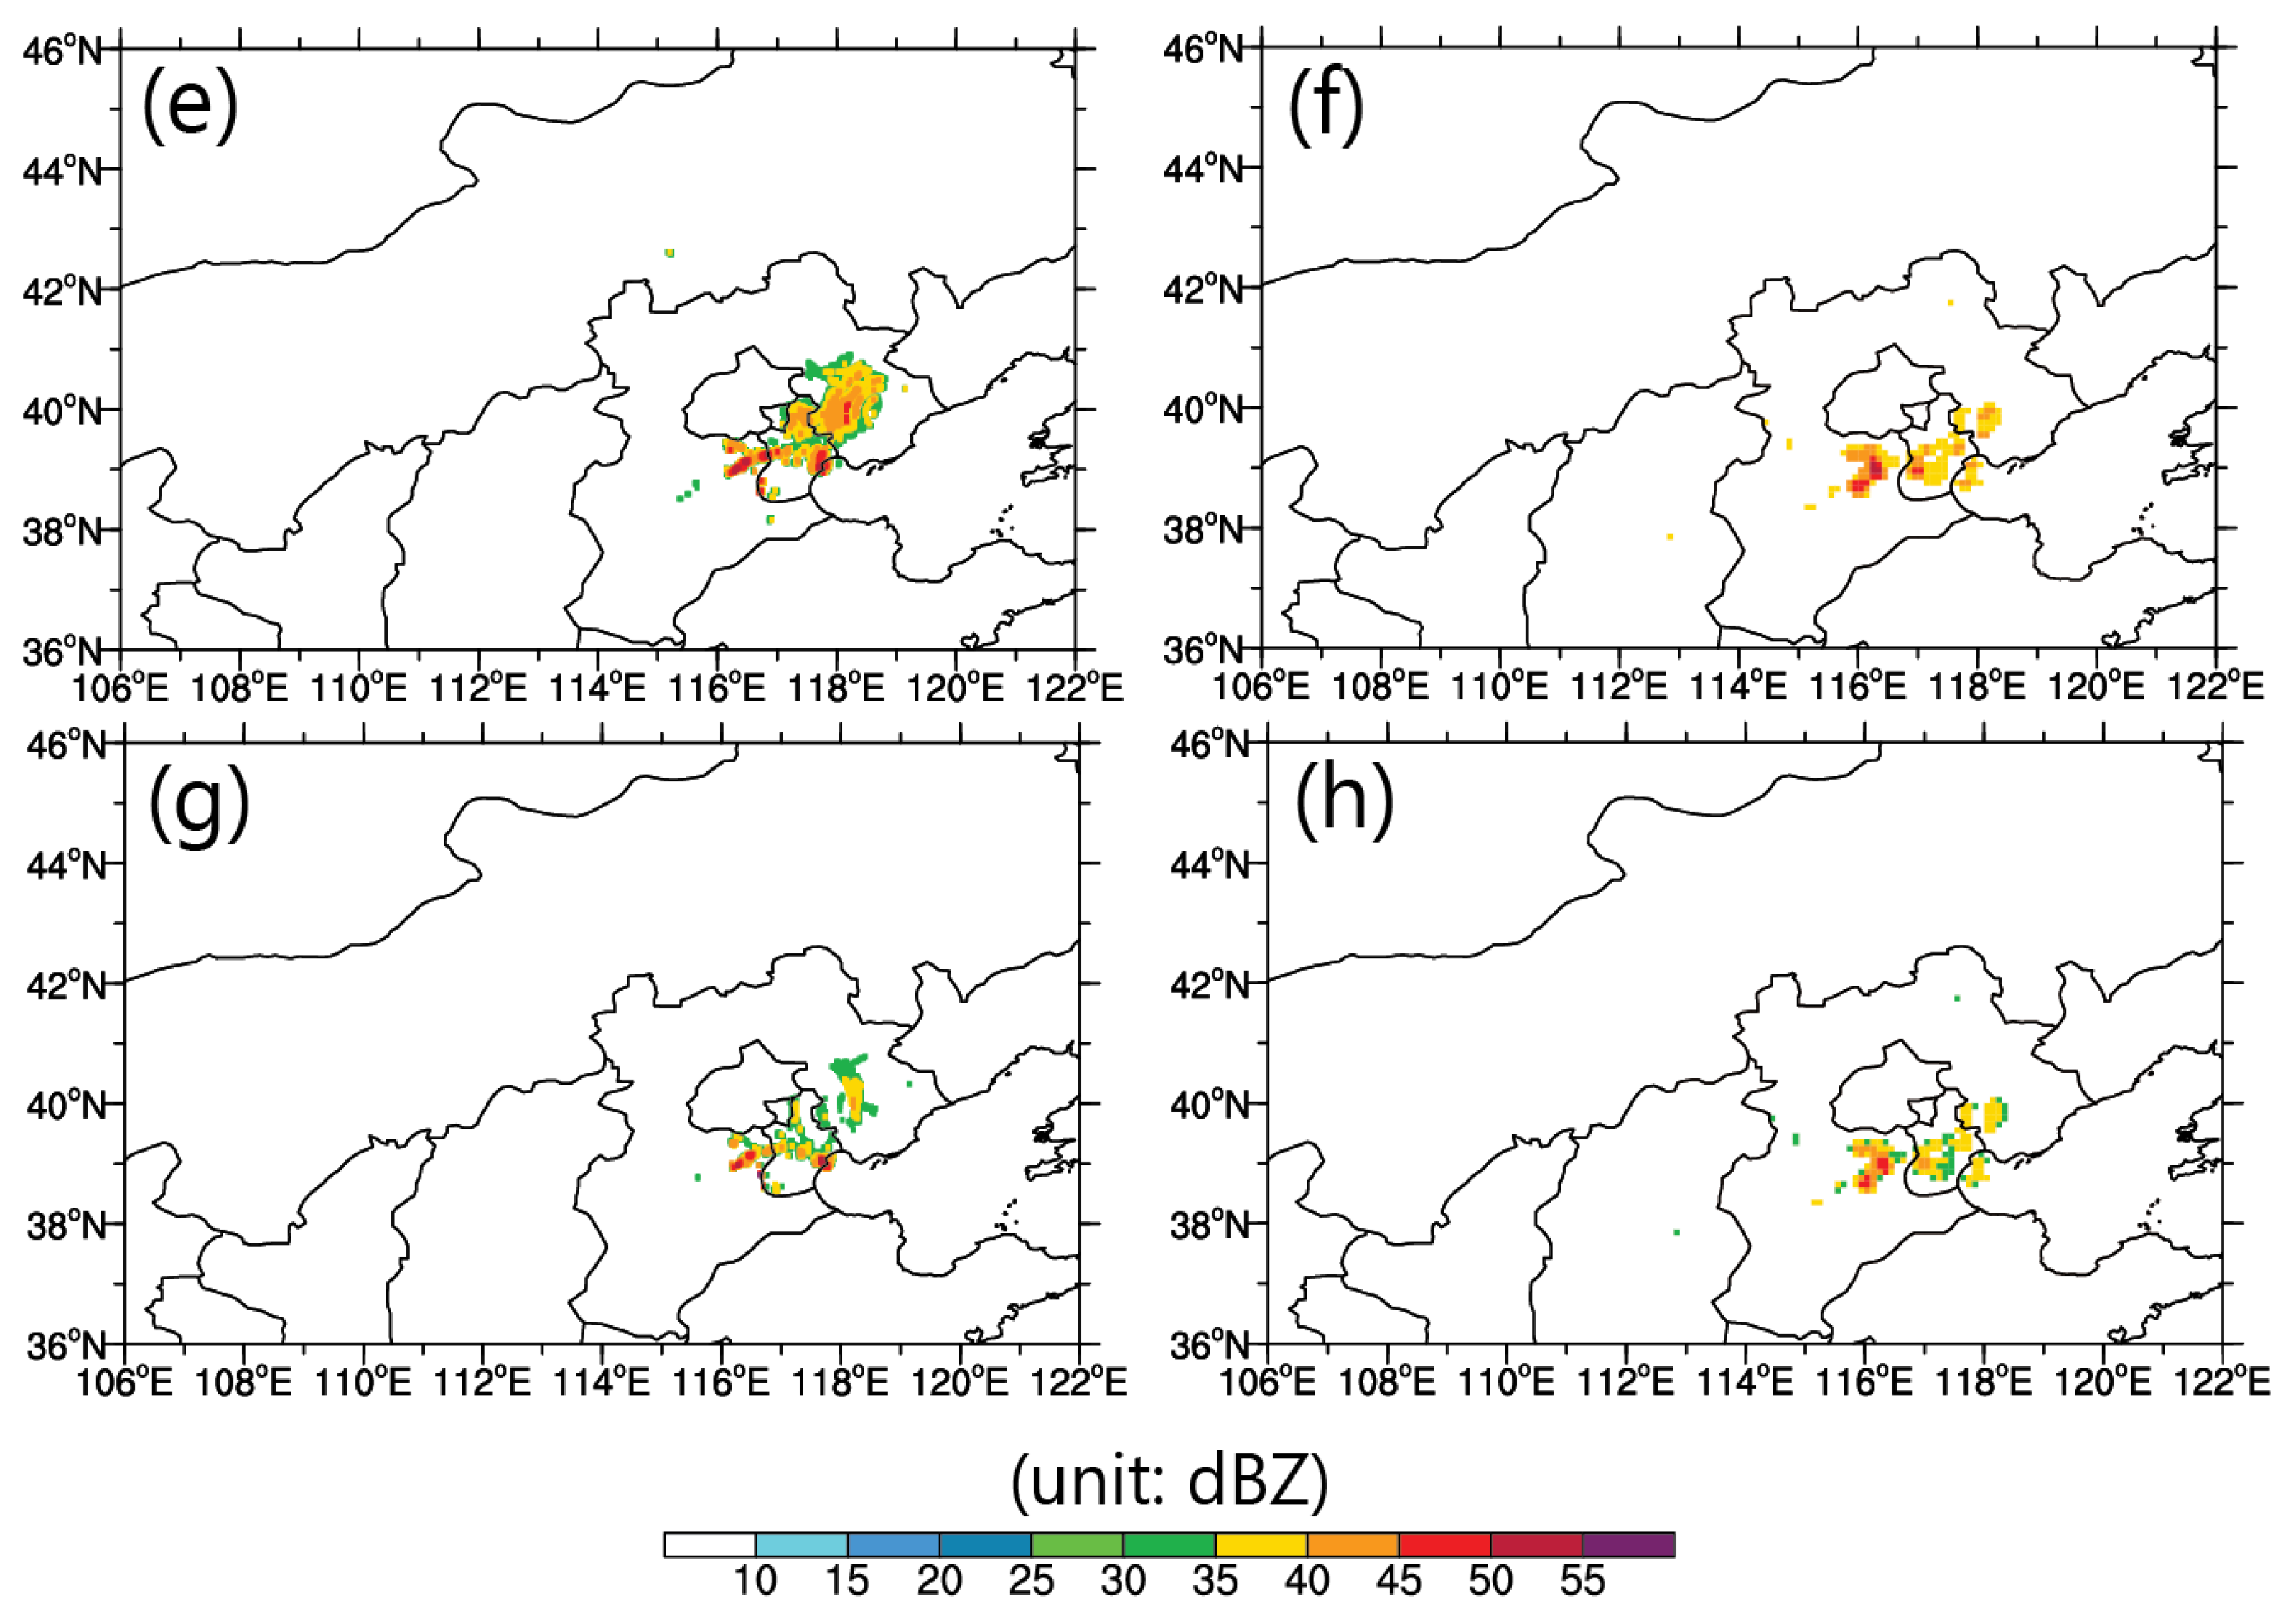
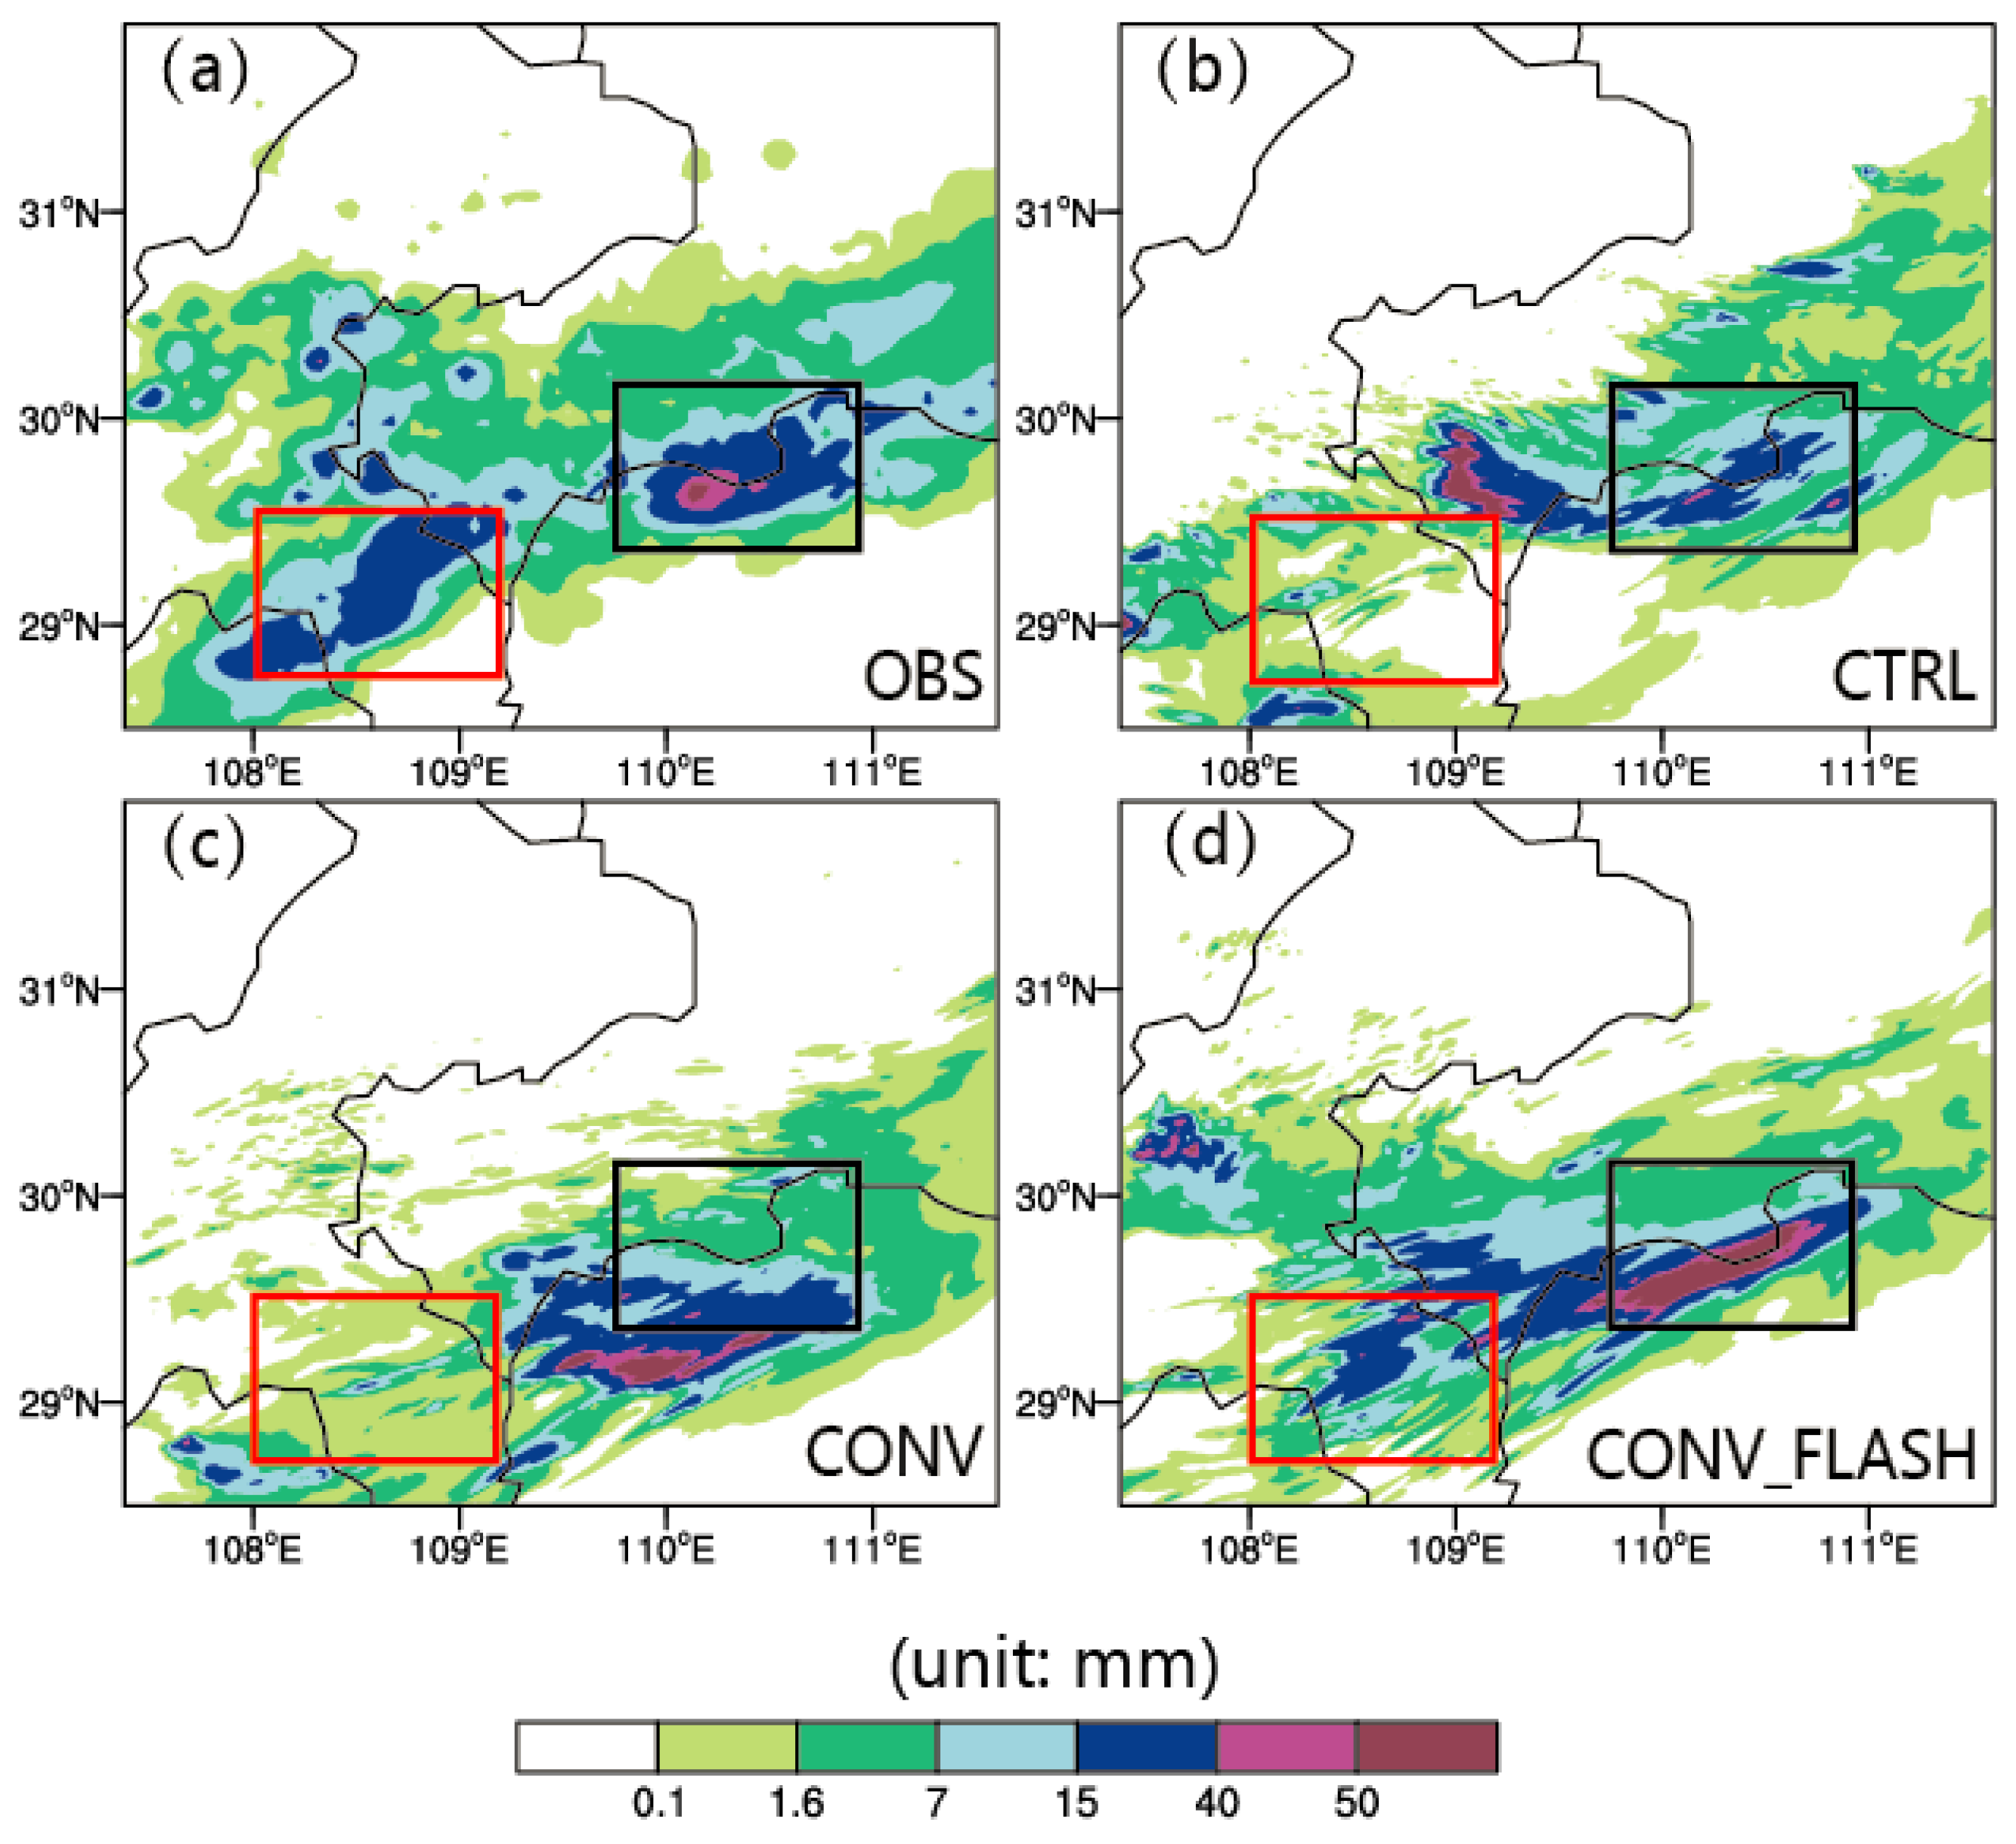
4.3.2. Precipitation Distribution
4.3.3. Analysis Increments of Hydrometers
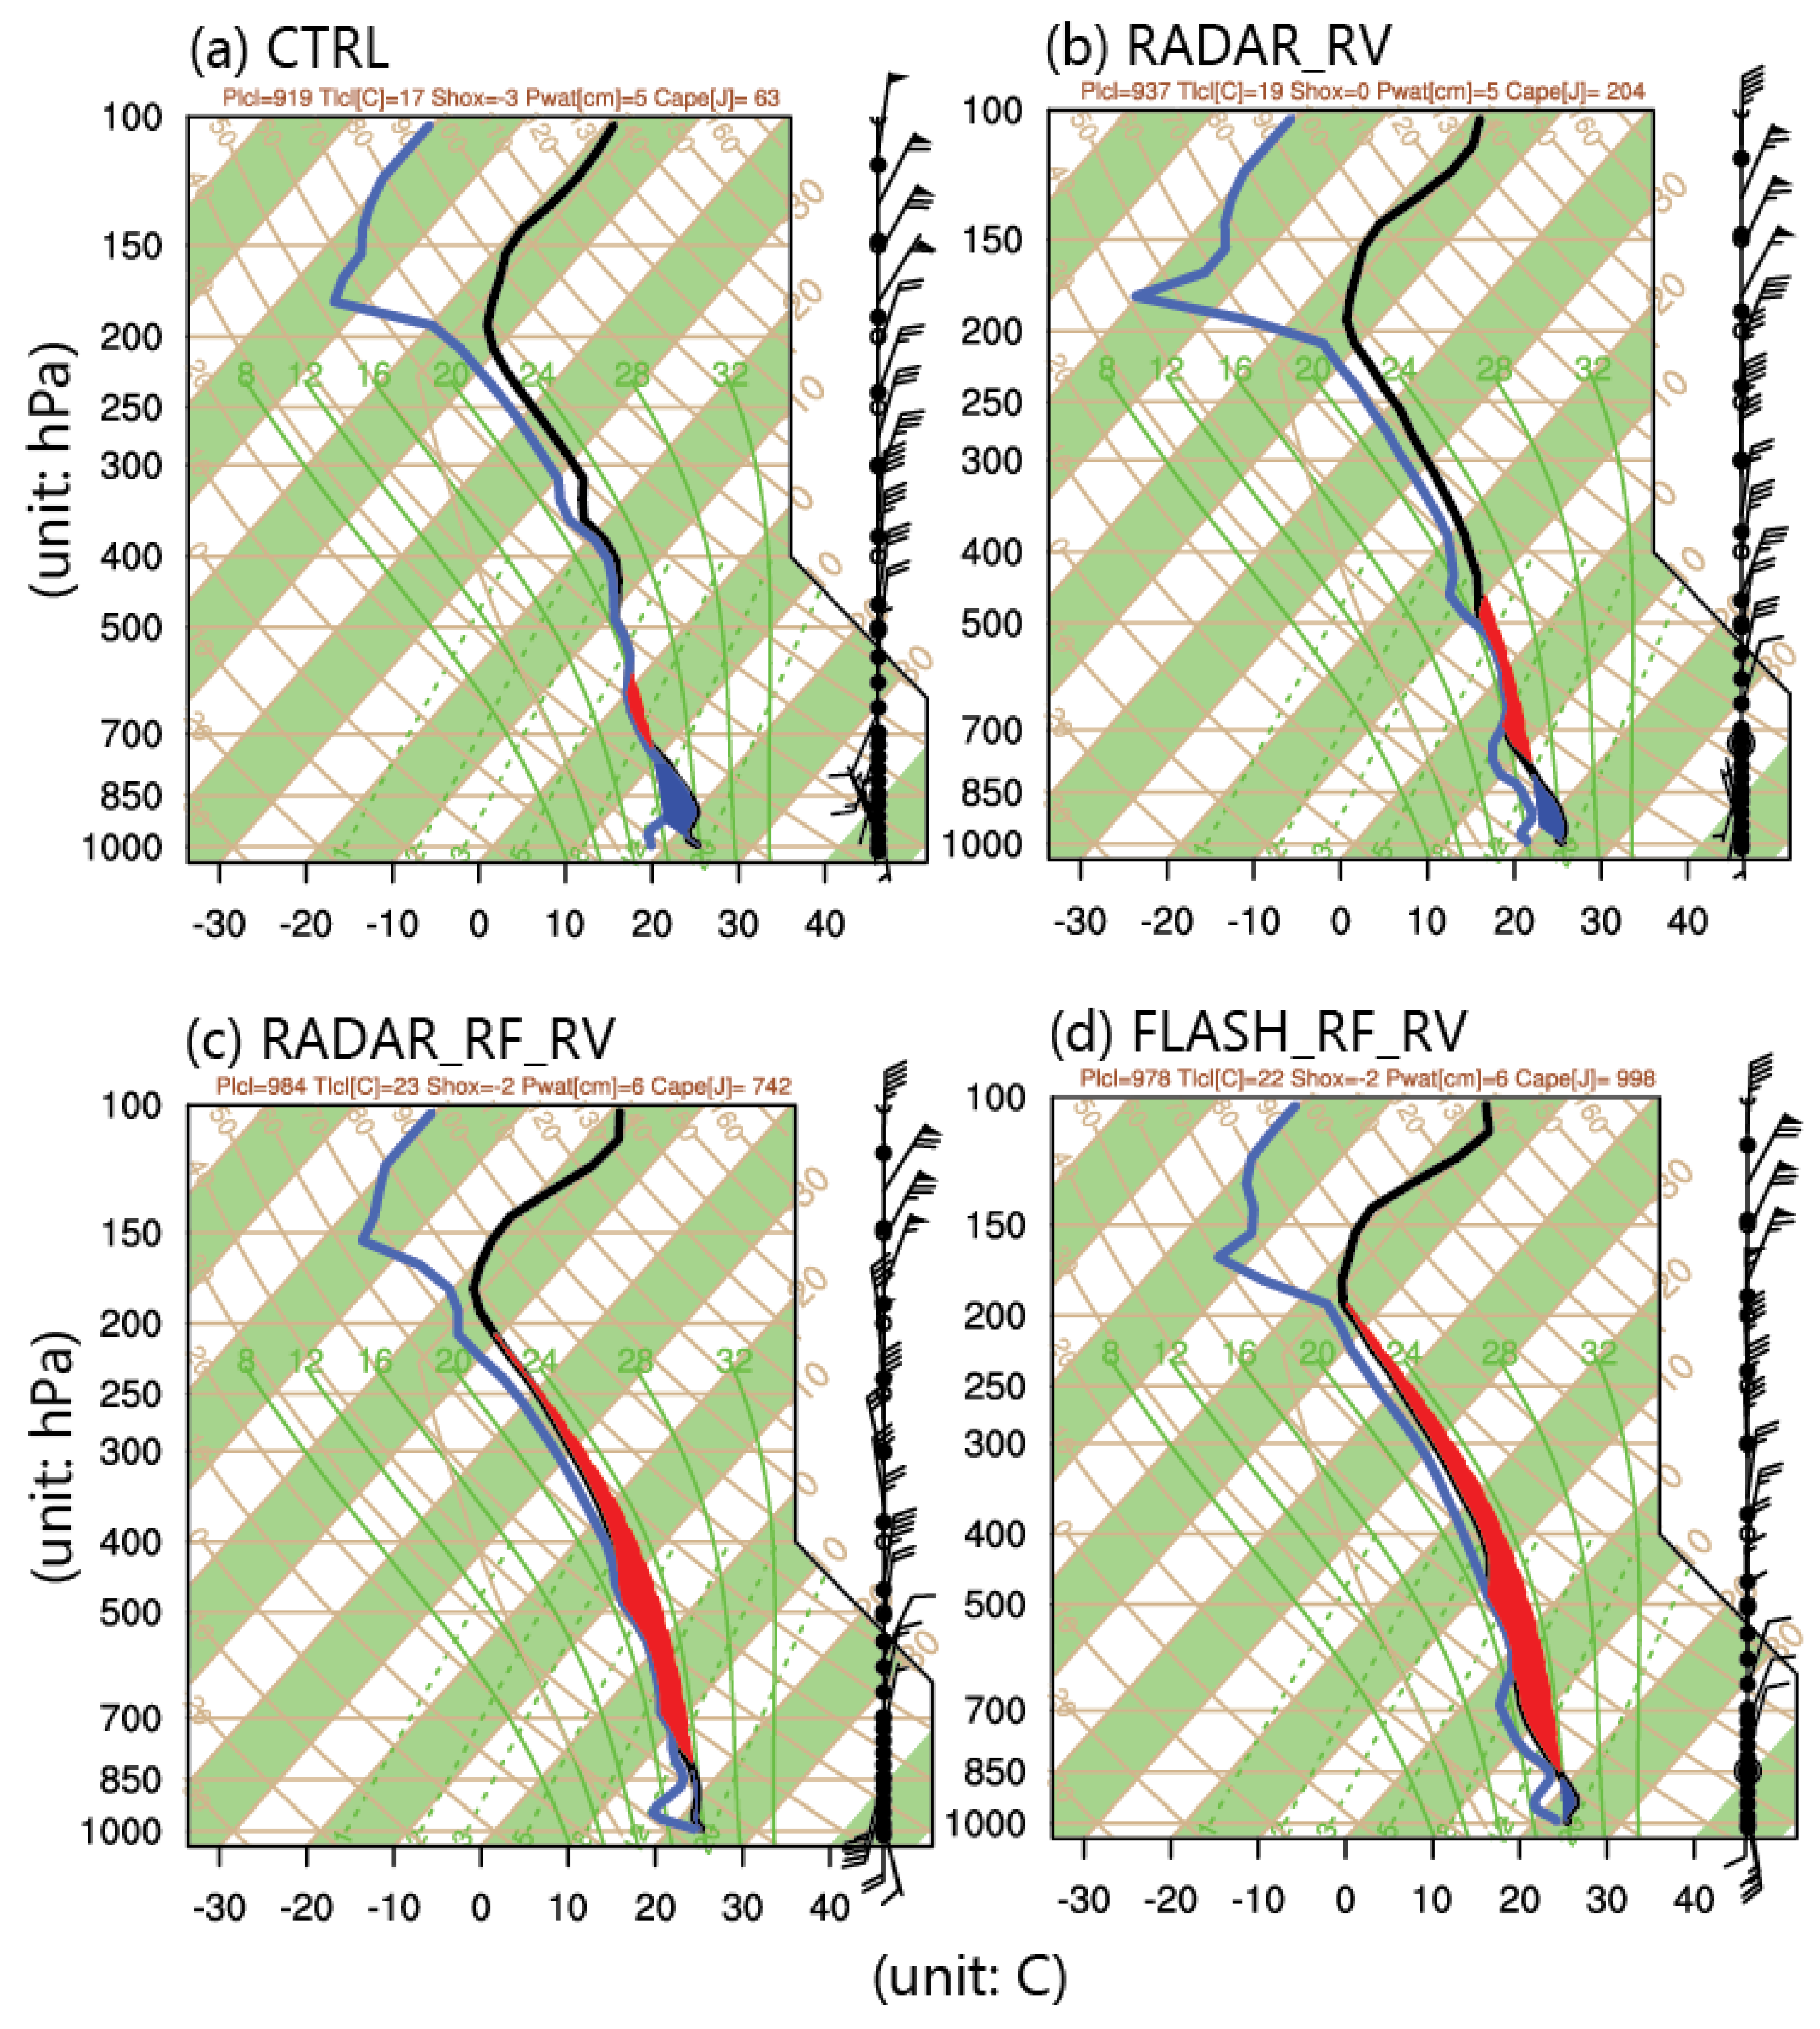
4.3.4. Convective Available Potential Energy
5. Lighting Assimilation Experiments in Mountainous Areas
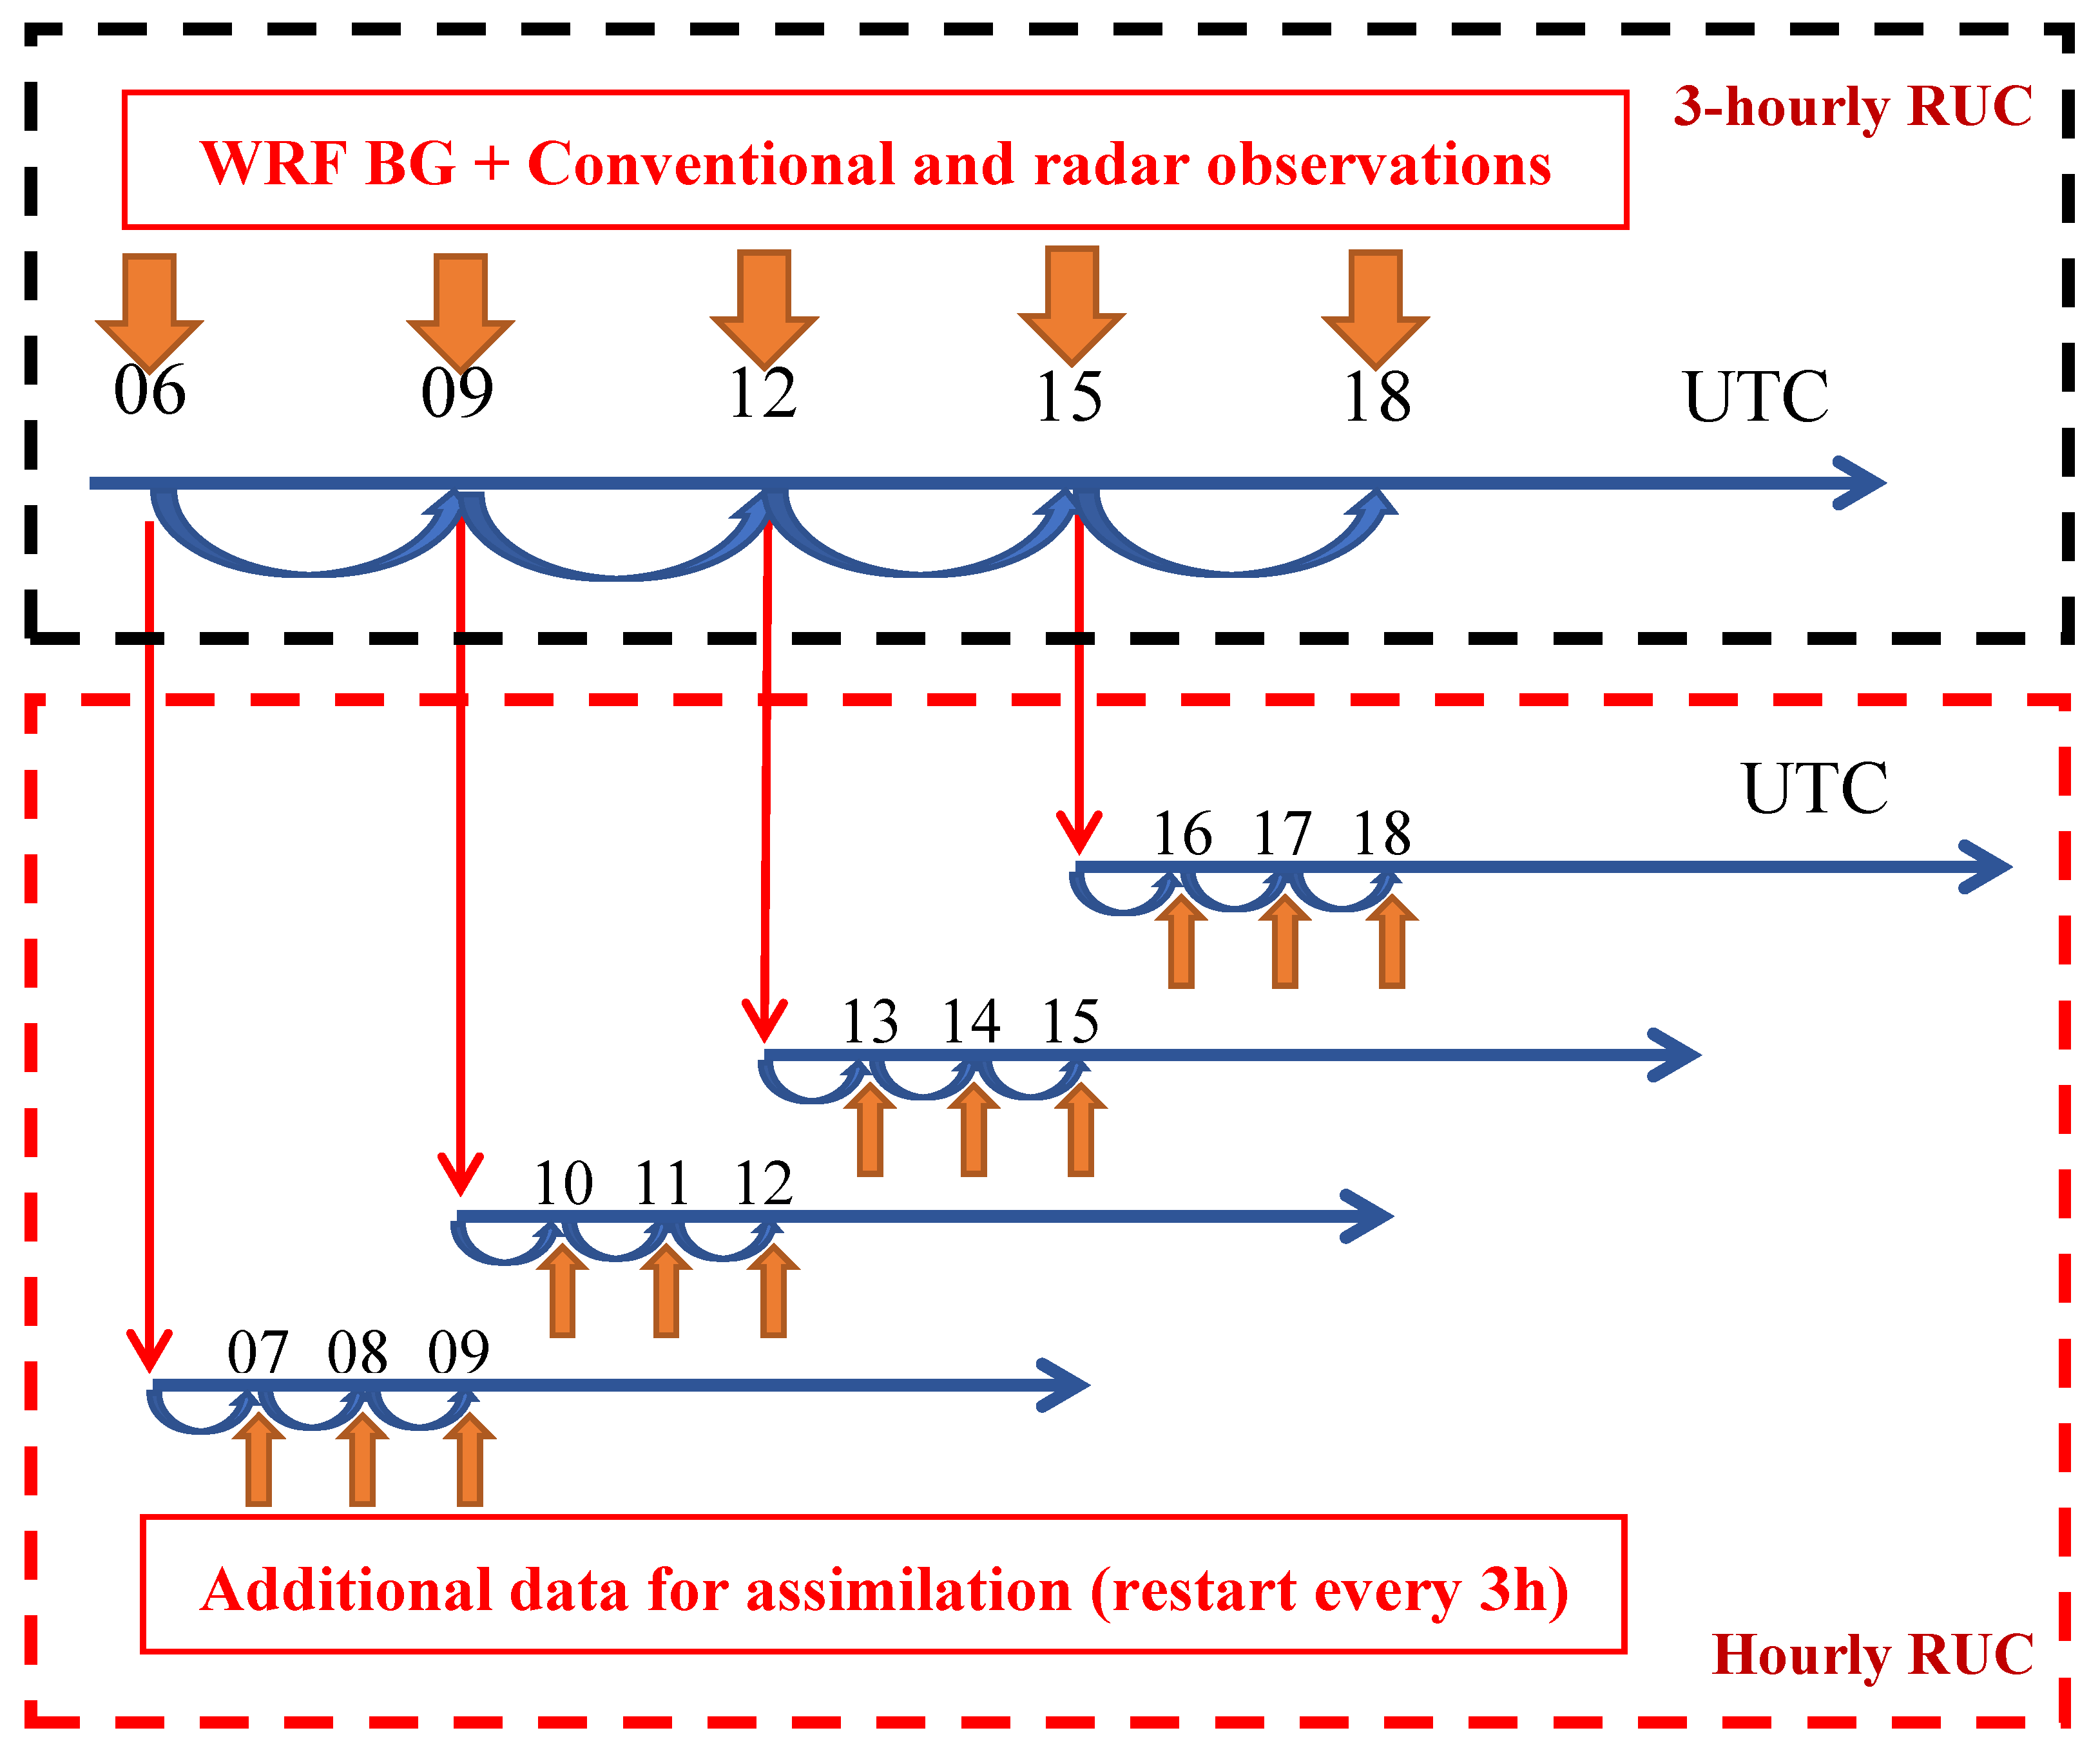
5.1. Experiments Set Up
5.2. The Rainfall Case in Mountainous Areas
5.3. Results
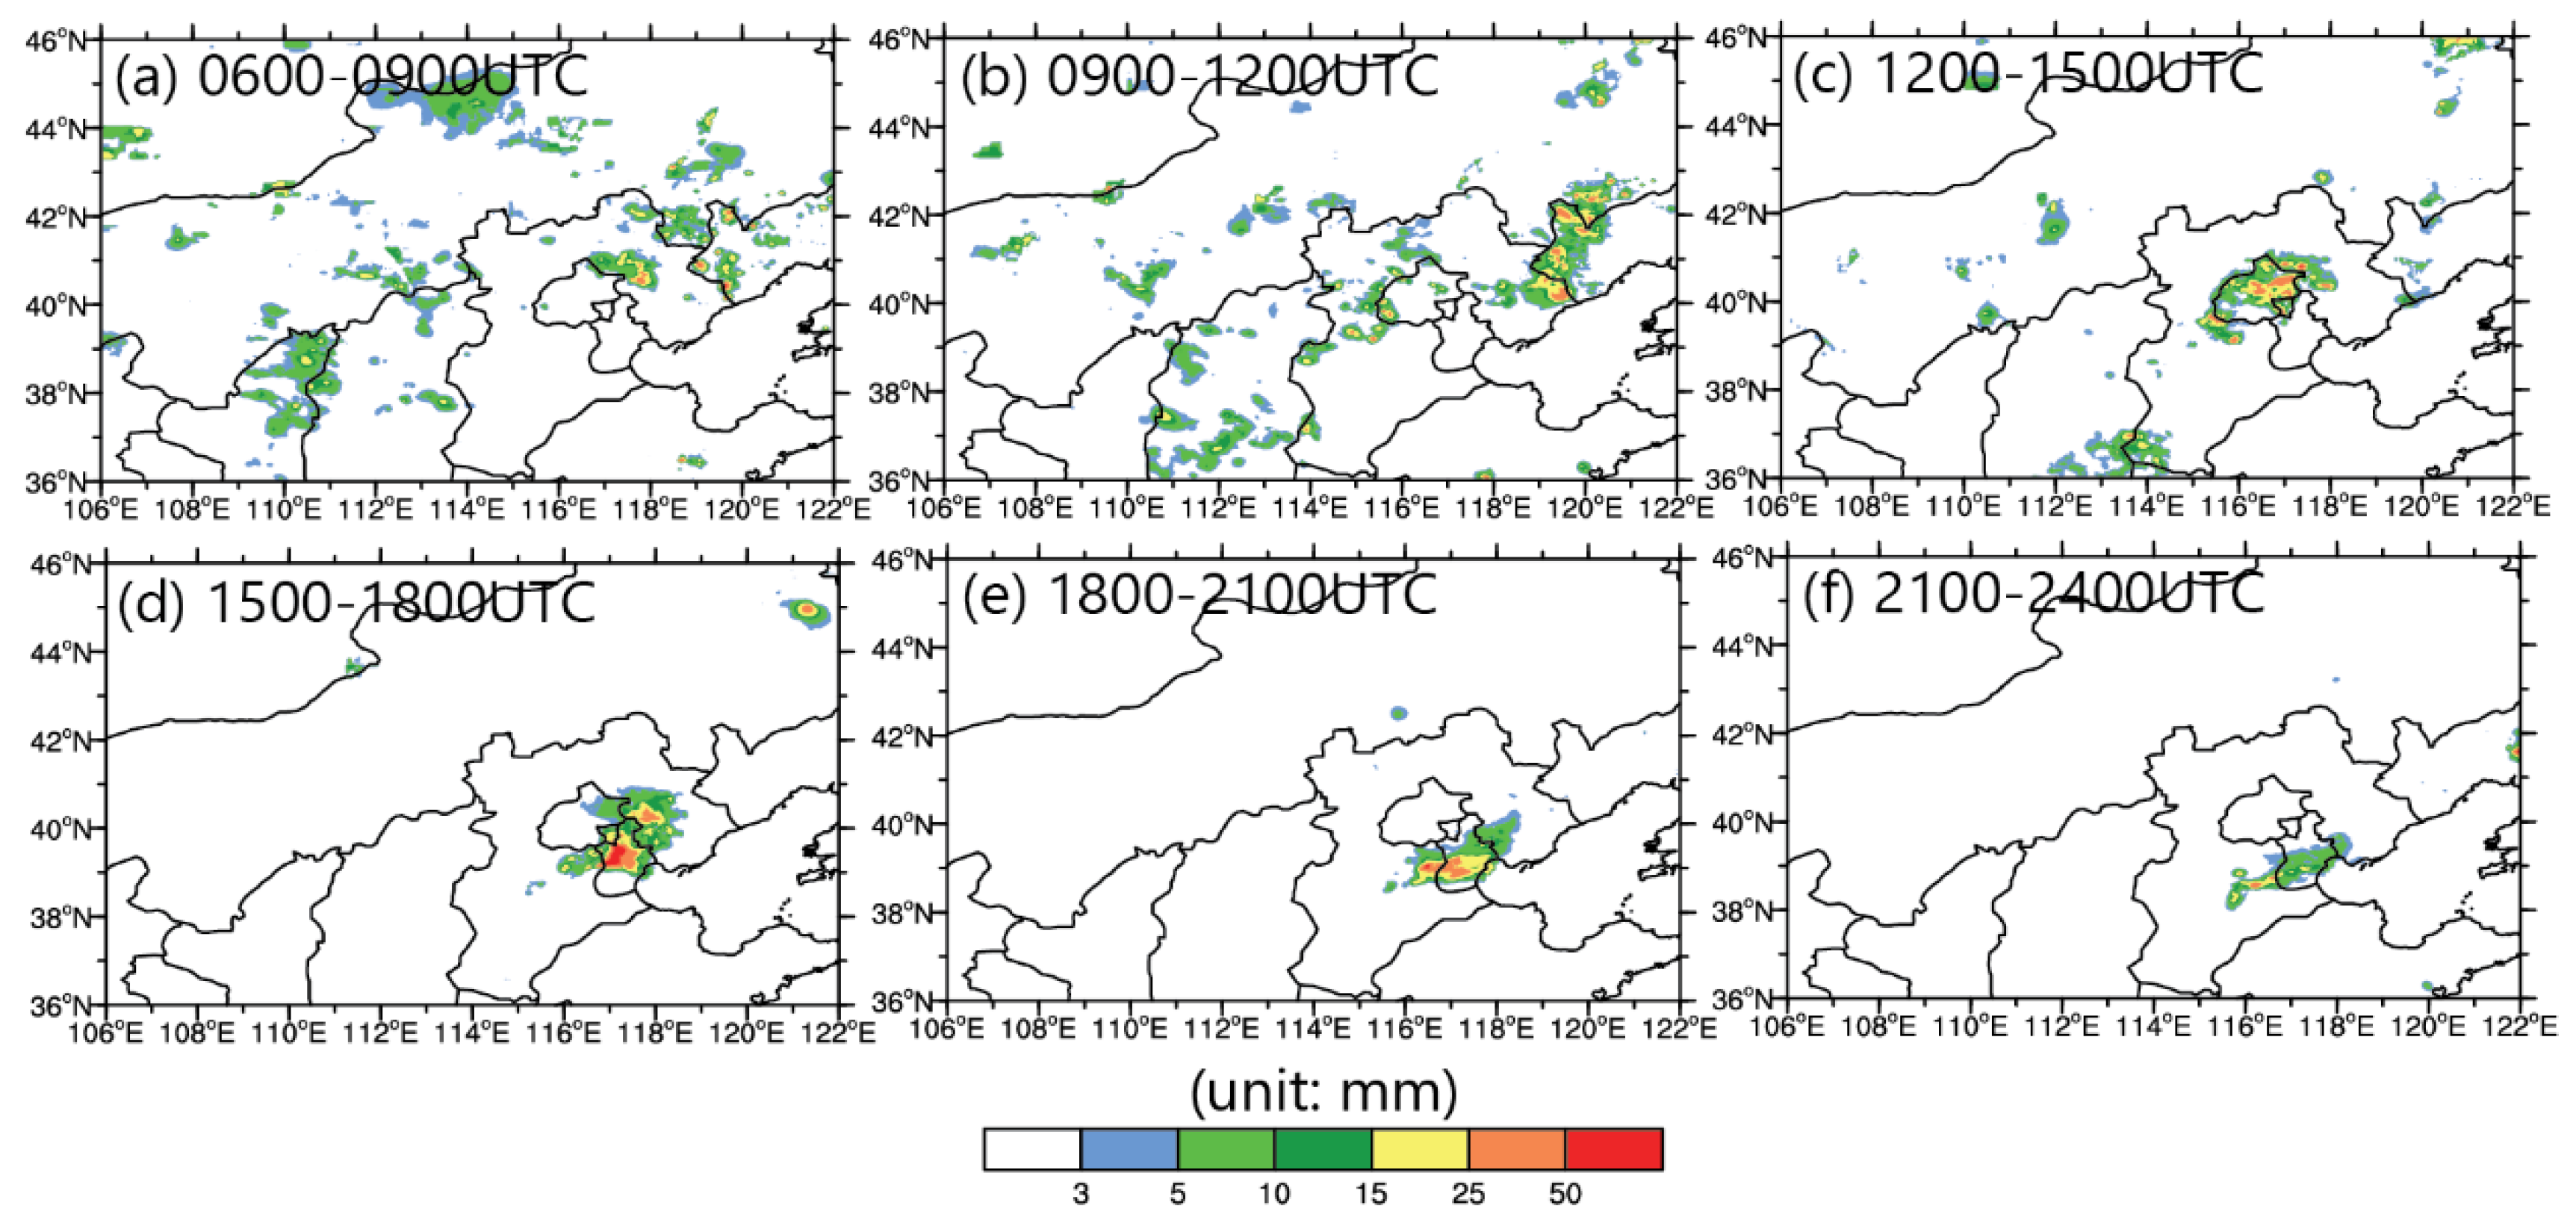
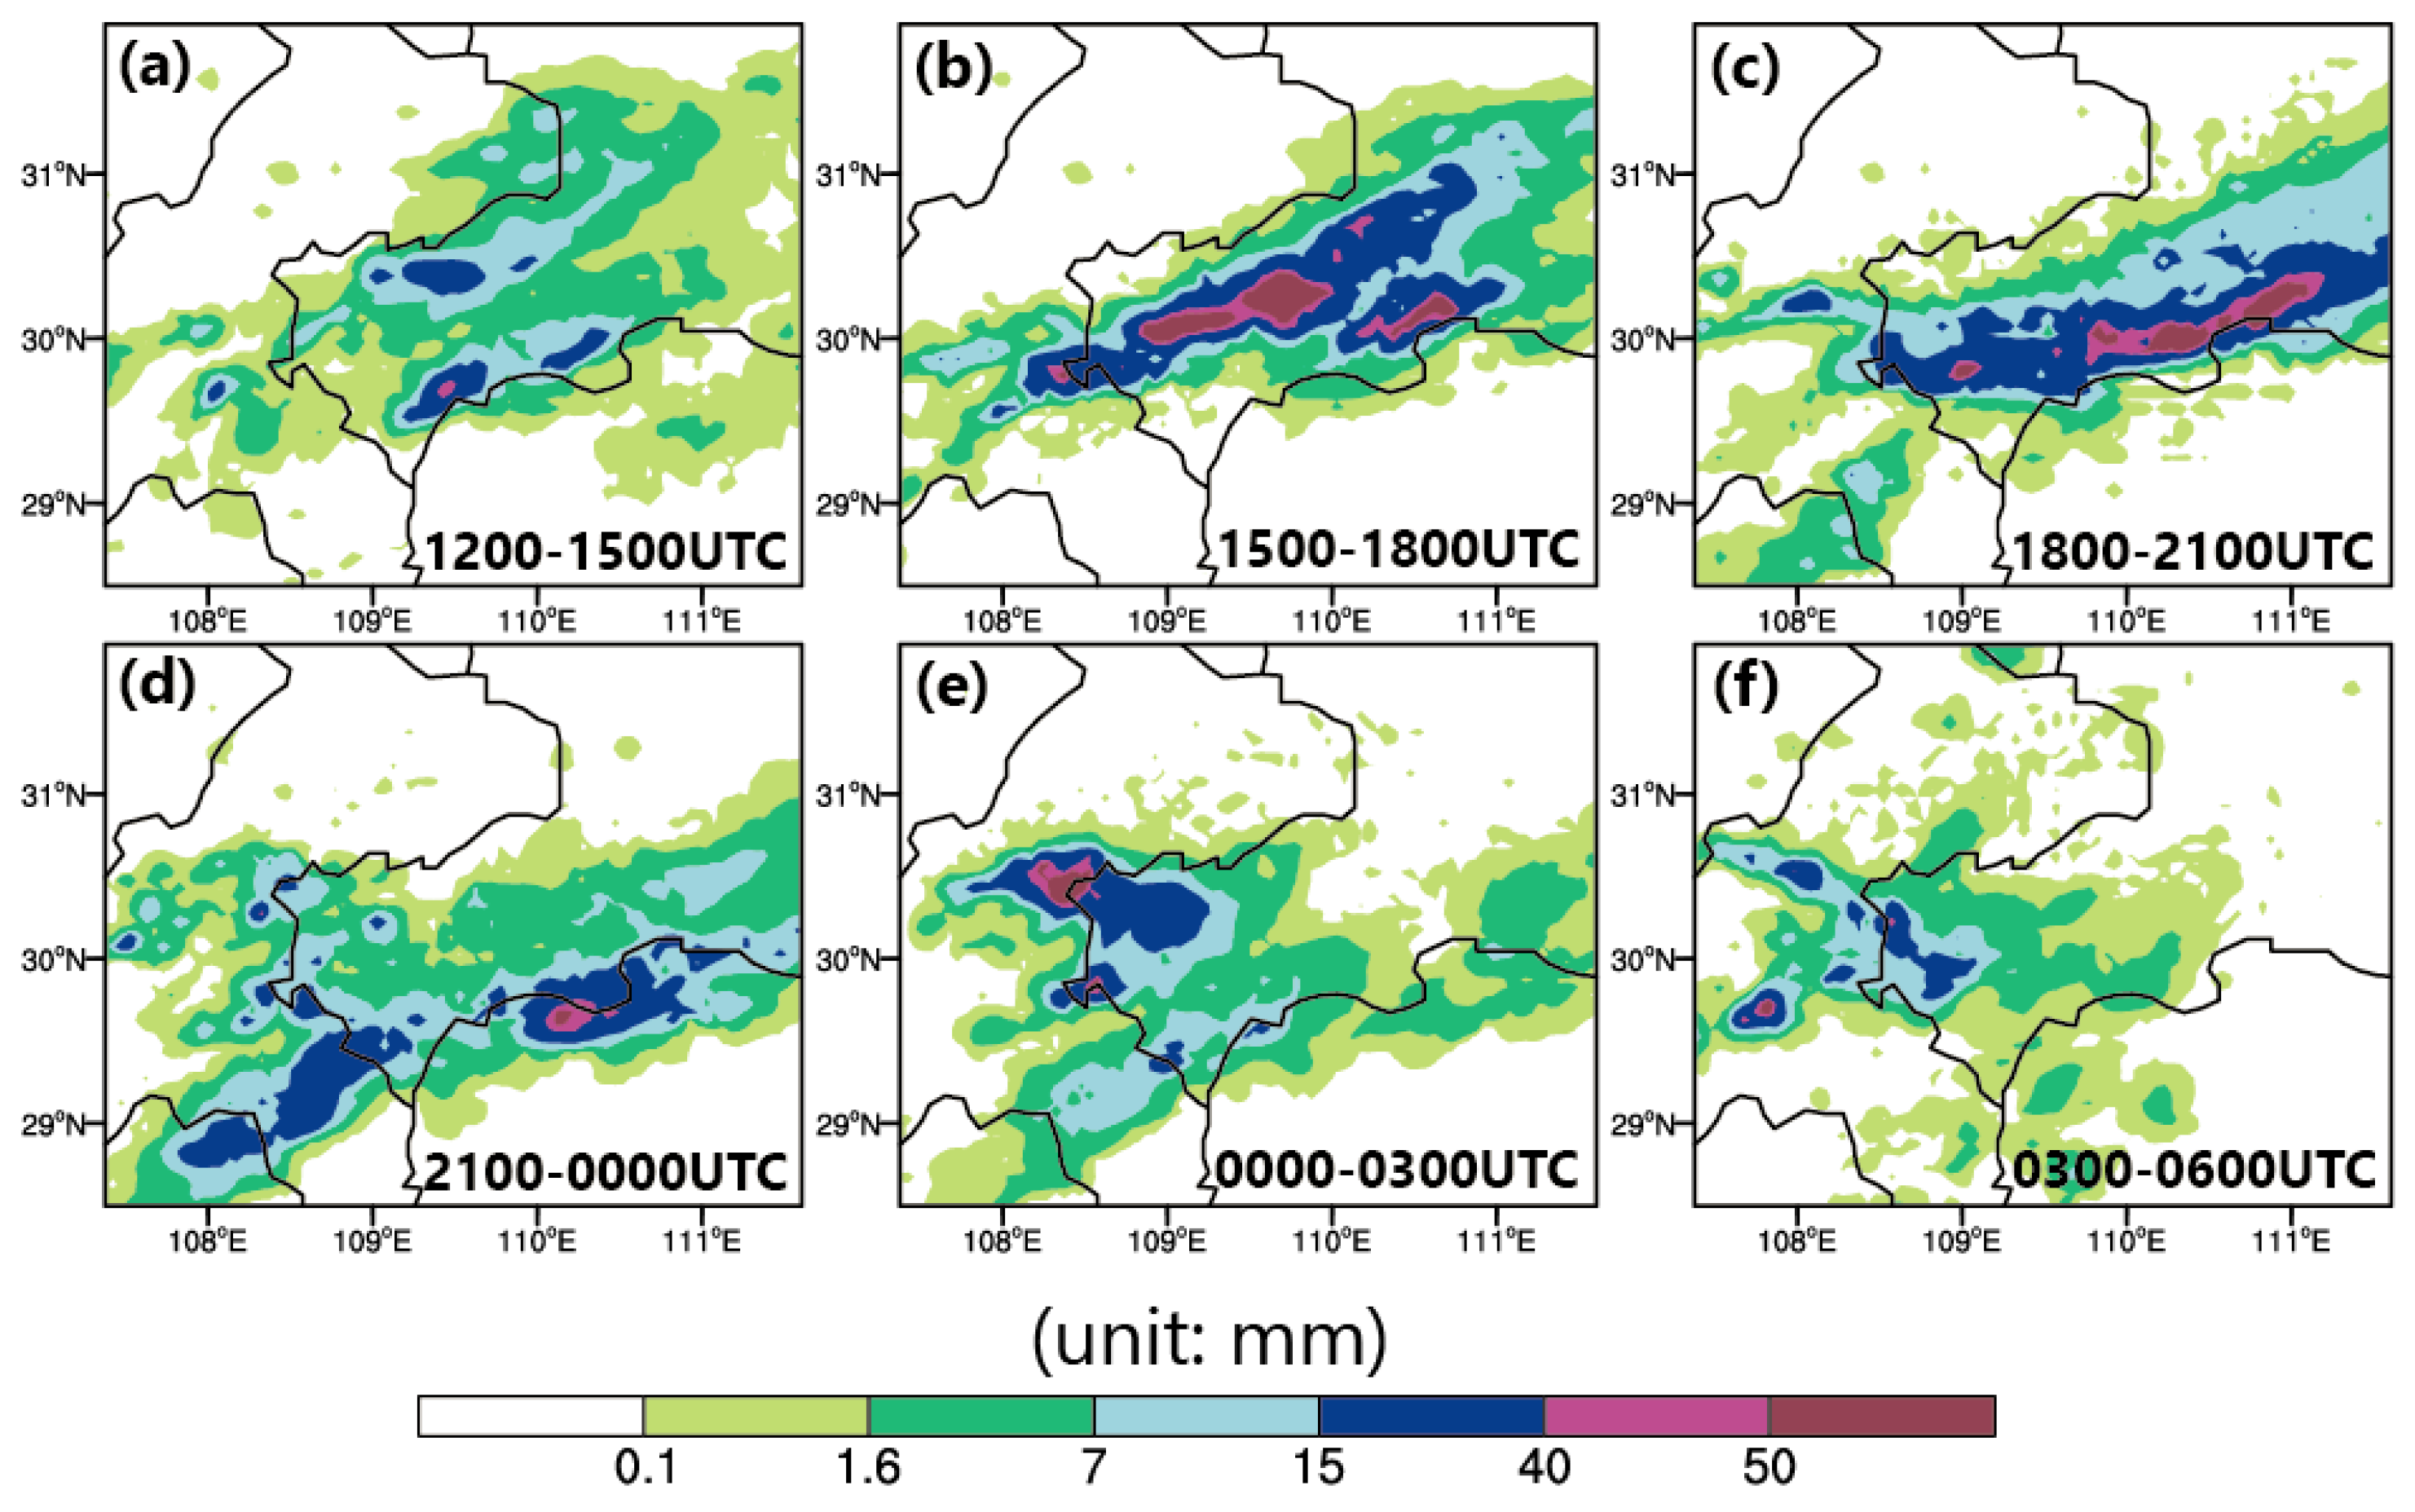
5.3.1. Precipitation Distribution
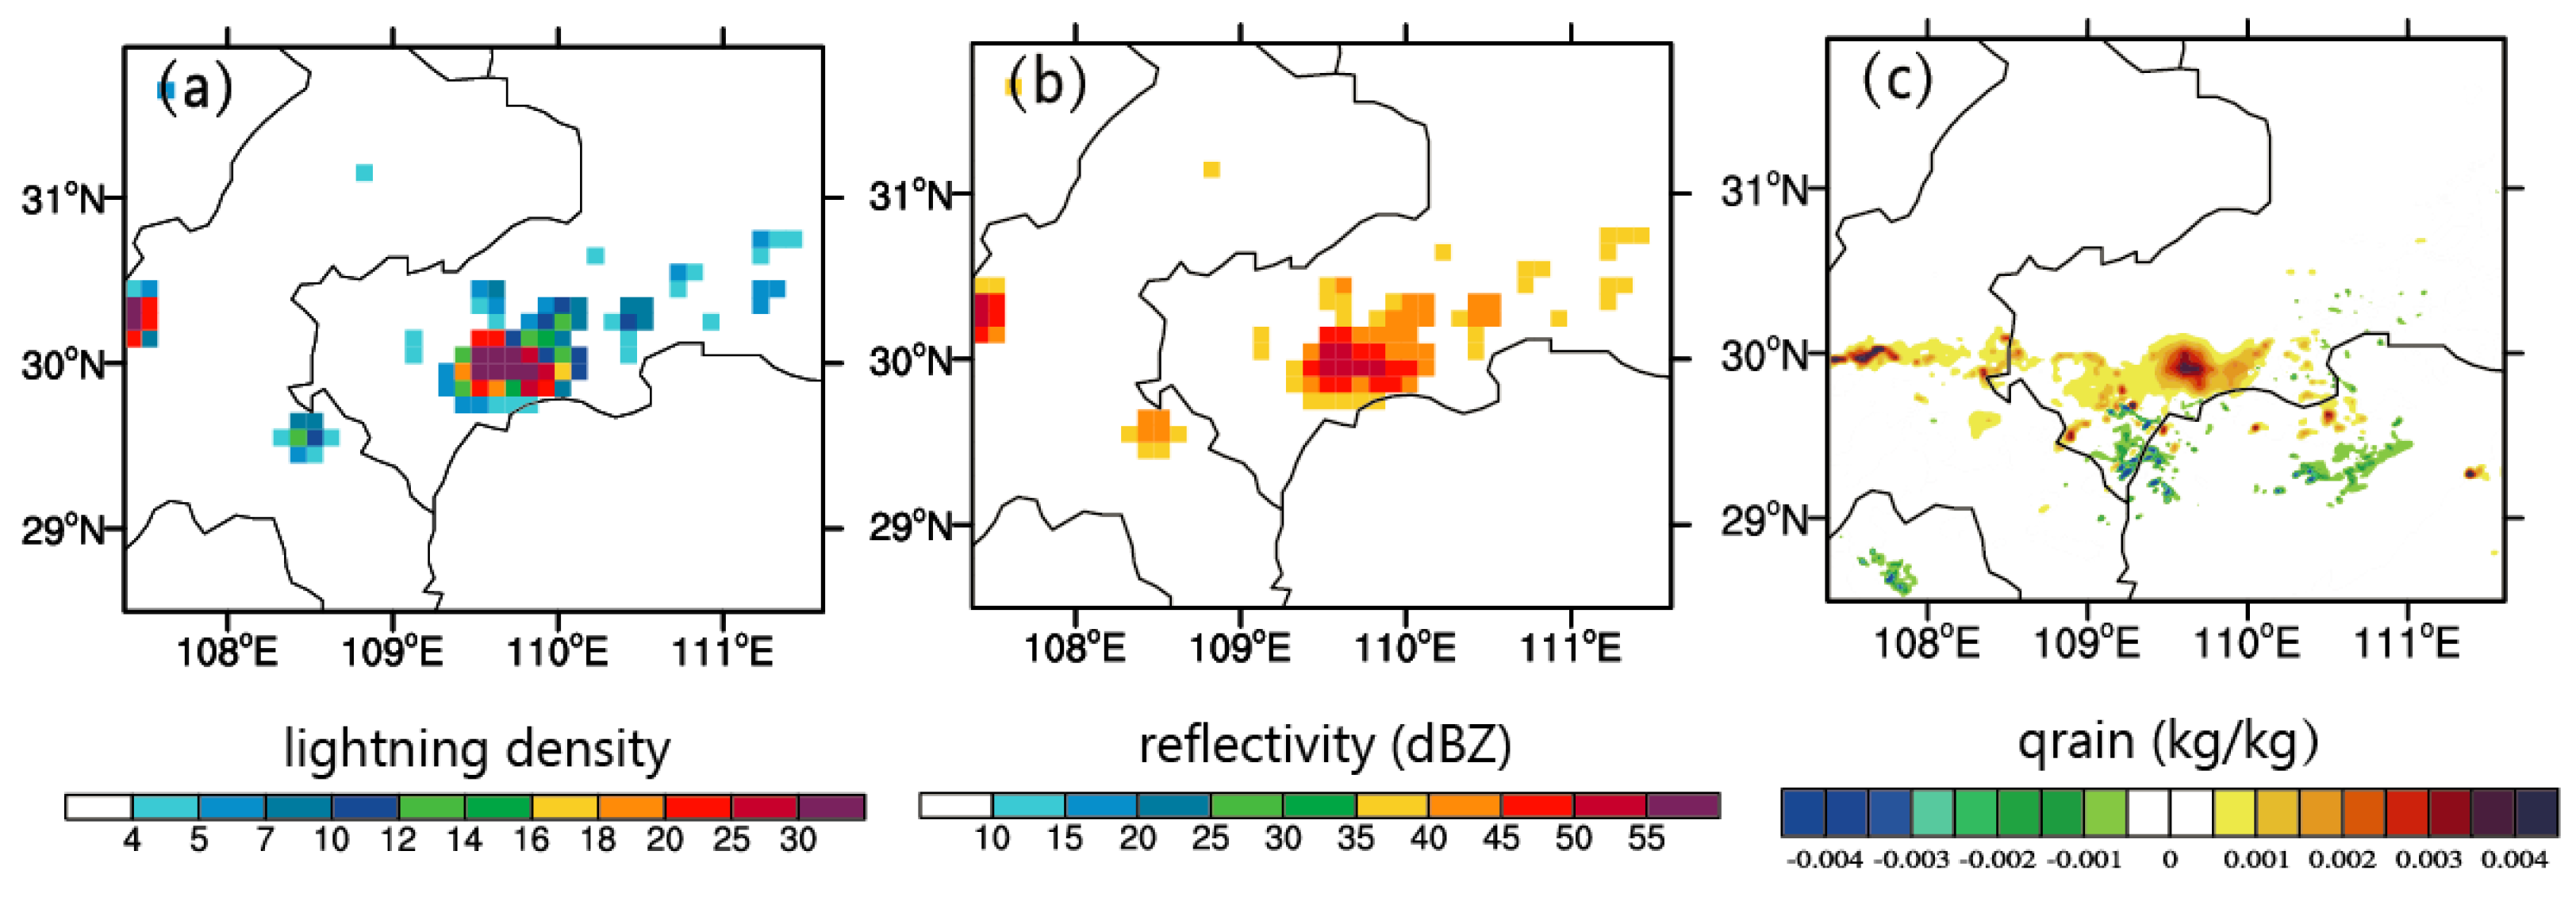
5.3.2. Diagnosis
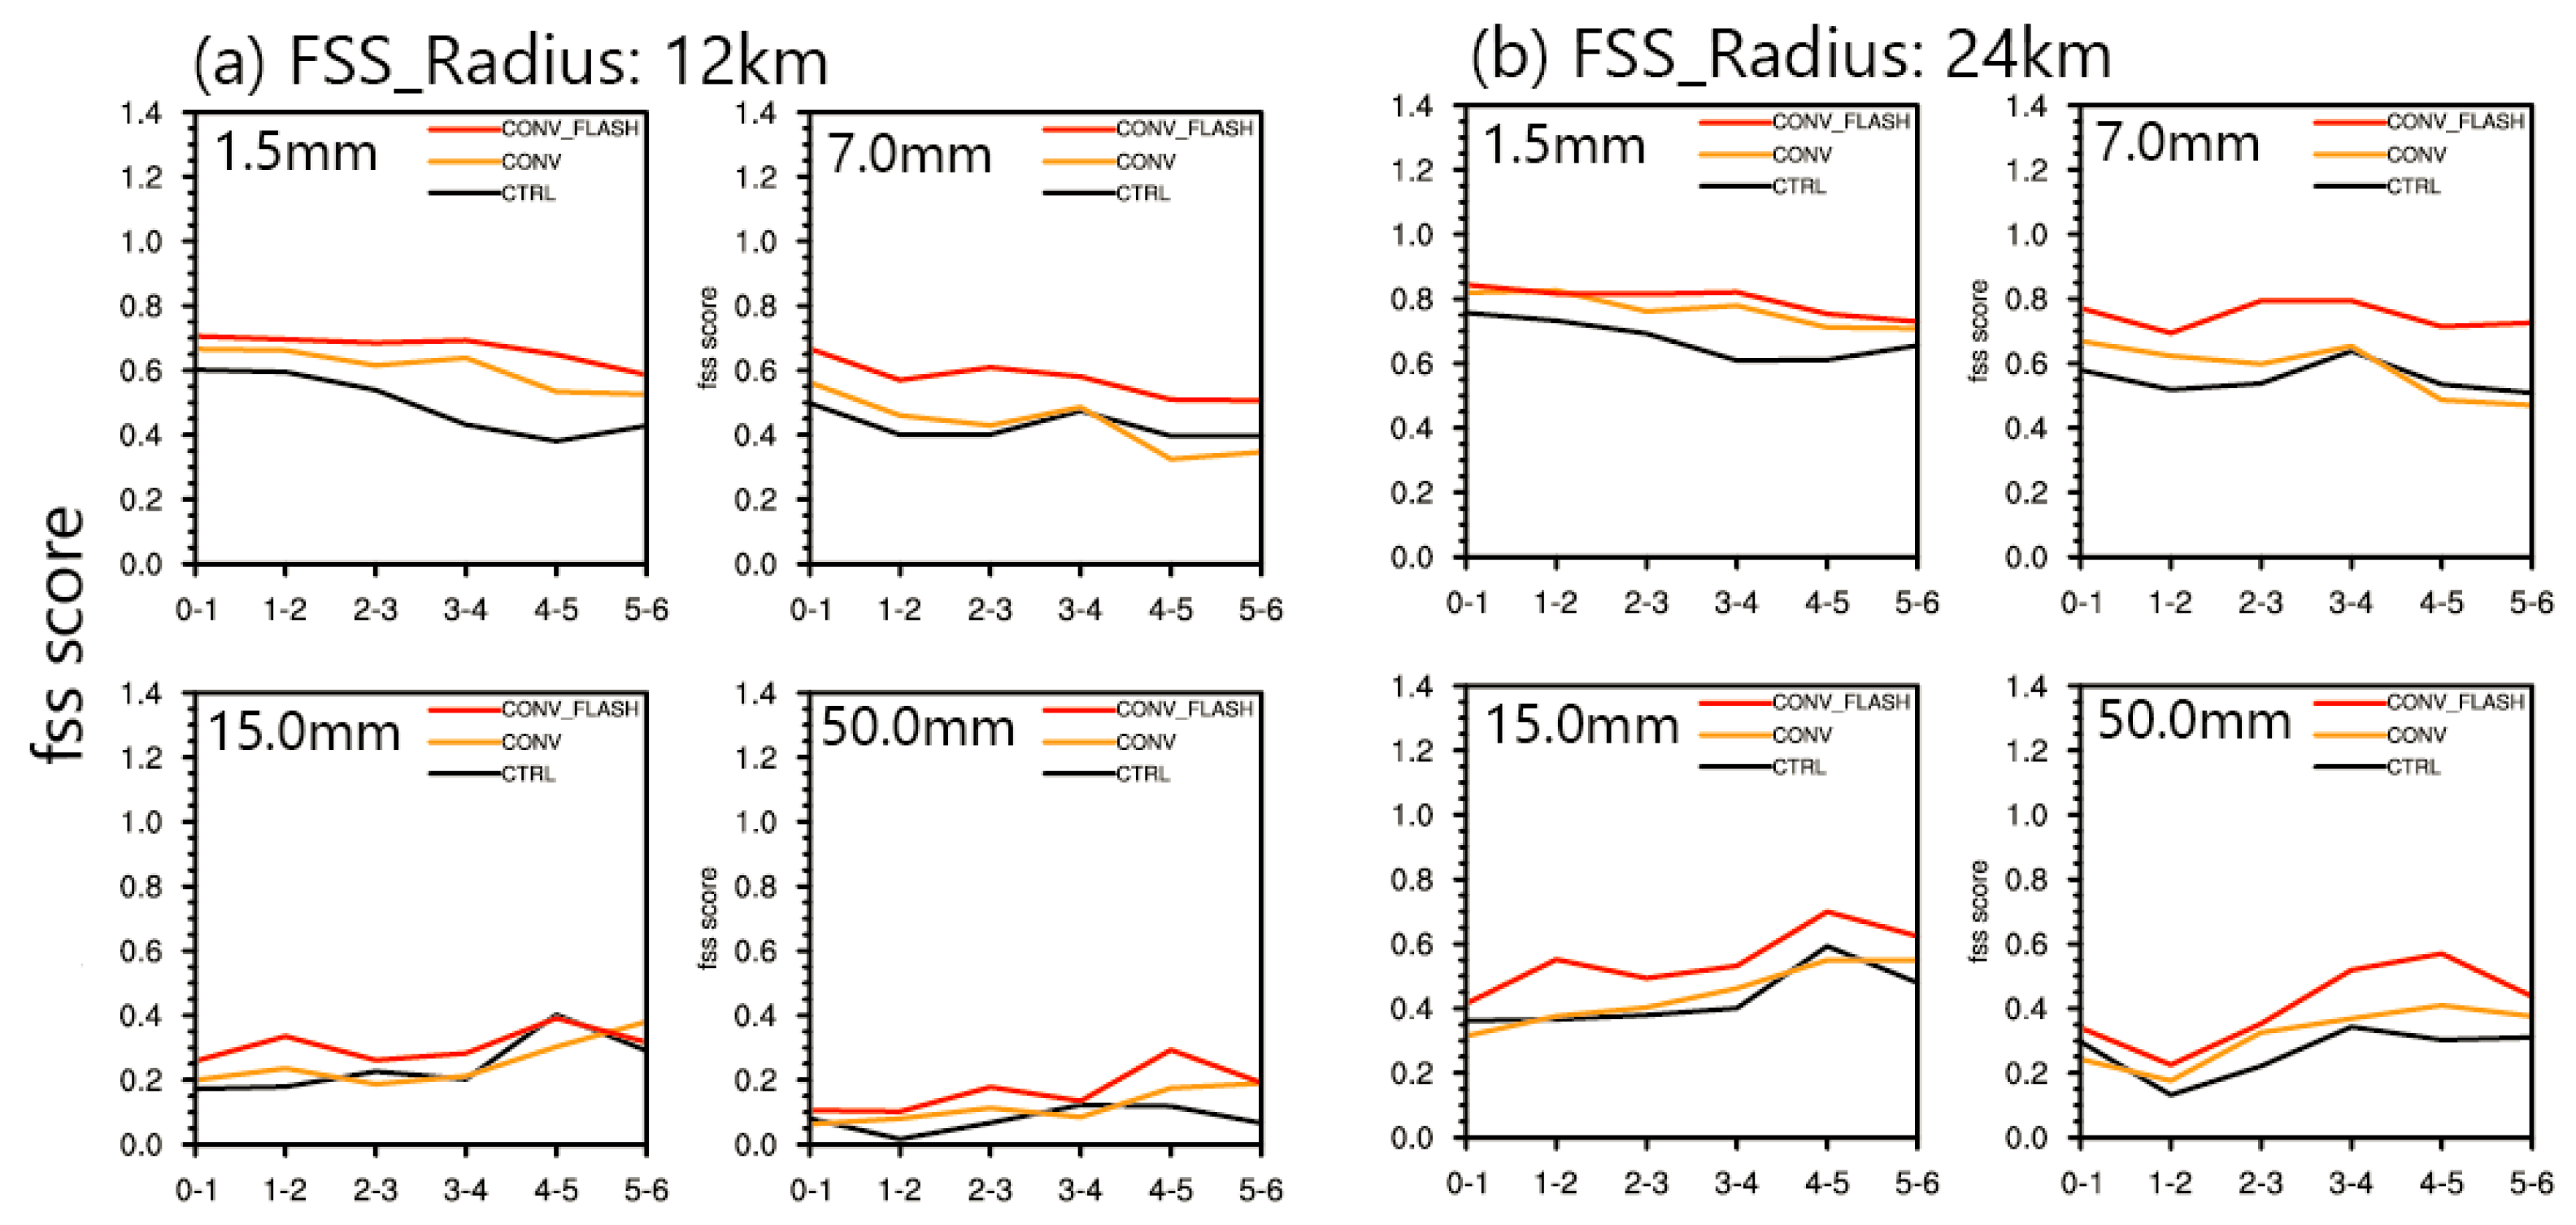
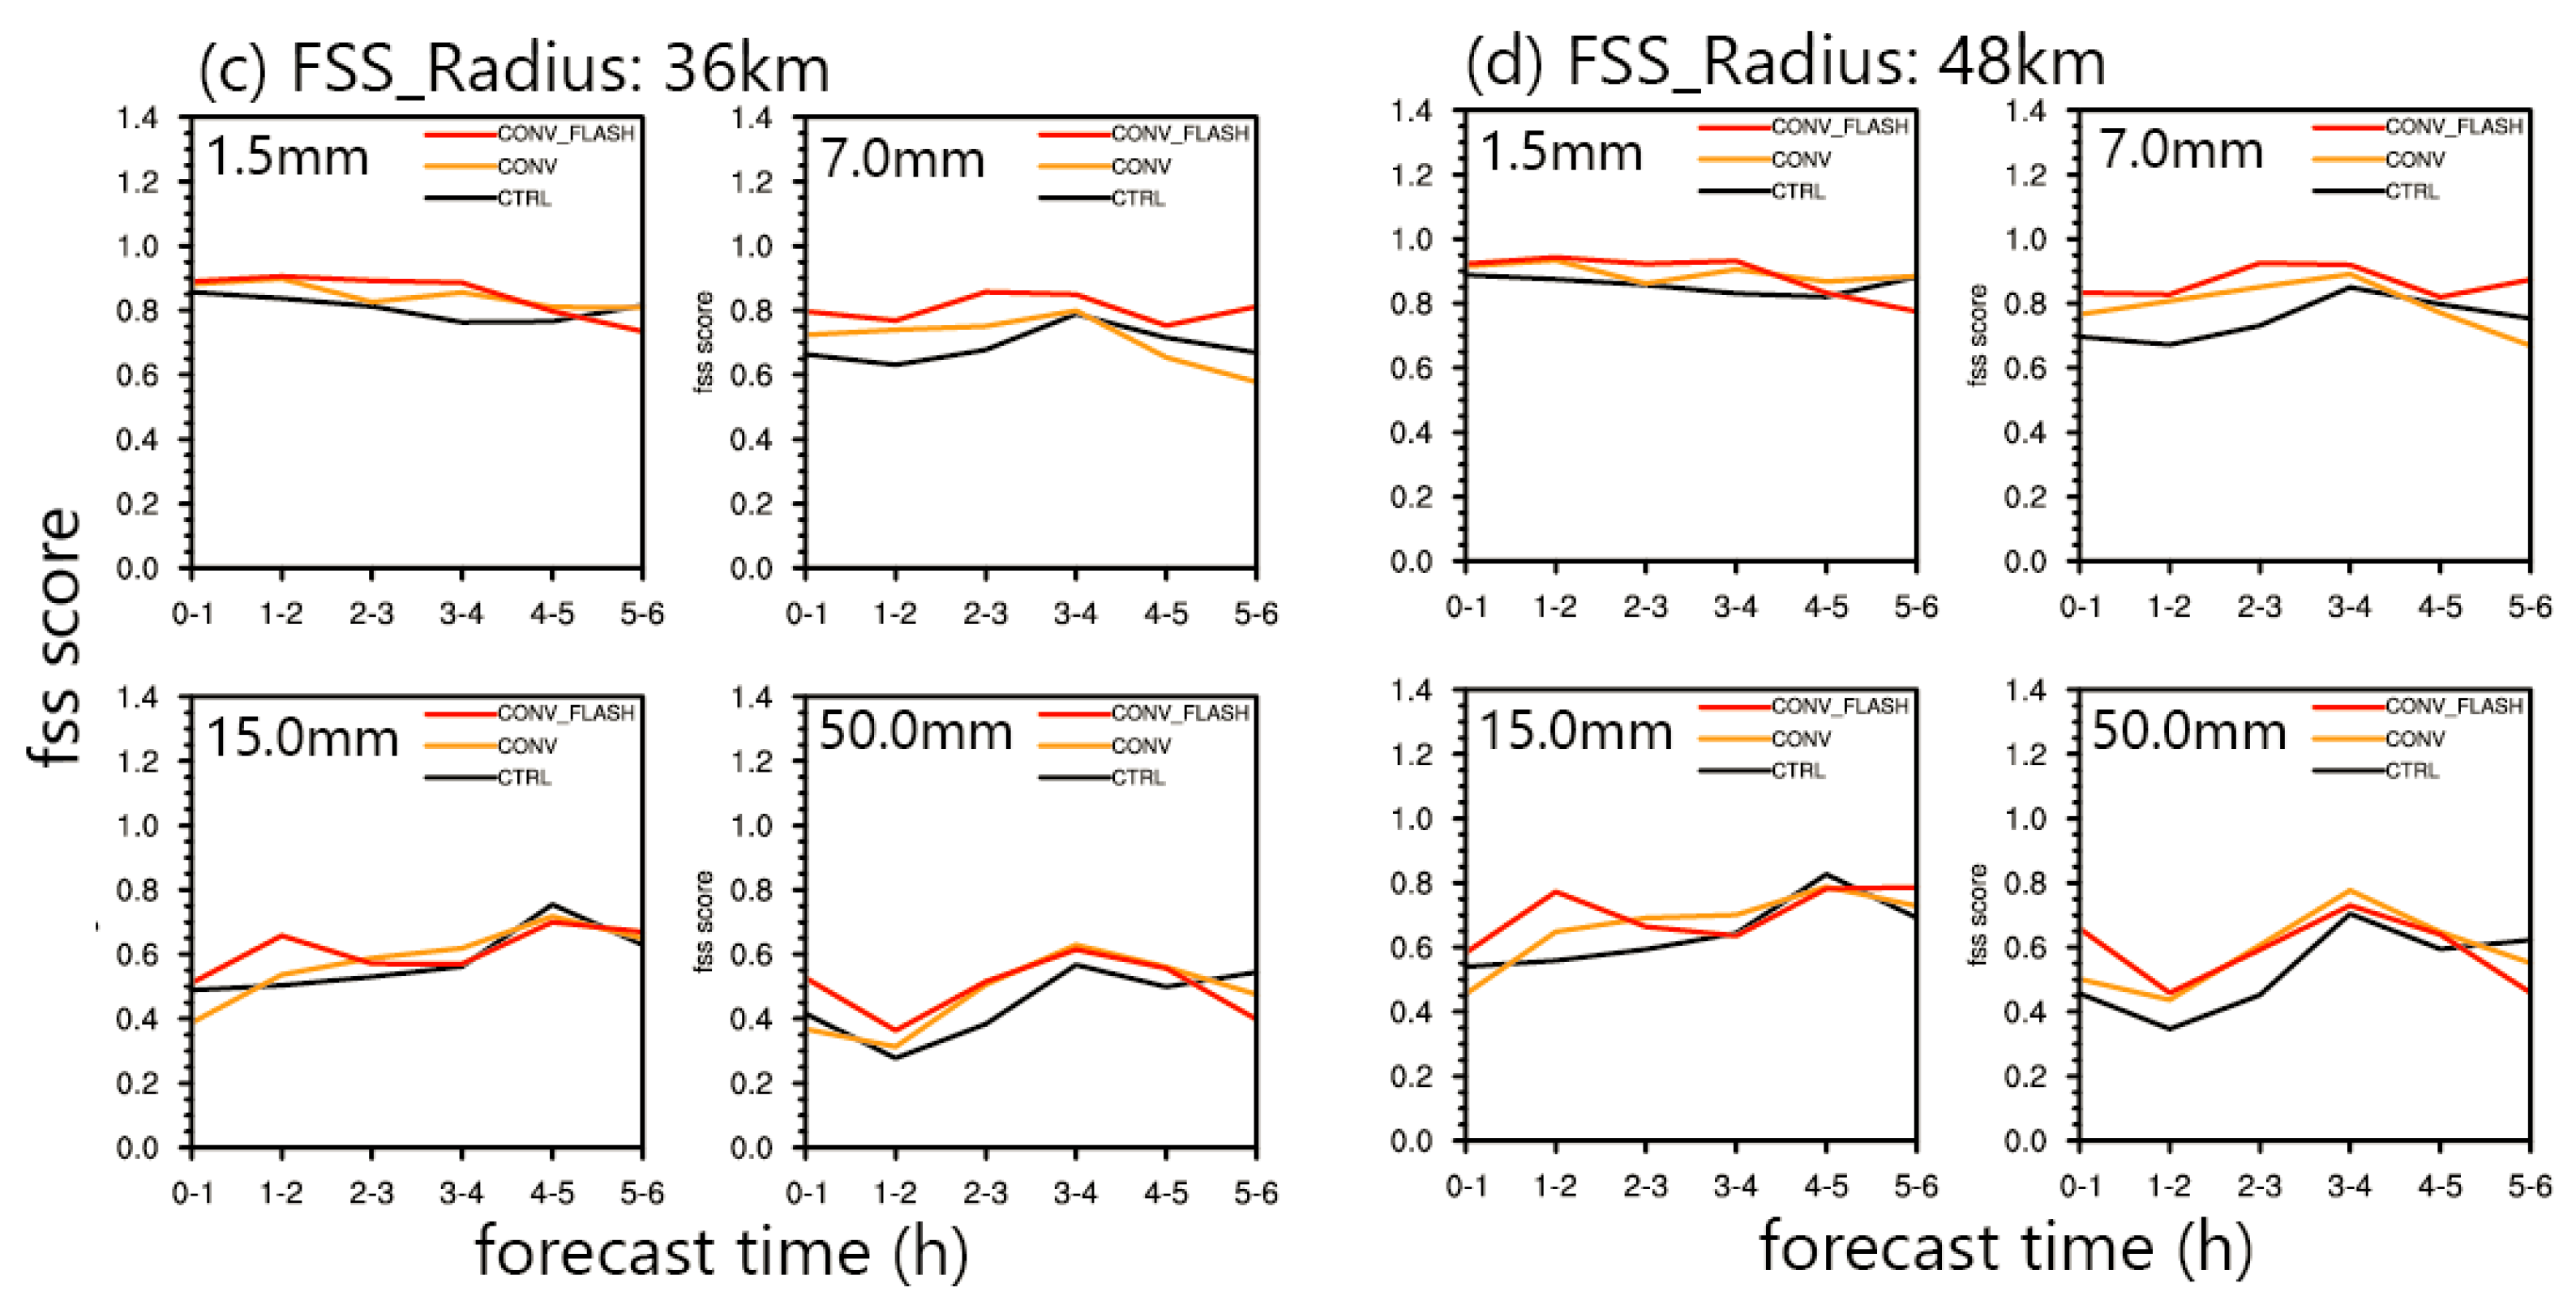
5.3.3. Rainfall Forecast Skill Scores
6. Discussion
7. Conclusions
Author Contributions
Funding
Acknowledgments
Conflicts of Interest
References
- Reynolds, S.E.; Brook, M.; Gourley, M.F. Thunderstorm Charge Separation. J. Atmos. Sci. 1957, 14, 426–436. [Google Scholar] [CrossRef]
- Latham, J.; Petersen, W.A.; Deierling, W.; Christian, H.J. Field identification of a unique globally dominant mechanism of thunderstorm electrification. Q. J. R. Meteorol. Soc. 2007, 133, 1453–1457. [Google Scholar] [CrossRef]
- Qie, X.; Yu, Y.; Guo, C.; Laroche, P.; Zhang, G.; Zhang, Q. Some features of stepped and dartstepped leaders near the ground in natural negative cloud-to-ground lightning discharges. Ann. Geophys. 2002, 20, 863–870. [Google Scholar] [CrossRef]
- Qie, X.; Yu, Y.; Wang, D.; Wang, H.; Chu, R. Characteristics of cloud-to-ground lightning in Chinese Inland Plateau. J. Meteorol. Soc. Jpn. 2002, 80, 745–754. [Google Scholar] [CrossRef]
- Qie, X.; Kong, X.; Zhang, G.; Zhang, T.; Yuan, T.; Zhou, Y.; Zhang, Y.; Wang, H.; Sun, A. The possible charge structure of thunderstorm and lightning discharges in northeastern verge of Qinghai–Tibetan Plateau. Atmos. Res. 2005, 76, 231–246. [Google Scholar] [CrossRef]
- Lin, K.P.; Lin, Z.G.; Yi, Y.M.; Lin, J.L. The spatial and temporal distribution for lightning of various clouds system. J. Trop. Meteorol. 2005, 21, 383–392. [Google Scholar]
- Guo, F.X.; Lu, G.Y.; Wu, X.; Wang, H.L.; Liu, Z.P.; Bao, M.; Li, Y.W. Occurrence conditions of positive cloud-to-ground flashes in severe thunderstorms. Sci. China Earth Sci. 2016, 59, 1401–1413. [Google Scholar] [CrossRef]
- Papadopoulos, A.; Chronis, T.G.; Anagnostou, E.N. Improving convective precipitation forecasting through assimilation of regional lightning measurements in a mesoscale model. Mon. Weather Rev. 2005, 133, 1961–1977. [Google Scholar] [CrossRef]
- Papadopoulos, A.; Anagnostou, E.; Serpetzoglou, E.N. Evaluating the impact of lightning data assimilation on mesoscale model simulations of a flash flood inducing storm. Atmos. Res. 2009, 94, 715–725. [Google Scholar] [CrossRef]
- Mansell, E.R.; Ziegler, C.L.; MacGorman, D.R. A lightning data assimilation technique for mesoscale forecast models. Mon. Weather Rev. 2007, 135, 1732–1748. [Google Scholar] [CrossRef]
- Müller, R.; Haussler, S.; Jerg, M.; Heizenreder, D.A. Novel Approach for the Detection of Developing Thunderstorm Cells. Remote Sens. 2019, 11, 443. [Google Scholar] [CrossRef]
- Fierro, A.O.; Mansell, E.R.; Ziegler, C.L.; Macgorman, D.R. Application of lightning data assimilation technique in the WRF-ARW model at cloud-resolving scales for the tornado outbreak of 24 May 2011. Mon. Wea. Rev. 2012, 140, 2609–2627. [Google Scholar] [CrossRef]
- Fierro, A.O.; Gao, J.D.; Ziegler, C.L.; Mansell, E.R.; Macgorman, D.R.; Dembek, S.R. Evaluation of a cloud-scale lightning data assimilation technique and a 3DVAR method for the analysis and short-term forecast of the 29 June 2012 Derecho event. Mon. Wea. Rev. 2014, 142, 183–202. [Google Scholar] [CrossRef]
- Fierro, A.O.; Gao, J.D.; Ziegler, C.L.; Ziegler, C.L.; Calhoun, K.M.; Mansell, E.R.; Macgorman, D.R. Assimilation of flash extent data in the variational framework at convection-allowing scales: Proof-of-concept and evaluation for the short-term forecast of the 24 may 2011 Tornado outbreak. Mon. Wea. Rev. 2016, 144, 4373–4393. [Google Scholar] [CrossRef]
- Lagouvardos, K.; Kotroni, V.; Defer, E.; Bousquet, O. Study of a heavy precipitation event over southern France, in the frame of HYMEX project: Observational analysis and model results using assimilation of lightning. Atmos. Res. 2013, 134, 45–55. [Google Scholar] [CrossRef]
- Wang, Y.; Yang, Y.; Qiu, X.B. Assimilating Cloud-to-ground Lightning Data Using Ensemble Square Root Filter. J. Arid Meteorol. 2015, 33, 761–768. [Google Scholar]
- Wang, Y.; Yang, Y.; Liu, D.; Zhang, D.; Yao, W.; Wang, C. A Case Study of Assimilating Lightning-Proxy Relative Humidity with WRF-3DVAR. Atmosphere 2017, 8, 55. [Google Scholar] [CrossRef]
- Alexander, G.D.; Weinman, J.A.; Karyampoudi, V.M.; Olson, W.S.; Lee, A.C.L. The effect of assimilating rain rates derived from satellites and lightning on forecasts of the 1993 superstorm. Mon. Weather Rev. 1999, 127, 1433–1457. [Google Scholar] [CrossRef]
- Chang, D.E.; Weinman, J.A.; Morales, C.A.; Olson, W.S. The effect of spaceborn microwave and ground-based continuous lightning measurements on forecasts of the 1998 Groundhog Day storm. Mon. Weather Rev. 2001, 129, 1809–1833. [Google Scholar] [CrossRef]
- Federico, S.; Avolio, E.; Petracca, M.; Panegrossi, G.; Sanò, P.; Casella, D.; Dietrich, S. Simulating lightning into the RAMS model: Implementation and preliminary results. Nat. Hazards Earth Syst. Sci. 2014, 14, 2933–2950. [Google Scholar] [CrossRef][Green Version]
- Federico, S.; Petracca, M.; Panegrossi, G.; Transerici, C.; Dietrich, S. Impact of the assimilation of lightning data on the precipitation forecast at different forecast ranges. Adv. Sci. Res. 2017, 14, 187–194. [Google Scholar] [CrossRef][Green Version]
- Qie, X.S.; Zhu, R.P.; Yuan, T.; Xu, X.K.; Li, W.L.; Liu, D.X. Application of total-lightning data assimilation in a mesoscale convective system based on the WRF model. Atmos. Res. 2014, 145–146, 255–266. [Google Scholar] [CrossRef]
- Chen, Z.X.; Qie, X.S.; Tian, Y.; Wang, D.F.; Yuan, S.F. Assimilation of lightning data through comprehensively nudging water contents at the cloud-resolving scale. Acta Meteorol. Sinica. 2017, 75, 442–459. [Google Scholar]
- Wang, H.; Liu, Y.; Cheng, W.; Zhao, T.; Fierro, A. Improving Lightning and Precipitation Prediction of Severe Convection Using Lightning Data Assimilation with NCAR WRF-RTFDDA: A lightning data assimilation method. J. Geophys. Res. Atmos. 2017, 122, 12296–12316. [Google Scholar] [CrossRef]
- Giannaros, T.M.; Kotroni, V.; Lagouvardos, K. WRFLTNGDA: A lightning data assimilation technique implemented in the WRF model for improving precipitation forecasts. Environ. Model. Softw. 2012, 76, 54–68. [Google Scholar] [CrossRef]
- Federico, S.; Torcasio, R.C.; Avolio, E.; Caumont, O.; Montopoli, M.; Baldini, L.; Vulpiani, G.; Dietrich, S. The impact of lightning and radar reflectivity factor data assimilation on the very short-term rainfall forecasts of RAMS@ISAC: Application to two case studies in Italy. Nat. Hazards Earth Syst. Sci. 2019, 19, 1839–1864. [Google Scholar] [CrossRef]
- Benjamin, S. Assimilation of lightning data into RUC model convection forecasting. In Proceedings of the Second Conference on Meteorological Applications of Lightning Data, Tucson, AZ, USA, 31 January 2006. [Google Scholar]
- Benjamin, S.; Weygandt, S.; Brown, J.; Smirnova, T.; Devenyi, D.; Brundage, K.; Grell, G.; Peckham, S.; Schlatter, T.; Smith, T. From the radar-enhanced RUC to the WRF-based Rapid Refresh. In Proceedings of the 18th Conference on Numerical Weather Prediction, Park City, UT, USA, 25–29 June 2007. [Google Scholar]
- Benjamin, S.G.; Dévényi, D.; Weygandt, S.S.; Brundage, K.J.; Brown, J.M.; Grell, G.A.; Kim, D.S.; Schewartz, B.E.; Smirnova, T.G.; Smith, T.L.; et al. An Hourly Assimilation–Forecast Cycle: The RUC. Mon. Weather Rev. 2004, 132, 495–518. [Google Scholar] [CrossRef]
- Benjamin, S.G.; Weygandt, S.S.; Smirnova, T.G.; Brown, J.M. Assimilation of lightning data using a diabatic digital fifilter within the Rapid Update Cycle. In Proceedings of the 12th Conference on IOAS-AOLS, New Orleans, LA, USA, 20–24 Jaunary 2008. [Google Scholar]
- Hu, M.; Weygandt, S.S.; Benjamin, S.G.; Xue, M. Ongoing development and testing of generalized cloud analysis package within gsi for initializing rapid refresh. In Proceedings of the 13th Conference on Aviation, Range and Aerospace Meteorology, American Meteorology Society, New Orleans, LA, USA, 21–24 January 2008. [Google Scholar]
- Hu, M. Assimilation of lightning data using cloud analysis within the Rapid Refresh. In Proceedings of the 4th Conference on the Meteorological Applications of Lightning Data, American Meteorology Society, Phoenix, AZ, USA, 13 January 2009; p. 29. [Google Scholar]
- Yang, Y.; Wang, Y.; Zhu, K. Assimilation of Chinese Doppler Radar and Lightning Data Using WRF-GSI: A Case Study of Mesoscale Convective System. Adv. Meteorol. 2015, 2015, 1–17. [Google Scholar] [CrossRef]
- Wang, Y.; Yang, Y.; Wang, C. Improving forecasting of strong convection by assimilating cloud-to-ground lightning data using the physical initialization method. Atmos. Res. 2014, 150, 31–41. [Google Scholar] [CrossRef]
- Yang, J.; Zhang, Z.; Wei, C.; Lu, F.; Guo, Q. Introducing the new generation of Chinese geostationary weather satellites-Feng Yun 4(FY-4). Bull. Am. Meteorol. Soc. 2016, 98, 1637–1658. [Google Scholar] [CrossRef]
- Cao, D.J. The Development of Product Algorithm of the Fengyun-4 Geostationary Lightning Mapping Imager. Adv. Meteorol. Sci. Technol. 2016, 6, 94–98. [Google Scholar]
- Goodman, S.J.; Blakeslee, R.J.; Koshak, W.J.; Mach, D.; Bailey, J.; Buechler, D.; Carey, L.; Schultz, C.; Bateman, M.; Stano, G.; et al. The GOES-R geostationary lightning mapper (GLM). Atmos. Res. 2013, 125–126, 34–49. [Google Scholar] [CrossRef]
- Fierro, A.O.; Wang, Y.; Gao, J.; Mansell, E.R. Variational Assimilation of Radar Data and GLM Lightning-Derived Water Vapor for the Short-Term Forecasts of High-Impact Convective Events. Mon. Wea. Rev. 2019, 147, 4045–4069. [Google Scholar] [CrossRef]
- Cui, X.; Gao, J.G.; Fan, R. Comparison and analysis of lightning characteristics in Jiangsu Province based on data from the Worldwide Lightning Location Network and the Advanced Time of Arrival and Direction System lightning location network. Trans. Atmos. Sci. 2016, 39, 270–279. [Google Scholar]
- Pessi, A.T.; Businger, S. The impact of lightning data assimilation on a winter storm simulation over the North Pacific. Ocean. Mon. Wea. Rev. 2009, 137, 3177–3195. [Google Scholar] [CrossRef]
- Roebber, P.J. Visualizing multiple measures of forecast quality. Weather Forecast. 2009, 24, 601–608. [Google Scholar] [CrossRef]
- Fan, S.Y.; Wang, H.L.; Chen, M.; Gao, H. Study of the data assimilation of radar reflectivity with the WRF 3D-Var. Acta Meteorol. Sin. 2013, 71, 527–537. [Google Scholar]
- Chen, M.; Chen, M.X.; Fan, S.Y. The real-time radar radial velocity 3DVar assimilation experiments for application to an operational forecast model in North China. Acta Meteorol. Sin. 2014, 72, 658–677. [Google Scholar]
- Lu, B.; Sun, J.S.; Zhong, J.Q.; Wang, Z.W.; Fan, S.Y. Analysis of characteristic bias in diurnal precipitation variation forecasts and possible reasons in a regional forecast system over Beijing area. Acta Meteorol. Sin. 2017, 75, 248–259. [Google Scholar]
- Hsiao, L.F.; Chen, D.S.; Kuo, Y.H.; Guo, Y.R. Application of WRF 3DVAR to operational typhoon prediction in taiwan: Impact of outer loop and partial cycling approaches. Weather Forecast. 2012, 27, 1249–1263. [Google Scholar] [CrossRef]
- Tong, W.; Sun, J.; Tang, X.; Li, G.; Zhang, Y. Design strategies of an hourly update 3DVAR data assimilation system for improved convective forecasting. Weather Forecast. 2016, 31, 1673–1695. [Google Scholar] [CrossRef]
- Sun, J.; Wang, H.; Tong, W.; Zhang, Y.; Lin, C.Y.; Xu, D. Comparison of the impacts of momentum control variables on high-resolution variational data assimilation and precipitation forecasting. Mon. Wea. Rev. 2015, 144, 149–169. [Google Scholar] [CrossRef]
- Sun, J.Z.; Chen, M.X.; Fan, S.Y. Radar data assimilation methods: Review and future perspective. Adv Meteor Sci Technol. 2016, 6, 17–27. [Google Scholar]
- Wang, H.; Sun, J.; Fan, S.; Huang, X.Y. Indirect Assimilation of Radar Reflectivity with WRF 3D-Var and Its Impact on Prediction of Four Summertime Convective Events. J. Appl. Meteorol. Climatol. 2013, 52, 889–902. [Google Scholar] [CrossRef]
- Roberts, N.M.; Lean, H.W. Scale-Selective Verification of Rainfall Accumulation from High-Resolution Forecast of Convective Event. Mon. Wea. Rev. 2008, 136, 78–97. [Google Scholar] [CrossRef]
- Lynn, B.H.; Kelman, G.; Ellrod, G. An Evaluation of the Efficacy of Using Observed Lightning to Improve Convective Lightning Forecasts. Weather Forecast. 2015, 30, 405–423. [Google Scholar] [CrossRef]
- Li, N.; Wang, Z.; Chen, X.; Austin, G. Studies of General Precipitation Features with TRMM PR Data: An Extensive Overview. Remote Sens. 2019, 11, 80. [Google Scholar] [CrossRef]


| Cases | Start Time (time,date,year) | End Time (time,date,year) | Duration/h |
|---|---|---|---|
| 1 | 1100UTC, 13 July 2017 | 2100UTC, 13 July 2017 | 10 |
| 2 | 1400UTC, 14 July 2017 | 2300UTC, 14 July 2017 | 9 |
| 3 | 1700UTC, 18 July 2017 | 2300UTC, 18 July 2017 | 6 |
| 4 | 1200UTC, 2 August 2017 | 0000UTC, 3 August 2017 | 12 |
| 5 | 0400UTC, 5 August 2017 | 1400UTC, 5 August 2017 | 10 |
| 6 | 0600UTC, 8 August 2017 | 2100UTC, 8 August 2017 | 15 |
| POD | 1000 | 2000 | 3000 | 4000 | 5000 | 6000 | 7000 | 8000 | 9000 | 10,000 |
| 0-35dBZ | 0.43 | 0.31 | 0.17 | 0.16 | 0.22 | 0.41 | 0.45 | 0.49 | 0.62 | 0.65 |
| 35-80dBZ | 0.49 | 0.49 | 0.63 | 0.64 | 0.64 | 0.58 | 0.59 | 0.39 | 0.17 | 0.11 |
| BIAS | 1000 | 2000 | 3000 | 4000 | 5000 | 6000 | 7000 | 8000 | 9000 | 10,000 |
| 0-35dBZ | 1.33 | 1.23 | 0.89 | 0.77 | 0.90 | 0.90 | 0.86 | 0.86 | 0.89 | 0.91 |
| 35-80dBZ | 0.71 | 0.89 | 2.19 | 2.02 | 1.63 | 1.51 | 2.78 | 1.54 | 1.44 | 1.50 |
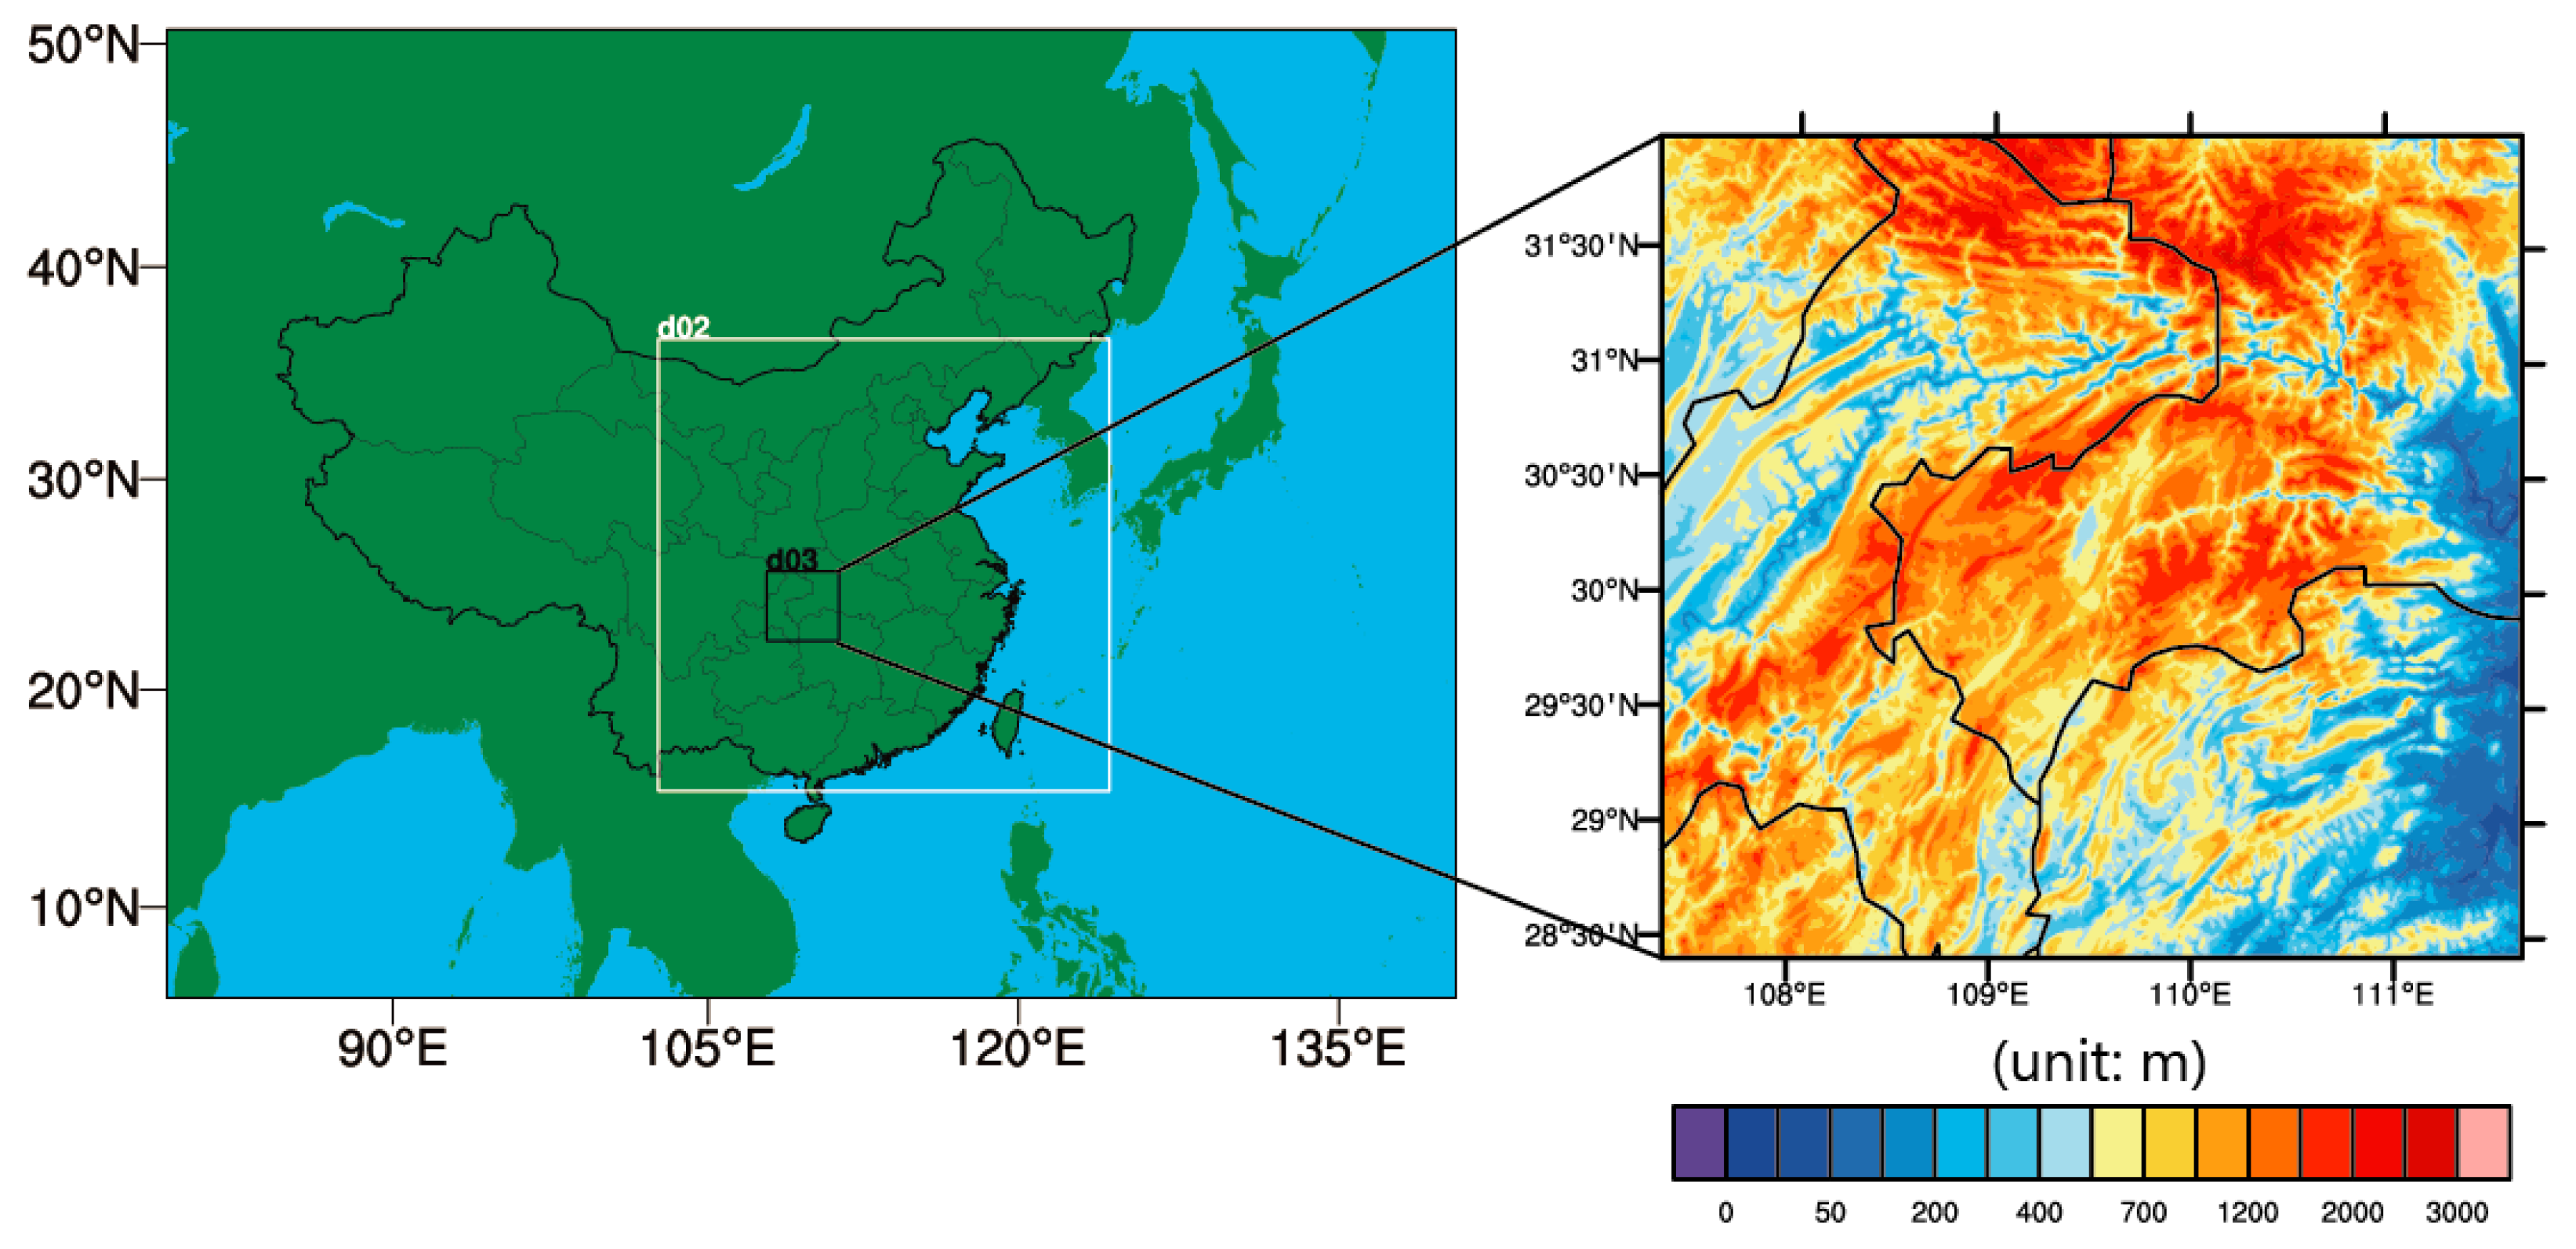
| Model network | D01: 649 × 500 × 50, 9 km horizontal resolution (covering the mainland China region) D02: 550 × 424 × 50, 3 km horizontal resolution (covering the North China region) |
| Model version | WRFDAV3.8.1 + WRFV3.8.1 |
| Data assimilation | Method: 3DVAR Data resource: GTS data, observation of automatic station in the Beijing area, ground-based GNSS/ZTD in North China, radar observation of 7 Doppler weather radars in the Beijing-Tianjin-Hebei region (D02) |
| Physical scheme | Boundary layer scheme: ACM2 Microphysical scheme: Thompson Long wave scheme: RRTMG Land-surface model scheme: NOAH Convection parameterization scheme: Kain–Fritsch (D01) |
| Experiment Name | Additional Data for Assimilation | Initial and Boundary Conditions |
|---|---|---|
| CTRL | No additional data | RMAPS-ST |
| RADAR_RV | Radar radial velocity | RMAPS-ST |
| RADAR_RF_RV | Radar radial velocity + Radar reflectivity | RMAPS-ST |
| FLASH_RF_RV | Radar radial velocity + 3D proxy reflectivity | RMAPS-ST |
| Threshold: 1.5 mm | 0-1 | 1-2 | 2-3 | 3-4 | 4-5 | 5-6 |
| RADAR_RV | 0.931 | 3.212 ** | 0.426 | 0.586 | 1.620 * | 1.519 |
| RADAR_RF_RV | 0.791 | 4.223 ** | 7.020 ** | 3.001 ** | 1.066 | 2.067 * |
| FLASH_RF_RV | 1.440 | 3.651 ** | 3.073 ** | 4.524 ** | 0.711 | 1.881 * |
| Threshold: 7.0 mm | 0-1 | 1-2 | 2-3 | 3-4 | 4-5 | 5-6 |
| RADAR_RV | 0.008 | 6.129 ** | 1.135 | 0.489 | 1.208 | 1.786 * |
| RADAR_RF_RV | 3.618 ** | 3.454 ** | 1.164 | 1.007 | 1.837 * | 6.568 ** |
| FLASH_RF_RV | 3.113 ** | 1.871 * | 0.335 | 1.125 | 2.545 ** | 7.329 ** |
| Threshold: 15.0 mm | 0-1 | 1-2 | 2-3 | 3-4 | 4-5 | 5-6 |
| RADAR_RV | 1.348 | 0.124 | 0.704 | 0.751 | 1.075 | 1.377 |
| RADAR_RF_RV | 5.014 ** | 1.329 | 1.194 | 1.419 | 4.612 ** | 4.085 ** |
| FLASH_RF_RV | 4.484 ** | 0.879 | 1.163 | 1.371 | 3.863 ** | 3.438 ** |
| Threshold: 50.0 mm | 0-1 | 1-2 | 2-3 | 3-4 | 4-5 | 5-6 |
| RADAR_RV | 1.664 * | 0.613 | 0.411 | 0.227 | 0.212 | 1.083 |
| RADAR_RF_RV | 3.585 ** | 0.260 | 0.410 | 1.064 | 3.179 ** | 3.120 ** |
| FLASH_RF_RV | 2.683 ** | 0.251 | 0.118 | 1.485 | 4.924 ** | 3.585 ** |
| Experiment Name | Data for Assimilation | Domain | Time Interval |
|---|---|---|---|
| CTRL | - | - | - |
| CONV | Conventional observations | D01 + D02 | 6 h |
| CONV_FLASH | Conventional observations + 3D FY-4A proxy reflectivity | D01 + D02/D02 | 6 h/3 h |
© 2020 by the authors. Licensee MDPI, Basel, Switzerland. This article is an open access article distributed under the terms and conditions of the Creative Commons Attribution (CC BY) license (http://creativecommons.org/licenses/by/4.0/).
Share and Cite
Chen, Y.; Yu, Z.; Han, W.; He, J.; Chen, M. Case Study of a Retrieval Method of 3D Proxy Reflectivity from FY-4A Lightning Data and Its Impact on the Assimilation and Forecasting for Severe Rainfall Storms. Remote Sens. 2020, 12, 1165. https://doi.org/10.3390/rs12071165
Chen Y, Yu Z, Han W, He J, Chen M. Case Study of a Retrieval Method of 3D Proxy Reflectivity from FY-4A Lightning Data and Its Impact on the Assimilation and Forecasting for Severe Rainfall Storms. Remote Sensing. 2020; 12(7):1165. https://doi.org/10.3390/rs12071165
Chicago/Turabian StyleChen, Yaodeng, Zheng Yu, Wei Han, Jing He, and Min Chen. 2020. "Case Study of a Retrieval Method of 3D Proxy Reflectivity from FY-4A Lightning Data and Its Impact on the Assimilation and Forecasting for Severe Rainfall Storms" Remote Sensing 12, no. 7: 1165. https://doi.org/10.3390/rs12071165
APA StyleChen, Y., Yu, Z., Han, W., He, J., & Chen, M. (2020). Case Study of a Retrieval Method of 3D Proxy Reflectivity from FY-4A Lightning Data and Its Impact on the Assimilation and Forecasting for Severe Rainfall Storms. Remote Sensing, 12(7), 1165. https://doi.org/10.3390/rs12071165