Quantifying the Impacts of Anthropogenic Activities and Climate Variations on Vegetation Productivity Changes in China from 1985 to 2015


 ,
,
Abstract
1. Introduction
2. Materials and Methods
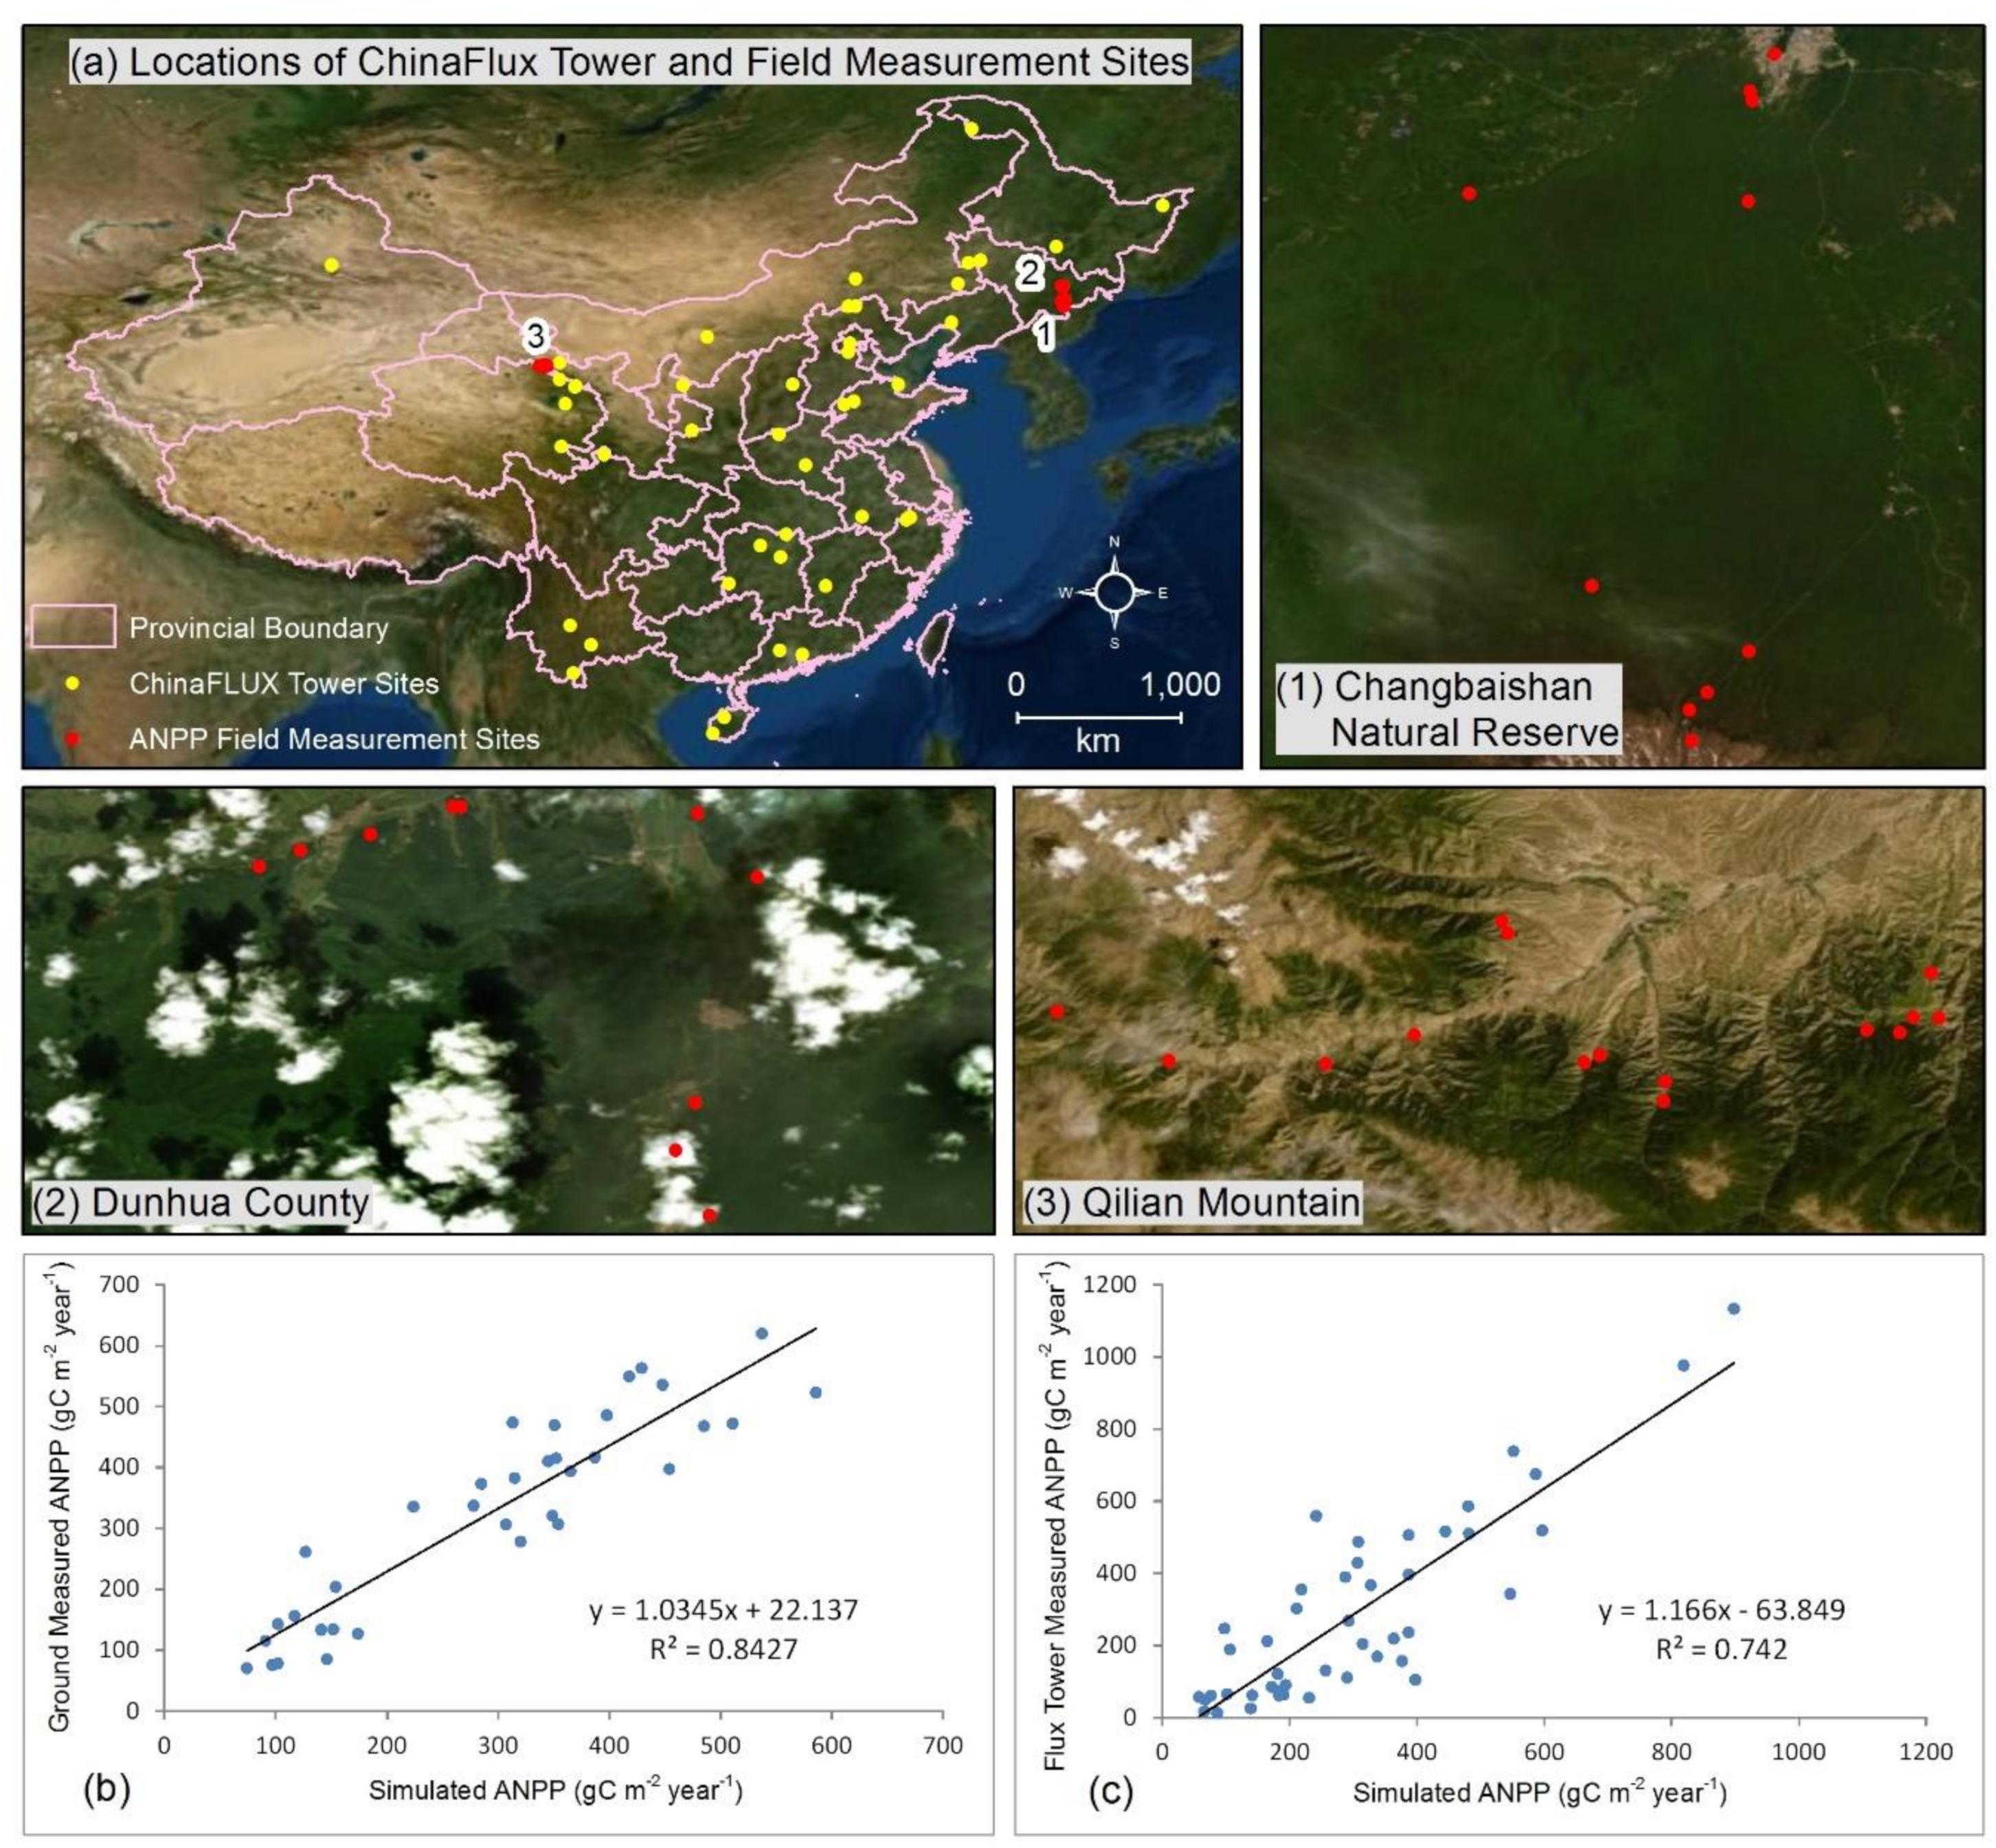
2.1. Data
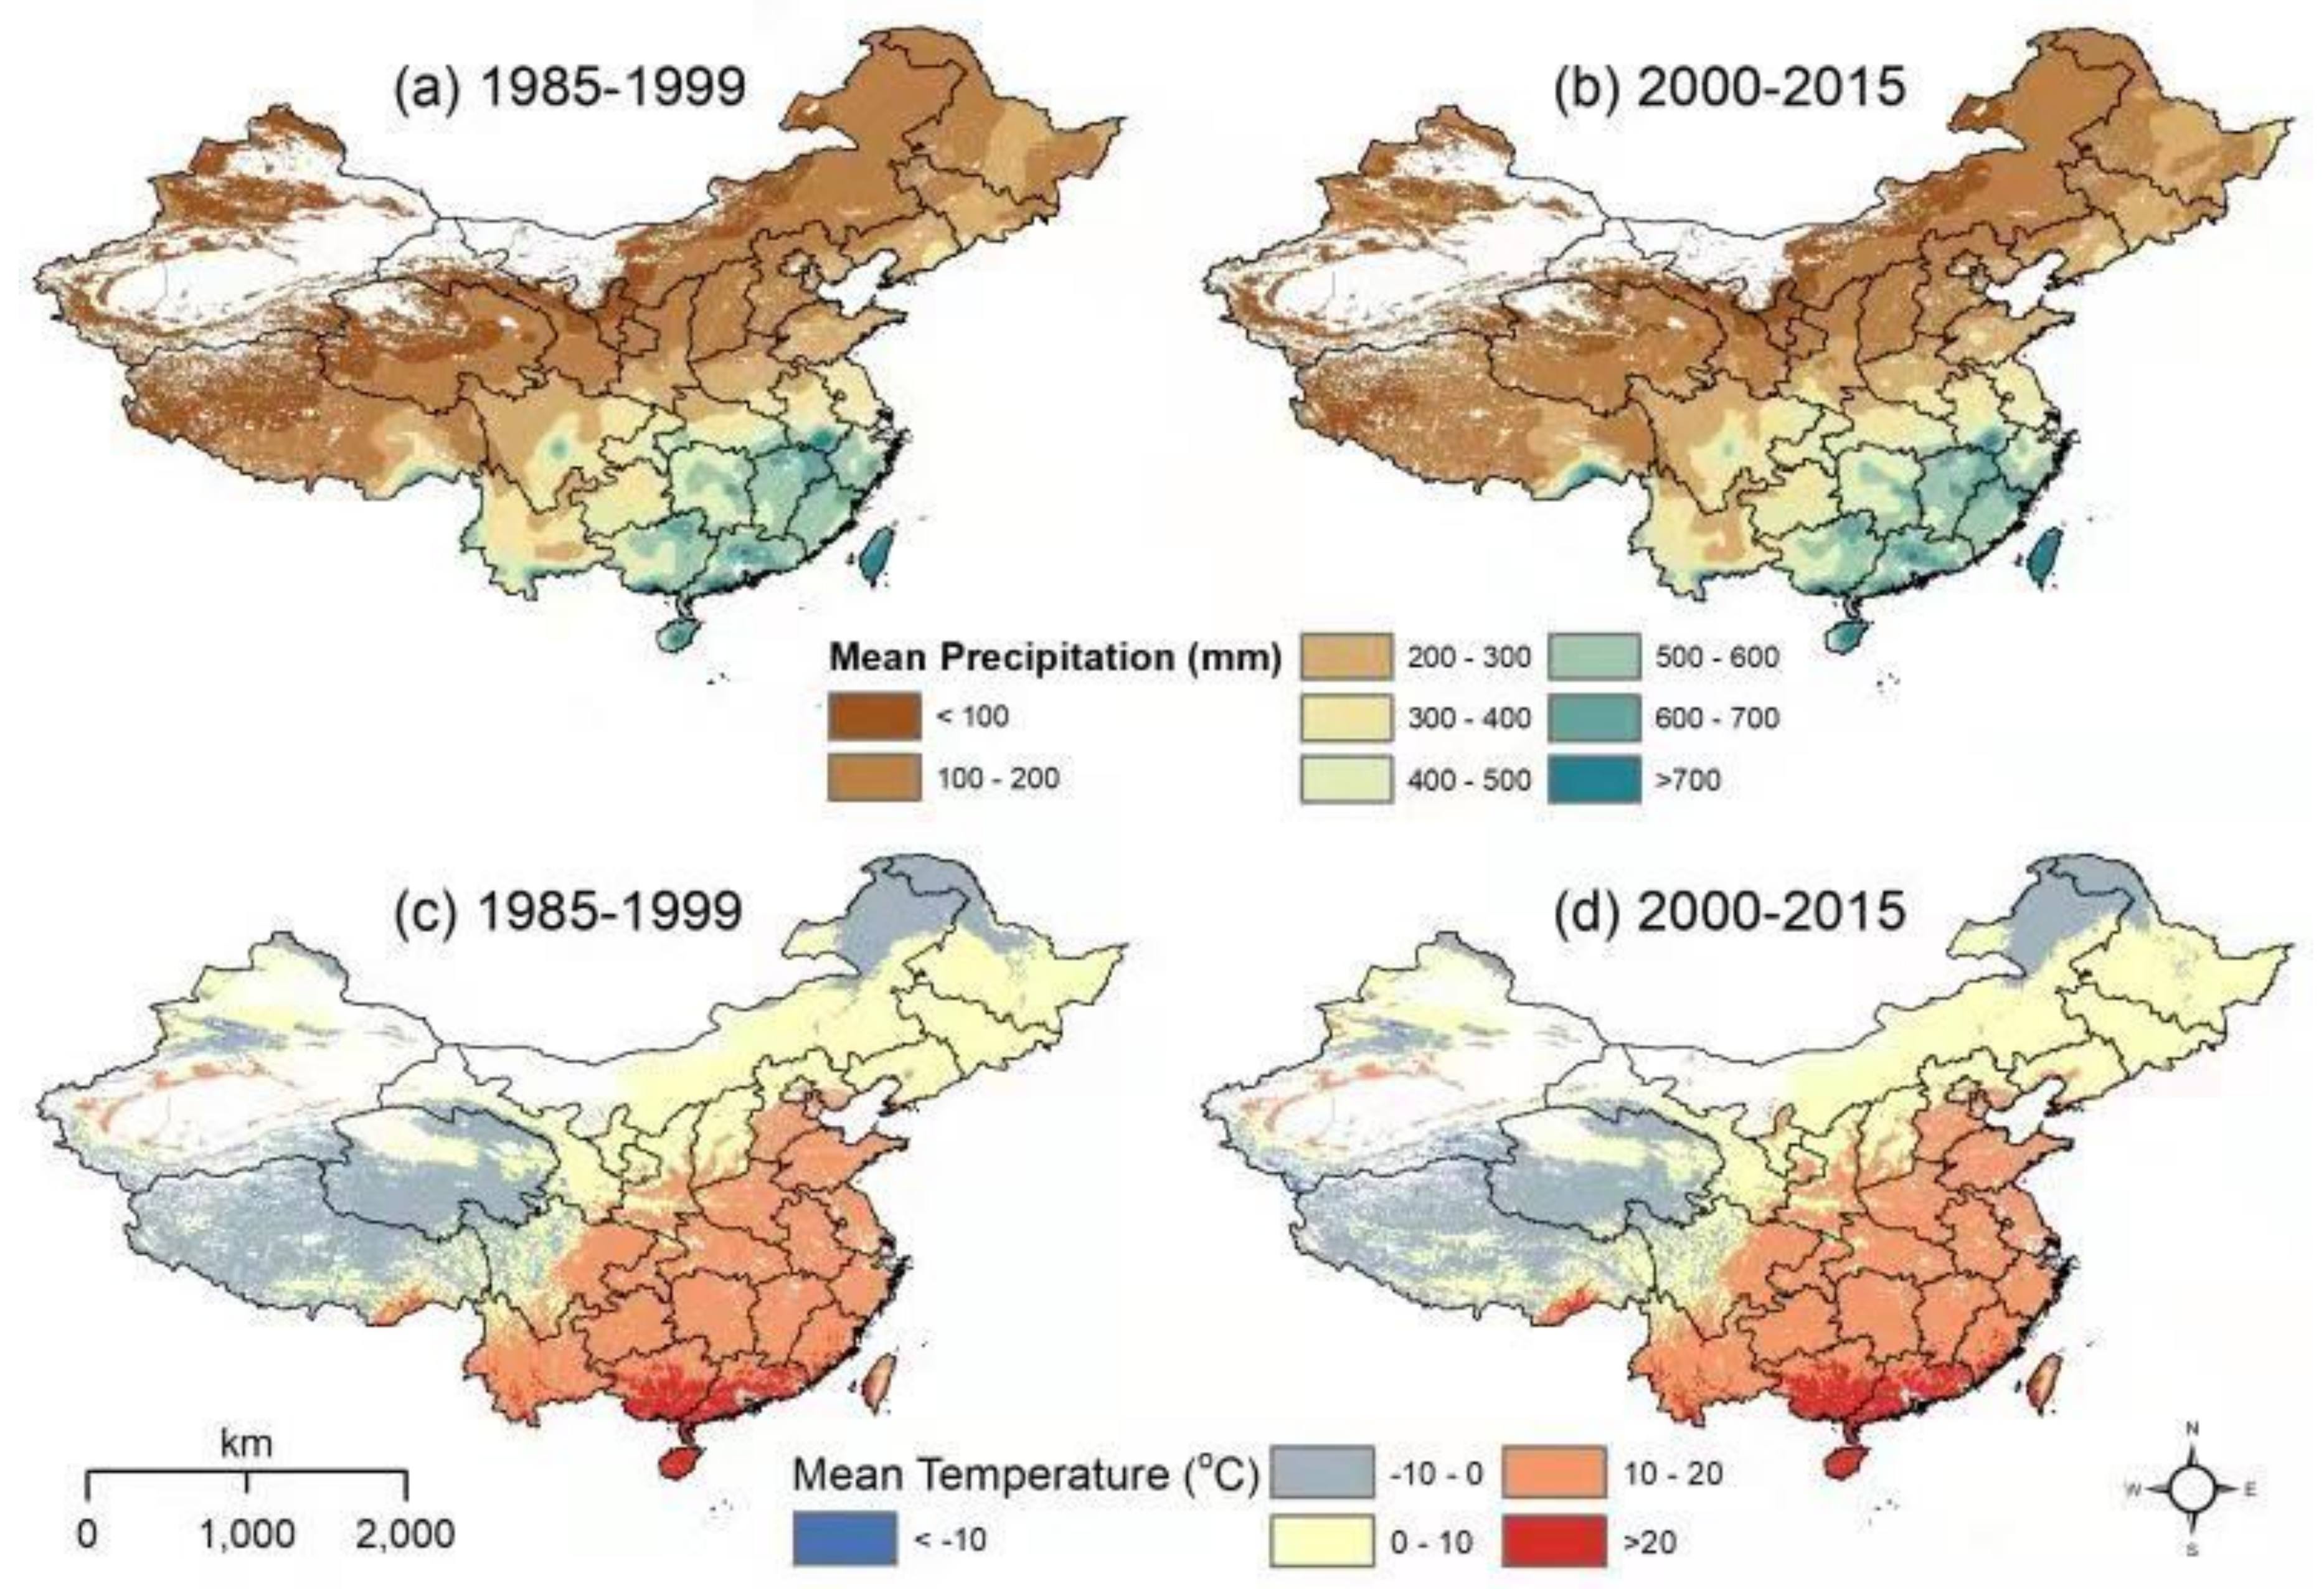
2.1.1. Climate Data
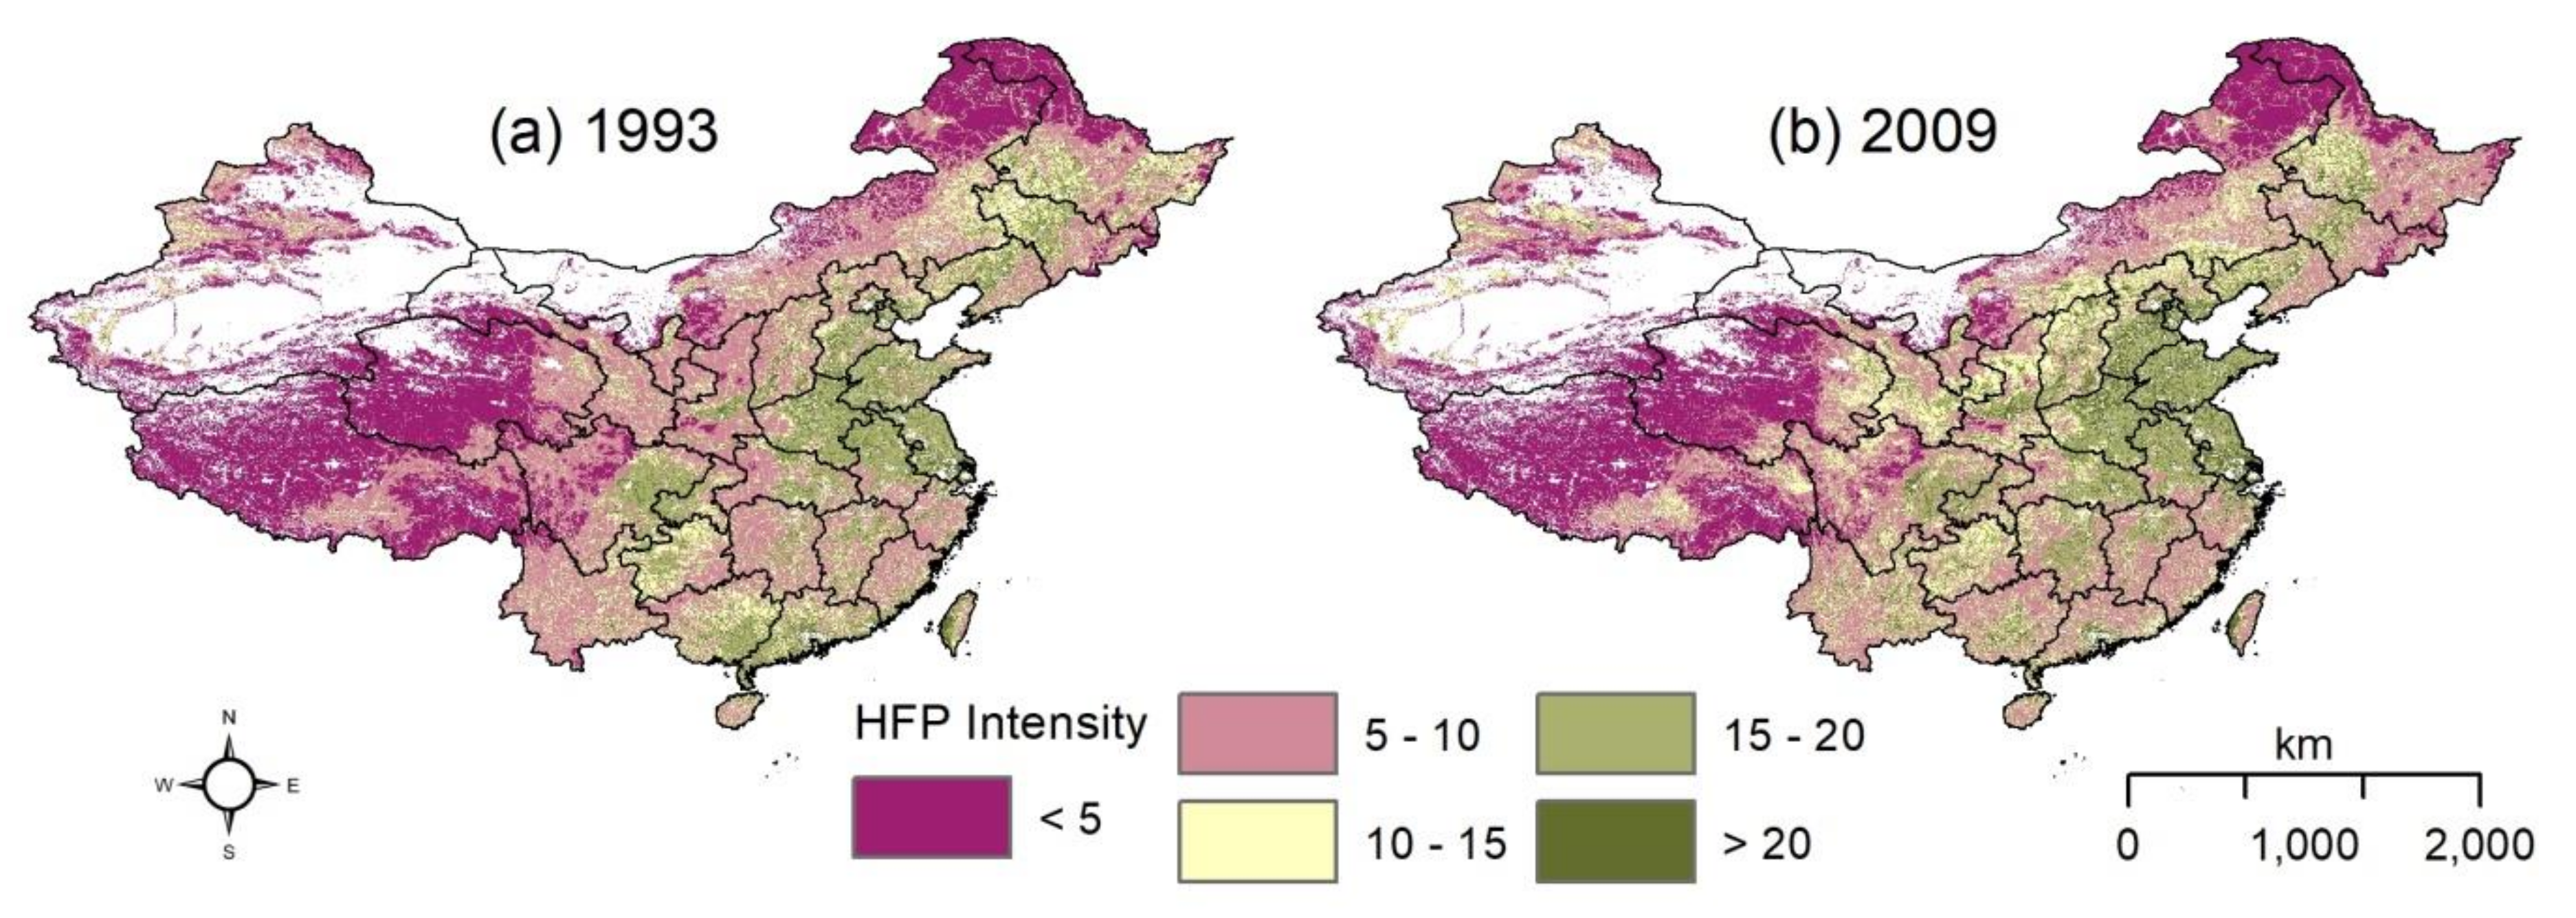
2.1.2. Human Footprint Data
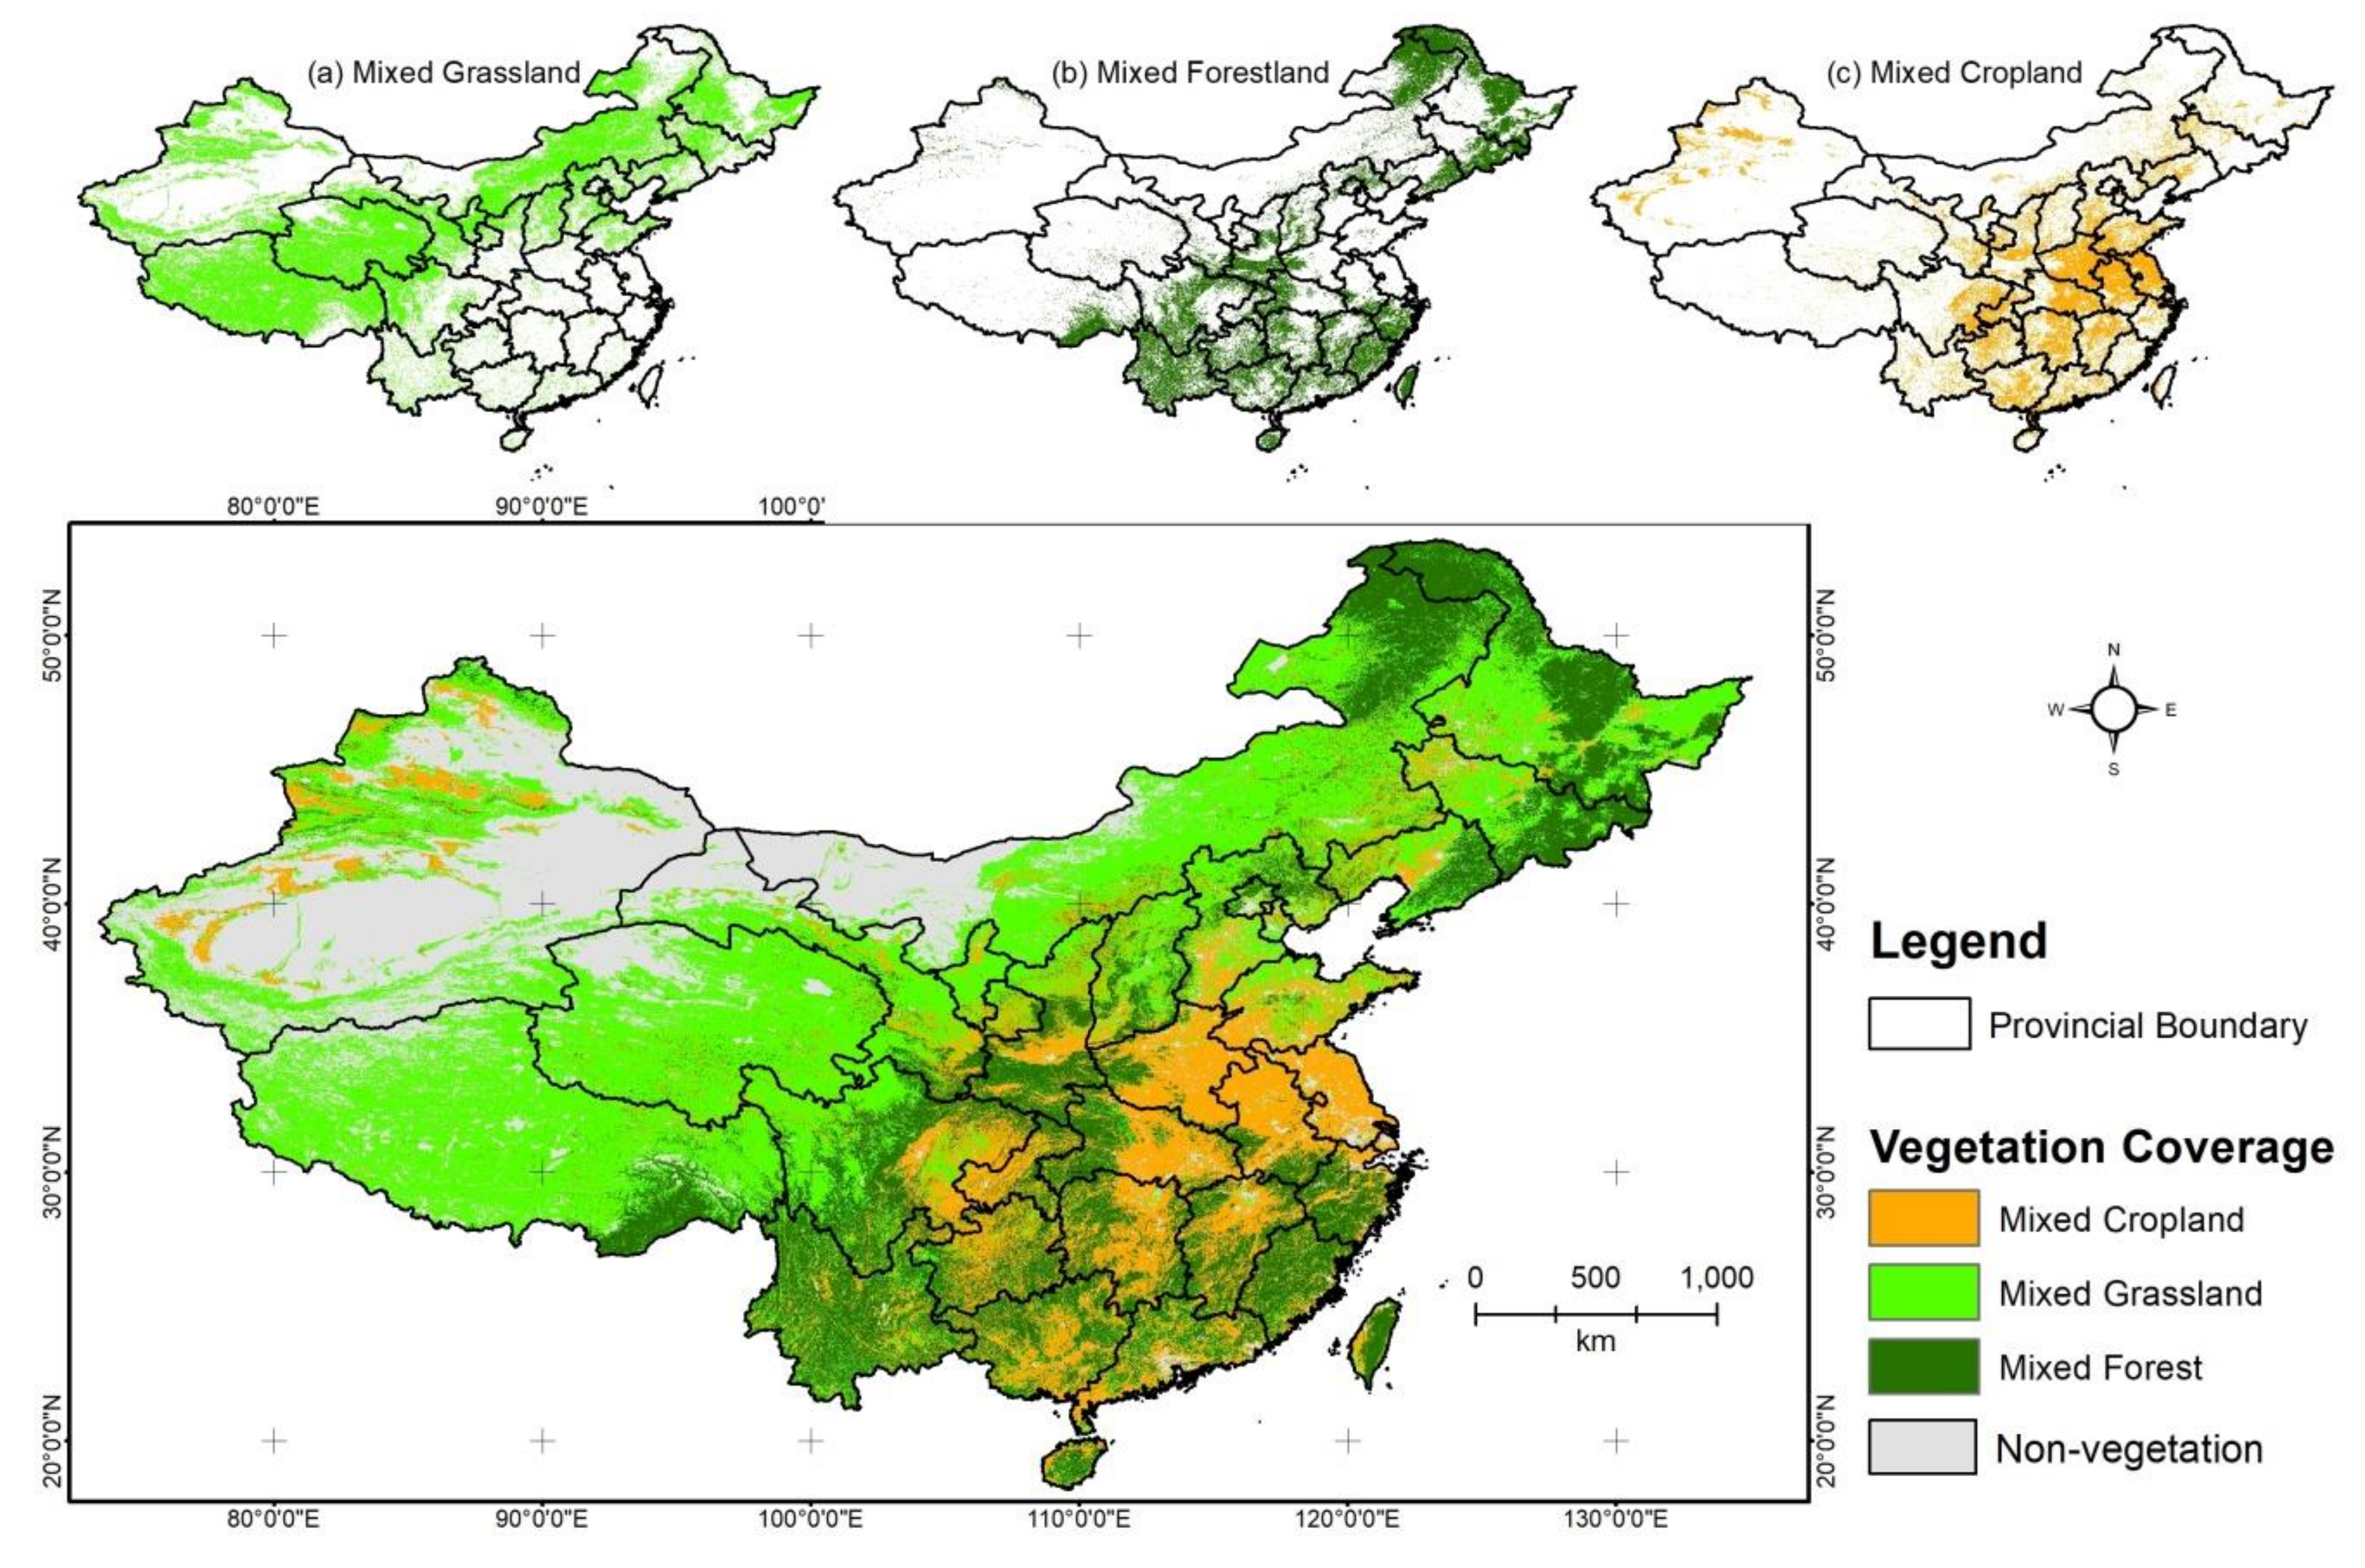
2.1.3. Vegetation Cover Data
2.1.4. Net Primary Productivity (NPP) Data
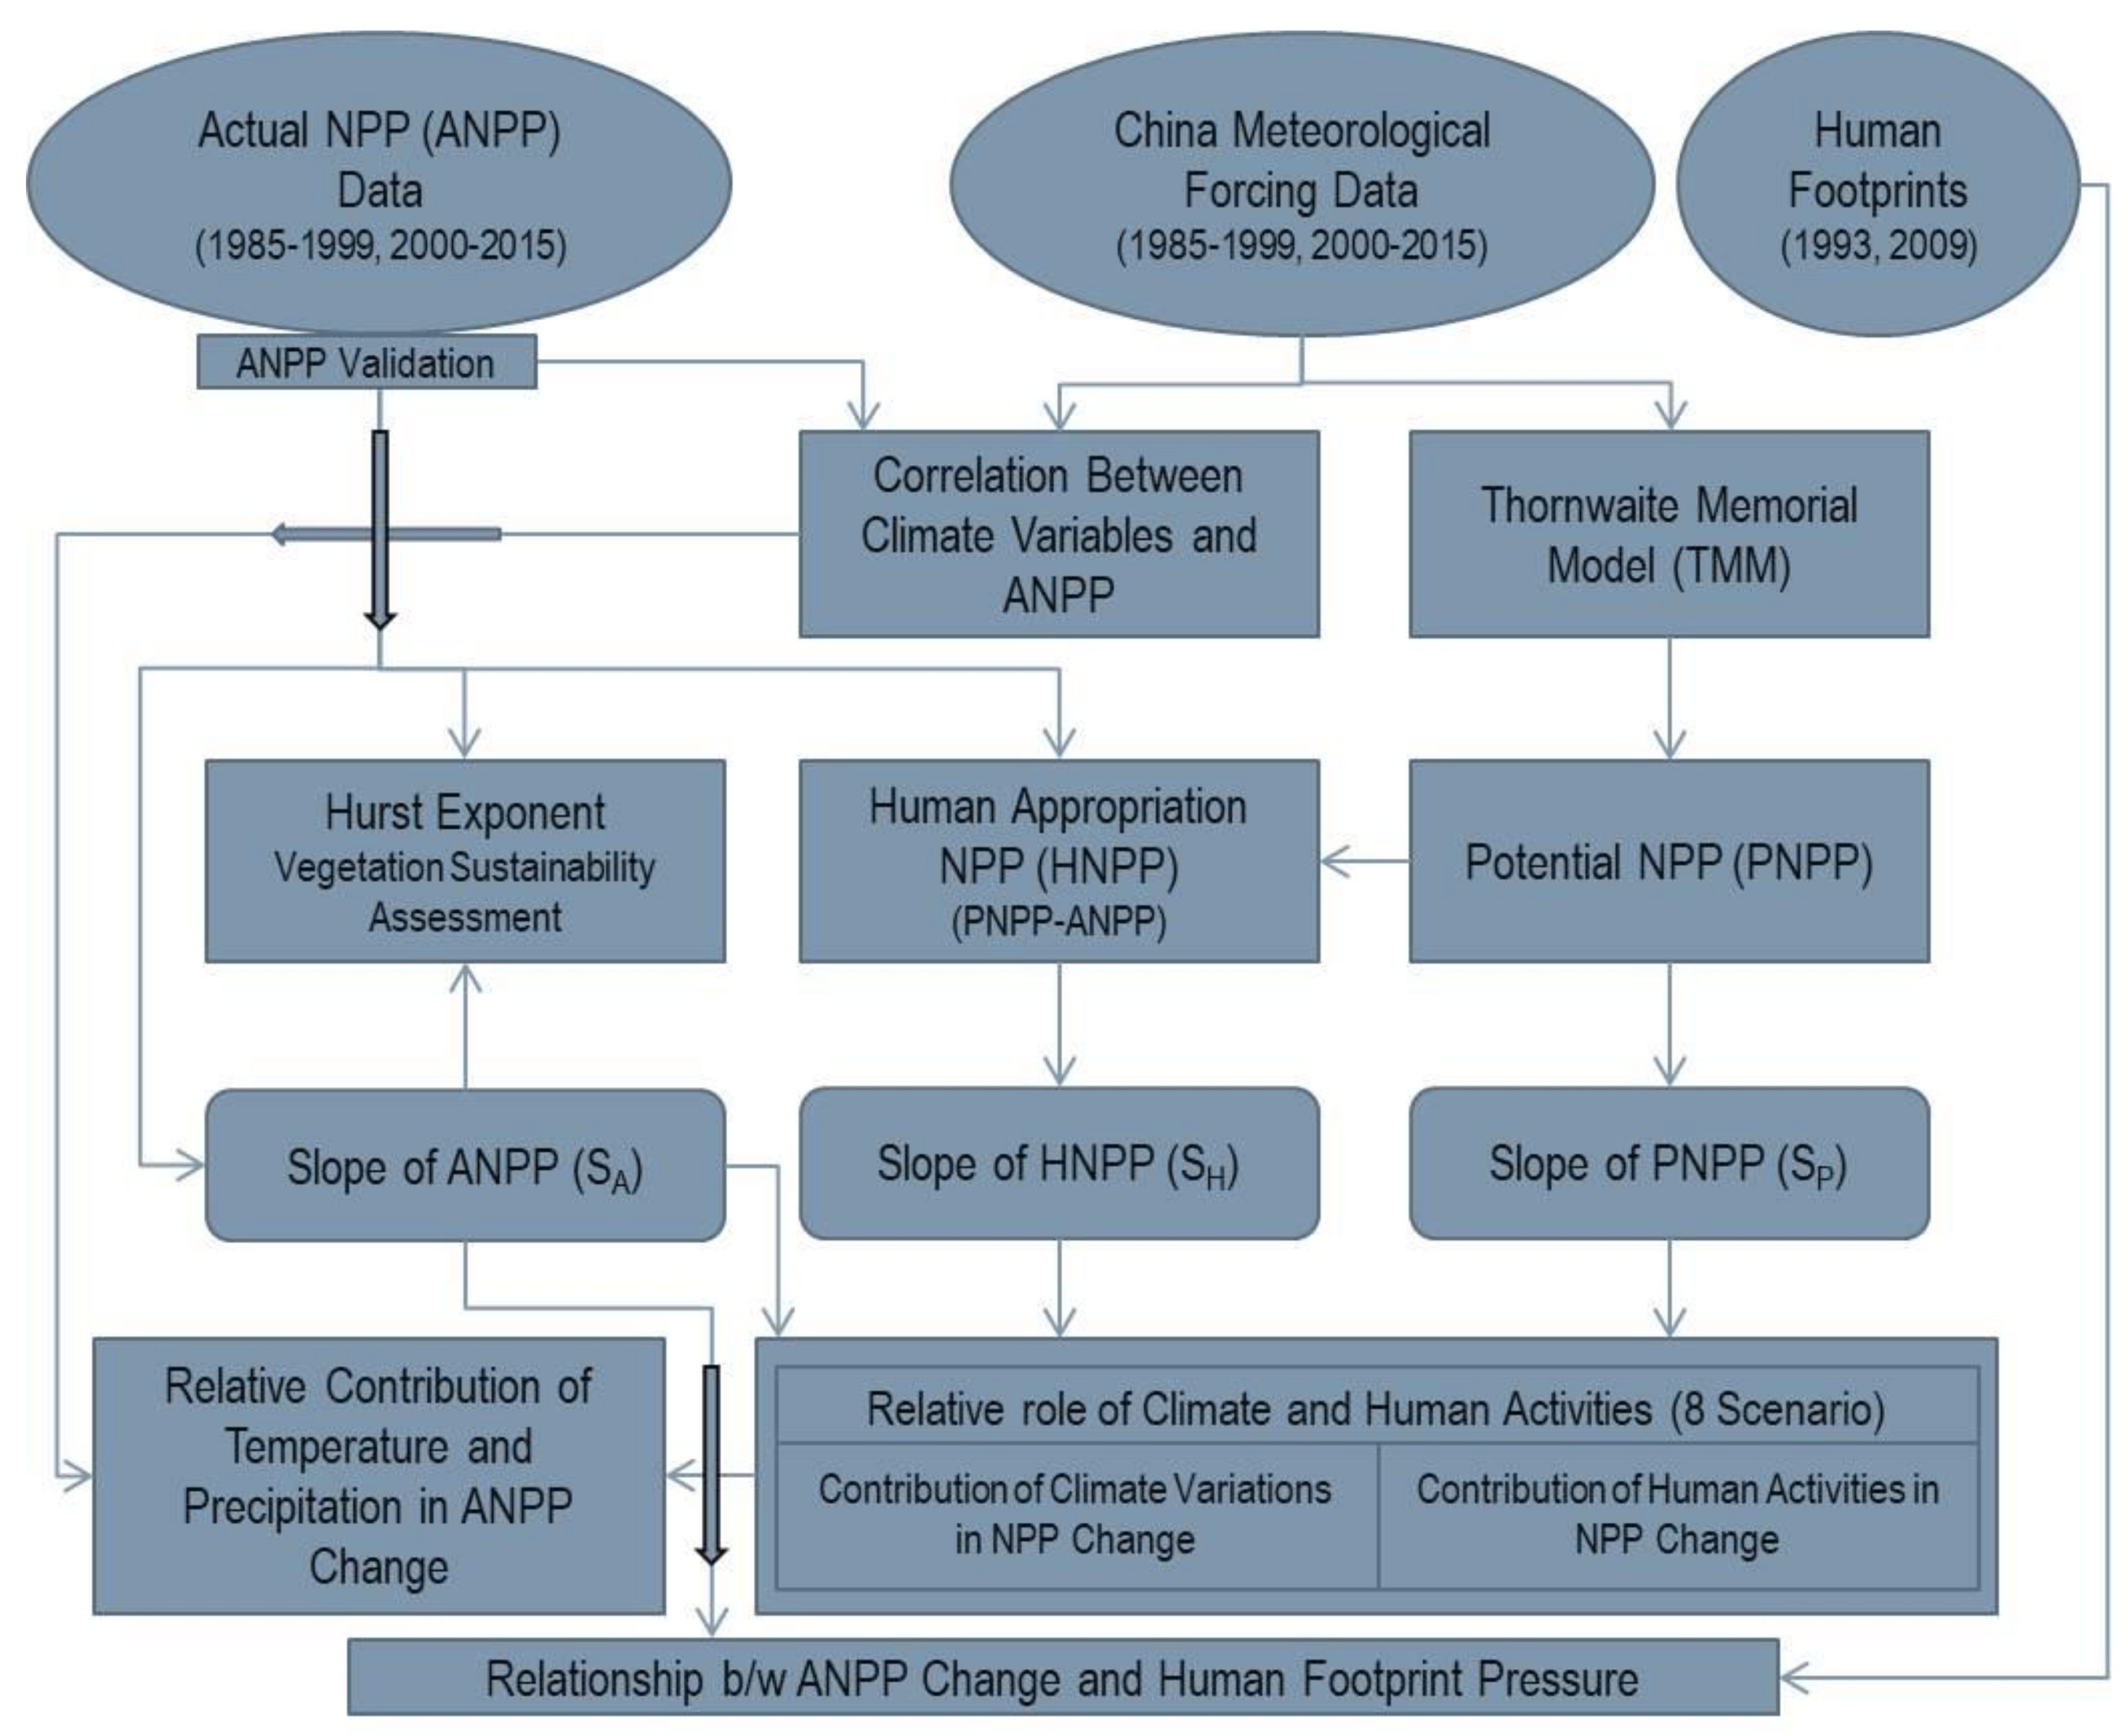
2.2. Methodological Framework
2.2.1. PNPP and HNPP Calculation
2.2.2. Slopes of Climate Variables and NPP and Scenario Development
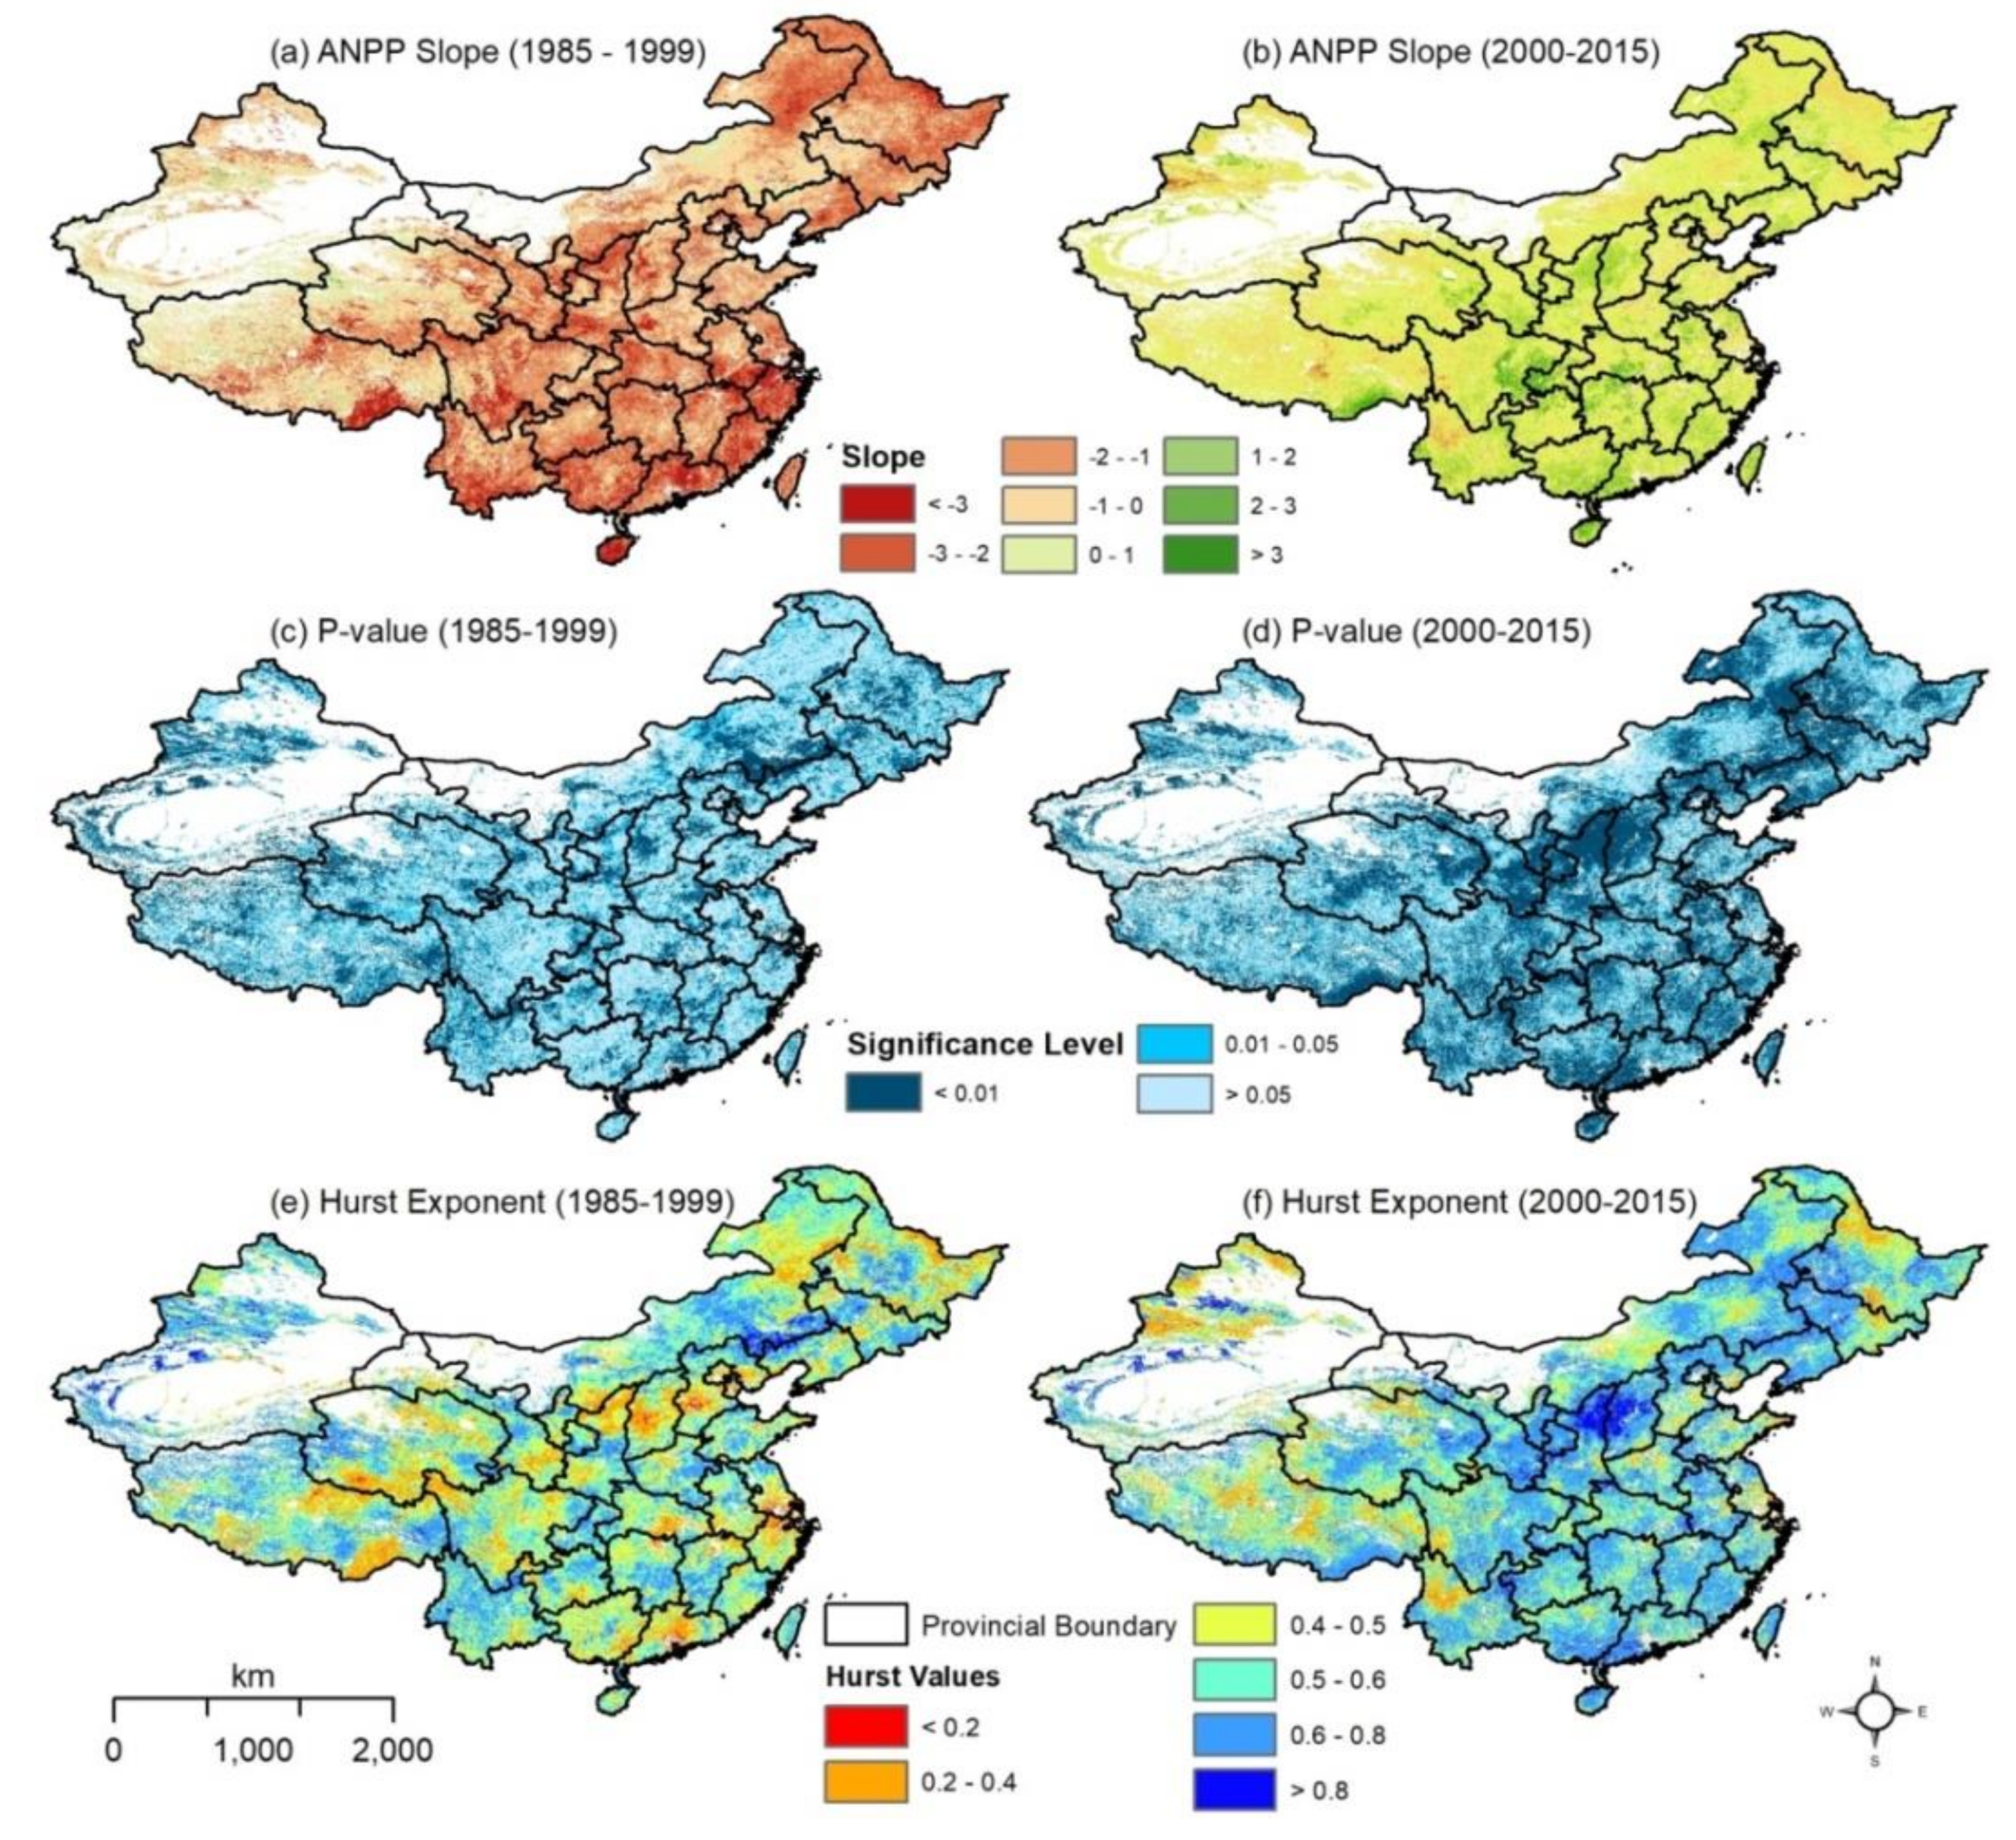
2.2.3. Hurst Exponent
- Divide the time series into sub-series , and for each sub-series = 1,…, τ.
- Then define the mean sequence of time series,
- Compute the cumulative deviation of each ,
- Generate the range sequence ,
- Then calculate the standard deviation sequence ,
- At the end, rescale the calculated range,where, H is the Hurst exponent, and can be calculated by fitting the above equation as follows:
2.2.4. Spatial Correlation Between Vegetation Productivity and Climate Factors
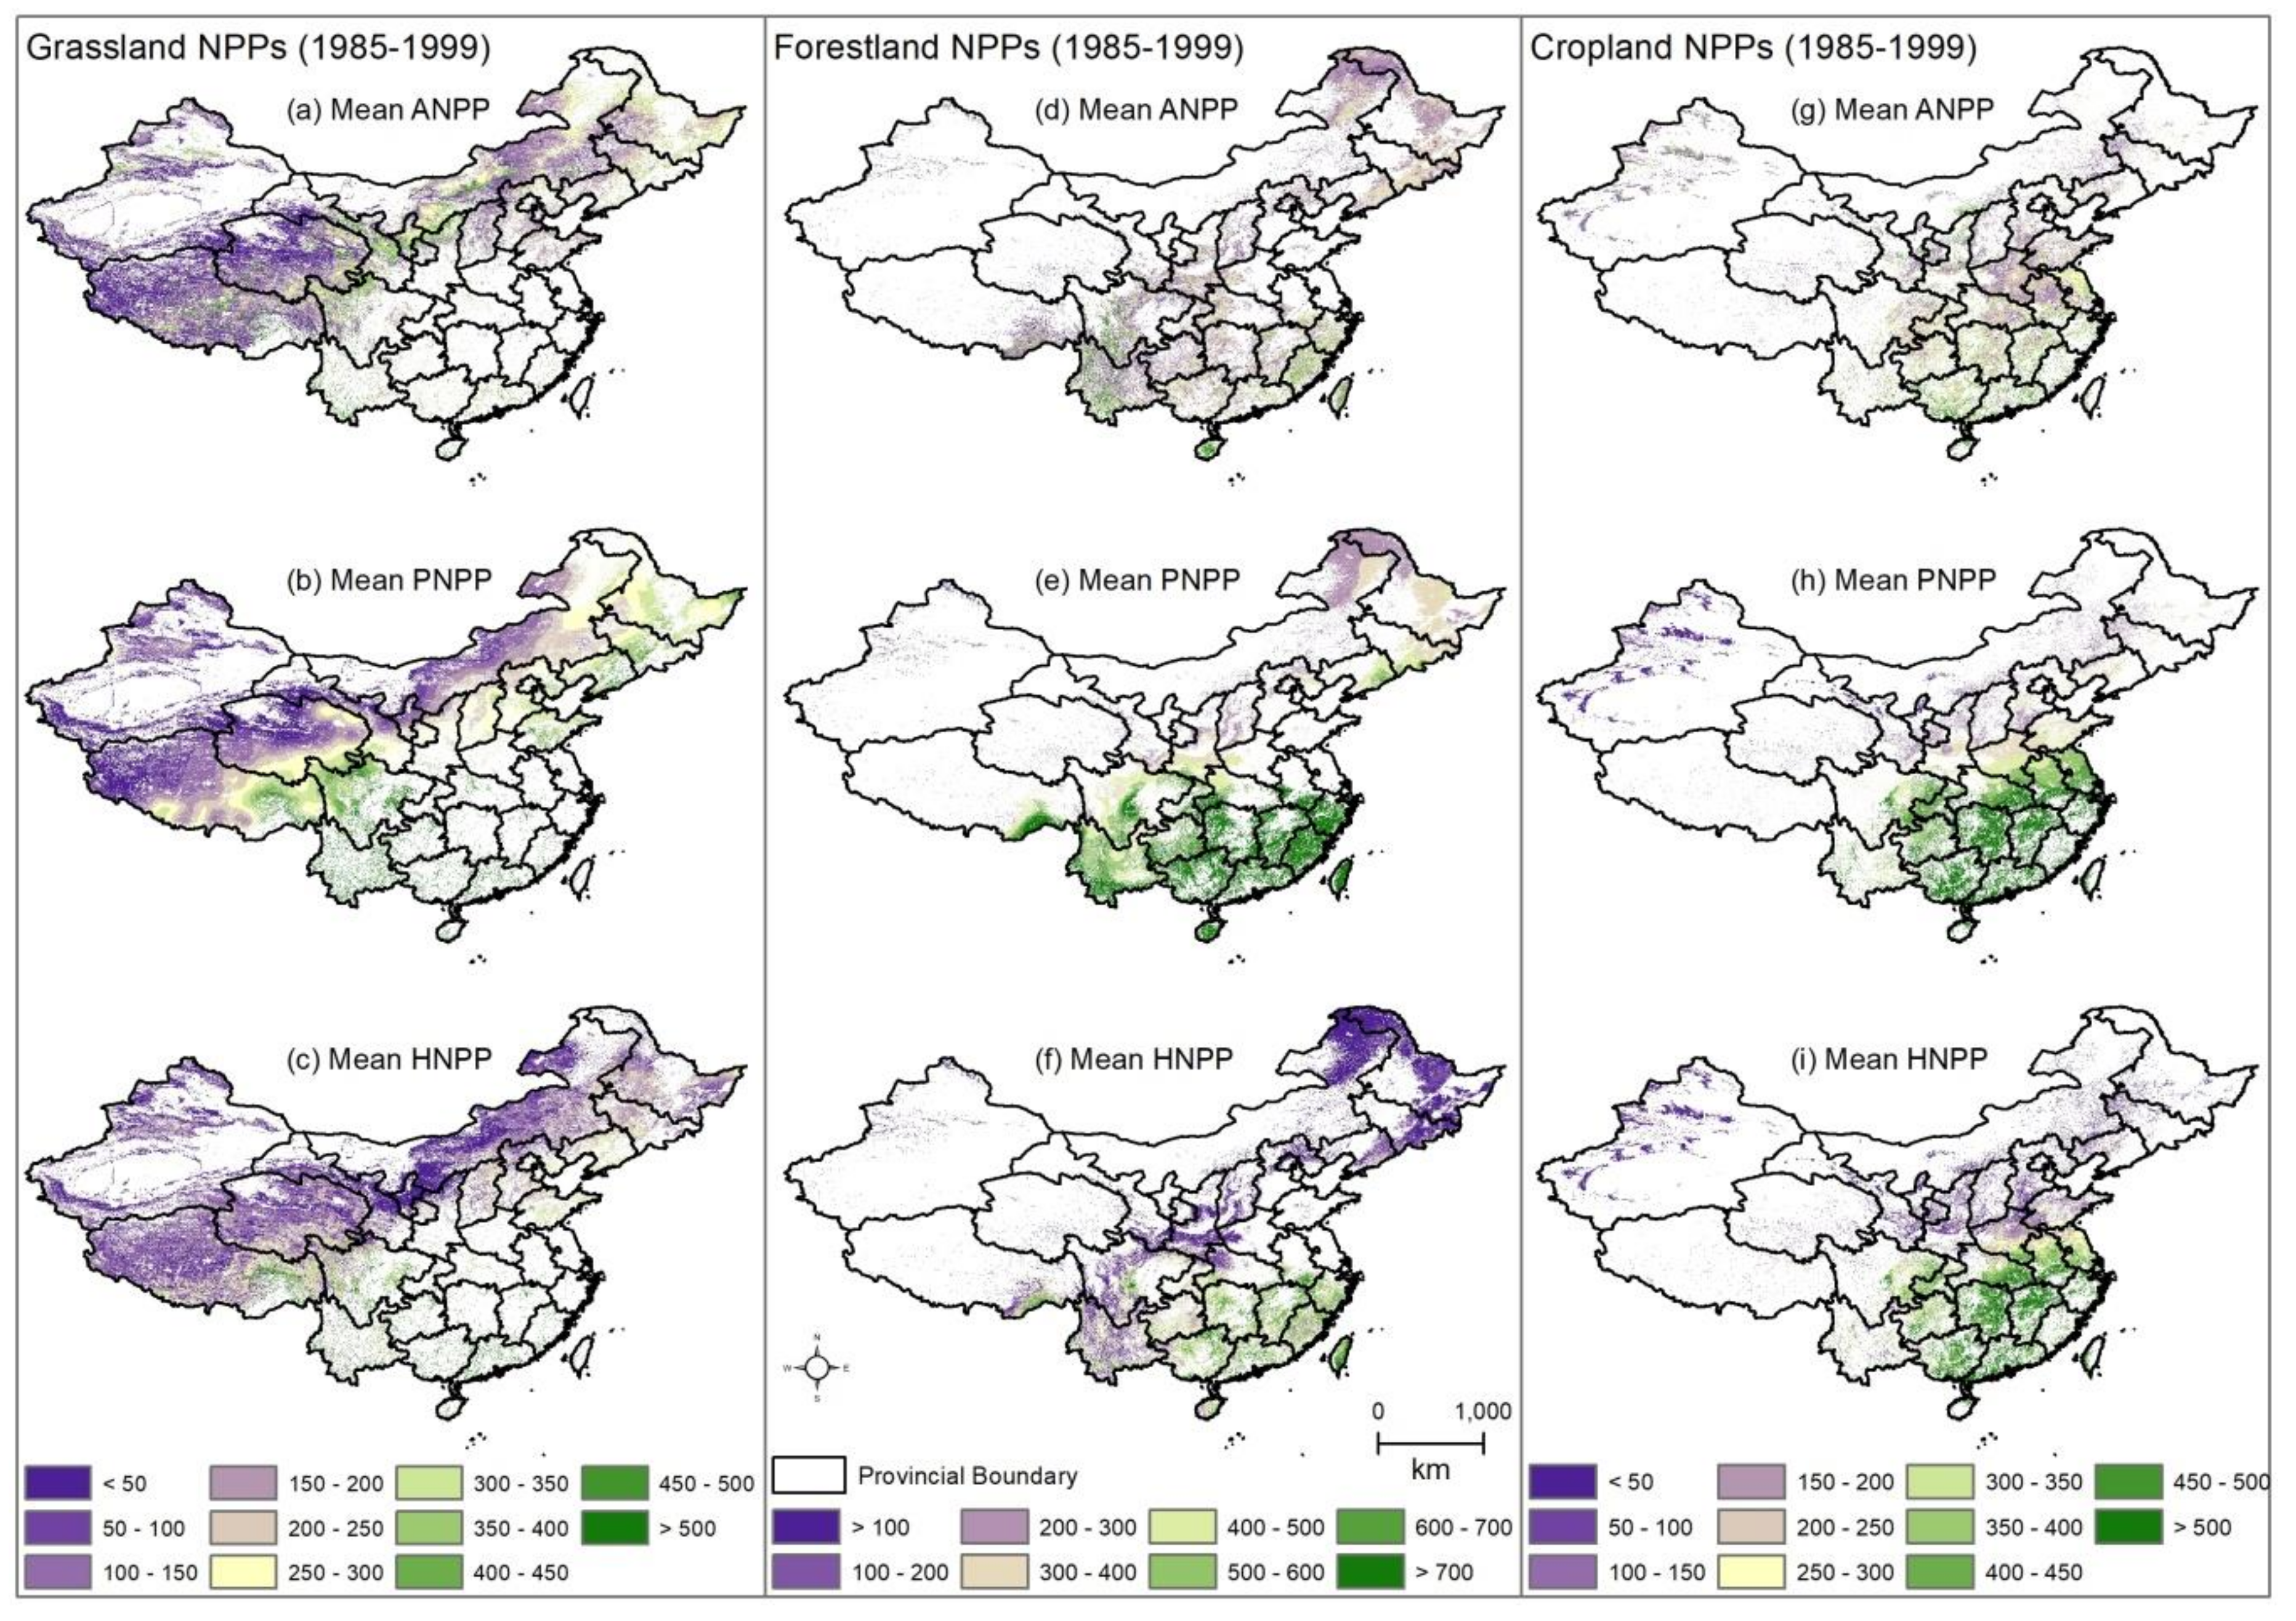
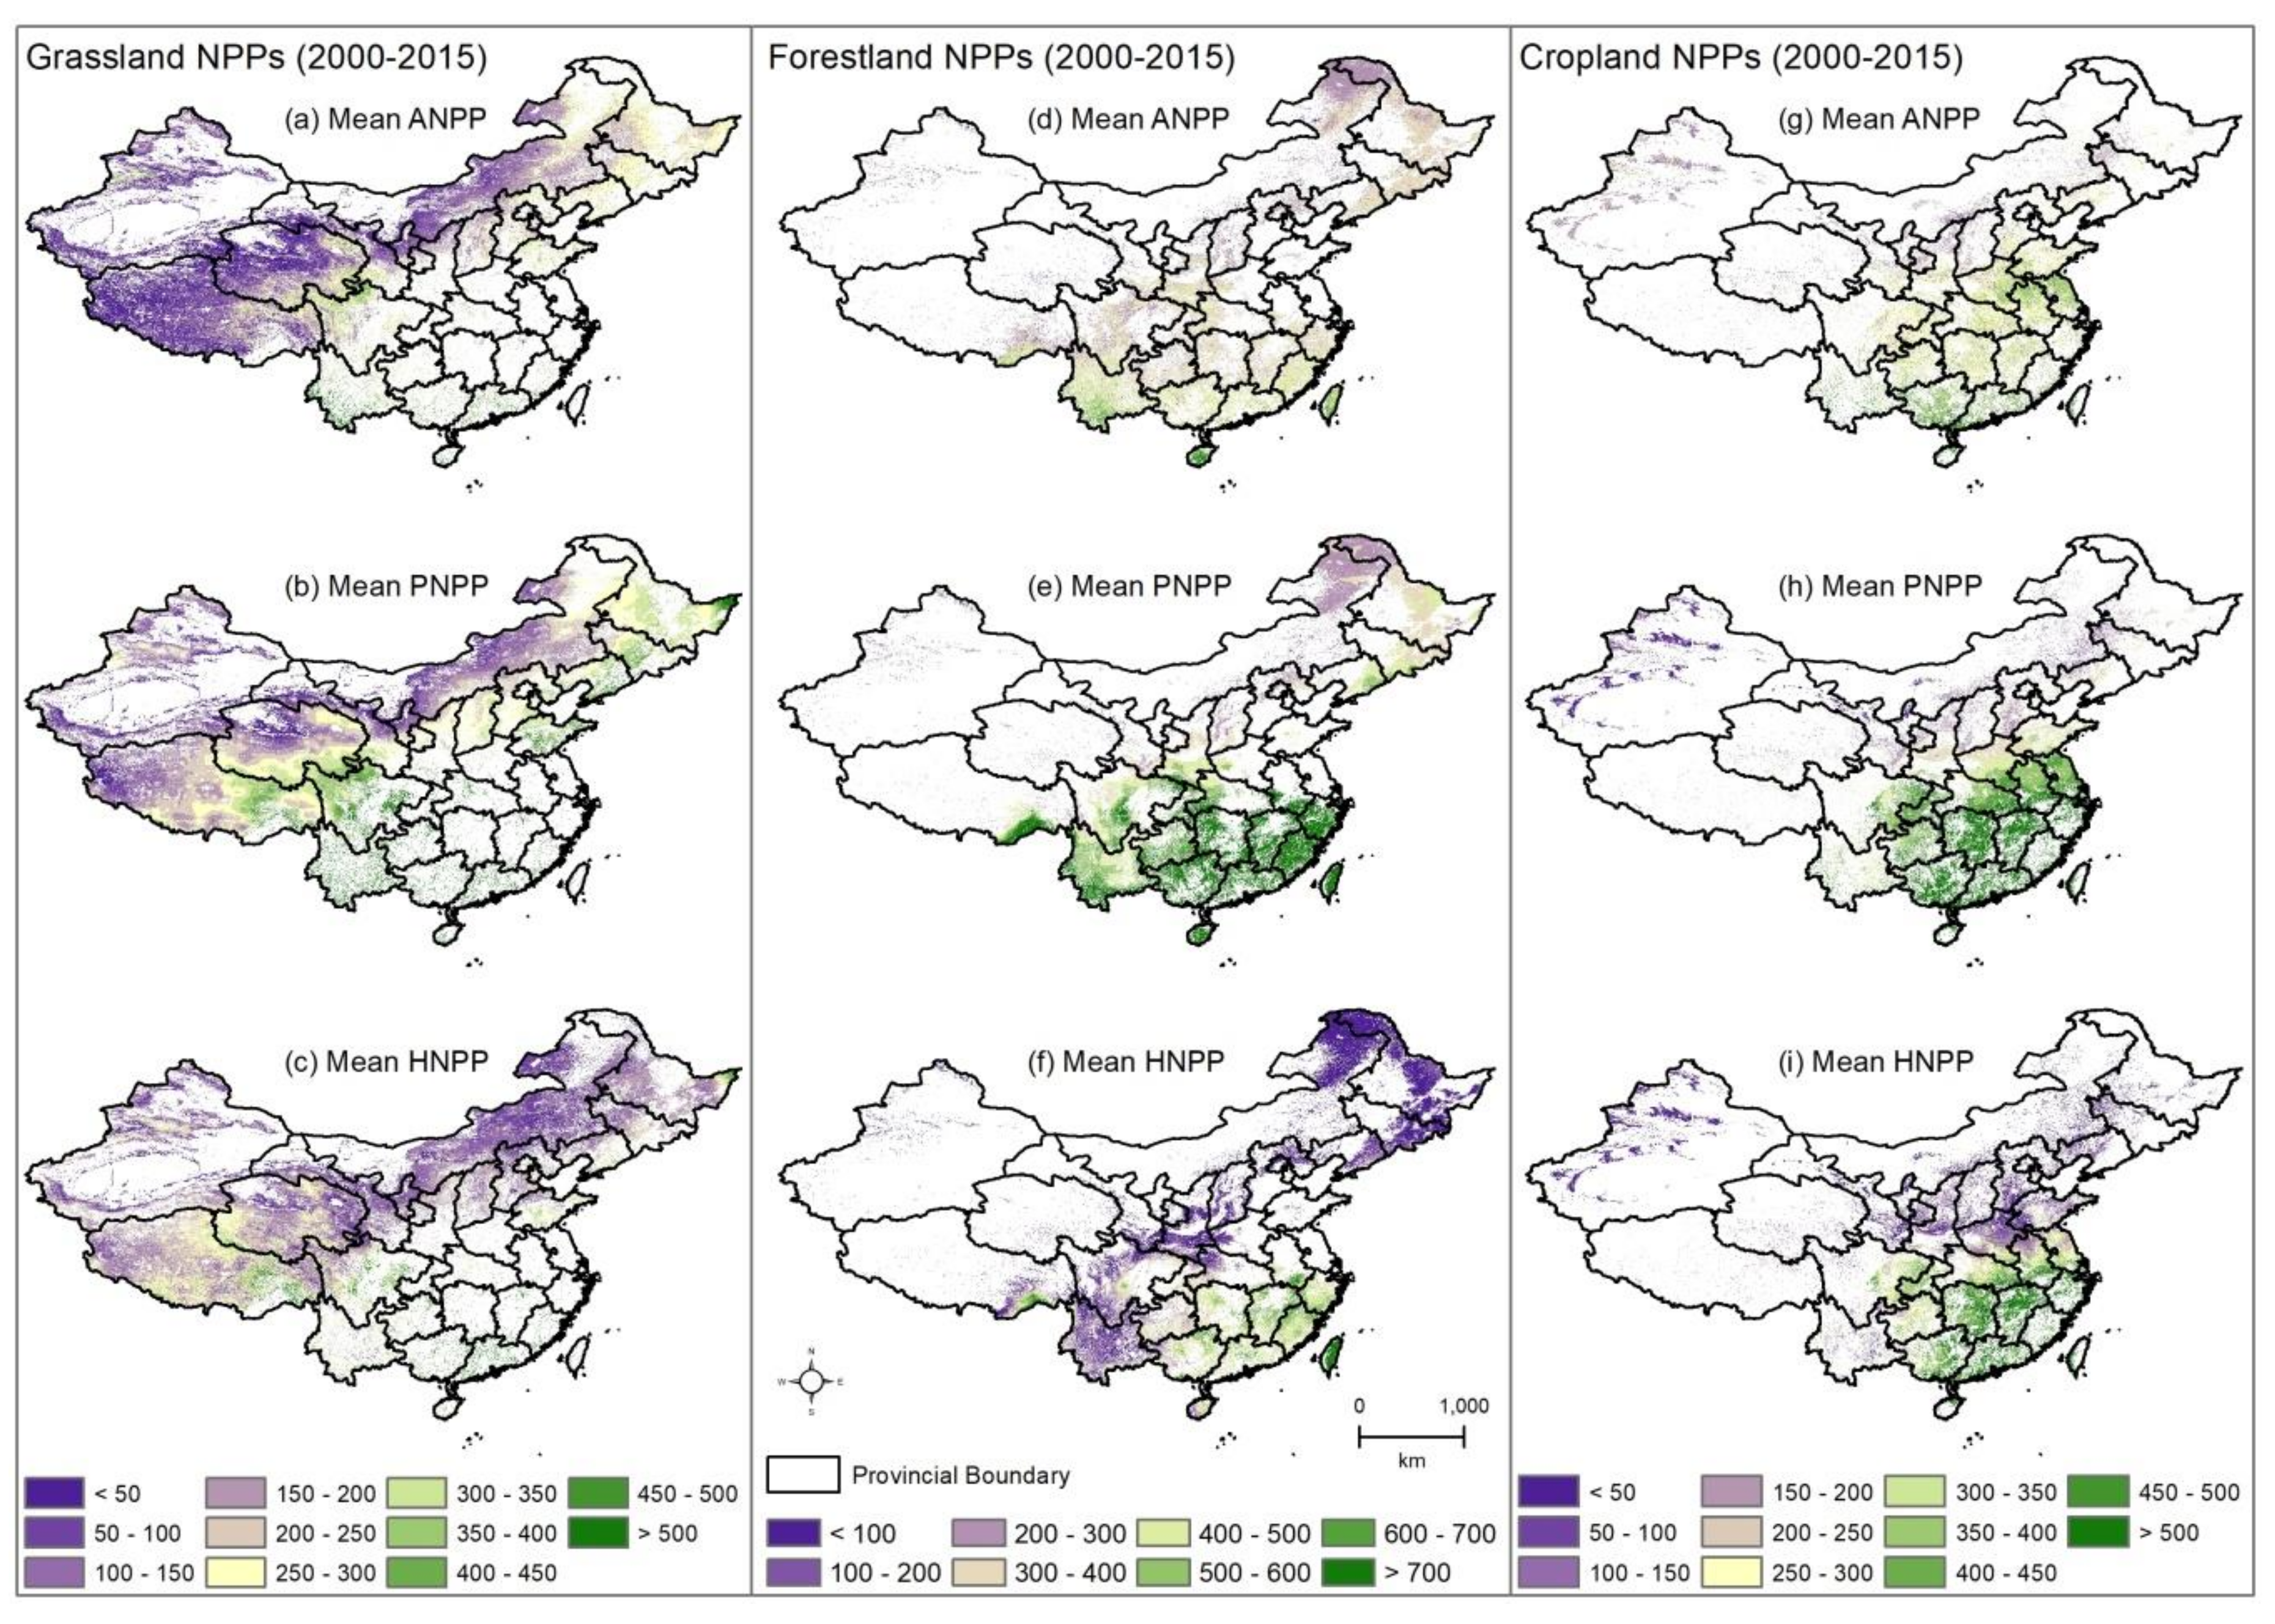
3. Results
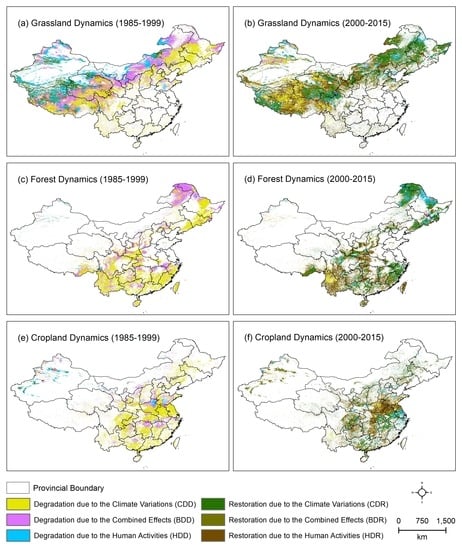
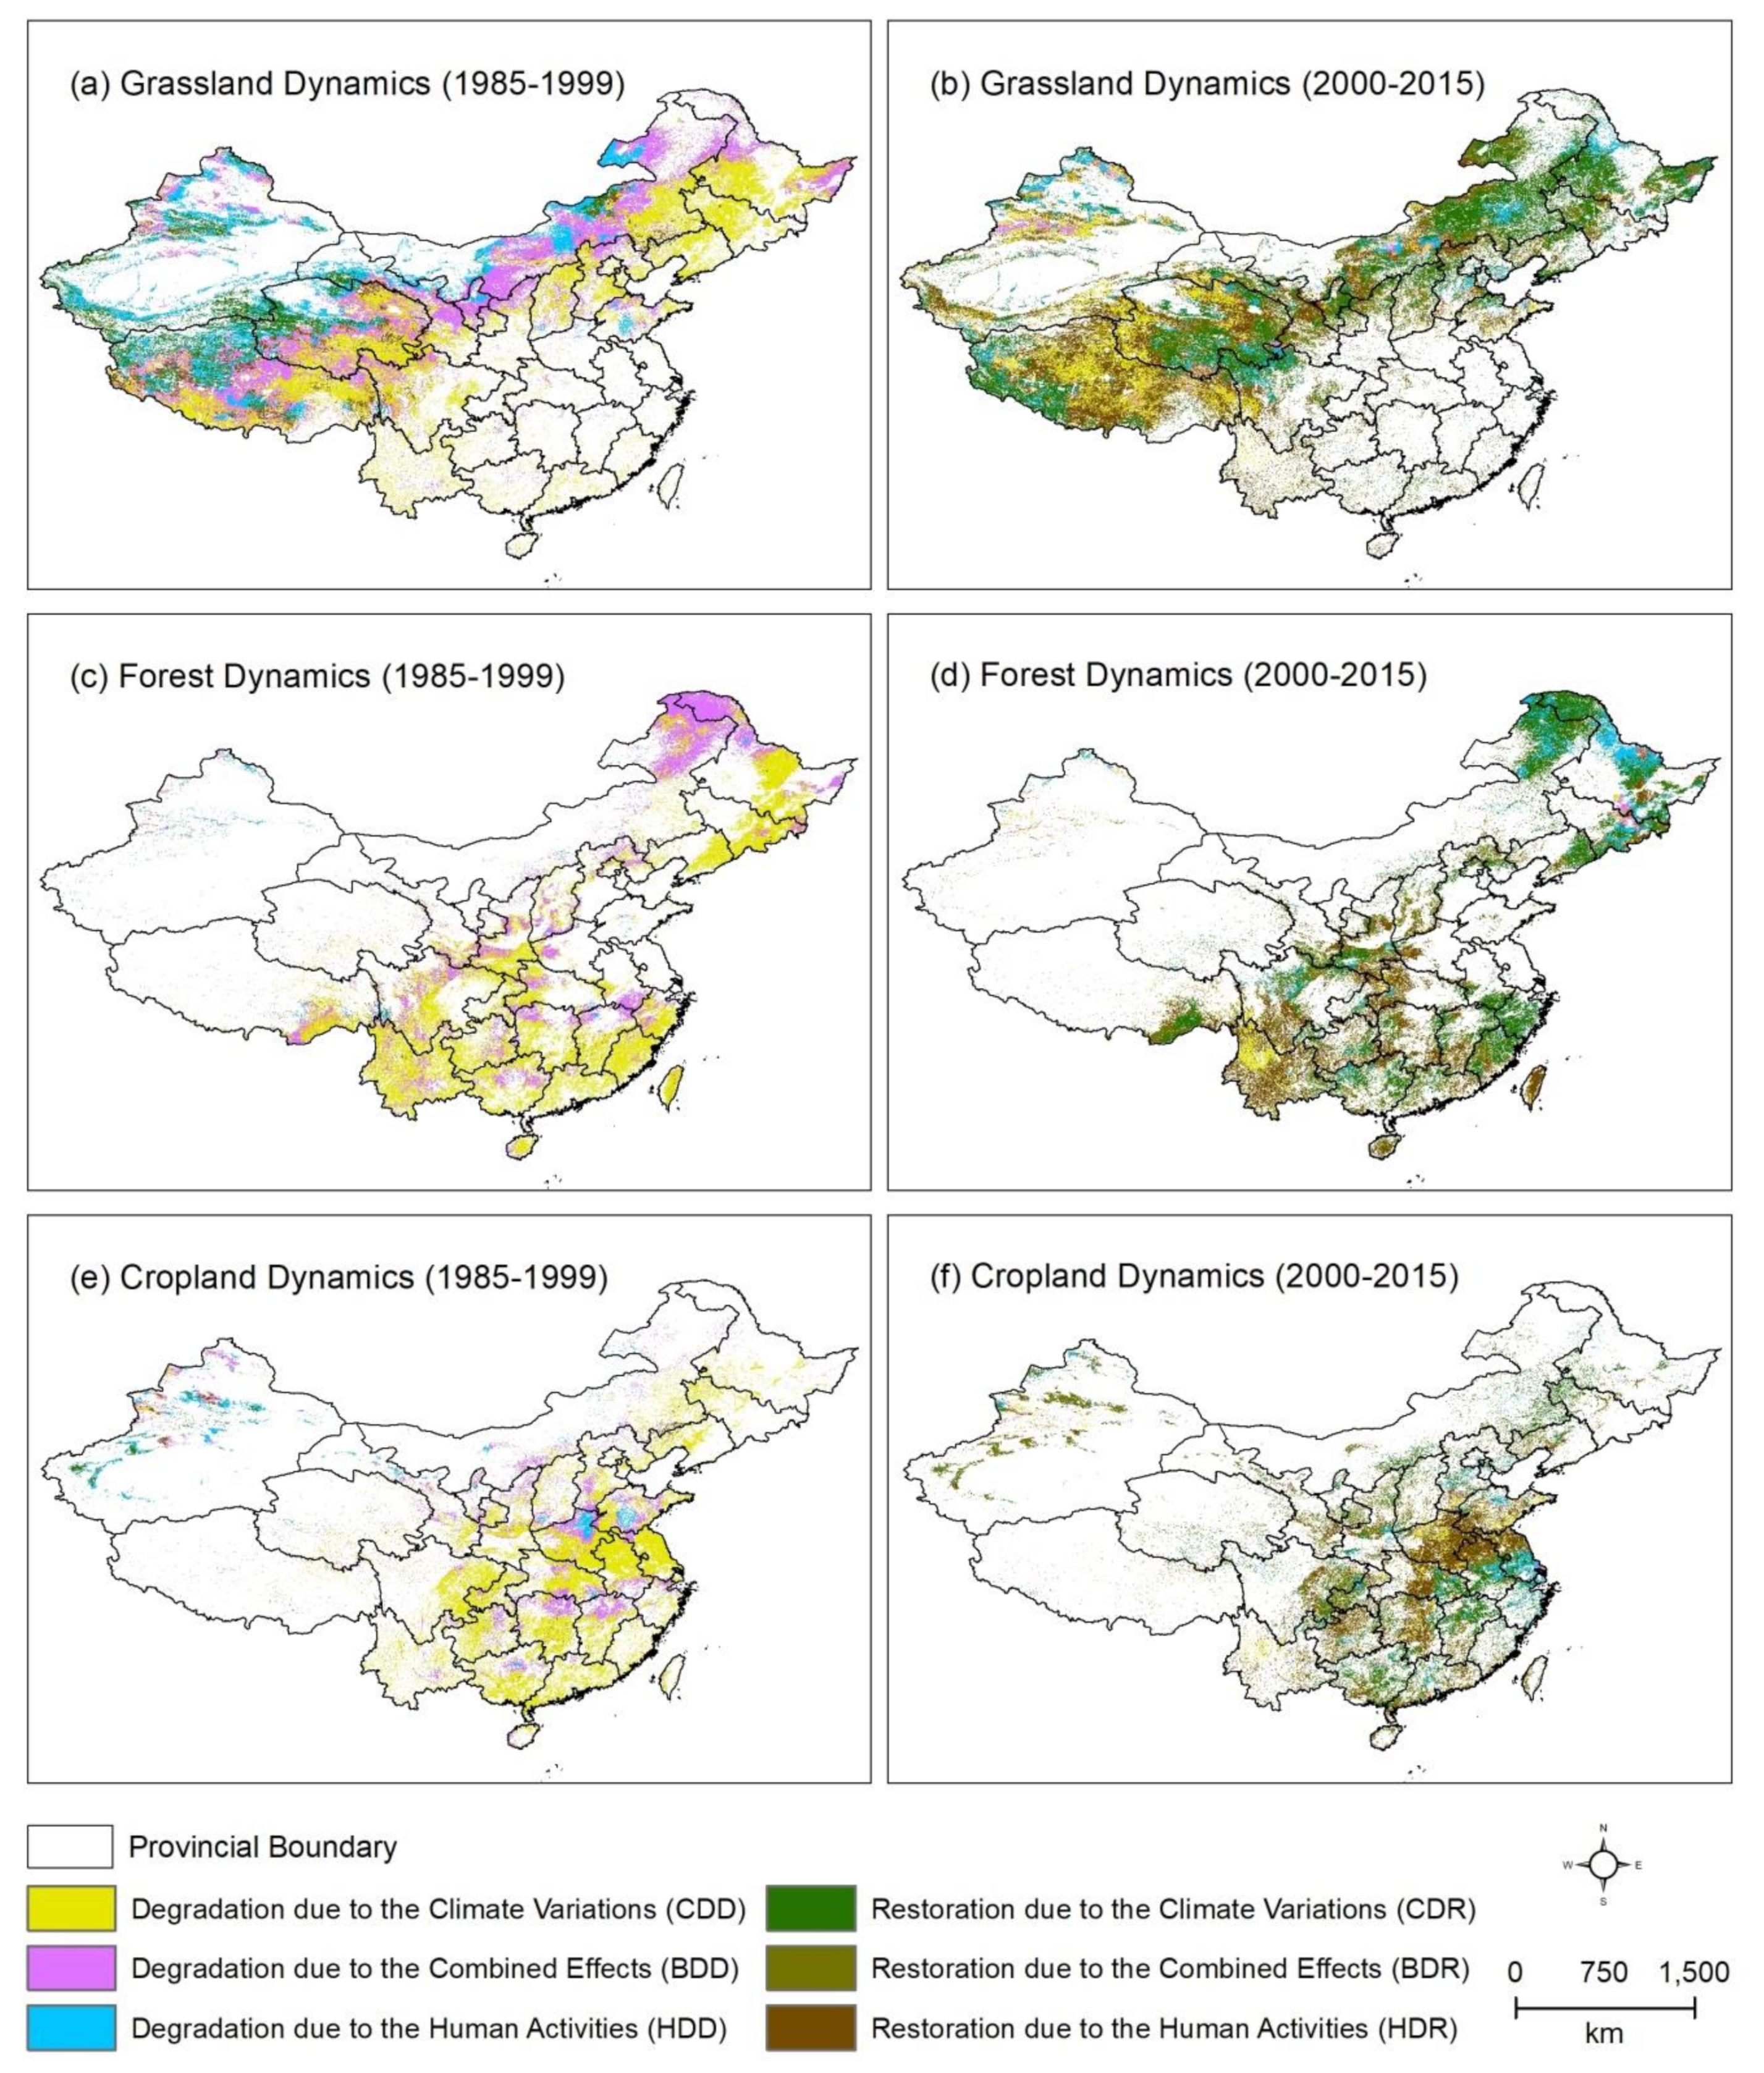
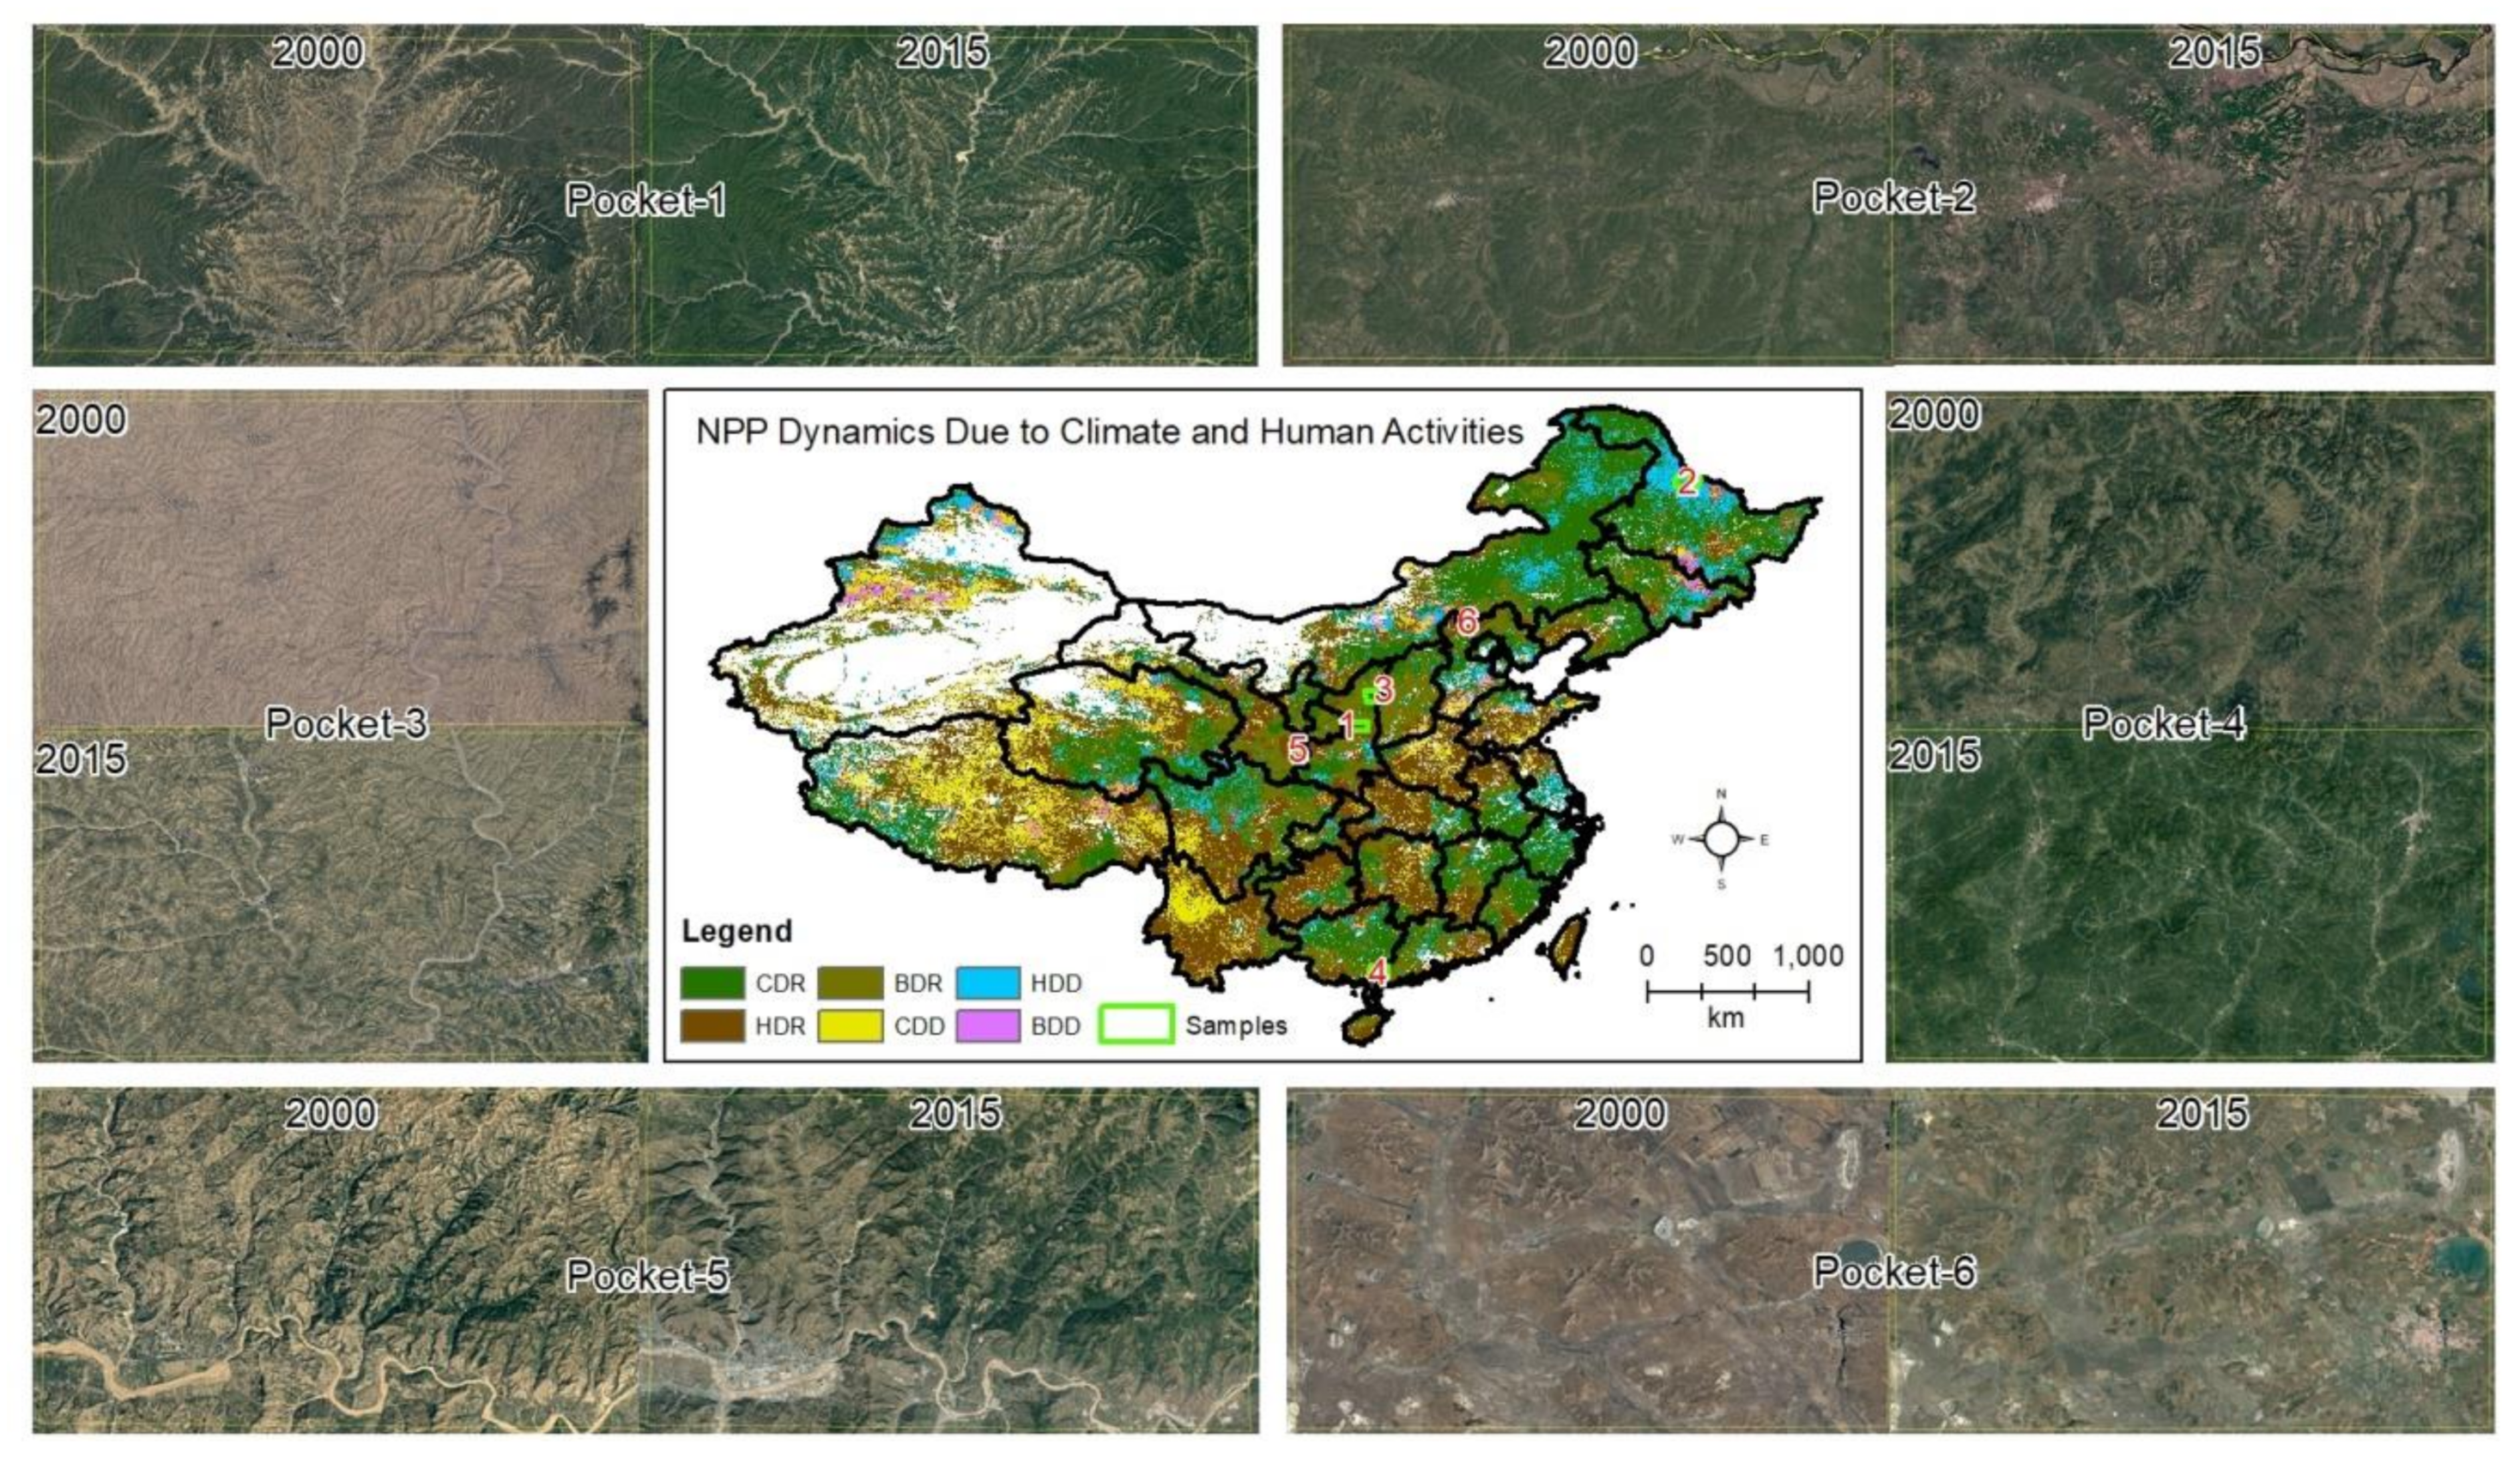
3.1. Drivers of Vegetation Dynamics
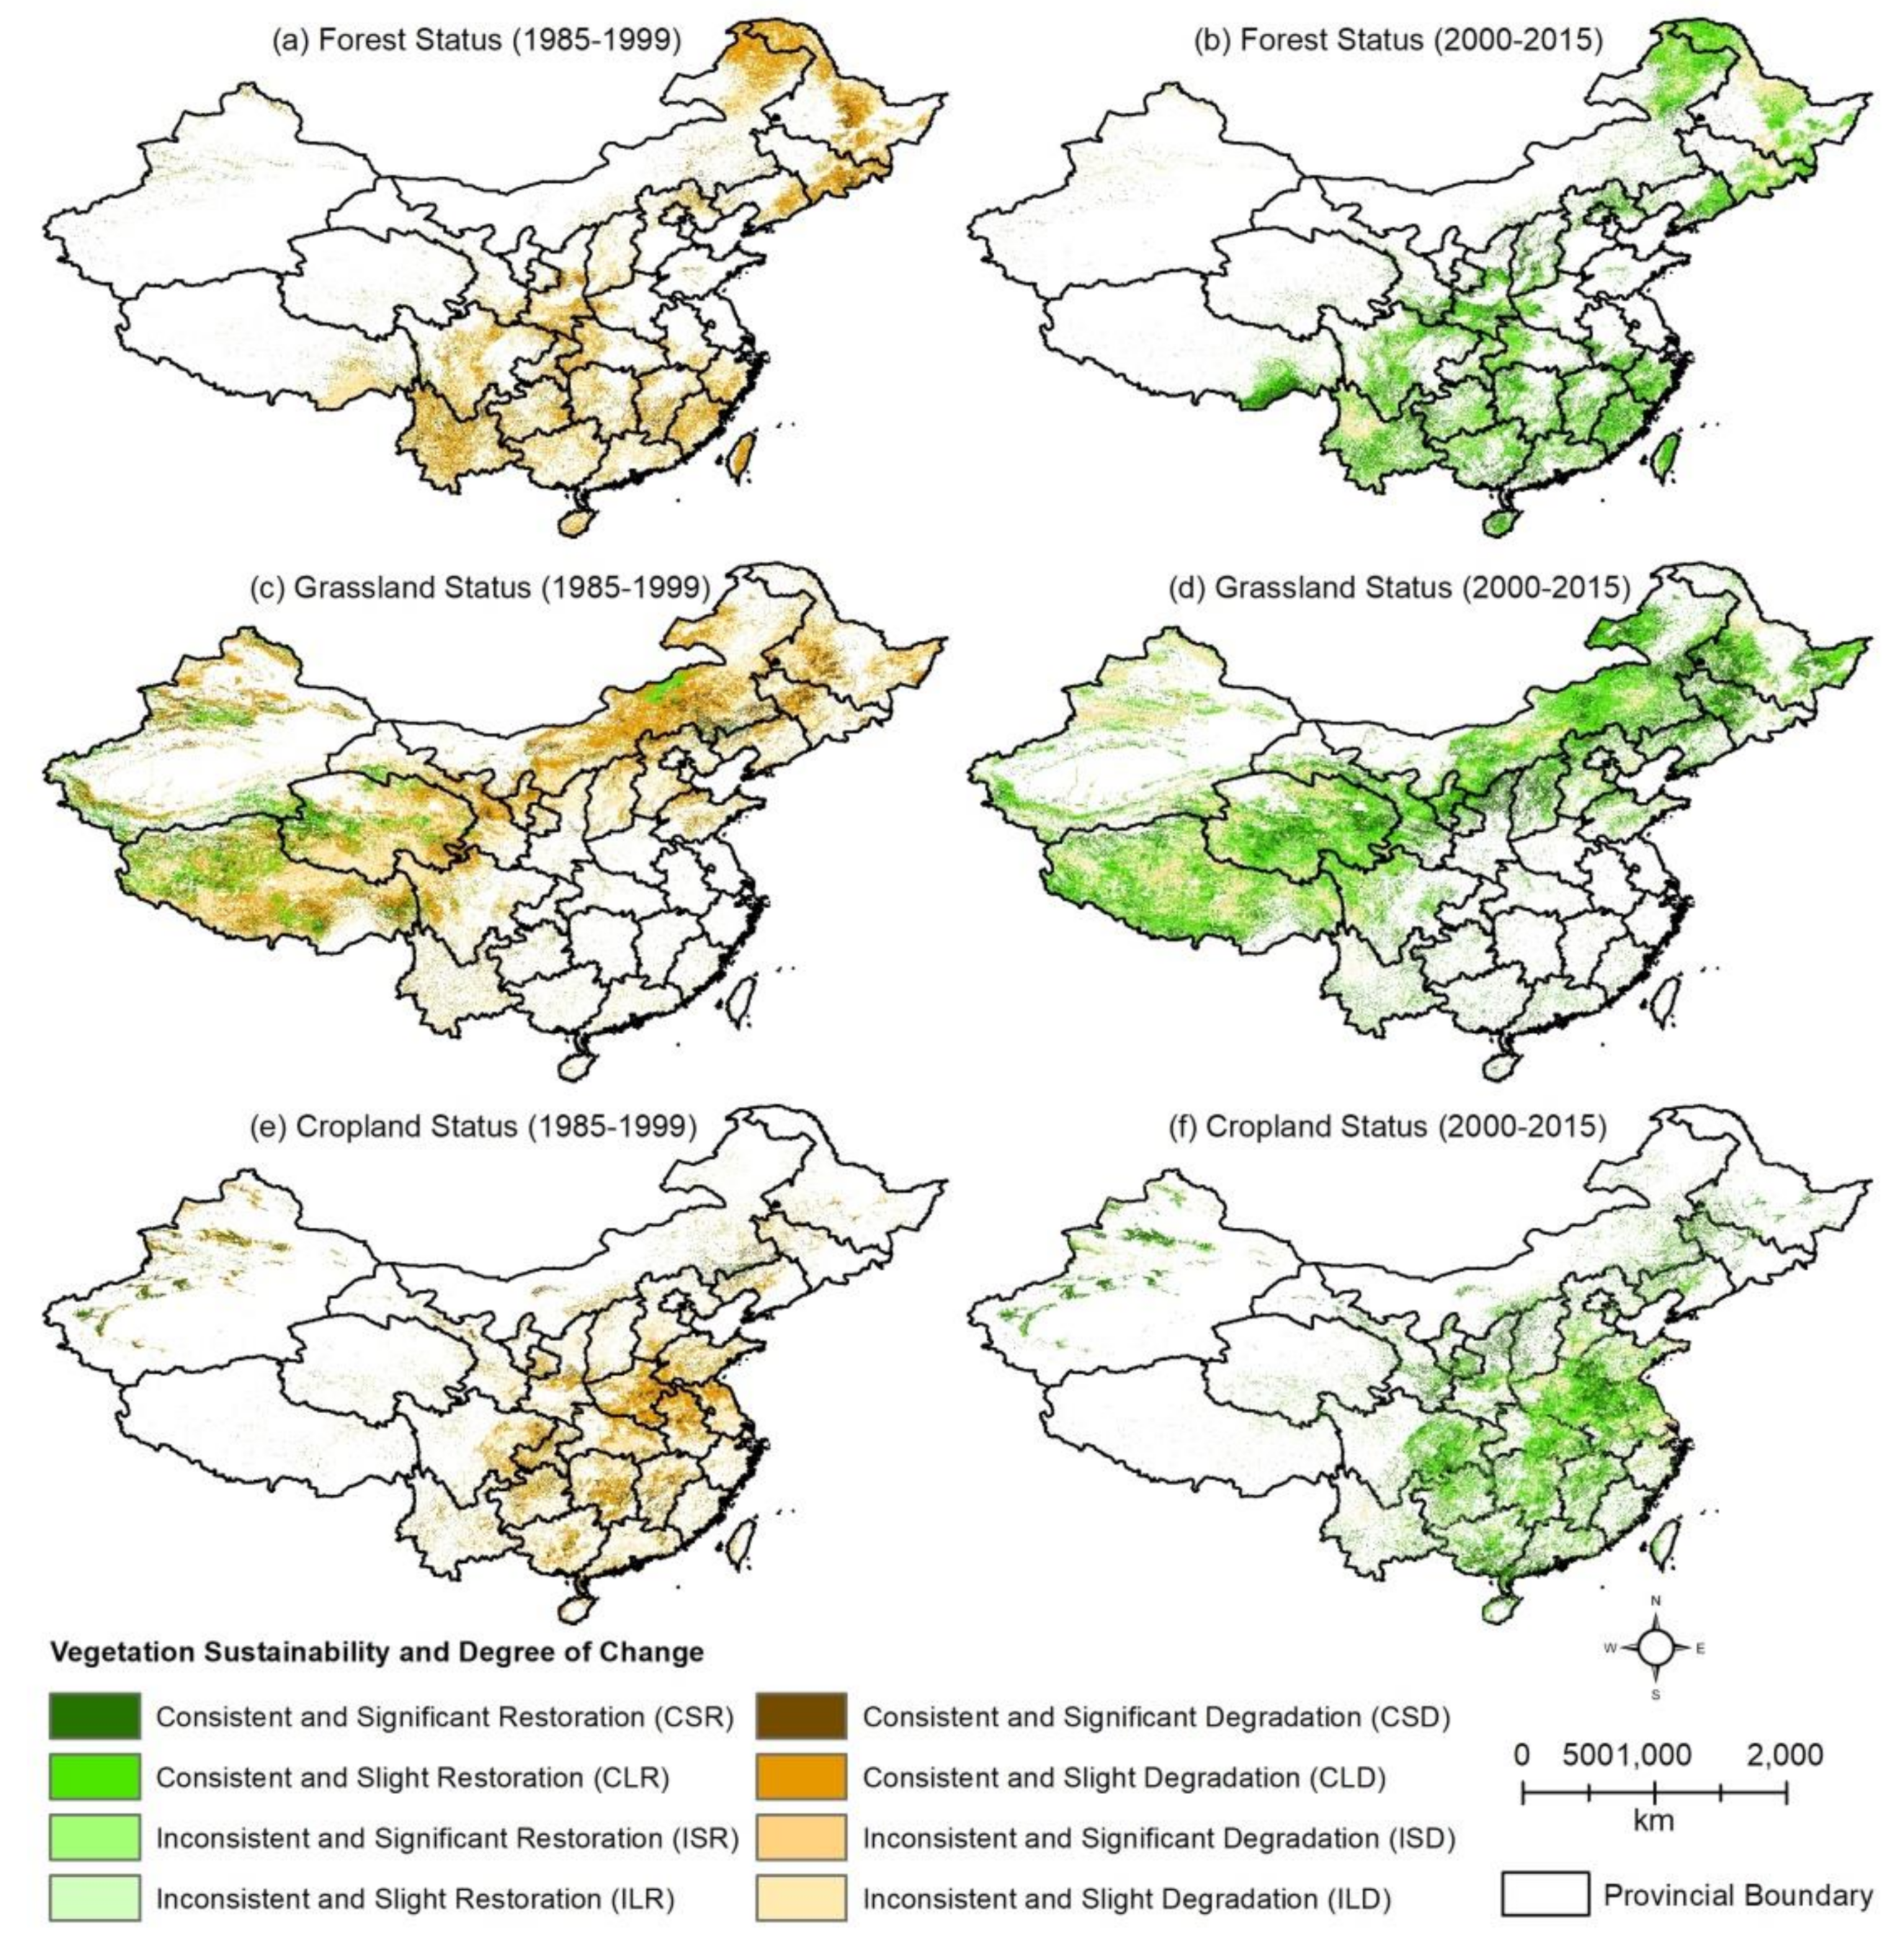
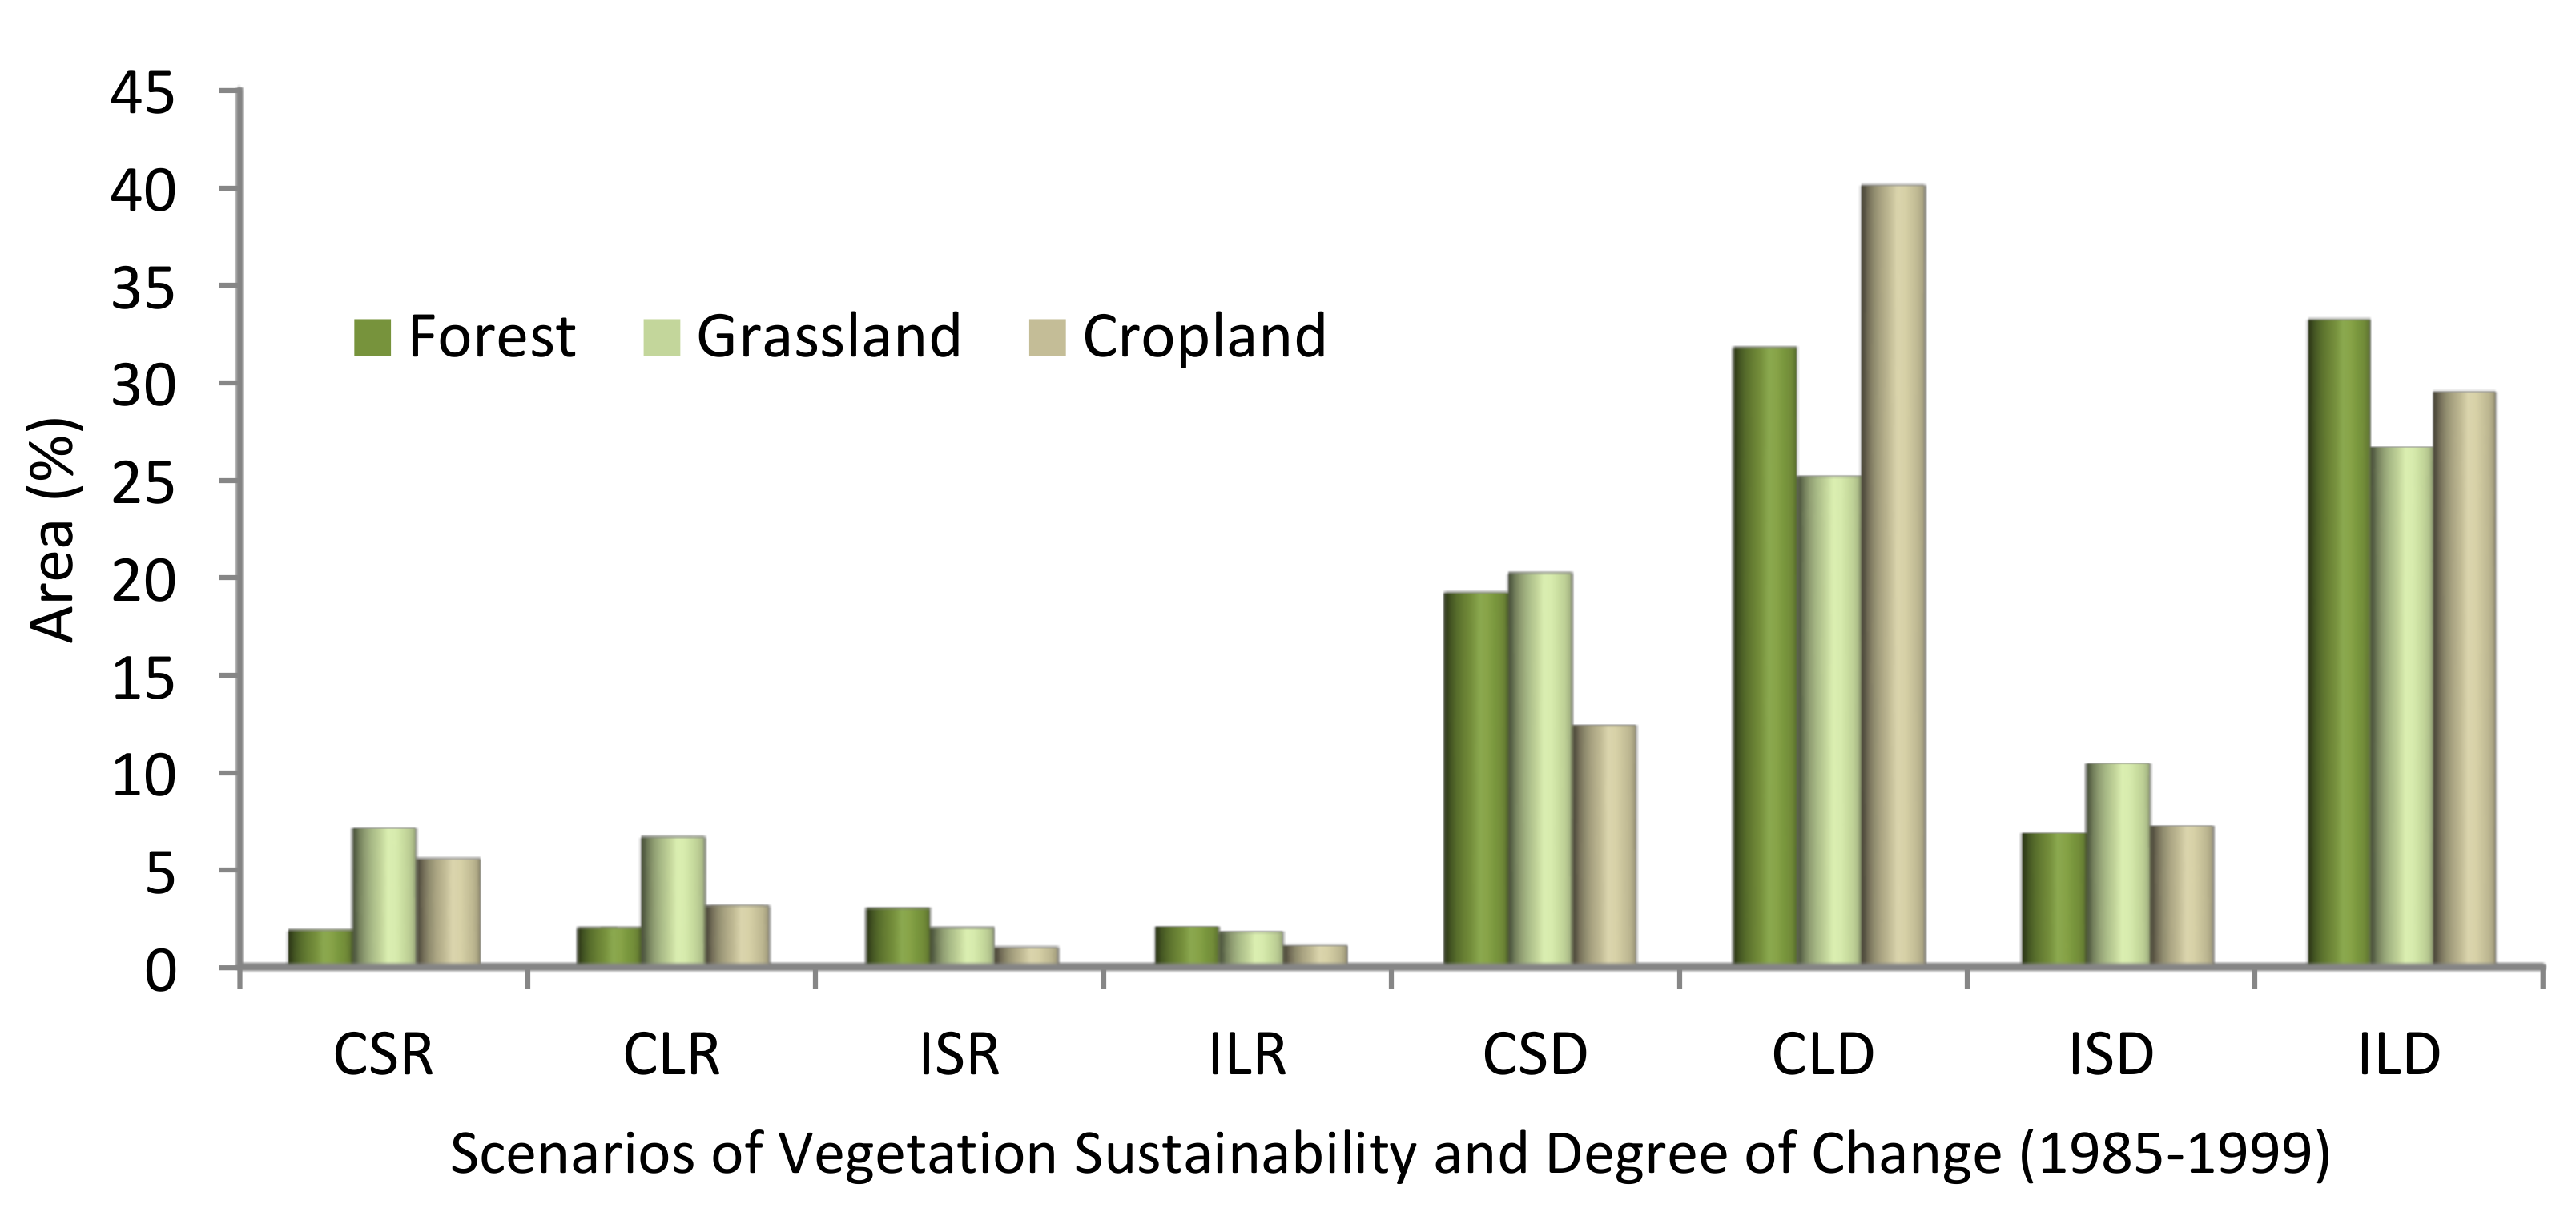
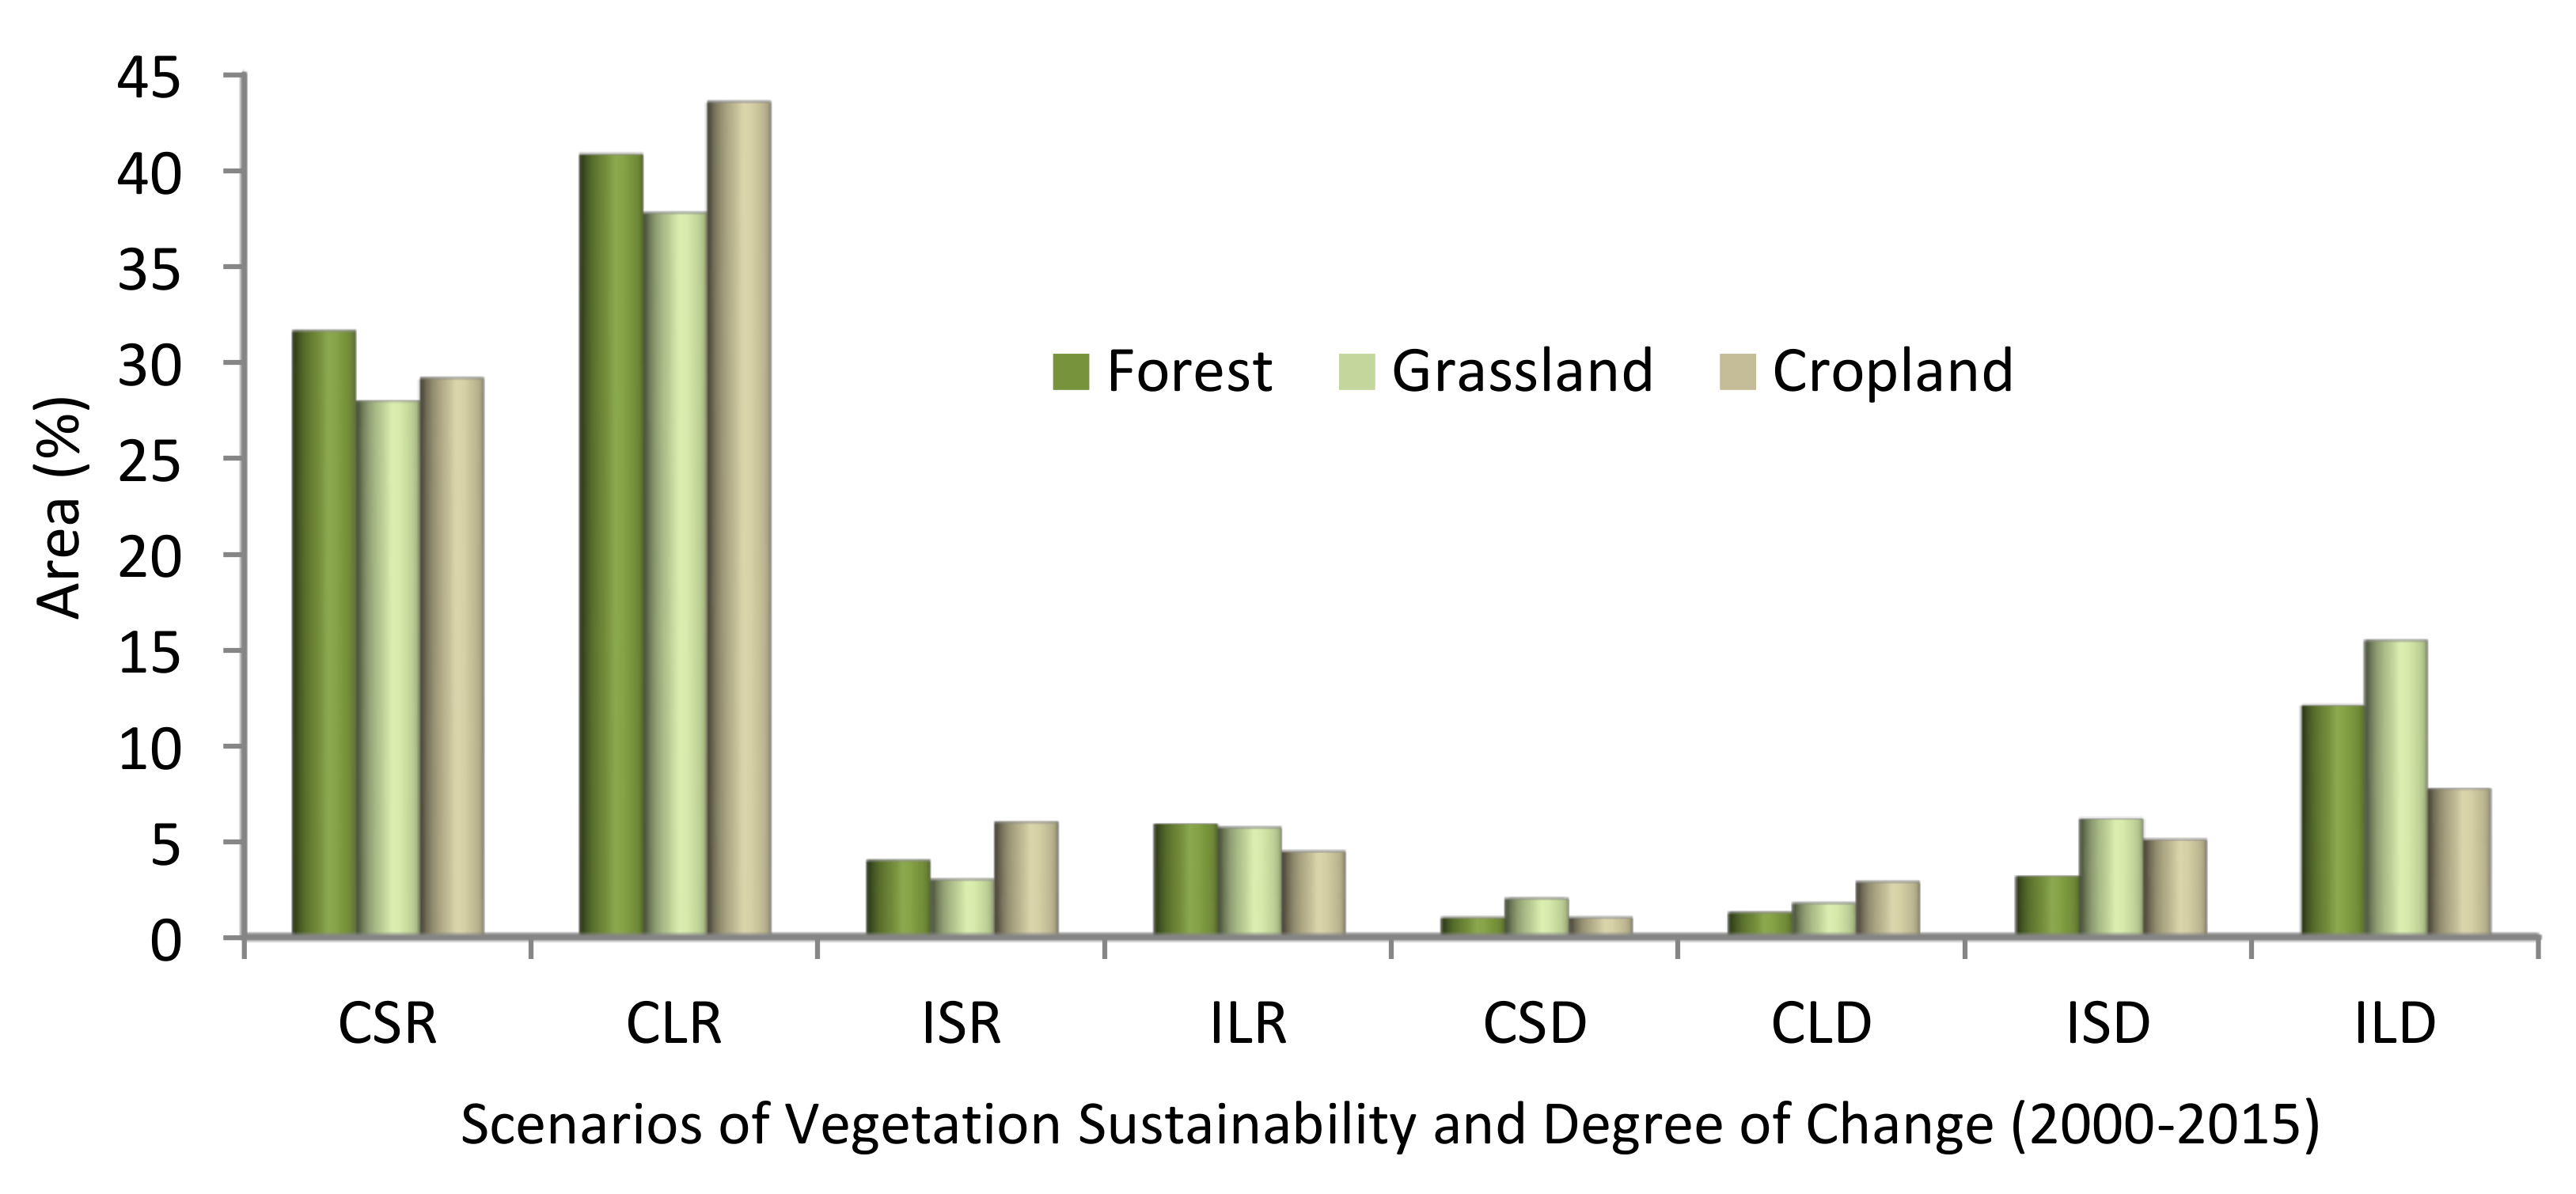
3.2. Vegetation Sustainability and Degree of Change
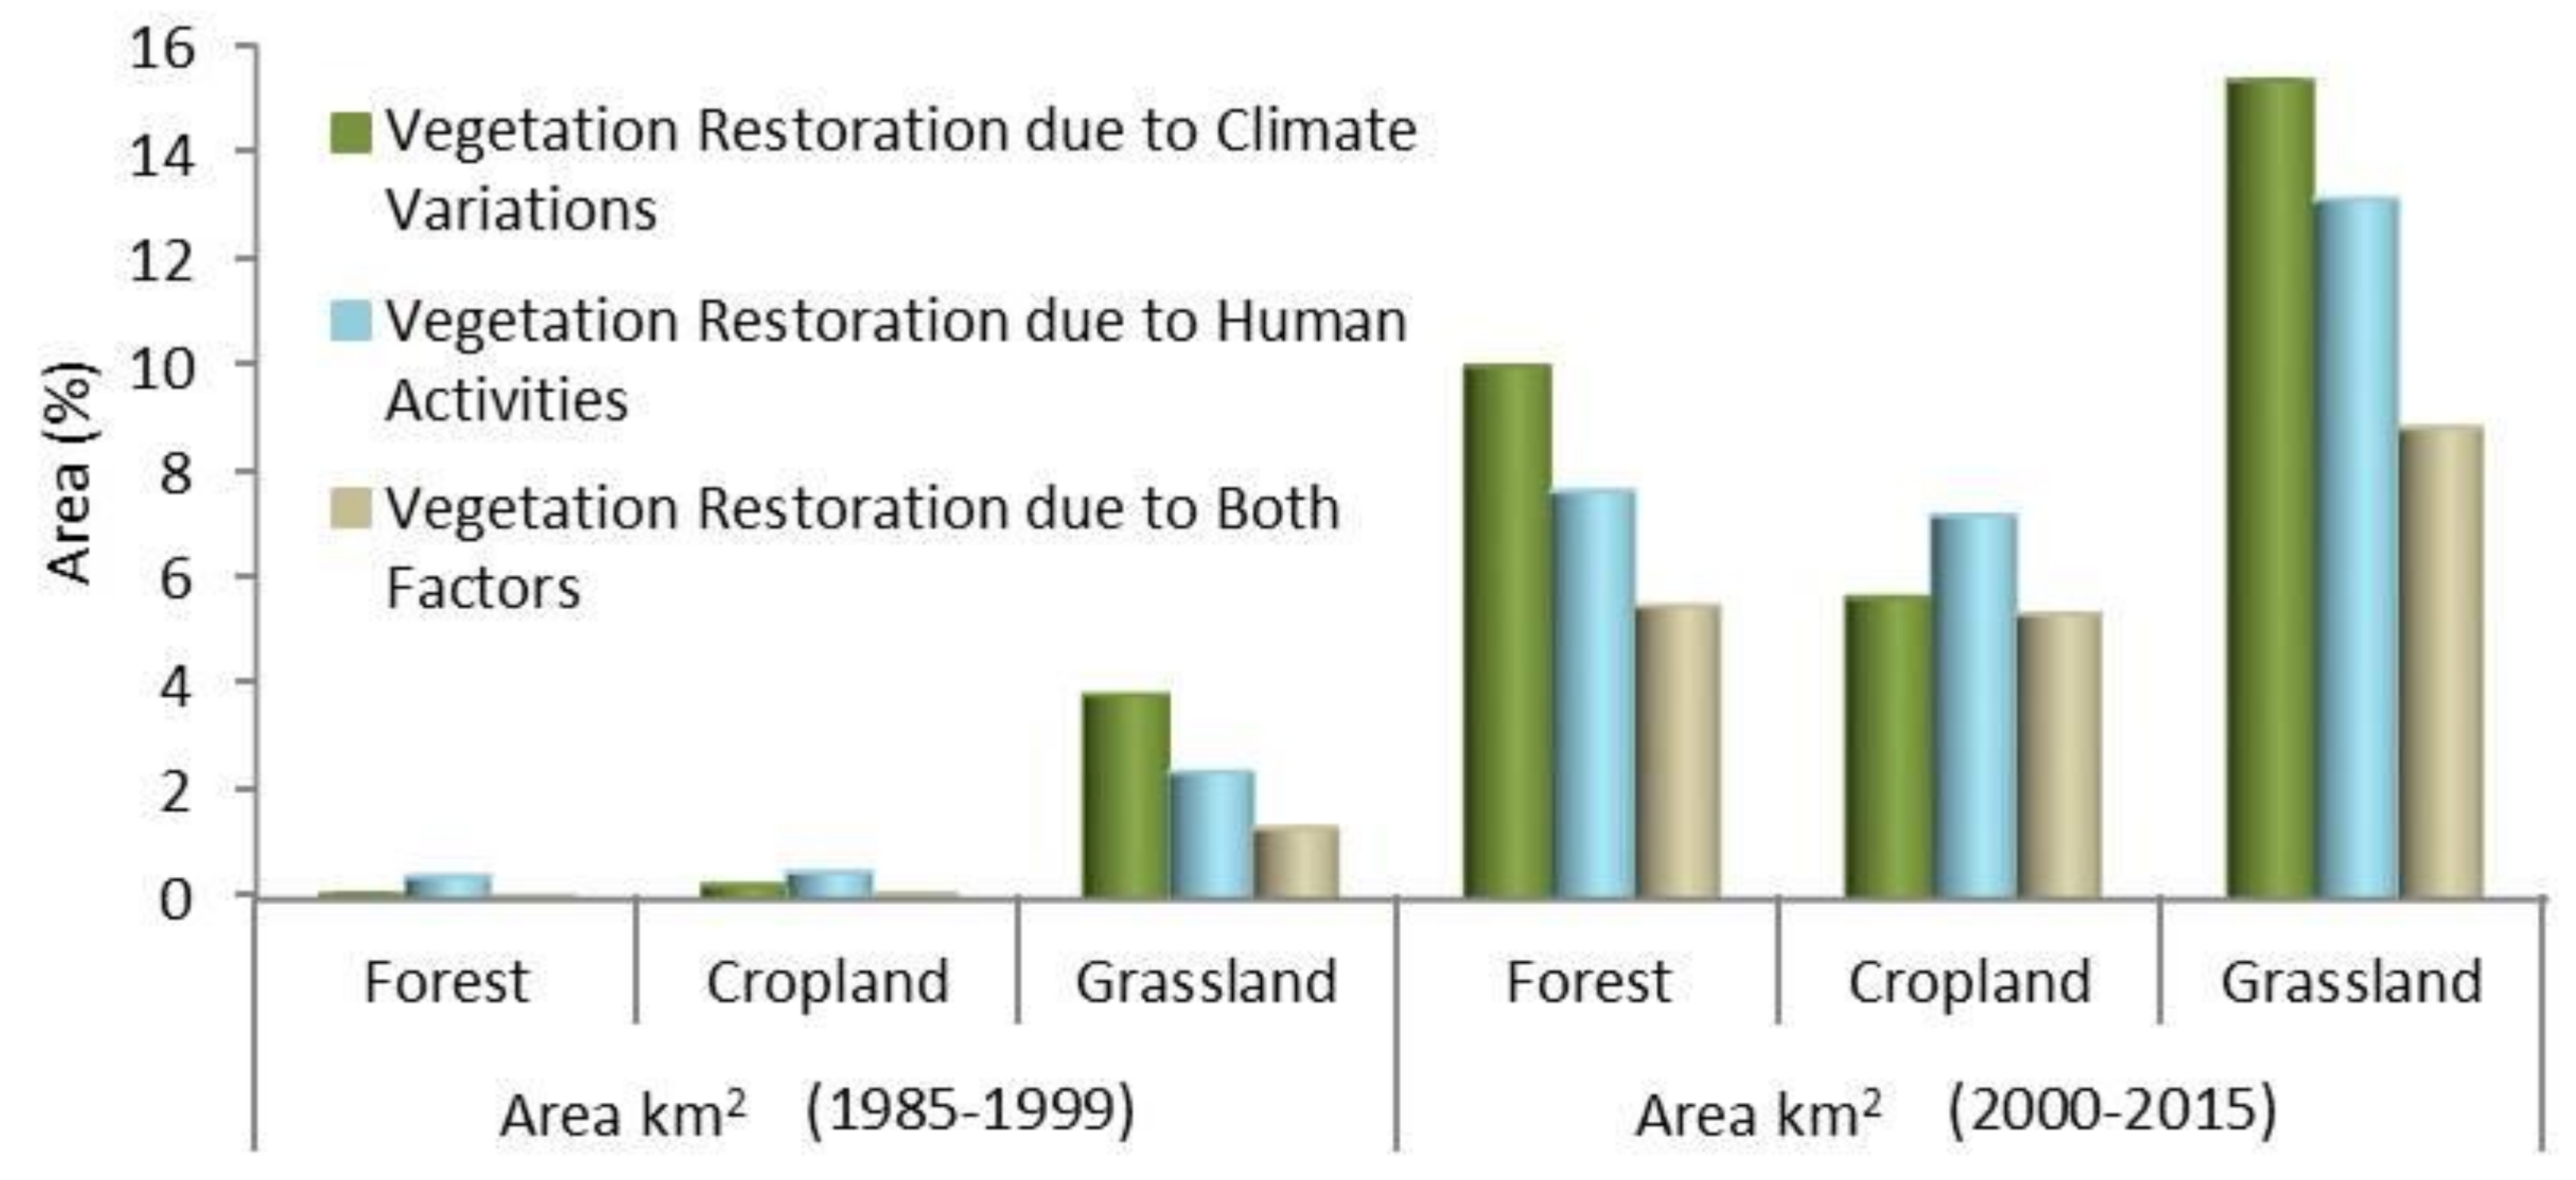
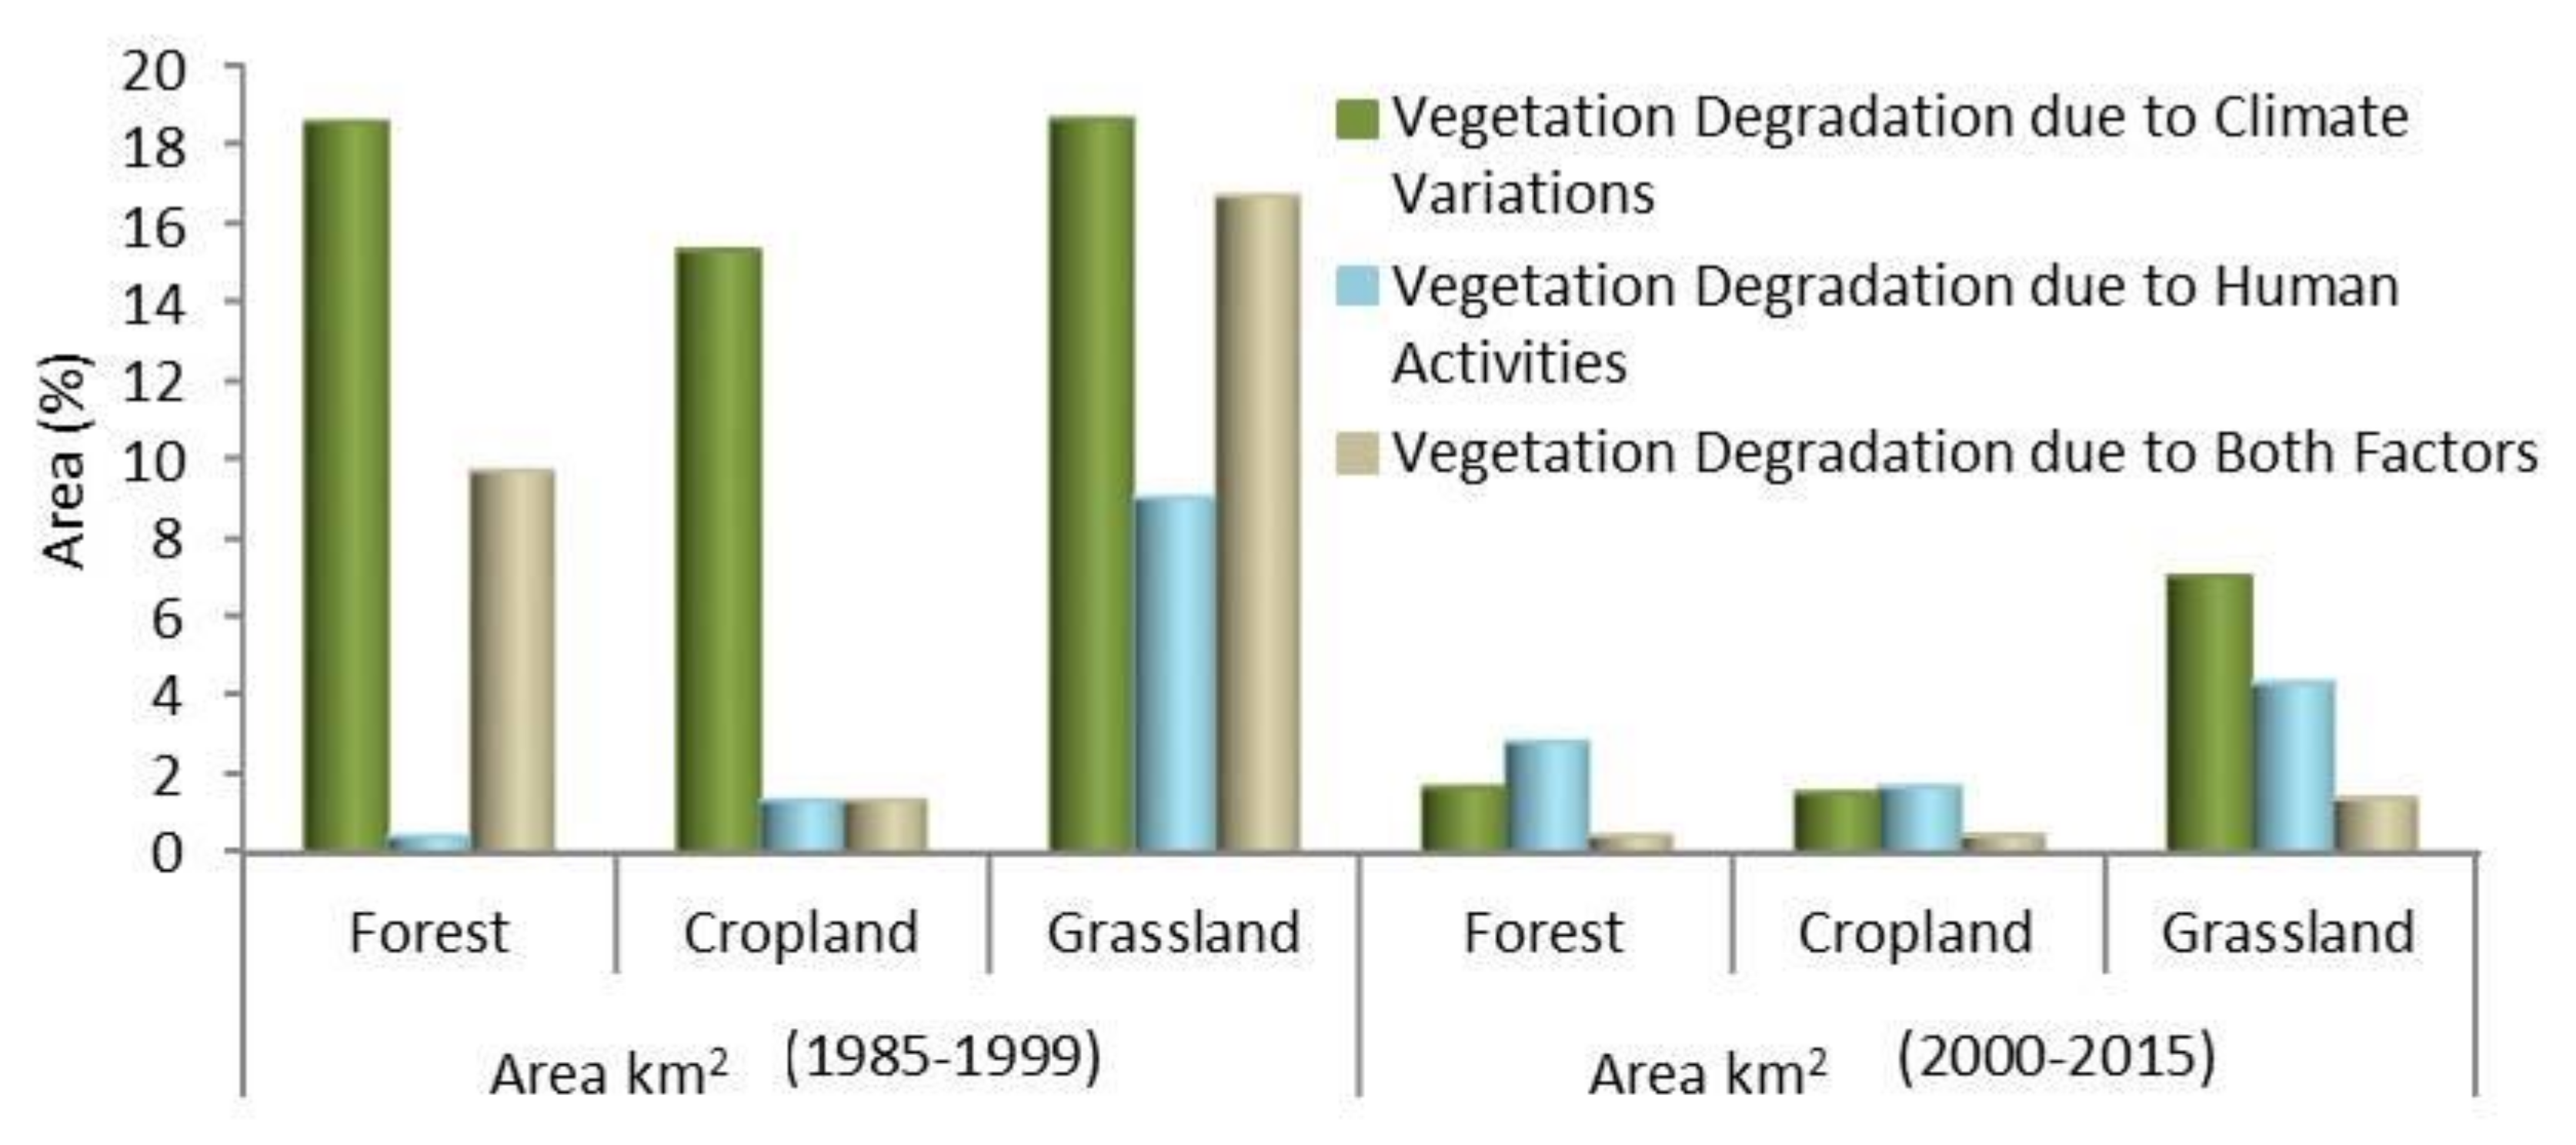
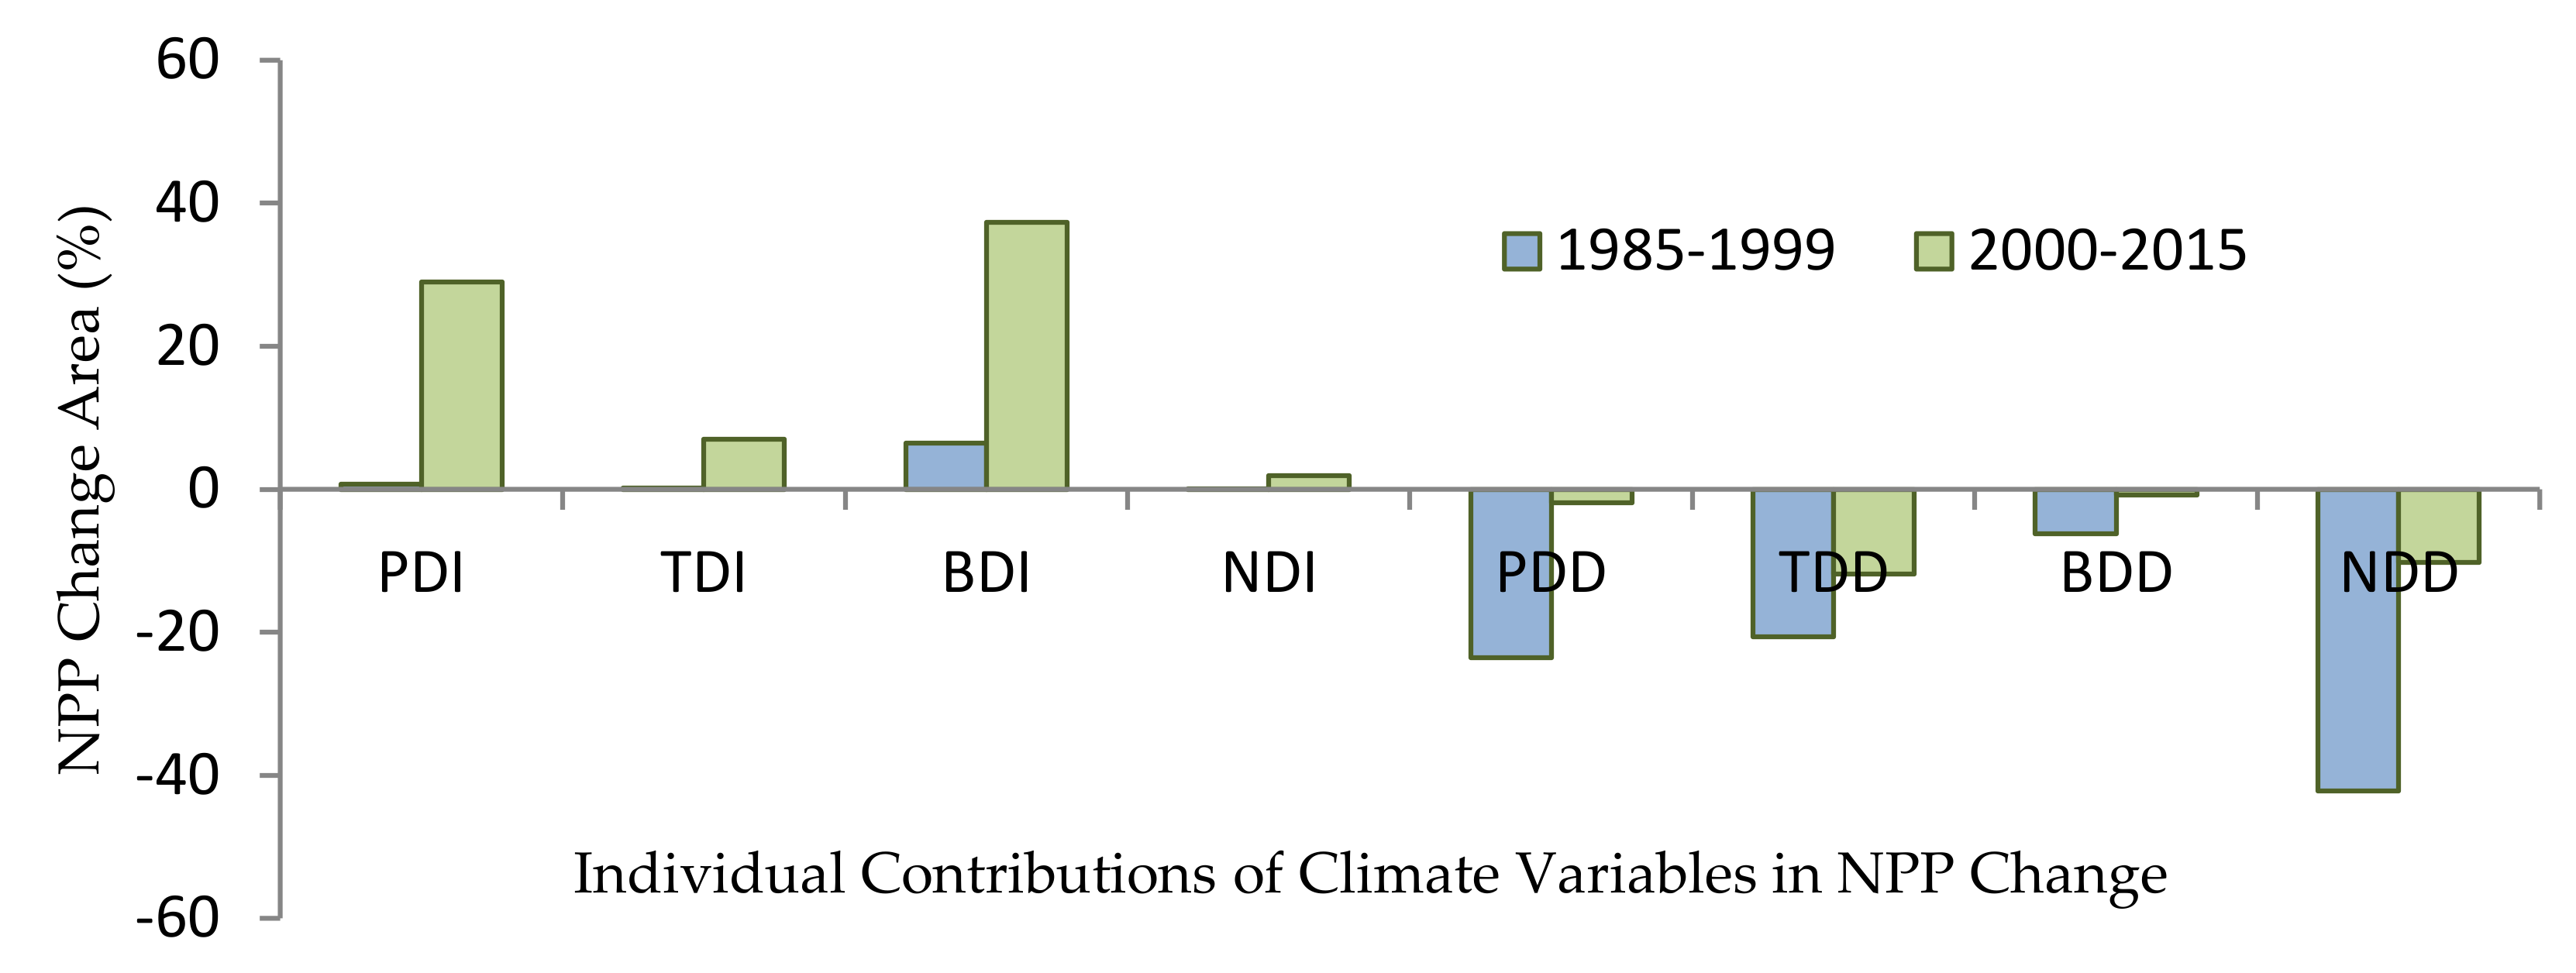
3.3. Individual Contributions of Climate Factors and Human Activities
4. Discussions
5. Conclusions
- Overall, the restoration period demonstrates increasing NPP trends for 78.7% and decreasing trends for 21.3% of the total vegetation cover, whereas the base period shows noticeable degradation in 91% and slight improvement in 9% of the total vegetation area.
- The consistently and significantly increasing NPP trends cover 29.64% of the total vegetation cover during the restoration period. Conversely, consistent and significant decreasing NPP trends are observed in 17.26% of the total vegetation cover during the restoration period.
- Both climatic factors and human activities contribute significantly to vegetation productivity changes. However, in this study, climate variations influence NPP changes in vegetation areas more than human activities.
- The quantitative contribution of climate to NPP restoration is found to be 0.21 and 0.56 gC m−2 yr−1 during the base and restoration periods, respectively, whereas the quantitative contribution of climate to NPP degradation is found to be 2.41 and 0.29 gC m−2 yr−1 during the base and restoration periods, respectively.
- The quantitative contribution of human activities to NPP restoration is found to be 0.36 and 0.63 gC m−2 yr−1 during the base and restoration periods, respectively, while the quantitative contribution of human activities to NPP degradation is calculated to be 0.72 and 0.31 gC m−2 yr−1 during the base and restoration periods, respectively.
- The combined effects of climate and human activities help to restore the maximum quantity of NPP (0.65 gC m−2 yr−1) during the base period and during the restoration period (1.11 gC m−2 yr−1).
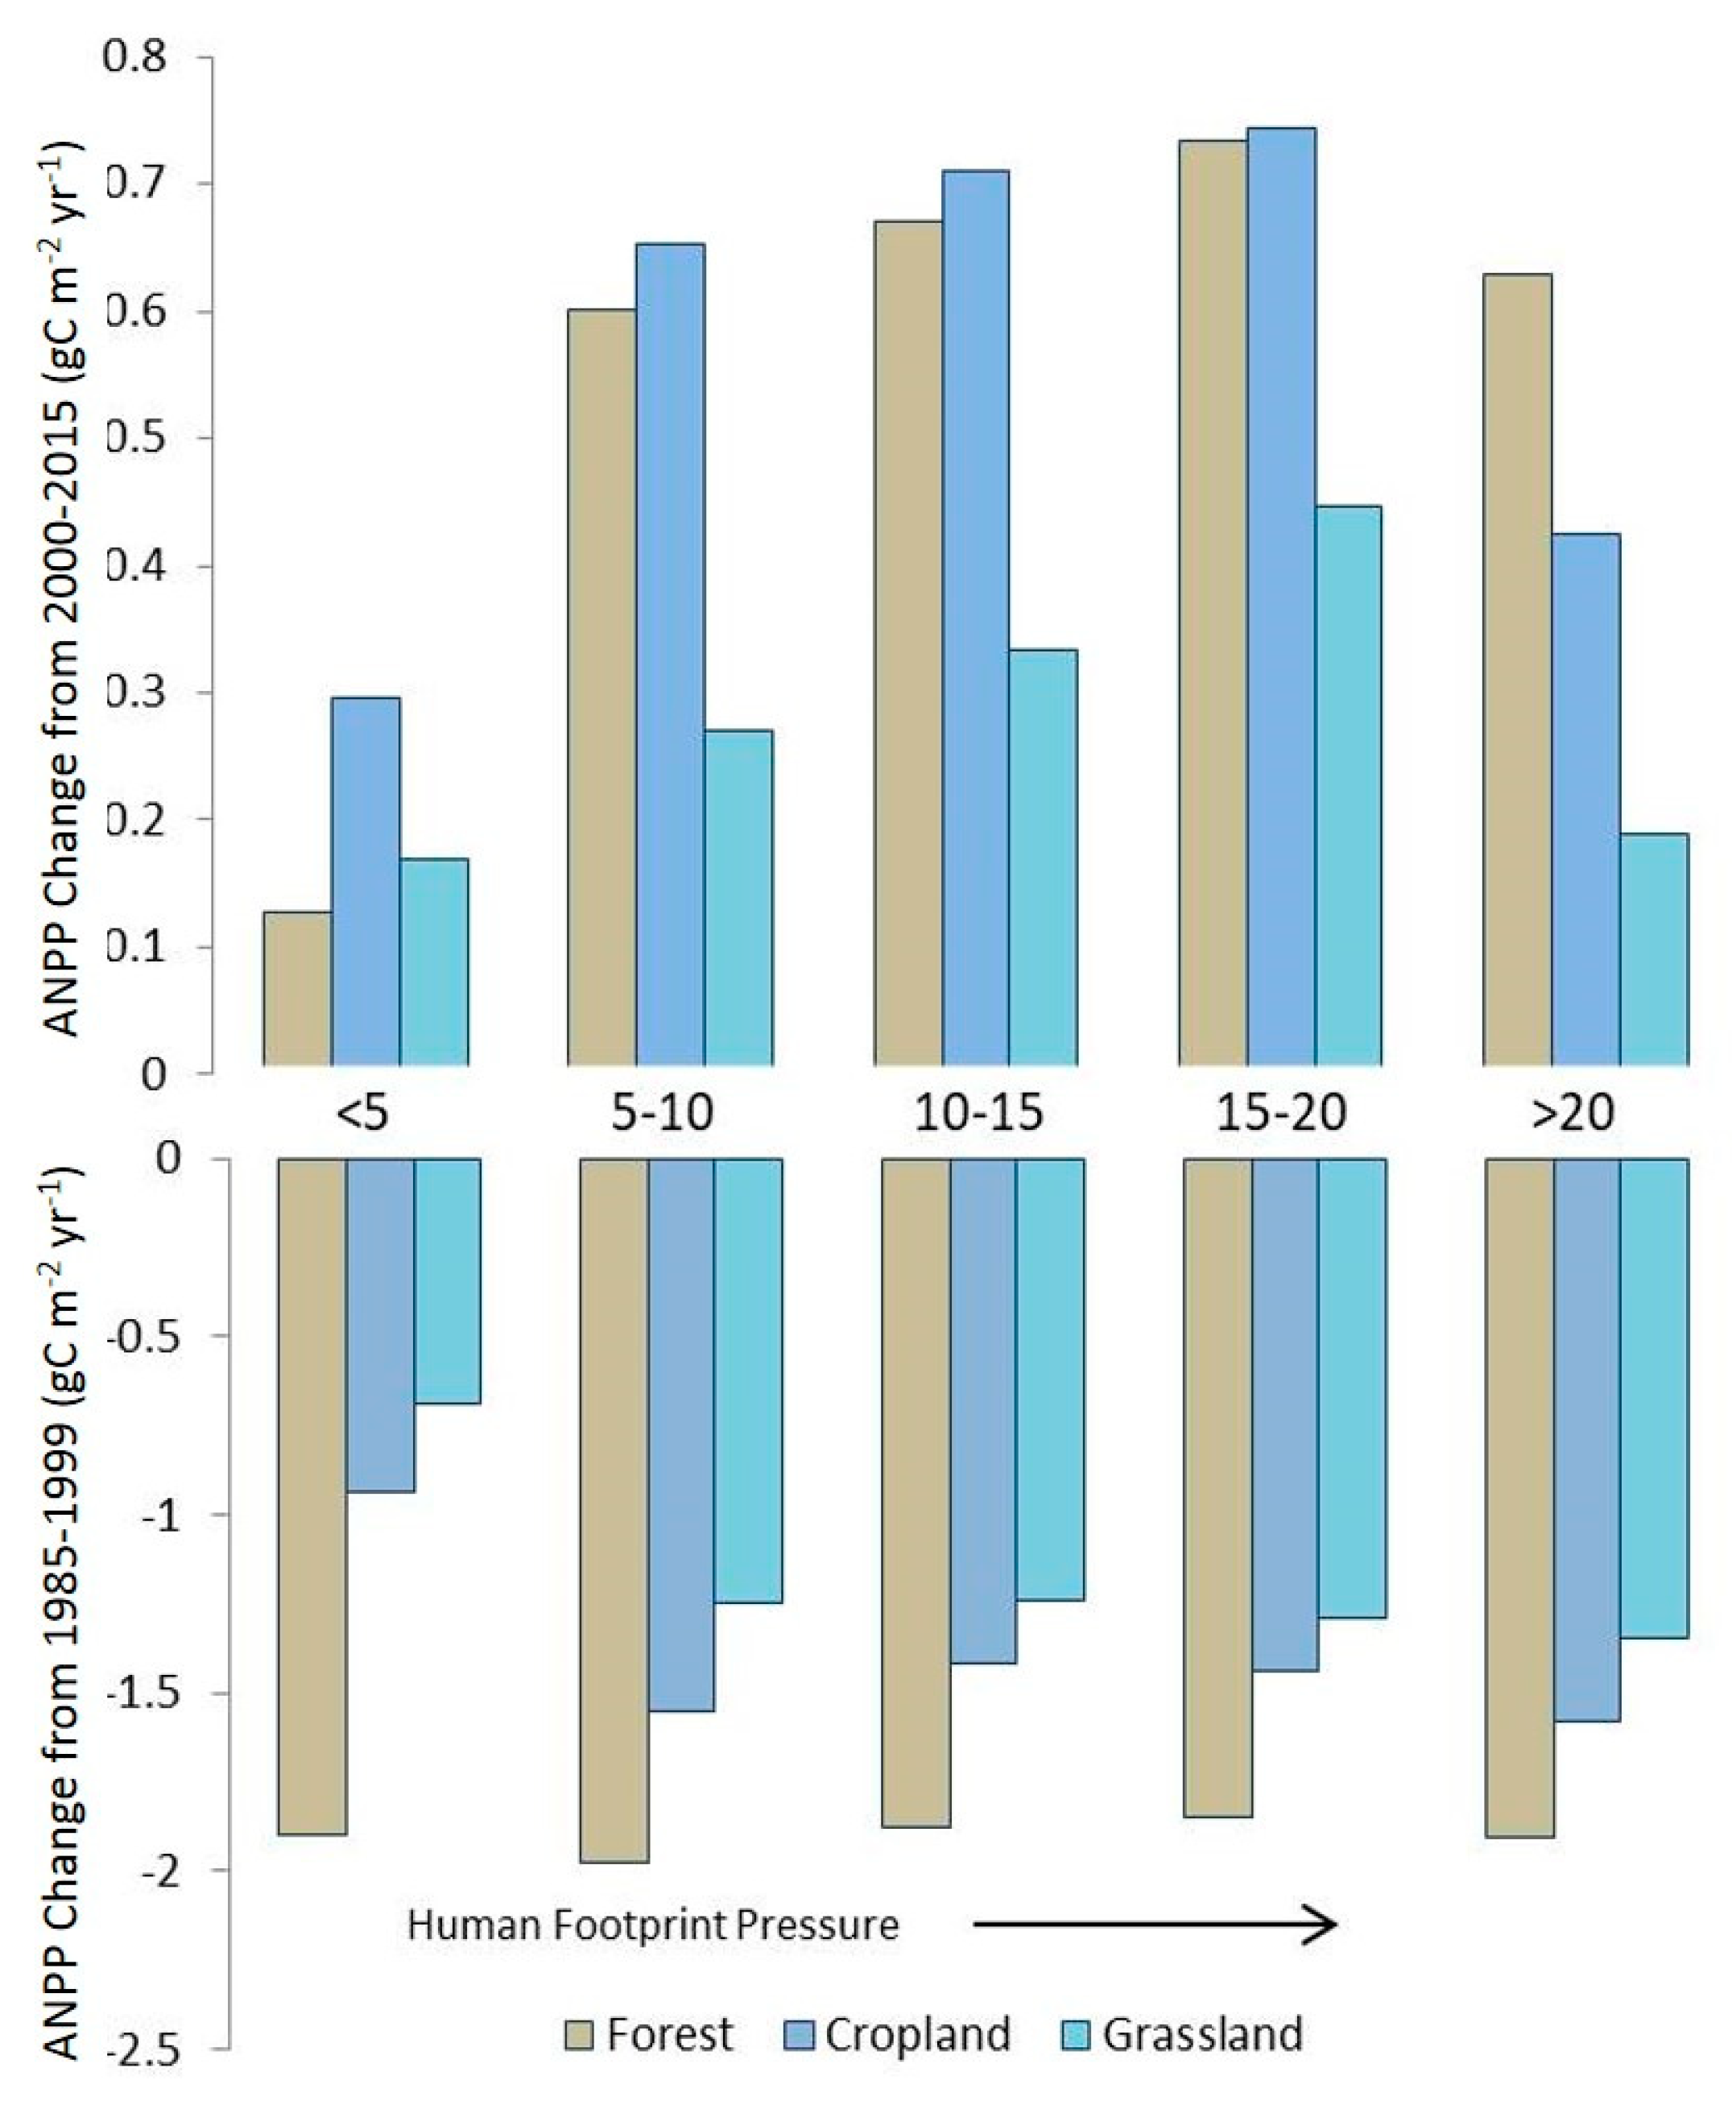
- Precipitation seems to be a dominant factor in controlling NPP changes, whereas human footprint pressure has a positive impact on NPP changes for the restoration period and a negative impact on NPP changes for the base period.
Author Contributions
Funding
Acknowledgments
Conflicts of Interest
References
- Haberl, H.; Erb, K.H.; Krausmann, F.; Gaube, V.; Bondeau, A.; Plutzar, C.; Gingrich, S.; Lucht, W.; Fischer-Kowalski, M. Quantifying and mapping the human appropriation of net primary production in earth’s terrestrial ecosystems. Proc. Natl. Acad. Sci. USA 2007, 104, 12942–12947. [Google Scholar] [CrossRef]
- He, C.; Tian, J.; Gao, B.; Zhao, Y. Differentiating climate- and human-induced drivers of grassland degradation in the Liao River Basin, China. Environ. Monit. Assess. 2014, 187, 4199. [Google Scholar] [CrossRef]
- Zhou, W.; Yang, H.; Huang, L.; Chen, C.; Lin, X.; Hu, Z.; Li, J. Grassland degradation remote sensing monitoring and driving factors quantitative assessment in China from 1982 to 2010. Ecol. Indic. 2017, 83, 303–313. [Google Scholar] [CrossRef]
- Chen, B.; Zhang, X.; Tao, J.; Wu, J.; Wang, J.; Shi, P.; Zhang, Y.-J.; Yu, C. The impact of climate change and anthropogenic activities on alpine grassland over the Qinghai-Tibet Plateau. Agric. For. Meteorol. 2014, 189, 11–18. [Google Scholar] [CrossRef]
- Li, A.; Wu, J.; Huang, J.-H. Distinguishing between human-induced and climate-driven vegetation changes: A critical application of RESTREND in inner Mongolia. Landsc. Ecol. 2012, 27, 969–982. [Google Scholar] [CrossRef]
- Wessels, K.; Prince, S.; Malherbe, J.; Small, J.; Frost, P.; Vanzyl, D. Can human-induced land degradation be distinguished from the effects of rainfall variability? A case study in South Africa. J. Arid Environ. 2007, 68, 271–297. [Google Scholar] [CrossRef]
- Ciais, P.; Reichstein, M.; Viovy, N.; Granier, A.; Ogée, J.; Allard, V.; Aubinet, M.; Buchmann, N.; Bernhofer, C.; Carrara, A.; et al. Europe-wide reduction in primary productivity caused by the heat and drought in 2003. Nature 2005, 437, 529–533. [Google Scholar] [CrossRef] [PubMed]
- Newbold, T.; Hudson, L.; Hill, S.L.L.; Contu, S.; Lysenko, I.; Senior, R.; Börger, L.; Bennett, D.J.; Choimes, A.; Collen, B.; et al. Global effects of land use on local terrestrial biodiversity. Nature 2015, 520, 45–50. [Google Scholar] [CrossRef]
- Herrmann, S.; Anyamba, A.; Tucker, C. Recent trends in vegetation dynamics in the African Sahel and their relationship to climate. Glob. Environ. Chang. 2005, 15, 394–404. [Google Scholar] [CrossRef]
- Hua, W.; Chen, H.; Zhou, L.; Xie, Z.; Qin, M.; Li, X.; Ma, H.; Huang, Q.; Sun, S. Observational Quantification of Climatic and Human Influences on Vegetation Greening in China. Remote Sens. 2017, 9, 425. [Google Scholar] [CrossRef]
- Brown, P.; Ming, Y.; Li, W.; Hill, S. Change in the magnitude and mechanisms of global temperature variability with warming. Nat. Clim. Chang. 2017, 7, 743–748. [Google Scholar] [CrossRef] [PubMed]
- Huang, J.; Yu, H.; Dai, A.; Wei, Y.; Kang, L. Drylands face potential threat under 2 °C global warming target. Nat. Clim. Chang. 2017, 7, 417–422. [Google Scholar] [CrossRef]
- Jiang, L.; Bao, A.; Guo, H.; Ndayisaba, F. Guli·jiapaer Vegetation dynamics and responses to climate change and human activities in Central Asia. Sci. Total. Environ. 2017, 599, 967–980. [Google Scholar] [CrossRef] [PubMed]
- Piao, S.; Mohammat, A.; Fang, J.; Cai, Q.; Feng, J. NDVI-based increase in growth of temperate grasslands and its responses to climate changes in China. Glob. Environ. Chang. 2006, 16, 340–348. [Google Scholar] [CrossRef]
- Suzuki, R.; Masuda, K.; Dye, D.G. Interannual covariability between actual evapotranspiration and PAL and GIMMS NDVIs of northern Asia. Remote Sens. Environ. 2007, 106, 387–398. [Google Scholar] [CrossRef]
- Zhang, Y.; Zhang, C.; Wang, Z.; Chen, Y.; Gang, C.; An, R.; Li, J. Vegetation dynamics and its driving forces from climate change and human activities in the Three-River Source Region, China from 1982 to 2012. Sci. Total Environ. 2016, 563, 210–220. [Google Scholar] [CrossRef]
- Zhang, Y.; Peng, C.; Li, W.-Z.; Tian, L.; Zhu, Q.; Chen, H.; Fang, X.; Zhang, G.; Liu, G.; Mu, X.; et al. Multiple afforestation programs accelerate the greenness in the ‘Three North’ region of China from 1982 to 2013. Ecol. Indic. 2016, 61, 404–412. [Google Scholar] [CrossRef]
- Zhang, B.; He, C.; Burnham, M.; Zhang, L. Evaluating the coupling effects of climate aridity and vegetation restoration on soil erosion over the Loess Plateau in China. Sci. Total Environ. 2016, 539, 436–449. [Google Scholar] [CrossRef]
- Ding, C. Land policy reform in China: Assessment and prospects. Land Use Policy 2003, 20, 109–120. [Google Scholar] [CrossRef]
- Wang, F.; Pan, X.; Wang, N.; Shen, C.; Lu, Q. Combating desertification in China: Past, present and future. Land Use Policy 2013, 31, 311–313. [Google Scholar] [CrossRef]
- Song, W.; Deng, X.; Liu, B.; Li, Z.; Jin, G. Impacts of grain-for-green and grain-forblue policies on valued ecosystem services in Shandong Province, China. Adv. Meteorol. 2015, 2015, 213534. [Google Scholar] [CrossRef]
- Wang, J.; Chen, Y.; Shao, X.; Zhang, Y.; Cao, Y. Land-use changes and policy dimension driving forces in China: Present, trend and future. Land Use Policy 2012, 29, 737–749. [Google Scholar] [CrossRef]
- Xu, H.-J.; Wang, X.-P.; Zhang, X.-X. Alpine grasslands response to climatic factors and anthropogenic activities on the Tibetan Plateau from 2000 to 2012. Ecol. Eng. 2016, 92, 251–259. [Google Scholar] [CrossRef]
- Yao, R.; Wang, L.; Huang, X.; Chen, J.; Li, J.; Niu, Z. Less sensitive of urban surface to climate variability than rural in Northern China. Sci. Total Environ. 2018, 628, 650–660. [Google Scholar] [CrossRef]
- Tong, X.; Wang, K.; Yue, Y.; Brandt, M.; Liu, B.; Zhang, C.; Liao, C.; Fensholt, R. Quantifying the effectiveness of ecological restoration projects on long-term vegetation dynamics in the karst regions of Southwest China. Int. J. Appl. Earth Obs. Geoinf. 2017, 54, 105–113. [Google Scholar] [CrossRef]
- Li, L.; Zhang, Y.; Liu, L.; Wu, J.; Wang, Z.; Li, S.; Zhang, H.; Zu, J.; Ding, M.; Paudel, B. Spatiotemporal patterns of vegetation greenness change and associated climatic and anthropogenic drivers on the Tibetan Plateau during 2000–2015. Remote Sens. 2018, 10, 1525. [Google Scholar] [CrossRef]
- Li, Q.; Zhang, C.; Shen, Y.; Jia, W.; Li, J. Quantitative assessment of the relative roles of climate change and human activities in desertification processes on the Qinghai-Tibet Plateau based on net primary productivity. Catena 2016, 147, 789–796. [Google Scholar] [CrossRef]
- Wessels, K.; Prince, S.; Reshef, I. Mapping land degradation by comparison of vegetation production to spatially derived estimates of potential production. J. Arid Environ. 2008, 72, 1940–1949. [Google Scholar] [CrossRef]
- Liang, W.; Yang, Y.; Fan, N.; Guan, H.; Zhang, T.; Long, D.; Zhou, Y.; Bai, D. Analysis of spatial and temporal patterns of net primary production and their climate controls in China from 1982 to 2010. Agric. For. Meteorol. 2015, 204, 22–36. [Google Scholar] [CrossRef]
- Chen, D.; Lan, Z.; Hu, S.; Bai, Y. Effects of nitrogen enrichment on belowground communities in grassland: Relative role of soil nitrogen availability vs. soil acidification. Soil Biol. Biochem. 2015, 89, 99–108. [Google Scholar] [CrossRef]
- Potter, C.; Klooster, S.; Genovese, V. Net primary production of terrestrial ecosystems from 2000 to 2009. Clim. Chang. 2012, 115, 365–378. [Google Scholar] [CrossRef]
- Ugbaje, S.U.; Odeh, I.O.A.; Bishop, T.F.A.; Li, J. Assessing the spatio-temporal variability of vegetation productivity in Africa: Quantifying the relative roles of climate variability and human activities. Int. J. Digit. Earth 2016, 10, 879–900. [Google Scholar] [CrossRef]
- Feng, Y.; Wu, J.; Zhang, J.; Zhang, X.; Song, C. Identifying the Relative Contributions of Climate and Grazing to Both Direction and Magnitude of Alpine Grassland Productivity Dynamics from 1993 to 2011 on the Northern Tibetan Plateau. Remote Sens. 2017, 9, 136. [Google Scholar] [CrossRef]
- Xu, H.-J.; Wang, X.-P.; Zhang, X.-X. Impacts of climate change and human activities on the aboveground production in alpine grasslands: A case study of the source region of the Yellow River, China. Arab. J. Geosci. 2017, 10, 17. [Google Scholar] [CrossRef]
- Zhang, R.; Liang, T.; Guo, J.; Xie, H.; Feng, Q.; Aimaiti, Y. Grassland dynamics in response to climate change and human activities in Xinjiang from 2000 to 2014. Sci. Rep. 2018, 8, 2888. [Google Scholar] [CrossRef]
- Yang, Y.; Wang, Z.; Li, J.; Gang, C.; Zhang, Y.; Zhang, Y.; Odeh, I.; Qi, J. Comparative assessment of grassland degradation dynamics in response to climate variation and human activities in China, Mongolia, Pakistan and Uzbekistan from 2000 to 2013. J. Arid Environ. 2016, 135, 164–172. [Google Scholar] [CrossRef]
- Gang, C.; Zhou, W.; Chen, Y.; Wang, Z.; Sun, Z.; Li, J.; Qi, J.; Odeh, I. Quantitative assessment of the contributions of climate change and human activities on global grassland degradation. Environ. Earth Sci. 2014, 72, 4273–4282. [Google Scholar] [CrossRef]
- Chen, Y.; Yang, K.; He, J.; Qin, J.; Shi, J.; Du, J.; He, Q. Improving land surface temperature modeling for dry land of China. J. Geophys. Res. Space Phys. 2011, 116. [Google Scholar] [CrossRef]
- Sheffield, J.; Goteti, G.; Wood, E. Development of a 50-Year High-Resolution Global Dataset of Meteorological Forcings for Land Surface Modeling. J. Clim. 2006, 19, 3088–3111. [Google Scholar] [CrossRef]
- Wen, Z.; Wu, S.; Chen, J.; Lü, M. NDVI indicated long-term interannual changes in vegetation activities and their responses to climatic and anthropogenic factors in the Three Gorges Reservoir Region, China. Sci. Total Environ. 2017, 574, 947–959. [Google Scholar] [CrossRef] [PubMed]
- Shen, M.; Piao, S.; Chen, X.; An, S.; Fu, Y.H.; Wang, S.; Cong, N.; Janssens, I.A. Strong impacts of daily minimum temperature on the green-up date and summer greenness of the Tibetan Plateau. Glob. Chang. Biol. 2016, 22, 3057–3066. [Google Scholar] [CrossRef] [PubMed]
- Yuan, L.H.; Jiang, W.G.; Shen, W.M.; Liu, Y.H.; Wang, W.J.; Tao, L.L.; Zheng, H.; Liu, X.F. The spatio-temporal variations of vegetation cover in the Yellow River Basin from 2000 to 2010. Acta Ecol. Sin. 2013, 33, 7798–7806. [Google Scholar]
- Chen, C.; Park, T.; Wang, X.; Piao, S.; Xu, B.; Chaturvedi, R.K.; Fuchs, R.; Brovkin, V.; Ciais, P.; Fensholt, R.; et al. China and India lead in greening of the world through land-use management. Nat. Sustain. 2019, 2, 122–129. [Google Scholar] [CrossRef] [PubMed]
- Fan, N.; Xie, G.D.; Zhang, C.S.; Chen, L.; Cheng, S.K. Spatial-temporal dynamic changes of vegetation cover in Lancang river basin during 2001–2010. Resour. Sci. 2012, 34, 1222–1231. [Google Scholar]
- Yin, H.; Pflugmacher, D.; Li, A.; Li, Z.; Hostert, P. Land use and land cover change in Inner Mongolia-understanding the effects of China’s re-vegetation programs. Remote Sens. Environ. 2018, 204, 918–930. [Google Scholar] [CrossRef]
- Running, S.W.; Thornton, P.E.; Nemani, R.; Glassy, J.M. Global Terrestrial Gross and Net Primary Productivity from the Earth Observing System. In Methods in Ecosystem Science; Sala, O.E., Jackson, R.B., Mooney, H.A., Howarth, R.W., Eds.; Springer: New York, NY, USA, 2000. [Google Scholar]
- Chen, P.F. Monthly NPP dataset covering China’s terrestrial ecosystems at north of 18°N (1985–2015). J. Glob. Chang. Data Discov. 2019, 3, 34–41. [Google Scholar]
- Potter, C.; Randerson, J.T.; Field, C.B.; Matson, P.A.; Vitousek, P.; Mooney, H.A.; Klooster, S.A. Terrestrial ecosystem production: A process model based on global satellite and surface data. Glob. Biogeochem. Cycles 1993, 7, 811–841. [Google Scholar] [CrossRef]
- Feng, Z.W.; Wang, X.K.; Wu, G. Biomass and Productivity of Chinese Forest Ecosystem; Science Press: Beijing, China, 1999. (In Chinese) [Google Scholar]
- Wang, P.; Sun, R.; Hu, J.; Zhu, Q.; Zhou, Y.; Li, L.; Chen, J. Measurements and simulation of forest leaf area index and net primary productivity in Northern China. J. Environ. Manag. 2007, 85, 607–615. [Google Scholar] [CrossRef]
- Chen, C.D.; Zhu, J.F. The Manual of Forest Biomass in Northeast of China; Chinese Forest Press: Beijing, China, 1989. (In Chinese) [Google Scholar]
- Friend, A.D.; Arneth, A.; Kiang, N.Y.; Lomas, M.; Ogée, J.; Roedenbeck, C.; Running, S.W.; Santaren, J.-D.; Sitch, S.; Viovy, N.; et al. FLUXNET and modelling the global carbon cycle. Glob. Chang. Biol. 2007, 13, 610–633. [Google Scholar] [CrossRef]
- Wu, C.; Chen, J.M.; Huang, N. Predicting gross primary production from the enhanced vegetation index and photosynthetically active radiation: Evaluation and calibration. Remote Sens. Environ. 2011, 115, 3424–3435. [Google Scholar] [CrossRef]
- Lieth, H. Modeling the Primary Productivity of the World. In Ecological Studies; Springer Science and Business Media LLC: Berlin/Heidelberg, Germany, 1975; Volume 14, pp. 237–263. [Google Scholar]
- Guo, Q.; Fu, B.; Shi, P.; Cudahy, T.; Zhang, J.; Xu, H. Satellite Monitoring the Spatial-Temporal Dynamics of Desertification in Response to Climate Change and Human Activities across the Ordos Plateau, China. Remote Sens. 2017, 9, 525. [Google Scholar] [CrossRef]
- Liu, Y.; Zhang, Z.; Tong, L.; Khalifa, M.; Wang, Q.; Gang, C.; Wang, Z.; Li, J.; Sun, Z. Assessing the effects of climate variation and human activities on grassland degradation and restoration across the globe. Ecol. Indic. 2019, 106, 105504. [Google Scholar] [CrossRef]
- Harold Edwin, H. Long-term storage capacity of reservoirs. Trans. Am. Soc. Civil Eng. 1951, 116, 770–799. [Google Scholar]
- Mandelbrot, B.B.; Wallis, J.R. Robustness of the rescaled range R/S in the measurement of noncyclic long run statistical dependence. Water Resour. Res. 1969, 5, 967–988. [Google Scholar] [CrossRef]
- Qu, S.; Wang, L.; Lin, A.; Yu, D.; Yuan, M.; Li, C. Distinguishing the impacts of climate change and anthropogenic factors on vegetation dynamics in the Yangtze River Basin, China. Ecol. Indic. 2020, 108, 105724. [Google Scholar] [CrossRef]
- Gang, C.; Wang, Z.; Zhou, W.; Chen, Y.; Li, J.; Chen, J.; Qi, J.; Odeh, I.; Groisman, P. Assessing the Spatiotemporal Dynamic of Global Grassland Water Use Efficiency in Response to Climate Change from 2000 to 2013. J. Agron. Crop Sci. 2015, 202, 343–354. [Google Scholar] [CrossRef]
- Xu, D.; Li, C.; Song, X.; Ren, H. The dynamics of desertification in the farming-pastoral region of North China over the past 10years and their relationship to climate change and human activity. Catena 2014, 123, 11–22. [Google Scholar] [CrossRef]
- Zhou, W.; Gang, C.; Zhou, L.; Chen, Y.; Li, J.; Ju, W.; Odeh, I. Dynamic of grassland vegetation degradation and its quantitative assessment in the northwest China. Acta Oecol. 2014, 55, 86–96. [Google Scholar] [CrossRef]
- Xu, D.; Kang, X.; Zhuang, D.; Pan, J. Multi-scale quantitative assessment of the relative roles of climate change and human activities in desertification—A case study of the Ordos Plateau, China. J. Arid Environ. 2010, 74, 498–507. [Google Scholar] [CrossRef]
- Huang, K.; Zhang, Y.-J.; Zhu, J.; Liu, Y.; Zu, J.; Zhang, J. The Influences of Climate Change and Human Activities on Vegetation Dynamics in the Qinghai-Tibet Plateau. Remote Sens. 2016, 8, 876. [Google Scholar] [CrossRef]
- Tian, H.; Cao, C.; Chen, W.; Bao, S.; Yang, B.; Myneni, R. Response of vegetation activity dynamic to climatic change and ecological restoration programs in Inner Mongolia from 2000 to 2012. Ecol. Eng. 2015, 82, 276–289. [Google Scholar] [CrossRef]
- Horion, S.; Cornet, Y.; Erpicum, M.; Tychon, B. Studying interactions between climate variability and vegetation dynamic using a phenology based approach. Int. J. Appl. Earth Obs. Geoinf. 2013, 20, 20–32. [Google Scholar] [CrossRef]
- Zhang, C.; Wang, X.; Li, J.; Hua, T. Roles of climate changes and human interventions in land degradation: A case study by net primary productivity analysis in China’s Shiyanghe Basin. Environ. Earth Sci. 2011, 64, 2183–2193. [Google Scholar] [CrossRef]
- Zhou, W.; Gang, C.; Zhou, F.; Li, J.; Dong, X.; Zhao, C. Quantitative assessment of the individual contribution of climate and human factors to desertification in northwest China using net primary productivity as an indicator. Ecol. Indic. 2015, 48, 560–569. [Google Scholar] [CrossRef]
- Liu, Y.; Wang, Q.; Zhang, Z.; Tong, L.; Wang, Z.; Li, J. Grassland dynamics in responses to climate variation and human activities in China from 2000 to 2013. Sci. Total Environ. 2019, 690, 27–39. [Google Scholar] [CrossRef]
- Chen, Y.; Mu, S.; Sun, Z.; Gang, C.; Li, J.; Padarian, J.; Groisman, P.; Chen, J.; Li, S. Grassland Carbon Sequestration Ability in China: A New Perspective from Terrestrial Aridity Zones. Rangel. Ecol. Manag. 2016, 69, 84–94. [Google Scholar] [CrossRef]
- Arneth, A.; Kelliher, F.M.; McSeveny, T.M.; Byers, J.N. Net ecosystem productivity, net primary productivity and ecosystem carbon sequestration in a Pinus radiata plantation subject to soil water deficit. Tree Physiol. 1998, 18, 785–793. [Google Scholar] [CrossRef] [PubMed]
- Bai, Y.; Wu, J.; Xing, Q.; Pan, Q.; Huang, J.; Yang, D.; Han, X. Primary production and rain use efficiency across a precipitation gradient on the mongolia plateau. Ecology 2008, 89, 2140–2153. [Google Scholar] [CrossRef]
- Mowll, W.; Blumenthal, D.M.; Cherwin, K.; Smith, A.; Symstad, A.J.; Vermeire, L.; Collins, S.L.; Smith, M.D.; Knapp, A.K. Climatic controls of aboveground net primary production in semi-arid grasslands along a latitudinal gradient portend low sensitivity to warming. Oecologia 2015, 177, 959–969. [Google Scholar] [CrossRef] [PubMed]
- Zheng, Y.; Xie, Z.; Robert, C.; Jiang, L.; Shimizu, H. Did climate drive ecosystem change and induce desertification in Otindag sandy land, China over the past 40 years? J. Arid Environ. 2006, 64, 523–541. [Google Scholar] [CrossRef]
- Zeng, B.; Yang, T.-B. Impacts of climate warming on vegetation in Qaidam Area from 1990 to 2003. Environ. Monit. Assess. 2007, 144, 403–417. [Google Scholar] [CrossRef] [PubMed]
- Zhao, M.; Running, S.W. Drought-Induced Reduction in Global Terrestrial Net Primary Production from 2000 Through 2009. Science 2010, 329, 940–943. [Google Scholar] [CrossRef] [PubMed]
- Cai, H.; Yang, X.; Xu, X. Human-induced grassland degradation/restoration in the central Tibetan Plateau: The effects of ecological protection and restoration projects. Ecol. Eng. 2015, 83, 112–119. [Google Scholar] [CrossRef]
- Wang, Z.; Zhang, Y.; Yang, Y.; Zhou, W.; Gang, C.; Zhang, Y.; Li, J.; An, R.; Wang, K.; Odeh, I.; et al. Quantitative assess the driving forces on the grassland degradation in the Qinghai–Tibet Plateau, in China. Ecol. Inform. 2016, 33, 32–44. [Google Scholar] [CrossRef]
- Mu, S.; Zhou, S.; Chen, Y.; Li, J.; Ju, W.; Odeh, I. Assessing the impact of restoration-induced land conversion and management alternatives on net primary productivity in Inner Mongolian grassland, China. Glob. Planet. Chang. 2013, 108, 29–41. [Google Scholar] [CrossRef]


| International Geosphere–Biosphere Program (IGBP) Scheme | Reclassified Classes |
|---|---|
| Evergreen Needleleaf Forest, Evergreen Broadleaf Forest, Deciduous Needleleaf Forest, Deciduous Broadleaf Forest, Mixed Forest | Mixed Forestland |
| Closed Shrublands, Open Shrublands, Woody Savannas, Savannas, Grasslands, Barren or Sparsely Vegetated, Permanent/Herbaceous Wetlands | Mixed Grassland |
| Croplands, Cropland/Natural Vegetation Mosaic | Mixed Cropland |
| Water Bodies, Urban and Built-Up, Permanent Snow and Ice | Non-vegetated land |
| Vegetation Status | SA | SP | SH | Dominant Factor |
|---|---|---|---|---|
| Increase | + | + | + | Climate-Dominated Vegetation Restoration (CDR) |
| + | - | - | Human-Dominated Vegetation Restoration (HDR) | |
| + | + | - | Both Dominated the Vegetation Restoration (BDR) | |
| + | - | + | Neither Affected the Vegetation Restoration (Error) | |
| Decrease | - | + | + | Human-Dominated Vegetation Degradation (HDD) |
| - | - | - | Climate-Dominated Vegetation Degradation (CDD) | |
| - | - | + | Both Dominated the Vegetation Degradation (BDD) | |
| - | + | - | Neither Affected the Vegetation Degradation (Error) |
| ANPP Slope | P-Value | Hurst Exponent | Consistency and Degree of Vegetation Change |
|---|---|---|---|
| + | < 0.05 | > 0.5 | Consistent and Significant Restoration (CSR) |
| + | > 0.05 | > 0.5 | Consistent and Slight Restoration (CLR) |
| + | < 0.05 | < 0.5 | Inconsistent and Significant Restoration (ISR) |
| + | > 0.05 | < 0.5 | Inconsistent and Slight Restoration (ILR) |
| - | < 0.05 | > 0.5 | Consistent and Significant Degradation (CSD) |
| - | > 0.05 | > 0.5 | Consistent and Slight Degradation (CLD) |
| - | < 0.05 | < 0.5 | Inconsistent and Significant Degradation (ISD) |
| - | > 0.05 | < 0.5 | Inconsistent and Slight Degradation (ILD) |
| Vegetation Status | Tcor | Pcor | Dominant Factor |
|---|---|---|---|
| Increase | + | - | Temperature-Dominated Vegetation Increase (TDI) |
| - | + | Precipitation-Dominated Vegetation Increase (PDI) | |
| + | + | Both Dominated the Increase (BDI) | |
| - | - | Neither Affected the Vegetation Increase (NDI) | |
| Decrease | - | + | Temperature-Dominated Vegetation Decrease (TDD) |
| + | - | Precipitation-Dominated Vegetation Decrease (PDD) | |
| - | - | Both Dominated the Decrease (BDD) | |
| + | + | Neither Affected the Vegetation Decrease (NDD) |
| 2000–2015 | 1985–1999 | |||
|---|---|---|---|---|
| Drivers of NPP Change | Increase (gC m−2 yr−1) | Decrease (gC m−2 yr−1) | Increase (gC m−2 yr−1) | Decrease (gC m−2 yr−1) |
| Climate Variation | 0.56 | 0.29 | 0.21 | 1.41 |
| Human Activities | 0.63 | 0.31 | 0.36 | 0.72 |
| Both | 1.11 | 0.67 | 0.65 | 2.01 |
| NPP Dynamics from 1985–1999 (gC m−2 yr−1) | NPP Dynamics from 2000–2015 (gC m−2 yr−1) | |||
|---|---|---|---|---|
| HFP | HDR | HDD | HDR | HDD |
| < 5 | 0.37 | -0.64 | 0.28 | −0.21 |
| 5–10 | 0.36 | -0.86 | 0.69 | −0.29 |
| 10–15 | 0.34 | -0.76 | 0.78 | −0.32 |
| 15–20 | 0.37 | -0.94 | 0.87 | −0.38 |
| > 20 | 0.40 | -0.93 | 0.85 | −0.51 |
© 2020 by the authors. Licensee MDPI, Basel, Switzerland. This article is an open access article distributed under the terms and conditions of the Creative Commons Attribution (CC BY) license (http://creativecommons.org/licenses/by/4.0/).
Share and Cite
Naeem, S.; Zhang, Y.; Tian, J.; Qamer, F.M.; Latif, A.; Paul, P.K. Quantifying the Impacts of Anthropogenic Activities and Climate Variations on Vegetation Productivity Changes in China from 1985 to 2015. Remote Sens. 2020, 12, 1113. https://doi.org/10.3390/rs12071113
Naeem S, Zhang Y, Tian J, Qamer FM, Latif A, Paul PK. Quantifying the Impacts of Anthropogenic Activities and Climate Variations on Vegetation Productivity Changes in China from 1985 to 2015. Remote Sensing. 2020; 12(7):1113. https://doi.org/10.3390/rs12071113
Chicago/Turabian StyleNaeem, Shahid, Yongqiang Zhang, Jing Tian, Faisal Mueen Qamer, Aamir Latif, and Pranesh Kumar Paul. 2020. "Quantifying the Impacts of Anthropogenic Activities and Climate Variations on Vegetation Productivity Changes in China from 1985 to 2015" Remote Sensing 12, no. 7: 1113. https://doi.org/10.3390/rs12071113
APA StyleNaeem, S., Zhang, Y., Tian, J., Qamer, F. M., Latif, A., & Paul, P. K. (2020). Quantifying the Impacts of Anthropogenic Activities and Climate Variations on Vegetation Productivity Changes in China from 1985 to 2015. Remote Sensing, 12(7), 1113. https://doi.org/10.3390/rs12071113