Object-Based Change Detection of Very High Resolution Images by Fusing Pixel-Based Change Detection Results Using Weighted Dempster–Shafer Theory


Abstract

1. Introduction
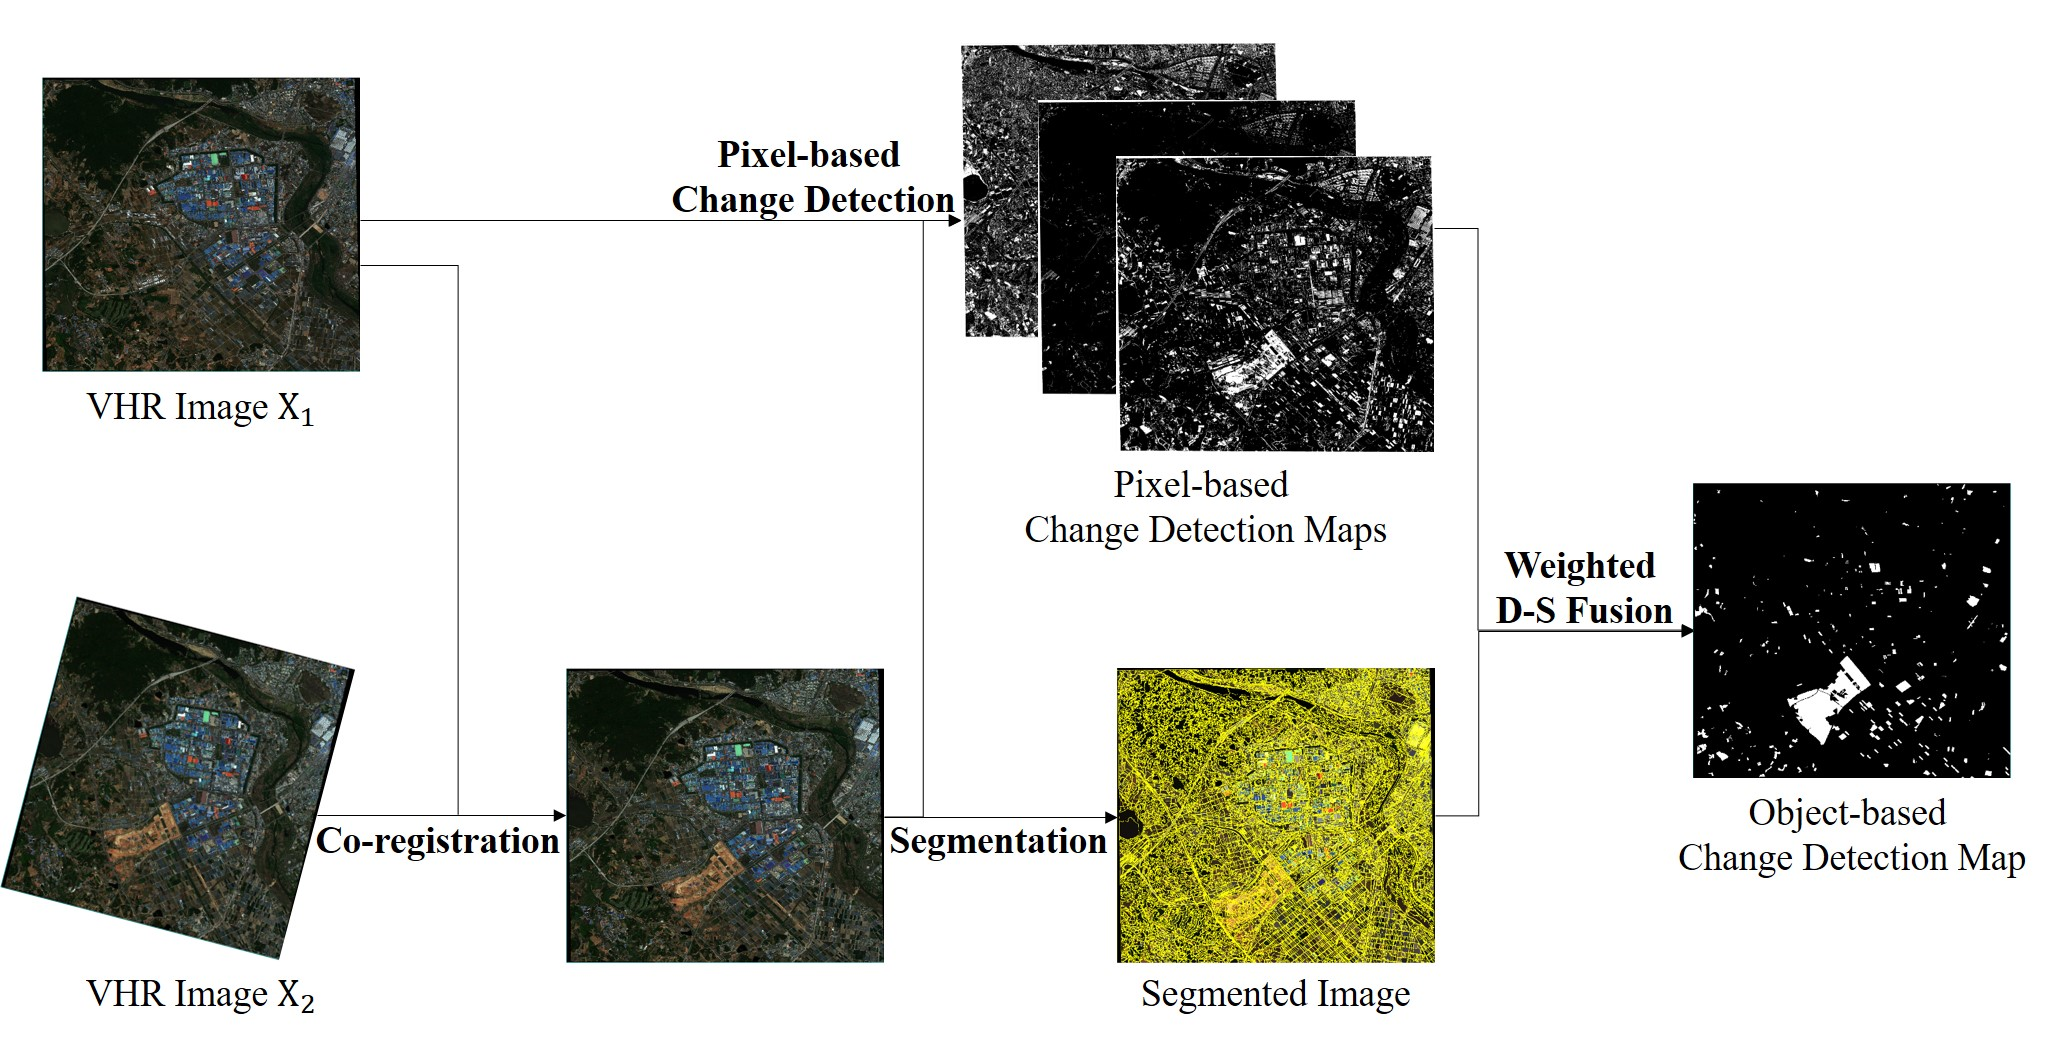
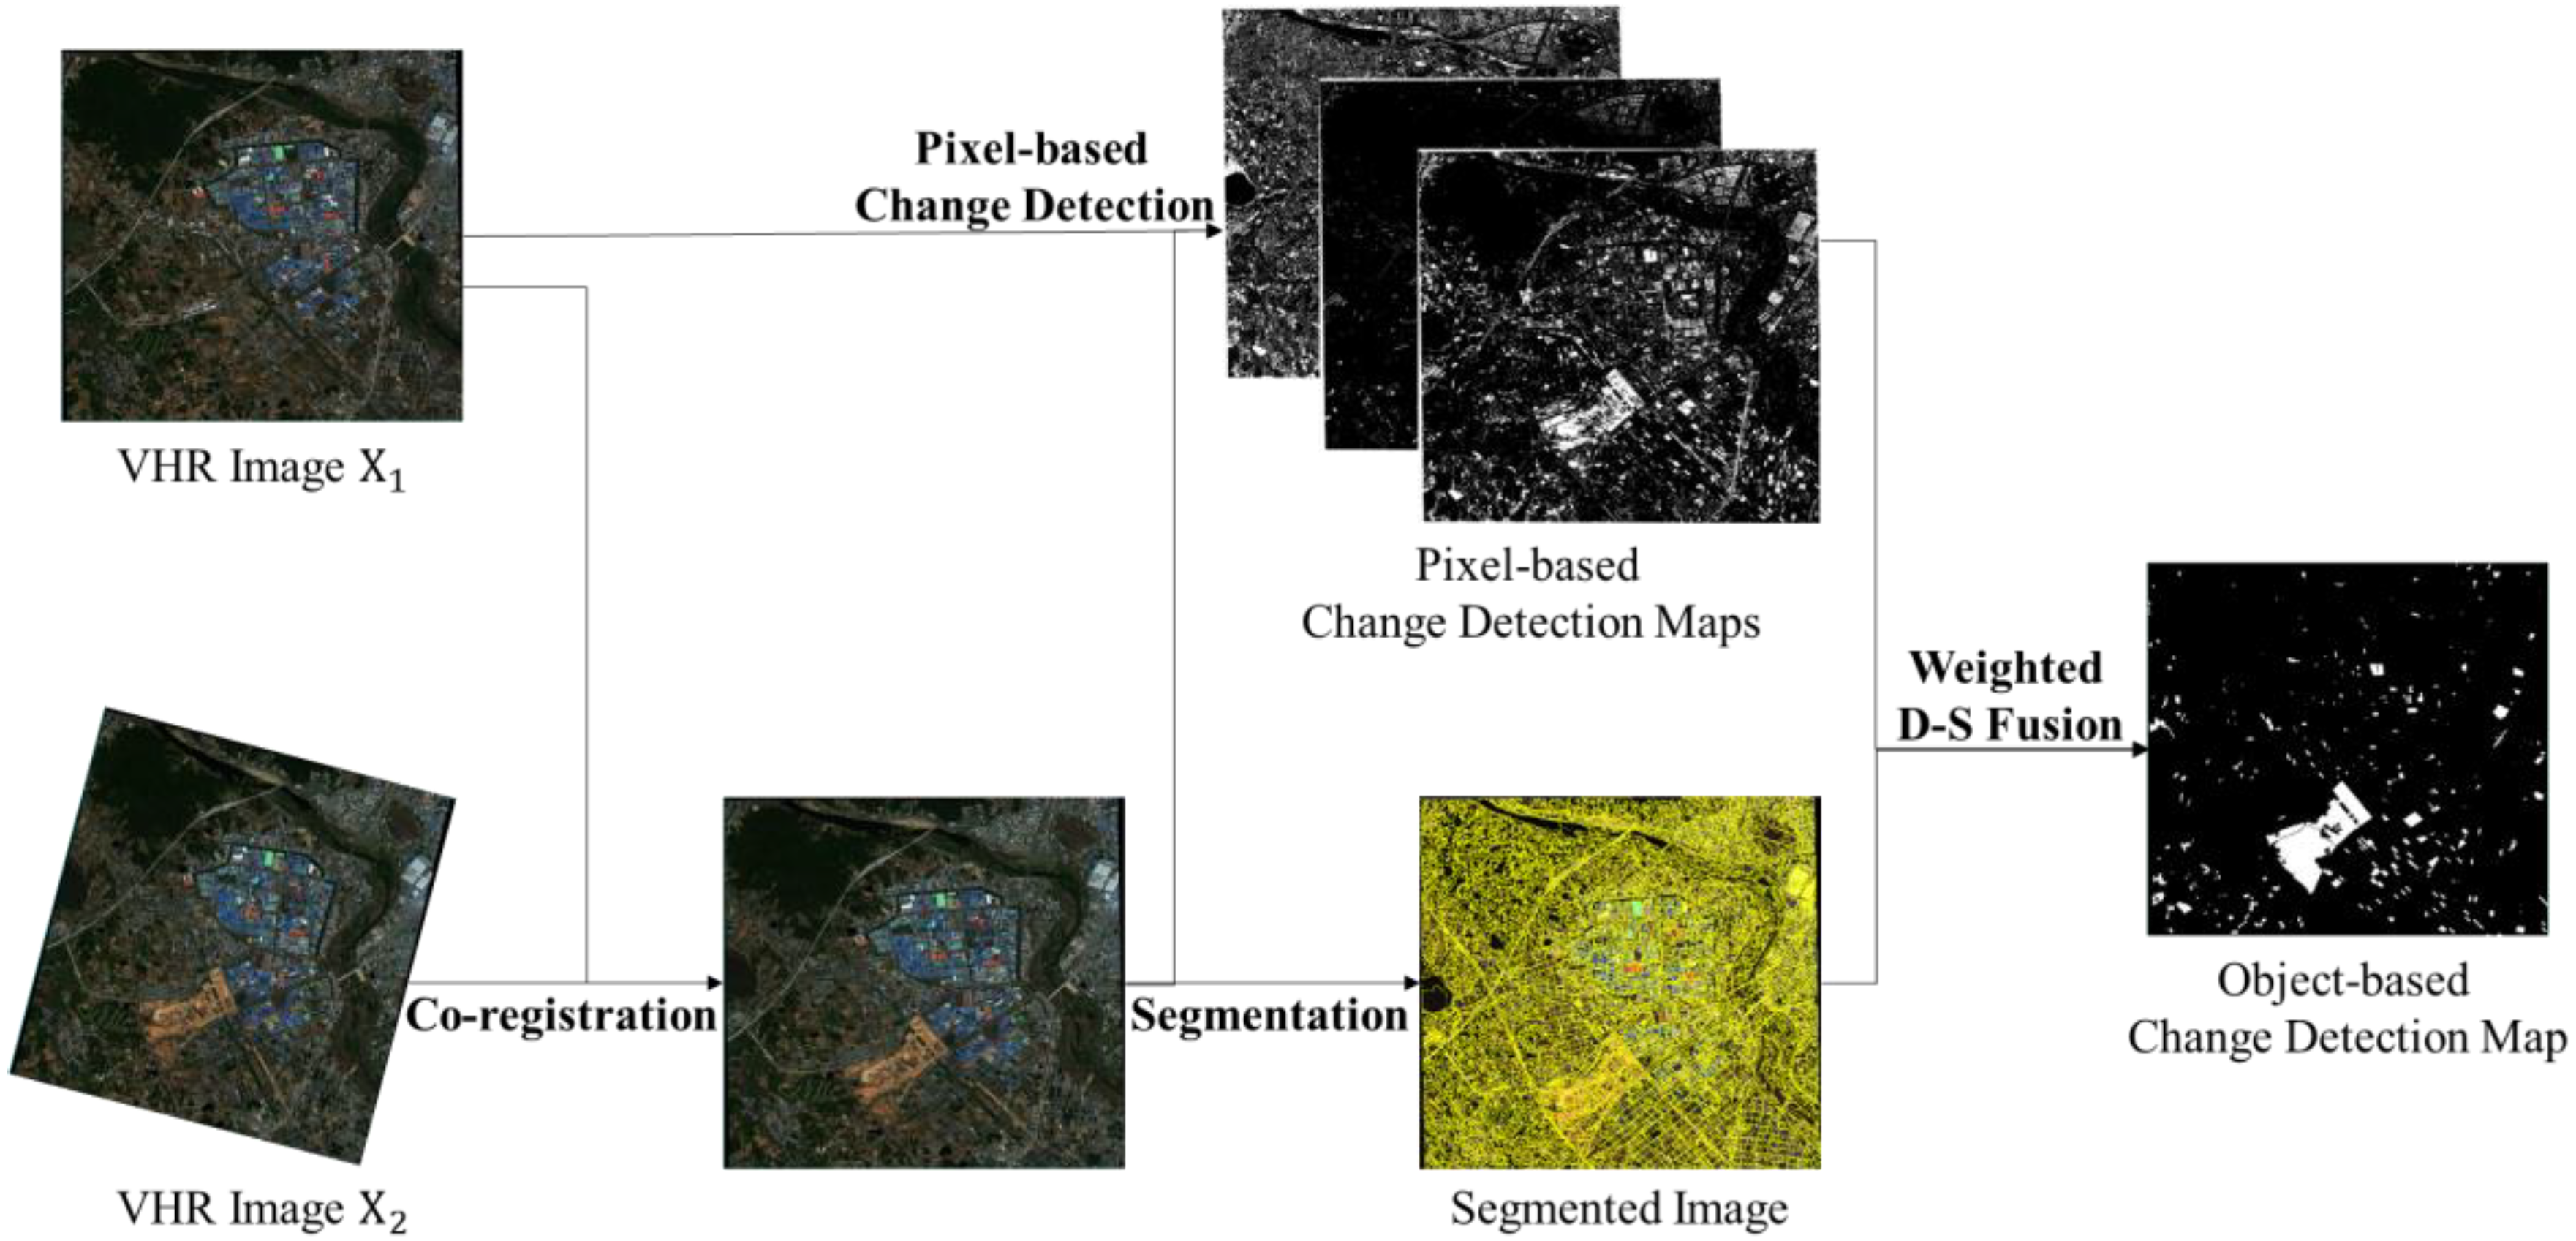
2. Methodology
2.1. Co-Registration
2.2. Image Segmentation
2.3. Pixel-Based Change Detection (PBCD)
2.4. Weighted D-S Theory (wDST) Fusion
3. Experimental Results
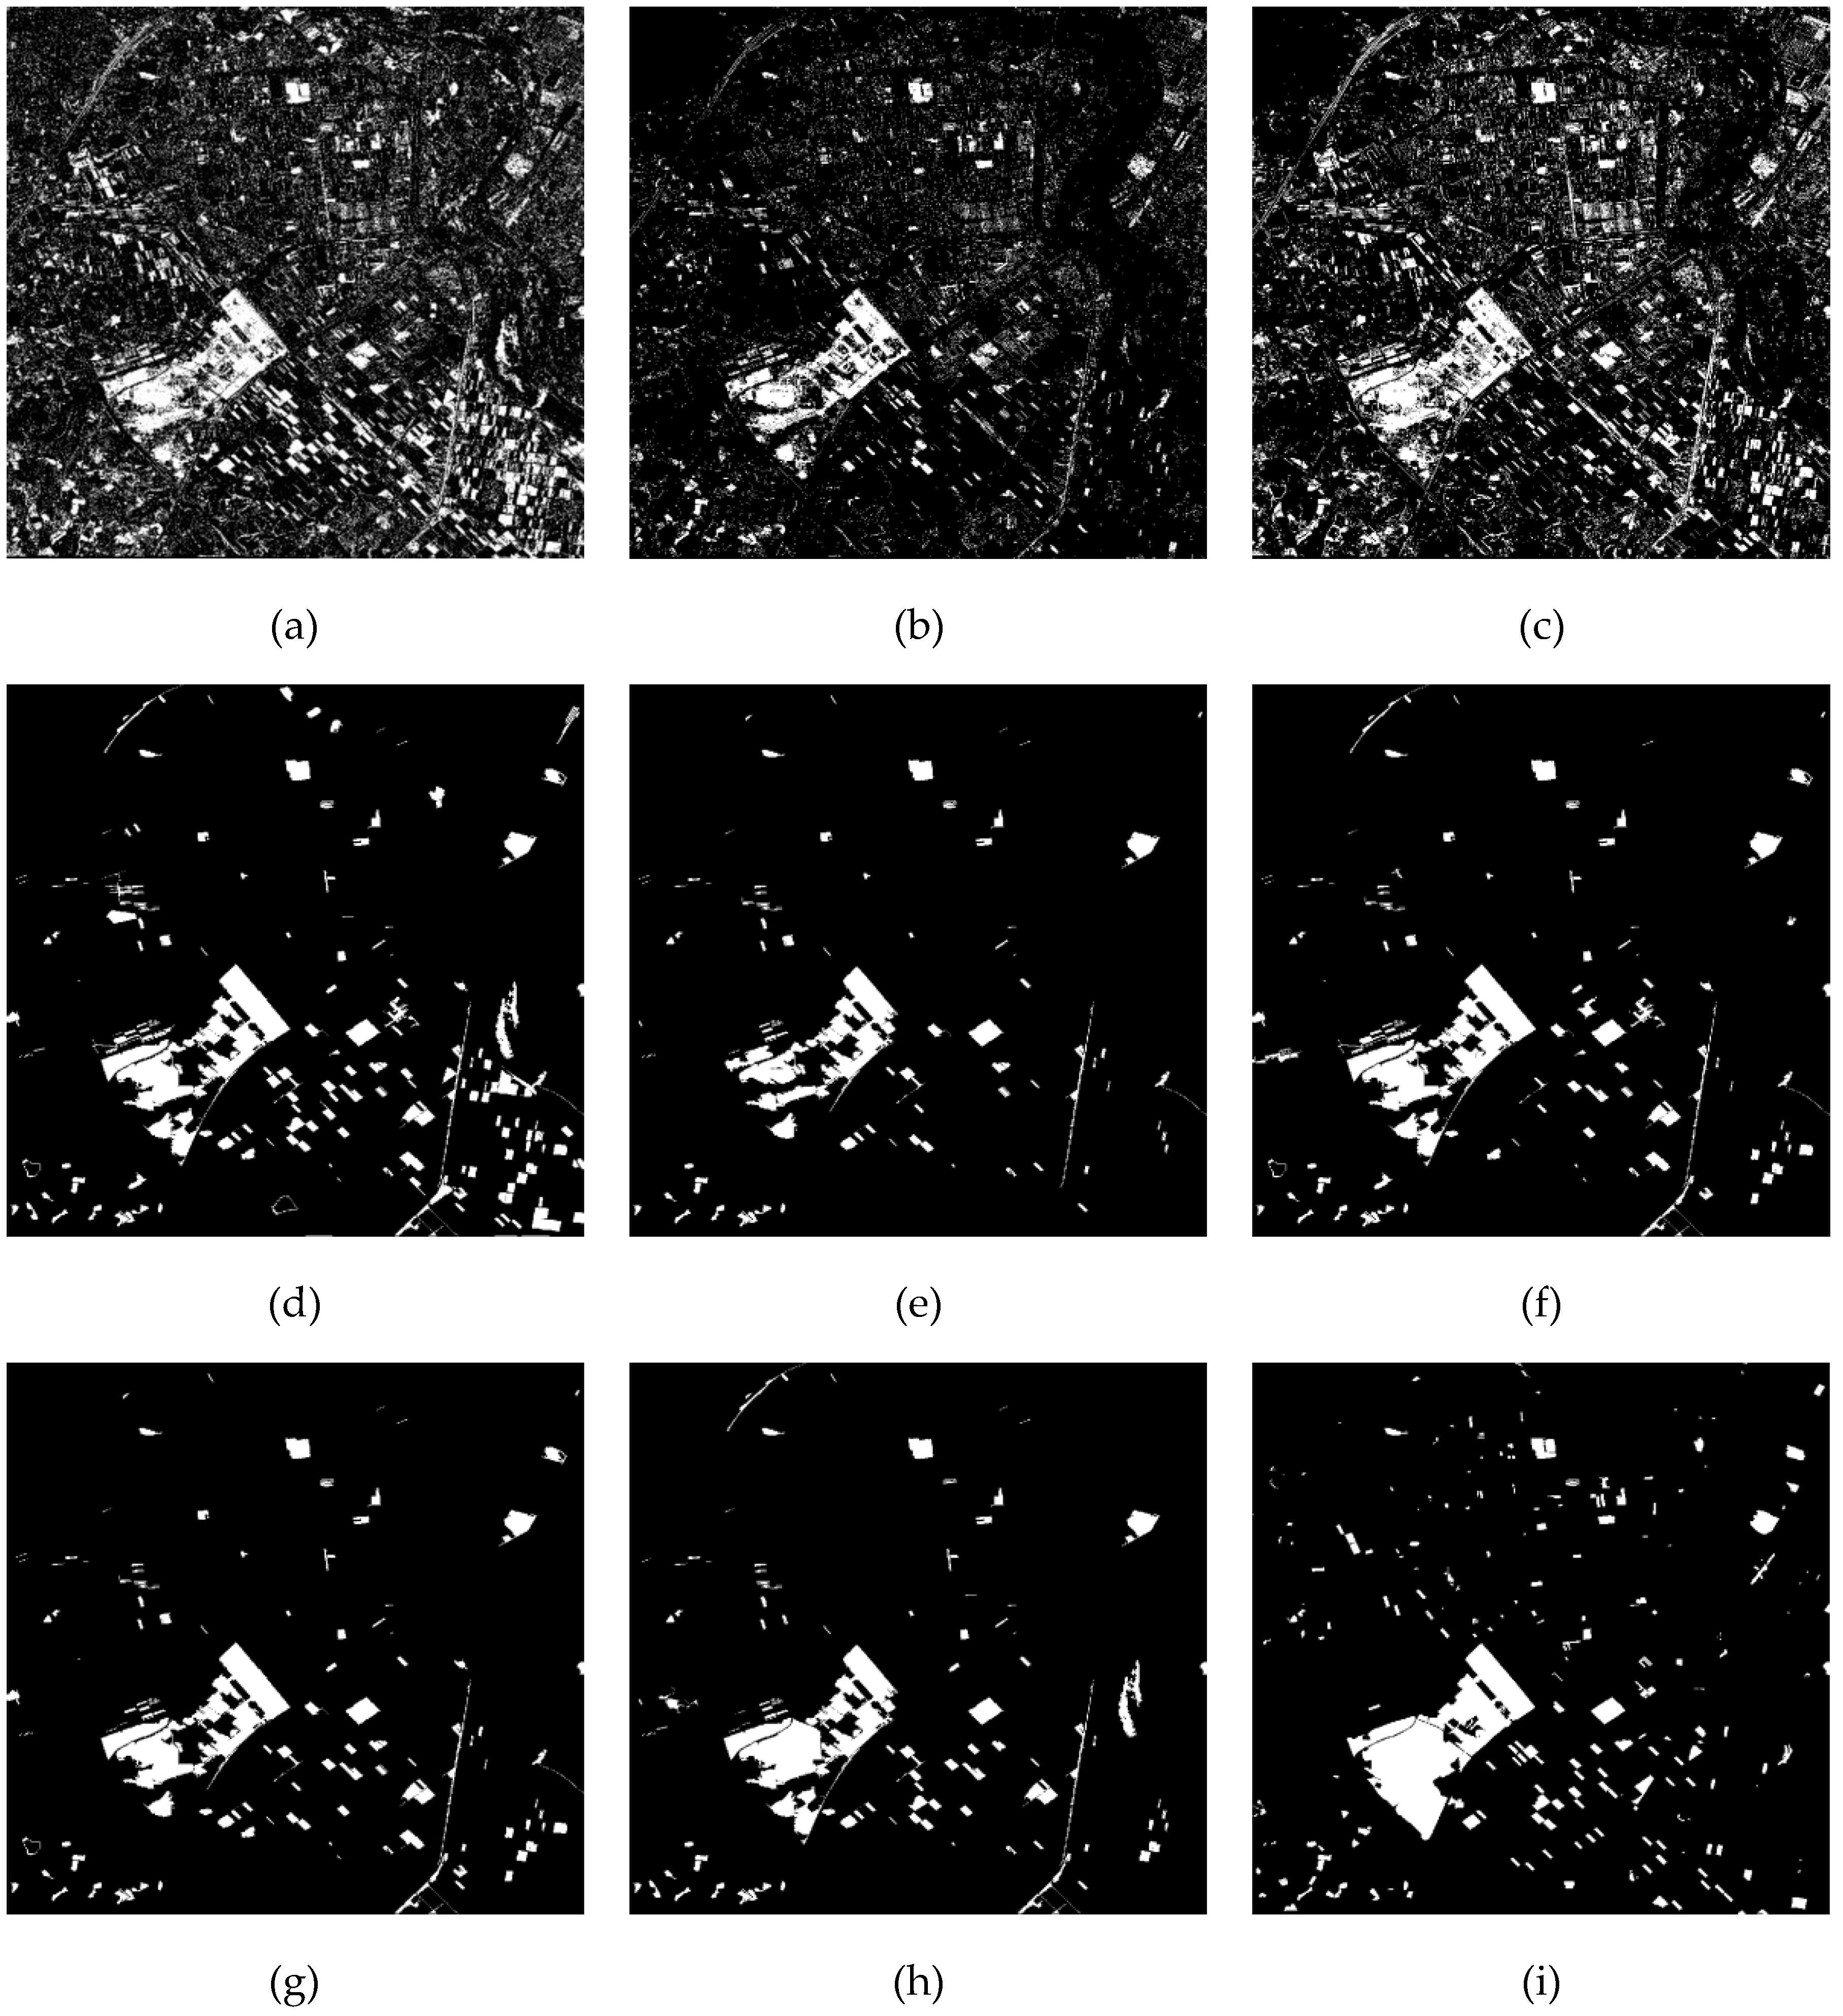
3.1. Experiments on the First Dataset
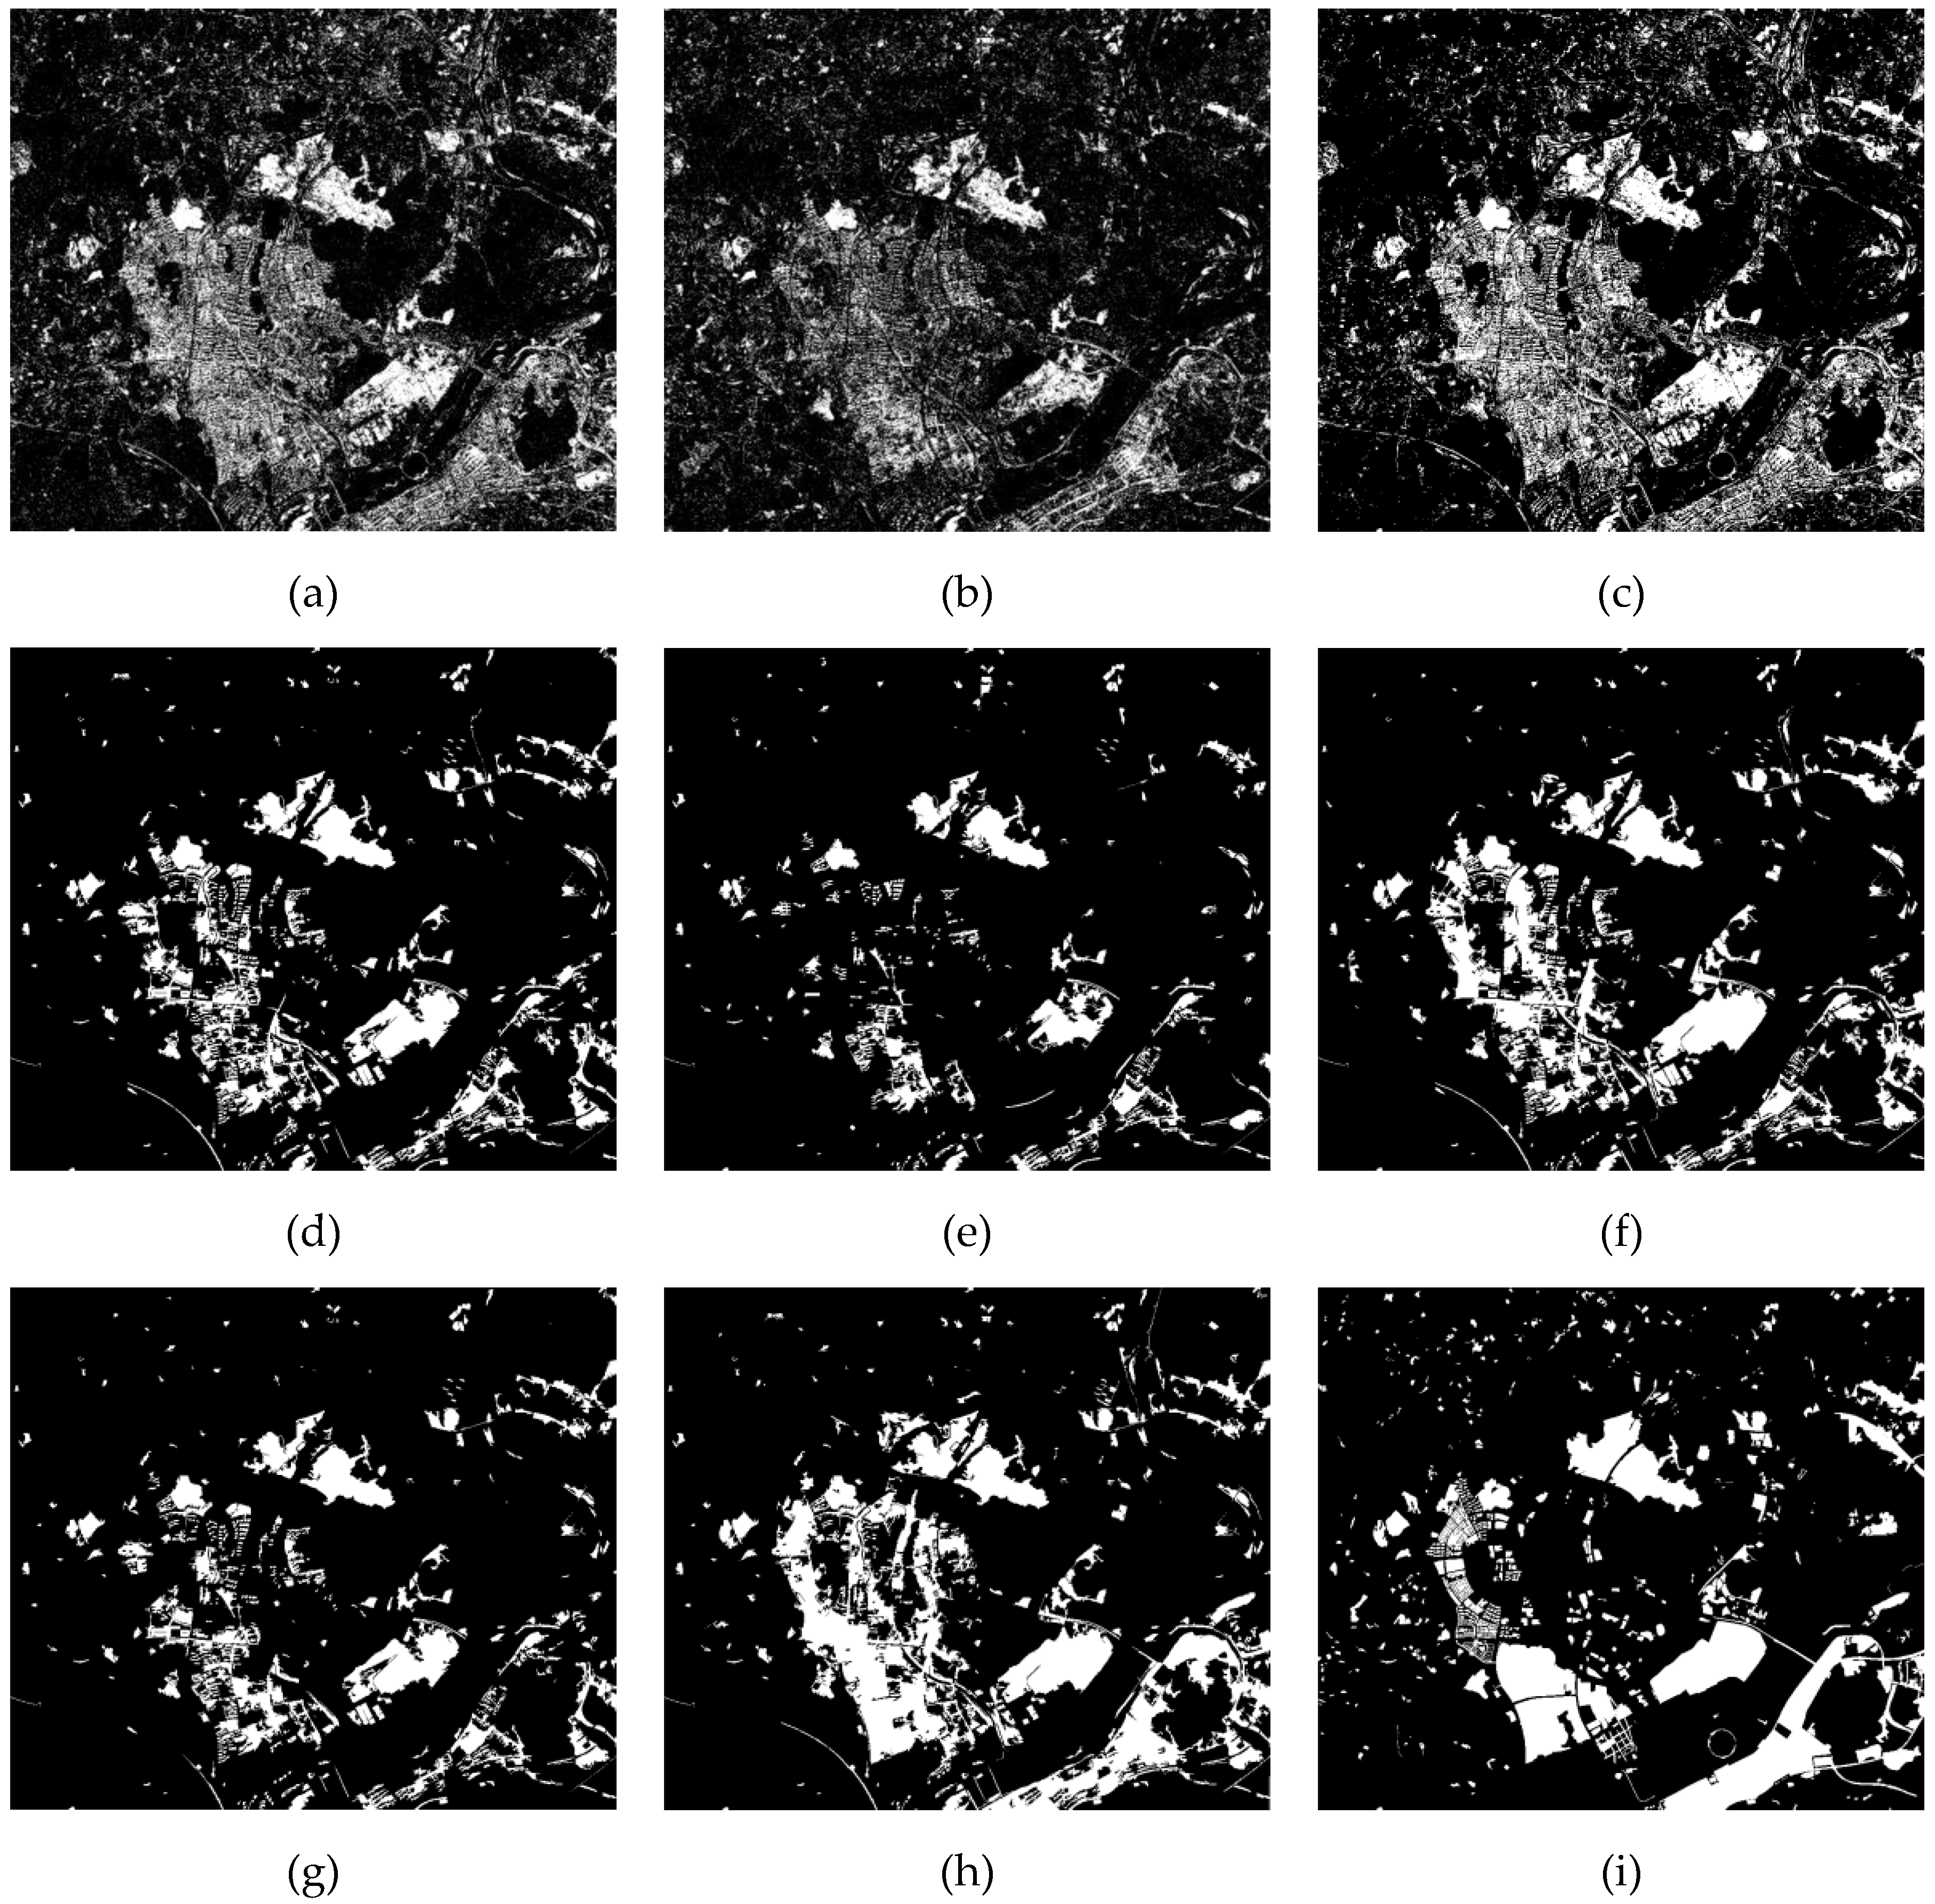
3.2. Experiments on the Second Dataset
4. Discussion
5. Conclusions
Author Contributions
Funding
Conflicts of Interest
References
- Singh, A. Review article digital change detection techniques using remotely-sensed data. Int. J. Remote Sens. 1989, 10, 989–1003. [Google Scholar] [CrossRef]
- Coppin, P.; Jonckheere, I.; Nackaerts, K.; Muys, B.; Lambin, E. Review articledigital change detection methods in ecosystem monitoring: A review. Int. J. Remote Sens. 2004, 25, 1565–1596. [Google Scholar] [CrossRef]
- Zhu, Z. Change detection using Landsat time series: A review of frequencies, preprocessing, algorithms, and applications. ISPRS J. Photogramm. Remote Sens. 2017, 130, 370–384. [Google Scholar] [CrossRef]
- Mahabir, R.; Croitoru, A.; Crooks, A.; Agouris, P.; Stefanidis, A. A critical review of high and very high- resolution remote sensing approaches for detecting and mapping slums: Trends, challenges and emerging opportunities. Urban Sci. 2018, 2, 8. [Google Scholar] [CrossRef]
- Hansen, M.C.; Loveland, T.R. A review of large area monitoring of land cover change using Landsat data. Remote Sens. Environ. 2012, 122, 66–74. [Google Scholar] [CrossRef]
- Dalla Mura, M.; Benediktsson, J.A.; Bovolo, F.; Bruzzone, L. An unsupervised technique based on morphological filters for change detection in very high resolution images. IEEE Geosci. Remote Sens. Lett. 2008, 5, 433–437. [Google Scholar] [CrossRef]
- Falco, N.; Dalla Mura, M.; Bovolo, F.; Benediktsson, J.A.; Bruzzone, L. Change detection in VHR images based on morphological attribute profiles. IEEE Geosci. Remote Sens. Lett. 2012, 10, 636–640. [Google Scholar] [CrossRef]
- Li, Z.; Shi, W.; Zhang, H.; Hao, M. Change detection based on Gabor wavelet features for very high resolution remote sensing images. IEEE Geosci. Remote Sens. Lett. 2017, 14, 783–787. [Google Scholar] [CrossRef]
- Liu, S.; Du, Q.; Tong, X.; Samat, A.; Bruzzone, L. Unsupervised change detection in multispectral remote sensing images via spectral-spatial band expansion. IEEE J. Sel. Top. Appl. Earth Obs. Remote Sens. 2019, 12, 3578–3587. [Google Scholar] [CrossRef]
- Lin, C.; Zhang, P.; Bai, X.; Wang, X.; Du, P. Monitoring artificial surface expansion in ecological redline zones by multi-temporal VHR images. In Proceedings of the 10th International Workshop on the Analysis of Multitemporal Remote Sensing Images (MultiTemp), Shanghai, China, 5–7 August 2019. [Google Scholar]
- Leichtle, T.; Geiß, C.; Wurm, M.; Lakes, T.; Taubenböck, H. Unsupervised change detection in VHR remote sensing imagery–An object-based clustering approach in a dynamic urban environment. Int. J. Appl. Earth Obs. Geoinf. 2017, 54, 15–27. [Google Scholar] [CrossRef]
- Liu, H.; Yang, M.; Chen, J.; Hou, J.; Deng, M. Line-constrained shape feature for building change detection in VHR remote sensing imagery. ISPRS Int. J. Geo-Inf. 2018, 7, 410. [Google Scholar] [CrossRef]
- Schepaschenko, D.; See, L.; Lesiv, M.; Bastin, J.F.; Mollicone, D.; Tsendbazar, N.-E.; Bastin, L.; McCallum, I.; Bayas, J.C.L.; Baklanov, A.; et al. Recent advances in forest observation with visual interpretation of very high-resolution imagery. Surv. Geophys. 2019, 40, 839–862. [Google Scholar] [CrossRef]
- Byun, Y.; Han, Y.; Chae, T. Image fusion-based change detection for flood extent extraction using bi-temporal very high-resolution satellite images. Remote Sens. 2015, 7, 10347–10363. [Google Scholar] [CrossRef]
- Bovolo, F.; Bruzzone, L. A theoretical framework for unsupervised change detection based on change vector analysis in the polar domain. IEEE Trans. Geosci. Remote Sens. 2007, 45, 218–236. [Google Scholar] [CrossRef]
- Ridd, M.K.; Liu, J. A comparison of four algorithms for change detection in an urban environment. Remote Sens. Environ. 1998, 63, 95–100. [Google Scholar] [CrossRef]
- Carvalho Júnior, O.A.; Guimarães, R.F.; Gillespie, A.R.; Silva, N.C.; Gomes, R.A.T. A new approach to change vector analysis using distance and similarity measures. Remote Sens. 2011, 3, 2473–2493. [Google Scholar] [CrossRef]
- Liu, S.; Marinelli, D.; Bruzzone, L.; Bovolo, F. A review of change detection in multitemporal hyperspectral images: Current techniques, applications, and challenges. IEEE Geosci. Remote Sens. Mag. 2019, 7, 140–158. [Google Scholar] [CrossRef]
- Zheng, Z.; Cao, J.; Lv, Z.; Benediktsson, J.A. Spatial–spectral feature fusion coupled with multi-scale segmentation voting decision for detecting land cover change with VHR remote sensing images. Remote Sens. 2019, 11, 1903. [Google Scholar] [CrossRef]
- Lu, J.; Li, J.; Chen, G.; Zhao, L.; Xiong, B.; Kuang, G. Improving pixel-based change detection accuracy using an object-based approach in multitemporal SAR Flood Images. IEEE J. Sel. Top. Appl. Earth Obs. Remote Sens. 2015, 8, 3486–3496. [Google Scholar] [CrossRef]
- Chen, G.; Hay, G.J.; Carvalho, L.M.; Wulder, M.A. Object-based change detection. Int. J. Remote Sens. 2012, 33, 4434–4457. [Google Scholar] [CrossRef]
- Han, Y.; Bovolo, F.; Bruzzone, L. Edge-based registration-noise estimation in VHR multitemporal and multisensor images. IEEE Geosci. Remote Sens. Lett. 2016, 13, 1231–1235. [Google Scholar] [CrossRef]
- Tang, Y.; Zhang, L.; Huang, X. Object-oriented change detection based on the Kolmogorov–Smirnov test using high-resolution multispectral imagery. Int. J. Remote Sens. 2011, 32, 5719–5740. [Google Scholar] [CrossRef]
- Wang, X.; Liu, S.; Du, P.; Liang, H.; Xia, J.; Li, Y. Object-based change detection in urban areas from high spatial resolution images based on multiple features and ensemble learning. Remote Sens. 2018, 10, 276. [Google Scholar] [CrossRef]
- Keyport, R.N.; Oommen, T.; Martha, T.R.; Sajinkumar, K.S.; Gierke, J.S. A comparative analysis of pixel-and object-based detection of landslides from very high-resolution images. Int. J. Appl. Earth Obs. Geoinf. 2018, 64, 1–11. [Google Scholar] [CrossRef]
- Hussain, M.; Chen, D.; Cheng, A.; Wei, H.; Stanley, D. Change detection from remotely sensed images: From pixel-based to object-based approaches. ISPRS J. Photogramm. Remote Sens. 2013, 80, 91–106. [Google Scholar] [CrossRef]
- Ma, L.; Li, M.; Blaschke, T.; Ma, X.; Tiede, D.; Cheng, L.; Chen, Z.; Chen, D. Object-based change detection in urban areas: The effects of segmentation strategy, scale, and feature space on unsupervised methods. Remote Sens. 2016, 8, 761. [Google Scholar] [CrossRef]
- Lv, Z.; Liu, T.; Wan, Y.; Benediktsson, J.A.; Zhang, X. Post-processing approach for refining raw land cover change detection of very-high-resolution remote sensing images. Remote Sens. 2018, 10, 472. [Google Scholar] [CrossRef]
- Cui, G.; Lv, Z.; Li, G.; Atli Benediktsson, J.; Lu, Y. Refining land cover classification maps based on dual-adaptive majority voting strategy for very high resolution remote sensing images. Remote Sens. 2018, 10, 1238. [Google Scholar] [CrossRef]
- Cai, L.; Shi, W.; Zhang, H.; Hao, M. Object-oriented change detection method based on adaptive multi-method combination for remote-sensing images. Int. J. Remote Sens. 2016, 37, 5457–5471. [Google Scholar] [CrossRef]
- Feizizadeh, B.; Blaschke, T.; Tiede, D.; Moghaddam, M.H.R. Evaluating fuzzy operators of an object-based image analysis for detecting landslides and their changes. Geomorphology 2017, 293, 240–254. [Google Scholar] [CrossRef]
- Luo, H.; Liu, C.; Wu, C.; Guo, X. Urban change detection based on dempster-shafer theory for multitemporal very-high-resolution imagery. Remote Sens. 2018, 10, 980. [Google Scholar] [CrossRef]
- Du, P.; Liu, S.; Xia, J.; Zhao, Y. Information fusion techniques for change detection from multi-temporal remote sensing images. Inf. Fusion 2013, 14, 19–27. [Google Scholar] [CrossRef]
- Du, P.; Liu, S.; Gamba, P.; Tan, K.; Xia, J. Fusion of difference images for change detection over urban areas. IEEE J. Sel. Top. Appl. Earth Obs. Remote Sens. 2012, 5, 1076–1086. [Google Scholar] [CrossRef]
- Dutta, P. An uncertainty measure and fusion rule for conflict evidences of big data via dempster–shafer theory. Int. J. Image Data Fusion 2018, 9, 152–169. [Google Scholar] [CrossRef]
- Luo, H.; Wang, L.; Shao, Z.; Li, D. Development of a multi-scale object-based shadow detection method for high spatial resolution image. Remote Sens. Lett. 2015, 6, 59–68. [Google Scholar] [CrossRef]
- Hegarat-Mascle, S.L.; Bloch, I.; Vidal-Madjar, D. Application of dempster-shafer evidence theory to unsupervised classification in multisource remote sensing. IEEE Trans. Geosci. Remote Sens. 1997, 35, 1018–1031. [Google Scholar] [CrossRef]
- Hao, M.; Shi, W.; Zhang, H.; Wang, Q.; Deng, K. A scale-driven change detection method incorporating uncertainty analysis for remote sensing images. Remote Sens. 2016, 8, 745. [Google Scholar] [CrossRef]
- Lu, Y.H.; Trinder, J.C.; Kubik, K. Automatic building detection using the dempster-shafer algorithm. Photogramm. Eng. Remote Sens. 2006, 72, 395–403. [Google Scholar] [CrossRef]
- Nielsen, A.A. The regularized iteratively reweighted MAD method for change detection in multi-and hyperspectral data. IEEE Trans. Image Process. 2007, 16, 463–478. [Google Scholar] [CrossRef]
- Celik, T. Unsupervised change detection in satellite images using principal component analysis and K-means clustering. IEEE Geosci. Remote Sens. Lett. 2009, 6, 772–776. [Google Scholar] [CrossRef]
- Han, Y.; Kim, T.; Yeom, J. Improved piecewise linear transformation for precise warping of very-high-resolution remote sensing images. Remote Sens. 2019, 11, 2235. [Google Scholar] [CrossRef]
- Aguilar, M.A.; del Mar Saldana, M.; Aguilar, F.J. Assessing geometric accuracy of the orthorectification process from GeoEye-1 and WorldView-2 panchromatic images. Int. J. Appl. Earth Obs. Geoinf. 2013, 21, 427–435. [Google Scholar] [CrossRef]
- Gašparović, M.; Dobrinić, D.; Medak, D. Geometric accuracy improvement of WorldView–2 imagery using freely available DEM data. Photogramm. Rec. 2019, 34, 266–281. [Google Scholar] [CrossRef]
- Han, Y.; Choi, J.; Jung, J.; Chang, A.; Oh, S.; Yeom, J. Automated co-registration of multi-sensor orthophotos generated from unmanned aerial vehicle platforms. J. Sens. 2019, 2019, 2962734. [Google Scholar] [CrossRef]
- Reddy, B.S.; Chatterji, B.N. An FFT-based technique for translation, rotation, and scale-invariant image registration. IEEE Trans. Image Process. 1996, 5, 1266–1271. [Google Scholar] [CrossRef]
- Belgiu, M.; Drǎguţ, L. Comparing supervised and unsupervised multiresolution segmentation approaches for extracting buildings from very high resolution imagery. ISPRS J. Photogramm. Remote Sens. 2014, 96, 67–75. [Google Scholar] [CrossRef]
- Ma, L.; Li, M.; Ma, X.; Cheng, L.; Du, P.; Liu, Y. A review of supervised object-based land-cover image classification. ISPRS J. Photogramm. Remote Sens. 2017, 130, 277–293. [Google Scholar] [CrossRef]
- Liu, S.; Du, Q.; Tong, X.; Samat, A.; Bruzzone, L.; Bovolo, F. Multiscale morphological compressed change vector analysis for unsupervised multiple change detection. IEEE J. Sel. Top. Appl. Earth Obs. Remote Sens. 2017, 10, 4124–4137. [Google Scholar] [CrossRef]
- Shafer, G. Dempster-shafer theory. Encycl. Artif. Intell. 1992, 1, 330–331. [Google Scholar]
- Padwick, C.; Deskevich, M.; Pacifici, F.; Smallwood, S. WorldView-2 pansharpening. In Proceedings of the ASPRS 2010 Annual Conference, San Diego, CA, USA, 26–30 April 2010. [Google Scholar]
- Belfiore, O.R.; Parente, C. Orthorectification and pan-sharpening of WorldView-2 satellite imagery to produce high resolution coloured ortho-photos. Mod. Appl. Sci. 2015, 9, 122–130. [Google Scholar]
- Gašparović, M.; Jogun, T. The effect of fusing Sentinel-2 bands on land-cover classification. Int. J. Remote Sens. 2018, 39, 822–841. [Google Scholar] [CrossRef]


| Accuracy | Pixel-Based Change Detection | Object-Based Change Detection | ||||||
|---|---|---|---|---|---|---|---|---|
| CVA | IRMAD | PCA | CVA | IRMAD | PCA | Majority Voting | Proposed | |
| FAR | 0.168 | 0.050 | 0.130 | 0.031 | 0.007 | 0.019 | 0.015 | 0.014 |
| MR | 0.232 | 0.422 | 0.352 | 0.374 | 0.536 | 0.448 | 0.452 | 0.416 |
| OA (%) | 82.780 | 85.532 | 92.542 | 94.644 | 95.783 | 95.269 | 95.614 | 95.877 |
| Kappa | 0.304 | 0.470 | 0.309 | 0.582 | 0.575 | 0.585 | 0.603 | 0.633 |
| F1-score | 0.374 | 0.375 | 0.510 | 0.610 | 0.596 | 0.610 | 0.626 | 0.655 |
| Accuracy | Pixel-Based Change Detection | Object-Based Change Detection | ||||||
|---|---|---|---|---|---|---|---|---|
| CVA | IRMAD | PCA | CVA | IRMAD | PCA | Majority Voting | Proposed | |
| FAR | 0.135 | 0.090 | 0.129 | 0.053 | 0.020 | 0.129 | 0.042 | 0.088 |
| MR | 0.435 | 0.545 | 0.411 | 0.523 | 0.674 | 0.464 | 0.553 | 0.322 |
| OA (%) | 81.827 | 82.726 | 83.867 | 87.389 | 87.763 | 86.645 | 87.839 | 87.533 |
| Kappa | 0.385 | 0.374 | 0.413 | 0.471 | 0.398 | 0.478 | 0.468 | 0.555 |
| F1-score | 0.493 | 0.516 | 0.469 | 0.542 | 0.455 | 0.557 | 0.535 | 0.630 |
© 2020 by the authors. Licensee MDPI, Basel, Switzerland. This article is an open access article distributed under the terms and conditions of the Creative Commons Attribution (CC BY) license (http://creativecommons.org/licenses/by/4.0/).
Share and Cite
Han, Y.; Javed, A.; Jung, S.; Liu, S. Object-Based Change Detection of Very High Resolution Images by Fusing Pixel-Based Change Detection Results Using Weighted Dempster–Shafer Theory. Remote Sens. 2020, 12, 983. https://doi.org/10.3390/rs12060983
Han Y, Javed A, Jung S, Liu S. Object-Based Change Detection of Very High Resolution Images by Fusing Pixel-Based Change Detection Results Using Weighted Dempster–Shafer Theory. Remote Sensing. 2020; 12(6):983. https://doi.org/10.3390/rs12060983
Chicago/Turabian StyleHan, Youkyung, Aisha Javed, Sejung Jung, and Sicong Liu. 2020. "Object-Based Change Detection of Very High Resolution Images by Fusing Pixel-Based Change Detection Results Using Weighted Dempster–Shafer Theory" Remote Sensing 12, no. 6: 983. https://doi.org/10.3390/rs12060983
APA StyleHan, Y., Javed, A., Jung, S., & Liu, S. (2020). Object-Based Change Detection of Very High Resolution Images by Fusing Pixel-Based Change Detection Results Using Weighted Dempster–Shafer Theory. Remote Sensing, 12(6), 983. https://doi.org/10.3390/rs12060983