Article

Automated Aerosol Classification from Spectral UV Measurements Using Machine Learning Clustering

1
Laboratory of Atmospheric Physics, Physics Department, Aristotle University of Thessaloniki, 54124 Thessaloniki, Greece
2
Aosta Valley Regional Environmental Protection Agency (ARPA), 11020 Saint-Christophe, Italy
*
Author to whom correspondence should be addressed.
Remote Sens. 2020, 12(6), 965; https://doi.org/10.3390/rs12060965
Submission received: 20 February 2020 / Revised: 10 March 2020 / Accepted: 13 March 2020 / Published: 17 March 2020
(This article belongs to the Section Atmospheric Remote Sensing)

Abstract

:
In this study, we present an aerosol classification technique based on measurements of a double monochromator Brewer spectrophotometer during the period 1998–2017 in Thessaloniki, Greece. A machine learning clustering procedure was applied based on the Mahalanobis distance metric. The classification process utilizes the UV Single Scattering Albedo (SSA) at 340 nm and the Extinction Angstrom Exponent (EAE) at 320–360 nm that are obtained from the spectrophotometer. The analysis is supported by measurements from a CIMEL sunphotometer that were deployed in order to establish the training dataset of Brewer measurements. By applying the Mahalanobis distance algorithm to the Brewer timeseries, we automatically assigned measurements in one of the following clusters: Fine Non Absorbing Mixtures (FNA): 64.7%, Black Carbon Mixtures (BC): 17.4%, Dust Mixtures (DUST): 8.1%, and Mixed: 9.8%. We examined the clustering potential of the algorithm by reclassifying the training dataset and comparing it with the original one and also by using manually classified cases. The typing score of the Mahalanobis algorithm is high for all predominant clusters FNA: 77.0%, BC: 63.9%, and DUST: 80.3% when compared with the training dataset. We obtained high scores as well FNA: 100.0%, BC: 66.7%, and DUST: 83.3% when comparing it with the manually classified dataset. The flags obtained here were applied in the timeseries of the Aerosol Optical Depth (AOD) at 340 nm of the Brewer and the CIMEL in order to compare between the two and also stress the future impact of the proposed clustering technique in climatological studies of the station.

Graphical Abstract

1. Introduction

Atmospheric particles are omnipresent in the earth’s atmosphere, interacting with solar radiation and the ecosystems. While particles are often referred to with the umbrella term aerosols, in principle, they form a mixture of multiple variant components. These components can be of different phases, either solid or liquid, vary significantly in size and shape, and originate from different sources. Identifying the nature of the predominant aerosol component is important as individual species interact in different ways with solar radiation (e.g., [1]). In addition, their toxicity, and the potential to inhale can also vary considerably, (e.g., [2]). While in situ instruments (e.g., nephelometers, aethalometers, mass spectrometers, particle counters) are excellent in identifying these individual components near the earth’s surface, it is both challenging and costly to perform such measurements in elevated layers. Remote sensing instruments (e.g., sunphotometers, spectrophotometers, lidars), on the other hand, allow aerosol monitoring in distant atmospheric regions (e.g., [3,4]).
Multiple aerosol classification techniques have been proposed based on measurements from remote sensing instruments. For instance, Ref. [5] use optical and microphysical aerosol properties such as the SSA, the complex refractive index, and the EAE and the Absorption Angstrom Exponents (AAE) in the visible spectrum to classify aerosols on global scale using sunphotometer measurements. Ref. [6] use thresholds on the fine mode fraction (FMF) at 550 nm and the SSA at 440 nm to classify sunphotometer measurements in seven categories based on size and absorptivity. Ref. [7] used a simple graphical method involving the AOD, the EAE and the spectral dependence of the EAE, and classified aerosols in different categories for stations in three different continents (Asia, America, Europe). They showed that fine aerosols are dominant in heavily polluted sites. Furthermore they showed that in Rome, Italy (a typical Mediterranean urban site such as Thessaloniki) the contribution of mineral dust in the aerosol mixture is important, in contrast to the rural site of Ispra, Italy (400 km north of Rome), for which the contribution of mineral dust is small. Refs. [8,9], both used sunphotometer measurements of the AOD and the EAE in order to classify aerosols in El Arenossilo, Spain and South Italy respectively. In both studies the significant role of dust aerosols was pointed out. Refs. [10,11] used estimates of the AOD at 550 nm and the fine-mode fraction data from Terra Moderate Resolution Imaging Spectroradiometer (MODIS) and air-mass back-trajectories for Athens, for the period February 2000–December 2005 and classified aerosols in three different categories: urban/industrial, clean maritime, and coarse-mode aerosols. They showed that for the majority of the studied cases the contribution of all the above types in the aerosol mixture is significant. Refs. [12,13] define thresholds for the classification of aerosol layers based on the depolarization ratio, and the extinction to backscatter ratio obtained from an airborne high spectral resolution lidar and two multi-wavelength depolarization Raman lidars, respectively. Finally, Refs. [14,15,16,17] all use machine learning techniques based on lidar measurements to automatically characterize individual aerosol layers.
While lidar systems and sunphotometers are a common approach to aerosol remote sensing they are not the only instruments capable of performing such measurements. Brewer spectrophotometers were originally developed for monitoring the total columns of ozone ( O 3 ) and sulfur dioxide ( S O 2 ) [18,19] and near the end of the 1980s, they were modified to perform spectral measurements of the global UV irradiance (e.g., [20]). The direct sun measurements used for the retrieval of the total columns of O 3 and S O 2 are frequently calibrated using the Langley plot methodology in order to retrieve the AOD at wavelengths between 305 and 320 nm [21,22,23]. However, using the particular methodology to retrieve the AOD in polluted environments is uncertain [24]. Ref. [20] developed an alternative calibration method which is thereon used instead of the Langley method for the retrieval of the AOD at the Laboratory of Atmospheric Physics (LAP) in Thessaloniki, Greece. Since 1997 different types of measurements are performed by the double monochromator Brewer with serial number 86 (Brewer#086) at the particular station, and quantities such as the AOD and the EAE in the range 320–360 nm [25], as well as the SSA and the Absorption AOD (AAOD) at wavelengths 310–360 nm with a step of 10 nm are operationally retrieved [26]. Although not standard, the temporal resolution of the measurements is adequate with spectral scans being typically less than 30 min apart during regular operation of the instrument.
Aerosol mixtures dominated by brown carbon or dust absorb more effectively the UV than the visible solar radiation, with the absorption efficiency of the particular aerosol types increasing fast with decreasing wavelength in the UV [1,27,28]. Thus, accurate measurements of the aerosol absorption optical properties in the particular spectral region can provide valuable information regarding the dominant species in the mixture and contribute significantly to the characterization of aerosol mixtures. In addition, the strong absorption of UV radiation by particular types of aerosols makes changes in the aerosol mixture one of the key factors affecting the levels of the UV irradiance at the surface, especially over polluted urban environments. However, measurements of the absorption properties of aerosols are currently available only from a limited number of stations around the world, and in most cases only for short time periods (e.g., [26,29,30,31,32,33]). Furthermore, the aerosol classification potential from spectrophotometers has not been studied yet as remote sensing literature is mainly focused on characterizing sunphotometer and lidar data.
In this study, we describe the development of an automated aerosol classification technique using spectral UV measurements from a double monochromator Brewer spectrophotometer. We used measurements performed during the period 1998–2017 at LAP in Thessaloniki, Greece ( 40.63 , 22.95 , 50 m) in order to automatically identify the predominant aerosol type in the atmospheric column using a supervised machine learning approach. Data from a collocated CIMEl sunphotometer were also used to support the methodology. The proposed technique is based on the Mahalanobis distance metric [34] which is rather common in cluster analysis. It has already been applied for the classification of columnar aerosol data acquired by sunphotometers (e.g., [5]) and also of aerosol data within individual layers detected by lidar systems (e.g., [14,15]). By providing a training dataset that consists of pre-classified Brewer cases, we automatically assigned each Brewer case to one of the clusters following a decision tree procedure.
The methodology presented in this study was directly applied to the long record of spectral UV measurements of Thessaloniki, Greece. The derived classification flags provide valuable information on the composition of the aerosol mixture over the area for an unprecedentedly long period, since 1998. To our knowledge, no other studies have delivered columnar classification flags from ground-based remote-sensing instruments for such long continuous periods. Knowledge of the evolution of the aerosol type over Thessaloniki will facilitate future studies that would require such information. Furthermore, the particular methodology can be also applied in order to get information for the type of aerosols for other stations around the world, for which high quality measurements of the spectral solar UV irradiance began before 2000 and are continuously available thereafter [35,36,37]. Finally, aerosol classification from spectrophotometer data, especially in the ultra violet spectral region, is a novel field, as the current scientific literature is mainly focused on aerosol classification from sunphotometer data and mostly from optical properties retrieved in the visible and infrared regions. Consequently, this study can facilitate the development of aerosol classification techniques that rely on optical aerosol properties obtained from state of the art spectral instruments such as Multi Axis Differential Optical Absorption Spectroscopy (MAX-DOAS) and/or Fourier-Transform Infrared Spectroscopy (FT-IR) spectrophotometers, in the future.
The manuscript is organized in the following sections. Section 2 includes a presentation of the instruments that participate in the analysis and the techniques applied for the calculation of the aerosol optical properties. The proposed aerosol classification technique is presented in Section 3 and its classification potential is discussed in Section 4. Section 5 includes a climatological analysis using the classification flags obtained here. Finally, the main findings are summarized in Section 6.

2. Instrumentation and Products

The instruments that participate in the analysis are included in this section. The CIMEL sunphotometer is presented first in Section 2.1 and the Brewer spectrophotometer is presented in Section 2.2. The products that are relevant to the analysis are discussed along with their respective uncertainties. Finally, the training dataset required for the aerosol classification technique is presented in Section 2.3.
In the analysis below, one hour averages have been used for all products to ensure compatibility between the two instruments. Uncertainties have been properly propagated due to averaging, assuming that the errors are independent and random within the one hour interval. Table 1 below summarizes all products that are used in the manuscript, their ranges, and the algorithm that produces them.

2.1. The Cimel Sunphotometer

This instrument was installed in LAP in 2003. In the initial setup, direct and diffuse radiance measurements have been performed in four wavelengths (440 nm, 675 nm, 870 nm, 1020 nm). After 2005, the system was upgraded and three additional channels at 340 nm, 380 nm, and 500 nm were included. Further details on the timeseries of the sunphotometer can be found in [38]. Measurements are automatically gathered, processed, and distributed by the AERONET network [39].
The AOD and the fine mode AOD values at all available wavelengths, as well as the SSA at 440 nm are provided directly from the standard AERONET algorithms [40,41]. The uncertainties of the SSA and FMF products are discussed in [41,42], respectively. In our analysis, we used Version 3 (see, [43]) Level 2.0 products and also Version 3 Level 1.5 products whenever the Level 2.0 Inversion algorithms successfully produced the aerosol size distribution. This technique has also been applied by [33,44]. Our main purpose is to enrich the SSA440 dataset as it directly affects the number of cases in the training dataset (see Section 2.3).

2.1.1. Fine Mode Fraction at 550 nm

The FMF at 550 nm is required for the methodology of [6] presented in Section 2.3 below. It is the ratio of total to fine mode AOD at 550 nm. However, these two products are not provided directly from AERONET and they need to be interpolated. A 2nd order polynomial fit is applied to the logarithm of the total and fine AOD values at 440 nm, 675 nm, 870 nm, and 1020 nm for this purpose. These wavelengths are preferred as they are available for a longer time. Applying, a 2nd order interpolation that takes into account all available wavelengths is favored over a linear interpolation between the two closest ones because it results to a more accurate predicted value (e.g., [38,45]). Indeed, according to [45] the spectral dependence of the logarithm of the AOD is close to but not exactly linear. This is especially true for dominant fine cases.

2.1.2. Extinction Angstrom Exponent at 340–380 nm

The EAE at 340–380 nm from the CIMEL is required in order to quantify uncertainties of the Brewer EAE (see Section 2.2). It can be calculated from the AOD values at 340 and 380 nm from Equation (1) [46]. It is available after 2005.
E A E λ 1 λ 2 = l n A O D λ 1 A O D λ 2 l n λ 1 λ 2 .
Here λ 1 and λ 2 correspond to wavelengths 340 nm and 380 nm, respectively. The uncertainties from error propagation assuming independent random errors are given by Equation (2).
σ E A E λ 1 λ 2 = 1 l n ( λ 1 ) l n ( λ 2 ) · σ A O D ( λ 1 ) A O D ( λ 1 ) 2 + 1 l n ( λ 1 ) l n ( λ 2 ) · σ A O D ( λ 2 ) A O D ( λ 2 ) 2
The uncertainty of the UV AOD values should be below 0.04 according to [43]. Equation (2) is applied in order to calculate the error per measurement. A filter is applied afterwards to exclude cases with uncertainties ( 1 σ ) larger than 0.4 from the analysis. Ideally, we would prefer to go for an even lower limit for the EAE340-380. However, decreasing this limit beyond 0.4 both excludes too many cases and also was not found to improve the agreement with the Brewer EAE320-360 (see Section 2.2).

2.2. The Double Monochromator Brewer Spectrophotometer

The Brewer#086 has been performing continuous automated spectral measurements of the global and direct UV irradiance in the range 290–363 nm since 1993 and 1997 respectively [47,48]. The step and the spectral resolution of the measurements are 0.5 nm. The direct component of solar irradiance is also measured at eight fixed wavelengths (every 10 nm starting from 290 nm) within the global irradiance scans. This way, nearly simultaneous (temporal difference of less than 5 s) measurements of the direct and global irradiance are available from the same instrument on a regular basis [26,49].
Regular calibration of the Brewer direct and global UV measurements [50], as well as participation of the two Brewer spectrophotometers operating at Thessaloniki in international inter-comparison campaigns [51,52] and comparison with reference instruments [53] ensure the good quality of the measurements since the beginning of the 1990s. Furthermore, the global UV measurements from the Brewer are regularly compared with measurements from a number of different co-located instruments measuring in the UV [50,54] in order to detect and filter out problematic measurements. For the same reason, the AOD from Brewer#086 is compared with the AOD from a co-located single monochromator Brewer and the CIMEL before using the data for further analysis [48,55].
Both, direct and global UV scans are performed several times in the day with a temporal resolution which depends on the used schedule. Under usual operational conditions it is better than 30 min for both types of spectral scans.

2.2.1. Spectral Aerosol Optical Depth and Single Scattering Albedo

The direct sun spectral scans are routinely used to retrieve the AOD in the range 320–360 nm with a spectral resolution of 0.5 nm [25]. Although the AOD is also available for wavelengths below 320 nm it is not used in the present study because of the larger uncertainties relative to longer wavelengths. This attributed mainly to the uncertainties in the total ozone used in the AOD retrieval algorithm, as well as the weaker signal recorded by the Brewer [48,55,56]. For Solar Zenith Angle (SZA) below 75 the standard uncertainty in the AOD from the Brewer#086 is 0.035 [55].
The nearly simultaneous direct and global measurements are used for the systematic retrieval of the AOD, the SSA and the AAOD since 1998. As analytically described in [26], the measured direct to global irradiance ratios are compared to corresponding modeled ratios which have been calculated for the same SZA, AOD and total ozone, and different values of the SSA. The spectral SSA values that best reproduced the measured ratios are selected as the solution of the algorithm. Again, only measurements at wavelengths 320–360 nm have been used in the present study because of the large uncertainties at shorter wavelengths. The SSA product is available with a spectral resolution of 10 nm as model simulating radiation with the 0.5 nm resolution spectra is computationally demanding (see, [55]).
Cases where the SZA is above 75 and cases with AOD340 values below 0.2 and above 1.5 are excluded from the analysis. Ref. [55] show that the product uncertainties increase significantly for large SZA values. On the other hand, AOD values below 0.2 correspond to a rather low aerosol load and consequently increased uncertainties. Below this limit, the aerosol effect on solar radiation is really low and sometimes comparable to the instrument noise. Moreover, small uncertainties in the retrieved concentration of the UV absorbents (mainly O 3 ) can produce artifacts in low aerosol conditions, especially for shorter wavelengths [55]. This filter removes less than 13% of the cases. High aerosol load is generally favorable. Data with AOD above 1.5, a limit that was set to exclude cases contaminated by thin cirrus clouds that have not been detected by the cloud screening algorithm, are not present in the Brewer timeseries. It is also worth mentioning, that such high AOD340 values are encountered very rarely in Thessaloniki (e.g., [38]). This filter removes less than 0.25% of the cases. A detailed discussion regarding the uncertainties in SSA and AAOD can be found in [55].

2.2.2. Extinction and Absorption Angstrom Exponents

It is also possible to calculate the EAE and AAE in the narrow spectral region 320–360 nm. A linear least squares fit is applied to calculate the EAE and the AAE from the slope of the logarithms of the AOD and the absorption AOD (AAOD), respectively, against the logarithms of the respective wavelengths. The high spectral resolution AOD product is used in both cases. The SSA is interpolated to match the spectral resolution of the AOD and the AAOD can be calculated from Equation (3).
A A O D ( λ ) = ( 1 S S A ( λ ) ) · A O D ( λ )
Uncertainties in the EAE and AAE are expected to be high in such narrow spectral regions (60 nm). Indeed, the AOD and AAOD do not change much within only 60 nm even for fine aerosols. When these changes are comparable with the standard AOD340 uncertainty (0.035) the propagated uncertainty in the EAE product is high. From error propagation in linear regression with independent random errors in the variables, the expected uncertainty is given by Equation (4). EAE320-360 values with one sigma higher than 0.4 are excluded from the analysis, similarly to the filter applied in Section 2.1.2.
σ E A E λ 1 λ 2 = 1 N · k = 1 N l n ( λ k ) l n ( λ ) ¯ l n 2 ( λ ) ¯ l n ( λ ) ¯ 2 · σ A O D ( λ k ) A O D ( λ k ) 2
Here σ E A E λ 1 λ 2 is the EAE uncertainty in the spectral region λ 1 to λ 2 , σ A O D ( λ k ) is the AOD uncertainty per wavelength, k is the index of each of the available wavelengths (N in total), l n ( λ ) ¯ is the mean wavelength logarithm, and l n 2 ( λ ) ¯ is the mean squared wavelength logarithm. A total of 81 wavelengths are available in the spectral region 320 to 360. We assume the error is the same for all AOD values and is equal to 0.035. It is obvious that higher AOD levels result to smaller uncertainties in the EAE. Furthermore, the error is inversely proportional to the number of available wavelengths.
The AAE is additionally affected by the uncertainty of the spectral SSA which results in an uncertainty in the AAOD340 below 0.060 according to [55]. Again by error propagation we get the expected uncertainty per case from Equation (4) using the AAOD instead of the AOD. For the AAE however, the uncertainties are rather large, above 1., given the high relative uncertainty of the AAOD. Consequently we decided to skip the AAE product for the aerosol classification.

2.2.3. Evaluation of the Extinction Angstrom Exponent at 320–360 nm

For the evaluation of the EAE320-360 product we compare with the EAE340-380 from the CIMEL (see Figure 1b). The AOD340 from both instruments is also included in Figure 1a exhibiting a perfect correlation of 0.99. More AOD data than EAE data are available as filters are applied to the two EAE in order to exclude data points with high uncertainties. The EAE320-360 is selected instead of the EAE440-870 provided by AERONET as the spectral region 340–380 of the CIMEL is close and equally narrow to the operating region 320–360 of the Brewer. While the AOD at 340 nm and the SSA at 340 nm from the Brewer have already been evaluated by [55], this is not the case for the EAE320-360 product. The correlation is satisfactory with a Pearson correlation coefficient of 0.66 between the two EAE. It is important to mention here that the EAE uncertainties are expected to be high for narrow spectral ranges in both instruments. As there are 81 available wavelengths to calculate the EAE320-360 contrary to 2 for the EAE340-340, the CIMEL EAE uncertainty is generally higher (see Equations (2) and (4)). Higher AOD340 values result in less uncertainty for both instruments and, in most cases, in better agreement.

2.3. The Reference Clusters

The Mahalanobis distance classification algorithm, presented in detail in Section 3, requires a training dataset of pre-classified Brewer cases as input. We will refer to that dataset from now on as the reference clusters in the manuscript. Aerosol classification is often manually performed by taking into account satellite observations, modeled backward trajectories, aerosol transportation models, and measurements from other instruments (e.g., [38,57,58,59]). Here we prefer to apply an automated threshold-based approach using measurements from a single instrument because it allows faster, more efficient, and less subjective classification of a large number of cases.
The methodology of [6] is selected to automatically produce classification flags from the CIMEL sunphotometer measurements in Thessaloniki during the period 2003–2017 (see Section 2.1). They propose an automated classification scheme based on thresholds of the FMF at 550 nm and the SSA at 440 nm. The FMF is indicative of the aerosol size. High values, close to 1, indicate dominant fine aerosol mixtures, while low values, close to zero indicate dominant coarse aerosol mixtures. It is also better correlated with the aerosol effective radius than the EAE. According to [6] the FMF provides quantitative information on the aerosol size while the EAE provides qualitative information. Ref. [60] show that the EAE440-870 value can be the result of various combinations of the fine mode effective radius and the FMF at 675 nm. The SSA is required to discern absorptive particles. The presence of absorptive particles reduces the SSA while the absence results to values close to 1 which is typical for scattering aerosols. Ref. [6] define seven categories based on the particle size and absorptivity presented in Figure 2. The categories include Sea Salt Mixtures (SALT), Dust Mixtures (DUST), Mixed, Fine Non Absorbing Mixtures (FNA), Low Black Carbon Mixtures (BC Low), Medium Black Carbon Mixtures (BC Med) and High Black Carbon Mixtures (BC High).
According to [6] FMF550 values below 0.4 correspond to dominant coarse aerosols while values above 0.6 to dominant fine ones. The region between 0.4 and 0.6 is considered as a safety margin for the FMF and is applied here instead of the the limit of 0.6 used by [41] in order to minimize the influence of various errors in the calculation of the FMF. The SSA threshold at 0.95 separates dust from sea salt for FMF550 values below 0.4. Fine particles are divided to the FNA above 0.95 that includes sulfate, nitrate, ammoniac, and organic aerosol, particles that mainly scatter radiation, and three categories based on the degree of black carbon particles they contain. The SSA thresholds are at 0.90 to 0.95 for BC Low, 0.85 to 0.90 for BC Med, and below 0.85, for BC High.
In our analysis, we used the classification flags of the FNA cluster (1854 cases) and DUST cluster (73 cases) and we also merged BC Med and BC High clusters in one single cluster named BC (1006 cases). We would prefer to use only the BC High cluster as it should contain mixtures with a stronger Black Carbon component. However, the data availability of BC High is marginal to form a single cluster with more data points. The BC Low cluster is not taken into account as one of the reference clusters. In our tests, we have seen that the optical properties of this cluster are not so different than the ones of the FNA cluster causing frequent misclasification between the two clusters. Merging FNA and BC Low clusters is also not optimal as it negatively affects the classification scores of BC (presented in Section 4). The SALT cluster is excluded as it contains only 3 cases and the Mixed cluster is not taken into account in the reference dataset as it contains cases that are influenced by multiple aerosol types.
Sea salt dominant mixtures are indeed rare in urban locations even for a coastal city such as Thessaloniki, since there is usually a strong urban aerosol background. Ref. [17] applied two aerosol classification algorithms for Thessaloniki and detected 3.5% and 0.0% of cases with pure maritime layers depending on the algorithm. Considering that the CIMEL performs columnar measurements, it should be even more rare to identify pure maritime aerosols in the whole column. Indeed, Ref. [5], in their climatology based on sunphotometer measurements detected no pure maritime aerosol for Thessaloniki. Here, only 3 out of 5270 cases were identified as sea salt predominant mixtures. Consequently, the FMF550 limit of 0.4 almost exclusively defines dust cases without the need of the SSA440. We take this into advantage in order to increase the number of dust cases. The FMF500 is used instead of the FMF550 due to its larger data availability as it is calculated from the Direct Sun algorithm that is less restrictive. An upper FMF500 limit of 0.375 is applied for dust. We have verified that this limit is equivalent to the FMF550 limit of 0.4 by comparing coincident FMF500 and FMF550 measurements. By applying this technique the number of dust measurements increase from 73 to 381.
The final training dataset consists of coincident Brewer and CIMEL measurements that are classified using the aforementioned flags. The three reference clusters are presented in Figure 3. They include the categories FNA, BC, and DUST numbering 564, 233, and 117 cases, respectively. This amount of data points should be adequate for Mahalanobis based clustering (e.g., [14,15]). The Mahalanobis distance machine learning technique presented in Section 3 bellow will rely on these distributions.

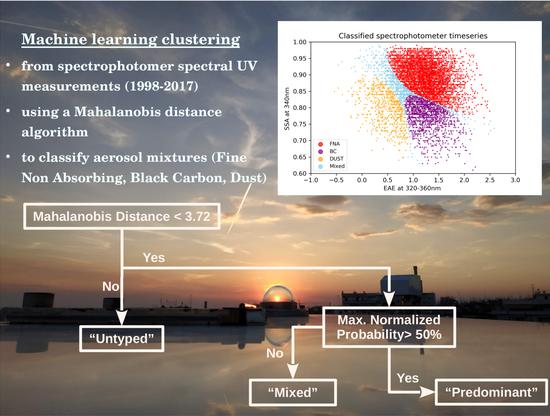
3. The Automated Classification Technique

The automated classification technique based on the minimum Mahalanobis distance is described in this section. This metric quantifies the distance of a point to a distribution in a multidimensional space. In our analysis, this space corresponds to the selected intensive aerosol optical properties from the Brewer spectrophotometer (EAE320-360, SSA340). Intensive properties are preferred instead of extensive ones, such as the AOD, as they are independent of the aerosol concentration and are not expected to change much per aerosol species. This approach is also adopted by [5,14,15]. They all use aerosol intensive properties to perform cluster analysis based on either lidar or sunphotometer data. A necessary step for these techniques is to identify the reference distributions that correspond to the distinct aerosol types desired for clustering (see Section 2.3).
The Mahalanobis distance is given by Equation (5) [34].
D M , i , j = ( x ^ i , j μ ^ j ) T · S j 1 · ( x ^ i , j μ ^ j )
D M , i , j corresponds to the Mahalanobis distance of the point i from the distribution j. In our case j represents the four reference clusters (FNA, BC Low, BC Med, and DUST) and i each measurement available in the timeseries. The vectors x ^ and μ ^ are two dimensional and consist of pairs of EAE320-360 and SSA340 values. μ ^ contains the mean values per cluster j (see Table 2), while x ^ includes the respective pairs per measurement i. S j is the variance co-variance matrix per cluster j. μ ^ and S j are calculated from the reference clusters (see Section 2.3). If these are known, the Mahalanobis distance of each individual measurement from each cluster can be obtained.
Large Mahalanobis distances indicate outliers. Assuming normally distributed intensive properties, the Mahalanobis distance should be chi-square distributed in a multidimensional space (2 here). We use a threshold at the 99.9% cumulative probability contour of the class distributions, similar to [14]. This results to a threshold of Mahalanobis values higher than 3.72 to be rejected as outliers that do not belong in any cluster. Such cases can either correspond to aerosol types not taken into account in the definition of the reference clusters (e.g., sea salt, volcanic, pollen) or to cases where at least one the optical properties is biased.
The minimum D M indicates the most probable cluster. However, there are cases where the D M exhibits similar values for more than one cluster. An additional metric, the normalized probability ( P M ) is applied here in order to separate such cases.
P M , i , j = 1 D M , i , j 2 j 1 D M , i , j 2
It is obvious that the normalized probability is maximum for the minimum Mahalanobis distance. The decision tree of the classification procedure can be seen in Figure 4. Cases with maximum P M larger than 0.5 are assigned to one of the predominant clusters. This threshold is also used by [15]. Cases with maximum P M below this threshold are assigned to the Mixed cluster.
The capabilities of the algorithm are presented in Figure 5. This figure includes the Brewer timeseries (8574 cases) in the period 1998–2017. All available measurements are characterized, even those used for the training Each case with minimum D M larger than 3.72 is assigned to one of the clusters (8562 cases). The FNA, BC, DUST, and Mixed clusters include 65.7%, 17.7%, 7.5%, and 9.1% of the cases, respectively. The remaining 12 cases were not assigned to any cluster as their minimum D M exceeded the aforementioned threshold. The Normalized Probability obtained for each point describes the level of confidence of the classification procedures. Values close to 1 indicate higher confidence as the point is far closer to the center of a single cluster compared to the other clusters.

4. Evaluation of the Proposed Technique

In this section, the clustering potential of the proposed technique is investigated. We compare the original training dataset flags, presented in Figure 3, with: (a) the exact same cases reclassified by the Mahalanobis algorithm, and (b) a manually classified dataset.
Figure 6a includes the typing score per cluster between the two versions of the training dataset. Differences between the original and the reclassified flags are expected as the Mahalanobis classification is probabilistic while original classification of those cases is based on absolute thresholds. The typing scores (per cent) are calculated with respect to the total number of cases per cluster of the original training dataset.
The typing score is high for all three clusters. FNA, BC, and DUST clusters produce scores of 77.0%, 63.9%, and 80.3% respectively. Around 10% in all cases is misclassified as Mixed. In addition, FNA cases tend to be misclassified as BC rather than DUST and vice versa. Similarly, misclassification of less than 10% occurs between the BC and DUST clusters. The algorithm, on the other hand does not seem to confuse FNA with DUST cases. This is attributed to the fact that the BC reference cluster is adjacent to both the other two clusters (Figure 3).
In order to perform the manual classification we have identified 6 cases per aerosol type (FNA, BC, DUST) based on measurements from a co-located multi-wavelength Raman system in the period 2008–2017. The aerosol characterization analysis was initially performed by [38]. They characterize aerosol profiles as desert dust or biomass burning if at least one such layer is present in the profile, otherwise the profile is flagged as continental. The analysis is supported by backward trajectories from the Hybrid Single Particle Lagrangian Integrated Trajectory Model HYSPLIT, modeled dust profiles from the Dust Regional Atmospheric Model (BSC-DREAM8b), and fire spot satellite data from the Fire Information for Resource Management System (FIRMS) that collects data from the Terra and Aqua MODIS.
While the identification of the aerosol type in individual layers is possible with lidars, this is not the case for spectrophotometric measurements that see the whole atmospheric column. For this reason, it is important to select cases where the aerosol type is dominant over the whole profile. As far as the desert dust cases are considered, we selected 6 strong events from the dataset of [38] where the dust mass concentration predicted by the BSC-DREAM8b model exceeds at least 100 μ g · m 3 in the profile and flagged them as DUST. In order to identify strong black carbon (BC) events we selected 6 cases with fire spots detected by MODIS in a radius of approximately 25 km around Thessaloniki indicating local fires. Isolating FNA cases is more challenging as black carbon can still be present to a certain degree in continental profiles. These particles originate from local sources such as fossil fuel combustion, central heating, industry, and transportation even in the absence of fire spots that are rather linked to wildfires, forest fires, or agricultural fires. For this reason, we selected 6 continental cases in the warm months of the year (May to September) in order to avoid central heating emissions. We have also verified that there were no active fire spots within a 50 km radius around the city and limited or no fire activity in the Balkans.
The 18 coincident Brewer cases were processed by the Mahalanobis algorithm and the resulting flags were compared with the manual ones. The results are presented in Figure 6b. All 6 FNA cases have been properly assigned to the FNA cluster. Four out of six BC cases are correctly assigned to the BC cluster but the other two are assigned to the FNA cluster. A similar behavior is also visible in Figure 6a. Finally, 5 out of 6 DUST cases are successfully assigned to the DUST cluster and 1 case is assigned to the mixed cluster. The corresponding scores are 100.0%, 66.7%, and 88.3% for the FNA, BC, and DUST clusters respectively, both rather high and similar to those ones calculated with the original training dataset. This happens despite the much different data availability between the two evaluation datasets.

5. Climatological Comparison

In this section, we present a comparison of the Brewer and the CIMEL timeseries for the three predominant clusters (FNA, BC, DUST). The classification flags presented in Figure 5 are used for the Brewer data. The spectrophotometer dataset includes 8574 cases in the period 1998–2017 which are classified as FNA: 5624, BC: 1519, DUST: 639. The CIMEL cases on the other hand are characterized according to the procedure described in Section 2.3. For clarity, we use all available sunphotometer flags instead of the training dataset that consists only of simultaneous cases between the two instruments and consequently contains much less cases. This dataset is less populated and includes 3241 cases in the period 2005–2017 which are classified as FNA: 1854, BC: 1006, DUST: 381.
The classification flags are used in order to obtain seasonal averages of the AOD340 timeseries. We have selected this product as it is available from both instruments. Daily averages per dataset are produced from hourly averages, weakly averages from daily averages when at least 2 daily averages are available, monthly averages from weekly averages when at least 2 weekly averages are available, and seasonal averages from monthly averages when at least 1 monthly value exists. This approach is preferred in order to avoid including months with extremely low data availability (e.g., [38,61,62]).
The results for the FNA, BC, DUST, and the total ensemble of cases (All) for the two instruments are presented in Figure 7 (a, b, c, and d, respectively). The mean AOD values are of similar magnitudes per aerosol type. The AOD levels seem higher and more spread for the FNA cases. The data availability is especially limited for the DUST mixtures with the sunphotometer presented only two seasonal averages. Linear trends have been calculated, but their statistical significance is low due to the small number of data points, particularly for the CIMEL. However, for all cases the trends have the same sign (negative) and are of the similar magnitude. Indicatively for the two main categories, the AOD trends for the Brewer and the CIMEL are respectively: −0.010, −0.018 per year for FNA and −0.006, −0.006 for BC.
BC and DUST mixtures seem to appear more frequently after 2007 in the Brewer timeseries. It is not clear, however, whether this is due to a general lower data availability early in the timeseries or it is a a real shift towards a more frequent occurrence of these two types. To verify that, we calculated the occurrence ratio per aerosol type which we define as the number of flags of the specific type within a time interval divided by the total number of flags in the same interval. Similar to the AOD timeseries, daily values of the occurrence ratio are produced first from the hourly values. Then, weekly averages are calculated from daily averages when at least 2 daily averages are available, monthly averages from weekly averages when at least 2 weekly averages are available, and seasonal averages from monthly averages when at least 1 monthly value exists.
The seasonal timeseries of the occurrence ratio in the period 1998–2017 is presented in Figure 8 using the classification flags obtained from the Brewer. It is obvious that FNA mixtures are generally prevalent and that they appear more frequently before 2007. This pattern changes in 2007 when BC and DUST mixtures start to appear more often, and is attributed to the fact that the SSA has started decreasing after 2006, as reported by [55]. From Figure 3 and Figure 5 it can be seen that cases with low SSA are typically identified as BC and DUST Mixtures. Consequently, this shift towards lower SSA values after 2007 results in a less frequent occurrence of FNA mixtures in favor of the BC and DUST mixtures. Fountoulakis et al. (2019) attributed the low SSA mainly to (1) increased emissions of dust aerosols since 2007 due to the construction of the subway, and (2) increased emissions of biomass burning and wood smoke aerosols as well as high concentrations of other pollutants since 2009. The latter were attributed to the increasing use of wood and pellets instead of oil and natural gas for domestic heating, after the beginning of the economic crisis in Greece. This seems to be in agreement with our findings. Between 1997 and the mid-2000, only the AOD is decreasing, and not the SSA. This is an indication that although the amount of aerosols is changing, their composition does not change significantly. As discussed in Kazadzis et al. (2007) the reduction of AOD in the particular period can be mainly attributed to reduced traffic and industry emissions. Decreased emissions by the latter two sources have possibly resulted to reduction of the—weakly absorbing—sulfuric and nitrate aerosols, in addition to the reduction of highly absorbing aerosols resulting to relatively stable SSA. In addition, the occurrence ratio of BC mixtures is generally higher in winter, even before 2007, which could be associated with increased emissions from domestic heating, as [55] also suggests. The occurrence ratio of Mixed cases is neither clearly increasing nor decreasing. This section highlights the importance of automated classification when performing climatological studies and stresses the usefulness of the proposed technique in future research certainly in the station of Thessaloniki but also in other stations equipped with similar instrumentation.

6. Conclusions

To sum up, an automated machine learning clustering technique was successfully applied to UV SSA and EAE measurements of a double monochromator Brewer spectrophotometer. The technique currently utilizes the classification flags obtained from a CIMEL sunphotometer measurements in order to define a reference dataset of Brewer measurements. A total of 8562 cases during the period 1998–2017 has been automatically assigned in one of these reference clusters based on the minimum Mahalanobis distance and maximum Normalized Probability. FNA Mixtures (64.7%) are encountered far more often in Thessaloniki. BC Mixtures (17.4%) are less common and DUST Mixtures (8.1%) are more rare. Mixed conditions occurred for 9.8% of the cases. Sea Salt mixtures occur vary rarely, therefore, they were not included in the automated classification algorithm. In order to quantify its clustering potential we compared the original training dataset flags with those derived after the reclassification with the algorithm, as well as with those classified manually. The typing score of the Mahalanobis algorithm is high for all predominant clusters FNA: 77.0%, BC: 63.9%, and DUST: 80.3% when compared with the training dataset. We obtained high scores as well (FNA: 100.0%), (BC: 66.7%), and (DUST: 83.3%) when comparing with the manually classified dataset. We compared the AOD340 timeseries from the Brewer and the CIMEL per aerosol type and we observed seasonal values and trends of similar magnitude. The overall trend is decreasing. The AOD trends for the Brewer and the CIMEL are respectively: −0.010, −0.018 per year for FNA and −0.006, −0.006 for BC but the statistical significance is low due to the small number of data points, particularly for the sunphotometer. Furthermore, FNA mixtures are generally prevalent in the period 1998–2017. BC and DUST mixtures appear only rarely in the period 1998–2007. After 2007, however, both types tend to appear more frequently. The technique can be expanded in the future by either including additional sunphotometer and spectrophotometer measurements, from the current station or from other stations with similar instrumentation. Expanding the training dataset will always lead to more accurate mean values and co-variance matrices of the SSA at 340 nm and the EAE at 320–360 nm for the reference clusters. Finally, the classification flags obtained here can be applied to climatological studies of the station in the future, in order to identify seasonal patterns and trends in the occurrence of the predominant mixtures.

Author Contributions

Conceptualization, N.S.; methodology, N.S.; software, N.S., I.F., A.N., and T.D.; validation, N.S., I.F., A.N., T.D., and A.B.; formal analysis, N.S.; investigation, I.F., A.N., and T.D.; resources, I.F., A.N., and T.D.; data curation, I.F., A.N., and T.D.; writing–original draft preparation, N.S.; writing–review and editing, A.N., I.F., T.D., and A.B.; visualization, N.S.; supervision, I.F. and A.B.; project administration, A.B.; funding acquisition, A.B. All authors have read and agreed to the published version of the manuscript.

Funding

This research is co-financed by Greece and the European Union (European Social Fund-ESF) through the Operational Program «Human Resources Development, Education and Lifelong Learning 2014–2020» in the context of the project Optimization and application of methods for ground-based remote sensing of aerosols and ozone in the lower troposphere for investigating their variability (MIS 5004486).

Acknowledgments

We thank Nikolaos Papagiannopoulos for assistance with the Mahalanobis technique, and Dimitrios S. Balis for comments that greatly improved the manuscript. We acknowledge the use of data and imagery from LANCE FIRMS operated by NASA’s Earth Science Data and Information System (ESDIS) with funding provided by NASA Headquarters. We also acknowledge the use of data and/or images from the (NMMB/BSC-Dust or BSC-DREAM8b) model, operated by the Barcelona Supercomputing Center (http://www.bsc.es/ess/bsc-dust-daily-forecast/).

Conflicts of Interest

The authors declare no conflict of interest.

Abbreviations

The following abbreviations are used in this manuscript:
AAEAbsorption Angstrom Exponent
AODAerosol Optical Depth
AAODAbsorption Aerosol Optical Depth
BCBlack Carbon
EAEExtinction Angstrom Exponent
FIRMSFire Information for Resource Management System
FMFFine Mode Fraction
FNAFine Non Absorbing
FT-IRFourier-Transform Infrared Spectroscopy
HYSPLITHybrid Single Particle Lagrangian Integrated Trajectory Model
LAPLaboratory of Atmospheric Physics
MODISModerate Resolution Imaging Spectroradiometer
MAX-DOASMulti Axis Differential Optical Absorption Spectroscopy
SSASingle Scattering Albedo

References

  1. Hess, M.; Koepke, P.; Schult, I. Optical Properties of Aerosols and Clouds: The Software Package OPAC. Bull. Am. Meteorol. Soc. 1998, 79, 831–844. [Google Scholar] [CrossRef]
  2. Kelly, F.J.; Fussell, J.C. Size, source and chemical composition as determinants of toxicity attributable to ambient particulate matter. Atmos. Environ. 2012, 60, 504–526. [Google Scholar] [CrossRef]
  3. Hair, J.W.; Hostetler, C.A.; Cook, A.L.; Harper, D.B.; Ferrare, R.A.; Mack, T.L.; Welch, W.; Izquierdo, L.R.; Hovis, F.E. Airborne High Spectral Resolution Lidar for profiling aerosol optical properties. Appl. Opt. 2008, 47, 6734–6752. [Google Scholar] [CrossRef] [PubMed]
  4. Chiliński, M.T.; Markowicz, K.M.; Zawadzka, O.; Stachlewska, I.S.; Lisok, J.; Makuch, P. Comparison of Columnar, Surface, and UAS Profiles of Absorbing Aerosol Optical Depth and Single-Scattering Albedo in South-East Poland. Atmosphere 2019, 10, 446. [Google Scholar] [CrossRef] [Green Version]
  5. Hamill, P.; Giordano, M.; Ward, C.; Giles, D.; Holben, B. An AERONET-based aerosol classification using the Mahalanobis distance. Atmos. Environ. 2016, 140, 213–233. [Google Scholar] [CrossRef]
  6. Lee, J.; Kim, J.; Song, C.; Kim, S.; Chun, Y.; Sohn, B.; Holben, B. Characteristics of aerosol types from AERONET sunphotometer measurements. Atmos. Environ. 2010, 44, 3110–3117. [Google Scholar] [CrossRef]
  7. Gobbi, G.P.; Kaufman, Y.J.; Koren, I.; Eck, T.F. Classification of aerosol properties derived from AERONET direct sun data. Atmos. Chem. Phys. 2007, 7, 453–458. [Google Scholar] [CrossRef] [Green Version]
  8. Toledano, C.; Cachorro, V.E.; de Frutos, A.M.; Torres, B.; Berjón, A.; Sorribas, M.; Stone, R.S. Airmass Classification and Analysis of Aerosol Types at El Arenosillo (Spain). J. Appl. Meteorol. Climatol. 2009, 48, 962–981. [Google Scholar] [CrossRef]
  9. Pavese, G.; Lettino, A.; Calvello, M.; Esposito, F.; Fiore, S. Aerosol composition and properties variation at the ground and over the column under different air masses advection in South Italy. Environ. Sci. Pollut. Res. 2016, 23, 6546–6562. [Google Scholar] [CrossRef]
  10. Kaskaoutis, D.G.; Kosmopoulos, P.G.; Kambezidis, H.D.; Nastos, P.T. Identification of the Aerosol Types over Athens, Greece: The Influence of Air-Mass Transport. Adv. Meteorol. 2010. [Google Scholar] [CrossRef] [Green Version]
  11. Kaskaoutis, D.; Kosmopoulos, P.; Kambezidis, H.; Nastos, P. Aerosol climatology and discrimination of different types over Athens, Greece, based on MODIS data. Atmos. Environ. 2007, 41, 7315–7329. [Google Scholar] [CrossRef]
  12. Groß, S.; Esselborn, M.; Weinzierl, B.; Wirth, M.; Fix, A.; Petzold, A. Aerosol classification by airborne high spectral resolution lidar observations. Atmos. Chem. Phys. 2013, 13, 2487–2505. [Google Scholar] [CrossRef] [Green Version]
  13. Wandinger, U.; Baars, H.; Engelmann, R.; Hünerbein, A.; Horn, S.; Kanitz, T.; Donovan, D.; van Zadelhoff, G.; Daou, D.; Fischer, J.; et al. HETEAC: The Aerosol Classification Model for EarthCARE. EPJ Web. Conf. 2016, 119, 01004. [Google Scholar] [CrossRef] [Green Version]
  14. Burton, S.P.; Ferrare, R.A.; Hostetler, C.A.; Hair, J.W.; Rogers, R.R.; Obland, M.D.; Butler, C.F.; Cook, A.L.; Harper, D.B.; Froyd, K.D. Aerosol classification using airborne High Spectral Resolution Lidar measurements—Methodology and examples. Atmos. Meas. Tech. 2012, 5, 73–98. [Google Scholar] [CrossRef] [Green Version]
  15. Papagiannopoulos, N.; Mona, L.; Amodeo, A.; D’Amico, G.; Gumà Claramunt, P.; Pappalardo, G.; Alados-Arboledas, L.; Guerrero-Rascado, J.L.; Amiridis, V.; Kokkalis, P.; et al. An automatic observation-based aerosol typing method for EARLINET. Atmos. Chem. Phys. 2018, 18, 15879–15901. [Google Scholar] [CrossRef] [Green Version]
  16. Nicolae, D.; Vasilescu, J.; Talianu, C.; Binietoglou, I.; Nicolae, V.; Andrei, S.; Antonescu, B. A neural network aerosol-typing algorithm based on lidar data. Atmos. Chem. Phys. 2018, 18, 14511–14537. [Google Scholar] [CrossRef] [Green Version]
  17. Voudouri, K.A.; Siomos, N.; Michailidis, K.; Papagiannopoulos, N.; Mona, L.; Cornacchia, C.; Nicolae, D.; Balis, D. Comparison of two automated aerosol typing methods and their application to an EARLINET station. Atmos. Chem. Phys. 2019, 19, 10961–10980. [Google Scholar] [CrossRef] [Green Version]
  18. Brewer, A.W. A replacement for the Dobson spectrophotometer? Pure Appl. Geophys. 1973, 106, 919–927. [Google Scholar] [CrossRef]
  19. Kerr, J.B.; McElroy, C.T.; Wardle, D.I.; Olafson, R.A.; Evans, W.F.J. The Automated Brewer Spectrophotometer. In Atmospheric Ozone; Zerefos, C.S., Ghazi, A., Eds.; Springer: Dordrecht, The Netherlands, 1985; pp. 396–401. [Google Scholar]
  20. Bais, A.F. Absolute spectral measurements of direct solar ultraviolet irradiance with a Brewer spectrophotometer. Appl. Opt. 1997, 36, 5199–5204. [Google Scholar] [CrossRef]
  21. Gröbner, J.; Meleti, C. Aerosol optical depth in the UVB and visible wavelength range from Brewer spectrophotometer direct irradiance measurements: 1991–2002. J. Geophys. Res. Atmos. 2004, 109. [Google Scholar] [CrossRef]
  22. Meleti, C.; Cappellani, F. Measurements of aerosol optical depth at Ispra: Analysis of the correlation with UV-B, UV-A, and total solar irradiance. J. Geophys. Res. Atmos. 2000, 105, 4971–4978. [Google Scholar] [CrossRef]
  23. López-Solano, J.; Redondas, A.; Carlund, T.; Rodriguez-Franco, J.J.; Diémoz, H.; León-Luis, S.F.; Hernández-Cruz, B.; Guirado-Fuentes, C.; Kouremeti, N.; Gröbner, J.; et al. Aerosol optical depth in the European Brewer Network. Atmos. Chem. Phys. 2018, 18, 3885–3902. [Google Scholar] [CrossRef] [Green Version]
  24. Kiedron, P.W.; Michalsky, J.J. Non-parametric and least squares Langley plot methods. Atmos. Meas. Tech. 2016, 9, 215–225. [Google Scholar] [CrossRef] [Green Version]
  25. Kazadzis, S.; Bais, A.; Kouremeti, N.; Gerasopoulos, E.; Garane, K.; Blumthaler, M.; Schallhart, B.; Cede, A. Direct spectral measurements with a Brewer spectroradiometer: Absolute calibration and aerosol optical depth retrieval. Appl. Opt. 2005, 44, 1681–1690. [Google Scholar] [CrossRef] [PubMed]
  26. Bais, A.; Kazantzidis, A.; Kazadzis, S.; Balis, D.; Zerefos, C.; Meleti, C. Deriving an effective aerosol single scattering albedo from spectral surface UV irradiance measurements. Atmos. Environ. 2005, 39, 1093–1102. [Google Scholar] [CrossRef]
  27. Campanelli, M.; Siani, A.M.; di Sarra, A.; Iannarelli, A.M.; Sanò, P.; Diémoz, H.; Casasanta, G.; Cacciani, M.; Tofful, L.; Dietrich, S. Aerosol optical characteristics in the urban area of Rome, Italy, and their impact on the UV index. Atmos. Meas. Tech. Discuss. 2019, 2019, 1–23. [Google Scholar] [CrossRef]
  28. Bais, A.F.; Bernhard, G.; McKenzie, R.L.; Aucamp, P.J.; Young, P.J.; Ilyas, M.; Jöckel, P.; Deushi, M. Ozone–climate interactions and effects on solar ultraviolet radiation. Photochem. Photobiol. Sci. 2019, 18, 602–640. [Google Scholar] [CrossRef] [Green Version]
  29. Eck, T.F.; Holben, B.N.; Slutsker, I.; Setzer, A. Measurements of irradiance attenuation and estimation of aerosol single scattering albedo for biomass burning aerosols in Amazonia. J. Geophys. Res. Atmos. 1998, 103, 31865–31878. [Google Scholar] [CrossRef]
  30. Sinyuk, A.; Torres, O.; Dubovik, O. Combined use of satellite and surface observations to infer the imaginary part of refractive index of Saharan dust. Geophys. Res. Lett. 2003, 30. [Google Scholar] [CrossRef] [Green Version]
  31. Corr, C.A.; Krotkov, N.; Madronich, S.; Slusser, J.R.; Holben, B.; Gao, W.; Flynn, J.; Lefer, B.; Kreidenweis, S.M. Retrieval of aerosol single scattering albedo at ultraviolet wavelengths at the T1 site during MILAGRO. Atmos. Chem. Phys. 2009, 9, 5813–5827. [Google Scholar] [CrossRef] [Green Version]
  32. Ialongo, I.; Buchard, V.; Brogniez, C.; Casale, G.R.; Siani, A.M. Aerosol Single Scattering Albedo retrieval in the UV range: An application to OMI satellite validation. Atmos. Chem. Phys. 2010, 10, 331–340. [Google Scholar] [CrossRef] [Green Version]
  33. Kazadzis, S.; Raptis, P.; Kouremeti, N.; Amiridis, V.; Arola, A.; Gerasopoulos, E.; Schuster, G.L. Aerosol absorption retrieval at ultraviolet wavelengths in a complex environment. Atmos. Meas. Tech. 2016, 9, 5997–6011. [Google Scholar] [CrossRef] [Green Version]
  34. Mahalanobis, P.C. On the Generalized Distance in Statistics; National Institute of Science of India: Odisha, India, 1936; Volume 12, pp. 49–55. [Google Scholar]
  35. De Mazière, M.; Thompson, A.M.; Kurylo, M.J.; Wild, J.D.; Bernhard, G.; Blumenstock, T.; Braathen, G.O.; Hannigan, J.W.; Lambert, J.C.; Leblanc, T.; et al. The Network for the Detection of Atmospheric Composition Change (NDACC): History, status and perspectives. Atmos. Chem. Phys. 2018, 18, 4935–4964. [Google Scholar] [CrossRef] [Green Version]
  36. McKenzie, R.; Bernhard, G.; Liley, B.; Disterhoft, P.; Rhodes, S.; Bais, A.; Morgenstern, O.; Newman, P.; Oman, L.; Brogniez, C.; et al. Success of Montreal Protocol Demonstrated by Comparing High-Quality UV Measurements with “World Avoided” Calculations from Two Chemistry-Climate Models. Sci. Rep. 2019, 9, 12332. [Google Scholar] [CrossRef]
  37. Fountoulakis, I.; Zerefos, C.S.; Bais, A.F.; Kapsomenakis, J.; Koukouli, M.E.; Ohkawara, N.; Fioletov, V.; Backer, H.D.; Lakkala, K.; Karppinen, T.; et al. Twenty-five years of spectral UV-B measurements over Canada, Europe and Japan: Trends and effects from changes in ozone, aerosols, clouds, and surface reflectivity. C. R. Geosci. 2018, 350, 393–402. [Google Scholar] [CrossRef]
  38. Siomos, N.; Balis, D.S.; Voudouri, K.A.; Giannakaki, E.; Filioglou, M.; Amiridis, V.; Papayannis, A.; Fragkos, K. Are EARLINET and AERONET climatologies consistent? The case of Thessaloniki, Greece. Atmos. Chem. Phys. 2018, 18, 11885–11903. [Google Scholar] [CrossRef] [Green Version]
  39. Holben, B.; Eck, T.; Slutsker, I.; Tanré, D.; Buis, J.; Setzer, A.; Vermote, E.; Reagan, J.; Kaufman, Y.; Nakajima, T.; et al. AERONET—A Federated Instrument Network and Data Archive for Aerosol Characterization. Remote Sens. Environ. 1998, 66, 1–16. [Google Scholar] [CrossRef]
  40. Dubovik, O.; King, M.D. A flexible inversion algorithm for retrieval of aerosol optical properties from Sun and sky radiance measurements. J. Geophys. Res. Atmos. 2000, 105, 20673–20696. [Google Scholar] [CrossRef] [Green Version]
  41. O’Neill, N.T.; Eck, T.F.; Smirnov, A.; Holben, B.N.; Thulasiraman, S. Spectral discrimination of coarse and fine mode optical depth. J. Geophys. Res. Atmos. 2003, 108. [Google Scholar] [CrossRef]
  42. Sinyuk, A.; Holben, B.N.; Eck, T.F.; Giles, D.M.; Slutsker, I.; Korkin, S.; Schafer, J.S.; Smirnov, A.; Sorokin, M.; Lyapustin, A. The AERONET Version 3 aerosol retrieval algorithm, associated uncertainties and comparisons to Version 2. Atmos. Meas. Tech. Discuss. 2020, 2020, 1–80. [Google Scholar] [CrossRef] [Green Version]
  43. Giles, D.M.; Sinyuk, A.; Sorokin, M.G.; Schafer, J.S.; Smirnov, A.; Slutsker, I.; Eck, T.F.; Holben, B.N.; Lewis, J.R.; Campbell, J.R.; et al. Advancements in the Aerosol Robotic Network (AERONET) Version 3 database—Automated near-real-time quality control algorithm with improved cloud screening for Sun photometer aerosol optical depth (AOD) measurements. Atmos. Meas. Tech. 2019, 12, 169–209. [Google Scholar] [CrossRef] [Green Version]
  44. Bond, T.C.; Doherty, S.J.; Fahey, D.W.; Forster, P.M.; Berntsen, T.; DeAngelo, B.J.; Flanner, M.G.; Ghan, S.; Kärcher, B.; Koch, D.; et al. Bounding the role of black carbon in the climate system: A scientific assessment. J. Geophys. Res. Atmos. 2013, 118, 5380–5552. [Google Scholar] [CrossRef]
  45. Eck, T.F.; Holben, B.N.; Reid, J.S.; Dubovik, O.; Smirnov, A.; O’Neill, N.T.; Slutsker, I.; Kinne, S. Wavelength dependence of the optical depth of biomass burning, urban, and desert dust aerosols. J. Geophys. Res. Atmos. 1999, 104, 31333–31349. [Google Scholar] [CrossRef]
  46. Ångström, A. On the Atmospheric Transmission of Sun Radiation and on Dust in the Air. Geogr. Ann. 1929, 11, 156–166. [Google Scholar] [CrossRef]
  47. Bais, A.F.; Zerefos, C.S.; McElroy, C.T. Solar UVB measurements with the double- and single-monochromator Brewer ozone spectrophotometers. Geophys. Res. Lett. 1996, 23, 833–836. [Google Scholar] [CrossRef]
  48. Kazadzis, S.; Bais, A.; Amiridis, V.; Balis, D.; Meleti, C.; Kouremeti, N.; Zerefos, C.S.; Rapsomanikis, S.; Petrakakis, M.; Kelesis, A.; et al. Nine years of UV aerosol optical depth measurements at Thessaloniki, Greece. Atmos. Chem. Phys. 2007, 7, 2091–2101. [Google Scholar] [CrossRef] [Green Version]
  49. Bais, A.F.; Kazadzis, S.; Balis, D.; Zerefos, C.S.; Blumthaler, M. Correcting global solar ultraviolet spectra recorded by a Brewer spectroradiometer for its angular response error. Appl. Opt. 1998, 37, 6339–6344. [Google Scholar] [CrossRef]
  50. Garane, K.; Bais, A.F.; Kazadzis, S.; Kazantzidis, A.; Meleti, C. Monitoring of UV spectral irradiance at Thessaloniki (1990–2005): Data re-evaluation and quality control. Ann. Geophys. 2006, 24, 3215–3228. [Google Scholar] [CrossRef]
  51. Bais, A.F.; Gardiner, B.G.; Slaper, H.; Blumthaler, M.; Bernhard, G.; McKenzie, R.; Webb, A.R.; Seckmeyer, G.; Kjeldstad, B.; Koskela, T.; et al. SUSPEN intercomparison of ultraviolet spectroradiometers. J. Geophys. Res. Atmos. 2001, 106, 12509–12525. [Google Scholar] [CrossRef] [Green Version]
  52. Redondas, A.; Carreño, V.; León-Luis, S.F.; Hernández-Cruz, B.; López-Solano, J.; Rodriguez-Franco, J.J.; Vilaplana, J.M.; Gröbner, J.; Rimmer, J.; Bais, A.F.; et al. EUBREWNET RBCC-E Huelva 2015 Ozone Brewer Intercomparison. Atmos. Chem. Phys. 2018, 18, 9441–9455. [Google Scholar] [CrossRef] [Green Version]
  53. Hülsen, G.; Gröbner, J.; Nevas, S.; Sperfeld, P.; Egli, L.; Porrovecchio, G.; Smid, M. Traceability of solar UV measurements using the Qasume reference spectroradiometer. Appl. Opt. 2016, 55, 7265–7275. [Google Scholar] [CrossRef] [PubMed]
  54. Zempila, M.M.; Fountoulakis, I.; Taylor, M.; Kazadzis, S.; Arola, A.; Koukouli, M.E.; Bais, A.; Meleti, C.; Balis, D. Validation of OMI erythemal doses with multi-sensor ground-based measurements in Thessaloniki, Greece. Atmos. Environ. 2018, 183, 106–121. [Google Scholar] [CrossRef] [Green Version]
  55. Fountoulakis, I.; Natsis, A.; Siomos, N.; Drosoglou, T.; Bais, A.F. Deriving Aerosol Absorption Properties from Solar Ultraviolet Radiation Spectral Measurements at Thessaloniki, Greece. Remote Sens. 2019, 11, 2179. [Google Scholar] [CrossRef] [Green Version]
  56. Carlund, T.; Kouremeti, N.; Kazadzis, S.; Gröbner, J. Aerosol optical depth determination in the UV using a four-channel precision filter radiometer. Atmos. Meas. Tech. 2017, 10, 905–923. [Google Scholar] [CrossRef]
  57. Amiridis, V.; Balis, D.S.; Kazadzis, S.; Bais, A.; Giannakaki, E.; Papayannis, A.; Zerefos, C. Four-year aerosol observations with a Raman lidar at Thessaloniki, Greece, in the framework of European Aerosol Research Lidar Network (EARLINET). J. Geophys. Res. Atmos. 2005, 110, D21203. [Google Scholar] [CrossRef] [Green Version]
  58. Giannakaki, E.; Balis, D.S.; Amiridis, V.; Zerefos, C. Optical properties of different aerosol types: Seven years of combined Raman-elastic backscatter lidar measurements in Thessaloniki, Greece. Atmos. Meas. Tech. 2010, 3, 569–578. [Google Scholar] [CrossRef] [Green Version]
  59. Siomos, N.; Balis, D.S.; Poupkou, A.; Liora, N.; Dimopoulos, S.; Melas, D.; Giannakaki, E.; Filioglou, M.; Basart, S.; Chaikovsky, A. Investigating the quality of modeled aerosol profiles based on combined lidar and sunphotometer data. Atmos. Chem. Phys. 2017, 17, 7003–7023. [Google Scholar] [CrossRef] [Green Version]
  60. Gobbi, G.P.; Angelini, F.; Barnaba, F.; Costabile, F.; Baldasano, J.M.; Basart, S.; Sozzi, R.; Bolignano, A. Changes in particulate matter physical properties during Saharan advections over Rome (Italy): A four-year study, 2001–2004. Atmos. Chem. Phys. 2013, 13, 7395–7404. [Google Scholar] [CrossRef] [Green Version]
  61. Carstea, E.; Fragkos, K.; Siomos, N.; Antonescu, B.; Belegante, L. Columnar aerosol measurements in a continental southeastern Europe site: Climatology and trends. Theor. Appl. Climatol. 2019. [Google Scholar] [CrossRef]
  62. Fountoulakis, I.; Bais, A.F.; Fragkos, K.; Meleti, C.; Tourpali, K.; Zempila, M.M. Short- and long-term variability of spectral solar UV irradiance at Thessaloniki, Greece: Effects of changes in aerosols, total ozone and clouds. Atmos. Chem. Phys. 2016, 16, 2493–2505. [Google Scholar] [CrossRef] [Green Version]
Figure 1. Point by point comparison of the AOD340 obtained from the Brewer and the CIMEL (a). The EAE320-360 product from the Brewer is compared with the EAE340-380 from the CIMEL on the right. The uncertainties for all products are included. The AOD340 levels of the CIMEL are also visible in the EAE comparison (b).
Remotesensing 12 00965 g001
Figure 2. The classification flags obtained by applying the scheme of [6] on sunphotometer data (5270 cases). Thresholds are applied on the FMF550 and SSA440 in order to assign each case in one of the clusters. The following clusters are defined: SALT (upper left), DUST (lower left), Mixed (middle), FNA (upper right), BC Low (2nd right), BC Med (3rd right), and BC High (lower right).
Remotesensing 12 00965 g002
Figure 3. The training dataset of Brewer cases is presented in this figure. The 90% cumulative probability contour is used for the visualization of the cluster ellipses. It occurs at a Mahalanobis distance of 2.14.
Remotesensing 12 00965 g003
Figure 4. The decision tree used for the Mahalanobis classification procedure. Thresholds are applied to the Mahalanobis distance and the Normalized Probability metrics.
Remotesensing 12 00965 g004
Figure 5. The full Brewer timeseries is presented here, automatically classified in the three predominant clusters and the mixed cluster.
Remotesensing 12 00965 g005
Figure 6. The Mahalanobis distance clustering technique is compared with (a) the clustering technique based on [6], and (b) the manually classified cases.
Remotesensing 12 00965 g006
Figure 7. Seasonal timeseries of the AOD340 obtained from the Brewer (blue) and the CIMEL (orange).
Remotesensing 12 00965 g007
Figure 8. Seasonal timeseries of the occurrence ratio of each aerosol type in the period 1998–2017 with classification flags obtained from the Mahalanobis algorithm.
Remotesensing 12 00965 g008
Table 1. The most important aerosol optical products are gathered here. The instrument that performed the measurement, the calculation algorithm, and any restrictions applied are included here.
Product NameInstrumentAlgorithmRestrictions
AOD340-380CIMELAERONET Ver. 3 Direct Sun
FMF500CIMELAERONET Ver. 3 Direct Sun
FMF550CIMELInterpolated from FMF440
SSA440CIMELAERONET Ver. 3 Inversions
EAE340-380CIMELAngstrom formula σ E A E 340 - 380 < 0.4
AOD320-360BREWERLAP Operational AlgorithmSZA < 75 , 0.2 < AOD340 < 1.5
SSA340BREWERLAP Operational AlgorithmSZA < 75
EAE320-360BREWERLogarithmic fit of AOD σ E A E 320 - 360 < 0.4
Table 2. The mean SSA440 and EAE320-340 values per Brewer reference cluster are included here.
Cluster NameSSA340EAE320-340Number of Cases
FNA Mixtures0.871.3564
BC Mixtures0.781.2233
DUST Mixtures0.780.5117

