Article

Investigating the Recent Surge in the Monomah Glacier, Central Kunlun Mountain Range with Multiple Sources of Remote Sensing Data

1
School of Geosciences and Info-Physics, Central South University, Changsha 410083, China
2
Laboratory of GeoHazards Perception, Cognition and Predication, Central South University, Changsha 410083, China
3
Shanghai Institute of Satellite Engineering, Shanghai 200090, China
4
Institute of Tibetan Plateau Research, Chinese Academy of Sciences, Beijing 100101, China
*
Author to whom correspondence should be addressed.
Remote Sens. 2020, 12(6), 966; https://doi.org/10.3390/rs12060966
Submission received: 21 February 2020 / Revised: 16 March 2020 / Accepted: 16 March 2020 / Published: 17 March 2020
(This article belongs to the Section Remote Sensing in Geology, Geomorphology and Hydrology)

Abstract

:
Several glaciers in the Bukatage Massif are surge-type. However, previous studies in this region focused on glacier area and length changes, and more information is needed to support the deep analysis of glacier surge. We determined changes in glacier thickness, motion, and surface features in this region based on TanDEM-X, ALOS/PRISM, Sentinel-1A, and Landsat images. Our results indicated that the recent surge of the Monomah Glacier, the largest glacier in the Bukatage Massif, started in early 2009 and ceased in late 2016. From 2009 to 2016, its area and length respectively increased by 6.27 km2 and 1.45 km, and its ice tongue experienced three periods of changes: side broadening (2009–2010), rapid advancing (2010–2013), and slow expansion (2013–2016). During 2000–2012, its accumulation zone was thinned by 50 m, while its ice tongue was thickened by 90 m. During 2015–2017, its flow velocity reduced from 1.2 to 0.25 m/d, and the summer velocities were much higher than winter velocities. We conclude that the recent Monomah Glacier surge is thermal-controlled. The subglacial temperature rose to the pressure-melting point because of substantial mass accumulation, and then the increased basal meltwater caused the surge.

Graphical Abstract

1. Introduction

A glacier surge is the rapid mass redistribution process that occurs after reaching a critical unsteady state [1,2,3], in which mass in the upper reservoir zone rapidly transfers to the lower receiving zone [4]. Since large-scale glacier mass redistribution can lead to an advance of the glacier terminus, glacial lake outburst, and landform alterations, a glacier surge can threaten downstream communities. Studies of the process and mechanism of glacier surges are thus necessary for the prevention and mitigation of these disasters. Englacial factors mainly control glacial surges, and therefore studies of the surging process and mechanism may provide insight into the internal dynamics of glaciers.
Surge-type glaciers mainly distribute in Alaska [5,6], Svalbard [7,8], and the Qinghai–Tibet Plateau (QTP) [4,9,10]. Two surge types have been concluded: the “hydrology-controlled” Alaskan type [5,6,11] and “thermal-controlled” Svalbard type [6,7,12]. These two types of surges are associated with distinct changes in glacier flow velocity and thickness [3,13]. In the last five decades, glaciers throughout the QTP had uneven mass loss rates [10,14,15], and those in the Pamir–Karakoram–Hindukush region (northwest QTP) even gained slight amounts of mass [14,16]. Glacier surge behaviors observed throughout the QTP are also heterogeneous. It is difficult to attribute one of the two mechanisms (hydrology-controlled or thermal-controlled) to the glacier surge behaviors in the QTP [13]. Glaciers in different parts of the QTP may have different surge mechanisms. Yasuda et al. [17] suggested that two kinds of mechanisms jointly drove surges in the glaciers of the West Kunlun Mountain Range, and Quincey et al. [13] made similar conclusions for glaciers in the Karakoram Mountain Range. However, the applicability of this explanation to other glacial centers in the QTP is unknown. Thus, there is a need for further investigations of process and mechanism of glacier surge in the QTP.
The Bukatage Massif is one of the largest glacial centers in central QTP, and the Monomah Glacier is the largest glacier in this center. There is evidence of multiple previous surges in this glacier [18,19,20,21,22]. Li et al. [18] and Jiang et al. [19] examined the area and terminus changes of glaciers in the Bukatage Massif, but did not analyze the glacier surge mechanism. Hu et al. [20] presented the glacier motion fields in the Bukatage Massif. However, the spatial-temporal resolution of the motion fields was coarse, and little information on the surge evolution of the Monomah Glacier can be inferred from them. Gao et al. [21] reported that the recent surge of the Monomah Glacier was thermal-controlled. However, their evidence was only based on terminus advance time, and the conclusion needs confirmation. We previously presented data on changes in glacier thickness in the Bukatage Massif from 2000 to 2016 [22], but there has been no thorough analysis of the mass transport of the Monomah Glacier. Thus, further investigations on the surge evolution and mechanism of the Monomah Glacier are necessary.
A surge-type glacier often oscillates between two phases: a surge (active) phase and a quiescent phase [23,24]. Since a surge changes the dynamic instabilities of a glacier, the variations within different phases are reflected by kinematic, thickness, and morphologic changes. Therefore, glaciers in the surge phase are characterized by turbulent ice flow, dramatic changes of thickness, sharp morphologic changes (e.g., emergence of looped moraine), and sometimes by an advancing terminus. Analysis of the flow velocity, thickness, and morphologic changes can improve the understanding of the internal control processes and inferences about the surge mechanism. The fast-developing earth observation satellites offer us a good opportunity to reveal the glacier changes in a remote glacierized region. However, research on the glacier surge in central QTP is still scarce so far. Meanwhile, as a typical piedmont outlet glacier, the Monomah Glacier is an excellent model for studying the glacial kinetics. In this study, aiming at revealing the evolution and mechanism of the recent surge in the Monomah Glacier, we utilized multiple remote sensing sources including TanDEM-X bistatic interferometric image pairs, ALOS/PRISM stereo image pair, Sentinel-1A images, and Landsat series images to determine changes in glacier thickness, flow velocity, boundary, and morphology. The multiple change characteristics strongly support our conclusions, and our study therefore provides important new knowledge of glacier surges in the QTP.

2. Study area and datasets

2.1. Study Area

The Bukatage Massif is in the Central Kunlun Mountain Range, and its summit has an elevation over 6860 m (Figure 1). Meteorological data indicate that a continental temperate plateau climate controls this massif. Since the 1950s, the temperature in ablation and accumulation seasons has increased with a rate of 1.07 ℃/10a and 0.99 ℃/10a, respectively, and the precipitation in ablation and accumulation seasons has increased with a rate of 3.92 mm/10a and 4.96 mm/10a, respectively [21]. According to the second Chinese Glacier Inventory [25], the Bukatage Massif has 51 glaciers that cover an area about 400 km2. The Monomah Glacier, which lies in the southeast of the massif, is the largest glacier. It originates from the central firn basin (about 5600 m.a.s.l.) and extends approximately 18 km, covering an area of 94 km2 (as of 2016). The accumulation zone is broad and flat, and receives mass from the south and north ridges. Several studies have confirmed that the Monomah Glacier has advanced during some years and retreated during other years over the past four decades [19,20,21]. Debris cover is rare in this glacial center.

2.2. Datasets

2.2.1. Synthetic Aperture Radar Images

Radar signals can penetrate cloud and snow surfaces, and therefore the active synthetic aperture radar (SAR) image is very suitable for estimating glacier flow velocity [26]. The Sentinel-1A satellite launched in 2014 is equipped with a C-band SAR sensor. The global coverage and continuous acquisition make Sentinel-1A image a key data source for studies of glacier motion. The interferometric wide (IW) swath mode image has a wide frame (250 km), a short revisit interval (12 days), and a fine spatial resolution (4 m × 14 m). In this study, 19 Sentinel-1A IW images that were acquired from 2015 to 2017 were used to obtain the recent flow velocity changes of the Monomah Glacier (Table 1). To assure the similarity between two images, only summer and autumn images were used.
The TanDEM-X constellation consists of two X-band SAR satellites respectively launched in 2007 (TerraSAR-X) and 2010 (TanDEM-X). These two satellites have similar configurations and fly in close formation. The strip swath mode image has a resolution of 3 m and coverage of 30 km × 60 km. In the bistatic imaging mode, the constellation can simultaneously collect the master and slave images of an interferometric pair, indicating good control of the temporal decorrelation. Moreover, the X-band microwave has a short wavelength and is sensitive to changes in surface altitude. Hence, the TanDEM-X bistatic image pair is very suitable for determining glacier surface elevations. In this study, four TanDEM-X bistatic image pairs (acquired in March 2011 and March 2012) were used to extract the new digital elevation models (DEMs) for measuring changes of thickness in the Monomah Glacier (Table 1).

2.2.2. Optical Images

To verify the results from the TanDEM-X DEMs, two PRISM stereo image pairs were also collected to extract new DEMs (Table 1). The PRISM sensor was designed for mapping of global topography, and was equipped with a three-line array mapping camera, so it can collect a trip-stereo image (forward, nadir, and backward) at one time. The standard triplet mode image has a resolution of 2.5 m and coverage of 35 km × 35 km. Several previous studies demonstrated that the ALOS/PRISM stereo image could be used to reconstruct glacier topography [27,28].
In addition to the measuring changes in glacier thickness and flow velocity, changes in glacier morphology and boundary are also valuable for studying surge evolution and mechanism [24]. The Landsat image series has advantages for these determinations because it provides temporal continuity and allows tracking of long-term changes in glacier morphology and boundary. This study used 19 Landsat-TM/ETM+/OLI images that were acquired from 2000 to 2017 (Table 1).

2.2.3. Digital Elevation Model

The ALOS World 3D-30m (AW3D30) digital surface model (DSM) consists of global elevation datasets that were generated by integrating archived elevation observations of the ALOS-1/PRISM stereo mapping instrument [29]. The released version has a resolution of 1 arc second and a vertical accuracy of 5 m. The quality file of adopted DSMs shows that the standard derivation of the differences with ICESat-1/GLAS land elevations is about 2 m in most parts of the Bukatage Massif. In this study, the AW3D30 DSM was used to assist the SAR offset-tracking.
Due to the time consistency and promising accuracy, many studies have used the 1 arc second C-band shuttle radar tomography mission (SRTM) DEM in studies of changes in glacier thickness and mass balance. All SAR images used to generate the SRTM DEM were collected between 11 and 22 February 2000. There is evidence [30] that the uncertainty of the C-band SRTM (SRTM-C) DEM is 6–8 m in most parts of Eurasia. In this study, the SRTM-C DEM was used as the historic elevation source for measuring the changes of thickness of the Monomah Glacier, and as the external DEM for the differential InSAR (D-InSAR) process (see below).

3. Methods

3.1. DEM Generation

The iterative differential InSAR method was used to extract new DEMs from the TanDEM-X bistatic image pairs. To facilitate the phase unwarping, a topographic phase map was simulated from the SRTM-C DEM, and was then subtracted from the TanDEM-X interferogram. A new DEM was generated by adding the height, which was converted from the unwrapped differential phase, to the SRTM DEM. Considering the distinction between spatial resolution levels of SRTM-C DEM and TanDEM-X image, the TanDEM-X images were initially multi-looked with factors of 7 × 7 to achieve a new DEM at higher resolution (less than 10 m), the newly generated DEM was employed as an external DEM for the D-InSAR process, and above procedures were then implemented iteratively. The factors of multi-looking for the TanDEM-X images decreased as the iteration progressed, and the iteration stopped when the objective resolution was achieved. After the iteration, geocoding errors caused by inaccuracy in the SRTM DEM were reduced.
A traditional photogrammetry method was used to extract new DEMs from the PRISM stereo images. Nonglacial ground control points (GCPs) were manually collected by combining Landsat-8 images with the SRTM DEM, and were validated using the ICESat-2 land elevation product [31,32]. About 20 evenly distributed GCPs were prepared for each image pair, and the root mean square error (RMSE) of each GCP was less than 3 m. Since distortion between the backward and forward image is remarkable, each triple-stereo image pair was divided into two pairs: the forward + nadir images and the nadir + backward images. The two separately generated DEMs were then averaged to produce the final DEM. Gross errors in DEMs due to mismatched pixels (clouds, pure snow, and shadows) were manually corrected through cross-validation with other DEM products.

3.2. Estimation of Changes in Glacier Surface Height

Changes in glacier thickness were estimated by differencing the glacier surface heights at different time. In particular, the SRTM-C DEM was subtracted from the newly generated PRISM DEM and TanDEM-X DEM. Due to the different acquisition methods, relative geolocation errors of the DEMs exist. An analytical co-registration method was used to determine the global shift between the two DEMs for differencing [33]. Local terrain parameters (slope and aspect) and raw height differences were entered into a geometric model to calculate the DEM shift. After DEM shifting, residual systematic biases remained in the height-difference map; these biases were planimetric-related, aspect-related, slope-related, altitude-related, and curvature-related [15,28,34], and could significantly affect the glacier thickness change measurement. Given the assumption that height differences over surrounding stable non-glacial regions were zeros, these systematic biases were fitted as universal trends from the height differences over stable non-glacial regions and removed from the height difference maps [28,34]. This step finally corrected the biases of glacier height differences up to 12 m.
Since all DEMs were acquired in late winter, seasonal effects were negligible. However, the effects of penetration of radar signals on the ice/snow surface should be taken into account. The difference between the penetration depths of C-band (SRTM-C DEM) and X-band (TanDEM-X DEM) over glacier surfaces was calculated by differencing the simultaneously acquired C-band and X-band SRTM DEMs. Since there are data voids in the X-band SRTM DEM (SRTM-X DEM), calculations of the differences between the penetration depths was implemented in the near Ulugh Muztagh Massif, which is about 300 km west of the Bukatage Massif and influenced by the same climate. A linear function between the altitude and penetration depth was established by polynomial regression, and was applied to the height difference map to correct penetration-related errors pixel-by-pixel. Notably, this method cannot correct residual errors related to the penetration of the X-band (for the case of differencing the SRTM-C DEM and PRISM DEM).

3.3. Estimation of Glacier Flow Velocity

The SAR intensity-tracking technique can capture large-scale displacements [26,35], and was therefore used to estimate glacier flow velocities during the surge phase. To reduce topographic effects, the AW3D30 DSM was used to assist the SAR intensity tracking [36,37]. Sentinel-1A images were grouped into 15 pairs in chronological order. Considering the rapid feature changes over the glacier surface, a temporal threshold of 40 days was used for image pairs. The size of the matching window was determined carefully to balance accuracy and number of observations. The search window was 128 × 64. After intensity-tracking, the noise in the offset maps was suppressed using the non-local means filter [38].

3.4. Delineation of Glacier Boundary and Identification of Changes in Glacier Morphology

Based on the Second Chinese Glacier Inventory [25], we manually delineated multi-terms of glacier boundary from the Landsat images with little cloud and seasonal snow. Glaciers in the Bukatage Massif are debris-free, and the identification of glacier body can be easy as long as the image contrast is high enough. Radiometric and atmospheric corrections were conducted to each Landsat image, and the RGB combination of SWIR1-NIR-Red bands were adopted to composite the false-color images, over which we digitized the glacier boundaries. The changes in glacier morphology were identified through visual interpretation [24]. Likewise, the identification of surface morphological changes also requires optical images with little cloud and seasonal snow. In order to increase the feature contrast over glacier surface, the false-color images (RGB: bands SWIR1-NIR-Red) were further stretched.

4. Results

4.1. Changes of Thickness in the Monomah Glacier

The glacier thickness changes obtained by differencing the SRTM-C DEM with the PRISM DEM and with the TanDEM-X DEM were shown in Figure 2a,b, respectively. Due to the lack of texture over a pure white snow surface, the generation of the PRISM DEM failed in most parts of the Bukatage glacial center except for the ablation zones of the Monomah Glacier, West Monomah Glacier, and glaciers in the south slope (Figure 2a). By contrast, very few voids were present in the new TanDEM-X DEM (Figure 2b). However, these two results regarding changes in glacier thickness were generally similar.
Analysis of the West Monomah Glacier indicated the ablation zone became 15–25 m thinner, and the accumulation zone became 15–20 m thicker from 2000 to 2012. For the two small glaciers in the southwest, the middle parts of their tongues became obviously thinner, while the lower parts of their tongues became obviously thicker. This pattern of changes was reversed for the Foot Glacier, in that the lower part of the tongue was 30–50 m thinner, and the upper part of the tongue was 15–20 m thicker. The Foot Glacier also had the greatest amount of thinning among all studied glaciers.
Our results of the Monomah Glacier also indicated different changes of thickness during the two periods. During 2000–2010, only the north side of the tongue became dramatically thicker (30–70 m), and the terminal region became about 40 m thinner (Figure 2a). During 2000–2012, the whole tongue became 50–90 m thicker, and this was accompanied by extension and broadening. In contrast, the upper and middle parts of the trunk became 25–50 m thinner. Notably, the magnitude of thinning at the middle part of the trunk was greater than that from 2000 to 2010. Within the tongue, the thickening was also greater on the north side. There were three thinning centers, and all were at the bases of the cirques and connecting to the main ridge (S1–S3 in Figure 7).

4.2. Changes of Flow Velocity in the Monomah Glacier

Similar to generation of the DEM, intensity tracking will fail when surface texture is absent. Moreover, sharp changes of the glacier surface during the interval of the SAR image pair can also cause failure of intensity tracking. This is why there were more effective glacial observations between October and November than between June and September. Fortunately, the flow velocity over the region of interest (the trunk of the Monomah Glacier) was well captured.
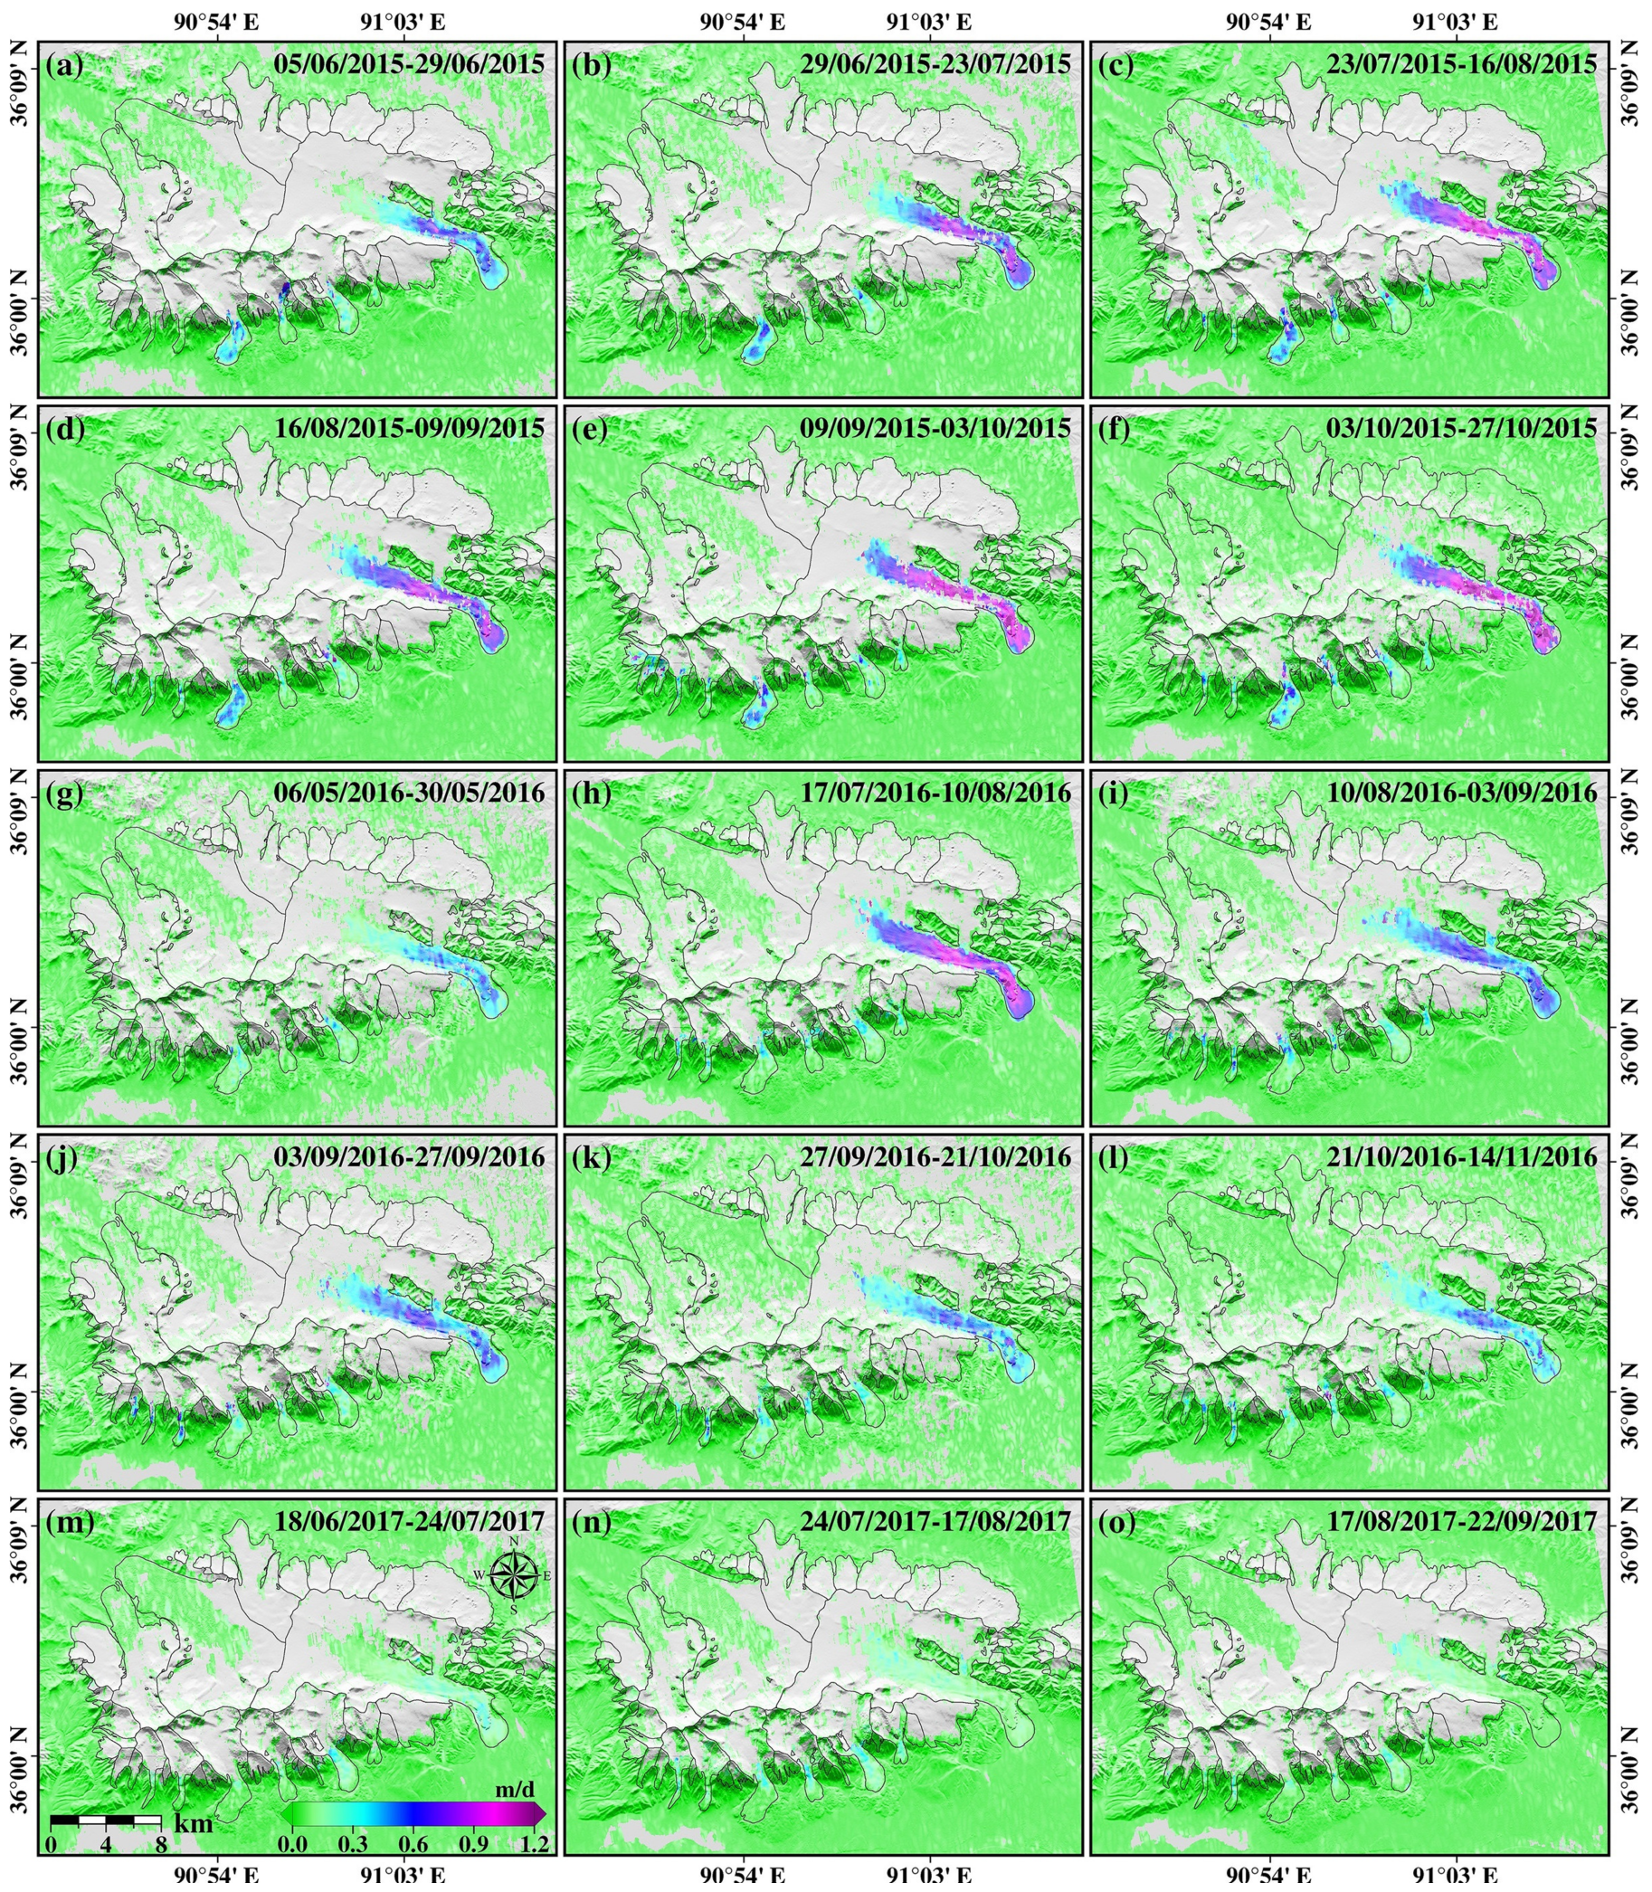
Figure 3 shows the measured two-dimensional glacier flow velocities of the Monomah Glacier during fifteen periods between 2015 and 2017. As noted above, the large-scale mass transfer of this glacier had already begun in 2010, and this glacier still flowed rapidly during 2016. From 2015 to 2017, the flow velocity had obvious annual and seasonal changes. In particular, during June 2015 the flow velocities in the middle-stream and down-stream regions were about 0.3–0.7 m/d (Figure 3a), and these values subsequently rose quickly. By July they were 0.7–1.0 m/d (Figure 3b), and by August they were 0.8–1.2 m/d (Figure 3c). These high flow velocities remained until October 2015 (Figure 3e,f). The flow velocities were much lower during May 2016 (0.3–0.5 m/d, Figure 3g), indicating deceleration during the winter of 2015/16. During July and early August 2016, the flow velocities increased to 0.7–1.1 m/d (Figure 3h). However, this acceleration did not continue, and by late August of 2016 the flow velocities decreased to 0.4–0.8 m/d (Figure 3h), and continued to decline thereafter (Figure 3i–k). By late October and early November 2016, the flow velocities were 0.3–0.5 m/d (Figure 3l).
After early 2017, the flow rates of Monomah Glacier became less variable. The highest flow velocity was about 0.25 m/d (Figure 3m), about 20% of that in 2015. For most observation periods during 2015 and 2016, the flow velocities first increased and then decreased from the glacier head to foot. The most active region was always at the confluence of the north tributary with the trunk. Notably, during September and October 2015, the whole tongue moved fast, and there seemed to be no obvious spatial velocity gradient in the down-stream region.

4.3. Changes of Boundaries and Morphology in the Monomah Glacier.

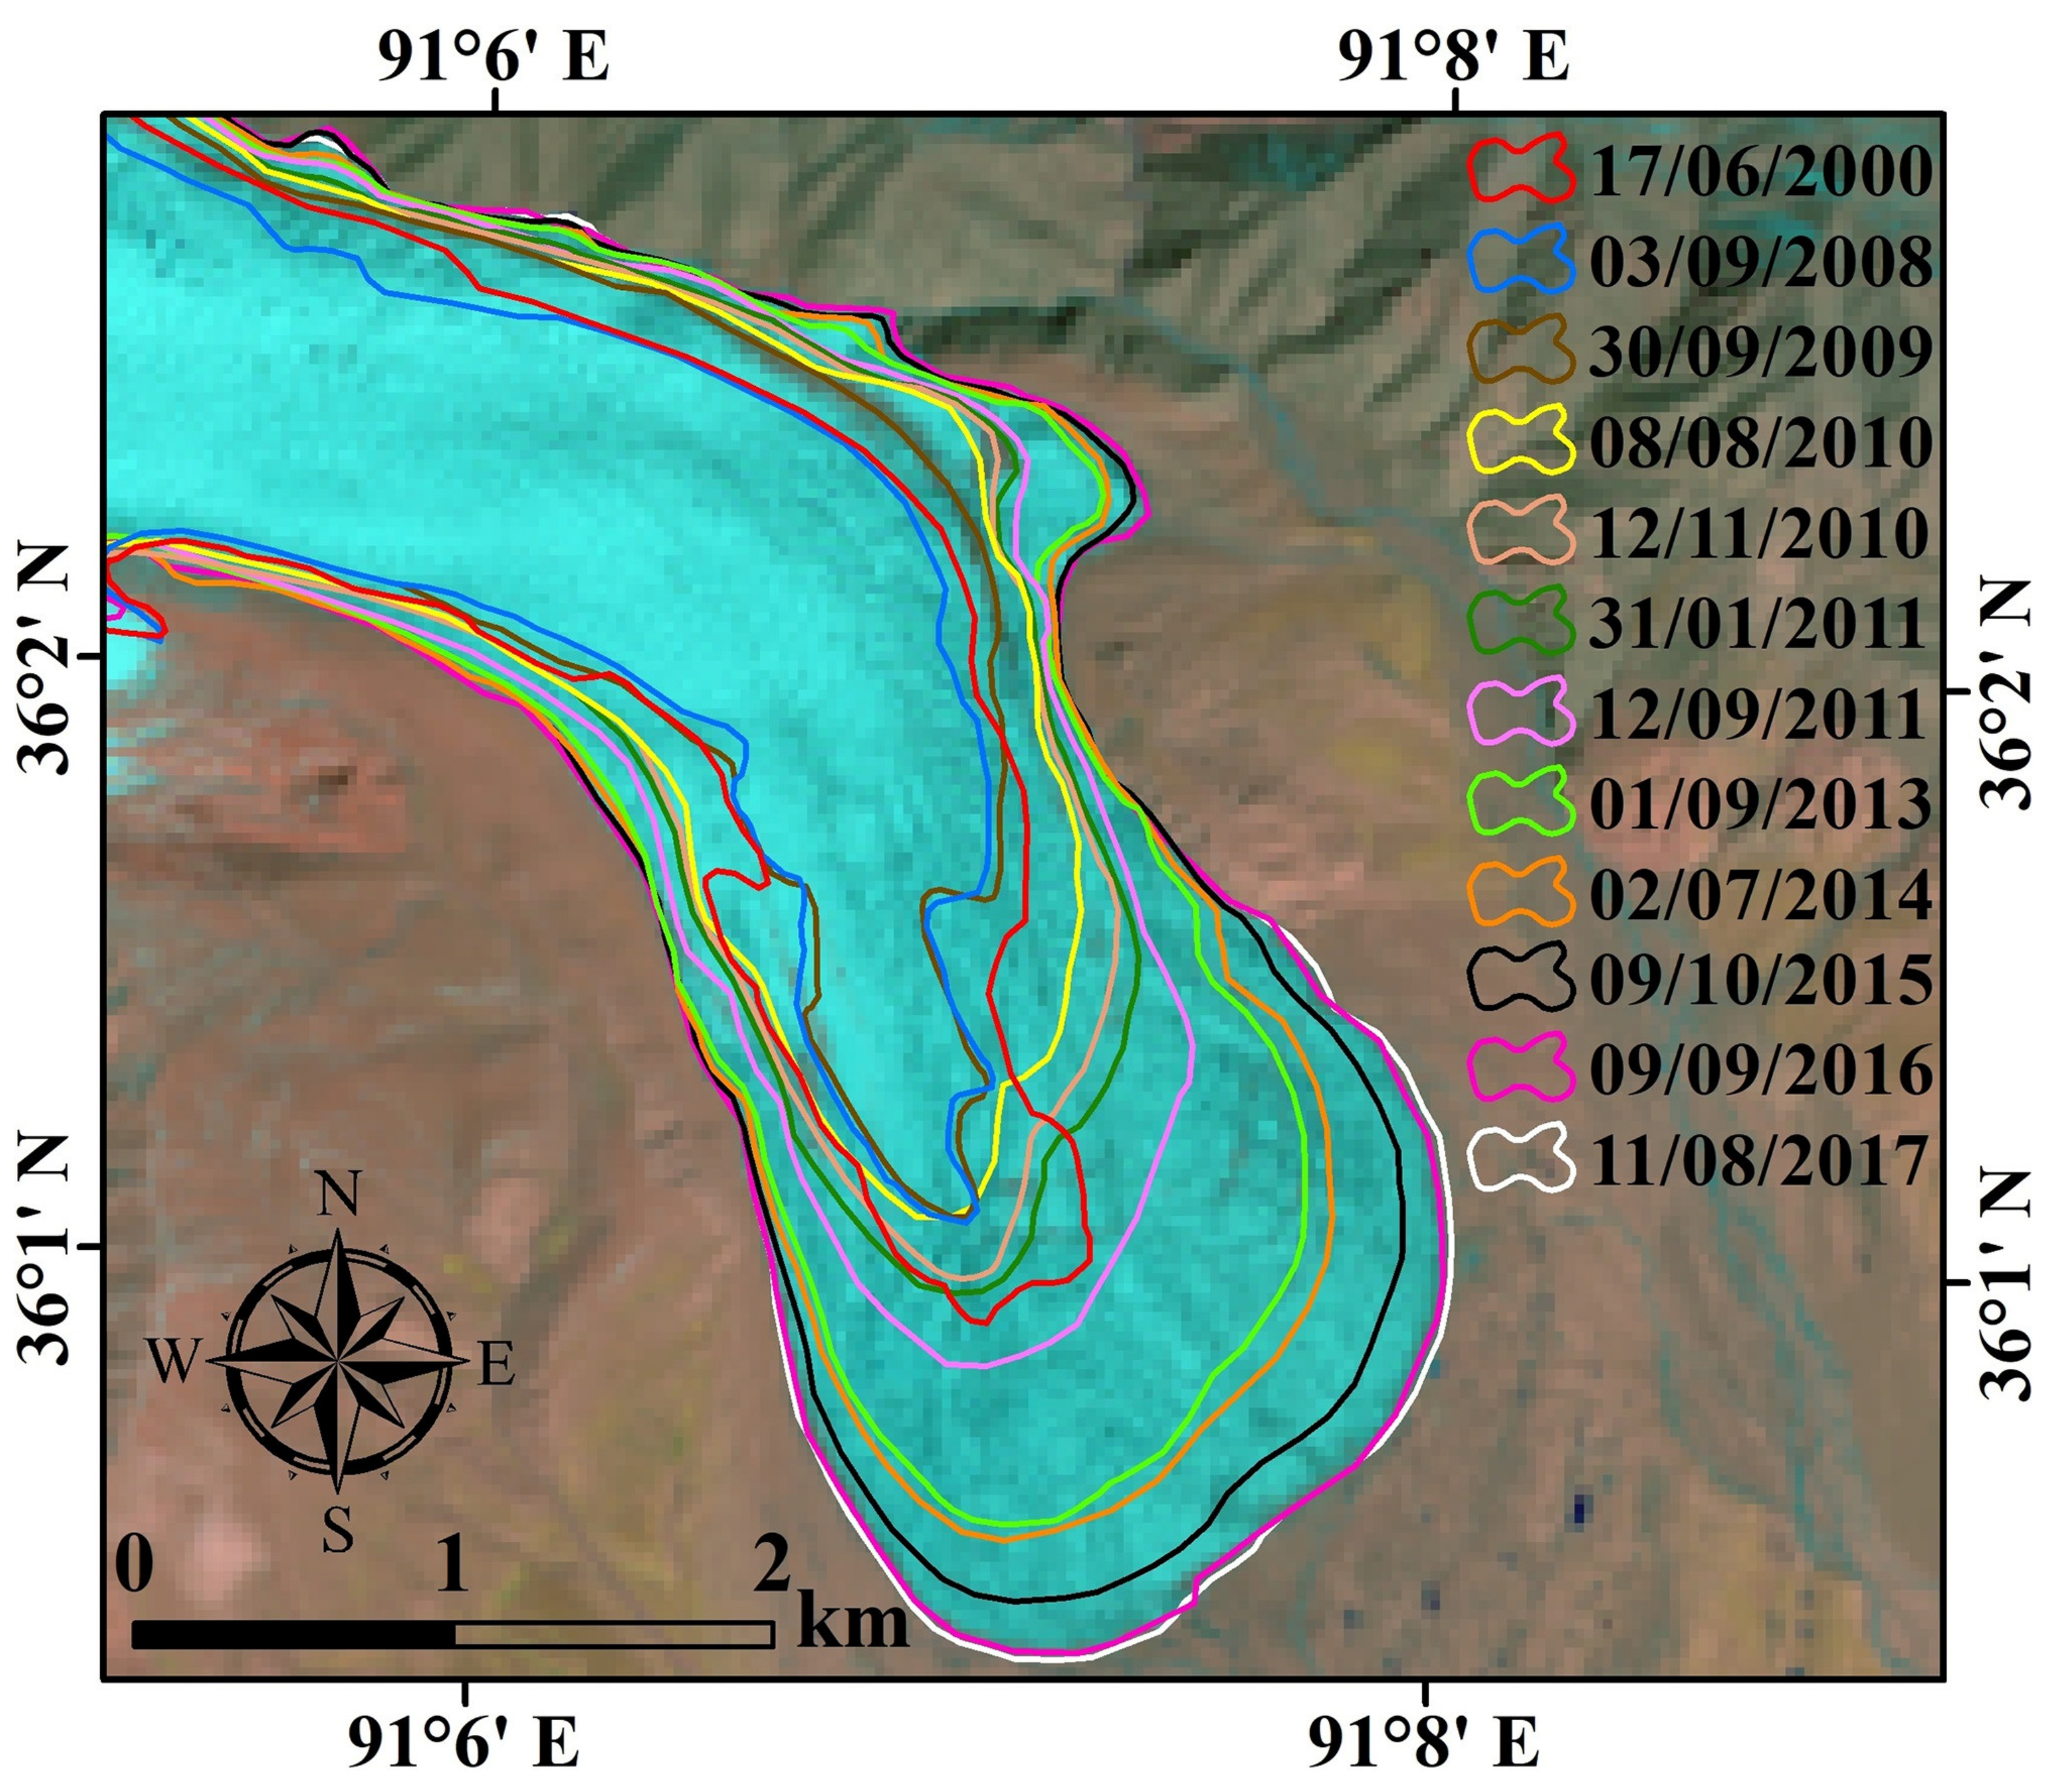
We compared the glacier boundaries at a different time and found that the extent of the Monomah Glacier varied greatly from June 2000 to August 2017 (Figure 4). In particular, from June 2000 to September 2008, the tongue area shrank by 0.91 km2. From September 2008 to September 2009, the terminus position did not change, but the upper part of the tongue expanded greatly. From September 2009 to August 2010, the lower part of the tongue expanded greatly. The tongue area increased by 0.87 km2, although the terminus position still did not change. However, from August 2010 to September 2011, the terminus advanced significantly. The tongue area increased by 1.30 km2 and the terminus advancing speed (0.49 km/a) was the greatest among all intervals. From September 2011 to September 2016, the terminus kept advancing, and the lower part of the tongue kept expanding. For the periods of September 2011 to September 2013, September 2013 to July 2014, July 2014 to October 2015, and October 2015 to September 2016, the glacier terminus extended by 0.50 km, 0.07 km, 0.22 km, and 0.23 km respectively, and the glacier area increased by 1.42 km2, 0.37 km2, 0.77 km2, and 0.67 km2 respectively. However, the expansion stopped after September 2016, and there was little change of the boundary from September 2016 to August 2017. Overall, from September 2008 to September 2016, the length increased by 1.45 km and the area increased by 6.27 km2.
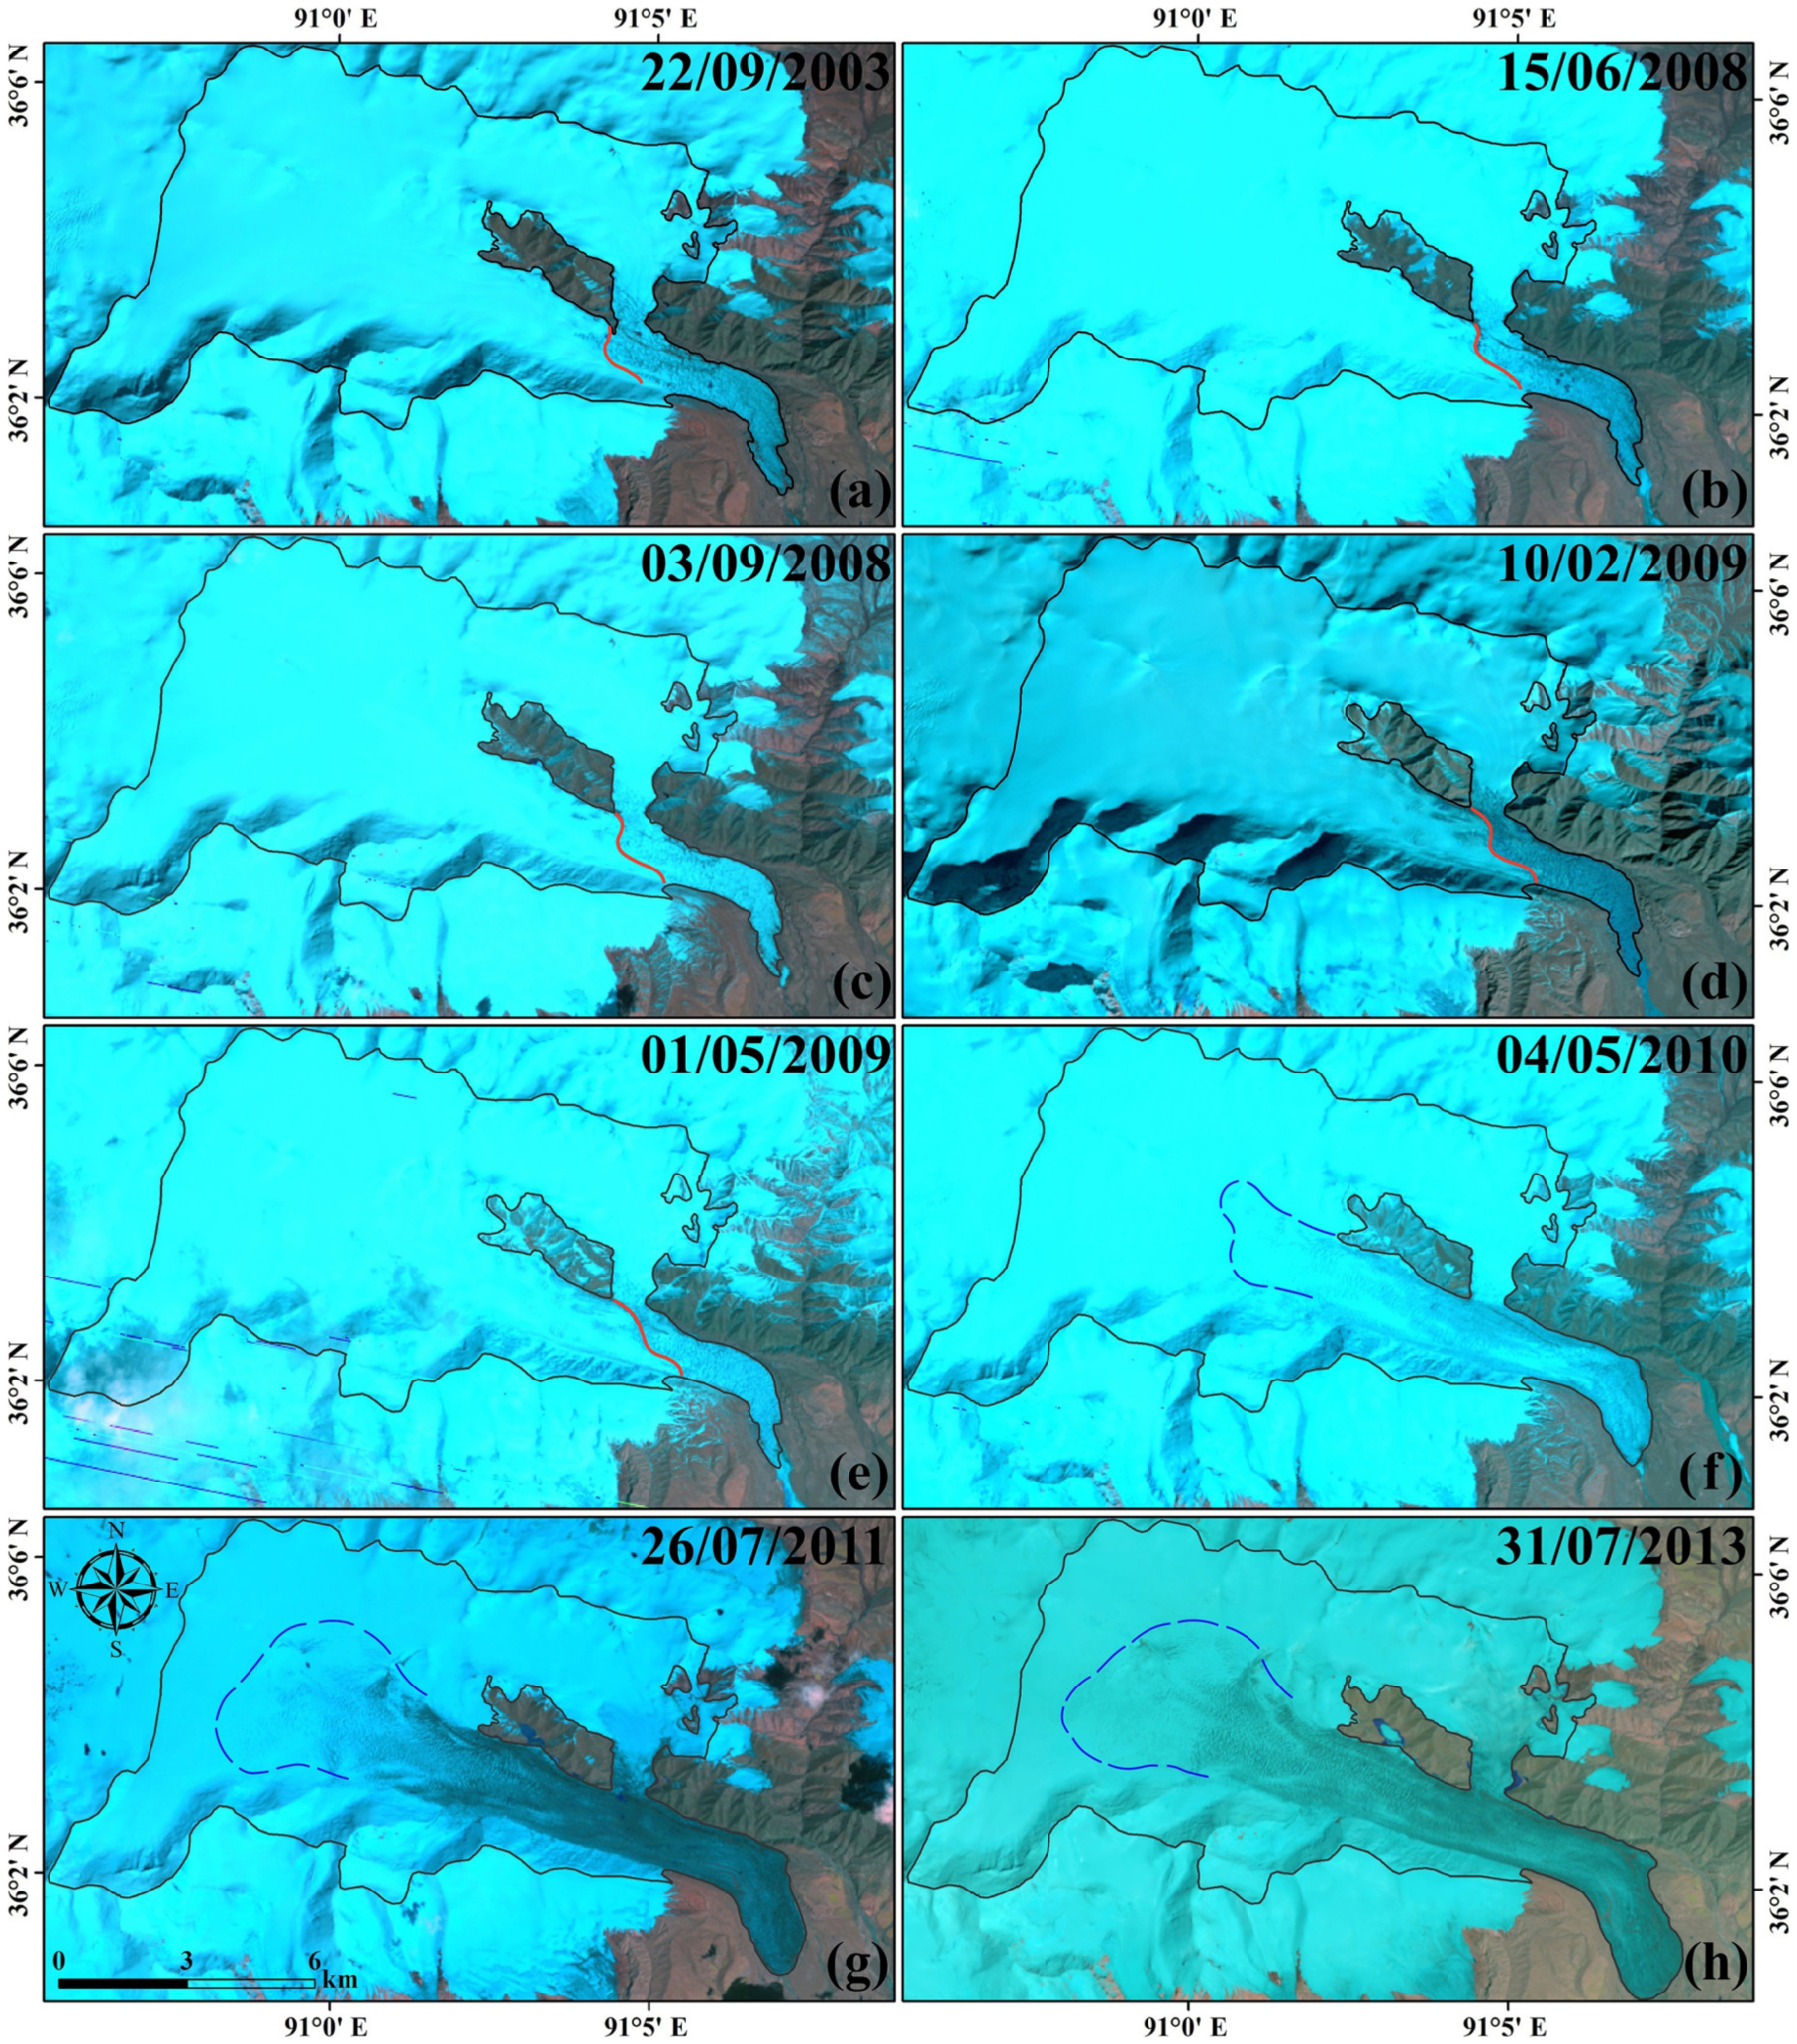
Our analysis also indicated significant changes in the surface morphology of the Monomah Glacier from September 2003 to July 2013 (Figure 5). In particular, during September 2003, there was a clear demarcation (red line in Figure 5) between the middle-stream and down-stream regions. The up- and middle-stream regions had smooth surfaces with high reflectance, while the down-stream region had a mottled surface with low reflectance. The demarcation line remained in almost the same position until September 2008 (Figure 5b,c); it moved downward from September 2008 to February 2009 (Figure 5d), and this movement continued during the next three months (Figure 5e). From May 2009 to May 2010, numerous crevasses appeared in the middle- and down-stream regions; the tongue expanded obviously, and there was increased reflectance of the upper part; mass from the northern tributary entered into the northern margin of the tongue; and the demarcation (red line) became submerged by the dense crevasses (Figure 5f). From May 2010 to July 2011, the area with the developing crevasse (blue dashed lines in Figure 5f,g) extended upwards over a long distance. From July 2011 to July 2013, the area with the developing crevasses remained relatively constant (Figure 5g,h), but the width and density of transverse crevasses increased significantly.

5. Discussion

5.1. Uncertainty Analysis

Over the stable nonglacial regions, the flow velocities and changes in thickness are supposed to be zeros. Based on the assumption that measurement errors over glacial and nonglacial regions are common, we assessed the uncertainties of these results using nonglacial observations [39]. The traditional indicator standard deviation (STD) is sensitive to outliers, and therefore not suitable for evaluating the accuracy of changes in glacier thickness. We used the normalized median absolute deviation (NMAD), a similar indicator that is insensitive to outliers [34,40]. The NMAD was calculated through the following formula:
N M A D = 1.4826 × m e d i a n Δ h i m e d i a n Δ h i = 1 , 2 , 3 , , n
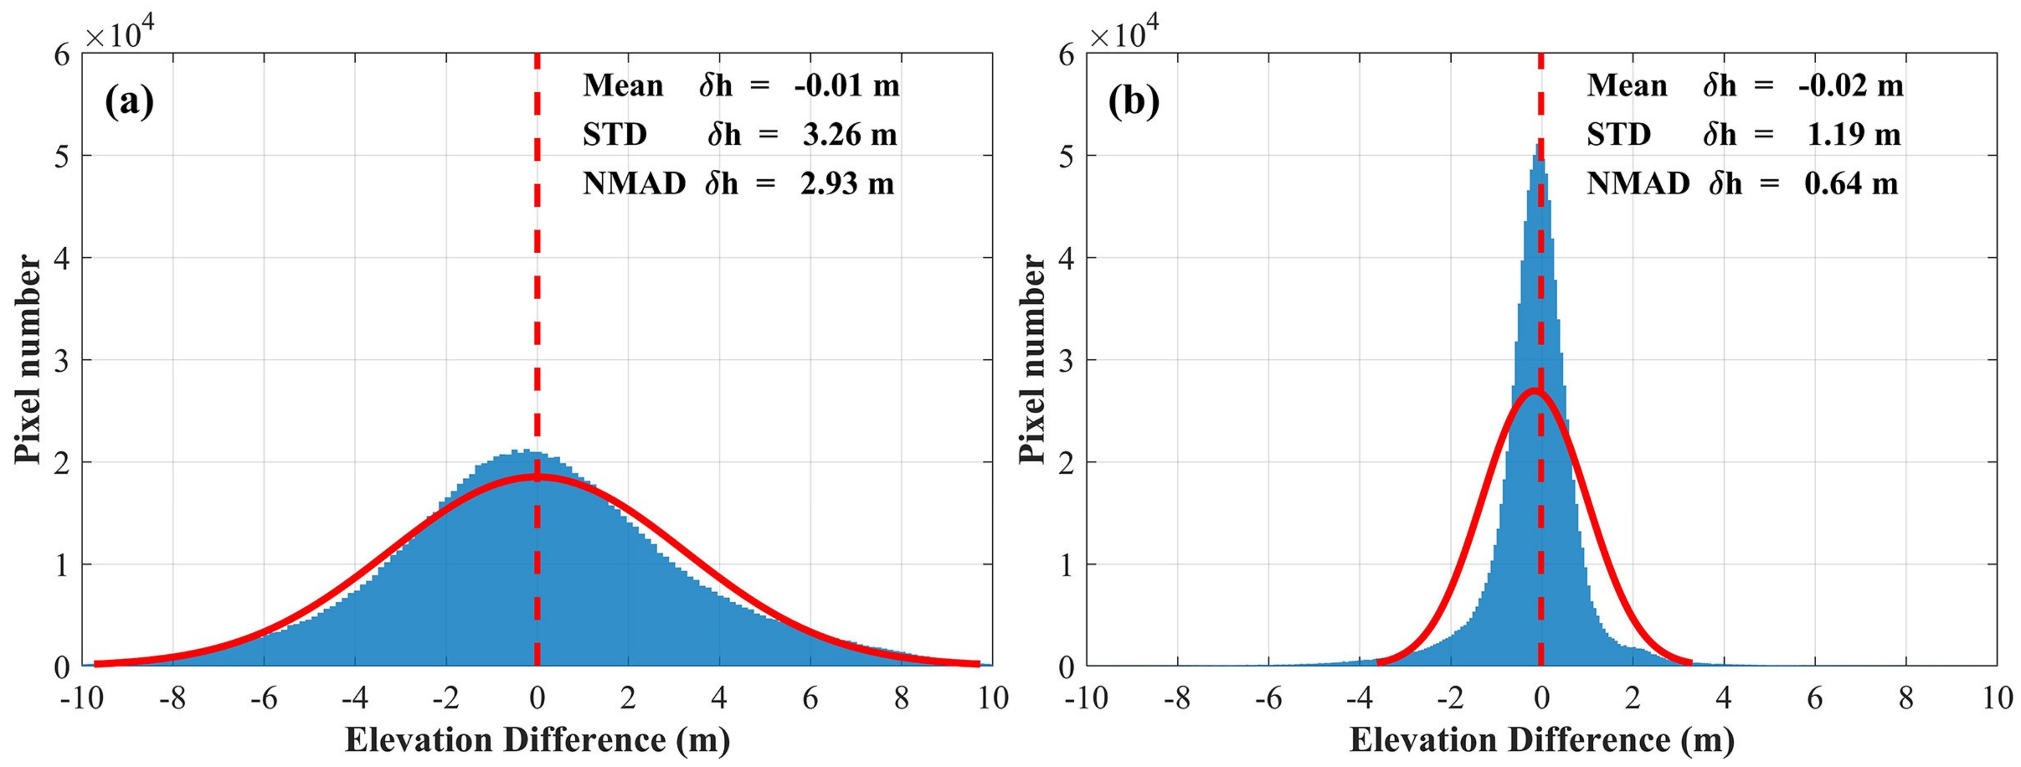
where Δ h is the height difference observation and n is the number of observations. Figure 6 illustrates the distribution of nonglacial height differences from two data sources. The mean values were very close to zero and the NAMDs were also low. Note that, the higher error level of the height differences during 2000–2010 (PRISM DEM–SRTM-C DEM) were mainly resulted from the low quality of winter PRISM images. There is serious pixel saturation in snow surface and serious pixel distortion in hillsides.
In addition to the uncertainty of height difference measurements ( δ h e i g h t _ d i f f ), the glacier seasonal changes and radar penetration into glacier surface may also introduce uncertainties to the glacier thickness change results [41]. The final uncertainty should be calculated through the basic error propagation principle:
δ = s q r t δ h e i g h t _ d i f f 2 + δ s e a s o n 2 + δ p e n e t r a t i o n 2
δ p e n e t r a t i o n = s q r t δ X 2 + δ C X 2
where δ X and δ C X represent the uncertainty of X-band penetration depth and the uncertainty of penetration difference between C- and X-bands, respectively. The contribution of seasonal variation ( δ s e a s o n ) is negligible, because all DEMs were acquired in winter. δ C X existed in two thickness change results, and δ X only existed in the result involved with PRISM DEM. We used the NMAD of differences between SRTM-C and SRTM-X elevations over stable regions to evaluate δ C X , which is 1.99 m. The overall uncertainty of the thickness change result involved with TanDEM-X DEM is ±2.09 m. δ X should be the absolute penetration depth of X-band, because we only corrected the penetration differences between C- and X-bands. Comparing the TanDEM-X DEM with GNSS elevations, Lambrecht et al. [41] found the average winter X-band penetration depth over a firn basin of the Fedchenko Glacier (Pamir) was about 1.8 m. We assumed it as the value of δ X . It is conservative to do so because our thickness change results involved with PRISM DEM are only available in glacier ablation zones (Figure 2a). Due to more complicated stratigraphy and higher mass density, the penetration of the X-band in the glacier ablation zone should be considerably weaker than the accumulation zone. The overall uncertainty of the thickness change result involved with PRISM DEM is ±3.93 m. In general, the magnitude of uncertainty is very small relative to glacier thickness change observations during the surge phase.
The uncertainties of glacier flow velocity measurements are mainly related to pixel size, co-registration accuracy, and the interval of image pairs. A typical co-registration accuracy of SAR intensity tracking over the glacier surface is better than 1/10 pixel [42]. The intervals of image pairs were 24 days (mostly) or 36 days. For image pairs with an interval of 24 days (image resolution: 4 m ×14 m), the theoretical uncertainty of the flow velocity measurement was about 6 cm/d. In fact, the average of the nonglacial flow velocity ranged from 2.6 to 4.0 cm/d, and the STD ranged from ±3.9 to ±5.6 cm/d. The uncertainty is also very small compared to the flow velocity observations during the surge phase (over 1.2 m/d).
The uncertainties of glacier area measurements ( δ a r e a ) are mainly related to pixel size and perimeter of the glacier boundary. Based on the assumption that the accuracy of manual delineation is half the pixel size, and the potential error of glacier area measurements is equal to half of the area of pixels crossed by glacier boundary [43]. The calculation formula is listed below:
δ a r e a = 1 2 × L × R
where L is the perimeter of glacier boundary and R is the pixel size. The uncertainty of the area measurements of the Monomah Glacier is ±0.55 km2.

5.2. The Surge Process of the Monomah Glacier
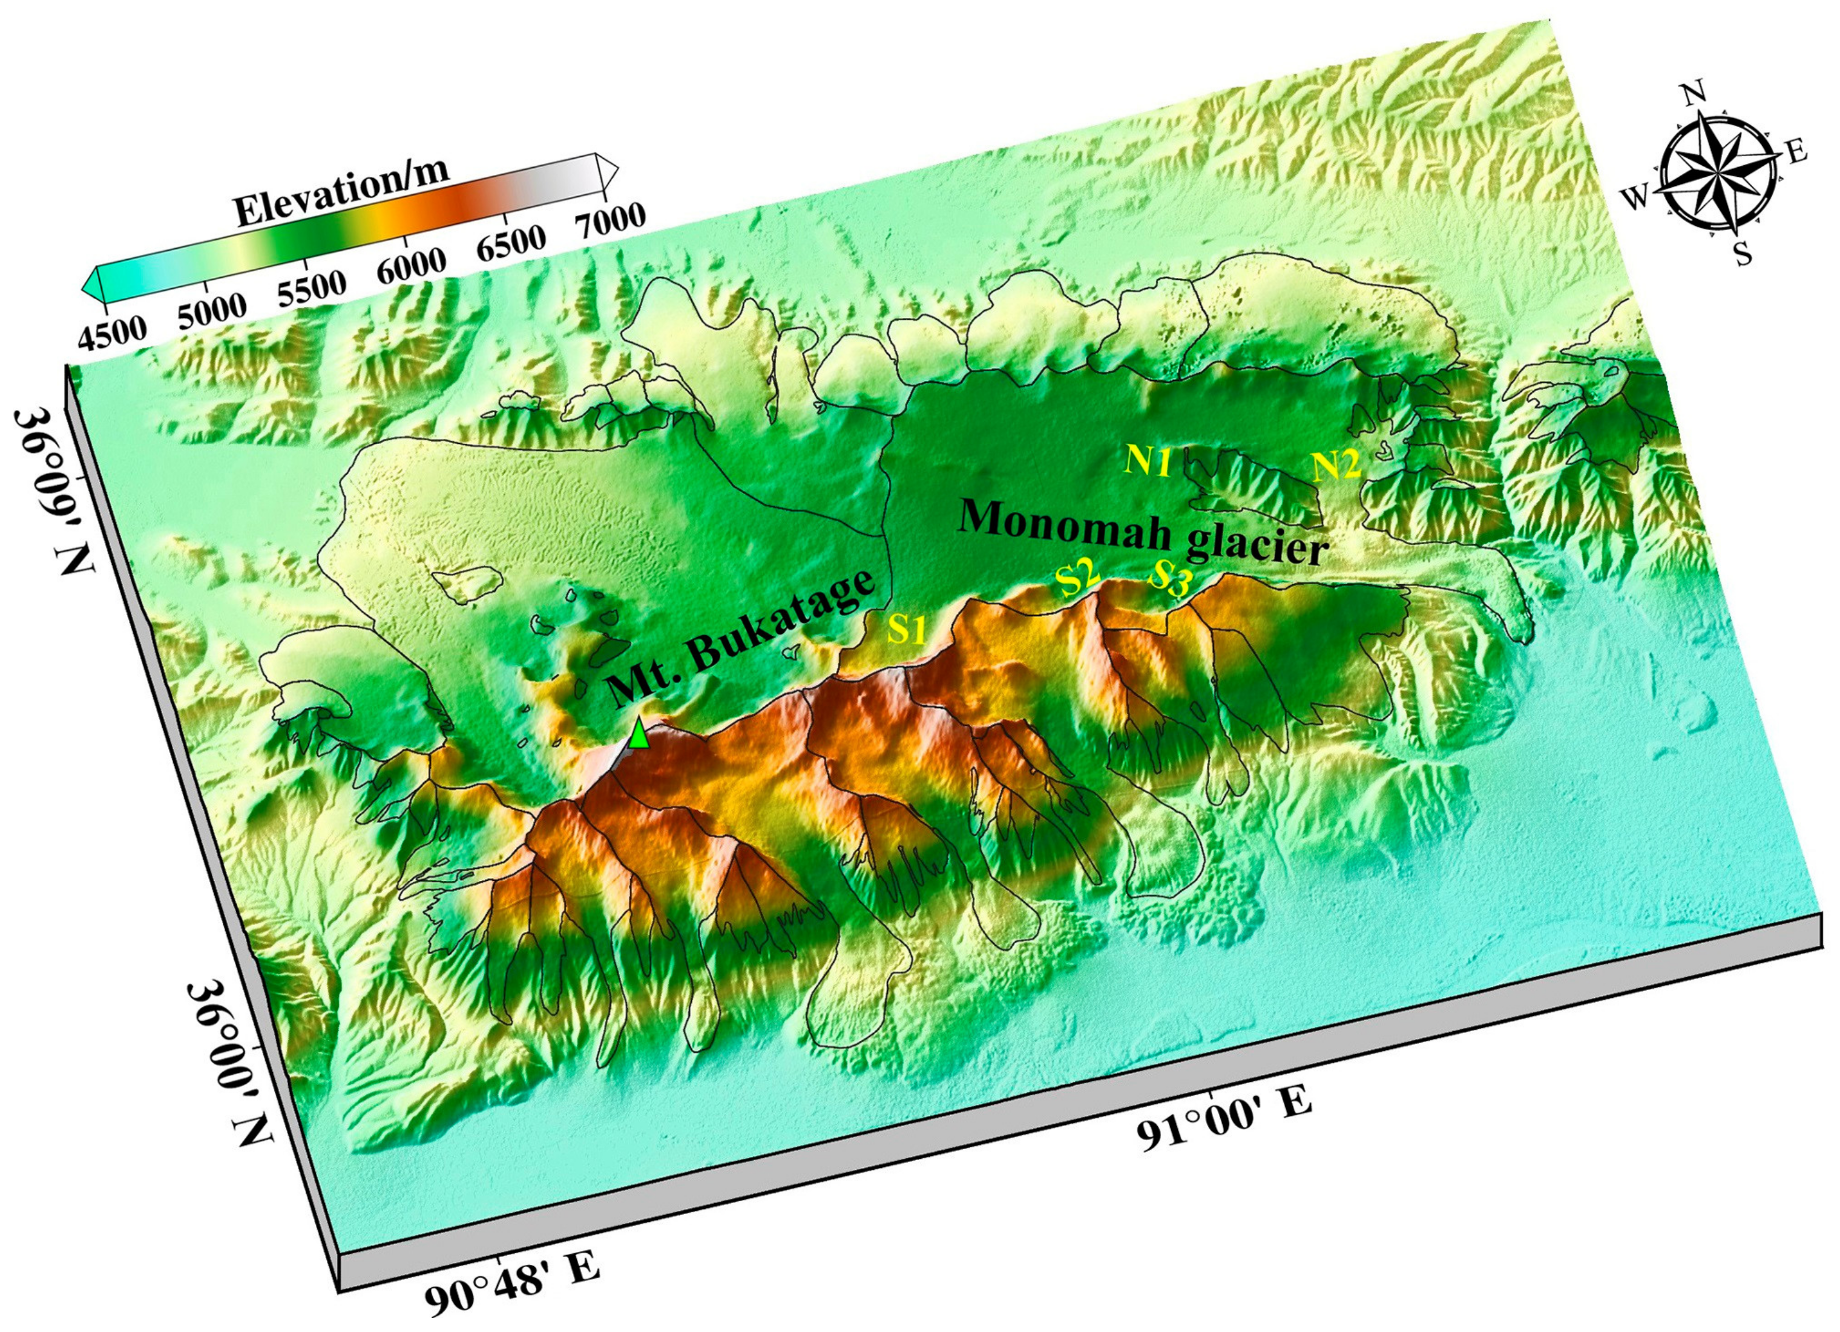
Our analysis of change in glacier thickness (2000–2012), boundary (2000–2017), and morphology (2003–2013) indicated that the recent surge of the Monomah Glacier began during early 2009. From 2009 to 2016, the glacier tongue experienced three periods of changes: side broadening (2009–2010), rapid advancing (2010–2013), and slow expansion (2013–2016). The extension of the demarcation line (Figure 5c–e) indicated that the mass in the upper- and middle-stream zones moved downward from September 2008 to May 2009. Besides, the distribution of thickness change appeared to be significantly affected by the local terrain. A similar impact of the topographic condition on the surge-type glacier was confirmed by previous studies [4,10,44]. In particular, the northern accumulation zone of Monomah Glacier was within a groove parallel to the trunk, and the mass that accumulated there fed the trunk through a gentle pass (Figure 7 N1) and a tributary (Figure 7 N2). Therefore, mass from the tributary (Figure 7 N2) actually hindered movement of the mass from the upper trunk at the confluence (Figure 5d,e). However, the gravitational potential energy of the mass was too high, and this hindrance did not last (Figure 5f). The mass from the tributary was then pushed to the north side of the upper tongue. The emergence of dense crevasses in the middle- and down-stream regions, the increase of surface reflectance in the upper tongue (Figure 5f), and the expansion of the tongue from May 2009 to May 2010 (Figure 4) indicated the mass in middle-stream collapsed and slipped into the tongue. After passing the confluence zone, the mass from the middle-stream flowed eastward, but the valley faces southeast. More importantly, a longitudinal hill was in front of the valley mouth, and the ice flow was forced to divert southward (Figure 2 and Figure 7). Hence, between 2008 and 2009 only the north side of the upper tongue expanded (Figure 4), and ice thickening was mainly on the north side of the tongue from 2000 to 2010 (Figure 2a).
Figure 7. Topography of the Bukatage Massif. Elevation source: SRTM-C DEM; black lines: glacier boundary in 2001.
Remotesensing 12 00966 g007
From May 2010 to July 2011, the crevasse-developing area extended upward (Figure 5g), indicating that the up-stream region collapsed because of losing middle-stream buttressing. The collapse of the up-stream region corresponded to a large mass release. The surface of the up-stream and higher middle-stream regions were significantly lower after the mass release. As shown in Figure 2b, the thinning of the Monomah Glacier mostly occurred in the south side of the upper trunk. The northern accumulation zone, which was wide and flat, was suited for mass accumulation [10]; however, the northern ridge (the source of the mass in the northern accumulation zone) was not high enough relative to the Bukatage ridge. The southern accumulation zone received mass from the high Bukatage ridge and fed the trunk directly. The three thinning centers were at the bases of the three cirques (S1–S3 in Figure 7), because mass accumulated faster there before the surge phase. Starting in about 2013, the pace of tongue expansion slowed. Due to the lack of optical and SAR images, we could not determine whether this started in 2012 or 2013. The time of the upstream collapse corresponded with that of the sharp tongue expansion (2010–2011). Thus, it is reasonable to infer that the slowing of tongue expansion corresponded to the end of the large-scale mass release from the up-stream region. Figure 3 shows that there were very high speeds in the down-stream and lower middle-stream regions during 2015, indicating that most of the mass restored in the up-stream and higher middle-stream regions during the quiescent phase had already moved to the down-stream and lower middle-stream regions. Notably, the peaks of flow velocity during 2015–2016 occurred west of the confluence because of the steep slope (Figure 7).
During the period of greatest mass transfer (2010–2013), the glacier tongue expanded quickly even during winter (Figure 4). However, from 2013 to 2016, the tongue only expanded during summer. These seasonal changes are consistent with the seasonal changes in flow velocity. In particular, the Monomah Glacier flowed much faster during summer than winter of 2015 and 2016 (Figure 3). This seasonal change of flow velocity is generally controlled by the amount of englacial meltwater [2]. The ablation of High Asia mountain glaciers mainly occurs from May to September [1,10]. During the ablation season, the subglacial water pressure increases and promotes glacier motion [45,46]. Besides, the annual average flow velocity of the tongue decreased obviously from 2015 to 2016, indicating a release of kinetic energy by the transferred ice body. Finally, the glacier flow velocity returned to its normal level and tongue expansion ceased at the end of 2016. As shown in Figure 4, the boundary of the tongue remained almost unchanged from September 2016 to August 2017. The recent surge of the Monomah Glacier thus lasted about 8 years (from early 2009 to late 2016). Large glaciers in the Bukatage Massif generally have wide-tailed tongues that extend to the proglacial plain (Figure 1 and Figure 7). When a glacier with this configuration surges, the effective normal stress in the downstream region declines, and this facilitates glacier motion. During the subsequent quiescent phase, the tongue will undergo significant ice ablation because of its wide superficial area. Therefore, the advancing and retreating of ice tongue occurred alternately over a relatively short period [19]. This phenomenon is similar to that found in the Perseibreen Glacier, Svalbard [47]. The significant thinning at the terminus from 2000 to 2010 (Figure 2a) indicated that if there was no recent surge, the tongue of the Monomah Glacier would have severe loss of mass, similar to the West Monomah Glacier. The mottled surface of the tongue (Figure 5a–e) also suggests severe ablation from 2003 to 2009.

5.3. Surge Mechanism of the Monomah Glacier

Our measurements of changes in glacier thickness showed that the thickness of the up-stream region of the West Monomah Glacier increased considerably over time. Although data on changes in thickness prior to the surge are not available, we believe that the up-stream region of the adjacent Monomah Glacier gained more mass before 2009, because it is broader and more even than that of the West Monomah Glacier (Figure 7). Due to the gentle terrain, the accumulated mass increased normal stress to the bedrock. Due to the increasing weight, it is likely that the subglacial temperature had reached the pressure-melting point [7,12]. An increase of meltwater lubricated the base and reduces the resistance to flow. The thermal conditions of the lower reaches changed over time [3], thus triggering the surge. A thermal-controlled glacier surge often lasts for several years [44], and our results indicated the recent surge of the Monomah Glacier lasted for about 8 years. In addition, we found that the Monomah Glacier advanced during the summer and winter when there was large-scale mass transfer (2010–2013), consistent with features of a thermal-controlled glacier surge [3,7].
For a hydrology-controlled glacier surge, the flow velocity is directly related to the englacial water pressure, which depends on the state of the subglacial drainage system [5,18]. During summer, an input of a large amount of meltwater can activate the drainage channels, and the subglacial water pressure drops. However, due to the constant compressive motion and plasticity of the ice body, the drainage channels gradually narrow as the meltwater declines during autumn and winter [48]. The subglacial water pressure then increases again. Such processes can lead to abnormal seasonal changes of flow velocity, more precisely a decrease during summer and an increase during winter [3,13,17]. We found that the flow velocity of the Monomah Glacier increased during summer and decreased during winter during the late surge phase, and this confirms that the recent surge of the Monomah glacier is thermal-controlled.
Our results thus lead to the following interpretations regarding the evolution of the recent Monomah Glacier surge. As the accumulation zone restored mass and the air temperature increased, the subglacial temperature gradually increased to the pressure-melting point. The meltwater lubricated the interface between the basal ice and bedrock, and the upstream region accelerated correspondingly. However, the transition from cold thermal condition to temperate thermal condition was slow. During the accelerating phase in the up-stream region, the downstream region remained frozen to the bedrock [49,50]. Therefore, the stacked mass at the middle-stream region increased. During early 2009, the gravitational potential energy of the stacked mass exceeded the critical value, and this triggering the glacier surge. Then, from 2009 to 2013, a large amount of ice was transferred from the up-stream and higher middle-stream regions to the down-stream and lower middle-stream regions, leading to a remarkable expansion of the tongue. Due to the high gravitational potential energy and abundant meltwater, the mass transferred to the down-stream region continued to move rapidly during the ablation seasons of 2013–2016. At the end of 2016, the glacier flow velocity returned to its normal level, and the terminus remained mostly stationary.
The revealed three-stage surge process of the Monomah glacier surge is consistent with the surge cases in Svalbard [51]. However, compared to the typical polythermal surge-type glaciers in Svalbard, the Monomah Glacier exhibited a shorter quiescent period (less than 20 years) [21]. The surge cycle can be affected by the local climate [52]. The climate wetting in the Bukatage Massif allowed glaciers to gain mass faster in the upper reaches. Besides, as mentioned above, the air temperature in the Bukatage Massif increased obviously during the early 21st century [20,21]. It is possible that the englacial temperature also increased [2,10]. In addition, in Svalbard the positive feedback from deformable till was thought to be an important factor that initiates the glacier surge [7,53], and the prevalent proglacial moraine and supraglacial drainage can support this view [54,55]. However, the Monomah glacier is debris-free. What kind of role the sediments played in the surge of Monomah glacier is to be determined by field investigation.

6. Conclusions

In order to investigate the evolution and mechanism of the recent Monomah Glacier surge, we determined changes in glacier thickness, flow velocity, and surface morphology based on four sources of remote sensing data. Results indicated that the recent Monomah Glacier surge was triggered at the lower middle-stream in early 2009 and ceased in late 2016. In the first two years, only the middle- and down-streams surged, and the ice tongue broadened but did not advance. In the third year, the up-stream collapsed because of losing middle-stream buttressing. The large-scale mass transfer and rapid tongue advancing lasted from about 2011 to 2013. After five years of fast flow, most of the mass transferring from higher regions to lower regions was done. However, due to the high gravitational potential energy and rich meltwater, the mass transferred to ice tongue did not deposit immediately. It still flowed fast during 2013–2016 (up to 1.2 m/d). At the end of 2016, the flow velocity finally restored to the normal level (0.25 m/d), and the ice tongue stopped advancing. This surge increased the area of the glacier by 6.27 km2 and increased its length by 1.45 km. From 2000 to 2012, the glacier thickness decreased by about 25 to 50 m in the upper trunk, and increased by about 50–90 m in the lower trunk. The obvious thickening in the accumulation zone of adjacent glacier suggests the Monomah Glacier had accumulated substantial mass in higher reaches before the surge. Besides, during the period of large-scale mass transfer (2000–2013), the glacier tongue expanded quickly during the summer and winter. However, during the late phase (2013–2016), the tongue only expanded during summer, and these changes are consistent with the seasonal changes in flow velocity. Combining the characteristics of multi-aspect changes, we conclude that the recent Monomah Glacier surge was thermal-controlled. In particular, the subglacial temperature rose to the pressure-melting point because of the substantial mass accumulation in the up-stream and higher middle-stream regions, and the increased basal meltwater lubricates the base and reduces the resistance to flow. The thermal conditions of the lower reaches changed over time, thus triggering the surge.
Analysis of multi-aspect glacier dynamics is very useful for investigating the evolution and mechanism of glacier surges. However, our results are limited to a single glacier, and cannot explain the regional characteristics of surge-type glaciers. The glacier surge behaviors can affect the glacier mass balance and basin runoff, and more importantly, can cause serious hazards to down-stream communities. Various surge behaviors have been widely reported in Karakoram, West-Kunlun, and Svalbard [13,17,51]. By contrast, the knowledge on glacier surge in central QTP is very limited. Thus, more studies of glacier surges in the central QTP are needed to determine how glaciers will change in response to the increasingly warm and wet climate in this region.

Author Contributions

Conceptualization, J.L. and L.G.; methodology, J.L. and L.G.; validation, X.L., Z.M., and W.W.; formal analysis, J.L. and L.G.; resources, J.L., L.W., Z.L. and Y.L.; data curation, L.G.; writing—original draft preparation, L.G.; writing—review and editing, J.L., L.W. and Z.L.; visualization, L.G. and J.L.; supervision, Z.L. and Y.L.; project administration, J.L., L.W., Z.M., and W.W.; funding acquisition, J.L., L.W., Z.M., and W.W. All authors have read and agreed to the published version of the manuscript.

Funding

This work was supported by the Strategic Priority Research Program of Chinese Academy of Sciences (No. XDA20100101), the National Key R & D plans of China (Nos. 2018YFA0605500 and 2018YFC1503505), the National Natural Science Foundation of China (Nos. 41904006, 41771081 and 41901295), the Hunan Provincial Natural Science Foundation of China (No. 2019JJ50761), the Hunan Provincial Talents Gathering Program of China (No. 2018RS3013), the Fundamental Research Funds for the Central Universities of Central South University (2019zzts638), and the Innovation Foundation of Shanghai Academy of Spaceflight Technology (No. SAST2018-042).

Acknowledgments

The authors express gratitude to all institution that provide us the dataset used in this study. TanDEM-X CoSSC images were from the DLR via Project No. jiali_XTI_GLAC6767. Sentinel-1A and Landsat images were from the ASF (https://vertex.daac.asf.alaska.edu/#) and the USGS (http://earthexplorer.usgs.gov/), respectively. C-band and X-band SRTM DEMs were from the CGIAR-CSI (http://srtm.csi.cgiar.org/) and EOC Geoservice (https://geoservice.dlr.de/web/), respectively. AW3D30 DSM was from the JAXA (https://www.eorc.jaxa.jp/ALOS/en/aw3d30/).

Conflicts of Interest

The authors declare no conflict of interest.

References

  1. Xie, Z.; Liu, C. Introduction of Glaciology, 1st ed.; Shanghai Popular Science Press: Shanghai, China, 2010; (In Chinese). ISBN 978-7-54-274449-4. [Google Scholar]
  2. Cuffey, K.; Paterson, W.S.B. The Physics of Glaciers, 4th ed.; Butterworth-Heinemann/Elsevier: Burlington MA, USA, 2010; ISBN 0123694612. [Google Scholar]
  3. Jiskoot, H. Glacier Surging. In Encyclopedia of Snow, Ice and Glaciers; Singh, V.P., Singh, P., Haritashya, U.K., Eds.; Springer: Dordrecht, The Netherlands, 2011; pp. 415–428. ISBN 978-9-04-812641-5. [Google Scholar]
  4. Bhambri, R.; Hewitt, K.; Kawishwar, P.; Pratap, B. Surge-type and surge-modified glaciers in the Karakoram. Sci. Rep. 2017, 7, 15391. [Google Scholar] [CrossRef] [PubMed]
  5. Kamb, B. Glacier surge mechanism based on linked cavity configuration of the basal water conduit system. J. Geophys. Res. 1987, 92, 9083–9100. [Google Scholar] [CrossRef] [Green Version]
  6. Lingle, C.S.; Fatland, D.R. Does englacial water storage drive temperate glacier surges? Ann. Glaciol. 2003, 36, 14–20. [Google Scholar] [CrossRef] [Green Version]
  7. Murray, T.; Stuart, G.W.; Miller, P.J.; Woodward, J.; Smith, A.M.; Porter, P.R.; Jiskoot, H. Glacier surge propagation by thermal evolution at the bed. J. Geophys. Res. 2000, 105, 13491–13507. [Google Scholar] [CrossRef] [Green Version]
  8. Murray, T.; Strozzi, T.; Luckman, A.; Jiskoot, H.; Christakos, P. Is there a single surge mechanism? Contrasts in dynamics between glacier surges in Svalbard and other regions. J. Geophys. Res. 2003, 108, 961. [Google Scholar] [CrossRef]
  9. Copland, L.; Sylvestre, T.; Bishop, M.P.; Shroder, J.F.; Seong, Y.B.; Owen, L.A.; Bush, A.; Kamp, U. Expanded and Recently Increased Glacier Surging in the Karakoram. Arct. Antarct. Alp. Res. 2011, 43, 503–516. [Google Scholar] [CrossRef] [Green Version]
  10. Hewitt, K. Glaciers of the Karakoram Himalaya; Springer: Dordrecht, The Netherlands, 2014; ISBN 978-9-40-076310-4. [Google Scholar]
  11. Kamb, B.; Raymond, C.F.; Harrison, W.D.; Engelhardt, H.; Echelmeyer, K.A.; Humphrey, N.; Brugman, M.M.; Pfeffer, T. Glacier surge mechanism: 1982-1983 surge of variegated glacier, alaska. Science 1985, 227, 469–479. [Google Scholar] [CrossRef] [Green Version]
  12. Fowler, A.C.; Murray, T.; Ng, F.S.L. Thermally controlled glacier surging. J. Glaciol. 2001, 47, 527–538. [Google Scholar] [CrossRef] [Green Version]
  13. Quincey, D.J.; Glasser, N.F.; Cook, S.J.; Luckman, A. Heterogeneity in Karakoram glacier surges. J. Geophys. Res. Earth Surf. 2015, 120, 1288–1300. [Google Scholar] [CrossRef] [Green Version]
  14. Kääb, A.; Berthier, E.; Nuth, C.; Gardelle, J.; Arnaud, Y. Contrasting patterns of early twenty-first-century glacier mass change in the Himalayas. Nature 2012, 488, 495–498. [Google Scholar] [CrossRef]
  15. Zhou, Y.; Li, Z.; Li, J. Slight glacier mass loss in the Karakoram region during the 1970s to 2000 revealed by KH-9 images and SRTM DEM. J. Glaciol. 2017, 63, 331–342. [Google Scholar] [CrossRef] [Green Version]
  16. Gardelle, J.; Berthier, E.; Arnaud, Y.; Kääb, A. Region-wide glacier mass balances over the Pamir-Karakoram-Himalaya during 1999–2011. Cryosphere Discuss. 2013, 7, 975–1028. [Google Scholar] [CrossRef]
  17. Yasuda, T.; Furuya, M. Dynamics of surge-type glaciers in West Kunlun Shan, Northwestern Tibet. J. Geophys. Res. Earth Surf. 2015, 120, 2393–2405. [Google Scholar] [CrossRef] [Green Version]
  18. Li, Z.; Sun, W.; Zeng, Q. Deriving Glacier Change Information on the Xizang (Tibetan) Plateau by Integrating RS and GIS Techniques. Acta Geographica Sinica 1999, 54, 263–268. (In Chinese) [Google Scholar] [CrossRef]
  19. Jiang, S.; Yang, T.; Wang, X.; Tian, H. Response of glacier variation to climate change in the Bukatage Ice Cap from 1973 to 2010. J. Arid Land Resour. Environ. 2013, 27, 47–52. (In Chinese) [Google Scholar] [CrossRef]
  20. Hu, F.; Yang, T.; Ji, Q.; Li, H.; Wang, J. Response of glacier in the Bukatage Mountains to climate change from 1990 to 2015. Arid Land Geography 2018, 41, 66–73. (In Chinese) [Google Scholar] [CrossRef]
  21. Gao, Y.; Yao, X.; Liu, S.; Qi, M.; Duan, H.; Liu, J.; Zhang, D. Remote sensing monitoring of advancing glaciers in the Bukatage Mountains from 1973 to 2018. J. Nat. Resour. 2019, 34, 1666–1681. (In Chinese) [Google Scholar] [CrossRef]
  22. Zhou, Y.; Hu, J.; Li, Z.; Li, J.; Zhao, R.; Ding, X. Quantifying glacier mass change and its contribution to lake growths in central Kunlun during 2000–2015 from multi-source remote sensing data. J. Hydrol. 2019, 570, 38–50. [Google Scholar] [CrossRef]
  23. Meier, M.F.; Post, A.S. What are glacier surges? Can. J. Earth Sci. 1969, 6, 807–817. [Google Scholar] [CrossRef]
  24. Paul, F. Revealing glacier flow and surge dynamics from animated satellite image sequences: Examples from the Karakoram. Cryosphere 2015, 9, 2201–2214. [Google Scholar] [CrossRef] [Green Version]
  25. Guo, W.; Liu, S.; Xu, J.; Wu, L.; Shangguan, D.; Yao, X.; Wei, J.; Bao, W.; Yu, P.; Liu, Q.; et al. The second Chinese glacier inventory: Data, methods and results. J. Glaciol. 2015, 61, 357–372. [Google Scholar] [CrossRef] [Green Version]
  26. Strozzi, T.; Luckman, A.; Murray, T.; Wegmüller, U.; Werner, C. Glacier motion estimation using SAR offset-tracking procedures. IEEE Trans. Geosci. Remote Sens. 2002, 40, 2384–2391. [Google Scholar] [CrossRef] [Green Version]
  27. Ye, Q.; Bolch, T.; Naruse, R.; Wang, Y.; Zong, J.; Wang, Z.; Zhao, R.; Yang, D.; Kang, S. Glacier mass changes in Rongbuk catchment on Mt. Qomolangma from 1974 to 2006 based on topographic maps and ALOS PRISM data. J. Hydrol. 2015, 530, 273–280. [Google Scholar] [CrossRef]
  28. Li, Z.; Li, J.; Ding, X.; Wu, L.; Ke, L.; Hu, J.; Xu, B.; Peng, F. Anomalous Glacier Changes in the Southeast of Tuomuer-Khan Tengri Mountain Ranges, Central Tianshan. J. Geophys. Res. Atmos. 2018, 123, 6840–6863. [Google Scholar] [CrossRef]
  29. Tadono, T.; Ishida, H.; Oda, F.; Naito, S.; Minakawa, K.; Iwamoto, H. Precise Global DEM Generation by ALOS PRISM. ISPRS Ann. Photogramm. Remote Sens. Spatial Inf. Sci. 2014, 2, 71–76. [Google Scholar] [CrossRef] [Green Version]
  30. Rodríguez, E.; Morris, C.S.; Belz, J.E. A Global Assessment of the SRTM Performance. Photogramm Eng Remote Sens. 2006, 72, 249–260. [Google Scholar] [CrossRef] [Green Version]
  31. Pieczonka, T.; Bolch, T.; Junfeng, W.; Shiyin, L. Heterogeneous mass loss of glaciers in the Aksu-Tarim Catchment (Central Tien Shan) revealed by 1976 KH-9 Hexagon and 2009 SPOT-5 stereo imagery. Remote Sens. Environ. 2013, 130, 233–244. [Google Scholar] [CrossRef] [Green Version]
  32. Holzer, N.; Vijay, S.; Yao, T.; Xu, B.; Buchroithner, M.; Bolch, T. Four decades of glacier variations at Muztagh Ata (eastern Pamir): A multi-sensor study including Hexagon KH-9 and Pléiades data. Cryosphere 2015, 9, 2071–2088. [Google Scholar] [CrossRef] [Green Version]
  33. Nuth, C.; Kääb, A. Co-registration and bias corrections of satellite elevation data sets for quantifying glacier thickness change. Cryosphere 2011, 5, 271–290. [Google Scholar] [CrossRef] [Green Version]
  34. Li, J.; Li, Z.; Zhu, J.; Li, X.; Xu, B.; Wang, Q.; Huang, C.; Hu, J. Early 21st century glacier thickness changes in the Central Tien Shan. Remote Sens. Environ. 2017, 192, 12–29. [Google Scholar] [CrossRef] [Green Version]
  35. Luckman, A.; Quincey, D.J.; Bevan, S. The potential of satellite radar interferometry and feature tracking for monitoring flow rates of Himalayan glaciers. Remote Sens. Environ. 2007, 111, 172–181. [Google Scholar] [CrossRef]
  36. Sansosti, E.; Berardino, P.; Manunta, M.; Serafino, F.; Fornaro, G. Geometrical SAR image registration. IEEE Trans. Geosci. Remote Sens. 2006, 44, 2861–2870. [Google Scholar] [CrossRef]
  37. Li, J.; Li, Z.; Ding, X.; Wang, Q.; Zhu, J.; Wang, C. Investigating mountain glacier motion with the method of SAR intensity-tracking: Removal of topographic effects and analysis of the dynamic patterns. Earth-Sci. Rev. 2014, 138, 179–195. [Google Scholar] [CrossRef]
  38. Buades, A.; Coll, B.; Morel, J.-M. A Non-Local Algorithm for Image Denoising. In Proceedings of the 2005 IEEE Computer Society Conference on Computer Vision and Pattern Recognition (CVPR’05), San Diego, CA, USA, 20–26 June 2005; IEEE: New York, NY, USA, 2005; pp. 60–65, ISBN 0-7695-2372-2. [Google Scholar]
  39. Paul, F.; Bolch, T.; Briggs, K.; Kääb, A.; McMillan, M.; McNabb, R.; Nagler, T.; Nuth, C.; Rastner, P.; Strozzi, T.; et al. Error sources and guidelines for quality assessment of glacier area, elevation change, and velocity products derived from satellite data in the Glaciers_cci project. Remote Sens. Environ. 2017, 203, 256–275. [Google Scholar] [CrossRef] [Green Version]
  40. Höhle, J.; Höhle, M. Accuracy assessment of digital elevation models by means of robust statistical methods. ISPRS J. Photogramm. Remote Sens. 2009, 64, 398–406. [Google Scholar] [CrossRef] [Green Version]
  41. Lambercht, A.; Mayer, C.; Wendt, A.; Floricioiu, D.; Volksen, C. Elevation change of Fedchenko Glacier, Pamir Mountains, from GNSS field measurements and TanDEM-X elevation models, with a focus on the upper glacier. J. Glaciol. 2018, 64, 637–648. [Google Scholar] [CrossRef] [Green Version]
  42. Werner, C.; Wegmuller, U.; Strozzi, T.; Wiesmann, A. Precision estimation of local offsets between pairs of SAR SLCs and detected SAR images. In Proceedings of the 2005 IEEE International Geoscience and Remote Sensing Symposium, IGARSS ‘05, Seoul, Korea, 25–29 July 2005; IEEE: New York, NY, USA, 2005; pp. 4803–4805, ISBN 0-7803-9050-4. [Google Scholar]
  43. Fujita, K.; Sakai, A.; Nuimura, T.; Yamaguchi, S.; Sharma, R.R. Recent changes in Imja Glacial Lake and its damming moraine in the Nepal Himalaya revealed by in situ surveys and multi-temporal ASTER imagery. J. Glaciol. 2009, 4, 45205. [Google Scholar] [CrossRef]
  44. Bolch, T.; Pieczonka, T.; Mukherjee, K.; Shea, J. Brief communication: Glaciers in the Hunza catchment (Karakoram) have been nearly in balance since the 1970s. Cryosphere 2017, 11, 531–539. [Google Scholar] [CrossRef] [Green Version]
  45. Sole, A.J.; Mair, D.W.F.; Nienow, P.W.; Bartholomew, I.D.; King, M.A.; Burke, M.J.; Joughin, I. Seasonal speedup of a Greenland marine-terminating outlet glacier forced by surface melt–induced changes in subglacial hydrology. J. Geophys. Res. 2011, 116, F01005. [Google Scholar] [CrossRef]
  46. Dunse, T.; Schuler, T.V.; Hagen, J.O.; Reijmer, C.H. Seasonal speed-up of two outlet glaciers of Austfonna, Svalbard, inferred from continuous GPS measurements. Cryosphere 2012, 6, 453–466. [Google Scholar] [CrossRef] [Green Version]
  47. Dowdeswell, J.A.; Benham, T.J. A surge of Perseibreen, Svalbard, examined using aerial photography and ASTER high resolution satellite imagery. Polar Res. 2003, 22, 373–383. [Google Scholar] [CrossRef]
  48. Li, J.; Li, Z.-w.; Wu, L.-x.; Xu, B.; Hu, J.; Zhou, Y.-s.; Miao, Z.-l. Deriving a time series of 3D glacier motion to investigate interactions of a large mountain glacial system with its glacial lake: Use of Synthetic Aperture Radar Pixel Offset-Small Baseline Subset technique. J. Hydrol. 2018, 559, 596–608. [Google Scholar] [CrossRef]
  49. Quincey, D.J.; Braun, M.; Glasser, N.F.; Bishop, M.P.; Hewitt, K.; Luckman, A. Karakoram glacier surge dynamics. Geophys. Res. Lett. 2011, 38, 1–6. [Google Scholar] [CrossRef] [Green Version]
  50. Clarke, G.K.C.; Collins, S.G.; Thompson, D.E. Flow, thermal structure, and subglacial conditions of a surge-type glacier. Can. J. Earth Sci. 1984, 21, 232–240. [Google Scholar] [CrossRef]
  51. Sund, M.; Eiken, T.; Hagen, J.O.; Kääb, A. Svalbard surge dynamics derived from geometric changes. Ann. Glaciol. 2009, 50, 50–60. [Google Scholar] [CrossRef] [Green Version]
  52. Sevestre, H.; Benn, D.I.; Hulton, N.R.J.; Bælum, K. Thermal structure of Svalbard glaciers and implications for thermal switch models of glacier surging. J. Geophys. Res. Earth Surf. 2015, 120, 2220–2236. [Google Scholar] [CrossRef] [Green Version]
  53. Jiskoot, H.; Murray, T.; Boyle, P. Controls on the distribution of surge-type glaciers in Svalbard. J. Glaciol. 2000, 46, 412–422. [Google Scholar] [CrossRef] [Green Version]
  54. Lønne, I. A new concept for glacial geological investigations of surges, based on High-Arctic examples (Svalbard). Quat. Sci. Rev. 2016, 132, 74–100. [Google Scholar] [CrossRef]
  55. Farnsworth, W.R.; Ingólfsson, Ó.; Retelle, M.; Schomacker, A. Over 400 previously undocumented Svalbard surge-type glaciers identified. Geomorphology 2016, 264, 52–60. [Google Scholar] [CrossRef]
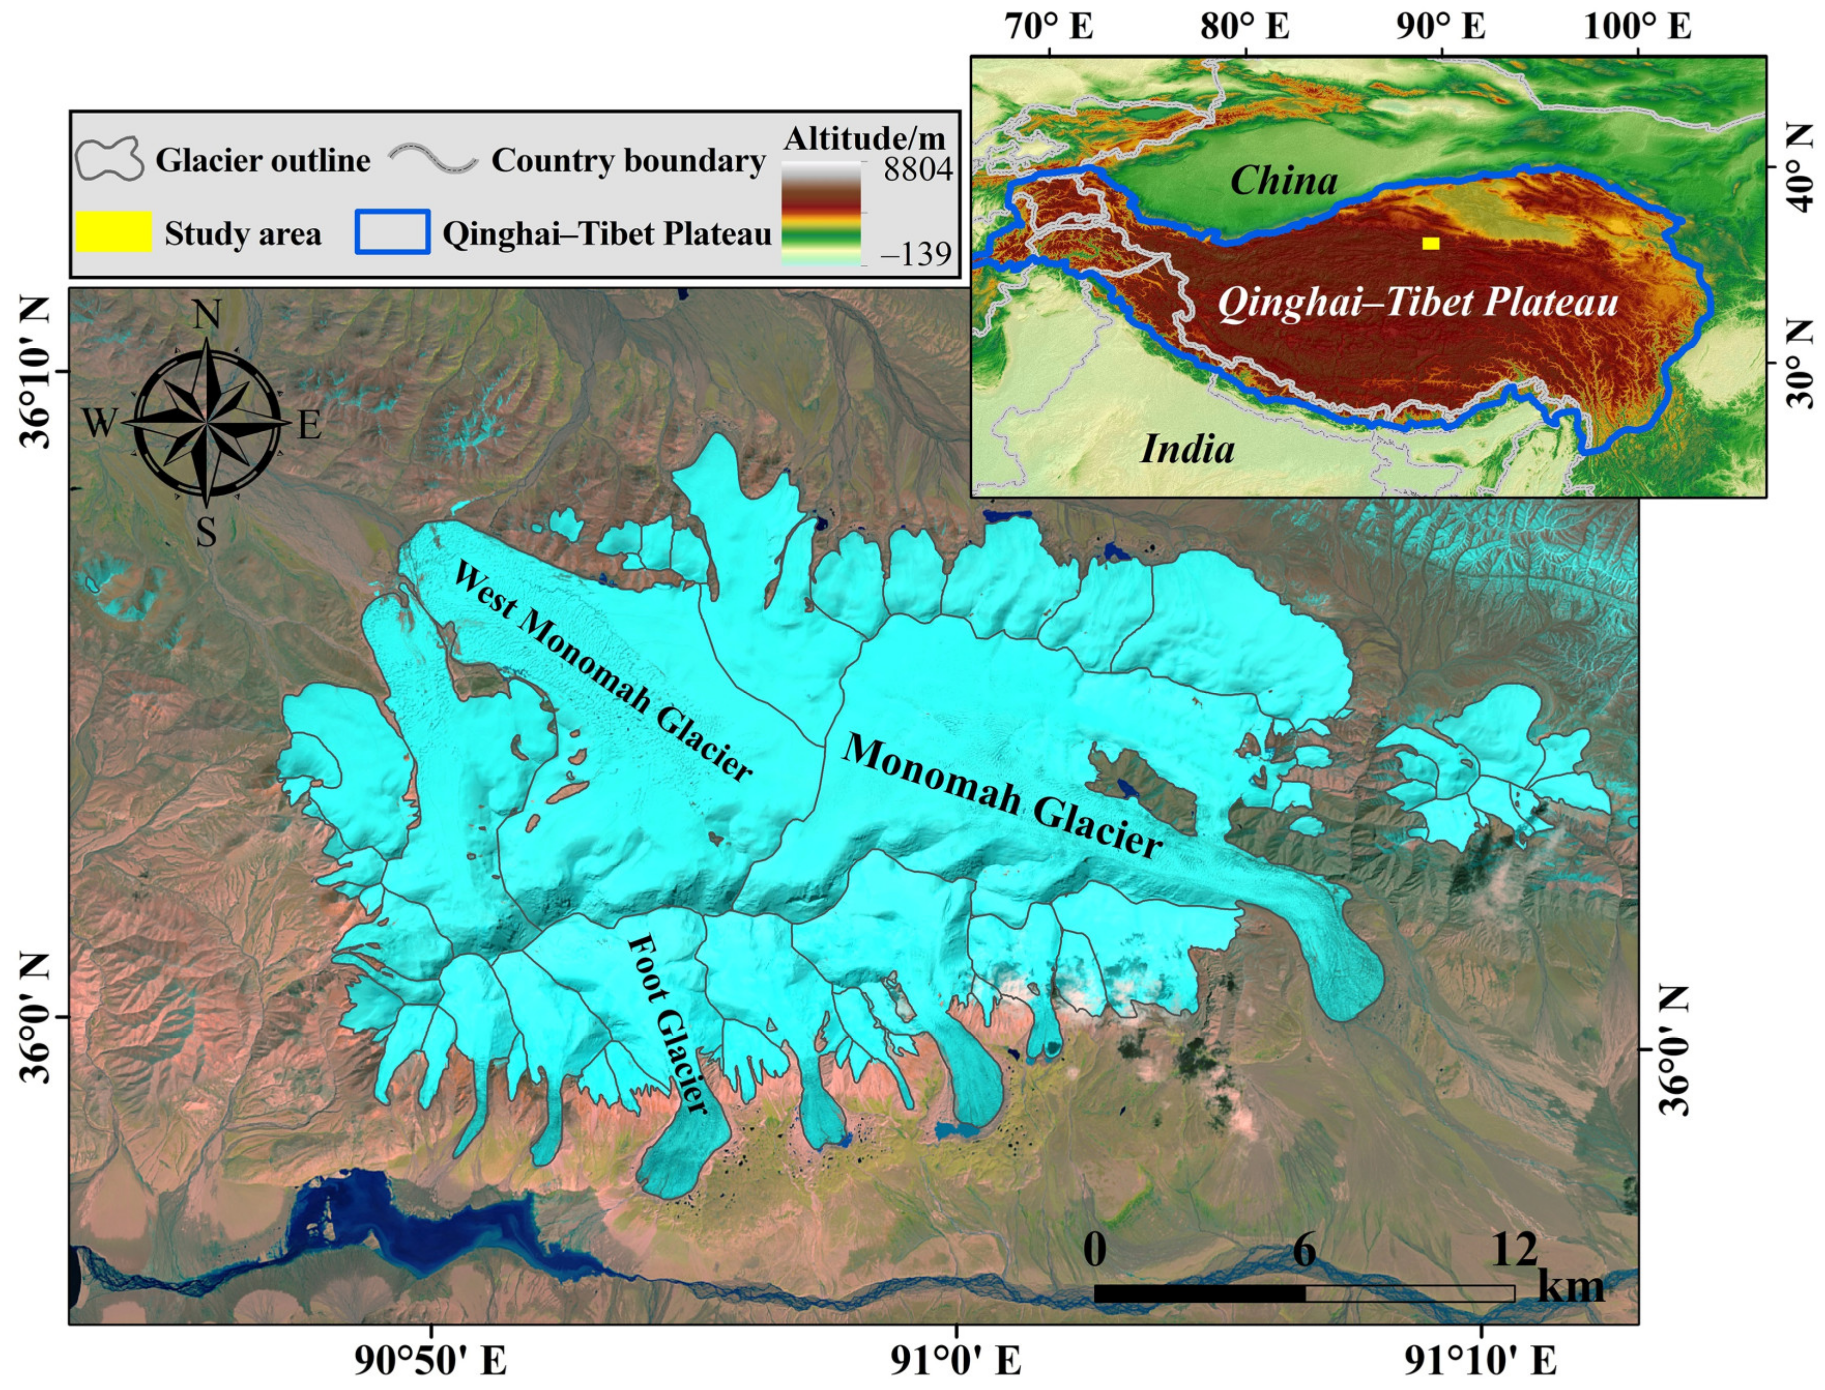
Figure 1. Glaciers in the Bukatage Massif. The Monomah Glacier is in the southeast. Background of the main panel: false-color Landsat-8/OLI image from 9 September 2016.
Remotesensing 12 00966 g001
Figure 2. Changes of glacier thickness in the Bukatage Massif. (a) In 2000–2010 (PRISM digital elevation model (DEM)–C-band shuttle radar tomography mission (SRTM-C) DEM) and (b) 2000–2012 (TanDEM-X DEM–SRTM-C DEM). Black lines: glacier outlines; backgrounds: shaded SRTM-C DEM; green triangle in each image: summit.
Remotesensing 12 00966 g002
Figure 3. Two-dimensional surface flow velocities of the Bukatage glacial center from 2015 to 2017. Black lines: glacier outlines; backgrounds: shaded DEMs.
Remotesensing 12 00966 g003
Figure 4. Changes in the boundary of the tongue of the Monomah Glacier from June 2000 to August 2017. Lines in different colors: glacier boundaries on different dates; background: false-color Landsat-8/OLI image acquired on 9 September 2016.
Remotesensing 12 00966 g004
Figure 5. Morphological changes of the Monomah Glacier from 22 September 2003 to 31 July 2013. Backgrounds: false-color Landsat images; black lines: boundary of the Monomah Glacier; red line: demarcation line between smooth and mottled zones; blue dashed line: demarcation line between smooth and crevasse-developing zones.
Remotesensing 12 00966 g005
Figure 6. Distributions of nonglacial height-difference observations. (a) PRISM DEM (2010)–SRTM-C DEM (2000) and (b) TanDEM-X DEM (2012)–SRTM-C DEM (2000).
Remotesensing 12 00966 g006
Table 1. Datasets used in this study.
DatasetsDateResolutionProduct IDUsage
TanDEM-X08 March 20111.8 m × 2.1 mdims_op_pl_dfd_XXXXB00000000279029621469New DEM generation
08 March 2011dims_op_pl_dfd_XXXXB00000000279029621469
05 March 2012dims_op_pl_dfd_XXXXB00000000292947470931
05 March 2012dims_op_pl_dfd_XXXXB00000000292947470882
ALOS/PRISM20 November 20092.5 m × 2.1 mALPSMB203652930(Backward)
ALPSMF203652820(Forward)
ALPSMN203652875(Nadir)
20 February 2010ALPSMB217072930(Backward)
ALPSMF217072820(Forward)
ALPSMN217072875(Nadir)
Sentinel-1A05 June 20154 m × 14 mS1A_IWSV_0114_0119_006238_041Flow velocity measurement
29 June 2015S1A_IWSV_0115_0120_006588_041
23 July 2015S1A_IWSV_0114_0119_006938_041
16 August 2015S1A_IWSV_0115_0120_007288_041
09 September 2015S1A_IWSV_0115_0120_007638_041
03 October 2015S1A_IWSV_0115_0120_007988_041
27 October 2015S1A_IWDV_0114_0119_008338_041
06 May 2016S1A_IWSV_0114_0119_011138_041
30 May 2016S1A_IWSV_0115_0120_011488_041
17 July 2016S1A_IWSV_0114_0119_012188_041
10 August 2016S1A_IWSV_0114_0119_012538_041
03 September 2016S1A_IWSV_0116_0121_012888_041
27 September 2016S1A_IWSV_0116_0121_013238_041
21 October 2016S1A_IWSV_0114_0119_013588_041
14 November 2016S1A_IWSV_0114_0119_013938_041
18 June 2017S1A_IWDV_0115_0120_017088_041
24 July 2017S1A_IWDV_0115_0120_017613_041
17 August 2017S1A_IWDV_0115_0120_017963_041
22 September 2017S1A_IWDV_0115_0120_018488_041
Landsat/TM22 September 200330 m × 30 mLT51390352003265BJC00Glacier surface change interpretation
15 June 2008LT51390352008167BJC01
03 September 2008LT51390352008247BJC00
10 February 2009LT51390352009041BJC00
01 May 2009LT51390352009121BJC01
04 May 2010LT51390352010124KHC00
08 August 2010LT51390352010220IKR01
12 November 2010LT51390352010316IKR01
31 January 2011LT51390352011031KHC00
26 July 2011LT51390352011207IKR01
12 September 2011LT51390352011255IKR01
Landsat/ETM+17 June 200015 m × 15 mLE71390352000169SGS00
30 September 2009LE71390352009273SGS00
Landsat/OLI31 July 201315 m × 15 mLC81390352013212LGN00
01 September 2013LC81390352013244LGN01
02 July 2014LC81390352014183LGN00
09 October 2015LC81390352015282LGN01
09 September 2016LC81390352016253LGN01
11 August 2017LC81390352017223LGN00