Abstract
Seismic and geodetic moment-rate comparisons can reveal regions with unexpected potential seismic hazards. We performed such a comparison for the Southeastern Iberia—Maghreb region. Located at the western Mediterranean border along the Eurasia–Nubia plate convergence, the region has been subject to a number of large earthquakes (M ≥ 6.5) in the last millennium. To this end, on the basis of available geological, tectonic, and seismological data, we divided the study area into twenty-five seismogenic source zones. Many of these seismogenic source zones, comprising the Western Betics, the Western Rif mountains, and the High, Middle, and Saharan Atlas, are characterized by seismic/geodetic ratio values lower than 23%, evidencing their prevailing aseismic behavior. Intermediate seismic/geodetic ratio values (between 35% and 60%) have been observed for some zones belonging to the Eastern Betics, the central Rif, and the Middle Atlas, indicating how crustal seismicity accounts only for a moderate fraction of the total deformation-rate budget. High seismic/geodetic ratio values (> 95%) have been observed along the Tell Atlas, highlighting a fully seismic deformation.
1. Introduction
Seismic and geodetic moment-rate comparisons provide relevant insights into the seismic hazard of regions subjected to significant crustal deformation. Valuable examples come from numerous tectonic regions worldwide, such as Iran [1,2], western Canada [3], western USA [4,5], Greece [6,7], southern Italy [8,9,10], Himalayas [11,12,13], and the East African Rift [14]. Geodetic moment-rate represents a measure of crustal deformation and might include both anelastic and elastic components, whereas seismic moment-rates measure the deformation accommodated by faulting. Although seismic and geodetic moment-rate estimations are affected by several physical uncertainties, their comparison has enabled identifying regions where the total deformation-rate budget is entirely released by crustal seismicity [3,4,10], as well as regions where the excess deformation-rate can be released either in aseismic slip across faults or through large future earthquakes [1,2,5,13,14]. Regarding this last point, a common practice is to estimate the number of large earthquakes (usually called “missing earthquakes”) needed so that the moment released by seismicity balances the deficit of moment derived from geodetic measurements [3,4,13].
The most common factors affecting moment-rate estimations are related to the completeness and temporal length of available seismic catalogs, which may be little adequate when it comes to capturing the seismic cycle of a given region; therefore, providing a lower estimation of the seismic moment-rate. Moreover, factors related to the reliability of the geodetic data, for instance, an insufficient time span to sample both the seismic and the aseismic spectrum, velocity uncertainties, stations density, and network geometry, long-term deformation transient, etc., may strongly affect the estimations. Furthermore, this comparison could be challenging in regions such as the Southeastern Iberia–Maghreb (western Mediterranean border; Figure 1), characterized by low-rate tectonic deformation and long seismic cycles with unusually high-magnitude (M > 7) earthquakes and seismicity patterns that are highly clustered in time.
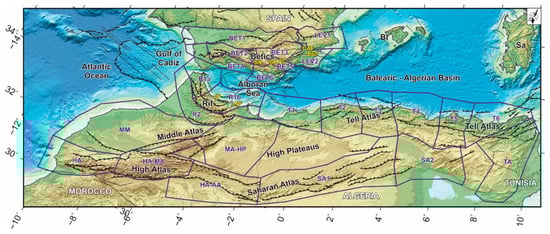
Figure 1.
Simplified tectonic map of Northwestern Africa and Southeastern Iberia. Mapped faults are re-drawn from [23] and references therein. Seismic source zones (Betics seismic source zones—BET1, BET2, BET3, BET4, BET5, BET6; Atlas seismogenic sources—HA, HA-AA, HA-MA, SA1, SA2, TA represent High, Middle, Saharan, and Tunisian Atlas, as well as the northeastern part of the Anti-Atlas; Levante seismogenic regions—LEV1, LEV2; Moroccan Meseta-High Plateaus seismic source zones—MA-HP, MM; Rif seismogenic sources—R1a, R1b, R2; Tell seismogenic source zones—T1, T2, T3, T4, T5, T6) analyzed in this study are also reported as blue solid polygons [24,25]. The map is plotted in an oblique Mercator projection.
Here, based on a combination of original Global Navigation Satellite System (GNSS) observations integrated with solutions coming from literature, scalar geodetic moment-rates have been compared with those derived from earthquake catalogs in order to provide a statistical estimation of the deformation-rate budget for the Southeastern Iberia–Maghreb region. In order to mitigate possible misreadings arising from the above mentioned physical uncertainties, we adopted different approaches in computing seismic moment-rates. In particular, the seismic moment-rates have been computed by adopting the moment summation [15] and the truncated cumulative Gutenberg–Richter distribution [16] approaches. Uncertainties in moment-rate estimations have been computed by adopting a logic tree approach [17].
2. Background Setting
The tectonic setting of the Southeastern Iberia–Maghreb region results from the Cenozoic orogenic evolution within the complex framework of the Eurasia–Nubia plate convergence (e.g., [18,19]). The present-day plate tectonic setting was reached in the earliest Miocene, with the welding of the Iberian Peninsula to the Eurasia plate. At that time, the main plate boundary between Africa and Eurasia in the Western Mediterranean region developed along the transpressive fault zone connecting the Açores triple junction to the Rif and Tell Atlas through the Gibraltar Orogenic Arc (e.g., [20,21]). In Southern Iberia, the Betics show a mainly North-North-West (NNW) direction of tectonic transport, turning around the Gibraltar Strait to a prevailing South-West (SW)-directed thrusting along the Rif while an overall South-South-East (SSE)-directed tectonic transport dominated the Tell Atlas fold-thrust belt. The inner side of the Gibraltar Orogenic Arc is occupied by the Alboran basin (Figure 1), a back-arc basin formed mainly during the early Miocene (e.g., [22]).
A number of on- and off-shore active fault systems dissect the study area and are responsible for a large amount of the current seismic release of the region. Among them, the Trans Alboran shear zone (a major NE-SW trending left-lateral strike-slip system) cuts the Alboran basin, and branches into the Eastern Betics shear zone and into the Nekor/Al-Hoceima seismic zone, northward and southward, respectively (e.g., [26,27,28]). In addition, the Trans Alboran shear zone is westward connected to southern Spanish off-shore by the right-lateral Yusuf fault [29]. In western Algeria, active faulting occurs within the Tell Atlas, along NE-SW-trending, right-stepping en-echelon reverse faults [30]. In eastern Algeria, active reverse faulting occurs in a broader area [31,32,33] and is coupled with right-lateral strike slip faulting on EW-trending faults [34]. Active faulting is recognized along the Aurès Mountains and the southern Atlas region [35].
Southern Iberia and Maghreb regions have been subject by the occurrence of large earthquakes (with estimated magnitude M ≥ 6.5) in the last centuries [36,37,38]. Global Navigation Satellite System (GNSS)-based measurements show that active deformation involves both Southern Iberia and Maghreb regions with rates up to 6 mm/yr (e.g., [23,39]). Such a GNSS-based active deformation has been interpreted in terms of elastic block modeling (e.g., [39,40]. However, the detection of a significant aseismic deformation component on the Betic–Rif system (∼75%; see [41] for details) highlights that the comparison of seismic and geodetic deformation-rates would not be balanced across the region. Results achieved in this study support the inference on the aseismic deformation behavior for most of the Betics and Rif regions, revealing a fully seismic deformation along most of the Tell Atlas.
3. Seismological Background and Seismic Moment-Rates
3.1. Historical Earthquakes
Available historical seismic catalogs for southern Iberia and Maghreb regions highlight the occurrence of large (M ≥ 6.5) earthquakes in Tunisia since AD 856 [36,37,38,42], including not well-documented damaging earthquakes since several centuries before Christ (BC). However, in spite of efforts made in recent updates [25] focused on seismic hazard studies, the accuracy of these catalogs is not uniform due both to the off-shore occurrence of numerous earthquakes and to the sparsely populated area. A number of studies focusing on this region have evidenced that many small and moderate earthquakes have most likely been overlooked, and that available seismic catalogs can be considered complete for M ≥ 6 earthquakes since approximately 1500, 1700, and 1850, for southern Iberia, northern Morocco and northern Algeria areas, respectively (e.g., [25,37,38] and references therein). Historical earthquakes are largely concentrated along the Azores–Gibraltar fault zone, along the Betic–Rif system, and along the Tell Atlas fold-thrust belt (Figure 2a). In detail, the strongest historical earthquakes (M ≥ 7.0) are mainly concentrated on the Azores–Gibraltar fault system (AD 1309, 1356, 1761, and 1755 events) and along the Tell Atlas fold-thrust belt (AD 856, 1365, 1716, 1722, 1790, 1832, 1867, and 1891 events).
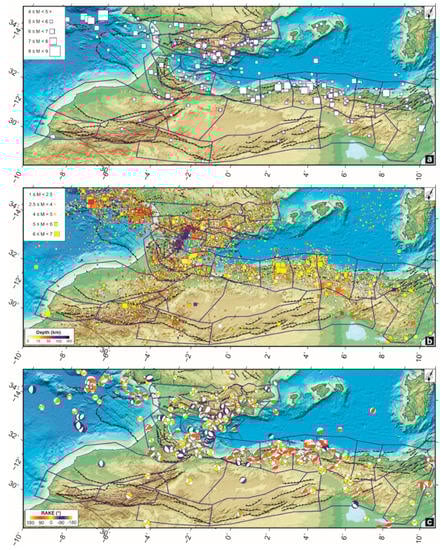
Figure 2.
(a) Historical earthquakes (blue squares; M ≥ 4.0) occurring during AD 856–1950 [36,37,38]. (b) Instrumental crustal seismicity (M ≥ 2.5) occurring in the investigated area since 1910 [46]. Symbols are colored according to focal depth. (c) Lower hemisphere, equal area projection for fault plane solutions (with M ≥ 3) compiled from the investigated area [23,47,48,49]; fault plane solutions are colored according to rake: red indicates pure thrust faulting, blue is pure normal faulting, and yellow is strike-slip faulting.
3.2. Instrumental Seismicity
The distribution of instrumental seismicity (earthquakes with M ≥ 2.5) as well as the main seismotectonic features (focal plane solutions for crustal events with M ≥ 3.0) of the study area are reported in Figure 2b,c, respectively. The bulk of instrumental seismicity, corresponding to low and moderate magnitude earthquakes, is spread across the Nubia–Eurasia plate boundary. It shows clear epicenter alignments between Azores and Gibraltar, and from Algeria to Tunisia, providing evidence of active faulting along the plate boundary belt. Along the Azores-Gibraltar fault zone and the Gulf of Cádiz, earthquakes have depths up to 40 km, being characterized by fault plane solutions with both reverse and strike-slip features (Figure 2b,c). Along North Algeria and Tunisia regions, earthquakes usually have hypocentral depths shallower than 30 km and are characterized by fault plane solutions with prevailing reverse features, coupled with subordinate strike-slip faulting features (Figure 2b,c). Crustal seismicity spreads over a ~300 km wide band between Northern Morocco and Southern Spain, where a number of epicenter alignments suggests the presence of individual active seismogenic faults; therefore, depicting a complex network of NE-SW and WNW-ESE faults (with lengths from tens to some hundreds of kilometers) that accommodate the Nubia–Eurasia convergence (Figure 2b). Seismicity at intermediate depths concentrates in the 50–100 km depth interval, in a 150-km-long band that extends from Southern Spain to the Alboran Sea and abruptly disappears toward east. In addition, the occurrence of deep earthquakes down to more than 600 km depth below the Granada Basin has been documented since 1954 (see [43,44] and references therein for additional details). These deep earthquakes are likely related to a sunk lithospheric slab whose relation with the current surface deformation is still debated (e.g., [45]).
3.3. Seismogenic Source Zones
The study area has been divided into twenty-five crustal seismogenic source zones (Figure 1) by taking into account the seismic zonation available in recent literature [24,25,50], which have been defined on the basis of the latest tectonic, geological, and seismological considerations. Some of these zones are well-defined on the basis of constraints coming from the analysis of the earthquake catalog (stationarity of the completeness periods, evaluation of the mean activity rate) and from a set of geological and seismotectonic considerations, such as style, geometry, and distribution of fault systems (with direct evidence of Holocene activity) and their relation to the local stress and deformation regimes. Other zones, although defined on similar seismotectonic or geological information, are lacking a clear correspondence between the contemporary seismic activity and the Holocene tectonic activity.
The seismic sources adopted for the Moroccan–Algeria–Tunisian region come from [24] and slightly updated in [50]. For this region, the general criterion adopted in [24,50] was to delimit areas with similar tectonic features and a more or less homogeneous stress pattern and seismicity parameters. Individual faults were not specifically considered because of the very scarce availability of kinematic, seismic and paleoseismic observations in this region. They were only considered ensuring that known faults or fault segments were not divided and partially included in different adjacent sources.
The seismic sources adopted for southeastern Spain belong to the last official upgrade of the Spanish seismic hazard maps [25], known as the ‘ByA12’ zonation (Zonificación de Bernal y asociados). This zonation is prevailing based on the available seismotectonic and geological information and was aimed at seismic hazard computations [25]. Such a zonation is characterized by some small zones sampled by zero or just one GNSS site; therefore, we joined some of them into large zones following more generalized seismic and tectonic criteria (Figure 1). We performed such an additional step because the computed strain-rates cannot be taken as an accurate estimate for small zones, due to the lack of spatial constraints from geodetic data (i.e., the strain-rates information would be derived from the velocity interpolation only).
A short description of the twenty-five seismogenic source zones is given below (see also Table A1 in Appendix A for additional details).
- Tell seismogenic source zones (T1, T2, T3, T4, T5, and T6). Tell region is the one with the largest density of earthquakes, including some of the most destructive events in the area, such as the 10 October, 1980 Chlef (MW 7.3) and the more recent 21 May, 2003 Boumerdes (MW 6.9) earthquakes. The differentiation among these six zones is mainly related to the different seismic features, clearly revealed when computing seismicity parameters. These zones are based on the previous works by [51,52,53]. T1 to T4 sources display a dominant compression striking NNW-SSE, whereas the T5 source exhibits a N-S-striking compressional strike-slip regime (e.g., [24,49,54]. Few focal mechanisms are available for the T6 source and therefore the mean stress regime is poorly constrained (Figure 2c).
- Rif seismogenic sources (R1a, R1b, and R2). The Rif region has been divided into three source zones on the basis of well-known active faults (e.g., the Jebah and Nekor faults) and seismic activity distribution in the Rif and in the southwestern part of the Alboran Sea. Large earthquakes, such as the recent 25 January, 2016 (Mw 6.3) Al Hoceima event or the historical 1624 May, 11 (MS 6.7) Fez event, occurred along some of these active faults. R1b and R2 sources show a horizontal compression, striking NW-SE to NNW-SSE, as well as a perpendicular horizontal extension [50]. There are few mechanisms for R1a source, but they show a pure WSW-ENE horizontal extension [54].
- Atlas seismogenic sources (HA, HA-MA, HA-AA, SA1, SA2, and TA). Overall, they include the High, Middle, Saharan, and Tunisian Atlas, as well as the northeastern part of the Anti-Atlas. These zones have been struck by moderate to large magnitude earthquakes, such as the 856 3, December (MS 7.0) Tunisia event, the 1731 (MW 6.4) and the 29 February, 1960 (MW 5.7) Agadir events. Some of these zones are also based on the previous works by [51,52,53]. HA-MA, SA1, SA2, and TA sources exhibit a near pure compressional stress regime, with a wide range of attitudes (NNW-SSE, NW-SE, N-S, and NW-SE, respectively; [24,55,56]. The stress field for the other seismogenic source zones is poorly constrained because of the limited number of available focal mechanisms (Figure 2c).
- Moroccan Meseta-High Plateaus seismic source zones (MM and MA-HP). They include a region with scarce seismicity and characterized by the occurrence of only low and low to moderate earthquakes, such as the 1979 January, 17 (MS 4.6) Khenifra and the 29 November, 1980 (MS 4.9) Jerada events. The MA-HP source is based on a previous one already described in [52,53]. The MM source is characterized by the presence of NNE-SSW and NE-SW oriented faults, as well as faults parallel to the Atlantic coast [57]. The stress field for both seismogenic source zones is poorly constrained because of the limited number of available focal mechanisms (Figure 2c).
- Betic seismic source zones (BET1, BET2, BET3, BET4, BET5, and BET6). These seismogenic sources correspond to the seismogenic region called Betic Cordilleras, also embracing the Subbetic, western part of the Prebetic units, and the Guadalquivir Basin, in its northern part. With the exception of the 29 March, 1954 (Mw 7.8) deep seismic event (depth of ~625 km), both instrumental and historical earthquakes did not exceed M 6.3 [24]. As mentioned above, initial sources delimited in [25] have been grouped into larger seismogenic sources. BET1 source zone embraces a complex network of faults striking WSW-ENE on the Guadalquivir Basin and NE-SW to NNE-SSW on the Sierra de Segura area, which hosted some historical destructive earthquakes, for instance the 1357 (Mw 6.1) Andalucia and the 1504 (Mw 6.1) Carmona events. BET2 source zone is characterized by faults striking N140/160E and N70E to E-W, as well as faults striking NW-SE which hosted destructive earthquakes, such as the 1431 (Mw 6.11) Granada event and the 1884 (Mw 6.30) Arenas del Rey event. BET3 source zone is characterized by low to moderate instrumental seismicity with a Mw 6.17 destructive event occurring in 1531 close to the town of Baza. BET4 source zone is characterized by low to moderate instrumental seismicity with a Mw 6.10 destructive event occurring in 1910 close to the small coastal town of Adra. BET5 source zone includes, from west to east, the Sierra Nevada, the Sierra de los Filabres, and the Almanzora Corridor areas. This zone is characterized by NW-SE to NNW-SSE oriented faults which are considered the seismogenic sources for seismicity striking the region. BET6 source zone includes the Adra-Sierra Alhamilla and Almería areas, incorporating to some extent the off-shore platform. In this source, existing fault systems mostly strike NW-SE and NNE-SSW, hosting historical destructive earthquakes, such as the 1522 (Mw 6.07) Almería event. Regarding the stress regime, BET2 and BET4 source zones are characterized by a primary NNW-SSE sub-horizontal compression, while BET1, BET3, BET5, and BET6 zones are characterized by a complex pattern resulting from the interaction of different sources of stress (see [54,55] for additional details).
- LEV1 and LEV2 seismogenic source zones. This area, named as Levante seismogenic region [25], covers the easternmost part of the Prebetic and Internal Betics and is dominated by a prevailing strike slip stress field with a near E-W extension and a N-S compression [54]. Both seismogenic source zones are characterized by the occurrence of several low to moderate magnitude earthquakes and some damaging historical events, rarely exceeding M > 6 such as the 1396 (MW 6.00) Tavernes de Valldigna and the 1645 (MS 6.25) Muro de Alcoy for LEV1 and the 1829 (MW 6.25) Torrevieja event for LEV2 [36]. Among the main tectonic features included in this source, the Cádiz-Alicante and the Caudete-Elda-Elche fault systems are worth noting. Regarding the LEV2 seismogenic source zone, different fault systems host the seismicity, such as the striking N140-160E San Miguel de Salinas and Torrevieja faults and the NW-SE Bajo Segura fault.
3.4. Seismic Moment-Rates
For each seismogenic source zone, the seismic moment-rate was calculated by adopting a truncated cumulative Gutenberg–Richter distribution [16]:
where Mmax is the magnitude of the largest earthquake that could occur within the investigated region; φ is a correction for the stochastic magnitude–moment relation; taking into account an average error of 0.2 on magnitudes, we assumed φ = 1.27 [16]. c and d are the coefficients of the magnitude (M)–scalar moment (Mseis) relation:
According to [58] we set c = 1.5 and d = 9.05. a and b are coefficients (seismicity rate and slope, respectively) of the Gutenberg–Richter recurrence relation:
being NM the cumulative number of earthquakes with magnitude M and larger.
Adopted parameters are detailed in Table 1; as a first step, we used the values already reported in literature [24,25]. As described in [24,25], a and b parameters have been directly computed from available catalogs by adopting the maximum likelihood method [59]. The Mmax values and associated uncertainties have been estimated by adopting different approaches. Regarding the Spanish seismogenic source zones, Mmax values have been estimated by adopting empirical laws [60] linking magnitude values to the dimensions of mapped active faults. For the zones characterized by a lack tectonic data, Mmax values have been estimated directly from the seismic catalog by adopting a cumulative exponential-truncated Gutenberg–Richter recurrence relation. Regarding the seismic source zones located along the African margin, Mmax values have been estimated from the seismic catalog by adopting the Kijko–Sellevoll approach [61], a method usually applied on regions where only a limited number of large earthquakes is available. Because the seismogenic source zones MA-HP and SA1 are characterized by b-values affected by large uncertainties (0.41 and 0.26, respectively), we performed new estimations by using as input event records reported in the International Seismological Centre (ISC) bulletin (see Figure A2 in Appendix B for details). Finally, estimated seismic moment-rates with an associated 67% confidence interval are reported in Table 1.

Table 1.
Earthquake catalog statistic and estimated seismic moment-rates () with associated errors for each seismic source zone (SSZ). Moment-rates have been estimated by using both a (#) truncated cumulative Gutenberg–Richter distribution [16] and the (*) the moment summation [6] approach. Seismicity rate (a) and slope (b) of the Gutenberg–Richter recurrence relation with its associated error are reported, as well as the values of the maximum magnitude observed (Mobs) and estimated (Mmax). Abbreviations are as follows: P, [37]; H, [38], S, [36]. Because of the large uncertainties of MA-HP and SA1, we also reported the recomputed a and b values (see the main text for details); in curved brackets the original values.
The scalar seismic moment-rate can be estimated also by adopting the moment summation approach [15]:
where N is the number of events occurring during a given time interval ΔT in the volume A·Hs (with A, the surface area and Hs, the seismogenic thickness), Mseis is the scalar seismic moment of the n-th earthquake from the N total earthquakes. In the following, we focused mainly on the results obtained from Equation (1); however, in order to test sensitivity, we considered results achieved by adopting Equation (4) (see Table 1).
4. GNNS Data and Geodetic Moment-Rates
4.1. GNSS Data Processing
Here we analyse an extensive GNSS dataset which, covering 20 years of observations (from 1999.00 up to 2019.00), includes more than 300 continuous GNSS sites available at EUREF Permanent GNSS Network [62], at Crustal Dynamics Data Information System [63], at UNAVCO [64] and from local and regional networks [23]. Time series of this GNSS dataset cover different time spans, ranging from 3.5 to 20 years with an average duration of 8.7 years. We also included 25 episodic GNSS sites located in Morocco with measurements carried out during the 1999.80–2006.71-time interval [40]. The GNNS phase observations were processed by using the GAMIT/GLOBK 10.7 software [65] following the strategy described in [66]. As a final processing step, a consistent set of positions and velocities in the International Terrestrial Reference Frame ITRF2014 reference frame [67] has been computed.
In order to improve the spatial density of the geodetic velocity field over the studied area, we integrated our solutions with those reported in [39,68,69,70]. In particular, we aligned published solutions to our ITRF2014 one by solving for Helmert transformation parameters that minimize the root mean square (RMS) of differences between velocities at common sites. The resulting velocity field, aligned to the ITRF2014, is reported in Table S1. Such a velocity field is characterized by an average site spatial density of 3.5 × 10⁻⁴ site km2 (i.e., ca. 11 sites within a radius of 100 km), with differences between the regions (Figure 3). The Betics have a high density of sites (8.3 × 10⁻⁴ site km2), the Rif region has a density of sites of 3.0 × 10⁻⁴ site km2, while the Tell and the Saharan regions have a density of sites of 0.9 × 10⁻⁵ site km2. In order to highlight regional and crustal deformation patterns over the investigated area, we align our ITRF2014 velocities to both a Eurasian and Nubian reference frames (see Table S1). The estimated velocity fields are reported in Figure 3.
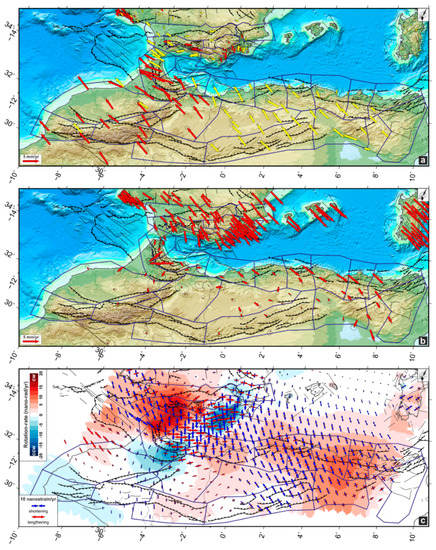
Figure 3.
Global Navigation Satellite System (GNSS) velocities and 95% confidence ellipses in a fixed (a) Eurasian and (b) Nubia reference frame (see Table S1 in the Supplementary Material section). Continuous and episodic GNSS stations are reported as yellow and red arrows, respectively. (c) Geodetic strain-rate field: red and blue arrows represent the greatest extensional (εHmax) and contractional (εhmin) horizontal strain-rates, respectively; the colors in the background show the rotation strain-rate (which describes the rotations with respect to a downward positive vertical axis with clockwise (cw) positive and counterclockwise (ccw) negative, as in normal geological conventions). The map is plotted in an oblique Mercator projection.
Looking at the velocity field referred to a Eurasian reference frame (Figure 3a), the primary pattern is given by a crustal shortening of ~5 mm/yr related to the Nubia–Eurasia oblique convergence. Such a crustal shortening is largely adsorbed on the Alboran and the Balearic–Algerian basins along off-shore structures. Eastern Betics are characterized by geodetic velocities showing a NW-to-NE fan-shaped pattern with rates ranging from ~3 mm/yr near the coast to ~0.8 mm/yr inland (Figure 3). To the east, the Baleares promontory is characterized by a motion of ~0.5 mm/yr toward East. Stations located on the southern sector of the Betics move toward SW while stations located in the eastern Rif move toward NW; therefore, highlighting a NNW-SSE to N-S contraction of the Alboran Basin. Stations located on the central sector of the Gibraltar Arc are characterized by a westward motion, leading to an E-W stretching of the western side of the Alboran Basin. Moreover, the Gibraltar Arc is affected by an E-W contraction of ~0.3 mm/yr, as deduced by differentiating the motion between the stations located externally and internally to the arc (Figure 3a). On northern Algeria along the coastal area, geodetic velocities decrease progressively from west (~3.0 mm/yr) to east (~0.5 mm/yr). Southward, the region encompassing the Middle, High, and Saharan Atlas as well as the western High Plateaus, is characterized by velocities similar to those predicted by the rigid Eurasia–Nubia plate motion [23,55], suggesting that the region belongs to stable Nubia. This last feature is also readily visible in the Nubian reference frame (Figure 3b), which shows small geodetic velocities (~0.3 mm/yr) in the Middle, High, Saharan Atlas and in the western High Plateaus, and velocities with values up to 5 mm/yr along the coastal area of the Tell Atlas and the Aurès Mountains.
4.2. Strain-Rate Field Estimation
The horizontal strain-rates have been estimated on a regular 0.5° × 0.5° grid over the investigated area by adopting the method reported in [71]. This method allows introducing different spatial weighting functions of data (e.g., uniform Gaussian or quadratic spatial weighting function), enabling to obtain a finer resolution, especially on regions characterized by sparsely distributed data. Based on some preliminary tests (see the Appendix C for additional details), the horizontal strain-rate field has been estimated by adopting a weighting threshold of 24 and by using a Gaussian function for distance weighting and Voronoi cell for areal weighting, respectively.
The estimated horizontal strain-rates and the rotation-rates are reported in Figure 3b. A large region comprising the eastern part of the Saharan Atlas, the Aurès Mountains and the Balearic–Algerian basin, is characterized by a prevailing shortening of ~10 nanostrain/yr along the NW-SE orientation. On the Algerian–Tunisian side, this shortening is coupled with clockwise rotation-rates up to 15 nanoradian/yr, suggesting the occurrence of transpressive right-lateral faulting between the Aurès Mountains and the contiguous eastern Saharan Atlas/High Plateau block. The High Atlas and the western part of the Saharan Atlas are characterized by an elongation of ~5 nanostrain/yr along a prevailing E-W direction. Westward, the regions comprising the High Atlas and the Middle Atlas are characterized by a shortening of ~5 nanostrain/yr along the N-S orientation, passing to a NW-SE orientation along the westernmost sector of the Rif. All these regions are characterized by small rotation-rates (~2 nanoradian/yr), highlighting their low tectonic activity. The region comprising the eastern Rif, the Alboran Basin and the Betics are characterized by a shortening of ~12 nanostrain/yr along the NW-SE orientation coupled with an elongation up to ~16 nanostrain/yr along the NE-SW orientation. This region is characterized by a complex rotation-rate pattern: clockwise rotation-rates up to 20 nanoradian/yr can be observed along the north-western Rif and the western Betics, while counterclockwise rotation-rates of ~15 nanoradian/yr and ~10 nanoradian/yr can be observed along the eastern Betics and the eastern Rif, respectively.
4.3. Geodetic Moment-Rates Computation
The geodetic moment-rate (and its associated uncertainty) was estimated for each seismic source zone with volume A·Hs as [72]:
where μ is the shear modulus of the crust, εHmax and εhmin are the principal horizontal strain-rates, and Max is a function returning the highest value of the arguments. Since the geodetic moment-rate is proportional to the chosen seismogenic thickness Hs, in order to choose appropriate values, we analyzed the depth distributions of earthquakes with magnitude M ≥ 1 for each seismic source zone (see Appendix B for details). After some preliminary estimations, the seismic source zones have been merged into 3 main regions, defining approximate seismogenic thicknesses of 15, 18, and 30 km for Betics (BET1, BET2, BET3, BET4, BET5, BET6, LEV1, and LEV2), Rif—western Atlas (R1a, R1b, R2, T1, MM, HA, HA-MA, MA-HP, HA-AA, SA1, and TA) and Tell Atlas (SA2, T2, T3, T4, T5, and T6), respectively. Hs values estimated for the Betics agree well with the ones reported (~15 km) in literature and estimated by using well-located earthquakes (see [73] and references therein). Our estimated Hs value (18 km) for the Tell Atlas region falls within the range of 15–20 km proposed in recent literature (e.g., [31,74,75]). Therefore, in the following computations we adopted the values of 15 and 18 km as estimated from the depth distributions of earthquakes for the Betics and Tell regions, respectively (see Table 2). Regarding the Rif—western Atlas regions, [41] assumed a fixed Hs value of 15 km for a wide area including the Rif region, while [76] observed that ~85% of seismicity located in Central High Atlas has focal depths lesser than 20 km. Based on these considerations, and since the completeness of the catalog will vary considerably throughout the period of time studied and throughout the study region, we cautiously have chosen an Hs value of 20 km for the Rif—western Atlas region.
Table 2.
Geodetic moment-rate () with associated error and adopted parameter values for each seismic source zone (SSZ). A, area of the SSZ; μ, shear modulus for crustal rocks; Hs, seismogenic thickness with a 10% variation for the lower and upper ranges (see Appendix B for additional details). Regarding the shear modulus μ, a value of 30 × 1010 N/m2 has been used, typical of average crustal rocks [77], and allowed for a 5% variation for the lower and upper ranges.
Table 2 lists the estimated geodetic moment-rates for all the identified source zones along with the associated uncertainties given from the ones related to the strain-rates, the seismogenic thicknesses and the shear modulus (for these last two parameters we assumed an uncertainty of 10% and 5% with respect to the chosen value, respectively).
5. Results and Discussions
Here we provide a detailed statistical evaluation of the seismic/geodetic moment-rates ratio for the Ibero–Maghrebian region by comparing GNSS-based moment-rates with those derived from seismic catalogs.
5.1. Moment-Rates
The estimated seismic moment-rates are reported in Table 1 and Figure 4. As above mentioned, the estimations have been performed by adopting two different approaches: the truncated Gutenberg–Richter distribution ([16]; Figure 4a) and the moment summation ([15]; Figure 4b).
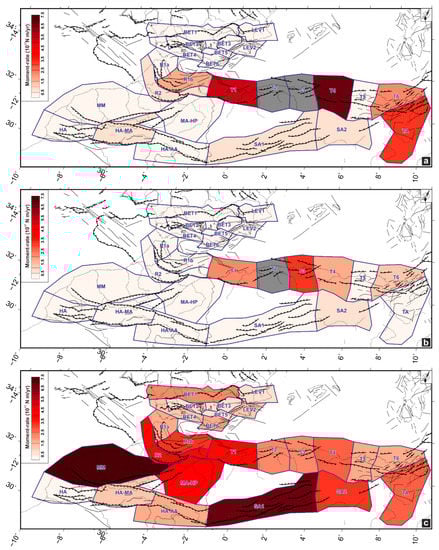
Figure 4.
Estimated moment-rates from seismicity, by considering the truncated Gutenberg–Richter distribution (a) and by considering the cumulative Kostrov summation method (b) and from (c) geodetic data (see Table 1 and Table 2 for details). SSZ characterized by moment-rates larger than 7.5 × 10¹⁷ Nm/yr are reported in grey. The maps are plotted in an oblique Mercator projection.
Estimations coming from the former approach, with the exception of very few zones (e.g., HA, SA2, and R1a; see Figure A4 in Appendix D), are generally larger (~40% on average) than the ones estimated from the latter approach; however, both estimations overlap within their associated uncertainties. The truncated Gutenberg–Richter distribution estimates the magnitude distribution of the earthquakes through the computation of the b value (Equation (3)), assuming that earthquake distribution is ergodic over the investigated region and represents an adequate sample of long-term seismicity, therefore allowing to take into account the probable incompleteness of the existing catalog (e.g., [78]). The moment summation method is strongly influenced by the catalog completeness and suffers from the possible lack of large earthquakes with high recurrence rate compared to the catalog duration. Based on these observations, in the following we refer to the results coming from the truncated Gutenberg–Richter distribution approach.
Computed values range in the interval 4.85 × 10¹⁵ − 3.0 × 10¹⁸ Nm/yr. The higher values (≥1.0 × 10¹⁷ Nm/yr) are observed along the eastern sector of the Rif (R1b) and along the Tell Atlas region (e.g., T1, T2, T3, T4, T6, and TA), clearly highlighting the high seismic release of this belt. Although T5 belongs to the Tell Atlas region, it shows an estimated moment-rate of ~3.2 × 10¹⁶ Nm/yr, a very low value when compared with surrounding zones. Betics seismogenic source zones (BET1, BET2, BET3, BET4, BET5, and BET6) are characterized by values in the 7.3 × 10¹⁵ − 3.5 × 10¹⁶ Nm/yr range, exhibiting a low to moderate seismic release. The Levante seismogenic region (LEV1 and LEV2) shows a moderate seismic release with an estimated moment-rate of ~4.0 × 10¹⁶ Nm/yr. A similar pattern can be observed on the Rif regions (R1a, R2), along the Moroccan Meseta - High Plateaus (MM and MA-HP) and along the Atlas seismogenic sources (HA, HA-AA, HA-MA, SA1, and SA2), with estimated seismic moment-rates ranging in the 4.9 × 10¹⁵ − 7.0 × 10¹⁶ Nm/yr interval.
The estimated geodetic moment-rates and associated uncertainties are reported in Table 2; computed values range in the interval 4.46 × 10¹⁶ − 7.32 × 10¹⁷ Nm/yr. Based on appraised values, at least four main interval ranges can be distinguished. In particular, moment-rate values larger than 7.0 × 10¹⁷ Nm/yr have been estimated for MM and SA1 zones. Moment-rate values spanning the 3.0 × 10¹⁷ − 4.2 × 10¹⁷ Nm/yr interval are observed for the eastern sector of the Rif (R1b and R2), for the westernmost zone of Tell Atlas (T1) and for the High Plateaus region (MA-HP) and for SA2 zone. Moment-rate values spanning the 2.0 × 10¹⁷ − 2.9 × 10¹⁷ Nm/yr interval are observed for the central sector of the Tell Atlas region (T2, T3 and T4), the western sector of Betics (BET1) and for SA2. Moment-rate values spanning the 1.1 × 10¹⁷ − 1.9 × 10¹⁷ Nm/yr interval are observed on the eastern sectors of the Tell Atlas (T5 and T6), on LEV2 zone, on the High Atlas region (HA-MA and HA-AA), on the western Rif (R1a) and on the southern Betics (BET4 and BET6). Moment-rate values lower than 1.0 × 10¹⁷ Nm/yr are observed on the central and eastern Betics (BET2, BET3 and BET5) and on LEV1 zone. The geodetic moment-rate computed for the TA seismogenic source zone is based on strain-rates information derived from the velocity interpolation only, therefore this estimation cannot be taken as an accurate estimate, due to the lack of spatial constraints from geodetic data (TA is not covered by GNSS stations). In addition, the geodetic moment-rate inferred for zone HA is statistically negligible because of the large uncertainties associated with the estimated value. Therefore, based on these considerations, the TA and HA seismogenic source zones have been excluded from the comparison reported below.
5.2. Seismic/Geodetic Moment-Rates Ratio
In the following, we define the seismic/geodetic moment-rates ratio (expressed as a percentage) as the “Seismic coupling coefficient” (hereinafter SCC; [2]), the geodetic moment-rate being a measure of both elastic and anelastic loading rates and the seismic moment-rate a measure of the elastic unloading rate. The theoretical range of SCC is between 0% and 100%. A SCC value close to 100% indicates that a large amount of the deformation budget is released through earthquakes. Conversely, a low ratio indicates an apparent seismic moment deficit, suggesting either a proportion of aseismic deformation (i.e., ongoing unloading by creep and other plastic process) or accumulating strain not released by seismicity (i.e., elastic storage).
Indeed, SCC can exceed the value of 100%, i.e., the seismic moment-rate is larger than the geodetic ones. This is commonly observed when seismic catalogs cover a very short time interval and contain one or more large earthquakes [2]. The temporal length of a seismic catalog as well as its completeness governs the adequacy of catalogs to estimate seismic moment-rates over a given region (e.g., [78]). Roughly speaking, a seismic catalog with a short duration (100–300 years) could be little adequate to capture the seismic cycle of a given region; indeed, seismic moment-rates estimated from seismic catalogs require that the average earthquake recurrence interval should be shorter than the catalog duration (see [2,4] for additional details). This means that the used seismic catalog would be long enough to capture a complete earthquake cycle for an individual seismogenic fault or alternatively, to provide a statistical sample of all phases of the seismic cycle, including of course earthquakes, for a region containing multiple seismogenic faults. Moreover, 50–100 year-long instrumental catalogs are the most common source of data used to derive earthquake statistics worldwide, under the assumption that such a time span is adequate to derive earthquake return periods over timescales of 500–5000 years, typically used in probabilistic seismic hazard analysis [3]. As mentioned above, available historical seismic catalogs for southern Iberia and Maghreb regions highlight the occurrence of large (M ≥ 6.5) earthquakes since AD 856 and can be considered complete for M ≥ 6 earthquakes since approximately 1500, 1700 and 1850, for the Southern Iberia, northern Morocco and northern Algeria areas, respectively [25,37,38]. Being aware that on the one hand, the earthquake occurrences and statistics may not be steady state over the whole timescales of our catalog and that on the other hand, the truncated Gutenberg–Richter distribution allows taking into account the probable incompleteness of the catalog [78], in the following we carefully discuss and frame our results in comparison with available and independent geological and geophysical observations.
Regarding geodetic moment-rate estimations, the GNSS measurements should sample a large spatial scale, so that they are not affected by local strain accumulation on individual faults, and a long enough time interval, so that measurement uncertainties have a minimal effect on velocity estimations and adequately sample both seismic, aseismic and long-term deformation transients. As noted above, our GNSS dataset shows different spatial density over the investigated area, with high density of sites on the Iberian region and low density along the Maghrebian region. Time series of this GNSS dataset cover different sample periods ranging from 3.5 to 20 years (with an average duration of 8.7 years) and, with the exception of a few sites located in the R1b source zone, generally do not include large earthquakes that could significantly contribute with co-seismic and post-seismic displacements to the estimated geodetic velocities. Therefore, our estimated regional velocity and the related strain rate field are statistically significant in most of the study area.
Estimated SCC values are reported in Table 3 and in Figure 5; based on the achieved SCC values, we considered three principal ranges of values: less than 23%, between 35% and 60%, and more than 95%.
Table 3.
Comparison of the seismic coupling coefficient (expressed as a percentage), which takes into account the moment-rates estimated from the (#) truncated cumulative Gutenberg–Richter distribution [16] and the (*) the moment summation [15] approach. Confidence intervals (67%) are also reported. SCC = seismic coupling coefficient.
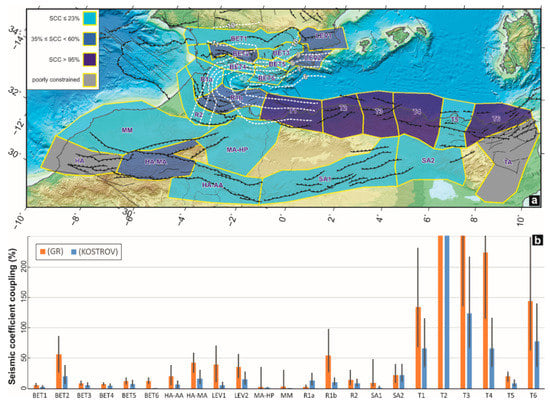
Figure 5.
(a) Seismic coupling coefficient (SCC), expressed as a percentage of the seismic/geodetic moment-rate ratio as computed in this study (see SCC (*) values in Table 3). As discussed in the main text, three principal ranges of SCC values have been identified: low (less than 23%), intermediate (between 35% and 60%) and high (more than 95%). In grey are reported the SSZ excluded from the comparison, i.e., HA and TA (see the text for more details). The white dashed line represents the depth (in km) of the brittle-ductile transition as reported in [85]. (b) Comparison of the seismic coupling coefficient (expressed as a percentage) which takes into account the moment-rates estimated from both the approaches discussed in the text. Confidence intervals (67%) are also reported.
A large sector of the study area, comprising Betics (BET1, BET3, BET4, BET5, BET6), Rif (R1a, R2), High, Middle, and Saharan Atlas (MM, MA-HP, HA-AA, SA1, SA2), and one region in the Tell Atlas (T5), is characterized by SCC values lower than 23%. This result is highly consistent with previous estimations computed for the Betics and Rif areas (see [41] for details) which highlighted how about 24% of crustal deformation is released seismically. A number of indicators such as surface heat flow, seismic tomography and local rheological models provided evidence of a weak crustal rheology; therefore, supporting the inference on the aseismic behavior of some sectors of the region. In detail, surface heat flow measurements available for the area show high values (100–120 mW m−2; [79,80]) along the eastern sector of the Alboran basin and moderate values (60–75 mW m−2) along the Betics [81] and Rif [82] regions. In the central and southern Gulf of Cadiz, the surface heat flow is characterized by values close to 40–50 mW m−2 [74], assuming typical values for stable continental/oceanic lithosphere [83]. Local seismic tomographies have inferred a low-velocity zone at 18-km depth beneath the central Betics, indicating variations in lithology and/or in the rigidity of the lower crust rocks (e.g., [84]). Local rheological models (e.g., [85]) highlighted how the crustal yield strength as well as the inferred depth of the brittle-ductile transition follow the curved shape of the Gibraltar arc with maximum depths of 12–9 km, whereas in the Rif and the Betics, such a transition became shallower eastward (~6–5 km depth; Figure 5). All these geological and geophysical evidences support the inference on the aseismic behavior, at least of the Betics and Rif regions.
Intermediate SCC values (between 35% and 60%) have been observed for HA-MA, R1b, LEV1, LEV2 and BET2 seismogenic source zones; therefore, suggesting how these regions account only for a moderate seismic fraction of the total deformation-rate budget. Some of these regions are characterized by well-known active faults which frequently generate moderate earthquakes such as LEV2 and R1b. On these zones, a significant contribution to the measured crustal deformation can be attributed to aseismic post-seismic mechanisms such as afterslip and/or viscoelastic relaxation, as for instance documented for earthquakes striking the R1b source zone in the last decades [86].
The higher SCC values (>95%) have been observed along the Tell Atlas zones (T1, T2, T3, T4, T6), suggesting how the measured crustal deformation over these zones is mostly released through earthquakes. All these source zones are characterized by SCC values larger than 100%. These values are not surprising, since, along the Tell Atlas zones, the crustal shortening of ~5 mm/yr related to the Nubia–Eurasia oblique convergence is largely adsorbed on off-shore reverse structures bordering the North African margin [23,39], therefore a relevant portion of the long-term elastic strain accumulation is not captured by the on-shore GNSS stations. In addition, a number of moderate to large earthquakes have epicenters concentrated off-shore (not sampled by GNSS stations), such as the 1790 Oran (M~7) [87], the 1856 Djijelli Mw 7.2 [88], and the 2003 Boumerdes Mw 6.8 [89] earthquakes, therefore, their released seismic energy corresponds to strain with no full counterpart on the on-shore surface. Both these features lead to an underestimation of geodetic strain-rate. As above mentioned, the geodetic moment-rate estimations are affected by the assumed computational parameters; even if increasing the seismogenic thickness value up to 25 km and/or computational parameters (grid size and weighting threshold) for strain-rates estimation, the SCC values for Tell Atlas zones remain confined to values larger than 100%. All these considerations, coupled with the occurrence of large destructive events (M > 7) both in historical and instrumental periods adds realistic constraints on the seismic behavior of the region. In such a context the low SCC value inferred for T5 source zone (~20%) appears puzzling. The seismic moment-rate is based on a maximum magnitude Mmax of 5.8, about 1 order of magnitude unit lesser than the values estimated for the other Tell Atlas source zones. It must be noted that an increase of 1 magnitude unit leads to an increase by a factor of ~5.4 of the moment-rate (Equation (1)), therefore leading to a SCC value close to 100%. These considerations, while on one hand suggest that the low SCC value inferred for T5 source zone could be poorly representative of its seismic behavior, on the other suggest that the possibility of forthcoming earthquakes in the region may increase. Since in this region the occurrence of a moderate earthquake (1985 Constantine Mw 5.8 event) is documented in the available seismic catalogs, it appears to be a potential seismic gap like other well studied regions of the world (e.g., [90,91].
Although the seismic and geodetic moment-rates comparison implies numerous assumptions and simplifications, it provides significant insights into the potential seismic hazard of tectonically active regions, essentially for time-dependent seismic hazard assessments. As noted above, valuable examples come from numerous tectonic regions worldwide such as Iran [1,2], western Canada [3], western USA [4,5], Greece [6,7], southern Italy [8,9,10], Himalaya [11,12,13], and the East African Rift [14]. Despite the different approaches adopted by these authors, all their estimations have enabled achieving valuable results that document cases with a good agreement between seismic and geodetic moment-rates and also cases where geodetic moment-rates are significantly larger than the seismic ones. However, uncertainties related to the physical significance of the deformation-rates mismatch over varying spatial and temporal scales are currently poorly understood. The continuous growth in continuous seismic and GNNS networks is allowing the acquisition of spatially extensive datasets at an increasing number of tectonic areas worldwide, therefore leading to an improved comprehension of such a physical significance.
6. Conclusive Remarks
Based on the SCC estimations previously presented and discussed, we identified three main regions with different seismic behavior along the western Mediterranean border.
- A large sector of the study area, comprising the western Betics, the western Rif, and the High, Middle, and Saharan Atlas is characterized by SCC values lower than 23%. Such a result coupled with geological and geophysical evidence supports the inference on the aseismic deformation (aseismic release processes) behavior at least for most of the Betics and Rif regions.
- Intermediate SCC values (between 35% and 60%) have been observed for some regions belonging to the eastern Betics, the central Rif, and the Middle Atlas. On these regions, crustal seismicity accounts only for a moderate fraction of the total deformation-rate budget.
- Higher SCC values (>95%) have been observed along the Tell Atlas, highlighting a fully seismic deformation. By considering the low SCC value inferred for T5 source zone, we speculated on the possibility of this being a seismic gap and hosting impending earthquakes.
Supplementary Materials
The following are available online at https://www.mdpi.com/2072-4292/12/6/952/s1, Table S1: Main features for each seismogenic source zone analyzed in this study, Table S2: Site coordinates and velocities referred to ITRF2014, Eurasian and Nubia reference frame for all GNSS sites analyzed in this study.
Author Contributions
Conceptualization, M.P. and F.S.; methodology, M.P.; software, M.P., F.S., and J.A.P.; validation, M.P., F.S., J.A.P., and J.F.; formal analysis, M.P., F.S., and J.A.P.; investigation, M.P.; resources, M.P., F.S., J.A.P., and J.F.; data curation, M.P., F.S., J.A.P., and J.F.; supervision, M.P.; project administration, M.P., J.A.P. and J.F.; funding acquisition, J.A.P. and J.F. All authors have read and agreed to the published version of the manuscript.
Funding
The research performed in this study was partially supported by the Spanish CGL2015-65602-R, CGL2016-80687-R and RTI2018-093874-B-100 projects, and the Programa Operativo FEDER Andalucía 2014-2020 – call made by the University of Jaén 2018.
Acknowledgments
We would like to thank all the people involved in the installation and maintenance of the GNSS stations and for making data available. Data used in this paper are available in the supporting information. The maps in this paper were produced using the public domain Generic Mapping Tools (GMT) software [92]. We would like to thank the Editor Bommie Xiong and the anonymous reviewers for their constructive and valuable suggestions on the earlier drafts of this manuscript. We thank S. Conway for the revision of the English form of this manuscript.
Conflicts of Interest
The authors declare no conflict of interest.
Appendix A
Table A1.
Main features for each seismogenic source zone (SSZ) analyzed in this study. The last column reports the number of GNSS sites, and site density for km2 (in brackets) for each SSZ.
Table A1.
Main features for each seismogenic source zone (SSZ) analyzed in this study. The last column reports the number of GNSS sites, and site density for km2 (in brackets) for each SSZ.
| SSZ | Stress Regime | Seismological Parameters | Level of Knowledge of Tectonic Structures | References | GNSS Data |
|---|---|---|---|---|---|
| BET1 | NNW-SSE compression and perpendicular horizontal extension | well constrained | High | [25,54,93,94] | 11 (3.2 ·10−4) |
| BET2 | Strike-slip to NW-SE compression | well constrained | High | [25,54,93,94] | 15 (14.1 ·10−4) |
| BET3 | NE extension to strike-slip | well constrained | High | [25,54,93,94] | 4 (3.9 ·10−4) |
| BET4 | Strike-slip to NW-SE compression | well constrained | High | [25,54,93,94] | 5 (3.4 ·10−4) |
| BET5 | NE extension to strike-slip | well constrained | High | [25,54,93,94] | 8 (14.6 ·10−4) |
| BET6 | NE extension to strike-slip | well constrained | High | [25,54,93,94] | 3 (3.1 ·10−4) |
| HA | NNW-SSE horizontal compression to strike-slip | poorly constrained | Medium | [24,50,93] | 2 (0.6 ·10−4) |
| HA-AA | NNW-SSE horizontal compression to strike-slip | poorly constrained | Medium | [24,50,93] | 2 (0.4 ·10−4) |
| HA-MA | NNW-SSE horizontal compression to strike-slip | poorly constrained | Medium-High | [24,50,93] | 3 (0.8 ·10−4) |
| LEV1 | NE extension to strike-slip | well constrained | High | [25,54,93,94] | 6 (3.5 ·10−4) |
| LEV2 | NE extension to strike-slip | well constrained | High | [25,54,93,94] | 22 (20.7 ·10−4) |
| MA-HP | NNW-SSE compression and perpendicular horizontal extension | poorly constrained | Medium | [24,50,93] | 8 (1.4 ·10−4) |
| MM | NNW-SSE pure compressional | poorly constrained | Medium | [24,50,93] | 7 (0.8 ·10−4) |
| R1a | NNW-SSE compression and perpendicular horizontal extension | well constrained | High | [24,50,54,93,94] | 9 (5.1 ·10−4) |
| R1b | NNW-SSE compression and perpendicular horizontal extension | well constrained | High | [24,50,54,93,94] | 3 (1.3 ·10−4) |
| R2 | NW-SE compression and perpendicular horizontal extension | well constrained | Medium-High | [24,50,54,93] | 7 (2.6 ·10−4) |
| SA1 | NW-SE horizontal compression to strike-slip | poorly constrained | Medium | [24,50,93] | 6 (0.8 ·10−4) |
| SA2 | N-S horizontal compression | poorly constrained | Medium | [24,50,93] | 6 (1.4 ·10−4) |
| T1 | NNW-SSE pure compressional to strike-slip | well constrained | High | [24,50,54,93,94] | 4 (1.3 ·10−4) |
| T2 | NNW-SSE pure compressional to strike-slip | well constrained | High | [24,50,54,93,94] | 2 (0.7 ·10−4) |
| T3 | NNW-SSE pure compressional | well constrained | High | [24,50,54,93] | 3 (1.1 ·10−4) |
| T4 | NNW-SSE pure compressional | well constrained | High | [24,50,54,93] | 4 (1.1 ·10−4) |
| T5 | N-S compressional strike-slip | well constrained | High | [24,50,54,93] | 3 (1.2 ·10−4) |
| T6 | NNW-SSE pure compressional | well constrained | High | [24,50,56,93] | 1 (0.3 ·10−4) |
| TA | NNW-SSE pure compressional | poorly constrained | High | [24,50,56,93] | 0 (0.0) |
Appendix B
To choose the most appropriate seismogenic thickness for the investigated region, the depth distributions of earthquakes from the ISC online catalog [46] were used. To this end, by taking into account all earthquakes with magnitude M ≥ 1, for each seismic zone we analyzed (i) the depth distribution—time plots and (ii) the cumulative frequency plots. Since several source zones share a similar pattern, we therefore merged all the seismic source zones into three main regions (Figure S1a) in order to obtain more robust results. Hence we re-analyzed, for each merged region, the depth distribution—time plots (Figure A1b–d) and the cumulative frequency plots (Figure A1e–g). Cumulative frequency plots of depth distributions of earthquakes show that 90% of events occur at depths less than 15, 18 and 30 km for Betics (BET1, BET2, BET3, BET4, BET5, BET6, LEV1, and LEV2), Tell Atlas (T2, T3, T4, T5, T6, and SA2), and Rif—western Atlas (R1a, R1b, R2, T1, MM, HA, HA-MA, HA-AA, SA1, MA-HP, and TA), respectively.

Figure A1.
(a) Seismic source zones subdivision into three main regions. In yellow, the Betics seismogenic sources (BET1, BET2, BET3, BET4, BET5, BET6, LEV1, and LEV2); in green the Rif—western Atlas seismogenic sources (R1a, R1b, R2, T1, MM, HA, HA-MA, HA-AA, SA1, MA-HP, and TA); in light-blue the Tell Atlas seismogenic sources (T2, T3, T4, T5, T6, and SA2). (b) Depth distribution—time plot of the Betics seismogenic sources. (c) Depth distribution—time plot of the Tell Atlas seismogenic sources. (d) Depth distribution—time plot of the Rif—western Atlas seismogenic sources. (e) Cumulative frequency plots of depth distribution of earthquakes; 90% of events occur at depths less than 15 km for the Betics main region. (f) Cumulative frequency plots of depth distribution of earthquakes; 90% of events occur at depths less than 18 km for the Tell Atlas main region. (g) Cumulative frequency plots of depth distribution of earthquakes; 90% of events occur at depths less than 30 km for the Rif - western Atlas main region.
The ISC routinely produces catalogs of earthquake hypocenter locations relying on data contributed by seismological agencies from around the world. A large number of earthquakes have their focal depth assigned to 0, 5, 10, 15, 20, 25, and 30 km, because of difficulties in computing reliable depth estimations. All events with M ≥ 3.5 are manually reviewed and relocated by an ISC analyst. The location provided by the ISC is based entirely on P-wave travel-time tables derived from a global 1D Earth velocity model (e.g., the ak135 model [95]). Therefore, many ISC hypocenters are poorly constrained in focal depth, especially in regions not extensively covered by seismic stations, as are the Rif and Atlas ones, and must be interpreted with caution.

Figure A2.
Cumulative frequency-magnitude distributions (red diamonds) of earthquakes for MA-HP and SA1 seismogenic source zones. The blue line represents the truncated Gutenberg–Richter function according to (1).
Appendix C
A variety of methods, based on different approaches, have been developed to compute strains (see [71] for an overview). Since the spatial distribution of our velocity field data is heterogeneous, in order to verify that the resulting strain-rate field provides a good representation of the regional deformation field of the investigated area, we performed some additional computations by adopting the method described in [71].
Four solutions are computed using a different combination of data weighting functions (12, 18, 24, and 32). The computation was performed on a 0.5° × 0.5° regular grid by adopting a Voronoi cell approach for areal weighting. Achieved results are reported in Figure A3: arrows show the greatest extensional (εHmax) and contractional (εhmin) horizontal strain-rates, while the color in the background shows the second invariant of the strain-rate tensor (defined as , where , and are three strain-rate components in an east and north Cartesian coordinate system).
Considering results reported in Figure A3, the strain-rate pattern suggests that as the weighting threshold decreases from 32 (Figure A3d) to 18 (Figure A3b), the strain-rate model picks up more tectonic strain signals along main tectonic features within the investigated area. However, as the weighting threshold decreases from 18 (Figure A3b) to 12 (Figure A3a), the differential strain-rate pattern starts to highlight very local signals. Some of these local signals are located in regions with dense data population (e.g., south-eastern Spain) while others are located in regions not covered by GNSS data, therefore suggesting a significant deteriorating of the strain-rate pattern at some places.
Balancing the trade-off between the resolution and robustness, we chose the strain-rate pattern resulting from a weighting threshold of 24 as the optimal model for the characterization of the strain-rate field in the Ibero–Maghrebian region.

Figure A3.
Estimated strain-rate field according to a Gaussian function for distance weighting of 12 (panel a), 18 (panel b), 24 (panel c), and 32 (panel d).

References
- Masson, F.; Chéry, J.; Hatzfeld, D.; Martinod, J.; Vernant, P.; Tavakoli, F.; Ghafory-Ashtiani, M. Seismic versus aseismic deformation in Iran inferred from earthquakes and geodetic data. Geophys. J. Int. 2005, 160, 217–226. [Google Scholar] [CrossRef]
- Palano, M.; Imprescia, P.; Agnon, A.; Gresta, S. An improved evaluation of the seismic/geodetic deformation-rate ratio for the Zagros Fold-and-Thrust collisional belt. Geophys. J. Int. 2018, 213, 194–209. [Google Scholar] [CrossRef]
- Mazzotti, S.; Leonard, L.J.; Cassidy, J.F.; Rogers, G.C.; Halchuk, S. Seismic hazard in western Canada from GPS strain rates versus earthquake catalog. J. Geophys. Res. 2011, 116, B12310. [Google Scholar] [CrossRef]
- Pancha, A.; Anderson, J.G.; Kreemer, C. Comparison of seismic and geodetic scalar moment rates across the Basin and Range Province. Bull. Seismol. Soc. Am. 2006, 96, 11–32. [Google Scholar] [CrossRef]
- Bos, A.G.; Spakman, W. Kinematics of the southwestern U.S. deformation zone inferred from GPS motion data. J. Geophys. Res. 2005, 110, B08405. [Google Scholar] [CrossRef]
- Rontogianni, S. Comparison of geodetic and seismic strain rates in Greece by using a uniform processing approach to campaign GPS measurements over the interval 1994–2000. J. Geodyn. 2010, 50, 381–399. [Google Scholar] [CrossRef]
- Chousianitis, K.; Ganas, A.; Evangelidis, C.P. Strain and rotation rate patterns of mainland Greece from continuous GPS data and comparison between seismic and geodetic moment release. J. Geophys. Res. 2015, 120, 3909–3931. [Google Scholar] [CrossRef]
- Jenny, S.; Goes, S.; Giardini, D.; Kahle, H.G. Seismic potential of southern Italy. Tectonophysics 2006, 415, 81–101. [Google Scholar] [CrossRef]
- Palano, M.; Cannavò, F.; Ferranti, L.; Mattia, M.; Mazzella, M.E. Strain and stress fields in the Southern Apennines (Italy) constrained by geodetic, seismological and borehole data. Geophys. J. Int. 2011, 187, 1270–1282. [Google Scholar] [CrossRef]
- D’Agostino, N. Complete seismic release of tectonic strain and earthquake recurrence in the Apennines (Italy). Geophys. Res. Lett. 2014, 41, 1155–1162. [Google Scholar] [CrossRef]
- Bilham, R.; Ambraseys, N. Apparent Himalayan slip deficit from the summation of seismic moments for Himalayan earthquakes, 1500–2000. Curr. Sci. 2005, 88, 1658–1663. [Google Scholar]
- Bungum, H.; Lindholm, C.D.; Mahajan, A.K. Earthquake recurrence in NW and central Himalaya. J. Asian Earth Sci. 2017, 138, 25–37. [Google Scholar] [CrossRef]
- Stevens, V.L.; Avouac, J.P. Millenary Mw > 9.0 earthquakes required by geodetic strain in the Himalaya. Geophys. Res. Lett. 2017, 43, 1118–1123. [Google Scholar] [CrossRef]
- Déprez, A.; Doubre, C.; Masson, F.; Ulrich, P. Seismic and aseismic deformation along the East African Rift System from a reanalysis of the GPS velocity field of Africa. Geophys. J. Int. 2013, 193, 1353–1369. [Google Scholar] [CrossRef]
- Kostrov, V. Seismic moment and energy of earthquakes, and seismic Row of rock. Izv. Acad. Sci. USSR Phys. Solid Earth 1974, 1, 23–44. [Google Scholar]
- Hyndman, R.D.; Weichert, D.H. Seismicity and rates of relative plate motion on the plate boundaries of western North America. Geophys. J. R. Astron. Soc. 1983, 72, 59–82. [Google Scholar] [CrossRef]
- Mazzotti, S.; Adams, J. Rates and uncertainties on seismic moment and deformation in eastern Canada. J. Geophys. Res. 2005, 110. [Google Scholar] [CrossRef]
- Michard, A.; Chalouan, A.; Feinberg, H.; Goffé, B.; Montigny, R. How does the Alpine belt end between Spain and Morocco? Bull. Soc. Géol. France 2002, 173, 3–15. [Google Scholar] [CrossRef]
- Platt, J.P.; Whitehouse, M.J.; Kelley, S.P.; Carter, A.; Hollick, L. Simultaneous extensional exhumation across the Alboran Basin: Implications for the causes of late orogenic extension. Geology 2003, 31, 251–254. [Google Scholar] [CrossRef]
- McKenzie, D.P. Plate tectonics of the Mediterranean region. Nature 1970, 226, 239–243. [Google Scholar] [CrossRef]
- Andrieux, J.; Fontbote, J.M.; Mattauer, M. Sur un modèle explicatif de l’arc de Gibraltar. Earth Planet. Sci. Lett. 1971, 12, 191–198. [Google Scholar] [CrossRef]
- Comas, M.C.; Platt, J.P.; Soto, J.I.; Watts, A.B. The origin and tectonic history of the Alboran Basin: Insights from Leg 161 results. In Proceedings of the Ocean Drilling Program; Scientific Results; Zahn, R., Comas, M.C., Klaus, A., Eds.; Ocean Drilling Program: College Station, TX, USA, 1999; Volume 161, pp. 555–580. [Google Scholar]
- Palano, M.; González, P.J.; Fernández, J. The diffuse plate boundary of Nubia and Iberia in the Western Mediterranean: Crustal deformation evidence for viscous coupling and fragmented lithosphere. Earth Planet. Sci. Lett. 2015, 430, 439–447. [Google Scholar] [CrossRef]
- Peláez, J.A.; Henares, J.; Hamdache, M.; Sanz de Galdeano, C. A seismogenic zone model for seismic hazard studies in northwestern Africa in Moment tensor solutions. In A Useful Tool for Seismotectonics; D’Amico, S., Ed.; Springer Natural Hazards: Berlin/Heidelberg, Germany, 2018; pp. 643–680. [Google Scholar]
- CNIG. Update of Seismic Hazard Maps of Spain; Centro Nacional de Información Geográfica: Madrid, Spain, 2013. [Google Scholar]
- Bourgois, J.A.; Mauffret, A.; Ammar, N.A.; Demnati, N.A. Multichannel seismic data imaging of inversion tectonics of the Alboran Ridge (western Mediterranean Sea). Geo Mar. Lett. 1992, 12, 117–122. [Google Scholar] [CrossRef]
- Masana, E.; Martínez-Díaz, J.J.; Hernández-Enrile, J.L.; Santanach, P. The Alhama de Murcia fault (SE Spain), a seismogenic fault in a diffuse plate boundary: Seismotectonic implications for the Ibero-Magrebian region. J. Geophys. Res. 2004, 109. [Google Scholar] [CrossRef]
- Gracia, E.; Pallas, R.; Soto, J.I.; Comas, M.C.; Moreno, X.; Masana, E.; Santanach, P.; Diez, S.; Garcia, M.; Dañobeitia, J. Active faulting offshore SE Spain, (Alboran Sea): Implications for earthquake hazard assessment in the southern Iberian Margin. Earth Planet. Sci. Lett. 2006, 241, 734–749. [Google Scholar] [CrossRef]
- Ballesteros, M.; Rivera, J.; Muñoz, A.; Muñoz-Martín, A.; Acosta, J.; Carbó, A.; Uchupi, E. Alboran basin, Southern Spain. Part II: Neogene tectonic implications for the orogenic float model. Mar. Petrol. Geol. 2008, 25, 75–101. [Google Scholar] [CrossRef]
- Meghraoui, M.; Cisternas, A.; Philip, H. Seismotectonics of the lower Cheliff basin: Structural background of the El Asnam (Algeria) earthquake. Tectonics 1986, 5, 809–836. [Google Scholar] [CrossRef]
- Meghraoui, M.; Pondrelli, S. Active faulting and transpression tectonics along the plate boundary in North Africa. Ann. Geophys. 2012, 55. [Google Scholar] [CrossRef]
- Bahrouni, N.; Bouaziz, S.; Soumaya, A.; Ben Ayed, N.; Attafi, K. Active deformation analysis and evaluation of earthquake hazard in Gafsa region (Southern Atlas of Tunisia). Geophys. Res. Abstr. 2013, 15, EGU2013-1009. [Google Scholar]
- Rabaute, A.; Chamot-Rooke, N. Active Tectonics of the Africa-Eurasia Boundary from Algiers to Calabria. Map at 1:500,000 Scale; Geosubsight: Paris, France, 2014; ISBN 978-2-9548197-0-9. [Google Scholar]
- Maouche, S.; Abtout, A.; Merabet, N.E.; Aïfa, T.; Lamali, A.; Bouyahiaoui, B.; Ayache, M. Tectonic and Hydrothermal Activities in Debagh, Guelma Basin (Algeria). J. Geophys. Res. 2013, 409475. [Google Scholar] [CrossRef]
- Ben Hassen, M.; Deffontaines, B.; Turki, M.M. Recent tectonic activity of the Gafsa fault through morphometric analysis: Southern Atlas of Tunisia. Quat. Int. 2014, 338, 99–112. [Google Scholar] [CrossRef]
- The SHARE European Earthquake Catalogue. Available online: www.emidius.eu/SHEEC/ (accessed on 26 January 2020).
- Peláez, J.A.; Chourak, M.; Tadili, B.A.; Aït Brahim, L.; Hamdache, M.; López Casado, C.; Martínez Solares, J.M. A catalog of main Moroccan earthquakes from 1045 to 2005. Seismol. Res. Lett. 2007, 78, 614–621. [Google Scholar] [CrossRef]
- Hamdache, M.; Peláez, J.A.; Talbi, A.; López Casado, C. A unified catalog of main earthquakes for northern Algeria from a.d. 856 to 2008. Seismol. Res. Lett. 2010, 81, 732–739. [Google Scholar] [CrossRef]
- Bougrine, A.; Yelles-Chaouche, A.K.; Calais, E. Active deformation in Algeria from Continuous GPS measurements. Geophys. J. Int. 2019, 217, 572–588. [Google Scholar] [CrossRef]
- Koulali, A.; Ouazar, D.; Tahayt, A.; King, R.W.; Vernant, P.; Reilinger, R.E.; McClusky, S.; Mourabit, T.; Davila, J.M.; Amraoui, N. New GPS constrains on active deformation along the Africa-Iberia plate boundary. Earth Planet. Sci. Lett. 2011, 308, 211–217. [Google Scholar] [CrossRef]
- Stich, D.; Martín, J.B.; Morales, J. Deformación sísmica y asísmica en la zona Béticas-Rif-Alborán. Rev. Soc. Geol. Esp. 2007, 20, 311–319. [Google Scholar]
- Martínez Solares, J.M.; Mezcua, J. Seismic Catalog of the Iberian Peninsula (880 BC-1900); IGN: Madrid, Spain, 2002. (In Spanish) [Google Scholar]
- Buforn, E.; Udías, A.; Madariaga, R. Intermediate and deep earthquakes in Spain. Pure Appl. Geophys. 1991, 136, 375–393. [Google Scholar] [CrossRef]
- Buforn, E.; Pro, C.; Udías, A.; del Fresno, C. The 2010 Granada, Spain, deep earthquake. Bull. Seismol. Soc. Am. 2011, 101, 2418–2430. [Google Scholar] [CrossRef]
- Cunha, T.A.; Matias, L.M.; Terrinha, P.; Negredo, A.M.; Rosas, F.; Fernandes, R.M.S.; Pinheiro, L.M. Neotectonics of the SW Iberia margin, Gulf of Cadiz and Alboran Sea: A reassessment including recent structural, seismic and geodetic data. Geophys. J. Int. 2012, 188, 850–872. [Google Scholar] [CrossRef]
- International Seismological Centre. Available online: www.isc.ac.uk/ (accessed on 26 January 2020).
- Dziewonski, A.M.; Chou, T.-A.; Woodhouse, J.H. Determination of earthquake source parameters from waveform data for studies of global and regional seismicity. J. Geophys. Res. 1981, 86, 2825–2852. [Google Scholar] [CrossRef]
- Ekström, G.; Nettles, M.; Dziewonski, A.M. The global CMT project 2004–2010: Centroid-moment tensors for 13,017 earthquakes. Phys. Earth Planet. Inter. 2012, 200–201, 1–9. [Google Scholar] [CrossRef]
- Custódio, S.; Lima, V.; Vales, D.; Cesca, S.; Carrilho, F. Imaging active faulting in a region of distributed deformation from the joint clustering of focal mechanisms and hypocentres: Application to the Azores-western Mediterranean region. Tectonophysics 2016, 676, 70–89. [Google Scholar] [CrossRef]
- Peláez, J.A.; Henares, J.; Hamdache, M.; Sanz de Galdeano, C. An updated seismic model for northwestern Africa. In Proceedings of the 16th European Conference on Earthquake Engineering, Thessaloniki, Greece, 18–21 June 2018. [Google Scholar]
- Aoudia, A.; Vaccari, F.; Suhadolc, P.; Meghraoui, M. Seismogenic potential and earthquake hazard assessment in the Tell Atlas of Algeria. J. Seism. 2000, 4, 79–98. [Google Scholar] [CrossRef]
- Peláez, J.A.; Hamdache, M.; López Casado, C. Seismic hazard in northern Algeria using spatially smoothed seismicity. Results for peak ground acceleration. Tectonophysics 2003, 372, 105–119. [Google Scholar] [CrossRef]
- Peláez, J.A.; Hamdache, M.; López Casado, C. Updating the probabilistic seismic hazard values of Northern Algeria with the 21 May 2003 M 6.8 Algiers earthquake included. Pure Appl. Geophys. 2005, 162, 2163–2177. [Google Scholar] [CrossRef]
- Henares, J.; López Casado, C.; Sanz de Galdeano, C.; Delgado, J.; Peláez, J.A. Stress fields in the Ibero-Maghrebian region. J. Seismol. 2003, 7, 65–78. [Google Scholar] [CrossRef]
- Palano, M.; González, P.J.; Fernández, J. Strain and stress fields along the Gibraltar Orogenic Arc: Constraints on active geodynamics. Gondwana Res. 2013, 23, 1071–1088. [Google Scholar] [CrossRef]
- Soumaya, A.; Ben Ayed, N.; Delvaux, D.; Ghanmi, M. Spatial variation of present-day stress field and tectonic regime in Tunisia and surroundings from formal inversion of focal mechanisms: Geodynamics implications for central Mediterranean. Tectonics 2015, 34, 1154–1180. [Google Scholar] [CrossRef]
- Aït Brahim, L.; Chotin, P.; Hinaj, S.; Abdelouafi, A.; Nakhcha, C.; Dhont, D.; Sossey Alaoui, F.; Bouaza, A.; Tabyaoui, H.; Chaouni, A. Paleostress evolution in the Moroccan African margin from Triassic to present. Tectonophysics 2002, 357, 187–205. [Google Scholar] [CrossRef]
- Hanks, T.C.; Kanamori, H. A moment magnitude scale. J. Geophys. Res. 1979, 84, 2348–2350. [Google Scholar] [CrossRef]
- Weichert, D.H. Estimation of the earthquake recurrence parameters for unequal observation observation periods for different magnitudes. Bull. Seismol. Soc. Am. 1980, 70, 1337–1346. [Google Scholar]
- Wells, D.L.; Coppersmith, K.J. New empirical relationship among magnitude, rupture length, rupture width, rupture area, and surface displacement. Bull. Seismol. Soc. Am. 1994, 84, 974–1002. [Google Scholar]
- Kijko, A.; Singh, M. Statistical tools for maximum possible earthquake magnitude estimation. Acta Geophys. 2011, 59, 674–700. [Google Scholar] [CrossRef]
- EUREF. Permanent GNSS Network. Available online: www.epncb.oma.be (accessed on 26 January 2020).
- CDDIS. NASA’s Archive of Space Geodesy Data. Available online: https://cddis.nasa.gov/ (accessed on 26 January 2020).
- UNAVCO. Available online: www.unavco.org (accessed on 26 January 2020).
- Herring, T.A.; King, R.W.; Floyd, M.A.; McClusky, S.C. Introduction to GAMIT/GLOBK, Release 10.7; Massachusetts Institute of Technology: Cambridge, UK, 2017; Available online: www-gpsg.mit.edu (accessed on 26 January 2020).
- Palano, M. On the present-day crustal stress, strain-rate fields and mantle anisotropy pattern of Italy. Geophys. J. Int. 2015, 200, 969–985. [Google Scholar] [CrossRef]
- Altamimi, Z.; Rebischung, P.; Métivier, L.; Collilieux, X. ITRF2014: A new release of the international terrestrial reference frame modeling nonlinear station motions. J. Geophys. Res. 2016, 121, 6109–6131. [Google Scholar] [CrossRef]
- Echeverría, A.; Khazaradze, G.; Asensio, E.; Gárate, J.; Martín Dávila, J.; Suriñach, E. Crustal deformation in eastern Betics from CuaTeNeo GPS network. Tectonophysics 2013, 608, 600–612. [Google Scholar] [CrossRef]
- Garate, J.; Martin-Davila, J.; Khazaradze, G.; Echeverria, A.; Asensio, E.; Gil, A.J.; de Lacy, M.C.; Armenteros, J.A.; Ruiz, A.M.; Gallastegui, J.; et al. Topo-Iberia project: CGPS crustal velocity field in the Iberian Peninsula and Morocco. GPS Solut. 2015, 19, 287–295. [Google Scholar] [CrossRef]
- Cabral, J.; Mendes, V.B.; Figueiredo, P.; da Silveira, A.B.; Pagarete, J.; Ribeiro, A.; Dias, R.; Ressurreição, R. Active tectonics in Southern Portugal (SW Iberia) inferred from GPS data. Implications on the regional geodynamics. J. Geodyn. 2017, 112, 1–11. [Google Scholar] [CrossRef]
- Shen, Z.-K.; Wang, M.; Zeng, Y.; Wang, F. Optimal interpolation of spatially discretized geodetic data. Bull. Seismol. Soc. Am. 2015, 105, 2117–2127. [Google Scholar] [CrossRef]
- Savage, J.C.; Simpson, R.W. Surface strain accumulation and the seismic moment tensor. Bull. Seismol. Soc. Am. 1997, 87, 1345–1353. [Google Scholar]
- Stich, D.; Martínez-Solares, J.M.; Custódio, S.; Batlló, J.; Martín, R.; Teves-Costa, P.; Morales, J. Seismicity of the Iberian Peninsula. In The Geology of Iberia: A Geodynamic Approach; Springer: Cham, Switzerland, 2020; pp. 11–32. [Google Scholar] [CrossRef]
- Mahsas, A.; Lammali, K.; Yelles, K.; Calais, E.; Freed, A.; Briole, P. Shallow afterslip following the 2003 May 21, Mw = 6.9 Boumerdes earthquake, Algeria. Geophys. J. Int. 2008, 172, 155–166. [Google Scholar] [CrossRef]
- Lin, J.; Stein, R.; Meghraoui, M.; Toda, S.; Ayadi, A.; Dorbath, C.; Belabbes, S. Stress transfer among en echelon and opposing thrusts and tear faults: Triggering caused by the 2003 Mw = 6.9 Zemmouri, Algeria, earthquake. J. Geophys. Res. 2011, 116, B03305. [Google Scholar] [CrossRef]
- Onana, P.N.E.; Toto, E.A.; Zouhri, L.; Chaabane, A.; El Mouraouah, A.; Brahim, A.I. Recent seismicity of Central High Atlas and Ouarzazate basin (Morocco). Bull. Eng. Geol. Environ. 2011, 70, 633–641. [Google Scholar] [CrossRef]
- Turcotte, D.; Schubert, G. Geodynamics; Cambridge University Press: Cambridge, UK, 2002; p. 456. [Google Scholar]
- Ward, S.N. On the consistency of earthquake moment rates, geological fault data, and space geodetic strain: The United States. Geophys. J. Int. 1998, 134, 172–186. [Google Scholar] [CrossRef]
- Torné, M.; Fernàndez, M.; Comas, M.C.; Soto, J.I. Lithospheric structure beneath the Alboran Basin: Results from 3D gravity modeling and tectonic relevance. J. Geophys. Res. 2000, 105, 3209–3228. [Google Scholar] [CrossRef]
- Polyak, B.G.; Fernàndez, M.; Khutorskoy, M.D.; Soto, J.I.; Basov, I.A.; Comas, M.C.; Khain, V.Y.; Alonso, B.; Agapova, G.V.; Mazurova, I.S.; et al. Heat flow in the Alboran Sea, western Mediterranean. Tectonophysics 1996, 263, 191–218. [Google Scholar] [CrossRef]
- Fernàndez, M.; Marzán, I.; Correia, A.; Ramalho, E. Heat flow, heat production, and lithospheric thermal regime in the Iberian Peninsula. Tectonophysics 1998, 291, 29–53. [Google Scholar] [CrossRef]
- Rimi, A.; Chalouan, A.; Bahi, L. Heat flow in the westernmost part of the alpine mediterranean system (The Rif, Morocco). Tectonophysics 1998, 285, 135–146. [Google Scholar] [CrossRef]
- Pollack, H.N.; Chapman, D.S. On the regional variation of heat flow, geotherms, and lithospheric thickness. Tectonophysics 1977, 38, 279–296. [Google Scholar] [CrossRef]
- Serrano, I.; Zhao, D.P.; Morales, J. 3-D crustal structure of the extensional Granada Basin in the convergent boundary between the Eurasian and African plates. Tectonophysics 2002, 344, 61–79. [Google Scholar] [CrossRef]
- Fernàndez-Ibáñez, F.; Soto, J.I. Crustal rheology and seismicity in the Gibraltar Arc (western Mediterranean. Tectonics 2008, 27, TC2007. [Google Scholar] [CrossRef]
- González, P.J.; Palano, M.; Fernández, J. Study of the present-day tectonics and seismogenetic sources of the Al-Hoceima region (Morocco) using GPS and MTINSAR. In Proceedings of the Fringe 2009 Workshop, Frascati, Italy, 30 November–4 December 2009; Volume 30. [Google Scholar]
- Yelles Chauche, A.K.; Kherroubi, A.; Beldjoudi, H. The large Algerian earthquakes (267 A.D.-2017). Física de la Tierra 2017, 29, 159–182. [Google Scholar] [CrossRef]
- Roger, J.; Hébert, H. The 1856 Djijelli (Algeria) earthquake and tsunami: Source parameters and implications for tsunami hazard in the Balearic Islands. Nat. Hazards Earth Syst. Sci. 2008, 8, 721–731. [Google Scholar] [CrossRef]
- Hamdache, M.; Peláez, J.A.; Yelles Chauche, A.K. The Algiers, Algeria earthquake (Mw 6.8) of 21 May 2003: Preliminary report. Seismol. Res. Lett. 2004, 75, 360–367. [Google Scholar] [CrossRef]
- Rong, Y.; Jackson, D.D.; Kagan, Y.Y. Seismic gaps and earthquakes. J. Geophys. Res. 2003, 108, 2471. [Google Scholar] [CrossRef]
- Gupta, H.; Gahalaut, V.K. Seismotectonics and large earthquake generation in the Himalayan region. Gondwana Res. 2014, 25, 204–213. [Google Scholar] [CrossRef]
- Wessel, P.; Smith, W.H. The generic mapping tools (GMT). Eos Trans. Am. Geophys. Union 1995, 76, 329. [Google Scholar] [CrossRef]
- Heidbach, O.; Rajabi, M.; Cui, X.; Fuchs, K.; Müller, B.; Reinecker, J.; Reiter, K.; Tingay, M.; Wenzel, F.; Xie, F.; et al. The World Stress Map database release 2016: Crustal stress pattern across scales. Tectonophysics 2018, 744, 484–498. [Google Scholar] [CrossRef]
- de Vicente, G.; Cloetingh, S.; Muñoz Martín, A.; Olaiz, A.; Stich, D.; Vegas, R.; Galindo Zaldívar, J.; Fernández Lozano, J. Inversion of moment tensor focal mechanisms for active stresses around the microcontinent Iberia: Tectonic implications. Tectonics 2008, 27, TC1009. [Google Scholar] [CrossRef]
- Kennett, B.L.N.; Engdahl, E.R.; Buland, R. Constraints on seismic velocities in the Earth from travel times. Geophys. J. Int. 1995, 122, 108–124. [Google Scholar] [CrossRef]
© 2020 by the authors. Licensee MDPI, Basel, Switzerland. This article is an open access article distributed under the terms and conditions of the Creative Commons Attribution (CC BY) license (http://creativecommons.org/licenses/by/4.0/).