Abstract
Solar power generation is highly fluctuating due to its dependence on atmospheric conditions. The integration of this variable resource into the energy supply system requires reliable predictions of the expected power production as a basis for management and operation strategies. This is one of the goals of the Solar Cloud project, funded by the Italian Ministry of Economic Development (MISE)—to provide detailed forecasts of solar irradiance variables to operators and organizations operating in the solar energy industry. The Institute of Methodologies for Environmental Analysis of the National Research Council (IMAA-CNR), participating to the project, implemented an operational chain that provides forecasts of all the solar irradiance variables at high temporal and horizontal resolution using the numerical weather prediction Advanced Research Weather Research and Forecasting (WRF-ARW) Solar version 3.8.1 released by the National Center for Atmospheric Research (NCAR) in August 2016. With the aim of improving the forecast of solar irradiance, the three-dimensional (3D-Var) data assimilation was tested to assimilate radiances from the Spinning Enhanced Visible and Infrared Imager (SEVIRI) aboard the Meteosat Second Generation (MSG) geostationary satellite into WRF Solar. To quantify the impact, the model output is compared against observational data. Hourly Global Horizontal Irradiance (GHI) is compared with ground-based observations from Regional Agency for the Protection of the Environment (ARPA) and with MSG Shortwave Solar Irradiance estimations, while WRF Solar cloud coverage is compared with Cloud Mask by MSG. A preliminary test has been performed in clear sky conditions to assess the capability of the model to reproduce the diurnal cycle of the solar irradiance. The statistical scores for clear sky conditions show a positive performance of the model with values comparable to the instrument uncertainty and a correlation of 0.995. For cloudy sky, the solar irradiance and the cloud cover are better simulated when the SEVIRI radiances are assimilated, especially in the short range of the simulation. For the cloud cover, the Mean Bias Error one hour after the assimilation time is reduced from 41.62 to 20.29 W/m2 when the assimilation is activated. Although only two case studies are considered here, the results indicate that the assimilation of SEVIRI radiance improves the performance of WRF Solar especially in the first 3 hour forecast.
Keywords:
solar irradiance; WRF; assimilation; SEVIRI; radiance; 3DVAR; numerical weather prediction 1. Introduction
The rise of renewable energy in global energy production requires the development of procedure to better manage these highly variable sources. In recent years, the contribution of solar power to electricity has incremented rapidly; in Italy solar power has grown from 3.6 GW in 2010 to more than 20 GW in 2018, which represents about 7% of the gross national electricity and the 20% of the total energy from renewable sources [1]. Solar energy usage is expected to continue growing for the foreseeable future. Thus, the prediction of solar radiation is becoming crucial to estimate in advance how much energy will be available and what share can be covered with renewable sources. Contrary to the conventional energy sources (fossil and nuclear), solar energy is considered a variable source because the energy production is dependent on the intensity of solar irradiance that is mainly attenuated by atmospheric aerosols and clouds passing between the sun and the solar-powered plants. Given this variability in the generation of solar power, nowadays it becomes imperative to focus on a realistic modelling and accurate prediction of this variable, which is essential for management, strategies operations and regulation of power supplies.
Solar power prediction is pursued through different techniques for various time scales. Indeed, the forecast temporal interval helpful for the operators range from few minutes to days, so different methods are necessary. The strategies used for the prediction of the Global Horizontal Irradiance (GHI) can be divided mainly into two groups. The first group includes numerical weather prediction (NWP) models, which solves the equations of atmospheric dynamics and thermodynamics to infer cloud and radiative information up to several days ahead [2,3]. The second group relies on the analysis of satellite or ground based remote sensing to infer cloud motion and short-term forecasting from minutes to few hours [4,5,6,7,8]. Most of the works [9,10,11] shows that the second group outperforms the first one for forecasts within 4–5 h, with the time window depending on the localization. For a longer forecast horizon, numerical models are more appropriate [12]. Some recent studies suggest that NWP forecasts are becoming competitive with respect to satellite-based methods even on short-time scale [10,12].
Several studies assess the performances of mesoscale models. The Weather Research and Forecasting (WRF) model has been tested in the forecasts of GHI in Spain [13] and in several European and North American sites [14], reporting relative Root Mean Square Error (RMSE) of about 40% for 24 h forecast horizon. Similar results have been found in Europe [15]. In Southern Italy, a comparison of two atmospheric regional models (the Regional Atmospheric Modeling System (RAMS) and the WRF model) has been reported for clear and cloudy sky conditions finding RMSE values for both models in overcast conditions about 80 W/m2 larger than in clear sky conditions [16]. A seasonal characterization using the RAMS model over the western Mediterranean Coast has been performed to evaluate the solar radiation using ground-based weather stations measurements for the winter 2010–2011 and the summer 2011. The statistically daily evaluations show absolute bias values varying from −50 to 160 W/m2 and a RMSE from 60 to 240 W/m2 [17]. A similar evaluation has been performed for the WRF/RAMS models over a region in Eastern Spain under distinct atmospheric conditions using in-situ observations and remote sensing data derived from the Spinning Enhanced Visible and Infrared Imager (SEVIRI) aboard the Meteosat Second Generation (MSG) and the uncoupled Land Surface Model (LSM) Global Land Data Assimilation System (GLDAS) during a 7-day period in summer 2011. Both the models show difficulties to forecast clouds with values of Mean Bias Error (MBE) and RMSE in overcast conditions ranging, respectively, from −70 to −80 W/m2 and from 140 to 190 W/m2 for WRF and from −80 to −110 W/m2 and from 200 to 400 W/m2 for RAMS [18].
An important milestone in solar radiation applications has been the development of WRF-Solar within the project Sun4Cast [19]. This study asserts that the use of WRF-Solar significantly improves the solar irradiance forecast and the combination of the NWP with satellite-based method produces accurate forecast also in the short range 1–6 h time scale [20]. This paper focuses on the following forecasting challenge: improve the short-term forecast of solar irradiance using satellite data assimilation. The forecast skill is indeed strongly influenced by the accuracy of the cloud and thermodynamics analyses in the initial representations, which can improve significantly using satellite data assimilation [21]. Satellite are the primary source of cloud information and therefore can play an important role also for solar power forecasting [21,22,23]. One of the methods used to improve the forecast of the clouds and consequently of the solar irradiance is the assimilation of the satellite radiances from geostationary meteorological satellites. The main advantage of the radiance assimilation is that the observed radiances can be directly ingested into the NWP without the need of retrieval methods. Retrievals provide an estimate of the simulated variable from the observed quantity based on inversion of a physical or empirical model; these techniques usually produce large uncertainties [21].
The main focus in recent years has been on radiance assimilation from polar orbiting satellites to improve the NWP forecast. Two studies analyzed the impact of the assimilation of radiance data from the Advanced Microwave Sounding Unit-A (AMSU-A) [24] and from the Advanced Microwave Scanning Radiometer 2 (AMSR2) [25] for the hurricane Sandy forecasts and the results proved that the radiance assimilation improved the short and medium range forecast [24] and the hurricane structure and cloud distributions [25]. Similar results can be found in References [26,27], where radiances from AMSU-A and AMSU-B [26] and from the Microwave Humidity Sounder (MHS) [27] have been assimilated in the WRF model to simulate an event of heavy rainfall in Beijing [26] and to forecast a binary system typhoons [27].
Besides polar-orbiting satellites, geostationary instruments were also found to be useful source of information and have been introduced to data assimilation more recently. Despite recent progress in data assimilation, the potentiality of geostationary sensors is far from being fully exploited [28]. One advantage of geostationary instruments is the nearly continuous picture of the weather event evolution due to their high temporal resolution. The impact of geostationary radiances from three infrared channels of SEVIRI using a four-dimensional data assimilation has been investigated using the High-Resolution Limited Area Model (HIRLAM) under clear sky and low-level cloud conditions [29,30,31]. The tests have been performed in a domain with a horizontal resolution of 22 km converting the measured radiances by SEVIRI to brightness temperatures and cloud products. Results show a positive impact for almost all upper-air variables; the main improvements are obtained for geopotential height and humidity [29,30,31]. The impact of assimilating Geostationary Operational Environmental Satellite (GOES) imager radiances on the analysis and forecast of a convective process over Mexico was assessed for the first time using a rapid refresh assimilation system with a convection permitting model setting [32]. Improved humidity and temperature analysis and significant standard deviation reductions were produced when the assimilation is activated [32].
In this study we present the preliminary results of the first attempt to assimilate the SEVIRI radiance in the WRF-Solar model in convection-permitting configuration to improve the solar irradiance forecast especially in the short-medium range. The paper is organized as follows: Section 2 describes the WRF-Solar with its configuration, the data assimilation system, the observation data sets, the two simulated periods and the statistical methodology. Section 3 provides the results and the statistical analysis both in clear sky and cloudy conditions and Section 4 draws conclusions and future developments.
2. Materials and Methods
In this study, the tool used to forecast the solar irradiance is the NWP model WRF, Solar version. The model has been tested both in the control configuration (CNTRL) without any type of assimilation and in assimilated mode (ASSIM) using the three-dimensional (3D-Var) data assimilation technique. The radiances measured by the imager radiometer SEVIRI onboard MSG geostationary satellite have been ingested in the NWP. The model performances are evaluated using two types of data: the ground-based observations from the weather stations of Regional Agency for the Protection of the Environment (ARPA) Lombardy and two European Organization for the Exploitation of Meteorological Satellites (EUMETSAT) products derived by SEVIRI.
2.1. Numerical Weather Prediction Model and the WRF-IMAA-Solar Setup
The WRF model is a next-generation mesoscale NWP system designed for flexible purposes from atmospheric investigations to operational forecasting requests. The Advanced Research WRF (ARW) dynamical core system has been developed by the collaborations of several research institutes directed by the National Center for Atmospheric Research (NCAR, http://www.wrf-model.org). The WRF-ARW core is based on an Eulerian solver for the fully compressible nonhydrostatic equations, using a mass vertical coordinate varying with height and it used for time-integration scheme a third-order Runge-Kutta. WRF-ARW supports horizontal nesting (one- or two-way) to allow a spatial resolution enhancement through the introduction of additional domains. The full physics schemes (microphysics, cumulus convection, atmospheric and surface radiation, planetary boundary layer and land-surface) provided by WRF vary from simple and efficient to the most sophisticated and computationally expensive [33].
The Solar version of WRF has been specifically conceived to improve the solar irradiance prediction. WRF-Solar is the first NWP model expressly planned to join the rising request for dedicated forecast variables for solar energy purposes [34]. The direct normal irradiance (DNI) and diffuse (DIF) components of solar irradiance in addition to the GHI component are calculated in the radiative budgets within the NWP system [34]. This calculation is performed by the radiative parameterization Rapid Radiative Transfer Model for Global (RRTMG) that explicitly solves the radiative transport equation for all the components. In addition, WRF-Solar introduces the direct effect in aerosol-radiation feedback to obtain a better representation of the components of diffuse and direct radiation and the indirect effect in the aerosol-cloud feedback that considers the interaction between the hydrometeors and the aerosols [35]. This link between the microphysical and the radiative scheme, leading to a physically more consistent representation of the distribution of the hydrometeors, is a novelty since usually in NWP models the distribution functions are imposed with an effective radius of the constant cloud particle.
The WRF-IMAA-Solar version 3.8.1 is operative at the Institute of Methodologies for Environmental Analysis of the National Research Council (IMAA-CNR) since 2016 and it has been developed during the SolarCloud project financed by the Italian Ministry of Economic Development (MISE), with the aim of providing high temporal and spatial resolution forecasts of solar irradiance variables to solar energy industry purposes.
Two-way nested domains have been selected for the implemented configuration: the larger domain is centered over the Mediterranean basin with 9 km grid spacing while the inner domain includes Italy with 3 km horizontal resolution (Figure 1). The domains are represented with a Lambertian projection using staggered Arakawa-C horizontal grid and the land-use and the Digital Elevation Model (DEM) are obtained by the Moderate Resolution Imaging Spectroradiometer (MODIS) database at 30 s of arc (about 900 m) updated in 2008. The vertical grid is common to all the domains with 36 vertical levels, ranging from the surface to the model top set to 50 hPa.
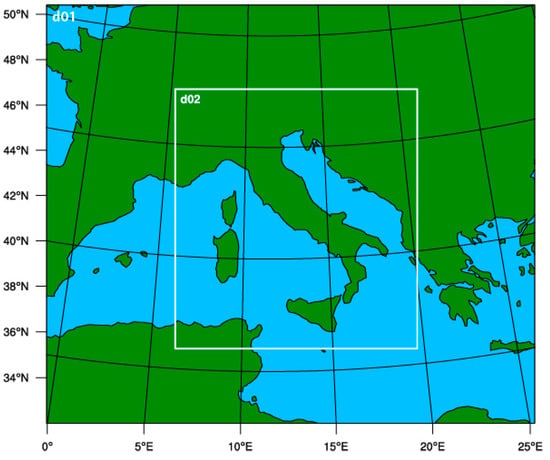
Figure 1.
Model domains for Weather Research and Forecasting (WRF) simulations: d01 the mother domain with a grid spacing of 9 km, d02 the inner domain with 3 km horizontal resolution.
The simulations are initialized using the weather forecast of the Global Forecast System (GFS) produced by the National Centers for Environmental Prediction (NCEP) at 0.25 degree and 35 vertical levels, upgraded every 6 h. A preliminary sensitivity analysis was carried out before making the model operational within the SolarCloud project to derive the optimum configurations. The Planetary Boundary Layer (PBL) has been simulated using the non-local-K Yonsei parameterization [36], the microphysics has been computed through the Thompson parameterization [35] and for the shortwave and the longwave the RRTMG radiation scheme [37]. The convective scheme has been activated only for the outer domain using the Kain-Fritsch [38]; the inner domain explicitly resolves the convective motion. The cumulus and the PBL scheme are called every time step, whereas the irradiances (GHI, DNI and DIF) are computed every 3 min, each time the radiation scheme is called and the instantaneous values are stored in output every hour.
2.2. D-VAR Data Assimilation of SEVIRI Radiance
The idea to assimilate satellite radiance data arises from the need to have the most accurate initial state of the atmosphere to better predict its future state and hence that of the solar irradiance reaching the surface [21,26,39]. Outgoing radiance is related to the geophysical atmospheric state, providing very useful thermodynamic information both over land and over sea. It can be simply measured by a satellite and directly ingested into the NWP using a variational method and a Radiative Transfer Model (RTM).
The radiance measured by SEVIRI is considered for data assimilation in this article. SEVIRI is an imager radiometer onboard MSG geostationary platform providing accurate weather monitoring data through twelve spectral channels. Eight channels are in the thermal infrared, providing data about the temperature of clouds, atmosphere, land and sea surfaces. The remaining four channels are in the visible and near-infrared range. The imaging sampling distance at nadir is 3 km for standard channels and approximately 1 km for the High Resolution Visible (HRV) channel [40]. The radiance data are available through National Centers for Environmental Prediction (NCEP) public interface in near real time (with 6 h delay) in Binary Universal Form for the Representation of meteorological data (BUFR) format (ftp://nomads.ncdc.noaa.gov/GDAS/).
The data assimilation used in this work is the 3D-Var version 3.8 developed by NCAR and included into the WRF Data Assimilation (WRFDA) system. The data assimilation is a technique by which observations are combined with the NWP product (the first guess or background) and their respective error statistics to provide an improved estimate (the analysis) of the atmospheric state [41,42]. Variational data assimilation achieves this through the iterative minimization of a prescribed cost function J(x):
where x is the state vector defined by the atmospheric and surface parameters, xb is the background vector, y is the observation, B is the background error covariance matrix, H is the operator that converts the model state to the observation space and R is the observation error covariance matrix. The aim is to minimize the cost function (1) that measures the distance of a field x from the observations y and from the background xb. A correct evaluation of the error covariance matrices, both B and R, is crucial to a good-quality final analysis. For the direct radiance assimilation, the observation operator H(x) include the RTM that calculates the radiances from the model variables of a state vector x. The RTM evaluates the physical processes modulating the Earth’s radiant energy balance. The modulations depend on the cloud microphysical details (particle size, shape, orientation, presence of aerosols), the cloud macrophysical properties (cloud top temperature, morphology, optical thickness) and environment context (water vapor, surface albedo, vertical profile of temperature). Actually, the RTM codes supported by the WRFDA are the Community Radiative Transfer Model (CRTM) and the Radiative Transfer for TOVS (RTTOV). The first has been developed by the Joint Center for Satellite Data Assimilation (JCSDA) and the second one by the European Centre for Medium-range Weather Forecasts (ECMWF) and the United Kingdom Meteorology Office (MetOffice). Both RTM codes can calculate radiances for several current and past instruments in orbit. WRFDA allows to select the desired RTM via the namelist parameter. In this study, the CRTM is chosen because this package is distributed with WRFDA without licensing restrictions and is compiled automatically [41,42]. The CRTM provides fast, accurate satellite radiance simulations under all weather and surface conditions, including both a forward model, which simulates the upwelling radiances for a given sensor and its Jacobian, which calculates the radiance derivatives with respect to the input atmospheric state variables. The CRTM is capable of accounting for the absorption of atmospheric gases as well as the multiple scattering of water clouds, of ice clouds and of a variety of aerosols [43].
J(x) = (x − xb) T B−1 (x − xb) + [y − H(x)] T R−1 [y − H(x)],
The instruments to be assimilated are controlled by four integer namelist parameters: RTMINIT_NSENSOR (the total number of sensors to be assimilated), RTMINIT_PLATFORM (the platforms IDs array to be assimilated), RTMINIT_SATID (satellite IDs array) and RTMINIT_SENSOR (sensor IDs array) [41,42]. For the assimilation of the SEVIRI radiance these parameters are set to 1, 12, 3 and 21, respectively.
As highlighted above, the background error covariance matrix plays a crucial role to provide proper weight to the background term in defining the analysis cost function J. Two different types of B are available for use in the WRF 3D-Var technique: one is the generic background error statistics that can be used for any case and the second one is a domain specific B matrix that considers the climatological aspects of the area. It is strongly recommended to use a domain-specific background error to consider the scale of the motions especially in the area with a complex orography [44]. In this study, a specific background B matrix is computed with a 1-month dataset using the National Meteorological Centre (NMC) technique [45]. This method evaluates the initial state error using differences of pairs of forecasts valid at the same time but with one of them having a delayed start time.
Before assimilating the satellite radiances in the system, a quality control is performed to discard faulty observations and the bias correction is carried out using the Variational Bias Correction (VarBC) scheme to remove possible biases from the measurements. A further procedure applied over the raw radiance data is the 120 km thinning mesh. Thinning methods are necessary to downsize the large satellite data sets and to reduce spatial error correlations between the observations in order to obtain the fundamental information of the data for a proper use in data assimilation technique. It should also be mentioned that WRFDA reads directly the BUFR radiance files distributed by EUMETSAT with no need for separate pre-processing. The whole processing, such as quality control, thinning, bias correction and so forth, is carried out within WRFDA. This is different from conventional observation assimilation, which requires a pre-processing package (OBSPROC) to generate WRFDA readable ASCII files. The WRFDA system requires three input files to run: the WRF first guess file (initial condition file for the WRF model), the observations (BUFR file) and the background error statistics file. The outputs of the WRFDA system becomes the inputs for the ASSIM simulations.
Currently, the WRF 3D-Var is able to assimilate the eight thermal infrared channels of SEVIRI (4–11).
2.3. Observational Data Sets
GHI data (W/m2) are obtained from the ground-based pyranometers of the Regional Network of Meteorological Survey of the ARPA of Lombardy region (Figure 2). These data are freely available from the ARPA website (http://www.arpalombardia.it/) in Comma Separated Values (CSV) format. The 23 weather stations are reported in Table 1 and have a sample frequency of 10 minutes. Table 1 reports also the above sea level (asl) elevations of the stations and the corresponding ones extracted from the DEM of the WRF. ARPA agency is responsible for the observation acquirement and the quality control. The pyranometers (mainly CM6B, HE20/K and DPA) used by the ARPA network are heterogeneous and produced by various companies, all belonging to the International Organization for Standardization (ISO) "First Class" classification and the World Meteorological Organization (WMO) "Good quality" classification; the uncertainties on the daily data declared by the manufacturers are ± 5%. [46,47,48,49,50].
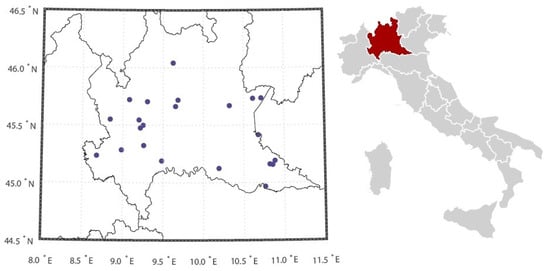
Figure 2.
(left) Location of the Regional Agency for the Protection of the Environment (ARPA) radiometric stations; (right) position of Lombardy region within Italy.

Table 1.
Name, position and real/simulated elevation of the ARPA weather stations.
The products from the MSG mission have been used to further evaluate the performance of the WRF-IMAA-Solar. Satellite observations were directly downloaded from the Data Centre of the EUMETSAT Earth Observation Portal where it is possible to order online long-term archived data and generated products from EUMETSAT.
The EUMETSAT products used here are:
- The MSG Meteorological Product Extraction Facility (MPEF) Cloud Mask (CLM) product describes the scene type (either ’clear’ or ’cloudy’) on a pixel level. The MPEF-CLM algorithm uses a set of threshold tests on reflectance, brightness temperature and brightness temperature differences of channel properly chosen in order to classify each pixel as clear sky over water, clear sky over land, cloud, or not processed (off Earth disc). Data are available in network Common Data Form (netCDF) format and have a frequency of 15 min [51,52,53].
- The Ocean and Sea Ice Satellite Application Facility (OSI SAF) hourly shortwave Surface Solar Irradiance (SSI) (W/m2) gives an estimate of the solar irradiance reaching the Earth’s surface. It is derived from the 0.6 µm visible channel of SEVIRI from MSG platform and it is produced by remapping over a 0.05° regular grid. The data are available in GRIdded Binary 2 (GRIB2) format with an hourly frequency [54,55].
2.4. The Two Simulated Periods
To evaluate WRF-IMAA-Solar two periods have been selected, one characterized by sunny days used to test CNTRL configuration and one by overcast conditions for ASSIM.
For the clear sky sensitivity test, two days of stable conditions have been selected: the 20–21 January 2017. During these days a robust ridge of high pressure of approximately 1040 hPa at the surface centered in the northern Europe (Figure 3a) guarantees clear sky conditions over the northern part of Italy (Figure 3b). The vertical alignment of the ridge between the surface and the 500 hPa level ensures the persistence of the stability conditions (Figure 3a).
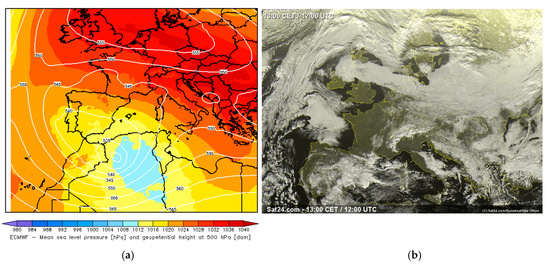
Figure 3.
Synoptic analysis at 12:00 UTC (Coordinated Universal Time), 20 January 2017: (a) European Centre for Medium-Range Weather Forecasts (ECMWF) 500 hPa geopotential height (white lines) and ECMWF mean sea level pressure; (b) the cloud cover observed by Meteosat Second Generation (MSG).
For cloudy conditions, 01–02 April 2017 is selected, as during these days the southward regression of the high pressure centered over Italy allows the descent of a deep trough in the north-central Europe (Figure 4a). This synoptic structure encourages the rising from south-west of warm and wet air (Figure 4a) fostering the development of scattered clouds in Northern Italy (Figure 4b).
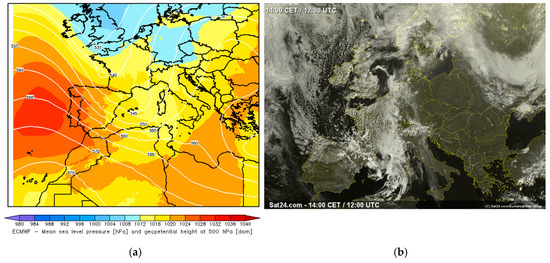
Figure 4.
Synoptic analysis at 12:00 UTC, 01 April 2017: (a) ECMWF 500 hPa geopotential height (white lines) and ECMWF mean sea level pressure; (b) the cloud cover observed by MSG.
2.5. The Statistical Methodology
The validation of this preliminary test in the two selected periods against the ground-based and satellite products is performed through the evaluation of statistical skills.
Four commonly-used statistical indexes are considered for the analysis of the GHI observed by the ARPA stations and for the MSG SSI [56]: the Mean Absolute Error (MAE), the Mean Bias Error (MBE), the Root Mean Square Error (RMSE) and the correlation (CORR), defined as follows:
where m and o represent model data and observations, respectively, cov is the covariance, N indicates the length of data, σm and σo are respectively the standard deviation of simulated and observed data.
For completeness the normalized scores have also been evaluated, so to reduce the dependence of the statistical indexes on the values of the GHI:
where is the average of the observations and MBE, RMSE and MAE are calculated respectively using the Equations (2)–(4).
For the evaluation of the cloud mask additional statistical indexes are introduced. These scores are based on the contingency table (Table 2), which summarizes the relationship between two categorical variables.

Table 2.
Two by two contingency table.
These statistical scores are defined using the frequency distributions in Table 2:
- Proportion Correct (PC) = (A + D)/(A + B + C + D);
- False Alarm Rate (FAR) = B/(A + B);
- Miss Rate (MR) = C/(A + C);
- BIAS = (A + B)/(A + C);
where A indicates event both observed and simulated, B simulated but not observed, C observed but not simulated and D not observed and not simulated.
3. Results and Discussion
This section presents the comparison of the WRF-IMAA-Solar in the two configurations CNTRL and ASSIM against the observations described in Section 2.3. The statistical analysis is carried out through the indexes reported in Section 2.5. An initial sensitivity test has been performed with the ground-based observations in clear and overcast conditions. The clear sky evaluation has been presented only for the model in CNTRL configuration since in absence of cloud the impact of radiance assimilation is of little relevance. For the clear sky sensitivity test the 20–21 January 2017 period has been used (Figure 3a,b). The comparison is done extracting from the numerical model the GHI over the four nearest grid points to the station coordinates and then performing a distance weighted mean. Figure 5a reports the diurnal cycles of the solar irradiance for the 20–21 January 2017 simulated by WRF-IMAA-Solar (red line) and observed by ARPA radiometers (black line). For clear sky conditions, the model correctly reproduces the observed evolution even though a slight overestimation (~5 W/m2) can be observed in the maximum of the mean solar irradiance (Figure 5a). The mean scatter plot of the GHI, reported in Figure 5b, shows a distribution with grouped points, due to the hourly samples; in clear sky conditions the GHIs increase before noon and decrease after the maximum with a similar trend among the stations. The standard deviation reported in Figure 5a,b for both observations and simulations is calculated between the stations to take into account the variability between them. The widths of the standard deviations for the observations (about 20–30 W/m2) are approximately comparable for all the GHI values (Figure 5b). These gaps are easily visible from Figure 5a at midday when the derivative of the curve approaches zero and they seem negligible in the rapid phase of growth and decrease of the GHI. In addition, note from Figure 5b that the standard deviations calculated among the stations are larger for the observations than for the simulated ones, meaning that the observed GHI of the 23 stations show larger variability than the simulations. That indicates that the model may miss some of the differences between sites that are fairly close. To highlight the differences among the stations, statistical scores have been evaluated separately for each station and reported in Table 3. From Table 1 we note that the model tends to underestimate the elevation of the stations and to smooth the height of the stations, especially the ones with higher elevations, leading to underestimation and less variable GHI among the observation sites. This is evident at stations like Bione, Mezzoldo Passo S. Marco and Tignale Oldesio where the GHI is underestimated, especially in the maximum of the solar irradiance of approximately 20–30 W/m2, as demonstrated by the negative values of the MBE (Table 3, clear sky). For some stations, particularly the ones located in urban areas (e.g. Milano, Milano Lambrate and Cinisello Balsamo), the model shows positive MBE > 5 W/m2, indicating an overestimation of the GHI probably due to an underestimation of GHI extinction caused by pollution aerosols or to excessively high albedo associated to improper land use category (Table 3, clear sky). Furthermore, larger RMSE, ranging from 20 to 30 W/m2, are associated to stations showing the greatest differences between real and model elevation, that is, Bione, Mezzoldo Passo S.Marco and Tignale Oldesio (Table 3, clear sky). In clear sky conditions, significant differences among real and model elevations could explain the model deviations from observations, indeed the vertical profile of global irradiance is determined by the change of the optical path length.
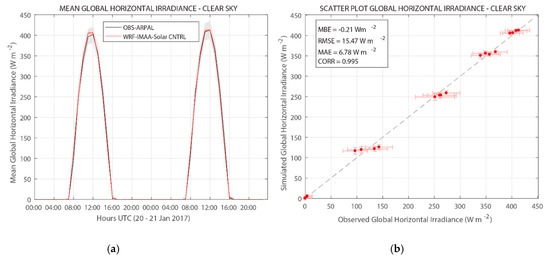
Figure 5.
The solar irradiance in clear sky conditions. (a) The simulated and observed diurnal cycles of the solar irradiance for the 20–21 January 2017, the values are averaged over all the 23 ARPA stations and the shaded areas represent the standard deviations among the stations. (b) The mean scatter plot with the standard deviations of the global horizontal irradiance (GHI) among the stations, the box on the top left reports the averaged statistical indexes.

Table 3.
The Mean Absolute Error (MAE), the Mean Bias Error (MBE), the Root Mean Square Error (RMSE) and the correlation (CORR) for each single ARPAL station in clear and cloudy sky conditions for three model runs: the control (CNTRL), the control started at 12 UTC (CNTRL 12 UTC) and the run with assimilation of SEVIRI radiance at 12 UTC (ASSIM 12 UTC).
The statistical scores averaged over all the stations are reported in the first line of Table 4. The values for the clear sky conditions confirm the positive performance of the WRF-IMAA-Solar with a MBE of –0.21 W/m2, a RMSE of 15.47 W/m2, a MAE of 6.78 W/m2 (comparable to the instrument uncertainty) and a CORR of 0.995.

Table 4.
Statistical scores for the preliminary tests in clear and cloudy sky for the control simulation and the assimilated of Spinning Enhanced Visible and Infrared Imager (SEVIRI) radiance at 00/12 UTC ones.
To conclude the comparison with the ARPAL stations, the model performances in overcast conditions have been evaluated. For this purpose, the period 01–02 April 2017 is selected (Figure 4a,b). For this case study the evaluation is performed for both the CNTRL and ASSIM configurations. For the ASSIM configuration, two different settings have been tested to choose the best performing one:
- ASSIM1: WRFDA uses the default B matrix.
- ASSIM2: WRFDA uses a domain specific B matrix that considers the climatological aspects of the area.
For both ASSIM1 and 2, the model assimilates radiances from the eight thermal infrared channels of SEVIRI (4–11) at the start time (00 UTC). The comparison is done in the same manner of clear sky conditions, with the ARPA observations and using the distance weighted mean. The first 24 h of simulation of the two runs have been selected for the comparison. The statistical scores obtained for the cloudy sky and averaged all over the stations are reported in Table 4. The performances of the model in overcast sky get worse than the ones in clear sky, confirming the difficulty for the model to correctly reproduce clouds in both space and in time. The introduction of the assimilation tends to improve the irradiance forecast. In fact, the RMSE, MAE and CORR are better for the ASSIM configurations than the CNTRL one. Only the MBE gets worse for ASSIM tests than the CNTRL one, which is probably due to the underestimation of the cloud cover. The assimilation test with the domain specific B matrix has better scores than the one with the default one.
Even though the ASSIM2 configuration shows slightly higher performances than CNTRL ones, except for the MBE, another test has been performed to further investigate the impact of the assimilation of the SEVIRI radiance at 12 UTC. To better evaluate, indeed, the impact of the assimilation on the forecast of the solar irradiance, it is preferable to choose diurnal hours for the assimilation time, when GHI is relatively high. In addition, at 00 UTC the cloudiness over Lombardy region is quite limited, hinting a little impact of the assimilation on the performance of the model.
For the ASSIM at 12 UTC, the model is set using the configuration with best scores in the preliminary tests (ASSIM2); hence from now on the acronym ASSIM will refer to the configuration mentioned above as ASSIM2.
Figure 6a shows the time series of simulated and observed solar irradiance with the respective standard deviations of the stations. Close to the assimilation time (12 UTC), ASSIM shows values closer to observations than CNTRL. Figure 6b confirms the tendency for both the configurations to overestimate the GHI, in fact the points lay above the 1:1 line. The underestimation of the cloud cover and the associated overestimation of radiation is a common problem in NWP modeling due to the incomplete representation of the complex and often nonlinear cloud processes into the parameterizations [12,57,58,59,60]. Even for this test, the standard deviation reported in Figure 6a,b for observations and simulations is calculated between the stations to take into account the variability between them. As seen for the clear sky in Figure 5b, the standard deviations of the stations are larger for the observed GHI than the simulated ones. To the possible reasons listed above, we can also add the difficulty for the model to simulate the right location and timing of clouds.
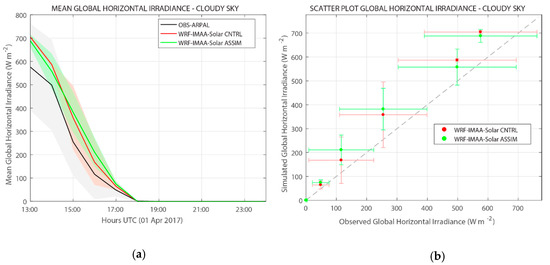
Figure 6.
The solar irradiance in cloudy sky conditions. (a) The simulated and observed solar irradiance for 1 April 2017, the values are averaged all over the 23 ARPA stations and the shaded areas represent the standard deviations of the stations. (b) Scatter plot of the GHI with the respective standard deviations among the stations.
The statistical scores reported in Table 4 reveal better values for the two simulations initialized at 12 UTC than for the three initialized at 00 UTC. These improvements are due both to the assimilation during diurnal time, when GHI is relatively high and to the interval time considered for the statistical scores closer to the start and assimilation times.
For this test, the statistical indexes have also been evaluated separately for each station (Table 3, cloudy sky). For the MBE and MAE indexes, the number of stations where ASSIM or CNTRL prevail is very similar (respectively 8 for the MBE and 6 for the MAE). For the RMSE and CORR scores, instead, the number of stations where the ASSIM values are better than the CNTRL ones, prevails. The stations that perform best for ASSIM are located on the east and west side of the Lombardy region, leaving a central area (the Milan and Bergamo area) where the CNTRL configuration prevails. This can be explained by looking at Figure 5a where we can distinguish two bands of clouds over northern Italy which leave an area of clear sky in the central part of Lombardy. Therefore, in the areas where the cloud cover is observed, the impact of assimilation of radiance from SEVIRI is positive and improves the model’s performance.
The statistical indexes averaged over all the stations for CNTRL and ASSIM are similar, though ASSIM shows better RMSE, decreasing from 104.34 W/m2 to 100.05 W/m2 and CORR, increasing from 0.915 to 0.920 (Table 4).
To increase the size of validation points, we extended the comparison to the satellite observations described above. The first evaluation is against the CLM from MSG. The cloud cover computed by WRF-IMAA-Solar-ASSIM is compared with the cloud cover observed by MSG satellite at 13 UTC (1 hour later the assimilation). Figure 7 clearly shows the impact of the assimilation—the ASSIM produce more cloudiness (Figure 7b) with respect to CNTRL (Figure 7c) which is confirmed by MSG observations (Figure 7a). The CNTRL simulation misses most of clouds over Italy, reproducing only the convective clouds related to the incoming front in North-West Italy. The analysis is further divided by cloud height (low, medium and high) as shown in Figure 8. It is clear that the SEVIRI assimilation allows the model to recover both the cirrus (Figure 8c) and the convective activity producing medium and low clouds (Figure 8a,b) towards the western boundary.
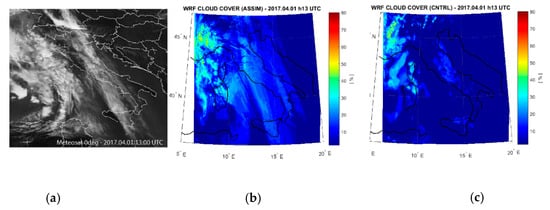
Figure 7.
The cloud cover at 13 UTC of 1 April 2017 observed by MSG (a), simulated by WRF-IMAA-Solar in assimilated mode (ASSIM) (b) and simulated by WRF-IMAA-Solar in control configuration (CNTRL) (c).
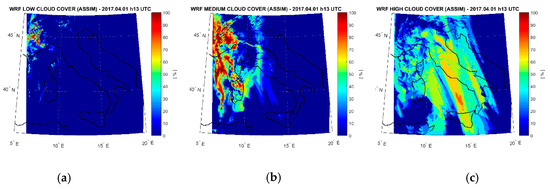
Figure 8.
The cloud cover at 13 UTC of 1 April 2017 simulated by WRF-IMAA-Solar-ASSIM divided by height: low (a), medium (b) and high clouds (c).
The comparison between the CLM from MSG and the simulations (CNTRL and ASSIM) is done interpolating the observations on the grid of the model and producing the CLM from the WRF cloud cover. For this comparison the simple persistence method has been introduced as benchmark to evaluate the convenience of using the assimilation technique. The persistence is a very simple method, for which the current status is projected as is to the future assuming that conditions remain unchanged in subsequent time intervals [5].
The impact of the assimilating process is most relevant at 13 UTC of 1 April, that is, one hour after the assimilation. Indeed, the first line of Figure 9 shows that WRF ASSIM gives a cloud mask very similar to the observed one, even though an overestimation of the cloud can be observed. This is confirmed by Figure 10, where PC, FAR, MR and BIAS are reported for the first 6 h after the assimilation. It is evident that the CNTRL configuration misses the 59% of cloud grid points against only the 11% for ASSIM; also the PC confirms that ASSIM well simulates the 81% of pixels cloud/no cloud versus the 63% for CNTRL and the BIAS for ASSIM is very close to the best value (1.09 for ASSIM and 0.43 for CNTRL). On the other hand, FAR increases for ASSIM (18%) with respect to CNTRL (5%). One hour later, at 14 UTC, the CNTRL simulation starts to recover the gap and indeed more clouds appear in central-southern Italy (Figure 9, second row). The statistical scores (Figure 10) confirm this recovery, especially for PC (82% for ASSIM and 80% for CNTRL), though remaining below the ASSIM performances (MR: 9% for ASSIM and 26% for CNTRL; BIAS: 1.10 for ASSIM and 0.80 for CNTRL). Three hours later the start time (15 UTC, third row Figure 9) the two WRF simulations are very similar even though the CNTRL maintains the tendency to underestimate the presence of clouds, for example around Sardinia, as shown by the MR reported in Figure 10 (MR: 7% for ASSIM and 16% for CNTRL) and the ASSIM to overestimate the cloud cover, as indicated by the FAR reported in Figure 10 (FAR: 16% for ASSIM and 9% for CNTRL). In the following hours (Figure 9: 16 UTC fourth row and 17 UTC fifth row) the CNTRL and ASSIM cloud masks are close to each other and no particular feature can be detected as confirmed by the PC ranging from 84% of CNTRL to 86% of ASSIM (Figure 10) and by the BIAS oscillating between 1.03 and 1.06 for both the configurations. For the statistical scores FAR and MR the differences decrease reaching respectively 13% and 8%. The comparison highlights that the persistence outperforms ASSIM only in the first half hour of simulation for the PC and FAR indexes; later in time the enhancement for ASSIM with respect to the persistence is remarkable (Figure 10). The improvement of ASSIM relative to the persistence model is negligible at the first hour of simulation for the MR and BIAS scores and increases with time (Figure 10). In addition, persistence tends to worsen with time according to all statistical indices, as opposed to the ASSIM and CNTRL configurations for which the performances improve over time (Figure 10). Therefore, WRF-IMAA-Solar outperforms the persistence model, especially when the assimilation is used. Indeed, all the mean statistical scores are always worse for the persistence than ASSIM (Table 5). The CNTRL configuration is outperformed by the persistence only for the MR index (Table 5).
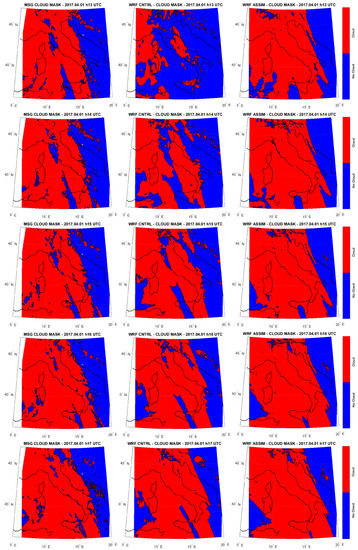
Figure 9.
The cloud cover of 1 April 2017 from 13 UTC (first line) to 17 UTC (fifth line) observed by MSG (first column), simulated by WRF-IMAA-Solar-CNTRL (second column) and simulated by WRF-IMAA-Solar-ASSIM (third column).
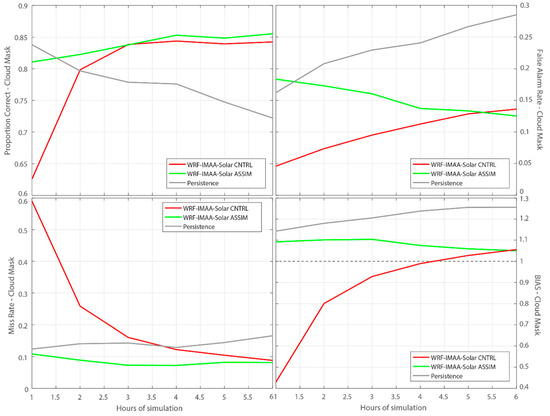
Figure 10.
The statistical scores for the Cloud Mask (CLM) vs hour of simulation from the start time (12 UTC). The red line refers to the CNTRL, the green one to ASSIM configuration, the gray one to the persistence and the black dotted one to the best value of the BIAS. Top panels show Proportion Correct (PC) (left) and False Alarm rate (FAR) (right); bottom panels show Miss Rate (MR) (left) and BIAS (right).

Table 5.
Proportion Correct (PC), False Alarm rate (FAR), Miss Rate (MR) and BIAS for the evaluation of the CLM simulated by WRF-IMAA-Solar – CNTRL, ASSIM and by the persistence method. The values are averaged between 13 UTC and 18 UTC.
Summarizing the impact of the radiance assimilation on the cloud mask, it is evident that the benefits are very clear especially within 3 h after the assimilation time; after this interval the performances of the CNTR and ASSIM are very similar. The statistical scores reported in Table 5 assert best results for ASSIM than CNTRL for the PC, MR and BIAS; only the FAR is worst for ASSIM with respect to CNTRL.
The second evaluation with MSG products focuses on the Hourly Shortwave Solar Irradiance. As for the cloud mask, the observations have been interpolated over the WRF model grid.
The GHI at 13 UTC of 1 April 2017 (first row of Figure 11) clearly reproduces what already seen above for the cloud mask (Figure 9): the overestimation produced by the CNTRL simulation is due to the lack of high clouds over central Italy and also the cloudy system north-west of Corsica is underestimated compared to the observed one. The ASSIM simulation better reproduces the GHI pattern over Italy but overestimates the GHI in the west side of the domain due to a lower extinction by the simulated cloud system, which appears more scattered than the observed one. We note a different behavior of the GHI by MSG over land and water; indeed, clear gaps appear over Sicily and central Italy where the lower values of GHI suddenly interrupt passing from sea to land. These observational gaps can be due to a different retrieval technique over land and over water and could have effects on the evaluation.
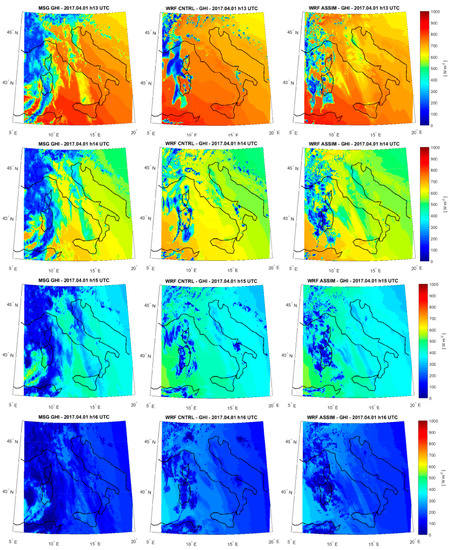
Figure 11.
The GHI of 1 April 2017 from 13 UTC (top row) to 16 UTC (bottom row) observed by MSG (first column), simulated by WRF-IMAA-Solar-CNTRL (second column) and simulated by WRF-IMAA-Solar-ASSIM (third column).
For this reason, the statistical indexes have also been calculated by selecting only the grid points over the sea, which seem more reasonable and more consistent with respect to the observed clouds.
Both the MBE and the NMBE indexes confirm the GHI overestimation more pronounced for the CNTRL configuration than the ASSIM one (Figure 12). In fact, the values of the MBE range from a maximum 68 W/m2 to a minimum 54 W/m2 for CNTRL and from a maximum 62 W/m2 to a minimum 49 W/m2 for ASSIM. The NMBE shows an increase of the overestimation with time (Figure 12, first row), with at least 2% above for ASSIM with respect to CNTRL. The mean values of the NMBE are 19% for ASSIM and 21% for CNTRL as reported in the Table 6. Let us highlight the improvement of both the MBE and the NMBE when only the water grid points are selected. This is more pronounced for ASSIM; in fact, the mean value of the MBE passes from 54.43 W/m2 to 38.85 W/m2 for ASSIM and from 60.57 W/m2 to 58.40 W/m2 for CNTRL (Table 6).
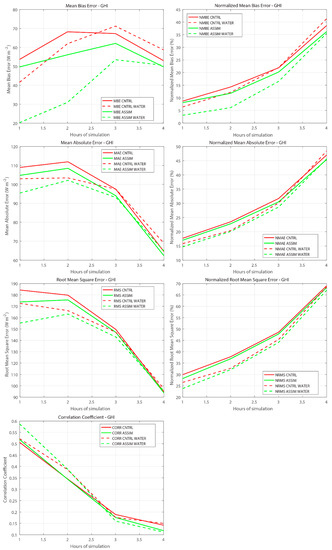
Figure 12.
The statistical scores for the GHI vs hour of simulation starting from the start time (12 UTC). The red lines refer to the CNTRL and the green ones to the ASSIM configuration. The dotted lines refer to the indexes evaluated only over the water grid points. In the first row are reported on the left the Mean Bias Error (MBE) and on the right the Normalized Mean Bias Error (NMBE); in the second row the Mean Absolute Error (MAE) on the left and the Normalized Mean Absolute Error (NMAE) on the right; in the third row the Root Mean Square Error (RMSE) and the Normalized Root Mean Square Error (NRMSE), respectively on the left and on the right and in the fourth row the Correlation (CORR).

Table 6.
The Normalized Mean Bias Error (NMBE), the Normalized Root Mean Square Error (NRMSE), the Normalized Mean Absolute Error (NMAE), the Mean Bias Error (MBE), the Root Mean Square Error (RMSE), the Mean Absolute Error (MAE) and the correlation (CORR) for the evaluation of the GHI simulated by WRF-IMAA-Solar – CNTRL and ASSIM, by the persistence and observed by MSG. The indexes have been calculated also only on the water grid point. The values are averaged between 13 UTC and 18 UTC.
Later in time (Figure 11) the GHI decreases because of sun setting and the overestimation in the left side of the domain remains more evident in the CNTRL than ASSIM simulation. The RMSE and MAE apparently seem to improve with time but this is due to the decreasing of the values of the GHI and not to an improvement of the forecast performances (second and third rows of Figure 12). For this reason, it is more appropriate to analyze the normalized indices, which indicate a slight superiority for ASSIM with respect to CNTRL and clearly show the worsening of the forecast skills with the time of simulation. The values of NMAE move from 17% of the first hour of simulation to 45% of the fourth one for ASSIM and from 18% to 47% for CNTRL. The same trend can be found for the NRMSE showing values ranging from 28% to 68% for ASSIM and from 30% to 69% for CNTRL. Slight better performances are given over water, with a maximum improvement for the NRMSE of 5% for ASSIM and 4% for CNTRL; the maximum improvement for NMAE is 3% for both ASSIM and CNTRL.
The correlation shows very similar results for both the configurations with a maximum of 59% for ASSIM WATER one hour after the assimilation (Figure 12, fourth row); values worsen with time, reaching approximately 12–14% after four hours. The persistence method has been used as benchmark also for the evaluation of the GHI. The mean values of the scores confirm that WRF-IMAA-Solar, both CNTRL and ASSIM, outperforms the persistence method. This result is expected, as this simple method can be used in clear sky conditions and is not suitable when the atmospheric dynamics involves rapid cloud cover variations.
Summarizing these preliminary results, it can be asserted that the WRF model overestimated the GHI and the assimilation process tends to reduce the error up to 4 h after the start time, when the SEVIRI radiance has been assimilated. The average scores confirm better performances for ASSIM, especially considering grid points only over water (Table 6).
4. Conclusions
The solar irradiance is particularly variable both in space and in time because of the complexity of the dynamic evolution of clouds. Geostationary satellite data can be taken into account to produce a more realistic representation of the atmospheric state using a data assimilation tool in a convective permitting model. Therefore, with the aim to improve the prediction of solar irradiance, preliminary tests have been performed to assess the impact of the 3D-VAR data assimilation of SEVIRI radiance in Italy using WRF Solar mesoscale model. The performances of the model have been analyzed both in clear conditions and cloudy sky. In clear sky the model has been tested without assimilation (CNTRL configuration) using the ARPAL radiometric stations. The statistical scores for the clear sky conditions confirm the positive performance of the WRF-IMAA-Solar with a MBE of −0.21 W/m2, a RMSE of 15.47 W/m2, a MAE of 6.78 W/m2 comparable to the instrument uncertainty and a CORR of 0.995.
For cloudy sky, simulations with data assimilation (ASSIM configuration) have been performed. A preliminary test allows us to select the best settings for the use of the 3D-VAR data assimilation: the eight thermal infrared channels of SEVIRI have been assimilated at 12 UTC using a domain specific B matrix to consider the climatological aspects of the area, the VarBC scheme correction to remove the biases from the measurements and the 120 km thinning mesh to avoid correlations between adjacent observations. The solar irradiance is better simulated by ASSIM than CNTRL configuration, especially in the 2–3 h nearest to the assimilation time, even though both the configurations overestimate the GHI. The statistical indexes calculated using the ARPAL stations improve for the ASSIM configuration, especially for the RMSE. The improvements introduced by the 3D-VAR data assimilation of SEVIRI radiances are confirmed also by the comparison with the EUMETSAT products: the Cloud Mask and the Hourly Shortwave Solar Irradiance. The use of the radiance assimilation on the simulation of cloud mask clearly produces better results especially in the 3 h later the assimilation time; after this interval the performances of the CNTRL and ASSIM are very similar. In particular one hour after the assimilation time the CNTRL configuration misses the 59% of cloud grid points against only the 11% for ASSIM; the PC statistical score passes from the 63% of CNTRL to the 81% of ASSIM and the BIAS for ASSIM is very close to the best value (1.09 for ASSIM and 0.43 for CNTRL). After the first hour of simulation, the better performance for the ASSIM configuration persists even though the difference is less significant.
The improvement related to the SEVIRI radiance assimilation is confirmed also by the comparison of the WRF-IMAA-Solar with the MSG products of the Hourly Shortwave Solar Irradiance. The statistical indexes confirm the GHI overestimation of the model is more pronounced for CNTRL than ASSIM. In the first hour of simulation the RMSE is reduced from 185 to 173 W/m2 and the MBE from 54 to 49 W/m2 when the assimilation is activated. The normalized statistical indexes are better by ~2% using the ASSIM configuration. A discontinuity is noted for MSG GHI over water and over land, probably due to a different retrieval technique. Calculating the statistical scores for only the over-water grid points, which seem to have a more consistent pattern with the observed clouds, the values improve further. Indeed, the value of the MBE one hour after the assimilation time passes from 49 W/m2 to 20 W/m2 for ASSIM and from 54 W/m2 to 42 W/m2 for CNTRL, using only the water grid points and the behavior is similar for the remaining indexes. The statistical scores obtained are comparable or slightly better than the values obtained from similar works, where a NWP is used to estimate the GHI [13,14,15,16,17,18]. The results from these preliminary tests show that the assimilation of geostationary satellite data increase the performances of the WRF-Solar model especially in the short-term range of the forecasts. This confirms the findings of other works [61,62,63], that is the effect of satellite data assimilation has high impact in the first 3–4 h of simulation and the improvement due to the assimilation decreases going forward with the simulation.
Note that this technique has been tested on two case studies only (one in clear sky and one in cloudy conditions) as preliminary tests for checking whether it is worth the effort to implement this change on our operational chain. Encouraged by the positive results, we are planning to increase the dataset and also to focus on the diffuse and direct components of the GHI.
Further improvements could be made considering other SEVIRI channels, for example, in the visible range. In the future, we plan to test assimilation with RTTOV model, since its most recent version allows for the assimilation of visible channels in addition to the infrared channels ones. The visible channels and specially the HRV channel with 1 km spatial resolution, carry more information and detail on the cloud pattern and properties, possibly foreshadowing an improved solar irradiance forecast. In addition, other advanced assimilation methods such as 4D-Var could be tested to take advantage of the frequent interval of scanning (15 min for SEVIRI).
Author Contributions
Conceptualization, S.G.; Methodology, S.G.; Software, E.R. (Ermann Ripepi); Validation, F.D.P.; Formal Analysis, M.V.; Investigation, S.G.; Resources, S.G.; Data Curation, D.G. and E.G.; Writing-Original Draft Preparation, S.G.; Writing-Review & Editing, D.C., S.L., S.T.N. and E.R. (Elisabetta Ricciardelli); Visualization, S.L.; Supervision, F.R.; Project Administration, E.G.; Funding Acquisition, D.C. All authors have read and agreed to the published version of the manuscript.
Funding
This work has been funded by the Italian Ministry of Economic Development (MISE) in the framework of the SolarCloud project, contract No. B01/0771/04/X24.
Conflicts of Interest
The authors declare no conflict of interest. The funders had no role in the design of the study; in the collection, analyses, or interpretation of data; in the writing of the manuscript, or in the decision to publish the results.
References
- GSE (Gestore dei Servizi Energetici) Statistical Report (Italian Only). Available online: https://www.gse.it/documenti_site/Documenti%20GSE/Rapporti%20statistici/Solare%20Fotovoltaico%20-%20Rapporto%20Statistico%202018.pdf (accessed on 27 January 2020).
- Perez, R.; Lorenz, E.; Pelland, S.; Beauharnois, M.; Knowe, G.V.; Hemker, K.; Heinemann, D., Jr.; Remund, J.; Müller, S.C.; Traunmüller, W.; et al. Comparison of numerical weather prediction solar irradiance forecasts in the US, Canada and Europe. Sol. Energy 2013, 94, 305–326. [Google Scholar] [CrossRef]
- Remund, J.; Perez, R.; Lorenz, E. Comparison of solar radiation forecasts for the USA. In Proceedings of the 23rd European Photovoltaic Solar Energy Conference, Valencia, Spain, 1–5 September 2008. [Google Scholar]
- Chow, C.W.; Urquhart, B.; Kleissl, J.; Lave, M.; Dominguez, A.; Shields, J.; Washom, B. Intra-hour forecasting with a total sky imager at the UC San Diego solar energy testbed. Sol. Energy 2011. [Google Scholar] [CrossRef]
- Pedro, H.T.; Coimbra, C.F. Assessment of forecasting techniques for solar power production with no exogenous inputs. Sol. Energy 2012, 86, 2017–2028. [Google Scholar] [CrossRef]
- Lorenz, E.; Hammer, A.; Heinemann, D. Short term forecasting of solar radiation based on satellite data. In Proceedings of the EUROSUN2004 (ISES Europe Solar Congress), Freiburg, Germany, 20–23 June 2004. [Google Scholar]
- Gallucci, D.; Romano, F.; Cersosimo, A.; Cimini, D.; Di Paola, F.; Gentile, S.; Geraldi, E.; Larosa, S.; Nilo, S.T.; Ricciardelli, E.; et al. Nowcasting Surface Solar Irradiance with AMESIS via Motion Vector Fields of MSG-SEVIRI Data. Remote Sens. 2018, 10, 845. [Google Scholar] [CrossRef]
- Romano, F.; Cimini, D.; Cersosimo, A.; Di Paola, F.; Gallucci, D.; Gentile, S.; Geraldi, E.; Larosa, S.; Nilo, S.T.; Ricciardelli, E.; et al. Improvement in Surface Solar Irradiance Estimation Using HRV/MSG Data. Remote Sens. 2018, 10, 1288. [Google Scholar] [CrossRef]
- Perez, R.; Kivalov, S.; Schlemmer, J.; Hemker, K.; Renné, D.; Hoff, T.E. Validation of Short and Medium Term Operational Solar Radiation Forecasts in the US. Sol. Energy 2010, 84, 2161–2172. [Google Scholar] [CrossRef]
- Diagne, M.; David, M.; Lauret, L.; Boland, J.; Schmutz, N. Review of solar irradiance forecasting methods and a proposition for small-scale insular grids. Renew. Sustain. Energy Rev. 2013, 27, 65–76. [Google Scholar] [CrossRef]
- Nonnenmacher, L.; Coimbra, C.F. Streamline-based method for intra-day solar forecasting through remote sensing. Sol. Energy 2014, 108, 447–459. [Google Scholar] [CrossRef]
- Inman, R.H.; Pedro, H.T.C.; Coimbra, C.F.M. Solar forecasting methods for renewable energy integration. Prog. Energy Combust. Sci. 2013, 39, 535–576. [Google Scholar] [CrossRef]
- Lara-Fanego, V.; Ruiz-Arias, J.A.; Pozo-Vázquez, D.; Santos-Alamillos, F.J.; Tovar-Pescador, J. Evaluation of the WRF model solar irradiance forecasts in Andalusia (southern Spain). Sol. Energy 2012, 86, 2200–2217. [Google Scholar] [CrossRef]
- Perez, R.; Hoff, T. Solar Anywhere Forecasting, in: Solar Energy Forecasting and Resource Assessment; Kleissl, J., Ed.; Elsevier: Amsterdam, The Netherlands, 2013. [Google Scholar] [CrossRef]
- Lorenz, E.; Remund, J.; Müller, S.C.; Traunmüller, W.; Steinmaurer, G.; Pozo, D.; Ruiz-Arias, J.A.; Lara Fanego, V.; Ramirez, L.; Romeo, M.G.; et al. Benchmarking of Different Approaches to Forecast Solar Irradiance. In Proceedings of the 24th European Photovoltaic Solar Energy Conference, Hamburg, Germany, 21–25 September 2009; pp. 4199–4208. [Google Scholar] [CrossRef]
- Lo Feudo, T.; Avolio, E.; Gulli, D.; Federico, S.; Calidonna, C.R.; Sempreviva, A.M. Comparison of hourly solar radiation from a ground-based station remote sensing and weather forecast models at a coastal site of South Italy (Lamezia Terme). Energy Procedia 2015, 76, 148–155. [Google Scholar] [CrossRef]
- Gómez, I.; Caselles, V.; Estrela, M.J. Seasonal Characterization of Solar Radiation Estimates Obtained from a MSG-SEVIRI-Derived Dataset and a RAMS-Based Operational Forecasting System over the Western Mediterranean Coast. Remote Sens. 2016, 8, 46. [Google Scholar] [CrossRef]
- Gómez, I.; Caselles, V.; Estrela, M.J.; Miró, J.J. Comparative assessment of RAMS and WRF short-term forecasts over Eastern Iberian Peninsula using various in-situ observations, remote sensing products and uncoupled land surface model datasets. Atmos. Res. 2018, 213, 476–491. [Google Scholar] [CrossRef]
- Haupt, S.E.; Kosovic, B.; Jensen, T.L.; Lee, J.; Jimenez Munoz, P.; Lazo, J.K.; Hinkleman, L. The Sun4Cast Solar Power Forecasting System: The Result of the Public-Private-Academic Partnership to Advance Solar Power Forecasting (No. NCAR/TN-526+STR). Natl. Center Atmos. Res. (NCAR) Boulder (CO) Res. Appl. Lab. Weather Syst. Assess. Program (US) 2016. [Google Scholar] [CrossRef]
- Haupt, S.E.; Kosović, B.; Jensen, T.; Lazo, J.K.; Lee, J.A.; Jiménez, P.A.; Cowie, J.; Wiener, G.; McCandless, T.C.; Rogers, M.; et al. Building the Sun4Cast system: Improvements in solar power forecasting. Bull. Am. Meteorol. Soc. 2017, 99, 121–136. [Google Scholar] [CrossRef]
- Kurzrock, F.; Cros, S.; Ming, F.C.; Otkin, J.A.; Hutt, A.; Linguet, L.; Lajoie, G.; Potthast, R. A Review of the Use of Geostationary Satellite Observations in Regional-scale Models for Short-term Cloud Forecasting. Meteorol. Z. 2018, 27, 277–298. [Google Scholar] [CrossRef]
- Cros, S.; Sébastien, N.; Liandrat, O.; Schmutz, N. Cloud pattern prediction from geostationary meteorological satellite images for solar energy forecasting. In Proceedings of the SPIE. Remote Sensing of Clouds and the Atmosphere XIX; and Optics in Atmospheric Propagation and Adaptive Systems XVII, Amsterdam, The Netherlands, 22 and 24– 25 September 2014; p. 924202. [Google Scholar] [CrossRef]
- Lorenz, E.; Kühnert, J.; Heinemann, D. Overview of irradiance and Photovoltaic Power Prediction. In Weather Matters for Energy; Troccoli, A., Dubus, L., Haupt, S.E., Eds.; Springer: New York, NY, USA, 2014; pp. 429–454. [Google Scholar]
- Tanvir, I.; Srivastava, P.K.; Kumar, D.; Petropoulos, G.P.; Dai, Q.; Zhuo, L. Satellite radiance assimilation using a 3DVAR assimilation system for hurricane Sandy forecasts. Nat. Hazards 2016, 82, 845–855. [Google Scholar] [CrossRef][Green Version]
- Yang, C.; Liu, Z.; Bresch, J.; Rizvi, S.R.H.; Huang, X.-Y.; Min, J. AMSR2 all-sky radiance assimilation and its impact on the analysis and forecast of Hurricane Sandy with a limited-area data assimilation system. Tellus 2016, 68A, 30917. [Google Scholar] [CrossRef]
- Xie, Y.; Xing, J.; Shi, J.; Dou, Y.; Lei, Y. Impacts of radiance data assimilation on the Beijing 7.21 heavy rainfall. Atmos. Res. 2016, 169, 318–330. [Google Scholar] [CrossRef]
- Xu, D.; Min, J.; Shen, F.; Ban, J.; Chen, P. Assimilation of MWHS radiance data from the FY-3B satellite with the WRF Hybrid-3DVAR system for the forecasting of binary typhoons. J. Adv. Model. Earth Syst. 2016, 8, 1014–1028. [Google Scholar] [CrossRef]
- Gustafsson, N.; Janji´c, T.; Schraff, C.; Leuenberger, D.; Weissmann, M.; Reich, H.; Brousseau, P.; Montmerle, T.; Wattrelot, E.; Buˇcánek, A.; et al. Survey of data assimilation methods for convective-scale numerical weather prediction at operational centres. Quart. J. R. Meteor. 2018. [Google Scholar] [CrossRef]
- Stengel, M.; Undén, P.; Lindskog, M.; Dahlgren, P.; Gustafsson, N.; Bennartz, R. Assimilation of SEVIRI infrared radiances with HIRLAM 4DVar. Q. J. R. Meteorol. Soc. 2009, 135 Pt B, 2100–2109. [Google Scholar] [CrossRef]
- Stengel, M.; Lindskog, M.; Undén, P.; Gustafsson, N.; Bennartz, R. An extended observation operator in HIRLAM 4D-VAR for the assimilation of cloud-affected satellite radiances. Q. J. R. Meteorol. Soc. 2010, 136, 1064–1074. [Google Scholar] [CrossRef]
- Stengel, M.; Lindskog, M.; Undén, P.; Gustafsson, N. The impact of cloud-affected IR radiances on forecast accuracy of a limited-area NWP model. Q. J. R. Meteorol. Soc. 2013, 139, 2081–2096. [Google Scholar] [CrossRef]
- Yang, C.; Liuz, Z.; Gao, F.; Child, P.P.; Min, J. Impact of assimilation goes imager clear-sky radiance with a rapid refresh assimilation system for convection-permitting forecast over Mexico. J. Geophys. Res. Atmos. 2017, 122, 5472–5490. [Google Scholar] [CrossRef]
- Skamarock, W.C.; Klemp, J.B.; Dudhia, J.; Gill, D.O.; Barker, D.M.; Wang, W.; Powers, J.G. A description of the Advanced Research WRF Version 3; NCAR Technical Note, NCAR/TN-475+STR. 2008. Available online: http://opensky.ucar.edu/islandora/object/technotes:500 (accessed on 25 May 2018).
- Jimenez, P.A.; Hacker, J.P.; Dudhia, J.; Haupt, S.E.; Jose, R.A.; Gueymard, C.A.; Thompson, G.; Eidhammer, T.; Deng, A. WRF-Solar: Description and Clear-Sky Assessment of an Augmented NWP Model for Solar Power Prediction. Bull. Am. Met. Soc. 2016, 97, 1249–1264. [Google Scholar] [CrossRef]
- Thompson, G.; Eidhammer, T. A Study of Aerosol Impacts on Clouds and Precipitation Development in a Large Winter Cyclone. J. Atmos. Sci. 2014, 71, 3636–3658. [Google Scholar] [CrossRef]
- Hong, S.Y.; Noh, Y.; Dudhia, J. A New Vertical Diffusion Package with an Explicit Treatment of Entrainment Processes. Mon. Weather Rev. 2006, 134, 2318–2341. [Google Scholar] [CrossRef]
- Iacono, M.J.; Delamere, J.S.; Mlawer, E.J.; Shephard, M.W.; Clough, S.A.; Collins, W.D. Radiative forcing by long-lived greenhouse gases: Calculations with the AER radiative transfer models. J. Geophys. Res. Atmos. 2008, 113. [Google Scholar] [CrossRef]
- Kain, J.S. The Kain–Fritsch Convective Parameterization: An Update. J. Appl. Meteorol. 2004, 43, 170–181. [Google Scholar] [CrossRef]
- Singh, R.; Ojha, S.P.; Kishtawal, C.M.; Pal, P.K.; Kumar, A.S.K. Impact of the assimilation of INSAT-3D radiances on short-range weather forecasts. Quart. J. R. Meteor. Soc. 2016, 142, 120–131. [Google Scholar] [CrossRef]
- Schmid, J. The SEVIRI Instrument. In Proceedings of the 2000 EUMETSAT Meteorological Satellite. Data User’s Conference, Bologna, Italy, 29 May–2 June 2000; Darmstadt, Germany, EUMETSAT ed (2000). pp. 13–32. [Google Scholar]
- Barker, D.M.; Huang, W.; Guo, Y.-R.; Bourgeois, A.; Xiao, Q. A Three-Dimensional Variational (3DVAR) Data Assimilation System For Use With MM5: Implementation and Initial Results. Mon. Weather Rev. 2004, 132, 897–914. [Google Scholar] [CrossRef]
- Barker, D.; Huang, X.-Y.; Liu, Z.; Auligné, T.; Zhang, X.; Rugg, S.; Ajjaji, R.; Bourgeois, A.; Bray, J.; Chen, Y.; et al. The Weather Research and Forecasting Model’s Community Variational/Ensemble Data Assimilation System: WRFDA. Bull. Am. Meteor Soc. 2012, 93, 831–843. [Google Scholar] [CrossRef]
- Han, Y.; van Delst, P.; Liu, Q.; Weng, F.; Yan, B.; Treadon, R.; Derber, J. Community Radiative Transfer Model (CRTM): Version 1; NOAA Technical Report; NOAA: Washington, DC, USA, 2006; 122p.
- Maiello, I.; Gentile, S.; Ferretti, R.; Baldini, L.; Nicoletta, R.; Picciotti, E.; Alberoni, P.P.; Marzano, F.S. Impact of multiple radar reflectivity data assimilation on the numerical simulation of a flash flood event during the HyMeX campaign. Hydrol. Earth Syst. Sci. 2017, 21, 5459–5476. [Google Scholar] [CrossRef]
- Parrish, D.F.; Derber, J.C. The national meteorological center’s spectral statistical-interpolation analysis system. Mon. Weather Rev. 1992, 120, 1747–1763. [Google Scholar] [CrossRef]
- Steinacker, R.; Haberli, C.; Pottschacher, W. A transparent method for the analysis quality evaluation of irregularly distributed noisy observational data. J. Appl. Meteorol. 2000, 12, 2303–2316. [Google Scholar] [CrossRef]
- Lussana, C.; Uboldi, F.; Salvati, M.R. A spatial consistency test for surface observations from mesoscale meteorological networks. Q. J. R. Meteorol. Soc. 2010, 136, 1075–1088. [Google Scholar] [CrossRef]
- Guide to Meteorological Instruments and Methods of Observation; WMO-No. 8; WMO: Geneva, Switzerland, 2018.
- Reda, I. Method to Calculate Uncertainties in Measuring Shortwave Solar Irradiance Using Thermopile and Semiconductor Solar Radiometers; NREL/TP-3B10-52194; National Renewable Energy Lab.(NREL): Golden, CO, USA, 2011.
- Wilcox, S.M.; Myers, D.R. Evaluation of Radiometers in Full-Time Use at the National Renewable Energy Laboratory Solar Radiation Research Laboratory; NREL/TP-550-44627; National Renewable Energy Lab.(NREL): Golden, CO, USA, 2008.
- MTG-FCI: ATBD for Cloud Mask and Cloud Analysis Product. Doc.No. EUM/MTG/DOC/10/0542, Issue: v3, Date: 17 January 2013 WBS: MTG-834200. Available online: http://www.eumetsat.int (accessed on 27 January 2020).
- MSG Meteorological Products Extraction Facility Algorithm Specification Document. Doc.No., EUM/MSG/SPE/022, Issue: v7B e-signed, Date: 23 October 2015. Available online: http://www.eumetsat.int (accessed on 27 January 2020).
- Lutz, H.J. Cloud processing for Meteosat Second Generation. EUMETSAT Tech. Department Tech. Memo. 1999, 4, 26. Available online: https://www.eumetsat.int/website/wcm/idc/idcplg?IdcService=GET_FILE&dDocName=PDF_TM04_MSG-CLOUD-PROCESSING&RevisionSelectionMethod=LatestReleased&Rendition=Web (accessed on 27 January 2020).
- EUMETSAT, 2018 (I): SAF/OSI/CDOP3/MF/TEC/MA/182, GEO DLI & SSI PUM, 26 February 2018, “Geostationary Radiative Fluxes Product User Manual”. Available online: http://www.osi-saf.org/lml/doc/osisaf_cdop2_ss1_pum_geo_flx.pdf (accessed on 27 January 2020).
- EUMETSAT, 2018 (II): SAF/OSI/CDOP3/MF/SCI/RP/328, Anne Marsouin, Météo-France/CMS, 6 November 2018, “Radiative fluxes validation report for GOES-16 OSI-305-a OSI-306-a Meteosat-11 OSI-303-a OSI-304-a Meteosat-8 OSI-IO-DLI OSI-IO-SSI”. Available online: http://www.osi-saf.org/lml/doc/osisaf_cdop2_ss1_geo_flx_val_rep.pdf (accessed on 27 January 2020).
- Gallucci, D.; Romano, F.; Cimini, D.; Di Paola, F.; Gentile, S.; Larosa, S.; Nilo, S.T.; Ricciardelli, E.; Ripepi, E.; Viggiano, M.; et al. Improvement of Hourly Surface Solar Irradiance Estimation Using MSG Rapid Scanning Service. Remote Sens. 2019, 11, 66. [Google Scholar] [CrossRef]
- Haiden, T.; Trentmann, J. Verification of cloudiness and radiation forecasts in the greater Alpine region. Meteorol. Z. 2015, 25, 3–15. [Google Scholar] [CrossRef]
- Yang, H.; Kleissl, J. Preprocessing WRF initial conditions for coastal stratocumulus forecasting. Sol. Energy 2016, 133, 180–193. [Google Scholar] [CrossRef]
- Yucel, I.; Shuttleworth, W.J.; Pinker, R.T.; Lu, L.; Sorooshian, S. Impact of Ingesting Satellite-Derived Cloud Cover into the Regional Atmospheric Modeling System. Mon. Weather Rev. 2002, 130, 610–628. [Google Scholar] [CrossRef][Green Version]
- Cintineo, R.; Otkin, J.A.; Xue, M.; Kong, F. Evaluating the Performance of Planetary Boundary Layer and Cloud Microphysical Parameterization Schemes in Convection-Permitting Ensemble Forecasts Using Synthetic GOES-13 Satellite Observations. Mon. Weather Rev. 2014, 142, 163–182. [Google Scholar] [CrossRef]
- Bauer, P.; Auligné, T.; Bell, W.; Geer, A.; Guidard, V.; Heilliette, S.; Kazumori, M.; Kim, M.-J.; Liu, E.H.-C.; McNally, A.P.; et al. Satellite cloud and precipitation assimilation at operational NWP centres. Quart. J. R. Meteor. Soc. 2011, 137, 1934–1951. [Google Scholar] [CrossRef]
- Bauer, P.; Ohring, G.; Kummerow, C.; Auligne, T. Assimilating Satellite Observations of Clouds and Precipitation into NWP Models. Bull. Am. Meteor. Soc. 2011, 92, ES25–ES28. [Google Scholar] [CrossRef]
- Bayler, G.M.; Aune, R.M.; Raymond, W.H. NWP Cloud Initialization Using GOES Sounder Data and Improved Modeling of Nonprecipitating Clouds. Mon. Weather Rev. 2000, 128, 3911–3920. [Google Scholar] [CrossRef]
© 2020 by the authors. Licensee MDPI, Basel, Switzerland. This article is an open access article distributed under the terms and conditions of the Creative Commons Attribution (CC BY) license (http://creativecommons.org/licenses/by/4.0/).


