The VEI 2 Christmas 2018 Etna Eruption: A Small But Intense Eruptive Event or the Starting Phase of a Larger One?

 ,
,  ,
,  ,
,  ,
,  ,
,  ,
,  ,
,  ,
,  and
and 
Abstract

1. Introduction
2. Materials and Methods

| Camera Label | Camera Type | Location and Distance from Summit | Model | Field of View |
|---|---|---|---|---|
| ECV | Visible | CUAD, ~27 km SSE, 35 m a.s.l. | Canon VC-C4 [5] | 3–47.5° [5] |
| ECVH | Visible, wide angle | CUAD, ~27 km SSE, 35 m a.s.l. | VIVOTEK | 33°~93° (horizontal), 24°~68° (vertical) |
| EMCT | Thermal | Monte Cagliato, 8.5 km ESE, 1160 m a.s.l. | FLIR A320 [25] | 320 × 240 pixels [25] |
| EMCH | Visible, wide angle | Monte Cagliato, 8.5 km ESE, 1160 m a.s.l. | VIVOTEK | 33°~93° (horizontal), 24°~68° (vertical) |
| EMOT | Thermal | La Montagnola, 3 km, 2600 m a.s.l. | FLIR A320 [5] | 320 × 240 pixels [5] |
| ENT | Thermal | Nicolosi, 15 km S, 730 m a.s.l. | FLIR A40M [5] | 320 × 240 pixels [5] |
| ESR | Thermal | Schiena dell’Asino, ~5 km SSE, 1985 m a.s.l. | FLIR A320 | 320 × 240 pixels |
3. Results
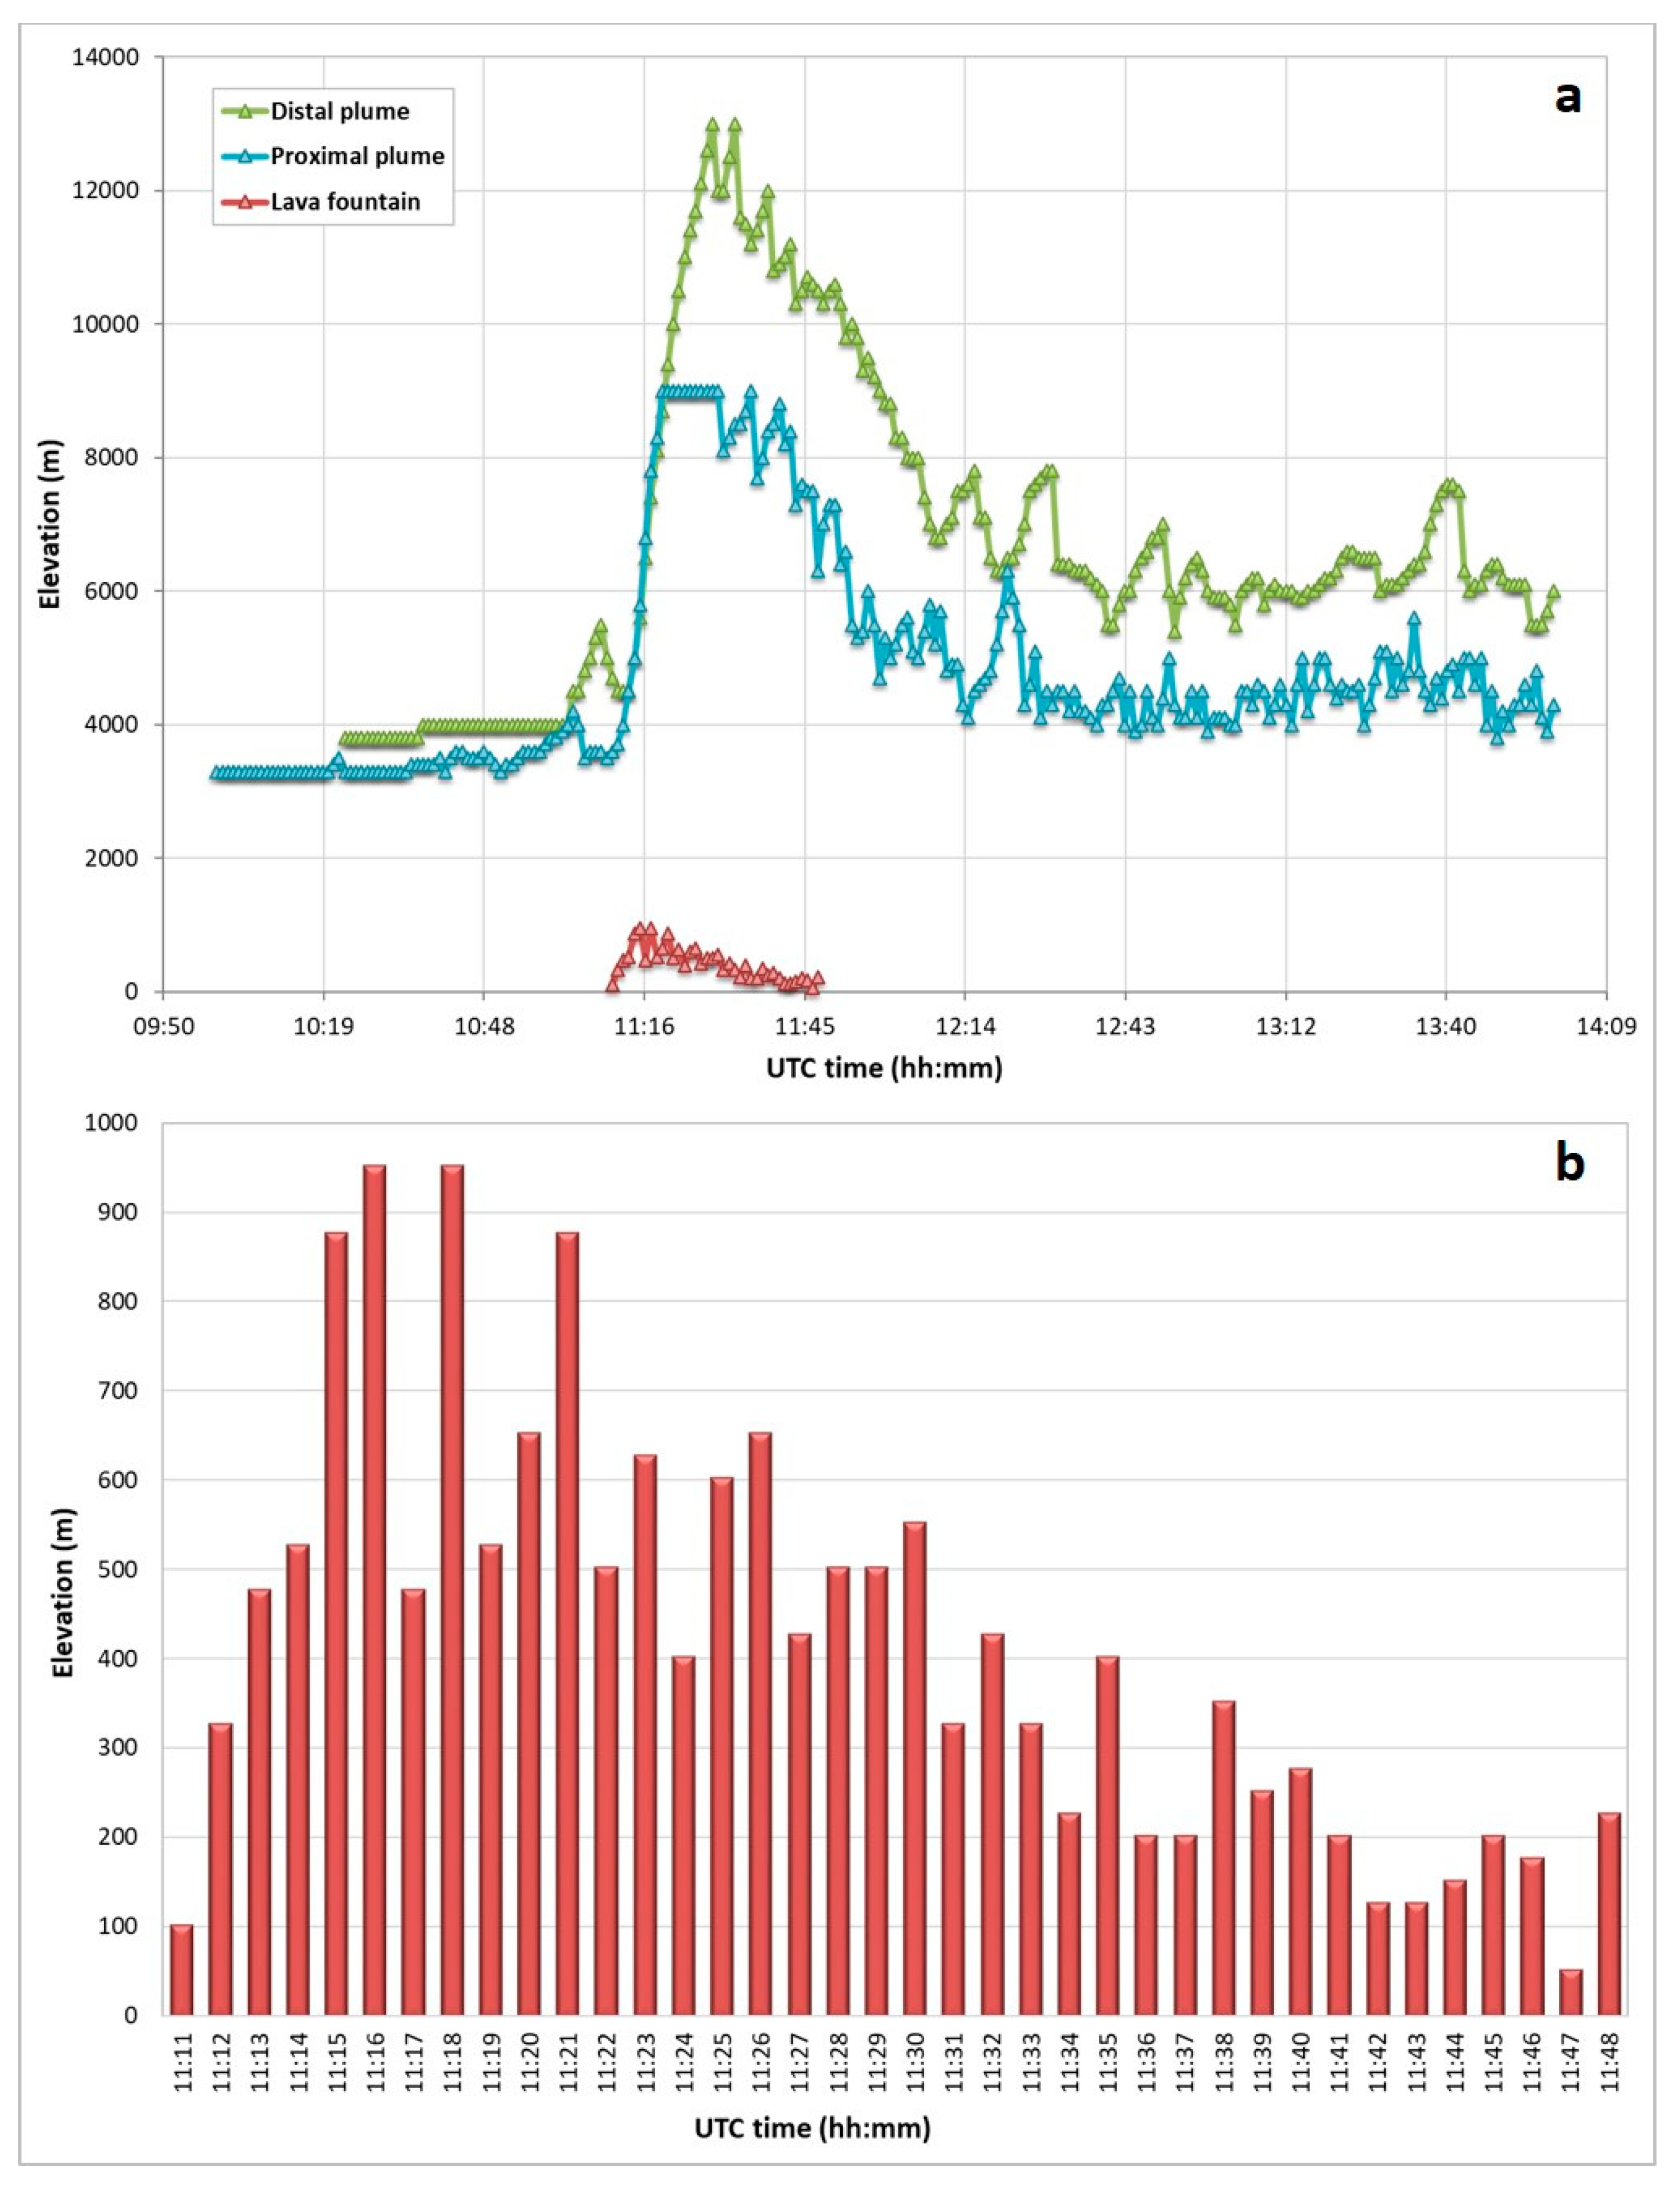
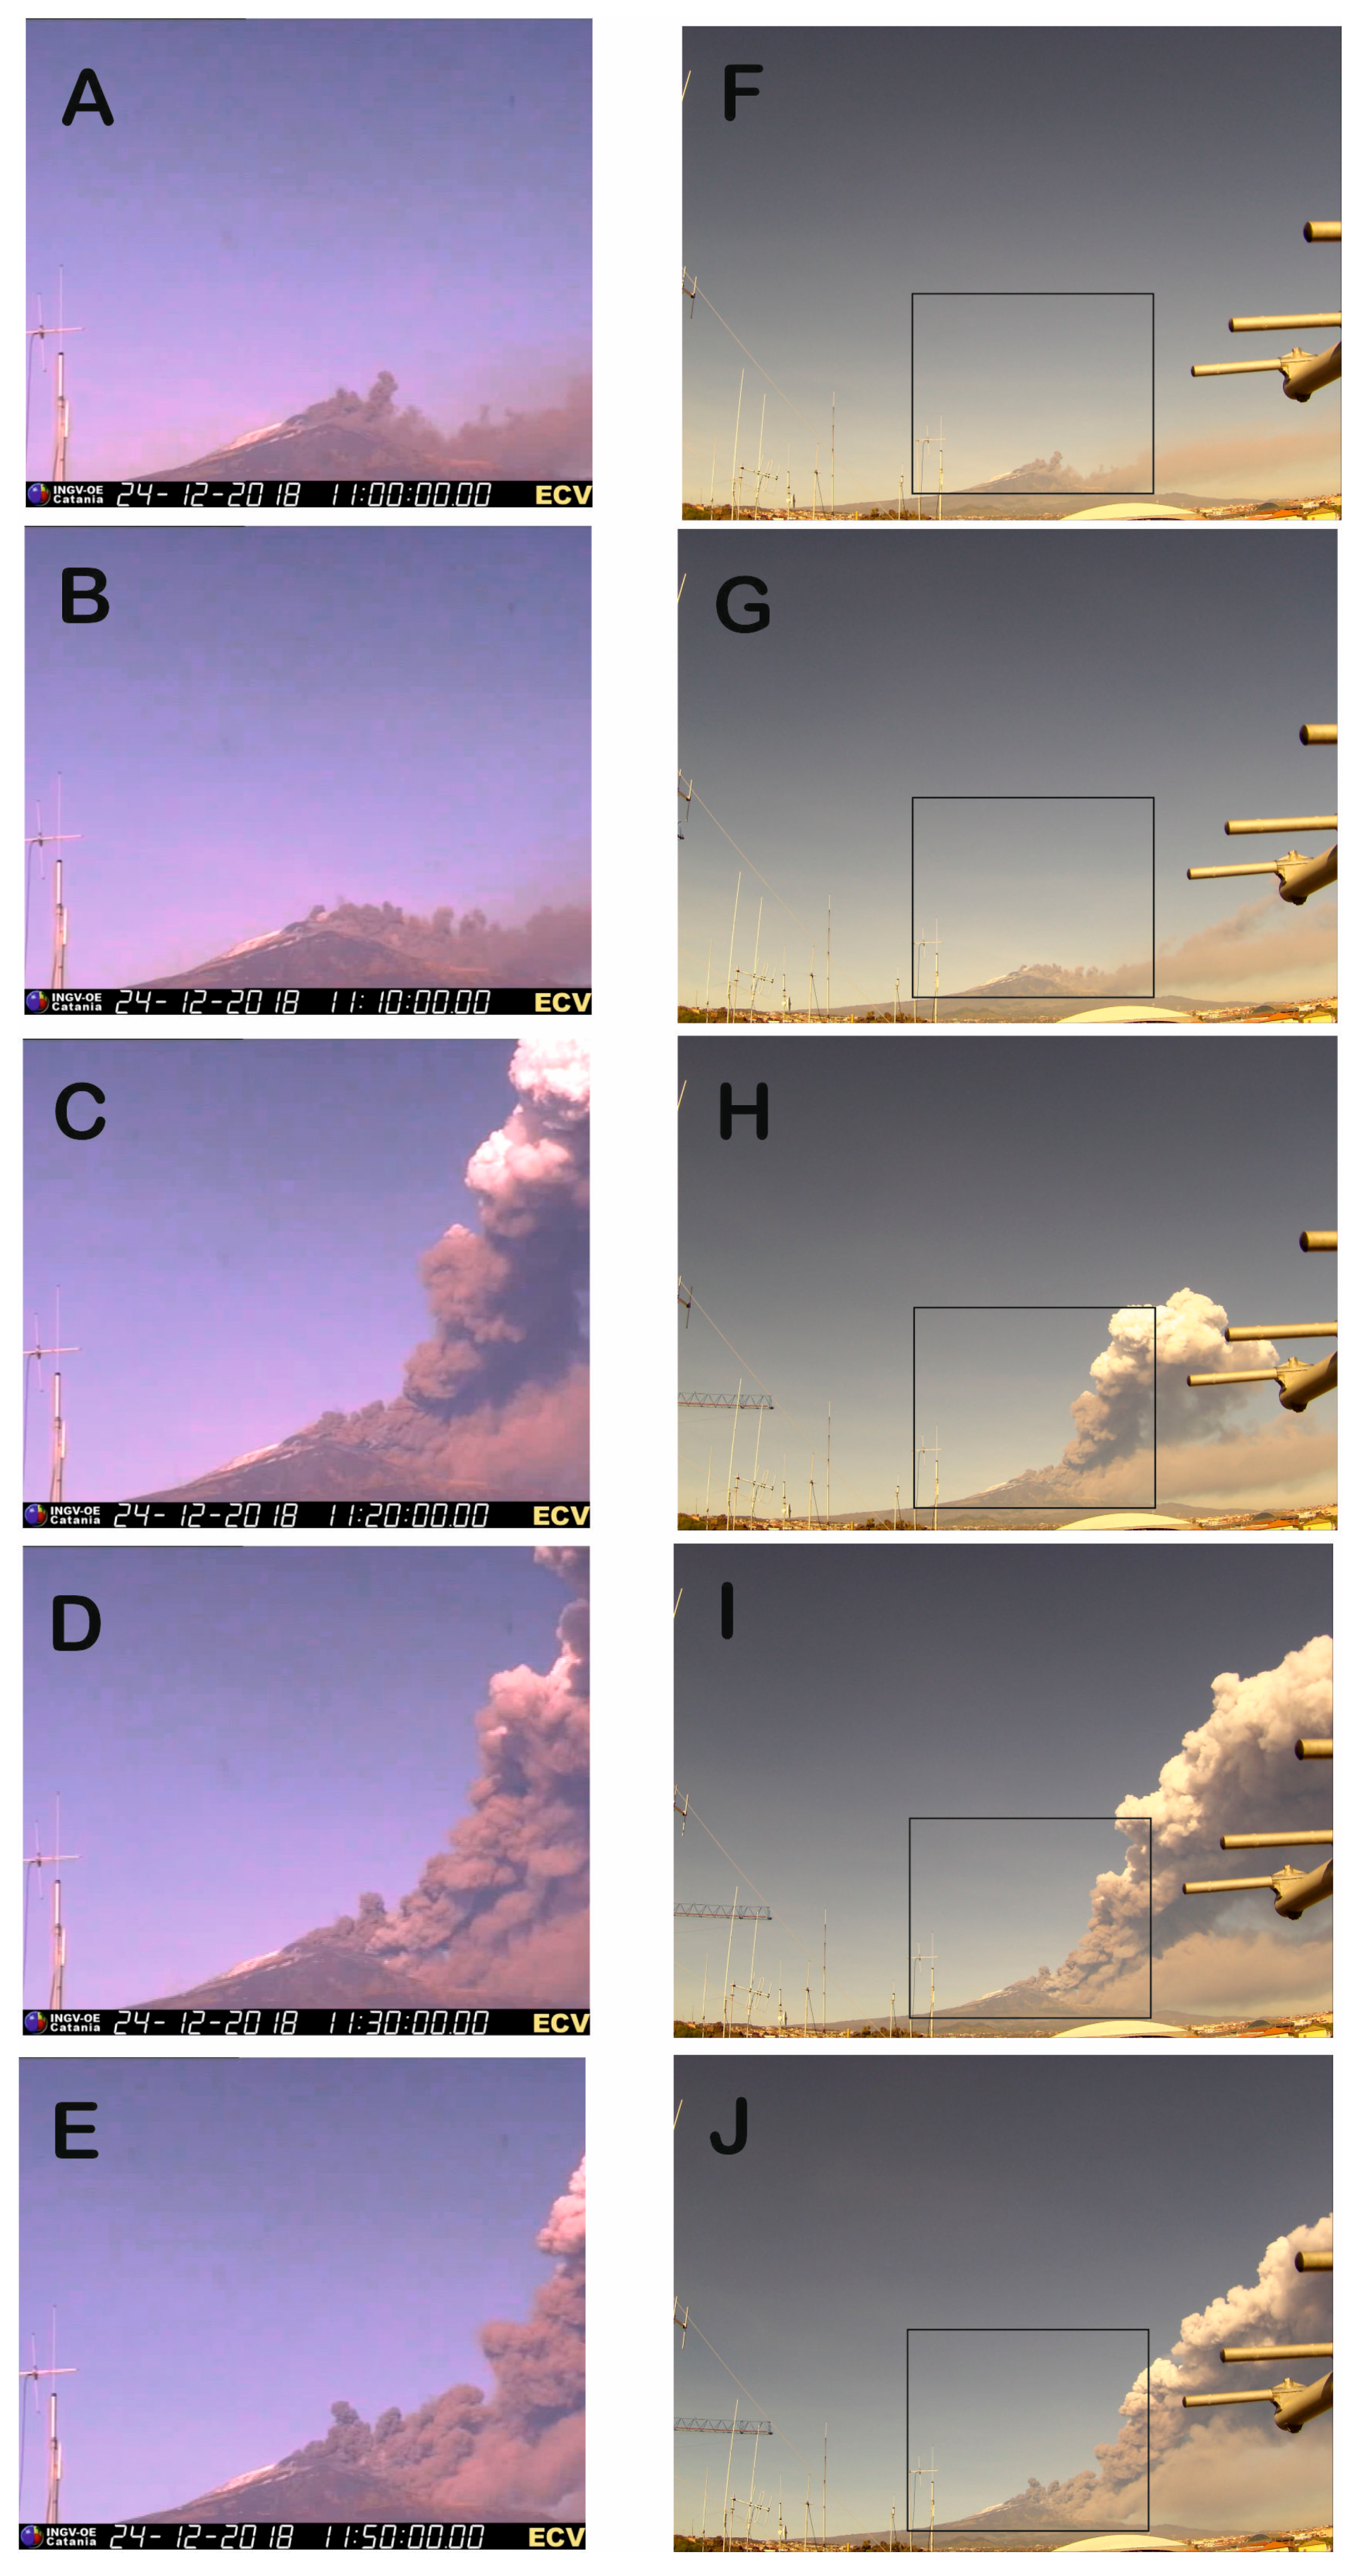
3.1. Ground-Based Monitoring Cameras
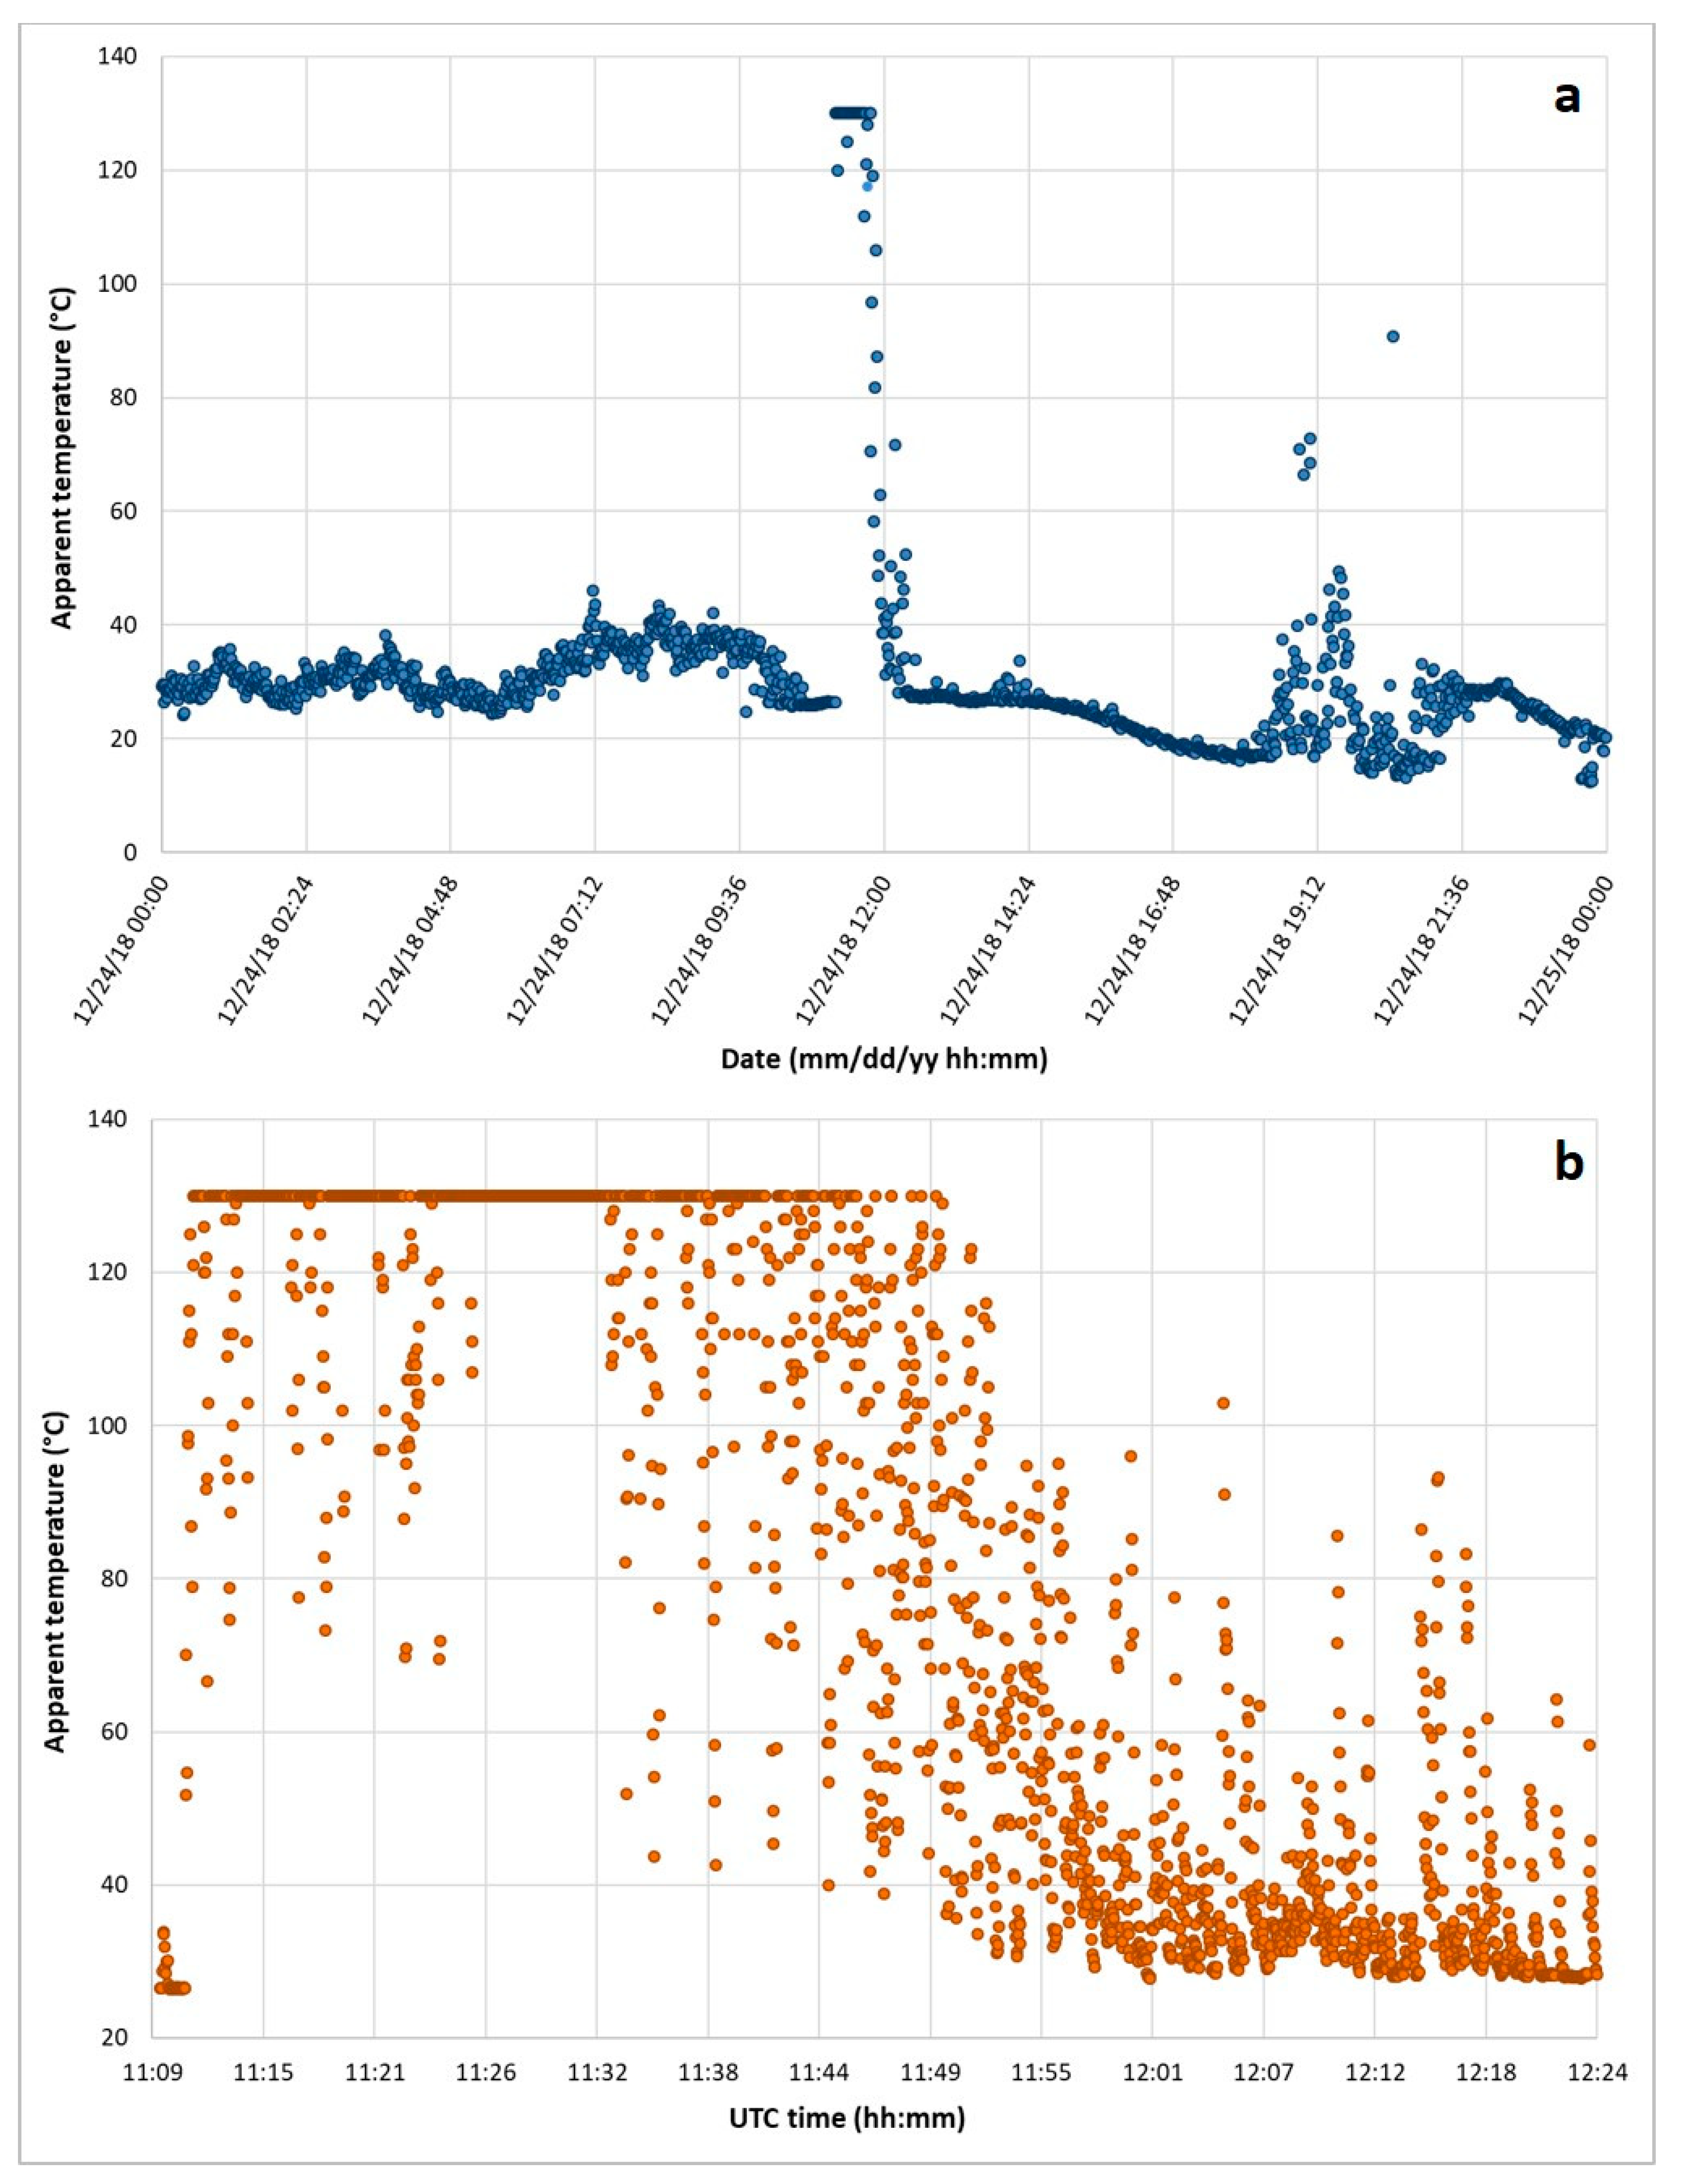
3.2. Radiometry
3.3. Satellite Monitoring
3.4. SO2 Flux from the Summit Craters
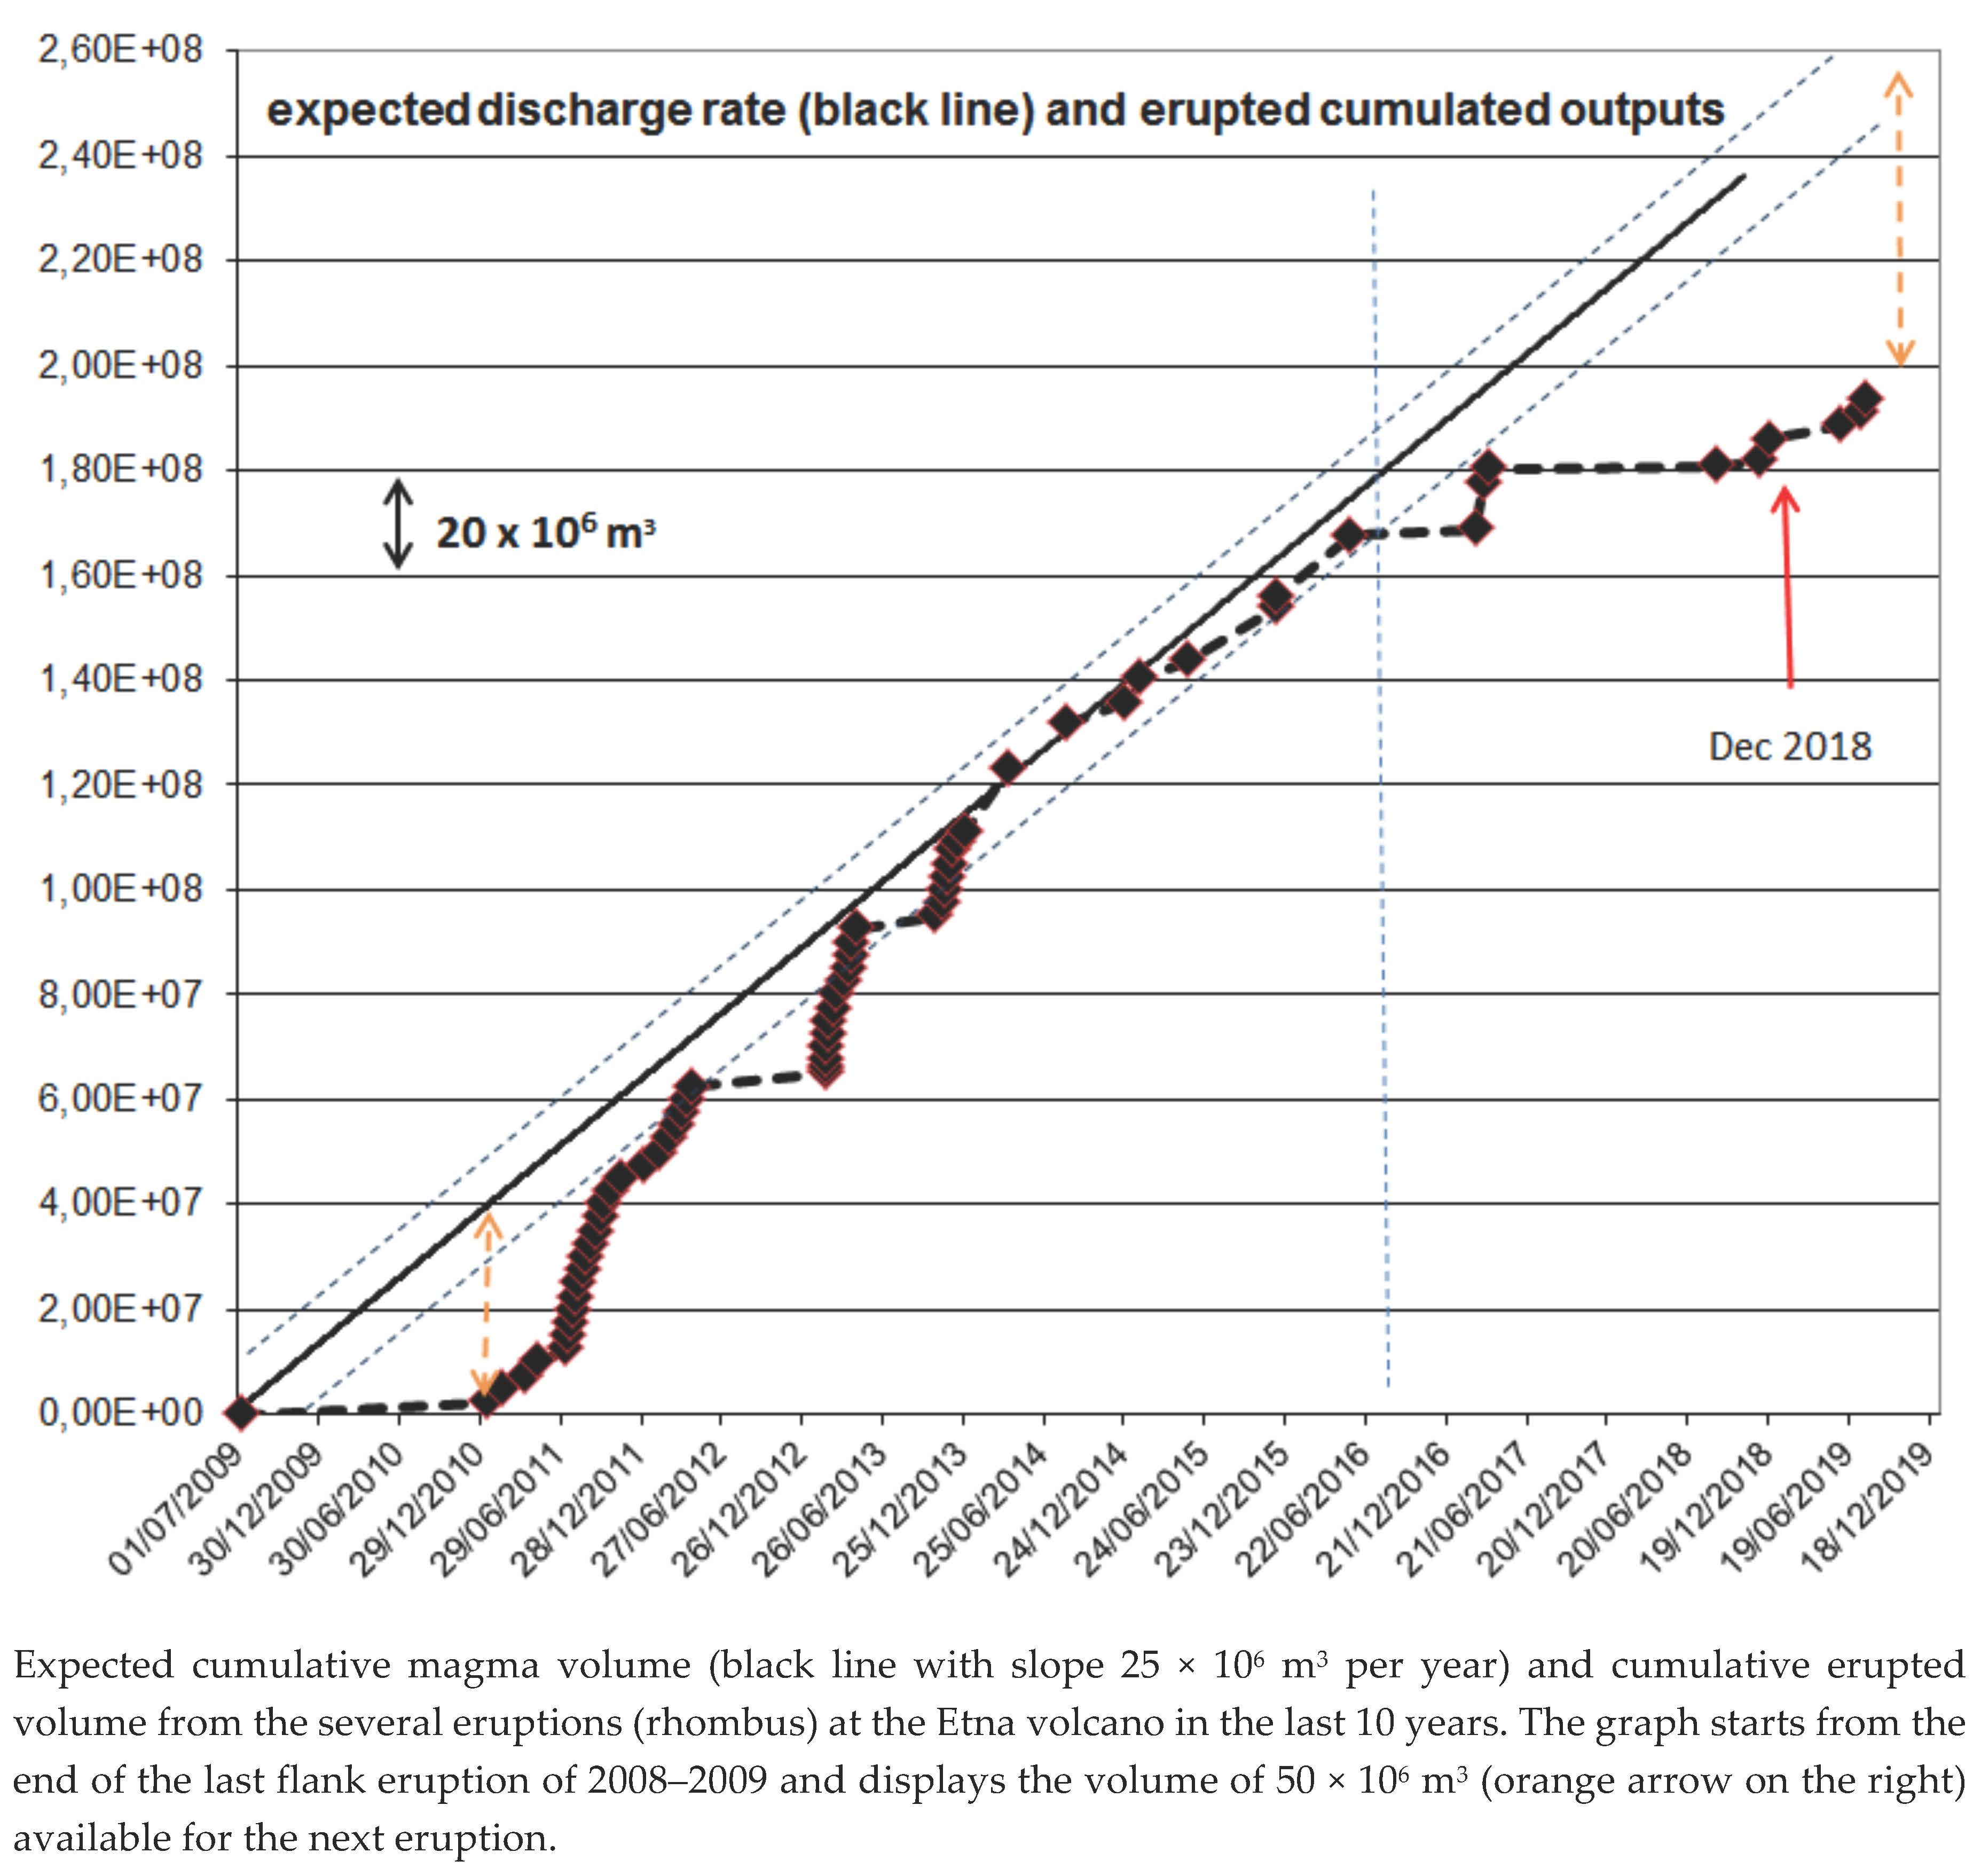
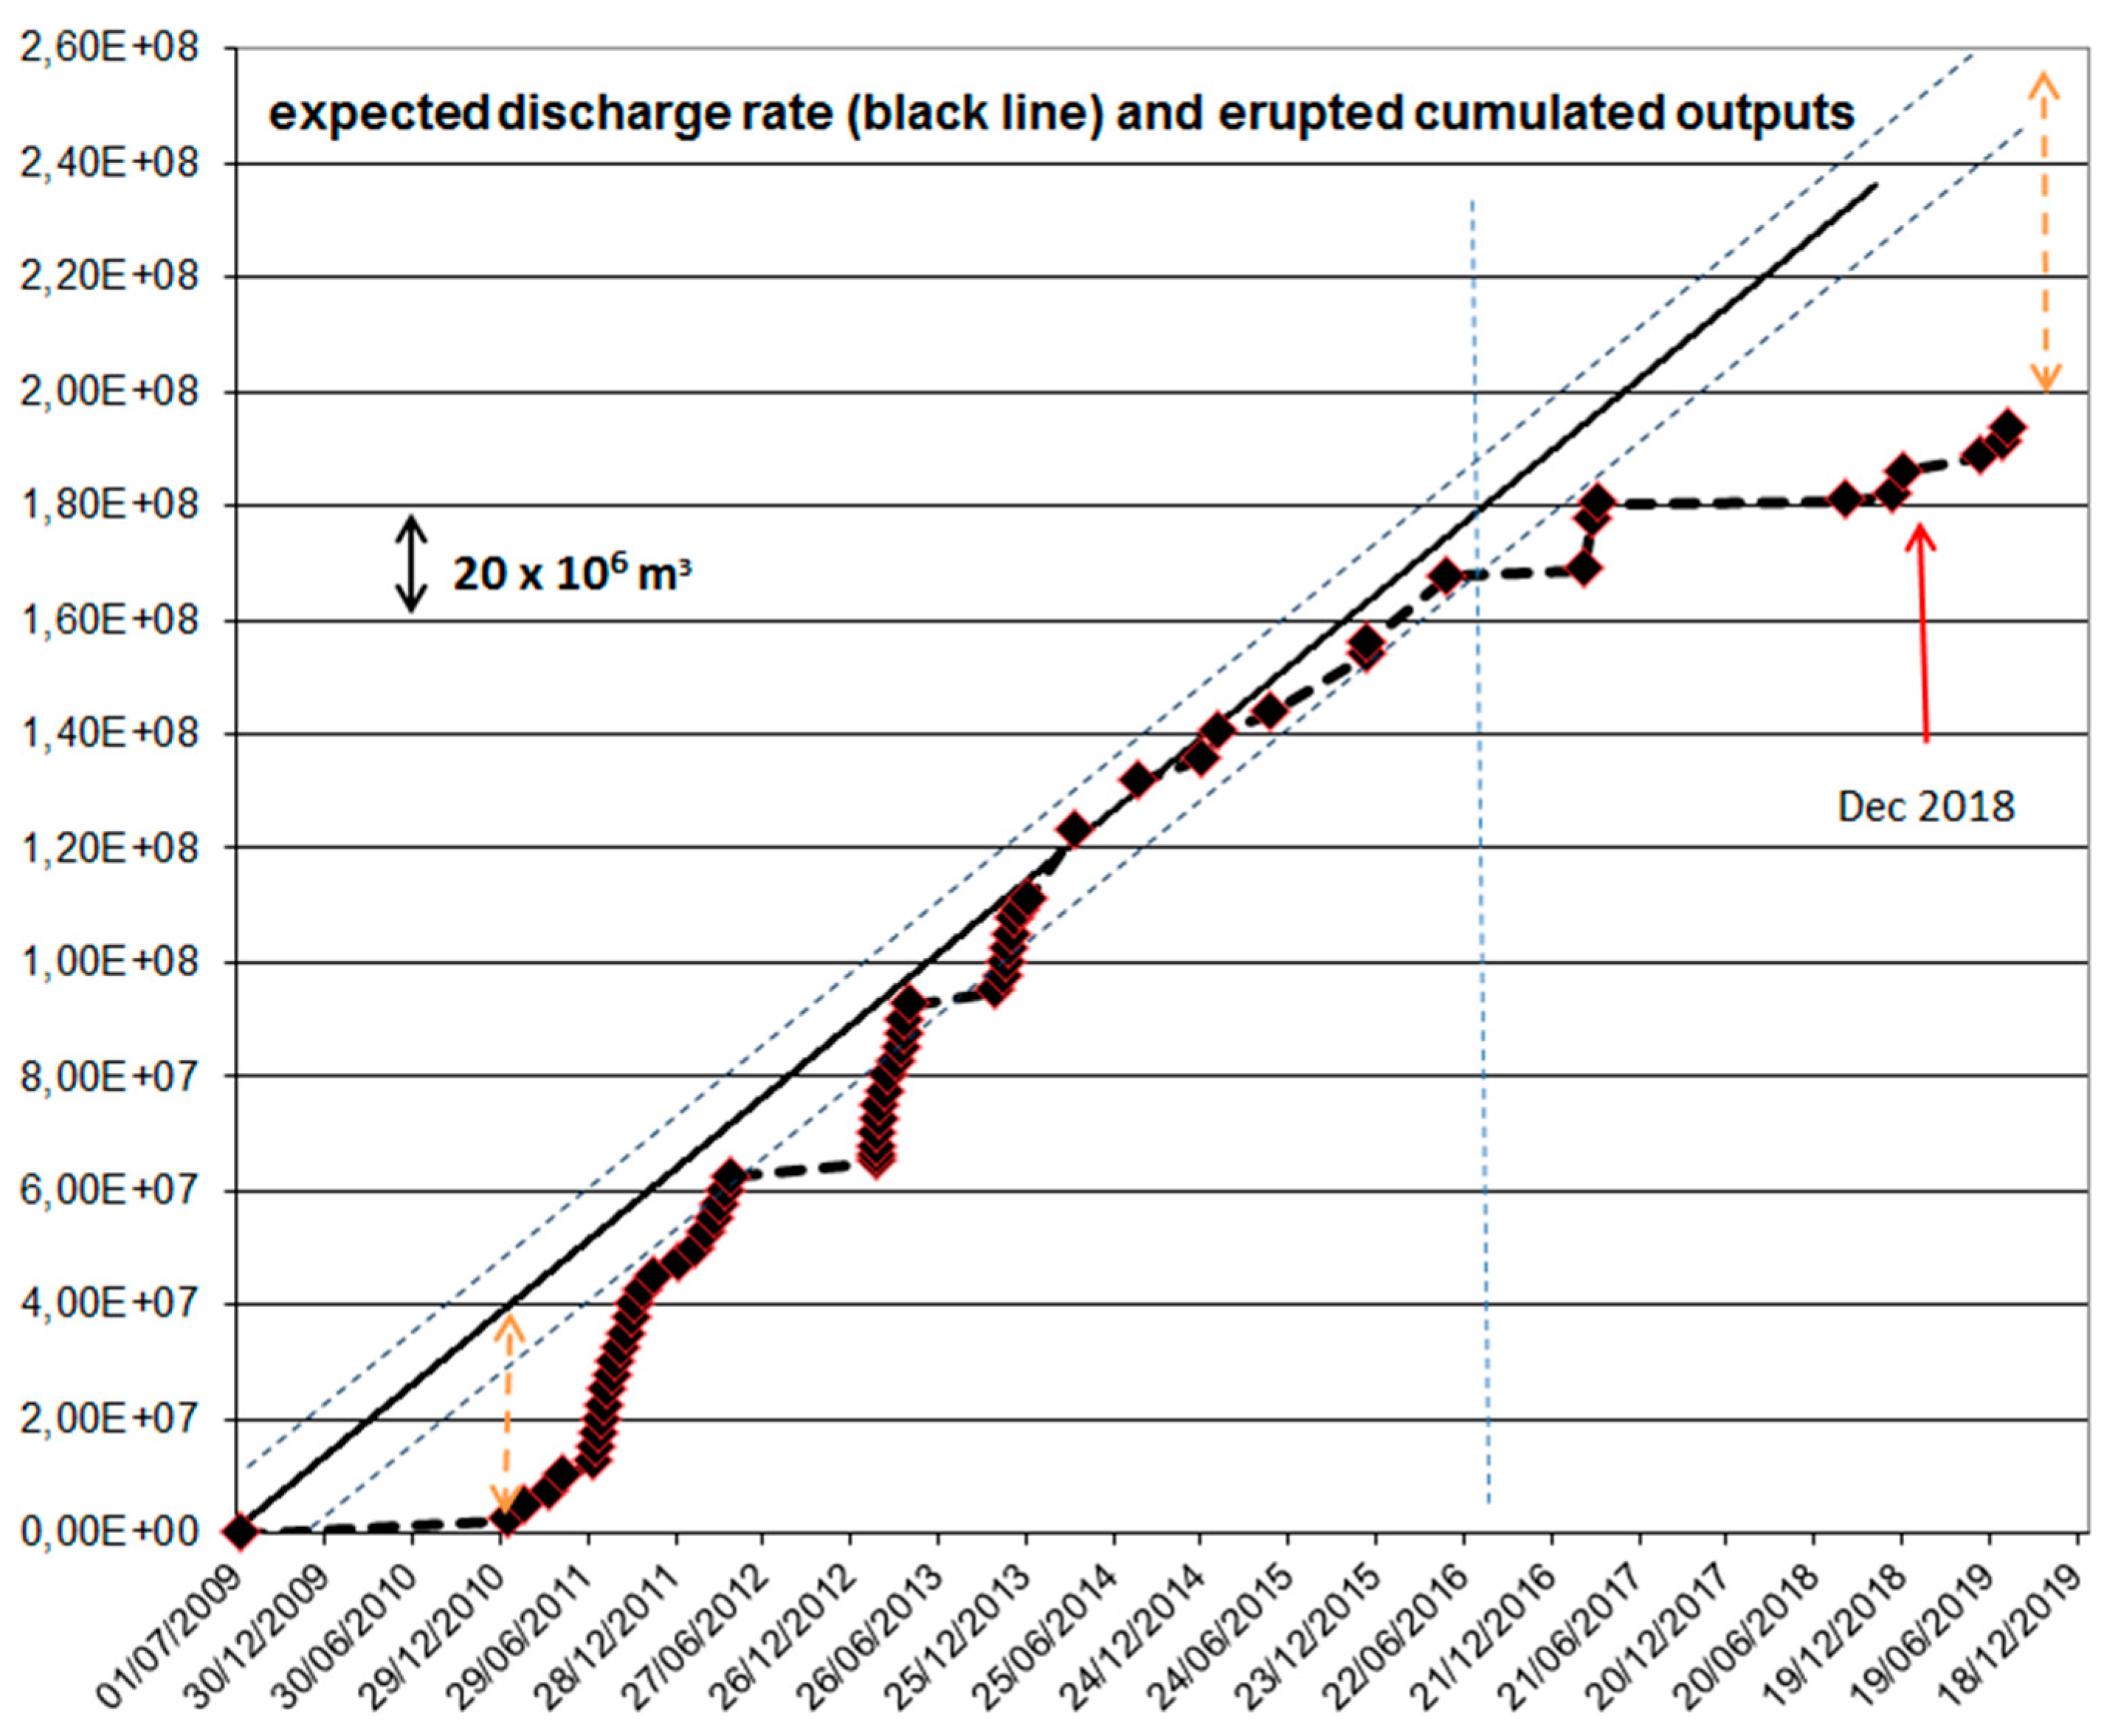
3.5. Estimate of Expected Lava Volumes from An Eruption
4. Discussion
5. Conclusive Remarks
Author Contributions
Funding
Acknowledgments
Conflicts of Interest
References
- Wadge, G.; Guest, J.E. Steady-state magma discharge at Etna 1971–81. Nature 1981, 294, 548–550. [Google Scholar] [CrossRef]
- Harris, A.J.L.; Steffke, A.; Calvari, S.; Spampinato, L. Thirty years of satellite-derived lava discharge rates at Etna: Implications for steady volumetric output. J. Geophys. Res. 2011, 116, B08204. [Google Scholar] [CrossRef]
- Harris, A.J.L.; Steffke, A.; Calvari, S.; Spampinato, L. Correction to “Thirty years of satellite-derived lava discharge rates at Etna: Implications for steady volumetric output”. J. Geophys. Res. 2012, 117, B08207. [Google Scholar] [CrossRef]
- Bonaccorso, A.; Calvari, S. Major effusive eruptions and recent lava fountains: Balance between expected and erupted magma volumes at Etna volcano. Geophys. Res. Lett. 2013, 40, 6069–6073. [Google Scholar] [CrossRef]
- Calvari, S.; Salerno, G.G.; Spampinato, L.; Gouhier, M.; La Spina, A.; Pecora, E.; Harris, A.J.L.; Labazuy, P.; Biale, E.; Boschi, E. An unloading foam model to constrain Etna’s 11–13 January 2011 lava fountaining episode. J. Geophys. Res. Solid Earth 2011, 116. [Google Scholar] [CrossRef]
- Bonaccorso, A.; Calvari, S. A new approach to investigate an eruptive paroxysmal sequence using camera and strainmeter networks: Lessons from the 3–5 December 2015 activity at Etna volcano. Earth Plan. Sci. Lett. 2017, 475, 231–241. [Google Scholar] [CrossRef]
- Calvari, S.; Cannavò, F.; Bonaccorso, A.; Spampinato, L.; Pellegrino, A.G. Paroxysmal Explosions, Lava Fountains and Ash Plumes at Etna Volcano: Eruptive Processes and Hazard Implications. Front. Earth Sci. 2018, 6, 107. [Google Scholar] [CrossRef]
- Ganci, G.; Harris, A.J.; Del Negro, C.; Guéhenneux, Y.; Cappello, A.; Labazuy, P.; Calvari, S.; Gouhier, M. A year of lava fountaining at Etna: Volumes from SEVIRI. Geophys. Res. Lett. 2012, 39, L06305. [Google Scholar] [CrossRef]
- Cappello, A.; Ganci, G.; Bilotta, G.; Corradino, C.; Herault, A.; Del Negro, C. Changing eruptive styles at the South-East Crater of Mount Etna: Implications for assessing lava flow hazards. Front. Earth Sci. 2019, 7, 213. [Google Scholar] [CrossRef]
- Bonaccorso, A.; Bonforte, A.; Calvari, S.; Del Negro, C.; Di Grazia, G.; Ganci, G.; Neri, M.; Vicari, A.; Boschi, E. The initial phases of the 2008–2009 Mount Etna eruption: A multidisciplinary approach for hazard assessment. J. Geophys. Res. 2011, 116, B03203. [Google Scholar] [CrossRef]
- Ganci, G.; Vicari, A.; Cappello, A.; Del Negro, C. An emergent strategy for volcano hazard assessment: From thermal satellite monitoring to lava flow modeling. Remote Sens. Environ. 2012, 119, 197–207. [Google Scholar] [CrossRef]
- Marchese, F.; Genzano, N.; Neri, M.; Falconieri, A.; Mazzeo, G.; Pergola, N. A multi-channel algorithm for mapping volcanic thermal anomalies by means of sentinel-2 MSI and landsat-8 OLI data. Remote Sens. 2019, 11, 2876. [Google Scholar] [CrossRef]
- Cannavò, F.; Sciotto, M.; Cannata, A.; Di Grazia, G. An Integrated Geophysical Approach to Track Magma Intrusion: The 2018 Christmas Eve Eruption at Mount Etna. Geophys. Res. Lett. 2019, 46, 8009–8017. [Google Scholar] [CrossRef]
- Laiolo, M.; Ripepe, M.; Cigolini, C.; Coppola, D.; Della Schiava, M.; Genco, R.; Innocenti, L.; Lacanna, G.; Marchetti, E.; Massimetti, F.; et al. Space- and ground-based geophysical data tracking of magma migration in shallow feeding system of mount Etna volcano. Remote Sens. 2019, 11, 1182. [Google Scholar] [CrossRef]
- Etna, Bollettini Settimanali, Rep. N° 49–52/2018. Available online: www.ct.ingv.it (accessed on 2 January 2020).
- Bonforte, A.; Guglielmino, F.; Puglisi, G. Large dyke intrusion and small eruption: The December 24, 2018 Mt. Etna eruption imaged by Sentinel-1 data. Terra Nova 2019, 31, 405–412. [Google Scholar] [CrossRef]
- De Novellis, V.; Atzori, S.; De Luca, C.; Manzo, M.; Valerio, E.; Bonano, M.; Cardaci, C.; Castaldo, R.; Di Bucci, D.; Manunta, M.; et al. DInSAR analysis and analytical modeling of Mount Etna displacements: The December 2018 volcano-tectonic crisis. Geophys. Res. Lett. 2019, 46. [Google Scholar] [CrossRef]
- Allard, P.; Behncke, B.; D’Amico, S.; Neri, M.; Gambino, S. Mount Etna 1993–2005: Anatomy of an Evolving Eruptive Cycle. Earth-Sci. Rev. 2006, 78, 85–114. [Google Scholar] [CrossRef]
- Bonaccorso, A.; Calvari, S.; Boschi, E. Hazard mitigation and crisis management during major flank eruptions at Etna volcano: Reporting on real experience. Geol. Soc. Lond. Spec. Publ. 2016, 426, 447–461. [Google Scholar] [CrossRef]
- Del Negro, C.; Cappello, A.; Bilotta, G.; Ganci, G.; Hérault, A.; Zago, V. Living at the edge of an active volcano: Risk from lava flows on Mt. Etna. GSA Bull. 2019. [Google Scholar] [CrossRef]
- Scollo, S.; Prestifilippo, M.; Pecora, E.; Corradini, S.; Merucci, L.; Spata, G.; Coltelli, M. Eruption column height estimation of the 2011- 2013 Etna lava fountains. Ann. Geophys. 2014, 77, S0214. [Google Scholar] [CrossRef]
- Newhall, C.G.; Self, S. The volcanic explosivity index (VEI): An estimate of explosive magnitude for historical volcanism. J. Geophys. Res. 1982, 87, 1231–1238. [Google Scholar] [CrossRef]
- Harris, A.J.L.; Dehn, J.; Calvari, S. Lava effusion rate definition and measurement: A review. Bull. Volcanol. 2007, 70, 1–22. [Google Scholar] [CrossRef]
- Walker, G.P.L. The Taupo pumice: Product of the most powerful known (Ultraplinian) eruption? J. Volcanol. Geoth. Res. 1980, 8, 69–94. [Google Scholar] [CrossRef]
- Ganci, G.; James, M.R.; Calvari, S.; Del Negro, C. Separating the thermal fingerprints of lava flows and simultaneous lava fountaining using ground-based thermal camera and SEVIRI measurements. Geophys. Res. Lett. 2013, 40. [Google Scholar] [CrossRef]
- Ganci, G.; Vicari, A.; Bonfiglio, S.; Gallo, G.; Del Negro, C. A texton-based cloud detection algorithm for MSG-SEVIRI multispectral images. Geomat. Nat. Hazards Risk 2011, 2, 279–290. [Google Scholar] [CrossRef]
- Ganci, G.; Vicari, A.; Fortuna, L.; Del Negro, C. The HOTSAT volcano monitoring system based on a combined use of SEVIRI and MODIS multispectral data. Ann. Geophys. 2011, 54, 5. [Google Scholar] [CrossRef]
- Wooster, M.J.; Zhukov, B.; Oertel, D. Fire radiative energy for quantitative study of biomass burning: Derivation from the BIRD experimental satellite and comparison to MODIS fire products. Remote Sens. Environ. 2003, 86, 83–107. [Google Scholar] [CrossRef]
- Ganci, G.; Bilotta, G.; Cappello, A.; Hérault, A.; Del Negro, C. HOTSAT: A multiplatform system for the satellite thermal monitoring of volcanic activity. Geol. Soc. Lond. Spec. Publ. 2016, 426, 207–221. [Google Scholar] [CrossRef]
- Ganci, G.; Cappello, A.; Bilotta, G.; Del Negro, C. How the variety of satellite remote sensing data over volcanoes can assist hazard monitoring efforts: The 2011 eruption of Nabro volcano. Remote Sens. Environ. 2020, 236, 111426. [Google Scholar] [CrossRef]
- Spampinato, L.; Sciotto, M.; Cannata, A.; Cannavò, F.; La Spina, A.; Palano, M.; Salerno, G.G.; Privitera, E.; Caltabiano, T. Multiparametric study of the February–April 2013 paroxysmal phase of Mt. Etna New South-East crater. Geochem. Geophys. Geosystems 2015, 16, 1932–1949. [Google Scholar] [CrossRef]
- Bombrum, M.; Spampinato, L.; Harris, A.; Barra, V.; Caltabiano, T. On the transition from strombolian to fountaining activity: A thermal energy-based driver. Bull. Volcanol. 2016, 78, 15. [Google Scholar] [CrossRef]
- Spampinato, L.; Calvari, S.; Oppenheimer, C.; Boschi, E. Volcano surveillance using infrared cameras. Earth Sci. Rev. 2011, 106, 63–91. [Google Scholar] [CrossRef]
- Salerno, G.G.; Burton, M.R.; Oppenheimer, C.; Caltabiano, T.; Randazzo, D.; Bruno, N. Three-years of SO2 flux measurements of Mt. Etna using an automated UV scanner array: Comparison with conventional traverses and uncertainties in flux retrieval. J. Volcanol. Geotherm. Res. 2009, 183, 76–83. [Google Scholar] [CrossRef]
- Salerno, G.G.; Burton, M.; Di Grazia, G.; Caltabiano, T.; Oppenheimer, C. Coupling between magmatic degassing and volcanic tremor in basaltic volcanism. Front. Earth Sci. 2018, 6, 157. [Google Scholar] [CrossRef]
- Platt, U.; Stutz, J. Differential Optical Absorption Spectroscopy: Principles and Applications; Springer: Berlin/Heidelberg, Germany, 2008; pp. 1610–1677. [Google Scholar]
- Salerno, G.G.; Burton, M.R.; Oppenheimer, C.; Caltabiano, T.; Tsanev, V.; Bruno, N. Novel retrieval of volcanic SO2 abundance from ultraviolet spectra. J. Volcanol. Geotherm. Res. 2009, 181, 141–153. [Google Scholar] [CrossRef]
- Campion, R.; Salerno, G.G.; Coheur, P.-F.; Hurtmans, D.; Clarisse, L.; Kazahaya, K.; Burton, M.; Caltabiano, T.; Clerbaux, C.; Bernard, A. Measuring volcanic degassing of SO2 in the lower troposphere with ASTER band ratios. J. Volcanol. Geotherm. Res. 2010, 194, 42–54. [Google Scholar] [CrossRef]
- Andronico, D.; Branca, S.; Calvari, S.; Burton, M.R.; Caltabiano, T.; Corsaro, R.A.; Del Carlo, P.; Garfì, G.; Lodato, L.; Miraglia, L.; et al. A multi-disciplinary study of the 2002–03 Etna eruption: Insights for into a complex plumbing system. Bull. Volcanol. 2005, 67, 314–330. [Google Scholar] [CrossRef]
- Behncke, B.; Calvari, S.; Giammanco, S.; Neri, M.; Pinkerton, H. Pyroclastic density currents resulting from the interaction of basaltic magma with hydrothermally altered rock: An example from the 2006 summit eruptions of Mount Etna, Italy. Bull. Volcanol. 2008, 70, 1249–1268. [Google Scholar] [CrossRef]
- Neri, M.; Acocella, V.; Behncke, B.; Giammanco, S.; Mazzarini, F.; Rust, D. Structural analysis of the eruptive fissures at Mount Etna (Italy). Ann. Geophys. 2011, 54. [Google Scholar] [CrossRef]
- Corradino, C.; Ganci, G.; Cappello, A.; Bilotta, G.; Hérault, A.; Del Negro, C. Mapping recent lava flows at Mount Etna using multispectral sentinel-2 images and machine learning techniques. Remote Sens. 2019, 11, 1916. [Google Scholar] [CrossRef]
- Scudero, S.; De Guidi, G.; Gudmundsson, A. Size distributions of fractures, dykes, and eruptions on Etna, Italy: Implications for magma-chamber volume and eruption potential. Sci. Rep. 2019, 9, 4139. [Google Scholar] [CrossRef] [PubMed]
- Bonaccorso, A.; Currenti, G.; Linde, A.; Sacks, S.; Sicali, A. Advances in understanding intrusive, explosive and effusive processes as revealed by the borehole dilatometer network on Mt. Etna volcano. Front. Earth Sci. 2020, 7, 357. [Google Scholar] [CrossRef]
- Calvari, S.; Spampinato, L.; Lodato, L. The 5 April 2003 vulcanian paroxysmal explosion at Stromboli volcano (Italy) from field observations and thermal data. J. Volcanol. Geotherm. Res. 2006, 149, 160–175. [Google Scholar] [CrossRef]
- Bonaccorso, A.; Calvari, S.; Linde, A.; Sacks, S.; Boschi, E. Dynamics of the shallow plumbing system investigated from borehole strainmeters and cameras during the 15 March 2007 Vulcanian paroxysm at Stromboli volcano. Earth Plan. Sci. Lett. 2012, 357–358, 249–256. [Google Scholar] [CrossRef]
- Andronico, D.; Taddeucci, J.; Cristaldi, A.; Miraglia, L.; Scarlato, P.; Gaeta, M. The 15 March 2007 paroxysm of Stromboli: Video-image analysis, and textural and compositional features of the erupted deposit. Bull. Volcanol. 2013, 75, 733. [Google Scholar] [CrossRef]
- Jaupart, C.; Vergniolle, S. Laboratory models of Hawaiian and Strombolian eruptions. Nature 1988, 331, 58–60. [Google Scholar] [CrossRef]
- Allard, P.; Burton, M.; Muré, F. Spectroscopic evidence for a lava fountain driven by previously accumulated magmatic gas. Nature 2005, 433, 407–410. [Google Scholar] [CrossRef]
- Aloisi, M.; Bonaccorso, A.; Cannavò, F.; Gambino, S.; Mattia, M.; Puglisi, G.; Boschi, E. A new dyke intrusion style for the Mount Etna May 2008 eruption modelled through continuous tilt and GPS data. Terra Nova 2009, 21, 316–321. [Google Scholar] [CrossRef]


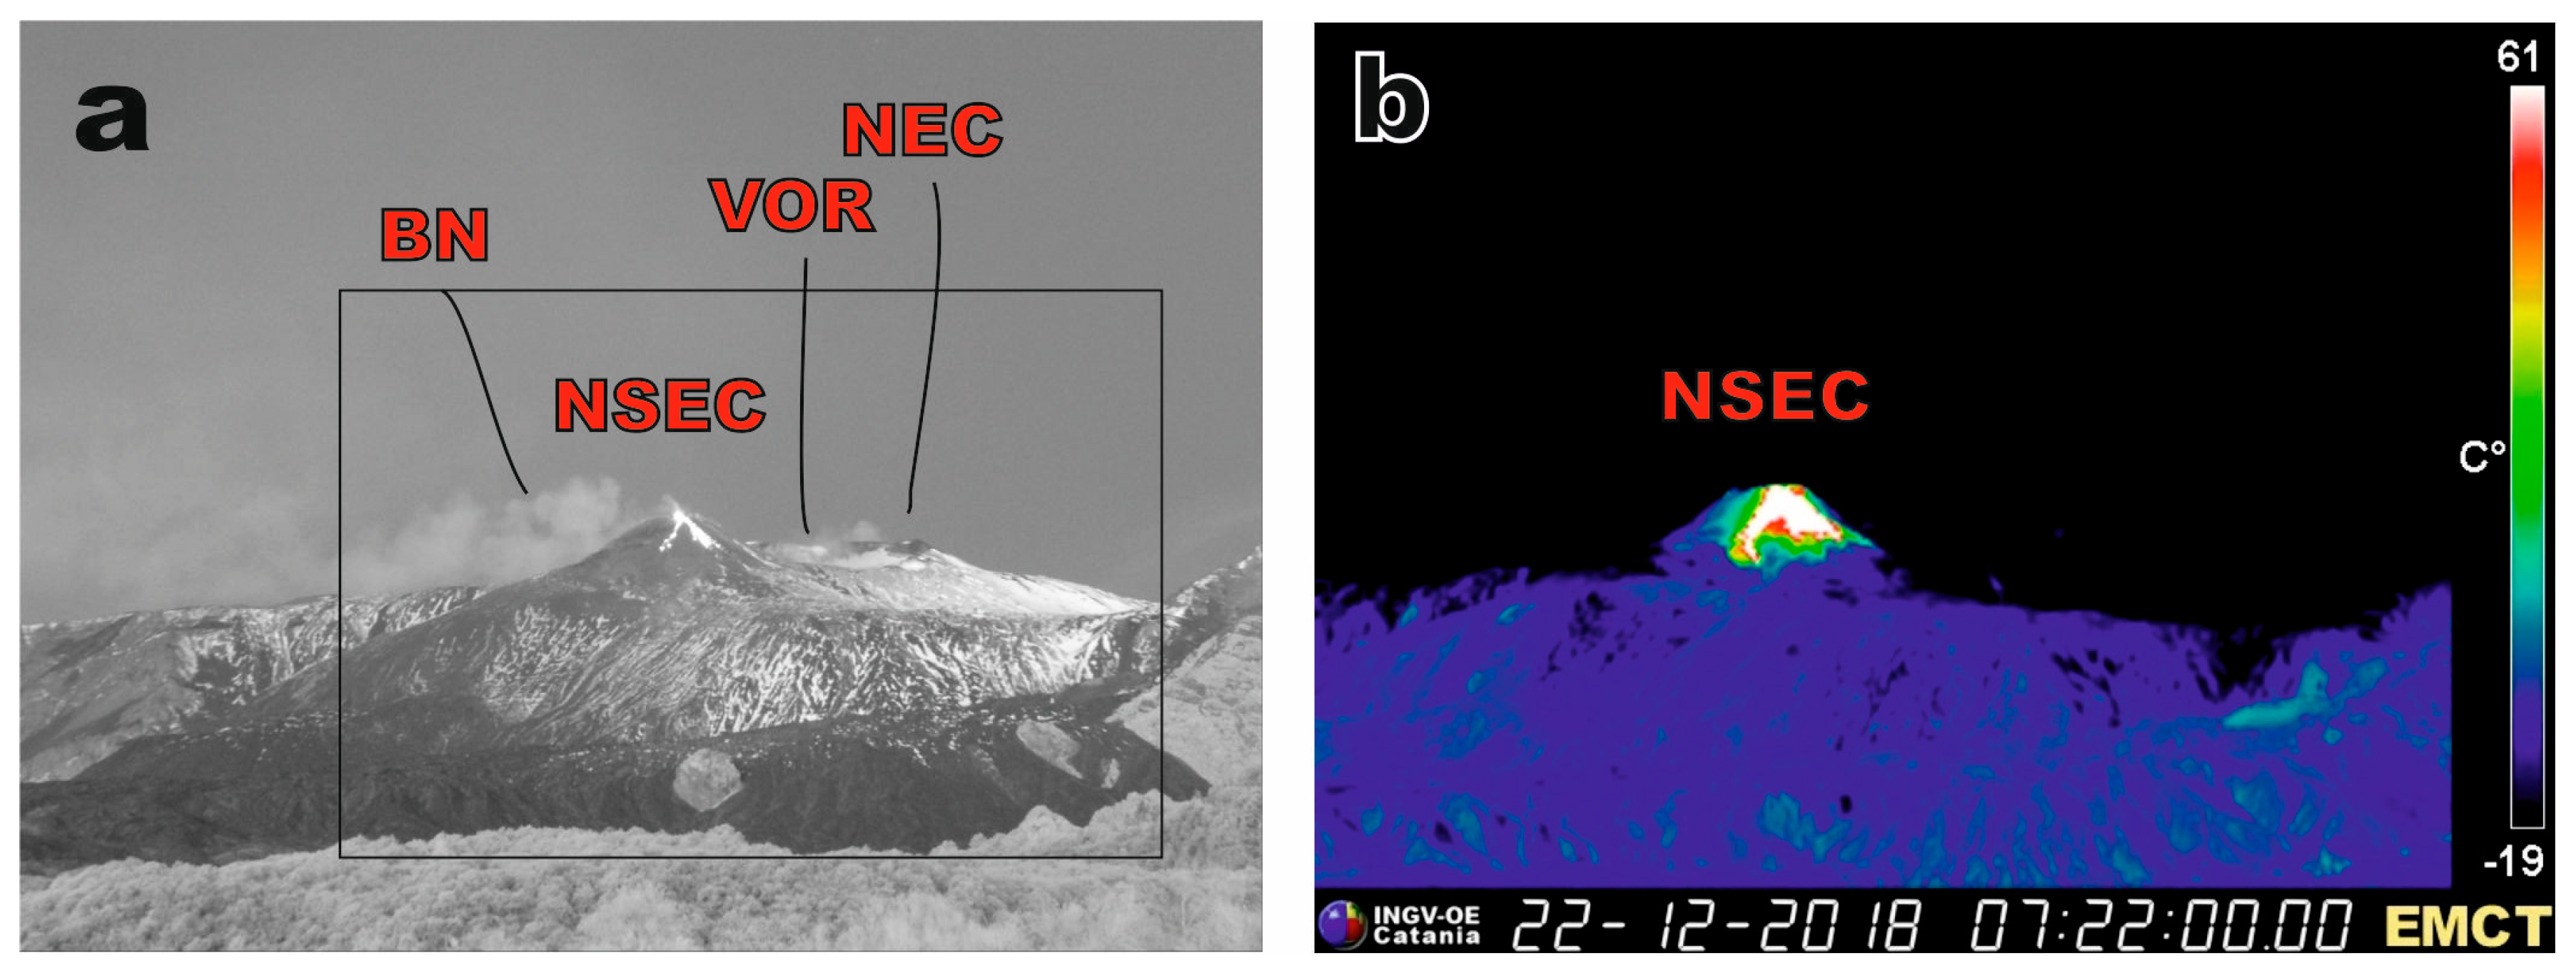
| Time (UT) | Crater | Eruptive Activity | Notes |
|---|---|---|---|
| 05:50 | NSEC | Weak Strombolian activity from the summit and small lava flows on the ENE flank of the cone | Strombolian activity and lava flows |
| 07:38 | BN + NEC | Intense puff of white vapor | Intense degassing |
| 09:51 | BN | Pulse of black ash emission suddenly dispersed by the wind | Strombolian explosion |
| 09:58 | BN | Pulse of black ash emission suddenly dispersed by the wind | Strombolian explosion |
| 10:03-10:22 | BN | Diluted and continuous emission of pink ash | Landslides within the crater |
| 10:22-10:30 | BN | Pulses of white vapor emission overlap to the continuous emission of pink ash | Intense degassing and landslides |
| 10:41 | NEC | Black ash emission | Deep explosions? |
| 10:42 | BN + NEC | Pink ash emission | Intense degassing and landslides |
| 10:55-13:00 | BN | Start of black ash plume with pulsating eruptive phase from two vents | Strombolian activity |
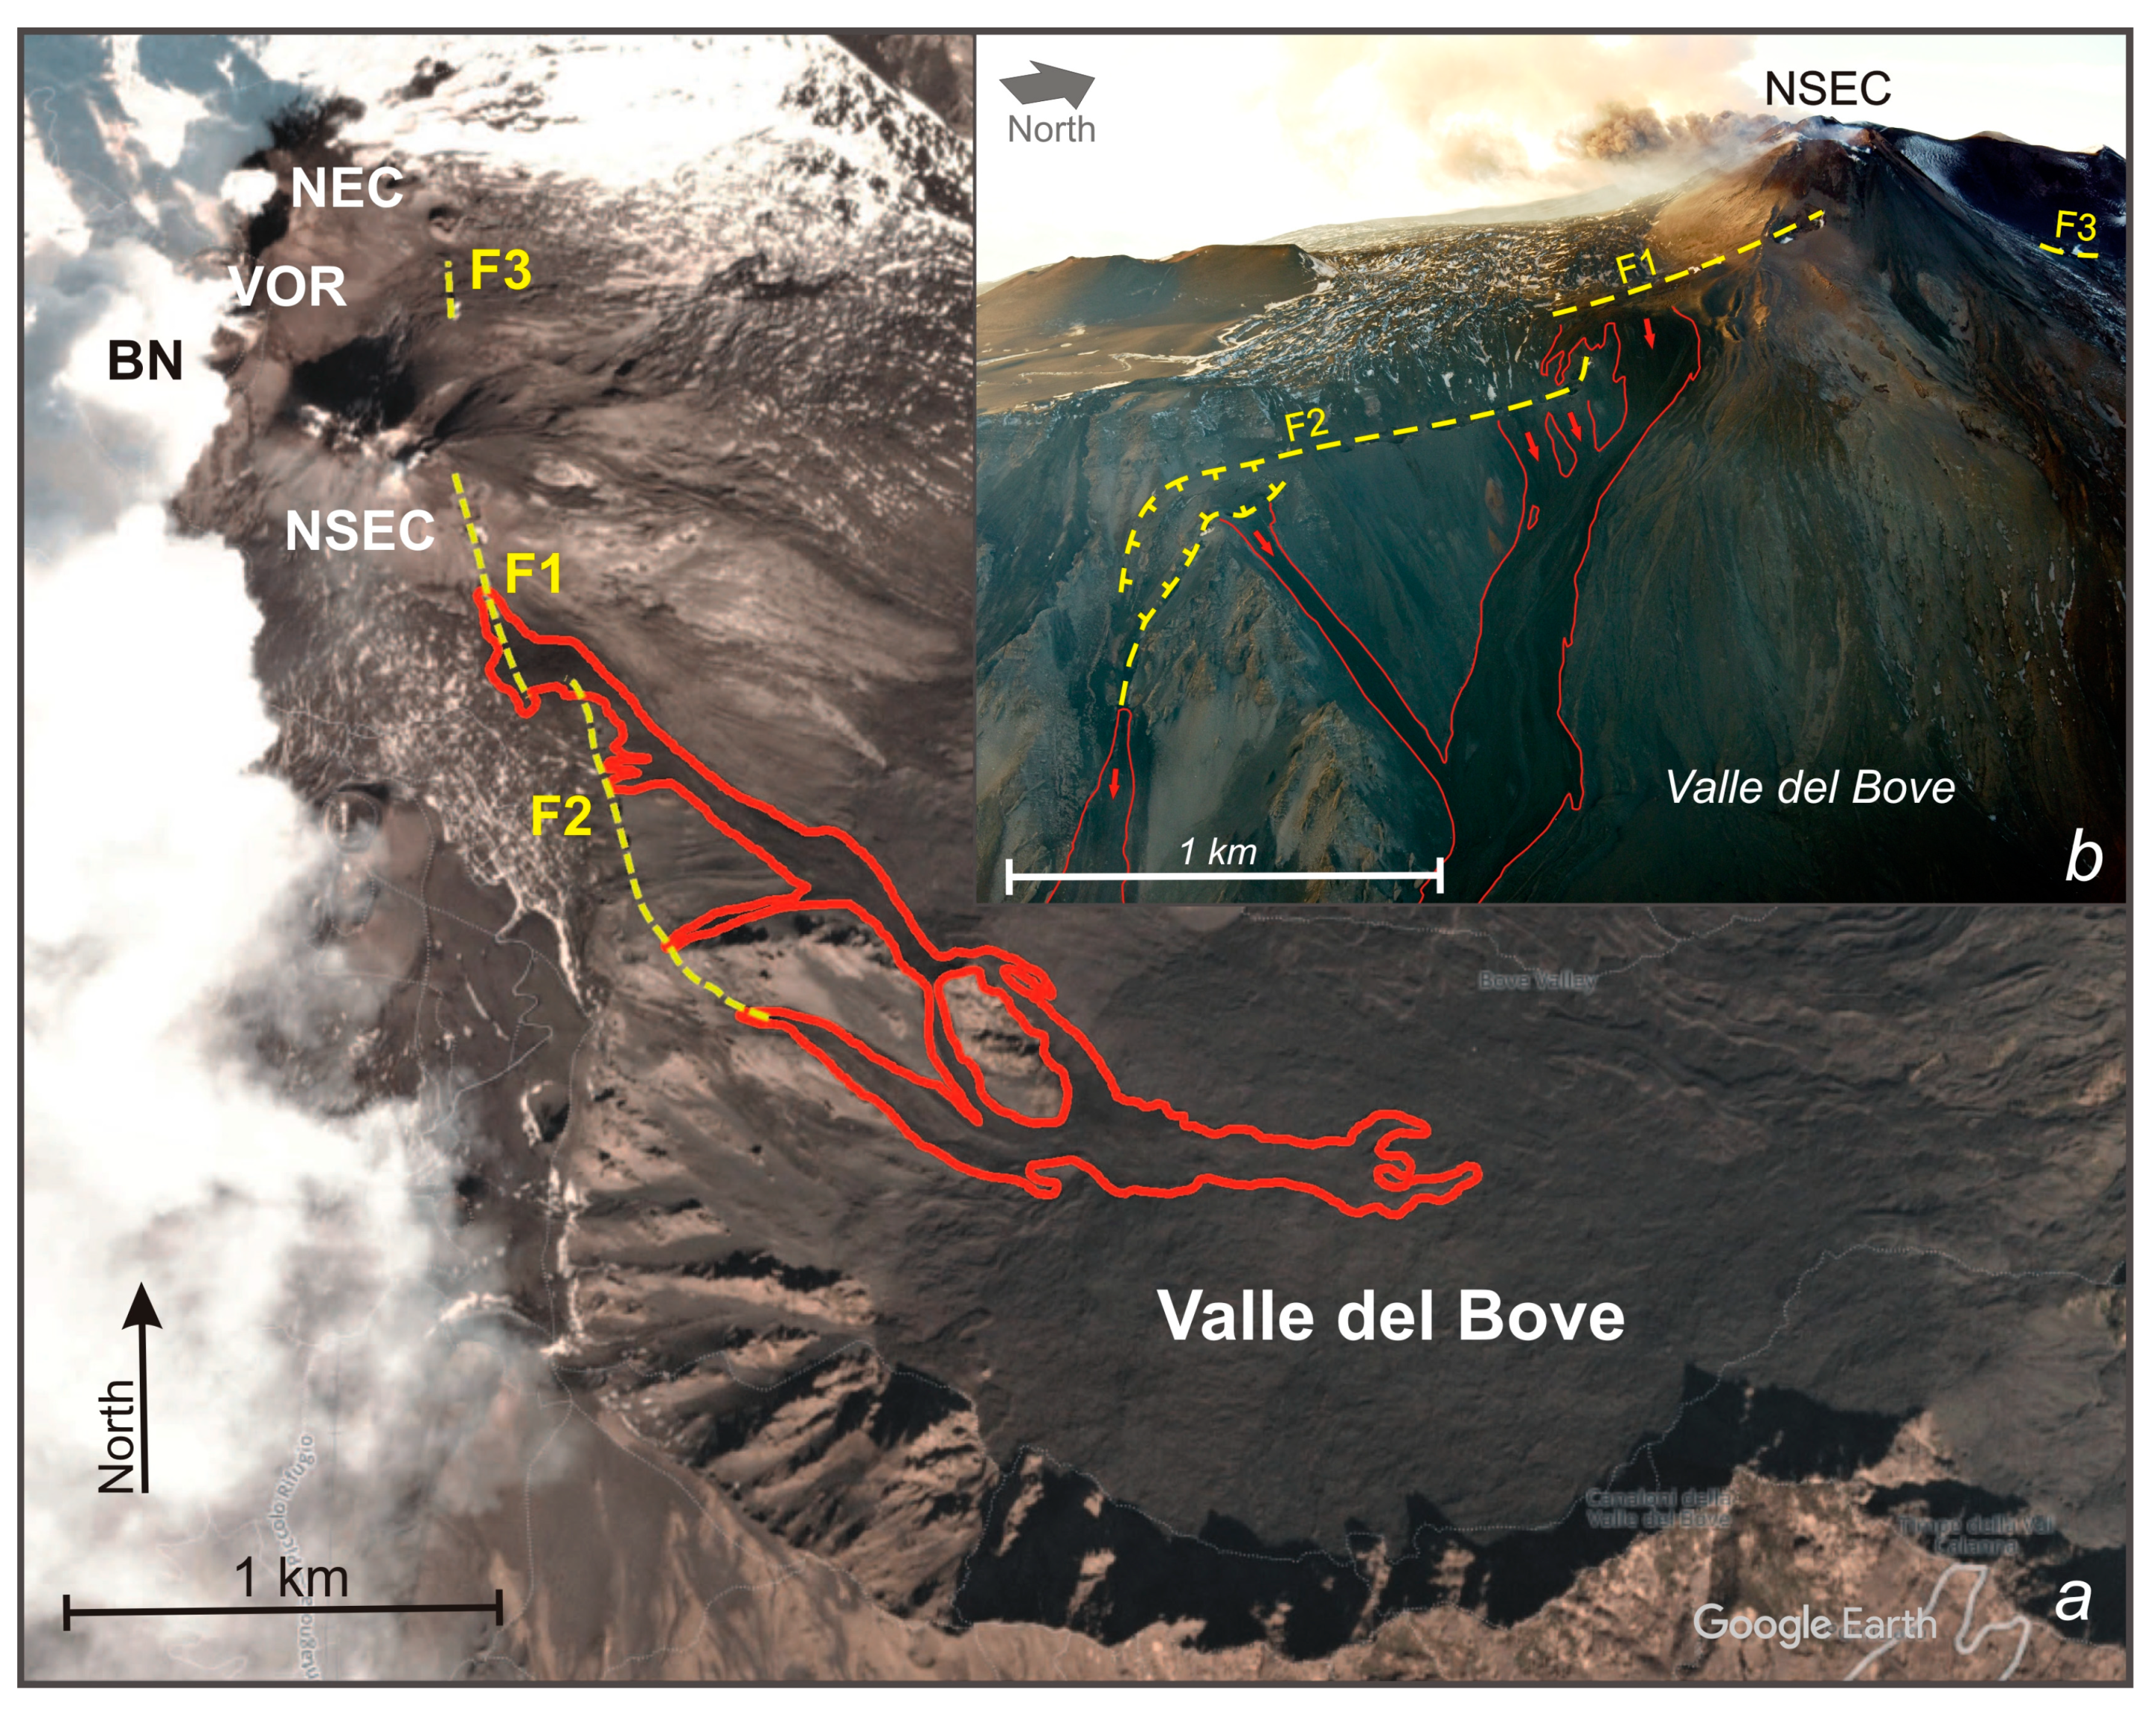
| 11:11 | F1 | Opening of the first segment of eruptive fissure within VdB with lava fountain. Strombolian activity from the NSEC stops but the small lava flows continue | Lava fountain from the fissure |
| 11:30 | F2 | Opening of the second segment (F2) of eruptive fissure within VdB with lava fountain. | Lava fountain from the fissure |
| 11:43 | F3 | Opening of the third (F3) fissure opened N of the NSEC | Strombolian activity |
| 11:43 | F2 | The F2 fissure spread further SE | Lava fountain from the fissure |
| ~12:00 | F2 | The F2 fissure stopped at 2400 m a.s.l. | Strombolian activity |
© 2020 by the authors. Licensee MDPI, Basel, Switzerland. This article is an open access article distributed under the terms and conditions of the Creative Commons Attribution (CC BY) license (http://creativecommons.org/licenses/by/4.0/).
Share and Cite
Calvari, S.; Bilotta, G.; Bonaccorso, A.; Caltabiano, T.; Cappello, A.; Corradino, C.; Del Negro, C.; Ganci, G.; Neri, M.; Pecora, E.; et al. The VEI 2 Christmas 2018 Etna Eruption: A Small But Intense Eruptive Event or the Starting Phase of a Larger One? Remote Sens. 2020, 12, 905. https://doi.org/10.3390/rs12060905
Calvari S, Bilotta G, Bonaccorso A, Caltabiano T, Cappello A, Corradino C, Del Negro C, Ganci G, Neri M, Pecora E, et al. The VEI 2 Christmas 2018 Etna Eruption: A Small But Intense Eruptive Event or the Starting Phase of a Larger One? Remote Sensing. 2020; 12(6):905. https://doi.org/10.3390/rs12060905
Chicago/Turabian StyleCalvari, Sonia, Giuseppe Bilotta, Alessandro Bonaccorso, Tommaso Caltabiano, Annalisa Cappello, Claudia Corradino, Ciro Del Negro, Gaetana Ganci, Marco Neri, Emilio Pecora, and et al. 2020. "The VEI 2 Christmas 2018 Etna Eruption: A Small But Intense Eruptive Event or the Starting Phase of a Larger One?" Remote Sensing 12, no. 6: 905. https://doi.org/10.3390/rs12060905
APA StyleCalvari, S., Bilotta, G., Bonaccorso, A., Caltabiano, T., Cappello, A., Corradino, C., Del Negro, C., Ganci, G., Neri, M., Pecora, E., Salerno, G. G., & Spampinato, L. (2020). The VEI 2 Christmas 2018 Etna Eruption: A Small But Intense Eruptive Event or the Starting Phase of a Larger One? Remote Sensing, 12(6), 905. https://doi.org/10.3390/rs12060905