Abstract
The Etna flank eruption that started on 24 December 2018 lasted a few days and involved the opening of an eruptive fissure, accompanied by a seismic swarm and shallow earthquakes, significant SO2 flux release, and by large and widespread ground deformation, especially on the eastern flank of the volcano. Lava fountains and ash plumes from the uppermost eruptive fissure accompanied the opening stage, causing disruption to Catania International Airport, and were followed by a quiet lava effusion within the barren Valle del Bove depression until 27 December. This was the first flank eruption to occur at Etna in the last decade, during which eruptive activity was confined to the summit craters and resulted in lava fountains and lava flow output from the crater rims. In this paper, we used ground and satellite remote sensing techniques to describe the sequence of events, quantify the erupted volumes of lava, gas, and tephra, and assess volcanic hazards.
1. Introduction
Mt. Etna is a basaltic volcano located in eastern Sicily (Italy) and characterized by a steady state, with an average magma output rate of ~0.8 m3 s−1, which equates to ~25 × 106 m3 per year [1,2,3,4]. It is an open-conduit volcano displaying an almost persistent mild explosive activity from the four summit craters: Bocca Nuova (BN), Voragine (VOR), NE Crater (NEC), and New SE Crater (NSEC; Figure 1). This quiet and low magma output is sometimes interrupted by either frequent, small-volume lava fountaining events [5,6,7,8], or by less frequent but volumetrically more important lava flows from the summit craters or from flank fissures [4,9], with the last flank eruption in 2008–09 [10,11]. The volcano was of interest since early November 2018 due to weak Strombolian activity and small ash emissions from the summit craters of BN, NEC, and NSEC [12], accompanied by an almost constant rate of inflation [13]. Summit explosive activity was accompanied by small lava flows erupted from a little cone located within the pit on the east flank of the NSEC cone [12,14]. These formed a fan-shaped lava flow field ~500 m in width that reached the base of the NSEC without having sufficient supply to advance further [15]. This lava flow field was still erupting at 9:51 UT on 24 December 2018 when the new flank eruption started (Figure 2). Meanwhile, weak Strombolian activity was taking place at the summit of NSEC (Figure 1 and Figure 2). At ~7:00 UT on 24 December, Etna showed sudden signals of unrest, with increasing ash emissions from the summit craters, accompanied by a seismic swarm comprising thousands of events localized under the summit area and the upper SW and NE flanks of the volcano [13,16,17]. In addition, during the eruption, a Mw = 4.9 earthquake affected the lower SE flank of Etna on 26 December at 02:19 UT (all times given in this paper are UT), followed by intense seismic swarms lasting many days and showing a decreasing energy trend [16]. The ground deformation pattern was explained with the upward movement of an ~30 × 106 m3 magma batch [16] that started from a depth of ~ 6 km b.s.l. and intruded along a ~N–S feeder dike that stopped at sea level and displaced most of the volcano edifice [16,17]. Then, the magma expanded upward into a much smaller dike that emerged at the surface through two NW–SE fissures [17], erupting a volume of lava of ~3 × 10⁶ m3 [13,16]. However, this seems poorly consistent with the general observed ratio of the volume of magma degassed versus the magma volume erupted, which in 1993–2005 was 3.3:1 ([18], and references therei).
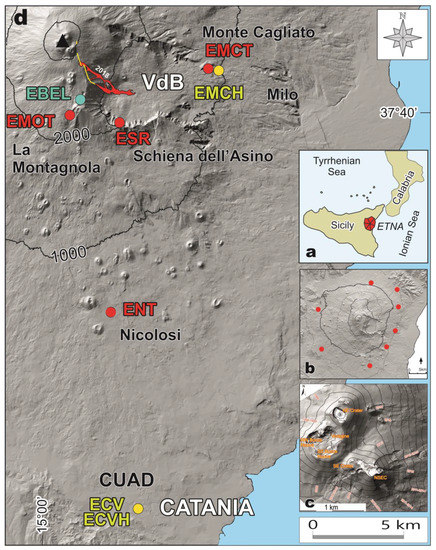
Figure 1.
(a) Map of southern Italy and location of the Etna volcano. (b) Location (red dots) of the Differential Optical Absorption Spectroscopy (DOAS) stations belonging to the Flame network around the flanks of Mount Etna. (c) Map of Etna’s summit with the names of the main active craters: NE Crater, Voragine, SE Crater, New SE Crater (NSEC), and Bocca Nuova comprising two pits (NW Bocca Nuova and SE Bocca Nuova), modified after Neri et al., 2017. (d) Map of the SE flank of the Etna volcano, with the black triangle showing the position of the summit craters magnified in (b), the 2018 lava flow field in red with the yellow lines for the eruptive fissures, and the location of the monitoring cameras used in this paper and comprising the INGV-OE network. The red dots are the thermal cameras Schiena dell’Asino (ESR), La Montagnola (EMOT), Nicolosi (ENT), and Monte Cagliato (EMCT); with the yellow dots the visual cameras CUAD (ECV) and CUAD, wide angle (ECVH), and Monte Cagliato, wide angle (EMCH). The blue dot indicates the location of the radiometer (EBEL). VdB = Valle del Bove depression.
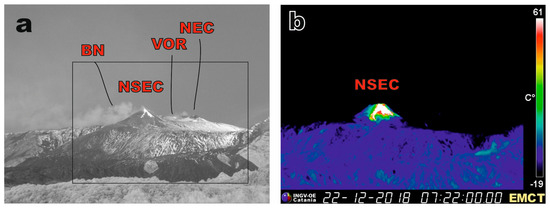
Figure 2.
(a) Infrared image from the Monte Cagliato EMCH visual camera recorded on 22 December 2018 at 05:45 showing a view from the east of the summit craters, with the location of the NE Crater (NEC), Voragine (VOR), Bocca Nuova (BN), and New SE Crater (NSEC) erupting small lava flows from its summit (in white). The black rectangle displays the area framed in (b). (b) Thermal image recorded from the Monte Cagliato EMCT thermal camera on 22 December 2018 at 07:22 showing the active lava flows spreading on the upper eastern flank of the NSEC (in white).
Several research articles have been focused on the interpretation of the events and especially of the process of dike intrusion and the quantification of the intruded volumes in space and time [13,14,16,17]. In this paper, we describe the chronology of eruptive events on the basis of remote sensing observations carried out from the INGV-OE network of monitoring cameras and from satellites. We added data from a radiometer and from the DOAS (Differential Optical Absorption Spectroscopy) FLAME UV scanners network to further constrain the release of particles and SO2 gas flux during the eruption. Our focus is on the effects of the intrusion process, which caused the explosive phenomena responsible for the Catania International Airport disruption and of the emplacement of a lava flow field within the barren Valle del Bove (VdB) depression. In doing this, our intention was to extract and test useful parameters that can be used for hazard and risk assessment during eruptive crises [6,7,19,20].
2. Materials and Methods
The description of the eruptive activity here reported was obtained using the images recorded by the INGV-OE network of fixed monitoring cameras, which is comprised of 13 visual and thermal cameras. In our study, we used six of these, listed in Table 1, where we have also reported their main features. We used the ECV (CUAD visible; ~27 km SSE from the craters, Table 1) and ECVH (CUAD visible wide-angle) visual cameras to characterize the ash plume height both in proximal (within ~5 km horizontal distance from the summit craters) and distal (~15 km horizontal distance from the summit craters) positions. The ECV camera records images every two second that have been calibrated in order to obtain a reliable plume’s height with errors up to 20% [21]. From these images, the plume’s height can be estimated up to a threshold of 9 km above sea level (a.s.l.). ECVH is a wide-angle camera located in the same position as ECV. It records images every minute that are not yet calibrated and that have been used in combination with ECV, choosing the same times at both cameras to estimate the height of the plume greater than 9 km a.s.l. and for distances up to ~15 km from the summit vents. Comparing the images recorded by ECV with those of ECVH, we observed a greater distortion of the ECVH images, which involved a greater error in the estimation of the plumes height, assessed at ±200 m, twice that of ECV (evaluated at ±100 m).
ENT (Nicolosi thermal; 15 km SSE from the craters) has been used for the calculation of the height and apparent temperature of the lava fountain and for the volume of erupted pyroclastics, obtained following the method proposed and applied by Calvari et al [5,7]. ENT records the thermal images every two seconds, and from these, we extracted one frame every minute in order to calculate the volume of tephra that erupted during the opening phase of the eruptive fissures. We then used the height of the lava fountain, obtained from these images and considered constant for the whole minute, to calculate the initial velocity at the vent ([V = (2gH)0.5], where V is velocity, g is acceleration of gravity, and H is the fountain height) erupted by a conduit with a diameter of 30 m [5]. Assuming that the vent area has a circular shape and using this velocity of the ejecta, we can calculate the flux of volume of vesiculated material plus gas erupted by the vent, integrating this value through the whole duration of the eruptive period. Considering that pyroclastics account for ~0.18% of the total erupted fluids [7], we obtained the total volume of pyroclastics erupted during the lava fountain episode with an estimated error of 20% [6]. In addition, ENT has been used to obtain the apparent temperature during the phases of Strombolian activity that occurred at the BN crater after the end of the opening of the eruptive fissure on the W wall of the Valle del Bove.
From EMOT (La Montagnola thermal; 3 km S of the craters), we isolated the frames displaying the intense impulsive Strombolian explosions that occurred at BN between 11:00 and 12:49 on 24 December in order to calculate the volume of pyrocastics erupted. In this case, being single explosive pulses, instead of integrating the value for the whole minute, we summed the single values obtained for each pulse, considering also in this case that pyroclastics account for 0.18% of the total fluids erupted.
Following the method proposed by Newhall and Self [22] and modified by Calvari et al. [7] for Etna, we considered the erupted volume as the main parameter for estimating the magnitude of the eruption and its volcanic explosivity index (VEI), whereas the intensity is given by the instantaneous effusion rate (IER), or the volume of ejecta per unit time [7,23,24].

Table 1.
List of the fixed monitoring cameras used in this study and comprising the Istituto Nazionale di Geofisica e Vulcanologia, Osservatorio Etneo (INGV-OE) network and of their features.
Table 1.
List of the fixed monitoring cameras used in this study and comprising the Istituto Nazionale di Geofisica e Vulcanologia, Osservatorio Etneo (INGV-OE) network and of their features.
| Camera Label | Camera Type | Location and Distance from Summit | Model | Field of View |
|---|---|---|---|---|
| ECV | Visible | CUAD, ~27 km SSE, 35 m a.s.l. | Canon VC-C4 [5] | 3–47.5° [5] |
| ECVH | Visible, wide angle | CUAD, ~27 km SSE, 35 m a.s.l. | VIVOTEK | 33°~93° (horizontal), 24°~68° (vertical) |
| EMCT | Thermal | Monte Cagliato, 8.5 km ESE, 1160 m a.s.l. | FLIR A320 [25] | 320 × 240 pixels [25] |
| EMCH | Visible, wide angle | Monte Cagliato, 8.5 km ESE, 1160 m a.s.l. | VIVOTEK | 33°~93° (horizontal), 24°~68° (vertical) |
| EMOT | Thermal | La Montagnola, 3 km, 2600 m a.s.l. | FLIR A320 [5] | 320 × 240 pixels [5] |
| ENT | Thermal | Nicolosi, 15 km S, 730 m a.s.l. | FLIR A40M [5] | 320 × 240 pixels [5] |
| ESR | Thermal | Schiena dell’Asino, ~5 km SSE, 1985 m a.s.l. | FLIR A320 | 320 × 240 pixels |
The satellite monitoring of the Christmas 2018 Etna eruption was performed using the HOTSAT volcano hotspot detection system [26,27]. In particular, HOTSAT ingests mid and thermal infrared data acquired by the Spinning Enhanced Visible and InfraRed Imager (SEVIRI), which enables almost continuous monitoring (up to five minutes in rapid scanning service mode, with a spatial resolution of 3 km at nadir), to output a hotspot location and to estimate lava thermal flux, effusion rate, and lava volume.
When a hot pixel is detected, HOTSAT quantifies the thermal anomaly by computing the associated radiant heat flux through the Mid-wavelength InfraRed (MIR) radiance approach of Wooster et al. [28]. Calculated for each SEVIRI image available during an eruptive episode, this allows the heat flux curve that describes the event to be obtained. By adopting a direct relationship between the radiant heat loss from an active lava flow and the effusion rate, and considering the extreme values of each lava parameter [29,30] HOTSAT also provides minimum and maximum estimates of the time-averaged discharge rate (TADR in m3/s) (i.e., the average effusion rate over a specified period). The integration of the minimum and maximum TADR curves yields an estimation of the lower and upper bounds for the dense-rock equivalent (DRE) volume of lava emitted.
From the satellite data, we also derived the plume top height. In order to obtain a good level of detail in terms of spatial resolution, we used the Visible Infrared Imaging Radiometer Suite (VIIRS) data acquired at 375 m by the joint National Aeronautics and Space Administration/ National Oceanic and Atmospheric Administration (NASA/NOAA) Suomi National Polar-orbiting Partnership (Suomi NPP). Assuming a thermal equilibrium between the plume top height and the atmosphere, we computed the mean brightness temperature in the Thermal InfraRed (TIR) wavelength (band I5) of the plume pixels and compared it with the temperature profile on Etna at 12:00 UT, obtained from the National Centers for Environmental Prediction (NCEP)/National Center for Atmospheric Research (NCAR) Reanalysis Project (available at http://www.esrl.noaa.gov/psd/data/reanalysis/reanalysis.shtml).
Complementary observations were provided by one of the three permanent radiometers integrated in Mt. Etna’s multi-parametric summit stations (EBEL; Figure 1). The radiometer consists of an Optris CT LT15F infrared thermometer (see [31,32] for instrumental details). For the radiometer recording, we used an emissivity of 0.97, transmissivity of 0.85 (in agreement with the absorption effect of the external protective lens used), dynamic range of 220 to 950 °C (to avoid signal saturation), and acquisition frequency of 50 Hz. External temperature reference was automatically and simultaneously acquired by the instrument. Considering the mean line-of-sight of ~1.9 km (radiometer to crater rim), the radiometer field-of-view (FOV) consisted of a circular area of ~12.142 km2 including the very top of the NSEC rim, but with most parts being clear sky (in the absence of fumarolic/eruptive activity). Indeed, integrated apparent temperatures were underestimated with respect to absolute values due to the broad radiometer FOV, the mixed nature of the different temperature components falling within it, and factors affecting remote thermal measurements [33]. However, in this study, we were not interested in absolute temperature retrieval but rather in the variations of the signal indicative of eruptive activity.
The bulk plume SO2 flux released from the summit craters of Mt. Etna and from the eruptive fissure of 24 December 2018 was measured during daylight hours by the FLAME (FLux Automatic MEasurement) ultraviolet DOAS scanning spectrometer network [34,35]. The automatic network consists of nine ultraviolet scanning spectrometers placed at a mean altitude of ~900 m on the flanks of Mt. Etna and at a mean distance of ~14 km from the summit craters. Recorded open-path ultraviolet spectra were reduced on-site by applying the differential optical absorption spectroscopy method [36] and using a modeled clear sky spectrum [37,38]. SO2 mass emission rate was automatically computed inverting the SO2 volcanic column amounts in the plume-profiles. Uncertainty in SO2 flux ranged between −22 and +36% [34,35].
3. Results
The data collected during Etna’s eruptive phase on the 24 December 2018 allowed us to characterize the sequence of events, estimate the erupted volume of pyroclastics and lava flows, and obtain a reliable measure of the elevation reached by the ash plume both in the proximal (within 5 km from the volcano summit and up to 9 km a.s.l.) and distal (up to 15 km from the summit) positions. Next, the data are presented and discussed.
3.1. Ground-Based Monitoring Cameras
The NSEC of the volcano was already the site of eruptive activity since November 2018, with mild Strombolian explosions from its summit and a small lava flow field forming a fan of short flows on its upper eastern flank (Figure 2).
The main phases of the eruptive episode as observed from the network of monitoring cameras are summarized in Table 2. The first signal of eruptive activity was detected by the network of monitoring cameras at 07:38 on 24 December 2018, when we observed the emission of a puff of a dense and white steam from BN (Table 2). The steam emissions became gradually more intense and frequent, and at 09:51, the first black (juvenile) ash emission occurred from BN, rapidly dispersed by the wind (Table 2). At 10:03, BN started in erupting a pink (lithic) ash plume (e.g., [39,40]) that was diluted and continuous, overlapped to the steam emission, forming a weak plume bent E in the wind direction. At 10:41, a black (juvenile) ash emission (e.g., [39,40]) also occurred from NEC, and at 10:55, BN started erupting a very dark and thick ash cloud that was hiding inside Strombolian explosions and pressurized bursts of hot products. At 11:11, we observed the opening of the first SE-trending segment (F1, Figure 3a,b) of the eruptive fissure at the southern base of the NSEC at ~ 3000 m a.s.l. This was 700 m long and attained a minimum elevation of 2850 m a.s.l., producing lava fountains and lava flows spreading eastward in the upper western flank of the VdB. The eruptive fissure propagated down slope and at 11:30, a new sub-parallel, sinistral en-echelon arranged, 800-m long segment made of several explosive and effusive vents formed (F2, Figure 3a,b), producing lava fountains and thin lava flows that ran fast along the western wall of the VdB. At 11:42, a third short (tens of meters) N–S fissure opened N of the NSEC at 3000 m a.s.l. (F3, Figure 3a,b), which remained active for only a few minutes, showing weak Strombolian activity. At the same time, the southern portion of F2 spread further SE, from which lava fountains also erupted, producing a thick ash plume that was hiding the scene.

Table 2.
Sequence of the main eruptive events detected by the INGV-OE cameras monitoring network on 24 December 2018. NSEC = New SE Crater; BN = Bocca Nuova; NEC = NE Crater; FER = Eruptive Fissure; VdB = Valle del Bove depression.
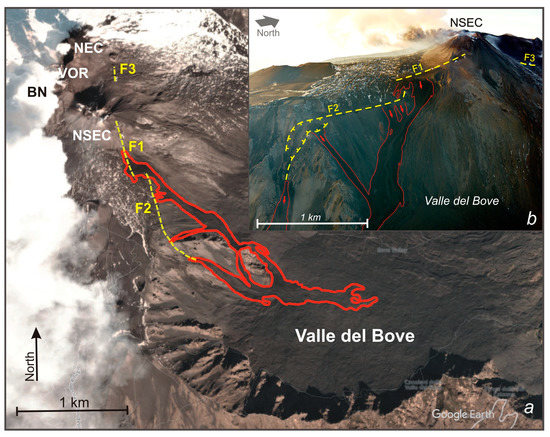
Figure 3.
(a) Map of the 24–27 December 2018 lava flow (red outline) on a Google Earth image. The yellow dashed lines F1-F2-F3 indicate the eruptive fissures. NSEC = New South-East Crater; VOR = Voragine; BN = Bocca Nuova; NEC = North-East Crater. (b) Aerial view from east of the eruptive fissures (F1–3, yellow dashed lines) and main lava flow emissions (red arrows). The lower part of the F2 fissure between 2500 and 2400 m a.s.l. (on the left) formed a graben 30–40 m wide. At higher altitudes, the graben was buried under the erupted pyroclastic products.
Overall, the eruptive fissure was about 2300 m long, and reached the minimum altitude of 2400 m a.s.l., propagating with a speed of ~0.7 m/s, which was the highest recorded at Etna in the last 110 years [41]. The opening of each sector of the eruptive fissure was accompanied by the spreading of short (hundreds of meters) hot avalanches along the western wall of the VdB as well as by the formation of lava fountains and abundant ash emission also obscuring visibility at the thermal images. The lava fountain from the eruptive fissure was no longer visible at 11:48, after 37 min of eruptive activity, but lava flows and Strombolian explosions continued, with explosions ceasing at F1 at ~12:00. While explosive activity was going on at the lower portion of the eruptive fissure, BN produced 74 explosive pulses between 11:00 and 12:49, with a frequency of one explosion every minute, and with the height of the eruptive cloud of ~500–600 m above the crater rim. In the late afternoon of 24 December, three additional explosive sequences occurred at BN at 18:58, 19:04, and 20:27, forming hot ash clouds, and after this, the crater displayed only degassing. Lava flow output from the lower part of the eruptive fissure toward the VdB continued for a few more days until the early morning of 27 December. The lava flow field reached a total extension of 0.88 km2 [42].
The lava fountain phase occurred during the opening and spreading of the eruptive fissure that started at 11:11 and ended at 11:48, and lasted 37 min (2220 s). The maximum height of the lava fountains was 950 m, recorded at 11:16 and at 11:18 (Figure 4 and Figure 5), after only five minutes from the starting phase of the eruptive fissure.
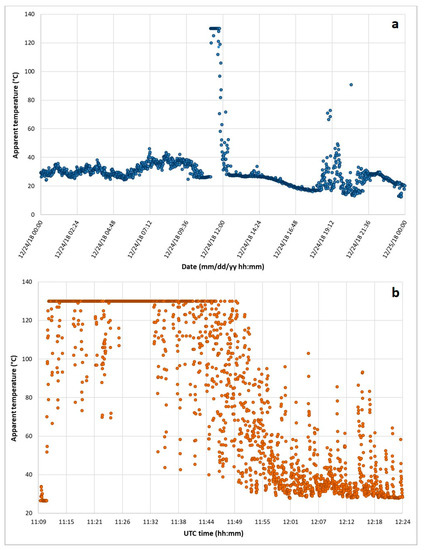
Figure 4.
(a) Maximum apparent temperature (°C) at one minute time lapse recorded by the ENT thermal camera during the whole day on 24 December 2018, displaying the first thermal anomalies at ~07:10 (ash emission from the summit craters), the lava fountain phase (with saturated values between 11:12 and 11:39), and the explosions from Bocca Nuova crater recorded between 18:58 and 20:27. (b) Maximum apparent temperature (°C) at two seconds time lapse recorded by the ENT thermal camera between 11:09 and 12:24, showing the lava fountain phase (between 11:11 and 11:48) with a mostly saturated apparent temperature scale (130 °C), and a gradual maximum apparent temperature decline during the following Strombolian explosive phase.
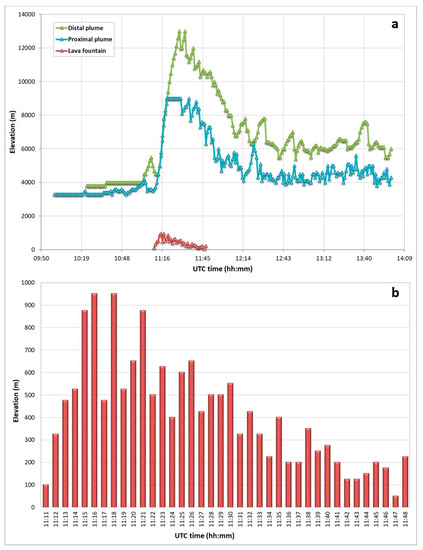
Figure 5.
(a) Elevation (in meters above sea level, a.s.l.) of the ash plume retrieved from the calibrated ECV camera (blue triangles) that allows a view of the ash plume up to 9 km a.s.l. and up to ~5 km distance from the craters, and from the non-calibrated ECVH wide-angle camera (green triangles) that allows for a wider perspective and to follow up the spreading of the plume up to an ~15 km distance from the vent against time, compared with the height of the lava fountain from the eruptive fissure (red triangles) obtained from the ENT camera. The maximum apparent elevation of the distal plume (green triangles) was recorded between 11:29 and 11:33. (b) Elevation (in meters above the vent) of the lava fountains occurred at the eruptive fissure against time (UT) recorded between 11:11 and 11:48 on 24 December 2018 from the ENT thermal camera.
The lava fountain caused the sudden spreading in the atmosphere of an ash plume that rose for more than 9 km a.s.l. (estimated from ECV), and probably reached as much as 13 km a.s.l. (Figure 5a and Figure 6) as estimated from the non-calibrated images of ECVH (Figure 6).
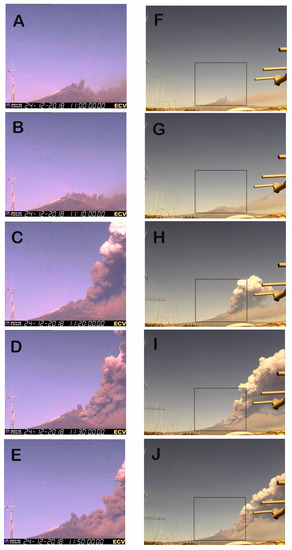
Figure 6.
Frames recorded by the ECV camera (left) at 11:00 (A), 11:10 (B), 11:20 (C), 11:30 (D), and 11:50 (E), and corresponding images recorded by the wide-angle ECVH camera (F–J). The black squares in the right frames display the area framed in the corresponding left image, which has the upper boundary at 9 km above sea level [21].
Figure 5a displays a delay of four minutes between the maximum elevation reached by the lava fountain (950 m at 11:16, Figure 5b) and that attained by the proximal ash plume (more than 9 km at 11:20, Figure 6C,H). Considering that the wind speed at that time was 15 m/s, this is consistent with the formation of a weak plume bent eastward (for wind speed greater than 10 m/s, [7]).
The total pyroclastic volume erupted from the eruptive fissure, calculated for the 37 min of the lava fountain duration was ~250,000 m3, about 1/10 of the average volume erupted during the lava fountains produced during 2011–2013 [5,7]. The time averaged discharge rate (TADR) calculated over the 37 min of the explosive episode was ~113 m3/s, with a range of the instantaneous effusion rate (IER) between 40 and 174 m3/s. Wind speed during the opening phase of the eruptive fissure was ~15–16 m/s, and the eruptive column formed an ash plume (weak plume) bent eastward in a downwind direction, that rose up to an elevation of more than 9 km above the craters between 11:20 and 11:30 (Figure 5 and Figure 6), and that far away from the summit of the volcano reached an approximated elevation of ~12–13 km a.s.l. Whereas the TADR was similar to that obtained for the lava fountains that occurred at Etna between 2011 and 2013, the duration of the explosive episode was at the lower boundary of the events that characterized the preceding activity [7].
3.2. Radiometry
Figure 7 reports the RMS (root-mean-square) of the 50 Hz of the integrated apparent temperatures calculated over a time window of one min between 10:00 and 18:00 on 24 December 2018. The signal represents the typical cooling curve shape on which several peaks overlap. Overall, it is possible to distinguish six main phases in the signal development indicated in the figure as areas of different colors. Area 1 (10:03–10:22) shows the first pulses induced by the presence of hot bodies/gases entering the radiometer FOV, with no pulses recorded before 10:03 due to technical issues in the station supply system. Area 2 (10:22–11:07) is characterized by two main increases of the signal, indicative of additional thermal anomaly entering in the FOV, and thus represent increasing eruptive activity. Area 3 (11:07–11:28) is marked by a fast increase in the signal that reached the acme at 11:28. Areas 4 (11:28–40) and 5 (11:40–11:48) show peaks in the thermal signal of minor amplitude that are likely due to the intense volcanic ash emission entering the radiometer FOV, thus attenuating the thermal radiation [33]. Following 11:48 (Area 6), the signal gradually decreased though showed pulsing behavior, especially between 13:08 and 15:02.
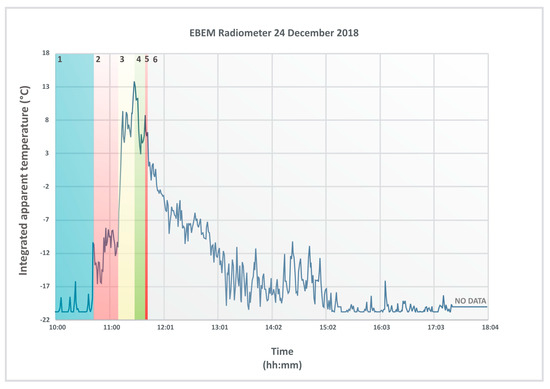
Figure 7.
Integrated apparent temperatures recorded by the EBEM radiometer on 24 December 2018. Data reported are the root-mean-square (RMS) of the 50 Hz signal calculated over a time window of one min. The colored areas in the graph indicate different phases of the eruptive activity and eruptive fissure opening and developing.
3.3. Satellite Monitoring
The high temporal resolution of SEVIRI (e.g., 15 min and up to a 5-min sampling interval in rapid scanning service (RSS) mode), enabled the near-continuous monitoring of the thermal activity of Etna from 24 December 2018 at 08:19 (first hotspot) and 27 December at 16:57 (last hotspot). The peak of activity occurred at midday on the 24 December, when a radiant heat of 17.5 GW was recorded (Figure 8). After this peak, the thermal activity decreased exponentially, running out in about one day. Converting the radiant heat flux into TADR, we obtained the minimum, mean, and maximum estimates shown in Figure 8, with a peak of 81 ± 24 m3/s. Finally, integrating these three curves, we computed that the DRE lava volume erupted during the eruption amounts to 2.5 ± 0.7 × 10⁶ m3.
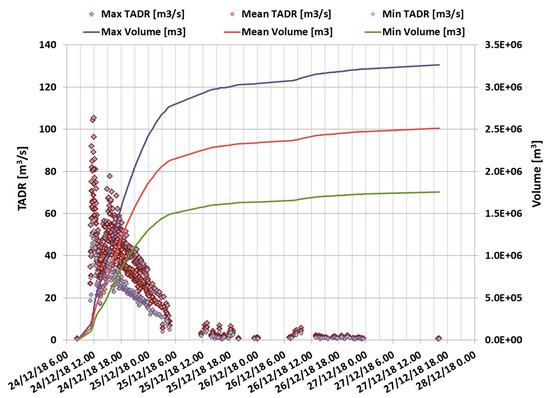
Figure 8.
Time averaged discharge rate (TADR) and volume derived from the SEVIRI data processing over Etna. The first hotspot was detected on 24 December 2018 at 08:19, while the last hotspot was on 27 December 2018, 16:57.
From the processing of the VIIRS image acquired on 24 December at 12:46, we also derived the plume top height that was between 4.4 and 8.8 ± 0.2 km, with a total length of ~125 km at 12:46 on 24 December (Figure 9). This was done by comparing the VIIRS I-5 channel brightness temperature with the temperature profile extracted from NCEP-NCAR Reanalysis data over Etna at 12:00 UT.
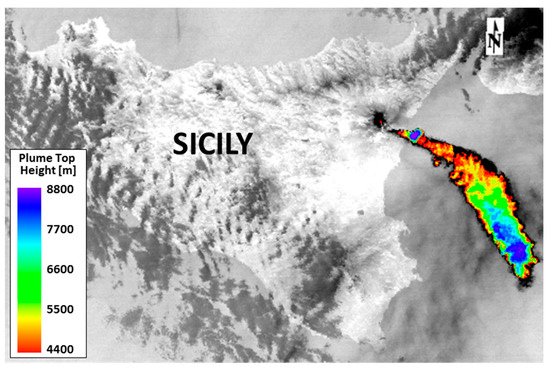
Figure 9.
Plume top height derived from the VIIRS image acquired on 24 December 2018 at 12:46.
3.4. SO2 Flux from the Summit Craters
Between 16 and 29 December, the bulk daily mean plume SO2 flux released by the summit and the eruptive fissure of 24 December showed changes at both the temporal and magnitude scale (Figure 10) coherent with the eruptive activity and with geophysical signal variation. Overall, the SO2 emission rates displayed a waxing–waning phase, which climaxed on the 26 December with the mean daily value of 12,200 t/d and intraday emission up to 18,000 t/d. In particular, the flux after a few days of slight decrease between 16 and 18 December, from 20 December, it increased gradually from a mean value of 4000 t/d to 12,200 t/d on 26 December with a mean degassing rate of 1230 t/d. Soon after 26 December, the geochemical signal gradually dropped to the pre-eruptive value, reaching 3400 t/d on 29 December (Figure 10). It is worth noting that even though the main explosive stage of the eruption occurred with the lava fountain on 24 December, the SO2-degassing regime steadily increased up to 26 December, consistent with the persistence of effusive activity from the lower end of the eruptive fissure, with the explosive activity at the summit crater, the volcanic tremor at high level, and the occurrence of the strongest seismicity on 26 December [16].
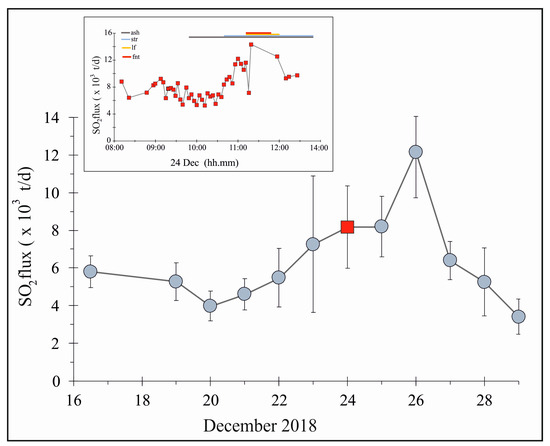
Figure 10.
Daily plume bulk SO2 flux measured by the FLAME network between 16 and 29 December, 2018. The vertical bar shows the infra-day variability of the flux, and the red square is the daily flux recorded on 24 December. In the upper-left of the graph is displayed the infra-day SO2 flux measured on 24 December, together with the eruptive activity taking place over the day (details are in Table 2). The colored lines indicate the eruptive activity: ash emission (grey), Strombolian explosions (pale blue), lava flows (yellow), and lava fountains (red). Uncertainty in emission rates range between −22 and +36%.
Over the 13 days between 16 and 28 December (Figure 10), the SO2 degassing regime displayed mean flux values higher than the typical quiescent regime at both the daily and intraday scale. In particular, the intraday variably of the SO2 emission regime (displayed as vertical bar) was highly variable and strictly connected to the eruptive activity observed. In the upper-left of the graph is shown the SO2 emission rates released during the lava fountain on 24 December. The graph shows that the SO2 degassing regime over the day was stable at high mean values and up to the threshold of the typical quiescent degassing regime of 5000 t/d. In particular, the SO2 flux decreased constantly between 8:00 and 10:00 from 8000 t/d to 5000 t/d while Strombolian activity was going on from the Bocca Nuova crater, to then reverse its trend at 10:30 and steadily increased up to 14,000 t/d at 11:20 with the opening of the eruptive fissure at the base of the NSEC, producing lava fountains and lava flows. Afterward, though the flux decreased slightly, it remained at a sustained mean value of 9500 t/d until 12:30.
3.5. Estimate of Expected Lava Volumes from An Eruption
During the last 40 years, the Etna volcano has shown a balance between the volumes of magma erupted and those expected according to an emission law characterized by an eruptive rate of 0.8 m3 s−1, equivalent to ~25 × 106 m3 per year [4]. Therefore, in the long-term (from years to decades) the volcano shows a steady-state with an equilibrium between the incoming and outgoing magma, which also allowed us to attempt a prediction of its future behavior in terms of expected volumes of magma to be erupted.
From Figure 11, we can observe that after the end of the last main flank eruption of 2008–09, which started on May 2008 and ended at the beginning of July 2009, the expected volume of magma accumulated an unbalanced volume of about 40 × 106 m3 until the end of 2010.
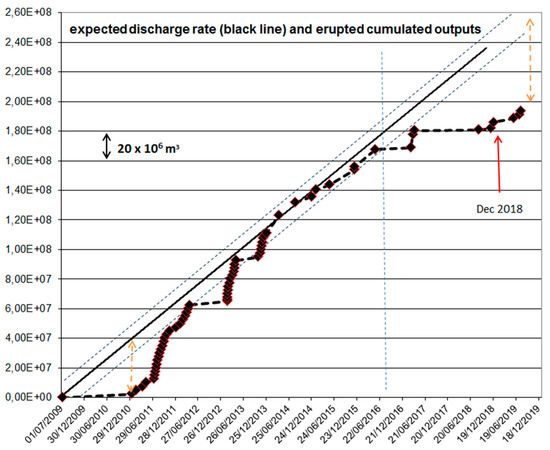
Figure 11.
Expected cumulative magma volume (black line with slope 25 × 106 m3 per year) and cumulative erupted volume from the several eruptions (rhombus) at the Etna volcano in the last 10 years. The graph starts from the end of the last flank eruption of 2008–2009.
In the following years, this volume discrepancy was then gradually re-balanced by the volumes emitted by the next several eruptions. In particular, the emitted volumes produced by lava fountain activity in 2011–2013 (44 events), the episodes of effusive activity during 2014, the paroxysmal events of Voragine (December 2015 with four close events and May 2016 with three close events) followed the balancing law between expected cumulative volumes (i.e., incoming magma rate of 0.8 m3 s−1) and erupted volumes (i.e., magma emitted during the eruptive events from 2011 to 2016).
Since the middle of 2016 (blue vertical dashed line in Figure 11), the discrepancy between the expected and emitted cumulative volumes has increased. Even if there was a flank eruption, the modest recent effusive activity on 24–27 December 2018 continued to not be enough to balance the expected cumulative value. According to the proposed approach, by December 2019, the average discrepancy of the cumulated and not emitted magma was about 50 × 106 m3. It is interesting to underline that this expected value, obtained from a precise law deduced by direct measurements of emitted volumes in the last 40 years [4], is however close to the ~64 × 106 m3 value estimated [43] as the average magma volume leaving the Etna’s magma chamber during each eruption in the past four centuries.
4. Discussion
The data presented in this study allowed us to follow the path of magma rising within the shallow feeding conduit of the volcano triggering the Christmas eruption. It is worth noting that the summit craters were already the sites of mild eruptive activity since early December, with Strombolian explosions and small lava flows being erupted from the NSEC (Figure 2). Changes from the baseline behavior of the volcano toward a state of potential eruption were also observed since late November in the SO2 emission, which showed steady anomalies with respect to the typical quiescent degassing regime of Etna. On the morning of 24 December 2018, a new batch of magma entered in the uppermost feeding system, causing a pressurization of the shallow conduit and an active intrusion. Marked strain changes in the range of 5–40 × 106 were recorded from ~08:30 by the high precision borehole dilatometer stations at distances ranging between 2.5 and 10 km from the summit craters. These changes were interpreted as the tensile action of the uprising magma intrusion [44]. The first surface effects of the ascending intrusion were observed between 10:03 and 10:22 (Table 2) by significant SO2 gas emissions together with hot pulses recorded by the radiometer (Figure 7, area 1, and Figure 10 inset), followed later by small collapses of the inner walls of the upper conduit, revealed by the pink (lithic) ash emission [39,40]. This activity is comparable, although at a different time scale due to the different size of the plumbing system, to the pink ash emissions and small intra-crater landslides observed at the Stromboli volcano a few seconds before the start of the 15 March 2007 paroxysmal explosive activity, suggesting pressurization and shaking of the upper conduit [45,46,47]. The gas and lithic ash emissions from the summit craters were rapidly substituted by dark (juvenile) ash emission [39,40], indicating an increasing involvement of new magma entering the system, as also revealed by the steady increase in SO2 flux (Figure 10). At 11:11, the upward magma movement eventually caused ground fracturing and the opening of an eruptive fissure (Figure 3). Its surface expression was featured by three segments of fractures extending between 3000 and 2850 m a.s.l. for a length of 700 m and a propagation rate of ~0.7 m/s, the highest recorded at Etna in the last 110 years [41]. During the following 37 min, lava fountains erupted from the highest part of the eruptive fissures, reaching a maximum height of 950 m above the vent after five minutes of activity and gradually decreased afterward (Figure 4b and Figure 5), with an average height of ~413 m. Within four minutes from the top height reached by the lava fountain, the ash plume rose to the elevation of 9 km a.s.l. and grew further (Figure 5a and Figure 6), supplying a weak plume bent downwind, compatible with the wind speed of 15 m/s recorded at that time [7]. The ash plume rose even more in a distal area within 15 km distance from the summit craters, being bent SE and extended for an estimated distance of 125 km from the vent at 12:46 (Figure 9) and an estimated maximum elevation of ~13 km a.s.l. (Figure 5a and Figure 6). It is worth noting the good agreement between the plume height inverted from the ECV and ECVH cameras and those obtained from the satellite at 12:46, with a range of 4.4 and 8.8 ± 0.2 km obtained from the satellite compared to 4.0 ± 0.1 km and 6.5 ± 0.2 km obtained from the ECV and ECVH cameras, respectively. Applying the two formulas proposed by Calvari et al. [7] for the NSEC and VOR lava fountains to obtain the maximum plume’s proximal height, we obtained 9 and 12 km, respectively. Therefore, the recorded plume’s proximal height of ~9 km (see Figure 5a) well fits the expected value of the law obtained for the lava fountains from the NSEC. This supports the idea that the 24 December lava fountain was produced by the NSEC shallow plumbing system. The lava fountains erupted a total DRE volume of 250,000 m3 in 37 min, which was about 1/10 of the volume erupted by the lava fountain episodes that occurred at the same volcano between 2011 and 2013 from the NSEC [5,7]. This volume was erupted at an average rate of ~113 m3/s over the whole phase, with a range of the IER between 40 and 174 m3/s. The lava fountain phase was accompanied and followed by the emission of lava flows from the lower portion of the eruptive fissure (Figure 3). The lava flow was erupted at a TADR (Figure 8) with a peak of 81 ± 24 m3/s, leading to a total DRE volume of 2.5 ± 0.7 × 10⁶ m3. This leads to a ratio between pyroclastics and lava of 1/10. Following Newhall and Self [22] and Calvari et al. [7], these volumes correspond to a volcanic explosivity index (VEI) of 2, which is at the lower end of Etna’s recent range [7]. The gas–SO2 flux data on the 24 December displayed a behavior consistent with the eruptive activity, decreasing from the early morning until 10:30, when the rate started to increase, reaching a climax at the peak of the lava fountain phase (Figure 10 inset). This trend in the SO2 flux decrease before the explosive activity has already been observed during previous lava fountain episodes at Etna [5], and is compatible with foam growth and collapse at the origin of the lava fountain phase [5,48,49].
The 24–27 December 2018 lateral eruption occurred about ten years after the previous flank eruption, which started on 13 May 2008 and ended after 417 days of continuous explosive and mainly effusive activity on 6 July 2009. In 2008, the magmatic dike intruded into the northeastern sector of Etna, triggering an intense seismic swarm and striking deformations that accompanied the opening of a vast N–S to NW–SE fracture field [10,50]. Initially, the magmatic dike spread north, along the NE Rift, until, however, it emerged on the surface at the opposite end of the fracture field in the upper SE flank. In that area it produced a violent activity of lava fountains lasting a few hours, which subsequently evolved into a long (over a year), fairly constant effusive activity. Therefore, at the end of the eruption, the volume of erupted magma was quite significant, 77.5 × 10⁶ m3 [41].
Comparing the 2008–2009 and 2018 lateral eruptions, it is immediately clear that they were similar enough for the intensity of the initial seismic swarm and for the localized deformations in the area of the eruptive fissures. However, in 2018, the seismic swarm and deformations did not end after the opening of the eruptive fissure, but continued afterward, spreading to the southeast and highlighting a probable attempt of the magma to intrude in the southern flank of the volcano. Similarly, the degassing regime, in which the SO2 flux persisted to increase even after 24 December and reached a peak on 26 December, indicating that a batch of magma reach in volatiles was still supplied from the shallow portion of the feeding system (~1–2 km b.s.l.).
The following portion of the eruption did not occur because the stress accumulated in that sector triggered the vigorous movement of the SE flank of Etna (several tens of cm), also generating a 4.9 MW earthquake that seriously damaged numerous inhabited centers [17]. It is therefore possible that these deformations have drained the magmatic dike laterally in depth, preventing it from erupting on the surface [16]. These results are in agreement with the estimated volume of magma accumulated within the system and available to be erupted in the future, which is ~50 × 106 m3 (Figure 11).
The relationships between tectonics and magma dynamics, both at depth and at very shallow levels of the volcano edifice, are certainly not new either to Etna or to other volcanoes worldwide. However, rarely, as on this occasion, the cause–effect relationship between these two factors seems to be clear and binding. We do not know how much the residual mobility of the magma is drained in depth, but at present, we recorded a significant deficit of erupted magma with respect to the average eruptive rates of Etna in the medium–long term. This scenario increases the need for extreme consideration in the interpretation of parameters produced by the sophisticated monitoring networks to improve our ability in the understanding and forecasting of potential lateral eruptions at Etna, which represent the highest hazard due to the large population that resides, in particular, on the southern flank of the volcano.
5. Conclusive Remarks
The remote sensing data presented in this paper have allowed us to follow the path of new gas-rich magma entering the volcano’s feeding system. This was displayed at the surface at ~7:00 on 24 December 2018 (Table 2 and Figure 6), when intense degassing was observed at the summit craters, followed by ash emission and an intense but short lava fountain phase. The lava fountain attained the height of 950 m (Figure 5b), feeding an ash plume bent eastward by the wind and growing to a proximal elevation of 9 km (Figure 5 and Figure 6), but extending for at least 125 km SE (Figure 9), reaching a maximum distal elevation of ~13 km (Figure 5a). The volume of pyroclastics that erupted during the 37 min duration of the lava fountain was ~2.5 × 10⁵ m3, one order of magnitude smaller than the lava fountain episodes of the NSEC that occurred between 2011 and 2013 [5,7] and much smaller than the lava fountains of Voragine that occurred in 2015 [6]. The lava flow erupted during the explosive episode and the next few days, obtained from satellite measurements, was an order of magnitude greater and attained ~2.5 ± 0.7 × 10⁶ m3. This resulted in a VEI 2 eruption [7,22]. The small magma volume erupted during this short eruptive phase has ~50 × 106 m3 of magma left that is still available within the shallow supply system and is prone to be erupted during a future eruptive phase, and this is growing at a rate of ~25 × 106 m3 for every year that passes without eruptions [4].
Author Contributions
Conceptualization, S.C., A.B., M.N.; Methodology, S.C., G.B., T.C., A.C., C.C., C.D.N., G.G., M.N., E.P., G.G.S., L.S.; Validation, S.C., G.B., A.B., T.C., A.C., C.D.N., G.G., M.N., E.P., G.G.S., L.S.; Formal analysis, S.C., G.B., A.B., A.C., G.G., E.P., G.G.S., L.S.; Investigation, S.C.; Supervision, S.C.; Visualization, A.B., C.D.N., G.G., M.N., G.G.S., L.S.; Writing—Original Draft Preparation, S.C., G.B., A.B., A.C., G.G., M.N., E.P., G.G.S., L.S.; Writing—Review & Editing, S.C.; Visualization, S.C., A.C., M.N.; Supervision, S.C. All authors have read and agreed to the published version of the manuscript.
Funding
This research received no external funding.
Acknowledgments
The authors would like to thank the NOAA and EUMETSAT for providing VIIRS and SEVIRI data, and all technicians from INGV-OE for the maintenance of the monitoring networks. We would like to thank the Guest Editor Michael Ramsey for handling the paper, and the two anonymous referees for their suggestions that helped improving the clarity of the paper.
Conflicts of Interest
The authors declare no conflict of interest.
References
- Wadge, G.; Guest, J.E. Steady-state magma discharge at Etna 1971–81. Nature 1981, 294, 548–550. [Google Scholar] [CrossRef]
- Harris, A.J.L.; Steffke, A.; Calvari, S.; Spampinato, L. Thirty years of satellite-derived lava discharge rates at Etna: Implications for steady volumetric output. J. Geophys. Res. 2011, 116, B08204. [Google Scholar] [CrossRef]
- Harris, A.J.L.; Steffke, A.; Calvari, S.; Spampinato, L. Correction to “Thirty years of satellite-derived lava discharge rates at Etna: Implications for steady volumetric output”. J. Geophys. Res. 2012, 117, B08207. [Google Scholar] [CrossRef]
- Bonaccorso, A.; Calvari, S. Major effusive eruptions and recent lava fountains: Balance between expected and erupted magma volumes at Etna volcano. Geophys. Res. Lett. 2013, 40, 6069–6073. [Google Scholar] [CrossRef]
- Calvari, S.; Salerno, G.G.; Spampinato, L.; Gouhier, M.; La Spina, A.; Pecora, E.; Harris, A.J.L.; Labazuy, P.; Biale, E.; Boschi, E. An unloading foam model to constrain Etna’s 11–13 January 2011 lava fountaining episode. J. Geophys. Res. Solid Earth 2011, 116. [Google Scholar] [CrossRef]
- Bonaccorso, A.; Calvari, S. A new approach to investigate an eruptive paroxysmal sequence using camera and strainmeter networks: Lessons from the 3–5 December 2015 activity at Etna volcano. Earth Plan. Sci. Lett. 2017, 475, 231–241. [Google Scholar] [CrossRef]
- Calvari, S.; Cannavò, F.; Bonaccorso, A.; Spampinato, L.; Pellegrino, A.G. Paroxysmal Explosions, Lava Fountains and Ash Plumes at Etna Volcano: Eruptive Processes and Hazard Implications. Front. Earth Sci. 2018, 6, 107. [Google Scholar] [CrossRef]
- Ganci, G.; Harris, A.J.; Del Negro, C.; Guéhenneux, Y.; Cappello, A.; Labazuy, P.; Calvari, S.; Gouhier, M. A year of lava fountaining at Etna: Volumes from SEVIRI. Geophys. Res. Lett. 2012, 39, L06305. [Google Scholar] [CrossRef]
- Cappello, A.; Ganci, G.; Bilotta, G.; Corradino, C.; Herault, A.; Del Negro, C. Changing eruptive styles at the South-East Crater of Mount Etna: Implications for assessing lava flow hazards. Front. Earth Sci. 2019, 7, 213. [Google Scholar] [CrossRef]
- Bonaccorso, A.; Bonforte, A.; Calvari, S.; Del Negro, C.; Di Grazia, G.; Ganci, G.; Neri, M.; Vicari, A.; Boschi, E. The initial phases of the 2008–2009 Mount Etna eruption: A multidisciplinary approach for hazard assessment. J. Geophys. Res. 2011, 116, B03203. [Google Scholar] [CrossRef]
- Ganci, G.; Vicari, A.; Cappello, A.; Del Negro, C. An emergent strategy for volcano hazard assessment: From thermal satellite monitoring to lava flow modeling. Remote Sens. Environ. 2012, 119, 197–207. [Google Scholar] [CrossRef]
- Marchese, F.; Genzano, N.; Neri, M.; Falconieri, A.; Mazzeo, G.; Pergola, N. A multi-channel algorithm for mapping volcanic thermal anomalies by means of sentinel-2 MSI and landsat-8 OLI data. Remote Sens. 2019, 11, 2876. [Google Scholar] [CrossRef]
- Cannavò, F.; Sciotto, M.; Cannata, A.; Di Grazia, G. An Integrated Geophysical Approach to Track Magma Intrusion: The 2018 Christmas Eve Eruption at Mount Etna. Geophys. Res. Lett. 2019, 46, 8009–8017. [Google Scholar] [CrossRef]
- Laiolo, M.; Ripepe, M.; Cigolini, C.; Coppola, D.; Della Schiava, M.; Genco, R.; Innocenti, L.; Lacanna, G.; Marchetti, E.; Massimetti, F.; et al. Space- and ground-based geophysical data tracking of magma migration in shallow feeding system of mount Etna volcano. Remote Sens. 2019, 11, 1182. [Google Scholar] [CrossRef]
- Etna, Bollettini Settimanali, Rep. N° 49–52/2018. Available online: www.ct.ingv.it (accessed on 2 January 2020).
- Bonforte, A.; Guglielmino, F.; Puglisi, G. Large dyke intrusion and small eruption: The December 24, 2018 Mt. Etna eruption imaged by Sentinel-1 data. Terra Nova 2019, 31, 405–412. [Google Scholar] [CrossRef]
- De Novellis, V.; Atzori, S.; De Luca, C.; Manzo, M.; Valerio, E.; Bonano, M.; Cardaci, C.; Castaldo, R.; Di Bucci, D.; Manunta, M.; et al. DInSAR analysis and analytical modeling of Mount Etna displacements: The December 2018 volcano-tectonic crisis. Geophys. Res. Lett. 2019, 46. [Google Scholar] [CrossRef]
- Allard, P.; Behncke, B.; D’Amico, S.; Neri, M.; Gambino, S. Mount Etna 1993–2005: Anatomy of an Evolving Eruptive Cycle. Earth-Sci. Rev. 2006, 78, 85–114. [Google Scholar] [CrossRef]
- Bonaccorso, A.; Calvari, S.; Boschi, E. Hazard mitigation and crisis management during major flank eruptions at Etna volcano: Reporting on real experience. Geol. Soc. Lond. Spec. Publ. 2016, 426, 447–461. [Google Scholar] [CrossRef]
- Del Negro, C.; Cappello, A.; Bilotta, G.; Ganci, G.; Hérault, A.; Zago, V. Living at the edge of an active volcano: Risk from lava flows on Mt. Etna. GSA Bull. 2019. [Google Scholar] [CrossRef]
- Scollo, S.; Prestifilippo, M.; Pecora, E.; Corradini, S.; Merucci, L.; Spata, G.; Coltelli, M. Eruption column height estimation of the 2011- 2013 Etna lava fountains. Ann. Geophys. 2014, 77, S0214. [Google Scholar] [CrossRef]
- Newhall, C.G.; Self, S. The volcanic explosivity index (VEI): An estimate of explosive magnitude for historical volcanism. J. Geophys. Res. 1982, 87, 1231–1238. [Google Scholar] [CrossRef]
- Harris, A.J.L.; Dehn, J.; Calvari, S. Lava effusion rate definition and measurement: A review. Bull. Volcanol. 2007, 70, 1–22. [Google Scholar] [CrossRef]
- Walker, G.P.L. The Taupo pumice: Product of the most powerful known (Ultraplinian) eruption? J. Volcanol. Geoth. Res. 1980, 8, 69–94. [Google Scholar] [CrossRef]
- Ganci, G.; James, M.R.; Calvari, S.; Del Negro, C. Separating the thermal fingerprints of lava flows and simultaneous lava fountaining using ground-based thermal camera and SEVIRI measurements. Geophys. Res. Lett. 2013, 40. [Google Scholar] [CrossRef]
- Ganci, G.; Vicari, A.; Bonfiglio, S.; Gallo, G.; Del Negro, C. A texton-based cloud detection algorithm for MSG-SEVIRI multispectral images. Geomat. Nat. Hazards Risk 2011, 2, 279–290. [Google Scholar] [CrossRef]
- Ganci, G.; Vicari, A.; Fortuna, L.; Del Negro, C. The HOTSAT volcano monitoring system based on a combined use of SEVIRI and MODIS multispectral data. Ann. Geophys. 2011, 54, 5. [Google Scholar] [CrossRef]
- Wooster, M.J.; Zhukov, B.; Oertel, D. Fire radiative energy for quantitative study of biomass burning: Derivation from the BIRD experimental satellite and comparison to MODIS fire products. Remote Sens. Environ. 2003, 86, 83–107. [Google Scholar] [CrossRef]
- Ganci, G.; Bilotta, G.; Cappello, A.; Hérault, A.; Del Negro, C. HOTSAT: A multiplatform system for the satellite thermal monitoring of volcanic activity. Geol. Soc. Lond. Spec. Publ. 2016, 426, 207–221. [Google Scholar] [CrossRef]
- Ganci, G.; Cappello, A.; Bilotta, G.; Del Negro, C. How the variety of satellite remote sensing data over volcanoes can assist hazard monitoring efforts: The 2011 eruption of Nabro volcano. Remote Sens. Environ. 2020, 236, 111426. [Google Scholar] [CrossRef]
- Spampinato, L.; Sciotto, M.; Cannata, A.; Cannavò, F.; La Spina, A.; Palano, M.; Salerno, G.G.; Privitera, E.; Caltabiano, T. Multiparametric study of the February–April 2013 paroxysmal phase of Mt. Etna New South-East crater. Geochem. Geophys. Geosystems 2015, 16, 1932–1949. [Google Scholar] [CrossRef]
- Bombrum, M.; Spampinato, L.; Harris, A.; Barra, V.; Caltabiano, T. On the transition from strombolian to fountaining activity: A thermal energy-based driver. Bull. Volcanol. 2016, 78, 15. [Google Scholar] [CrossRef]
- Spampinato, L.; Calvari, S.; Oppenheimer, C.; Boschi, E. Volcano surveillance using infrared cameras. Earth Sci. Rev. 2011, 106, 63–91. [Google Scholar] [CrossRef]
- Salerno, G.G.; Burton, M.R.; Oppenheimer, C.; Caltabiano, T.; Randazzo, D.; Bruno, N. Three-years of SO2 flux measurements of Mt. Etna using an automated UV scanner array: Comparison with conventional traverses and uncertainties in flux retrieval. J. Volcanol. Geotherm. Res. 2009, 183, 76–83. [Google Scholar] [CrossRef]
- Salerno, G.G.; Burton, M.; Di Grazia, G.; Caltabiano, T.; Oppenheimer, C. Coupling between magmatic degassing and volcanic tremor in basaltic volcanism. Front. Earth Sci. 2018, 6, 157. [Google Scholar] [CrossRef]
- Platt, U.; Stutz, J. Differential Optical Absorption Spectroscopy: Principles and Applications; Springer: Berlin/Heidelberg, Germany, 2008; pp. 1610–1677. [Google Scholar]
- Salerno, G.G.; Burton, M.R.; Oppenheimer, C.; Caltabiano, T.; Tsanev, V.; Bruno, N. Novel retrieval of volcanic SO2 abundance from ultraviolet spectra. J. Volcanol. Geotherm. Res. 2009, 181, 141–153. [Google Scholar] [CrossRef]
- Campion, R.; Salerno, G.G.; Coheur, P.-F.; Hurtmans, D.; Clarisse, L.; Kazahaya, K.; Burton, M.; Caltabiano, T.; Clerbaux, C.; Bernard, A. Measuring volcanic degassing of SO2 in the lower troposphere with ASTER band ratios. J. Volcanol. Geotherm. Res. 2010, 194, 42–54. [Google Scholar] [CrossRef]
- Andronico, D.; Branca, S.; Calvari, S.; Burton, M.R.; Caltabiano, T.; Corsaro, R.A.; Del Carlo, P.; Garfì, G.; Lodato, L.; Miraglia, L.; et al. A multi-disciplinary study of the 2002–03 Etna eruption: Insights for into a complex plumbing system. Bull. Volcanol. 2005, 67, 314–330. [Google Scholar] [CrossRef]
- Behncke, B.; Calvari, S.; Giammanco, S.; Neri, M.; Pinkerton, H. Pyroclastic density currents resulting from the interaction of basaltic magma with hydrothermally altered rock: An example from the 2006 summit eruptions of Mount Etna, Italy. Bull. Volcanol. 2008, 70, 1249–1268. [Google Scholar] [CrossRef]
- Neri, M.; Acocella, V.; Behncke, B.; Giammanco, S.; Mazzarini, F.; Rust, D. Structural analysis of the eruptive fissures at Mount Etna (Italy). Ann. Geophys. 2011, 54. [Google Scholar] [CrossRef]
- Corradino, C.; Ganci, G.; Cappello, A.; Bilotta, G.; Hérault, A.; Del Negro, C. Mapping recent lava flows at Mount Etna using multispectral sentinel-2 images and machine learning techniques. Remote Sens. 2019, 11, 1916. [Google Scholar] [CrossRef]
- Scudero, S.; De Guidi, G.; Gudmundsson, A. Size distributions of fractures, dykes, and eruptions on Etna, Italy: Implications for magma-chamber volume and eruption potential. Sci. Rep. 2019, 9, 4139. [Google Scholar] [CrossRef] [PubMed]
- Bonaccorso, A.; Currenti, G.; Linde, A.; Sacks, S.; Sicali, A. Advances in understanding intrusive, explosive and effusive processes as revealed by the borehole dilatometer network on Mt. Etna volcano. Front. Earth Sci. 2020, 7, 357. [Google Scholar] [CrossRef]
- Calvari, S.; Spampinato, L.; Lodato, L. The 5 April 2003 vulcanian paroxysmal explosion at Stromboli volcano (Italy) from field observations and thermal data. J. Volcanol. Geotherm. Res. 2006, 149, 160–175. [Google Scholar] [CrossRef]
- Bonaccorso, A.; Calvari, S.; Linde, A.; Sacks, S.; Boschi, E. Dynamics of the shallow plumbing system investigated from borehole strainmeters and cameras during the 15 March 2007 Vulcanian paroxysm at Stromboli volcano. Earth Plan. Sci. Lett. 2012, 357–358, 249–256. [Google Scholar] [CrossRef]
- Andronico, D.; Taddeucci, J.; Cristaldi, A.; Miraglia, L.; Scarlato, P.; Gaeta, M. The 15 March 2007 paroxysm of Stromboli: Video-image analysis, and textural and compositional features of the erupted deposit. Bull. Volcanol. 2013, 75, 733. [Google Scholar] [CrossRef]
- Jaupart, C.; Vergniolle, S. Laboratory models of Hawaiian and Strombolian eruptions. Nature 1988, 331, 58–60. [Google Scholar] [CrossRef]
- Allard, P.; Burton, M.; Muré, F. Spectroscopic evidence for a lava fountain driven by previously accumulated magmatic gas. Nature 2005, 433, 407–410. [Google Scholar] [CrossRef]
- Aloisi, M.; Bonaccorso, A.; Cannavò, F.; Gambino, S.; Mattia, M.; Puglisi, G.; Boschi, E. A new dyke intrusion style for the Mount Etna May 2008 eruption modelled through continuous tilt and GPS data. Terra Nova 2009, 21, 316–321. [Google Scholar] [CrossRef]
© 2020 by the authors. Licensee MDPI, Basel, Switzerland. This article is an open access article distributed under the terms and conditions of the Creative Commons Attribution (CC BY) license (http://creativecommons.org/licenses/by/4.0/).