Article

Development of a 3D Real-Time Atmospheric Monitoring System (3DREAMS) Using Doppler LiDARs and Applications for Long-Term Analysis and Hot-and-Polluted Episodes

by
Steve Hung Lam YIM
1,2,3
1
Department of Geography and Resource Management, The Chinese University of Hong Kong, Hong Kong, China
2
Stanley Ho Big Data Decision Analytics Research Centre, The Chinese University of Hong Kong, Hong Kong, China
3
Institute of Environment, Energy and Sustainability, The Chinese University of Hong Kong, Hong Kong, China
Remote Sens. 2020, 12(6), 1036; https://doi.org/10.3390/rs12061036
Submission received: 6 February 2020 / Revised: 16 March 2020 / Accepted: 18 March 2020 / Published: 24 March 2020

Abstract

:
Heatwaves and air pollution are serious environmental problems that adversely affect human health. While related studies have typically employed ground-level data, the long-term and episodic characteristics of meteorology and air quality at higher altitudes have yet to be fully understood. This study developed a 3-Dimensional Real-timE Atmospheric Monitoring System (3DREAMS) to measure and analyze the vertical profiles of horizontal wind speed and direction, vertical wind velocity as well as aerosol backscatter. The system was applied to Hong Kong, a highly dense city with complex topography, during each season and including hot-and-polluted episodes (HPEs) in 2019. The results reveal that the high spatial wind variability and wind characteristics in the lower atmosphere in Hong Kong can extend upwards by up to 0.66 km, thus highlighting the importance of mountains for the wind environment in the city. Both upslope and downslope winds were observed at one site, whereas downward air motions predominated at another site. The high temperature and high concentration of fine particulate matter during HPEs were caused by a significant reduction in both horizontal and vertical wind speeds that established conditions favorable for heat and air pollutant accumulation, and by the prevailing westerly wind promoting transboundary air pollution. The findings of this study are anticipated to provide valuable insight for weather forecasting and air quality studies. The 3DREAMS will be further developed to monitor upper atmosphere wind and air quality over the Greater Bay Area of China.

Graphical Abstract

1. Introduction

Heatwaves and air pollution are major environmental problems [1,2,3,4] that adversely affect human health [5,6,7,8,9,10,11,12,13,14,15,16,17,18,19]. Despite the substantial burdens on human health, the present understanding of such weather and air quality problems remains limited by insufficient data. In particular, data concerning the wind and air quality in the upper atmosphere are required for data analyses and modeling. This absence of data limits research into heatwaves and air pollution.
Extremely high temperatures and air pollution may occur simultaneously because of their shared atmospheric driving conditions. For this study, an event featuring extremely high temperatures and air pollution was defined as a hot-and-polluted episode (HPE). The synergy between high temperatures and air pollution can result in serious public health burdens. Lee et al. [20] investigated a period of abnormally high temperatures and air pollution in the United Kingdom. They determined that the regional entrainment of air from the upper atmosphere caused early morning increases in ozone during the episode and increased biogenic emissions under high temperatures. Stedman [21] reported that this increase in ozone and particulates caused more than 400 and 700 additional mortalities in England and Wales, respectively. Therefore, a more comprehensive understanding of the formation mechanism of such episodes is required.
In addition to local emissions, transboundary air pollution (TAP) is a major contributor to serious air pollution [14,22]. For example, studies have reported the severe TAP in the Greater Bay Area of China [23,24,25,26,27] and the resultant health impacts [10,28]. However, the understanding of upper atmosphere TAP remains limited. To mitigate this limitation and provide forecasting of TAP and HPEs, a monitoring system is required to collect extensive data of atmospheric variables from the upper atmosphere.
Conventional measurements have focused on ground-level air quality. Since 2013, China has been releasing hourly ground-level air pollutant data covering the entire country. Previous studies have intensively investigated ground-level air quality by using surface monitoring networks [29,30,31,32] or satellite-retrieval approaches [33]. One previous study attempted to retrieve vertical structures of aerosol from various satellite observations [34]. Nevertheless, air quality at higher altitudes and the meteorological driving conditions have yet to be fully understood. Some studies have employed upper air sounding data to investigate the meteorology at various altitudes [35,36]. However, such data are typically measured only two to three times per day because of the high cost of data collection. In addition, upper air sounding data are collected using a helium balloon that carries devices for meteorological measurement. Therefore, the measurement locations are dependent on the horizontal and vertical wind velocities at various altitudes. Although sounding data provide a valuable data set for upper atmosphere meteorology, methodological characteristics prevent the colocation and high time resolution required for conducting air quality studies.
To overcome data availability problems, Light Detection and Ranging (LiDAR) can be used for remote atmospheric sensing [37]. For example, an intercomparison study took place at Mace Head, Ireland [38] where one LiDAR and two co-located ceilometers were validated against the boundary-layer height derived from radiosoundings. As preparation for the European Space Agency ADM Mission [39], an intercomparison campaign that held in southern France showed the feasibility of the direct detection Dopple wind LiDAR technique to retrieve the horizontal wind speed atmospheric profile. A single Doppler LiDAR unit can perform wind profiling and air quality monitoring [40,41,42]. For example, Hong Kong International Airport applied Doppler Lidar to monitor wind shear near the airport [43,44,45]. The laser beam of their lidar points toward the departure and approach runways. Their application in Dec 2005 captured ~76% of reported wind shear events [46]. Another study applied Doppler LiDAR for evaluating offshore wind characteristics for wind energy [47]. A previous study assessed internal boundary layer structure in Hong Kong under sea-breeze conditions. The authors compared their simulated internal boundary layer with that derived from Doppler LiDAR data. This shows the importance of LiDAR for model developments [48]. Doppler LiDAR was also used for air quality research. A study applied Doppler LiDAR to investigate the characteristics of heavy particular matter pollution [49]. These studies have shown the capabilities of Doppler LiDAR for meteorological and air quality studies.
For cities with considerable spatial and temporal variations in wind, a single LiDAR unit may be insufficient to provide a complete description of complex atmospheric conditions. Previous studies have reported substantial spatial wind variability [50] and TAP [25,26] in Hong Kong. To improve understanding of the wind environment and its influence on air quality in this highly dense city, a 3-Dimensional (3D) Real-timE Atmospheric Monitoring System (3DREAMS) was developed in the present study. This system can be used for air pollution studies with high spatial wind variability or TAP, especially those in Hong Kong as well as in the Greater Bay Area to investigate the interactions between cities in the region.
The aim of this study was to develop the 3DREAMS using more than one Doppler LiDAR unit. The method is described in Section 2. Section 3 presents the results of comparison between the LiDAR data and upper air sounding data as well as those of the analyses for annual and episodic wind profiles. Conclusions are provided in Section 4.

2. Materials and Methods

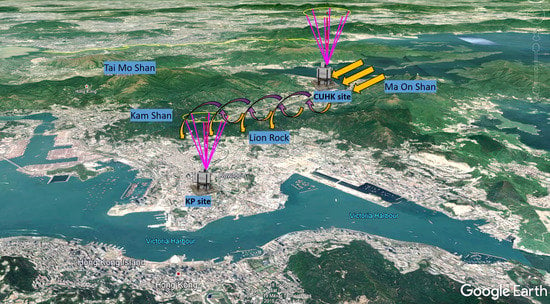
Two 1.5-µm Doppler LiDAR units (Halo Photonics Stream Line Scanning Doppler LiDAR system) were employed for the development of the first stage of the 3DREAMS. The One LiDAR unit was installed at the Physical Geography Experimental Station of the Chinese University of Hong Kong (CUHK), and the other unit was installed at the Hong Kong Observatory weather station: King’s Park (KP). The locations of the two LiDAR units are shown in Figure 1. The CUHK site is located in northeastern Hong Kong and has an elevation of 5 m above sea level. This site is surrounded by mountains, including Ma On Shan (≈700 m), Lion Rock (≈500 m), Kam Shan (≈370 m), and Tai Mo Shan (≈957 m), as shown in Figure 1. The KP site is located in the downtown area of Hong Kong and has an elevation of 65 m above sea level.
The LiDAR units were configured to retrieve aerosol backscatter and wind profiles in the boundary layer up to approximately 3 km above ground level. The principle of the Doppler LiDARs is that laser pulses are emitted by a transmitter and the reflected signals scattered by particles are received by a receiver which is built with the transmitter in the same unit. Particles, which are transported by horizontal wind, induce a Doppler shift as reflected in backscattered light signals. Through measuring the line-of-sight Doppler wind values, the optical heterodyning in the receiver determines the horizontal wind vector.
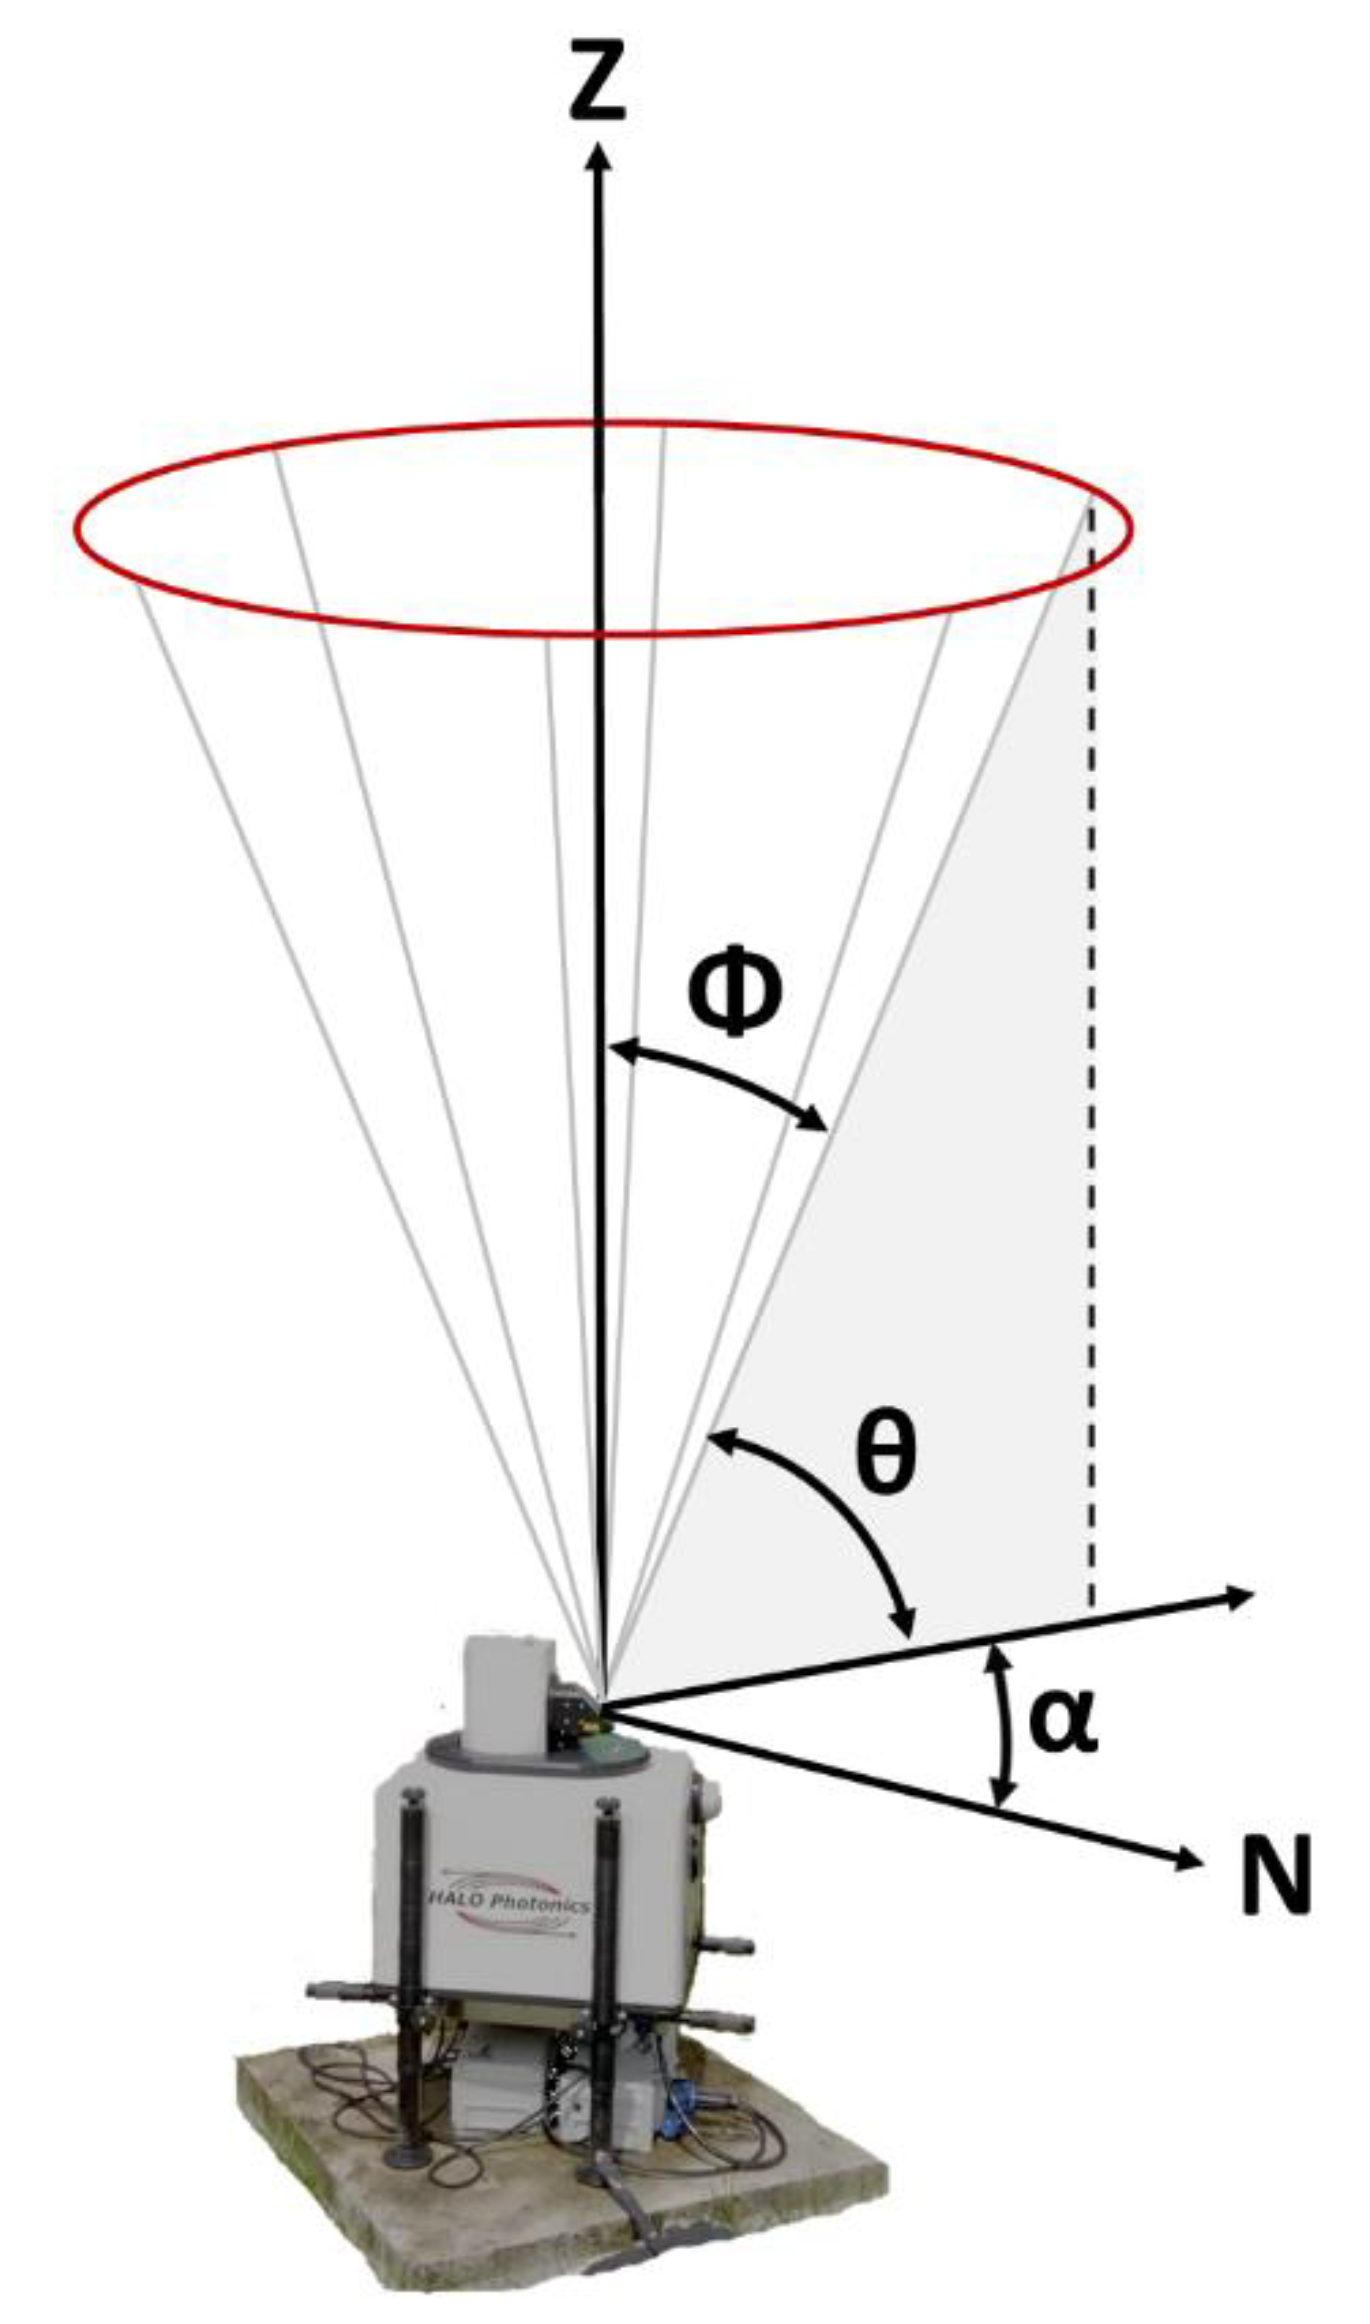
This study employed the both stare and velocity-azimuth display (VAD) scanning methods to measure horizontal wind information. Figure 2 depicts the schematic diagram of the stare and VAD scanning methods. The stare scan refers to a scanning using a continuous vertically pointing laser beam with Φ = 0° and θ = 90°. The stare scan was configured to operate at height and temporal resolutions of 30 m and 1 s, respectively. For the VAD scan, the LiDAR units were set to have six azimuthal positions at a constant interval of an azimuth angle α = 60° with a constant evaluation angle of θ = 75° (Φ = 15° with respect to the zenith) at a 10-min interval. For quality control, the data with a signal-to-noise ratio less than −20 dB were removed.
Before their operations, the two LiDAR units were calibrated by the LiDAR manufacturer and validated using a colocation comparison test. The colocation comparison results confirmed consistency between the LiDAR units with a 95% confidence interval, thus indicating an acceptable calibration. Regular maintenance checks were conducted during operation. The LiDAR windows were cleaned hourly through automatic wiping and weekly with an optical cleaning solution. In addition, horizontal leveling checks were conducted weekly to correct for any settling, which can partly affect beam-pointing accuracy. The precision of the leveling was within ±1°. The literature has reported the limitation of LiDAR performance in complex terrain [51,52,53]. The LiDARs’ were configured and checked to make sure surrounding mountains would not significantly affect the LiDARs’ performance, which could be further confirmed by a comparison between LiDAR data and available upper air sounding data at the same site. The comparison results are shown in Section 3.1.
Analyses in this study were conducted using data collected during the spring, summer, fall, and winter of 2019, which were defined as February–April, May–August, September–October, and November–January, respectively. The annual data availability for the CUHK and KP sites was 94% and 82%, respectively.
The annual mean vertical profiles of horizontal wind speed and direction and vertical wind velocity were investigated, and the vertical profiles during HPEs were analyzed. HPEs were defined by a temperature of ≥28.2 °C [54] and more than 50% of air quality stations reporting a concentration of fine particulate matter with an aerodynamic diameter ≤ 2.5 µm (PM2.5) higher than or equal to the median of the 90th percentile of daily PM2.5 of all stations for the year (33.2 µg/m3). The previous study [54] reported a statistically significant increase in premature mortality risk for an average 1 °C increase in daily average temperature above 28.2 °C. Overall, nine HPEs were identified during 2019. Information concerning these HPEs is provided in Table 1. The PM2.5 concentration data at 16 air quality monitoring stations were obtained from the Hong Kong Environmental Protection Department (http://www.aqhi.gov.hk/en.html). The temperature and surface wind, and the upper air sounding data at the KP weather station (latitude: 22°18′43′′; longitude: 114°10′22′′) were obtained from the Hong Kong Observatory (https://www.hko.gov.hk/en/cis/stn.htm).

3. Results

3.1. Comparison with Upper Air Sounding Data

LiDAR data were compared with the available upper air sounding data located at the same site. Figure 3 shows that the LiDAR units captured the general vertical profiles of horizontal wind speed and direction. Differences at heights less than 0.50 km were negligible, whereas those for heights greater than 0.50 km were more substantial. As discussed in the methods section, the measurement locations of the upper air sounding data varied with the wind velocities at the various measurement altitudes, possibly resulting in different measurement locations for the two data sources. The percentage difference between the averaged horizontal wind speeds of the two data sources for heights less than 1.00 km was less than 10%, which indicates sufficient agreement between LiDAR and upper air sounding data.
Figure 4c depicts the seasonal vertical profiles of horizontal wind speed based on the LiDAR measurements at the KP site, whereas Figure 4d shows the seasonal vertical profiles of horizontal wind speed averaged from the upper air sounding data throughout the entire year. The results show a high agreement between the profiles, despite the fact that the time resolution of the two data was different.

3.2. Horizontal Wind Speed

3.2.1. Annual and Seasonal Vertical Profiles

Figure 4a presents the annual vertical profiles of horizontal wind speed at the CUHK and KP sites. The results reveal the horizontal wind speed was higher at KP than at CUHK. The KP site is located in an urban area, whereas the CUHK site is located in a suburban area. The lower horizontal wind speed at the CUHK site may be attributable to the complex topography near the site [50].
Figure 4b,c present the seasonal vertical profiles of horizontal wind speed. At the CUHK site, the mean wind speed for heights less than 1.00 km was higher in summer (6.4 m/s) than in other seasons (5.4, 4.6, and 4.6 m/s for spring, fall, and winter, respectively). For heights less than 0.42 km, the wind speeds in spring and fall were similar, whereas, for height between 0.42 km to 1.00 km, the wind speed in spring was clearly higher than that in fall. For heights of 1.60 to 2.00 km, the wind speeds in spring and winter were higher than those in summer and fall.
Similarly, at the KP site, the mean wind speed for heights less than 1.00 km was the highest in summer (7.6 m/s), followed by spring (6.8 m/s), winter (6.2 m/s) and fall (6.1 m/s). For heights less than 0.48 km, the wind speed was the highest in spring; for heights between 0.48 km and 1.74 km, the wind speed in summer was clearly higher than those of other seasons. For heights of 1.74 to 2.00 km, the wind speed was the highest in winter; nevertheless the seasonal difference at that level at KP was not significant as that at CUHK.
To understand the seasonal variation, the seasonal vertical profiles of wind speed measured by upper air sounding as well as the wind speed at 10 m above ground (wsd10m) at three automatic weather stations were analyzed. The similar seasonal trend was also shown in the upper air sounding data, see Figure 4d. Despite the fact that the upper air sounding only provided two data points (08:00 and 20:00 HKT) in a day, the sounding vertical profiles confirm the LiDAR seasonal profiles. Table 2 lists seasonal wsd10m at various Hong Kong Observatory (HKO) stations. The wsd10m at the Waglan Island station shows an obvious seasonal wind variation with the highest wind speed in winter, followed by summer, spring and fall. Nevertheless, the wsd10m at Sha Tin station (near to the CUHK site) and the KP site was the highest in summer and spring, followed by fall and winter. It is noted that the Waglan Island station is located at southeast Hong Kong, which is not affected by any mountains and buildings, and thus serves as a background weather station for Hong Kong. The different seasonal wind speed clearly demonstrates the influence of topography on wind environment in Hong Kong and supports to the findings of vertical wind profiles.

3.2.2. Diurnal Vertical Profiles

Figure 5 shows the diurnal vertical profiles of horizontal wind speed. Similar to the annual vertical profiles, the diurnal horizontal wind was stronger at the KP site than at the CUHK site. The diurnal vertical profiles exhibited clear peak wind speeds for heights of 0.84 to 1.98 km at CUHK and 0.81 to 1.98 km at KP. The results reveal a clear vertical gradient of horizontal wind speed at the two LiDAR sites from 21:00 to 12:00 HKT. The maximum hourly mean wind speed was 10.6 m/s, which occurred at 20:00 HKT and 15:00 HKT at CUHK and KP, respectively. The minimum hourly mean wind speeds were 6.6 m/s and 7.8 m/s, which occurred at 17:00 HKT and 19:00 HKT at CUHK and KP, respectively.
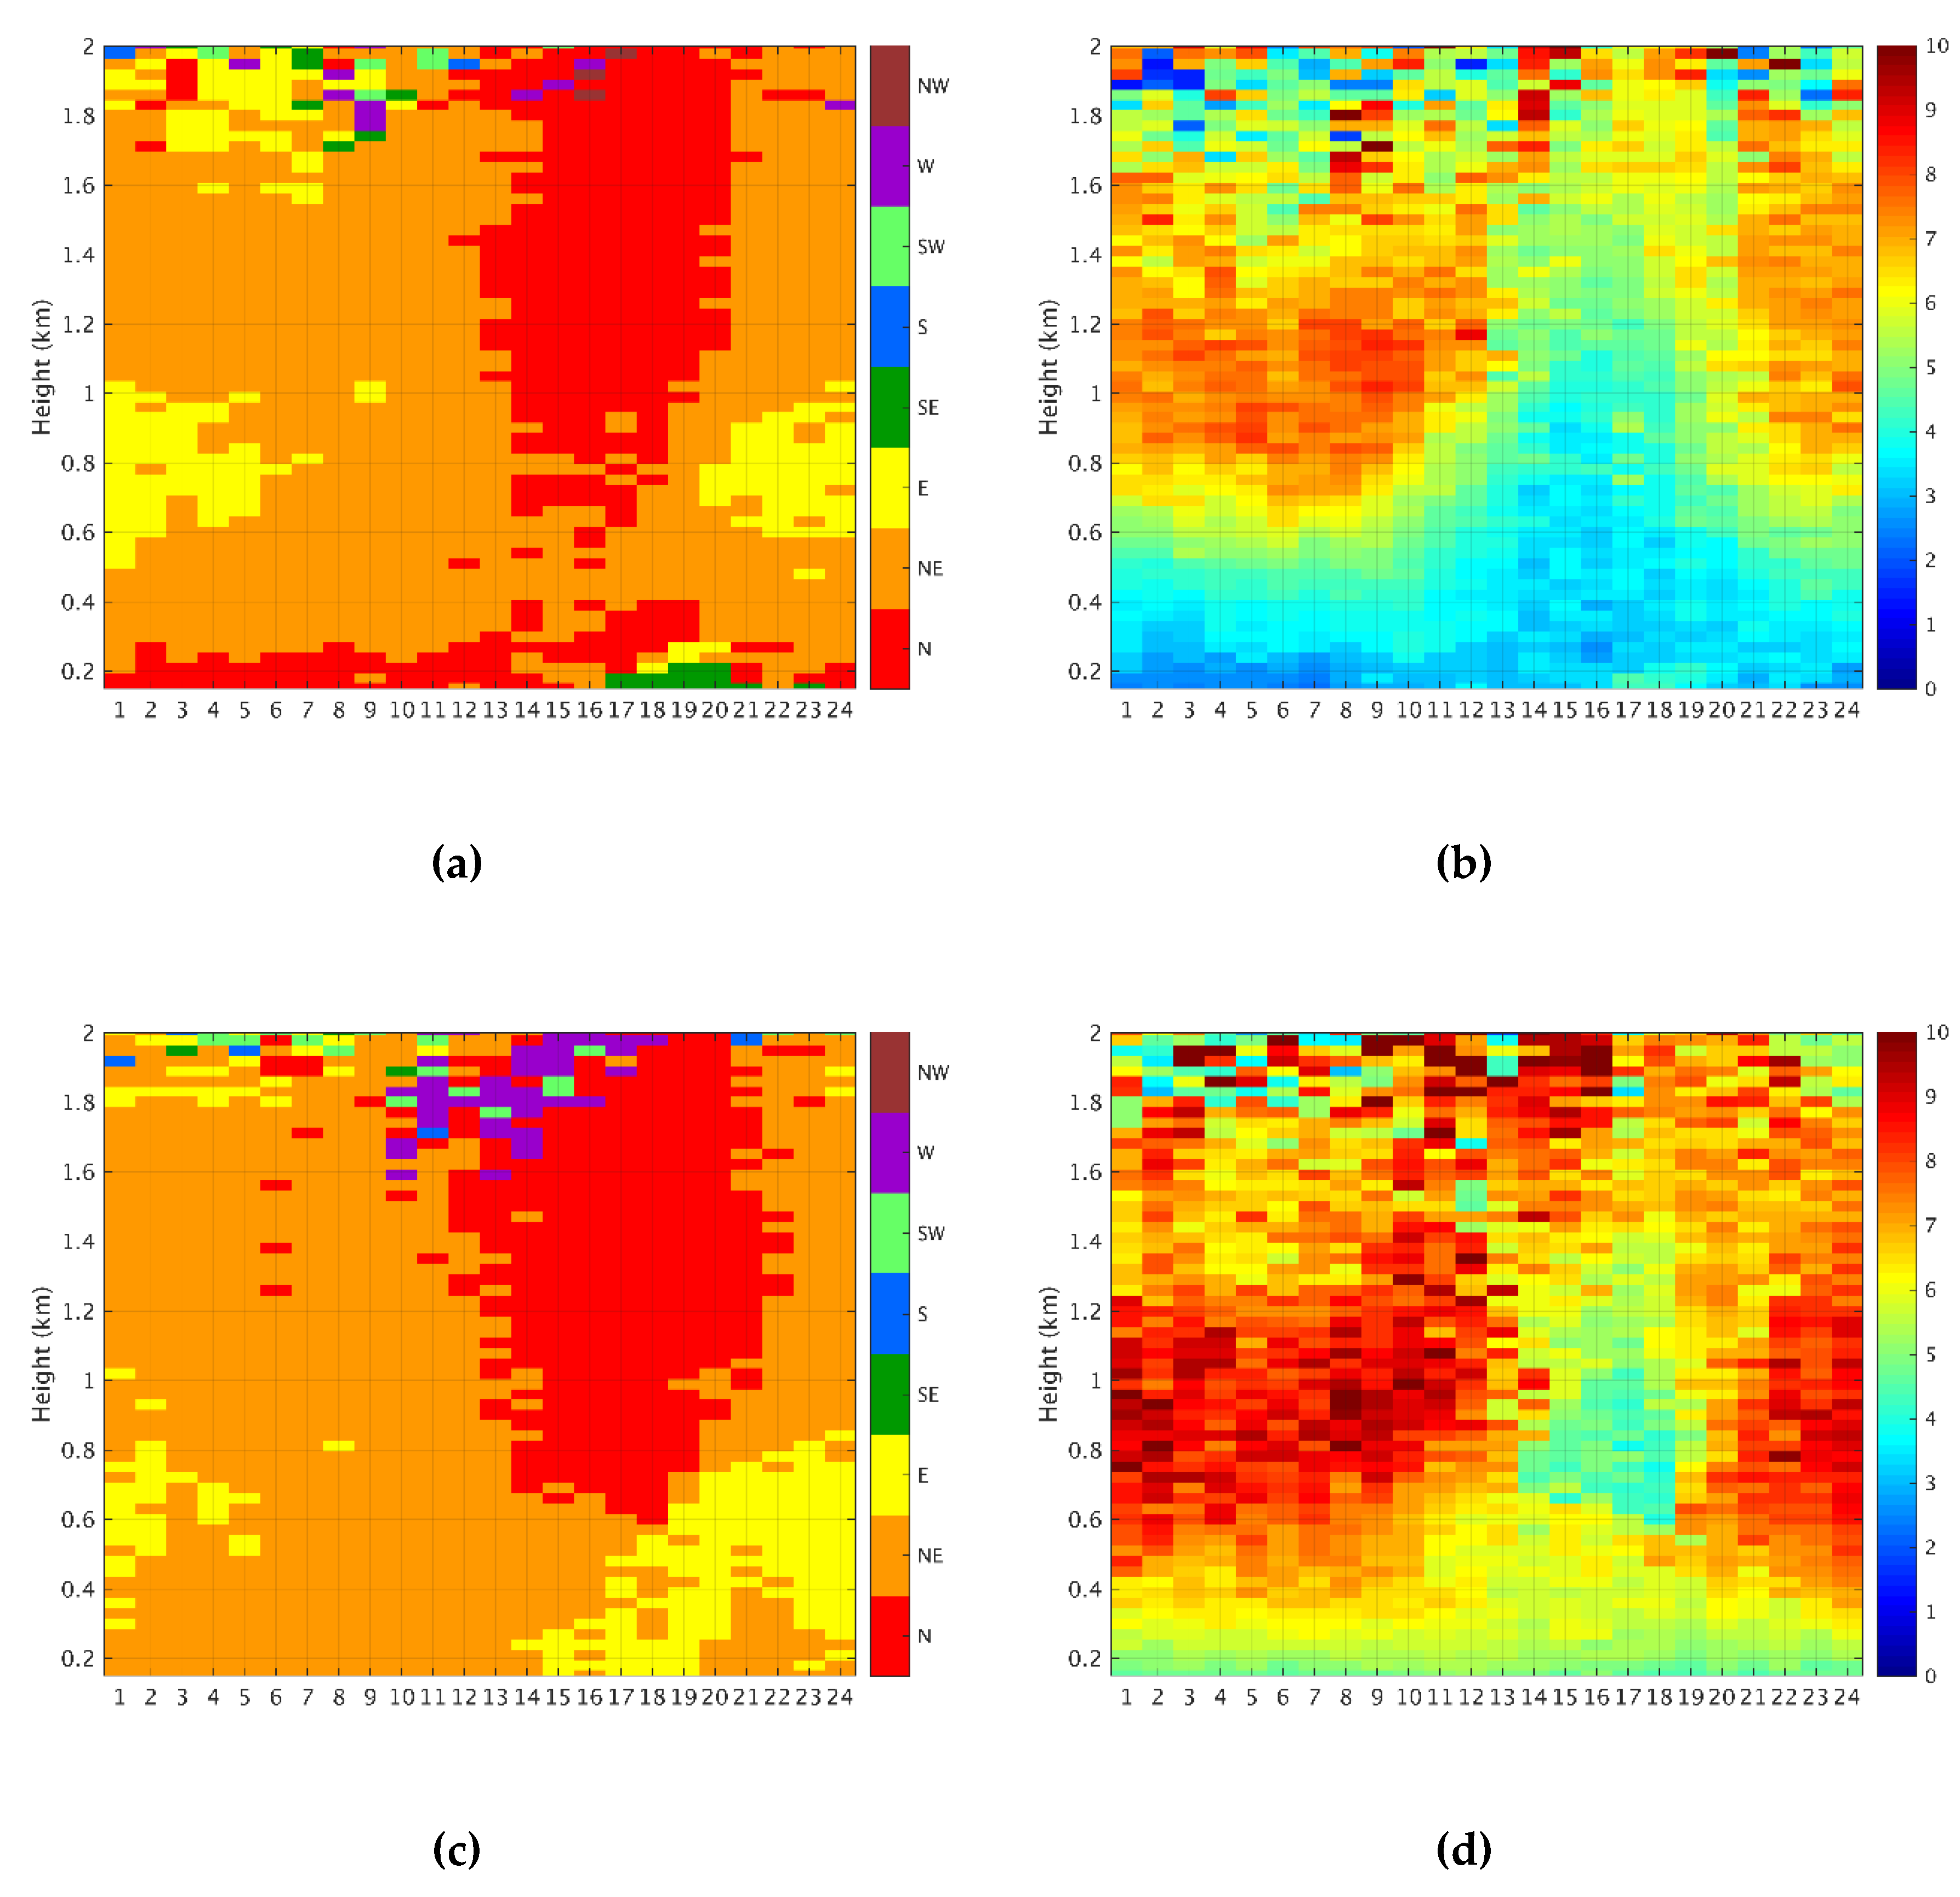
The vertical gradient was shown clearly in the averaged upper air sounding profiles, see Figure 4e. Similar to the LiDAR profiles at 08:00 HKT and 20:00 HKT, the averaged mean vertical profile at 08:00 HKT has a clear vertical gradient with a peak at around 0.80 km, whereas it was not shown in the 20:00 HKT upper air sounding profile. Figure 6 shows the diurnal vertical profiles of prevailing wind direction and the corresponding mean wind speed at the two LiDAR stations. The weaker vertical gradient of horizontal wind speed at the two LiDAR sites between 13:00 HKT and 20:00 HKT was due to the relatively weak northerly wind between 0.8 km and 1.4 km. It is noted that the northerly wind should be blocked by the topography at the north of the two sites.

3.3. Horizontal Wind Direction

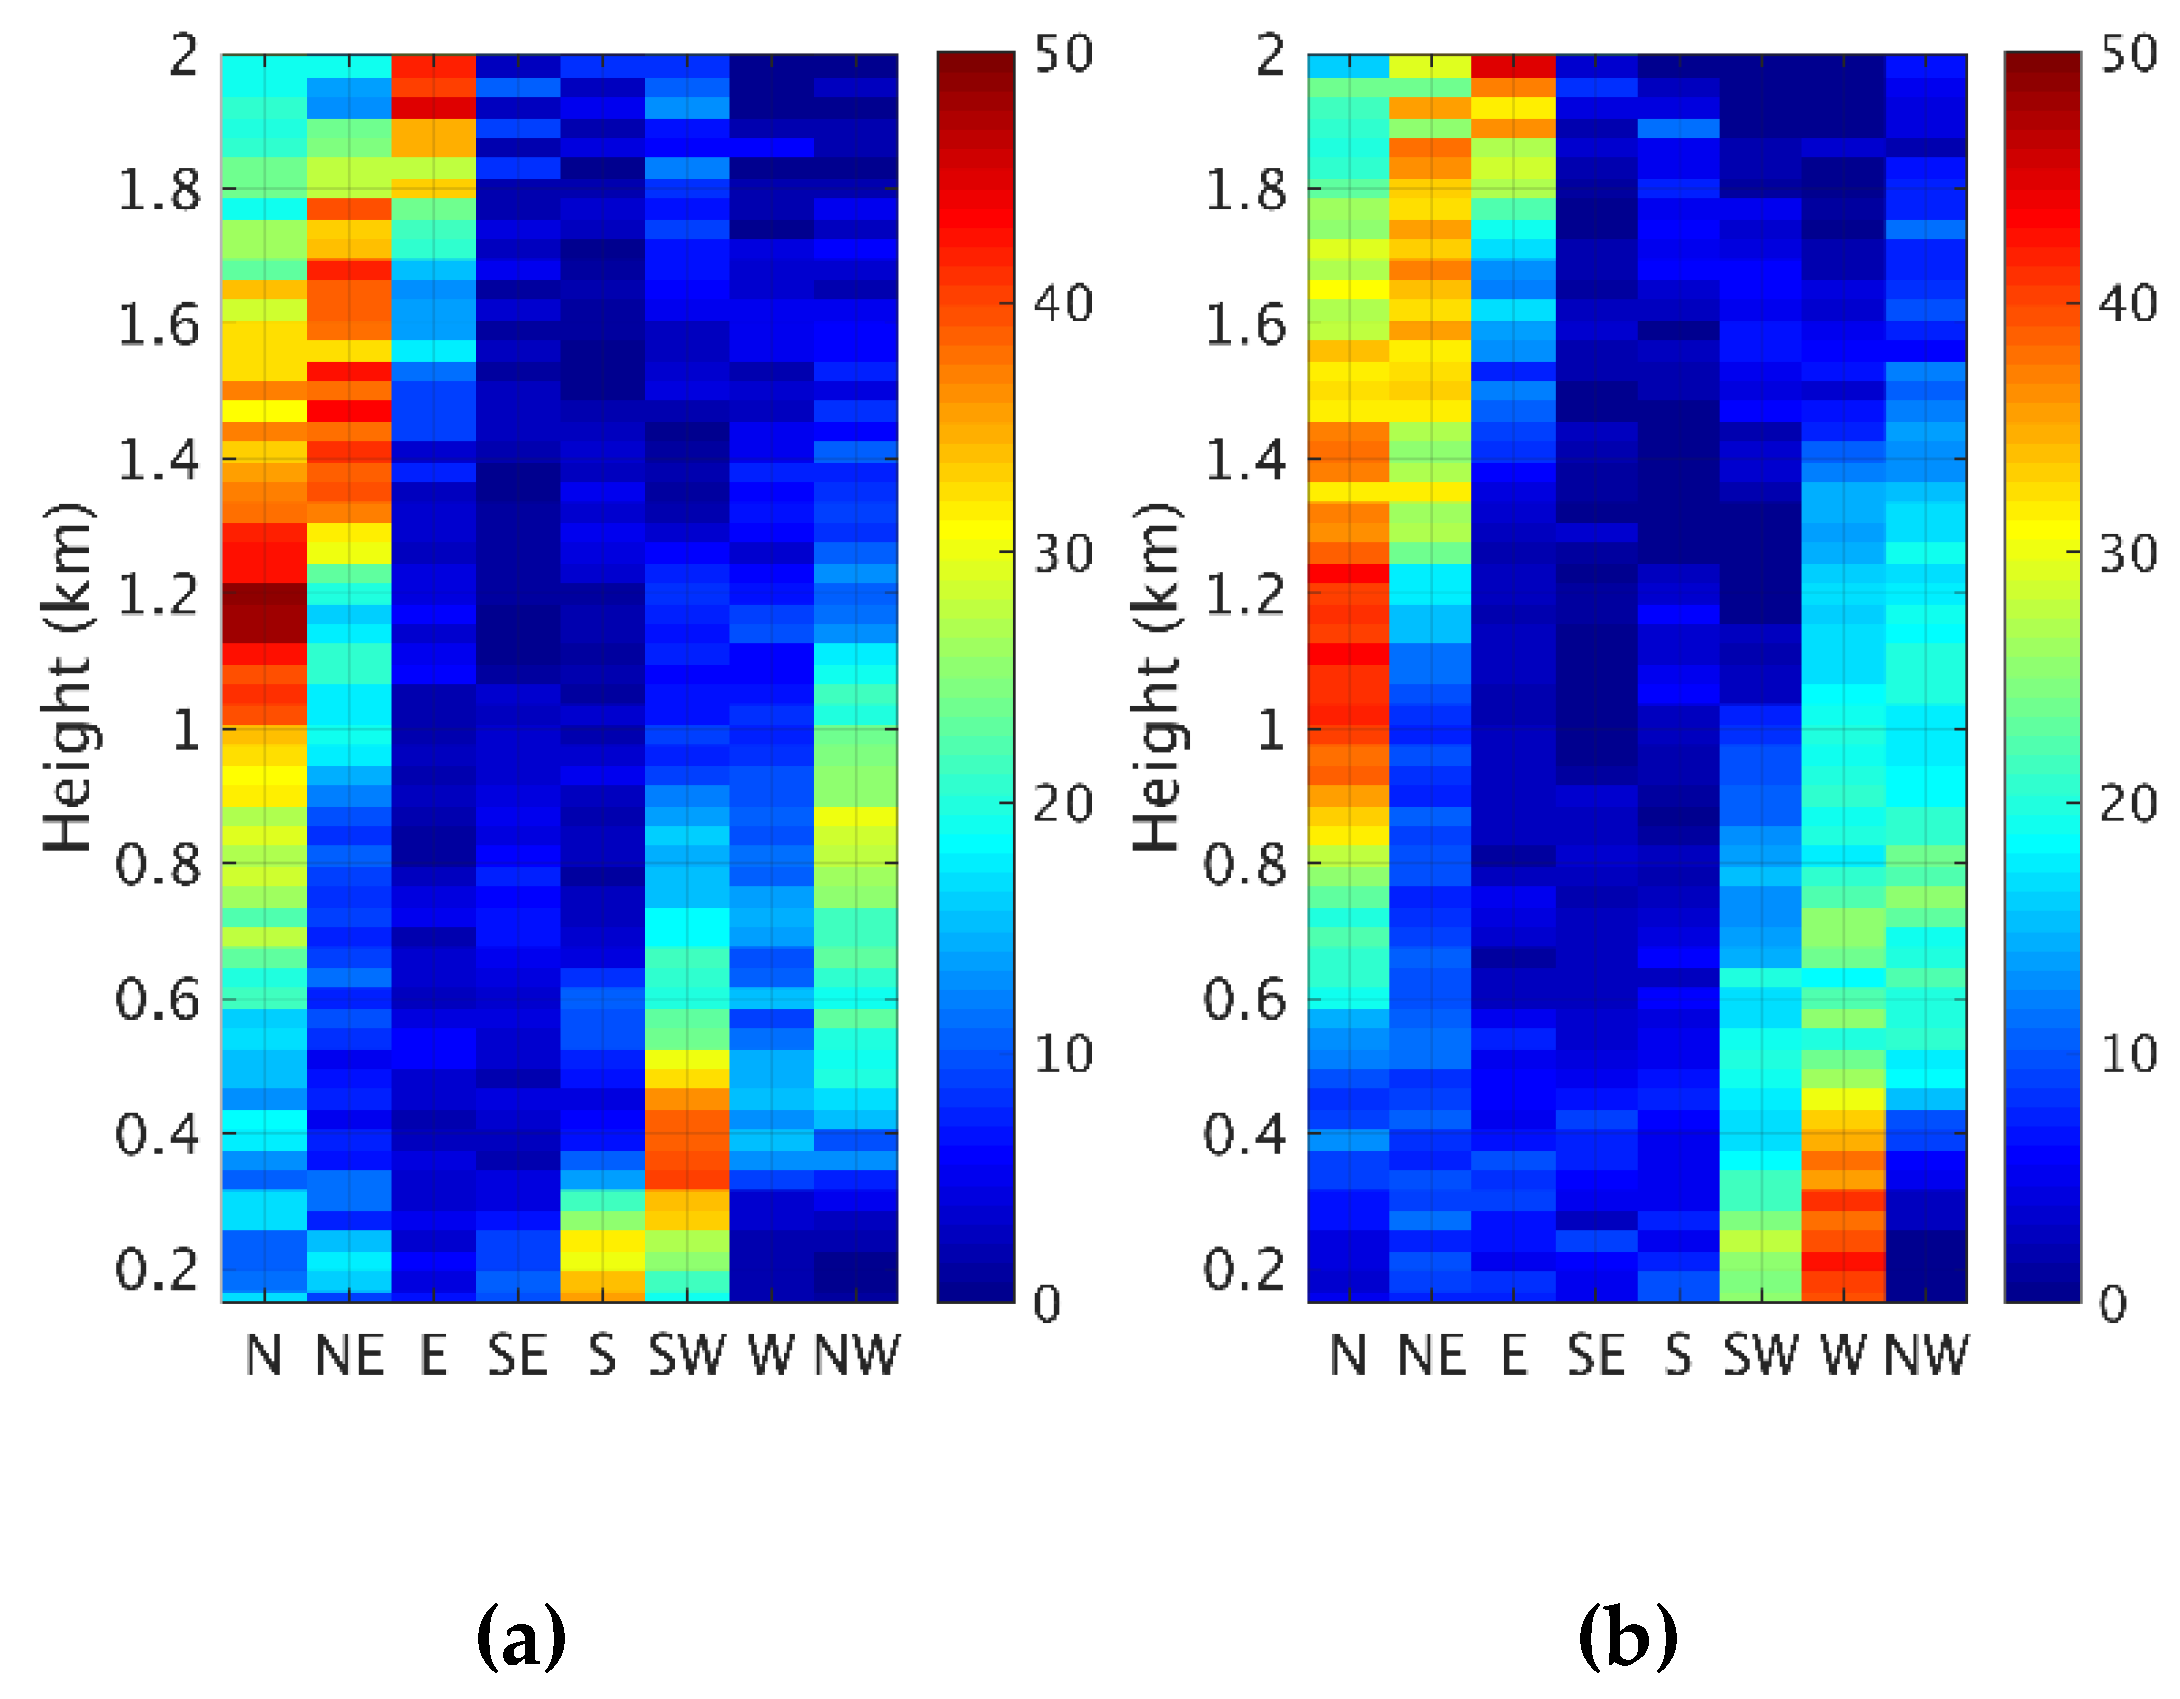
Figure 7 shows the annual vertical profiles of horizontal wind direction frequency at CUHK and KP. At CUHK, the prevailing horizontal wind direction was north for heights less than 0.20 km. The prevailing horizontal wind direction clearly shifted to northeast for heights of 0.20 to 1.80 km and to north and northeast for heights of 1.80 to 2.00 km. At KP, the prevailing horizontal wind direction was northeast for heights less than 1.70 km. Within this range, easterly wind was observed for heights less than 1.10 km and northerly wind was observed for heights from 1.10 to 1.70 km. For heights from 1.70 to 2.00 km, the prevailing horizontal wind directions were north and northeast. These results demonstrated the high spatial wind variability for heights less than 0.30 km and consistent prevailing horizontal wind direction for heights greater than 0.39 km. The high spatial wind variability was mainly due to the complex topography of Hong Kong [50], as discussed in Section 3.2.1.
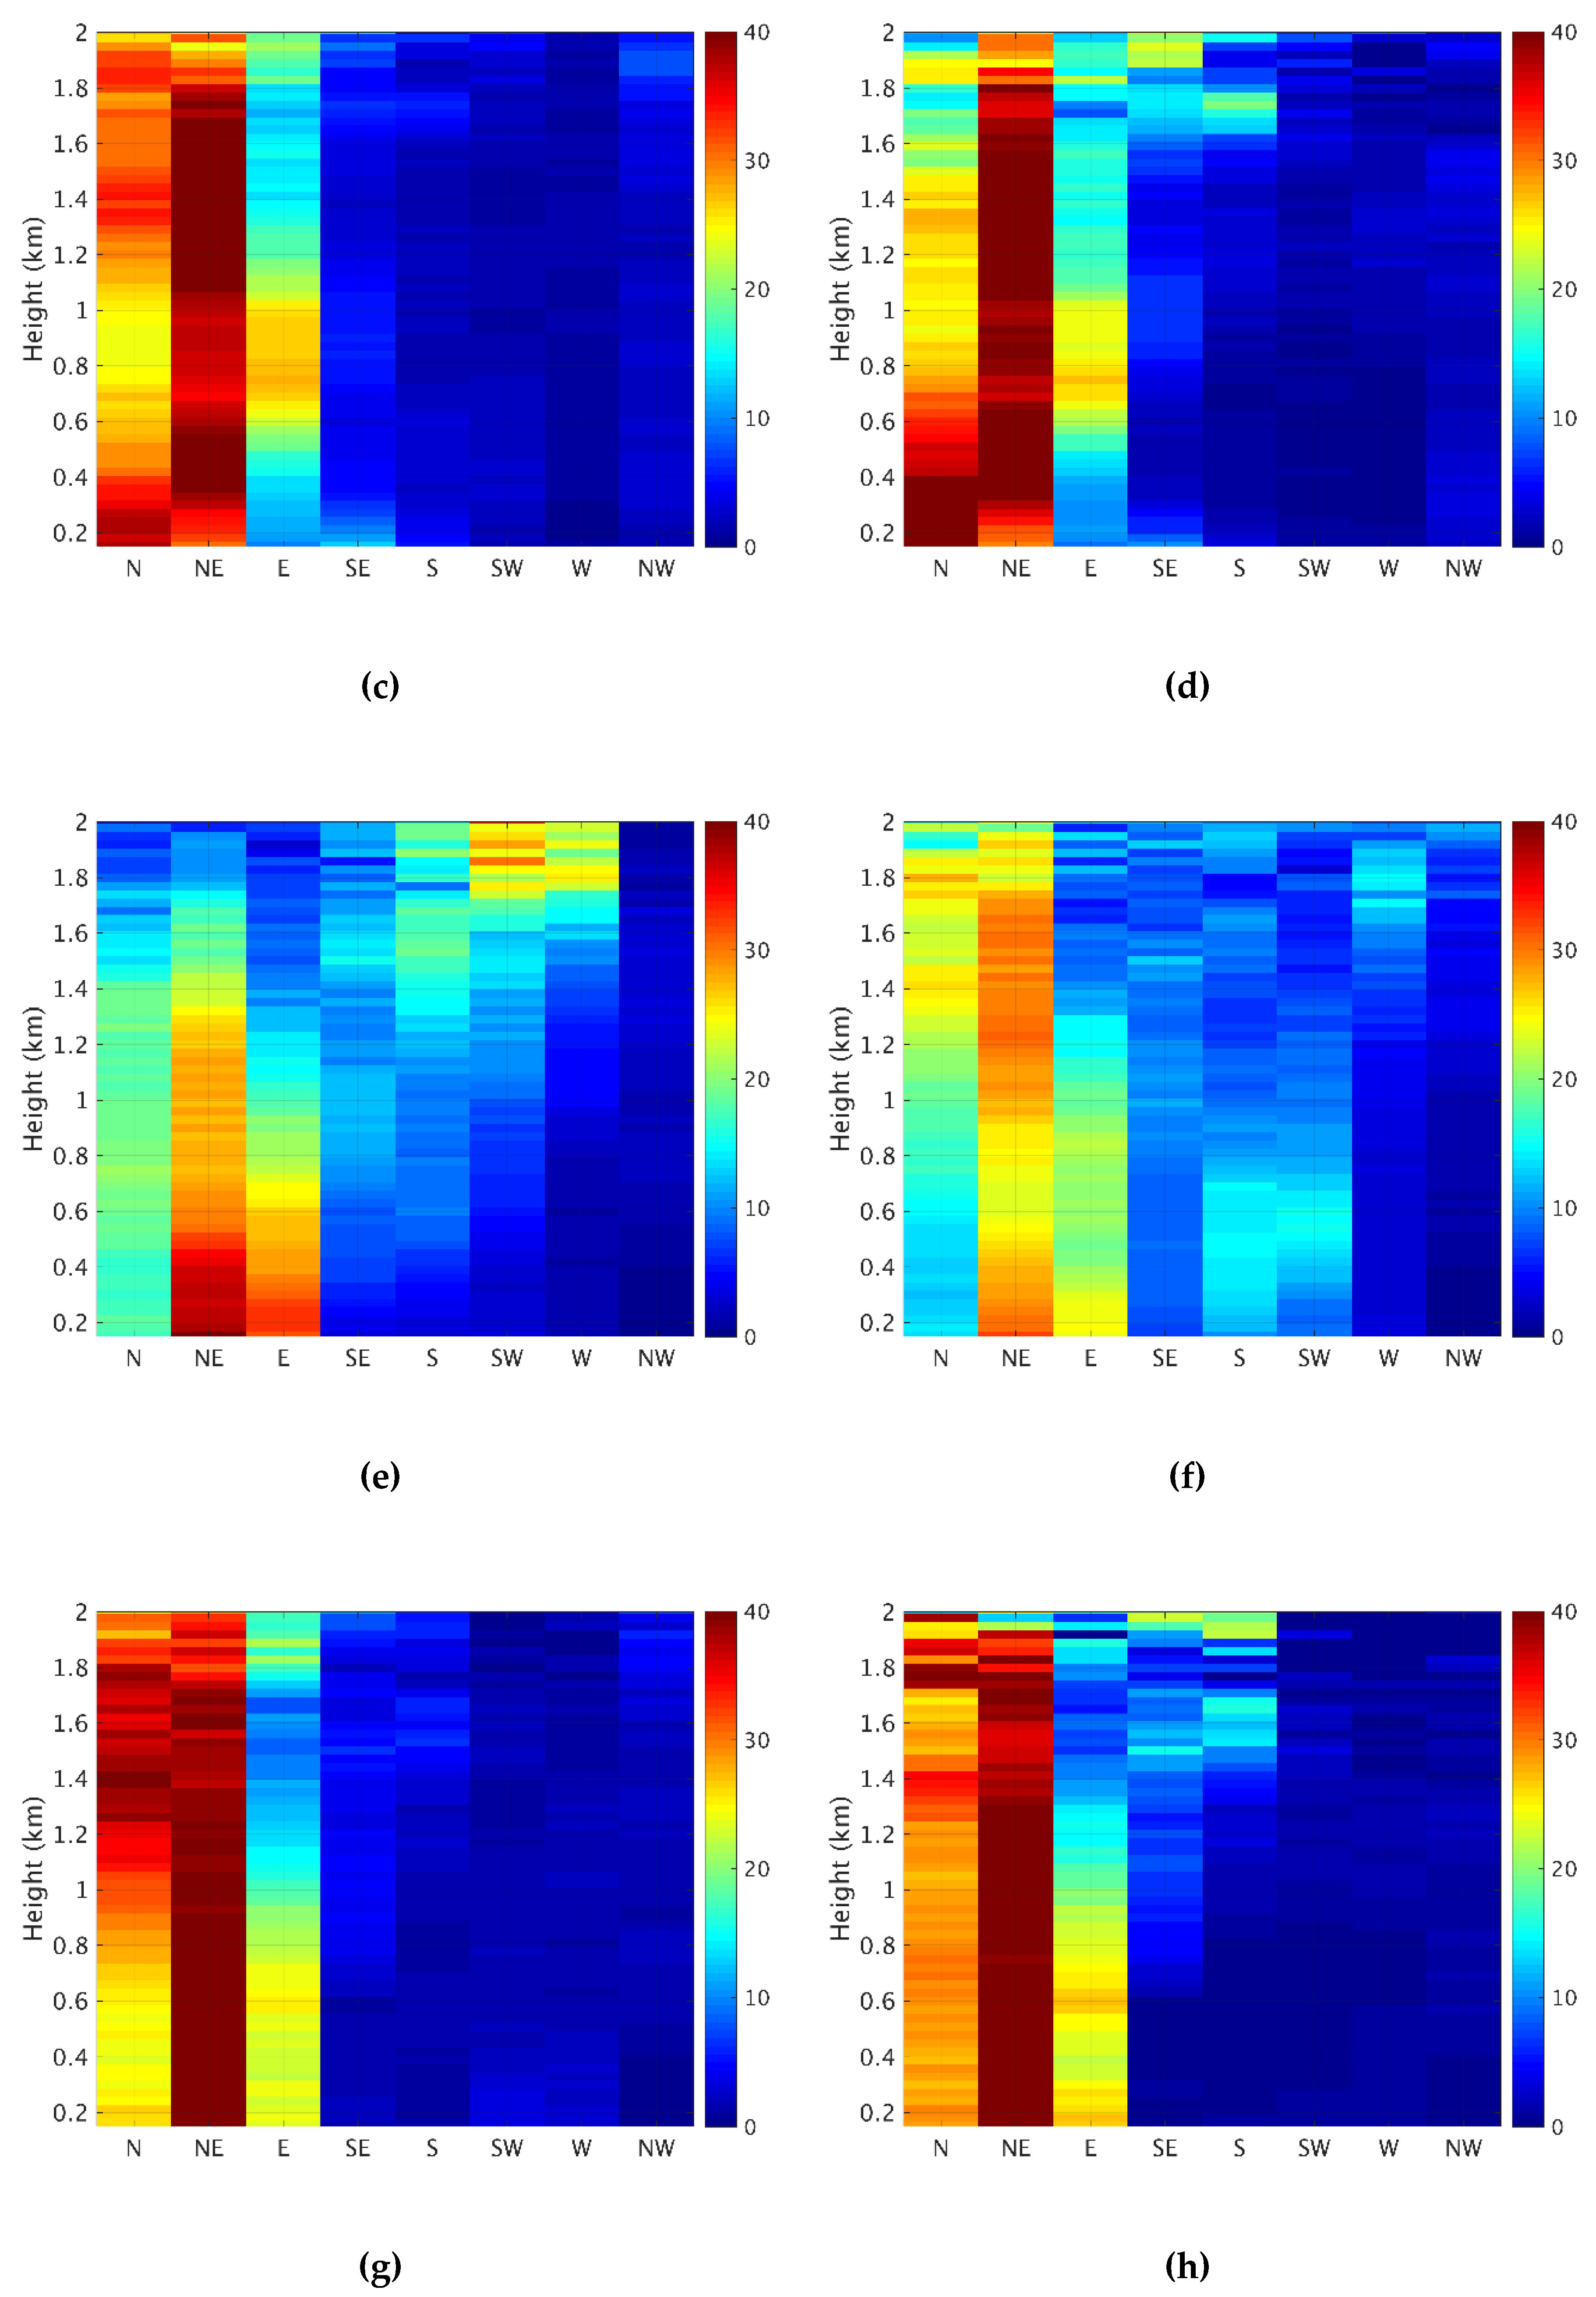
Figure 8 shows the seasonal vertical profiles of horizontal wind direction frequency at the CUHK and KP sites. In spring, the prevailing horizontal wind directions at CUHK were north and northeast for heights less than 0.60 km, whereas those at KP were northeast and east. For heights from 0.60 to 1.70 km, the prevailing horizontal wind directions at these sites were more consistent (northeast and east). For heights of 1.70 to 2.00 km, the prevailing horizontal wind directions shifted west and southwest at these two sites.
In summer, the prevailing horizontal wind directions at ground level were similar to those in spring except that southerly and southwesterly winds were more frequently noted for heights less than 1.00 km. At heights from 1.00 to 2.00 km, the prevailing horizontal wind directions at the two sites consistently shifted to north and northeast. In fall and winter, the prevailing horizontal wind directions at the two LiDAR sites were relatively stable, mainly northeast, followed by north and east.

3.4. Vertical Wind Velocity

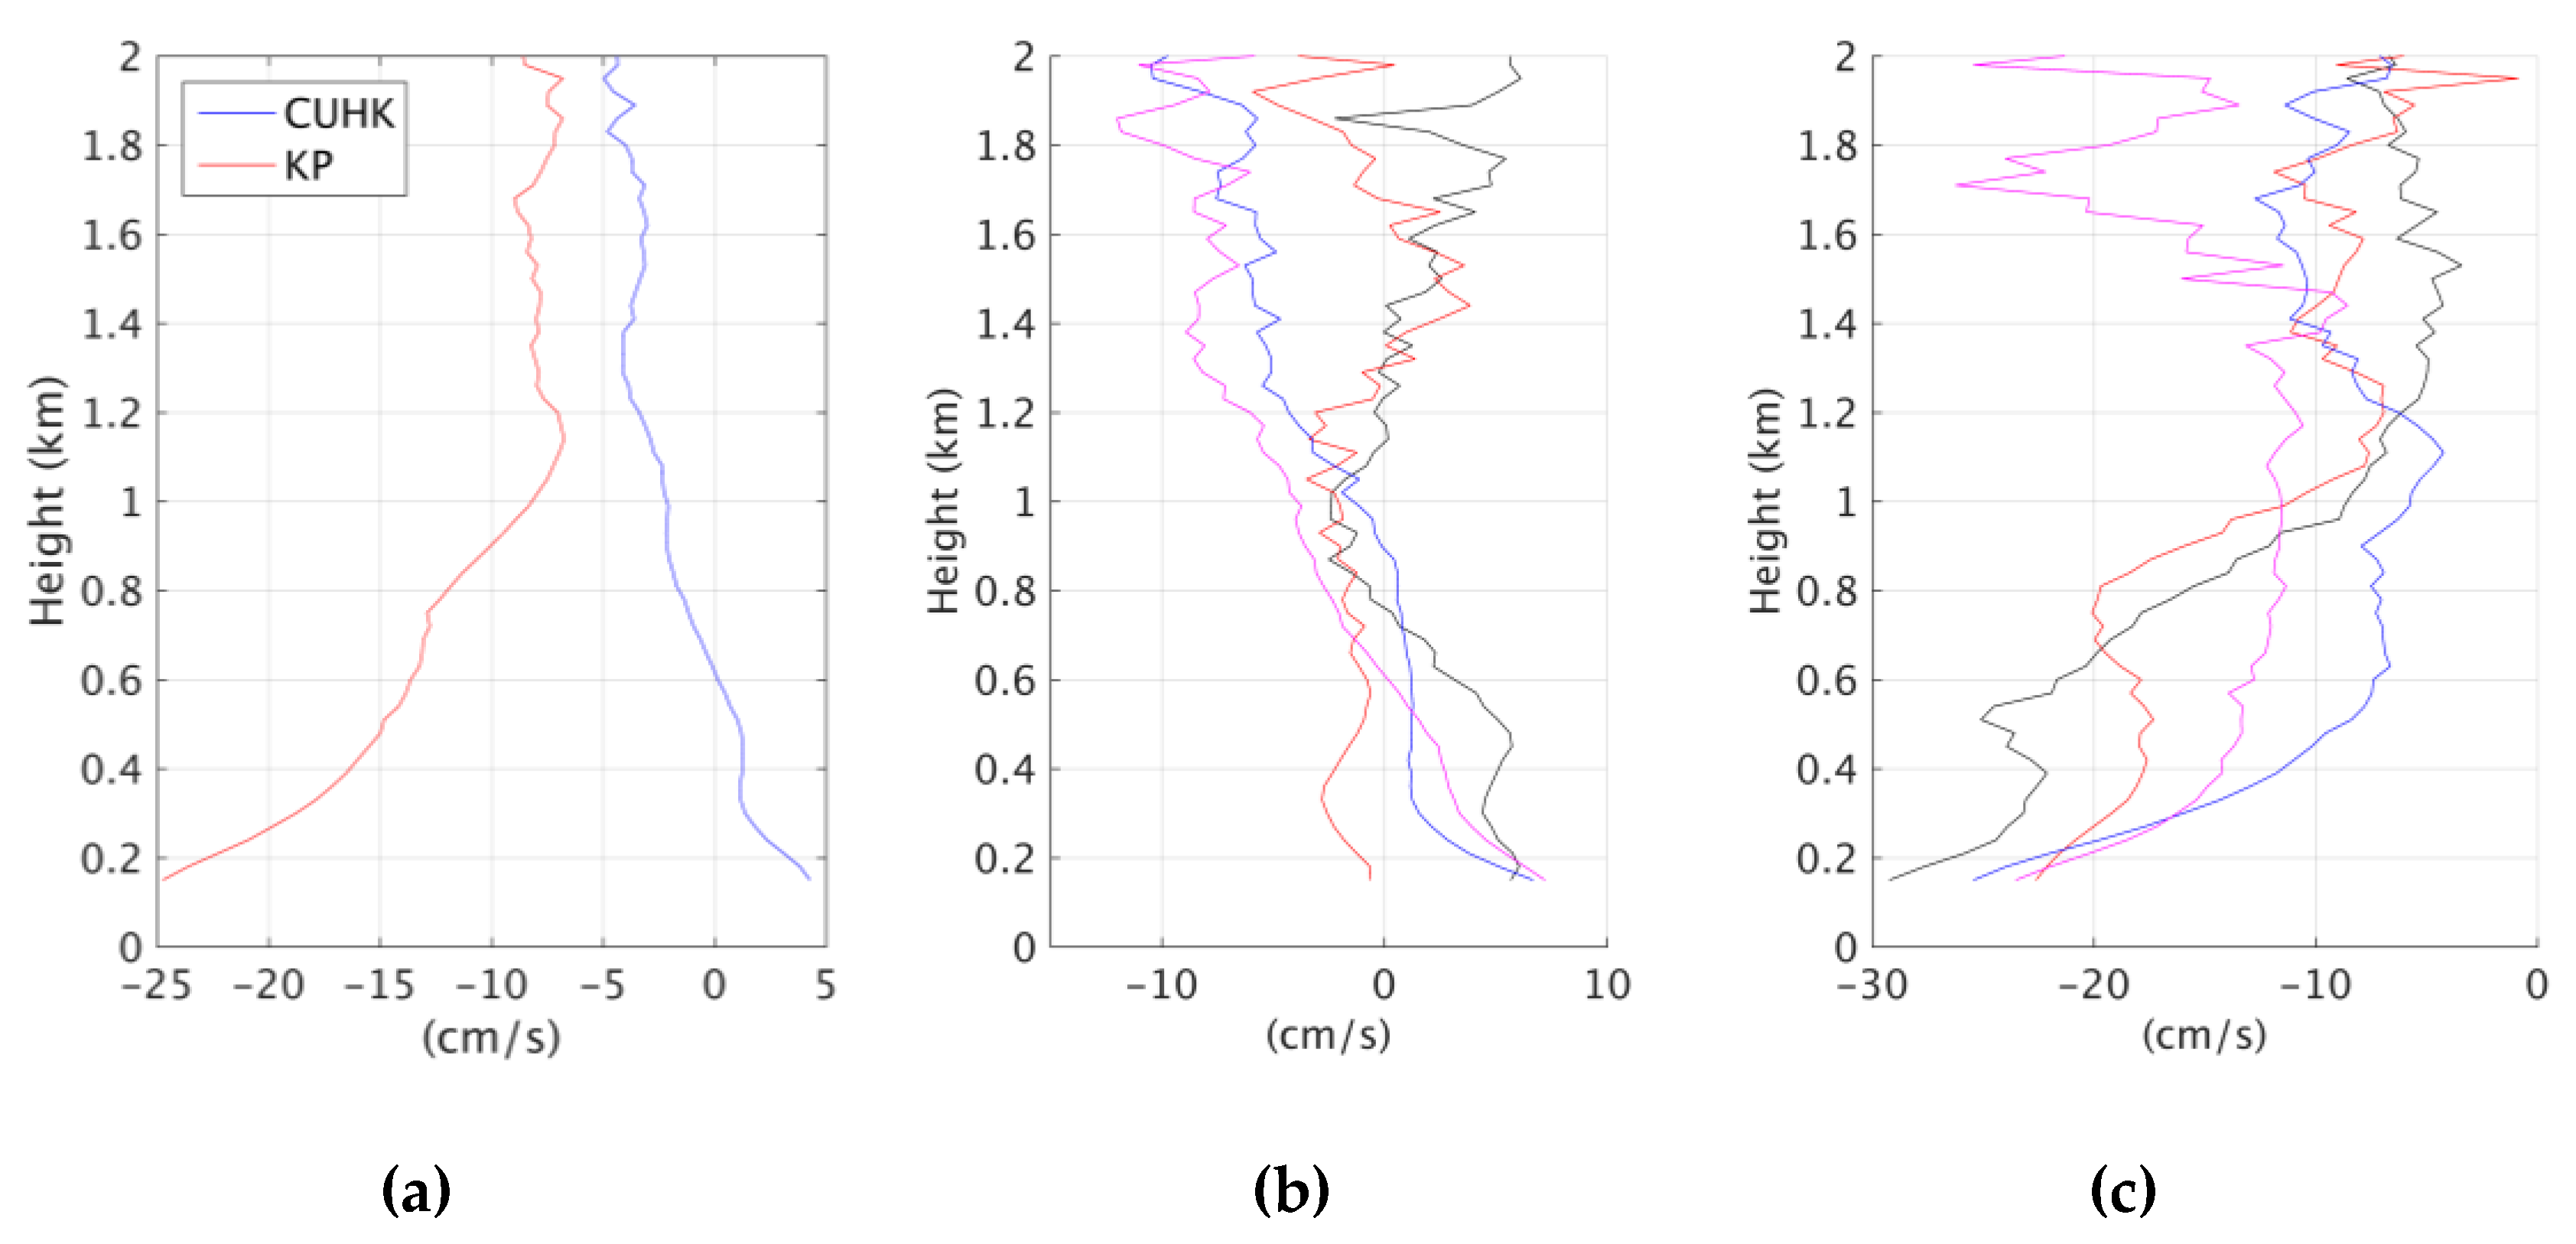
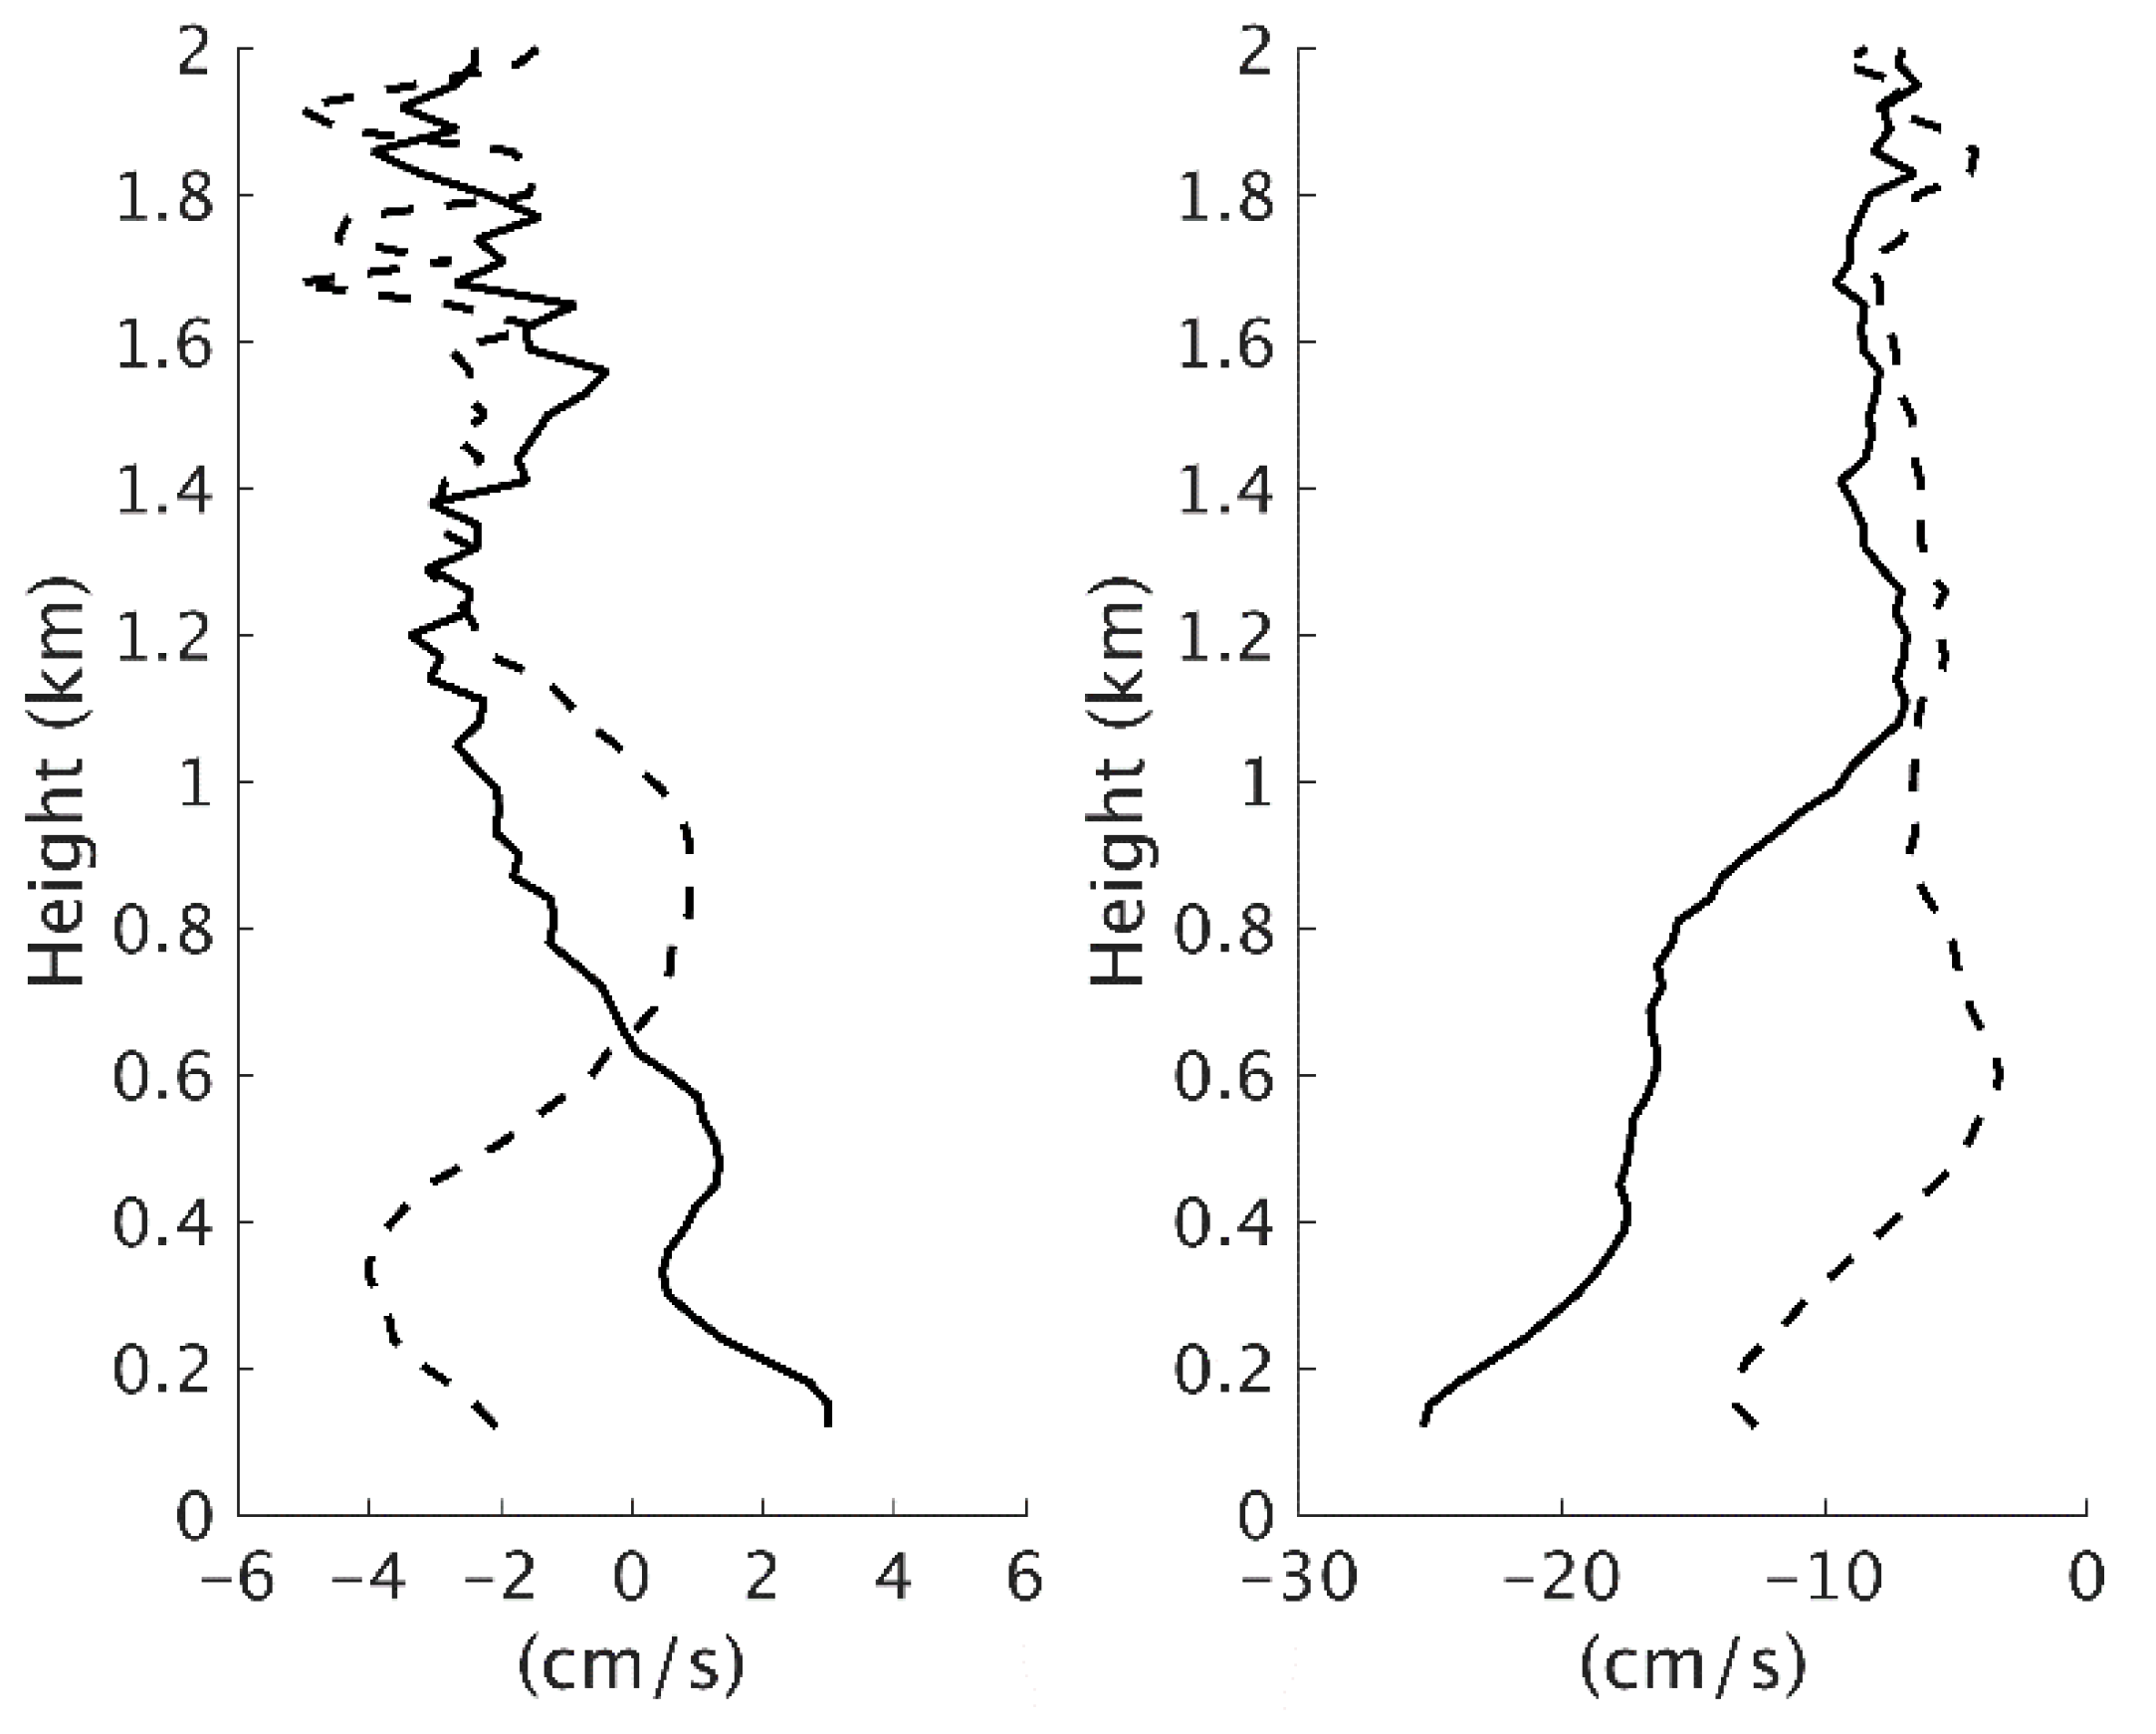
Figure 9 displays the annual and seasonal vertical profiles of vertical wind speed (cm/s) at the two LiDAR sites. At CUHK, the average vertical wind velocity for heights less than 1.00 km was −0.26 cm/s. At this site, upward and downward air motions were observed. The annual profile indicates that upward air motions dominated for heights less than 0.60 km, whereas downward air motions dominated for heights from 0.60 to 2.00 km. The upward air motions at heights less than 0.60 km may be induced by the surrounding topography. As shown in Figure 7, the prevailing horizontal wind directions at CUHK were north and northeast. The northerly and northeasterly air flows were lifted up by the surrounding topography, thus inducing upward air motions. Seasonal variations were also observed. Positive mean vertical velocities were observed in spring, fall, and winter (2.56, 1.34, and 0.59 cm/s, respectively), whereas the mean vertical velocity observed in summer (−1.34 cm/s) was consistent with the annual mean.
At KP, downward air motions dominated for heights less than 2.00 km. The annual mean vertical wind velocity for heights less than 1.00 km was −14.92 cm/s, highlighting that downward motions at KP were stronger than those at CUHK. Negative vertical wind velocities were consistent for all seasons. The strongest downward air motion was observed during spring (−20.07 cm/s), followed by summer (−18.42 cm/s), winter (−14.18 cm/s), and fall (10.90 cm/s).
Notably, when the prevailing northerly or northeasterly wind approaches Hong Kong, CUHK is located upwind, whereas KP is located downwind. For heights less than 1.00 km, the upslope wind at CUHK was clearly weaker than the downslope wind at KP. However, this difference was less apparent in summer (Figure 9b). This may be because of the unstable atmosphere that occurs during summer as a result of stronger solar radiation in that season. Relatively strong buoyancy force could be generated from the warmer ground surface. The unstable atmosphere is favorable for wind going over mountains, enhancing upslope flow [55]. On the other hand, the induced vertical rising air motion may suppress downslope flow. These two effects may reduce the difference between upslope and downslope winds in summer.

3.5. Wind Profiles in HPEs

By examining the temperature and PM2.5 data for the thresholds described in the methods section, nine HPEs were identified. Detailed information regarding each HPE is provided in Table 1 This section details wind and backscatter analyses for the HPEs.

3.5.1. Horizontal Wind Speed and Direction

Figure 4 displays the annual and HPE vertical profiles of horizontal wind speed at the two LiDAR sites, and Figure 10 depicts the vertical profiles of horizontal wind direction frequency during HPEs. Compared with annual means, the horizontal wind speeds were clearly lower during HPEs. At CUHK, the horizontal wind speed for heights less than 1.00 km during HPEs was 61.4% lower than the annual mean; the horizontal wind speed over these heights was 51.7% lower at KP. The relatively low horizontal wind speed was unfavorable for air pollutant dispersion.
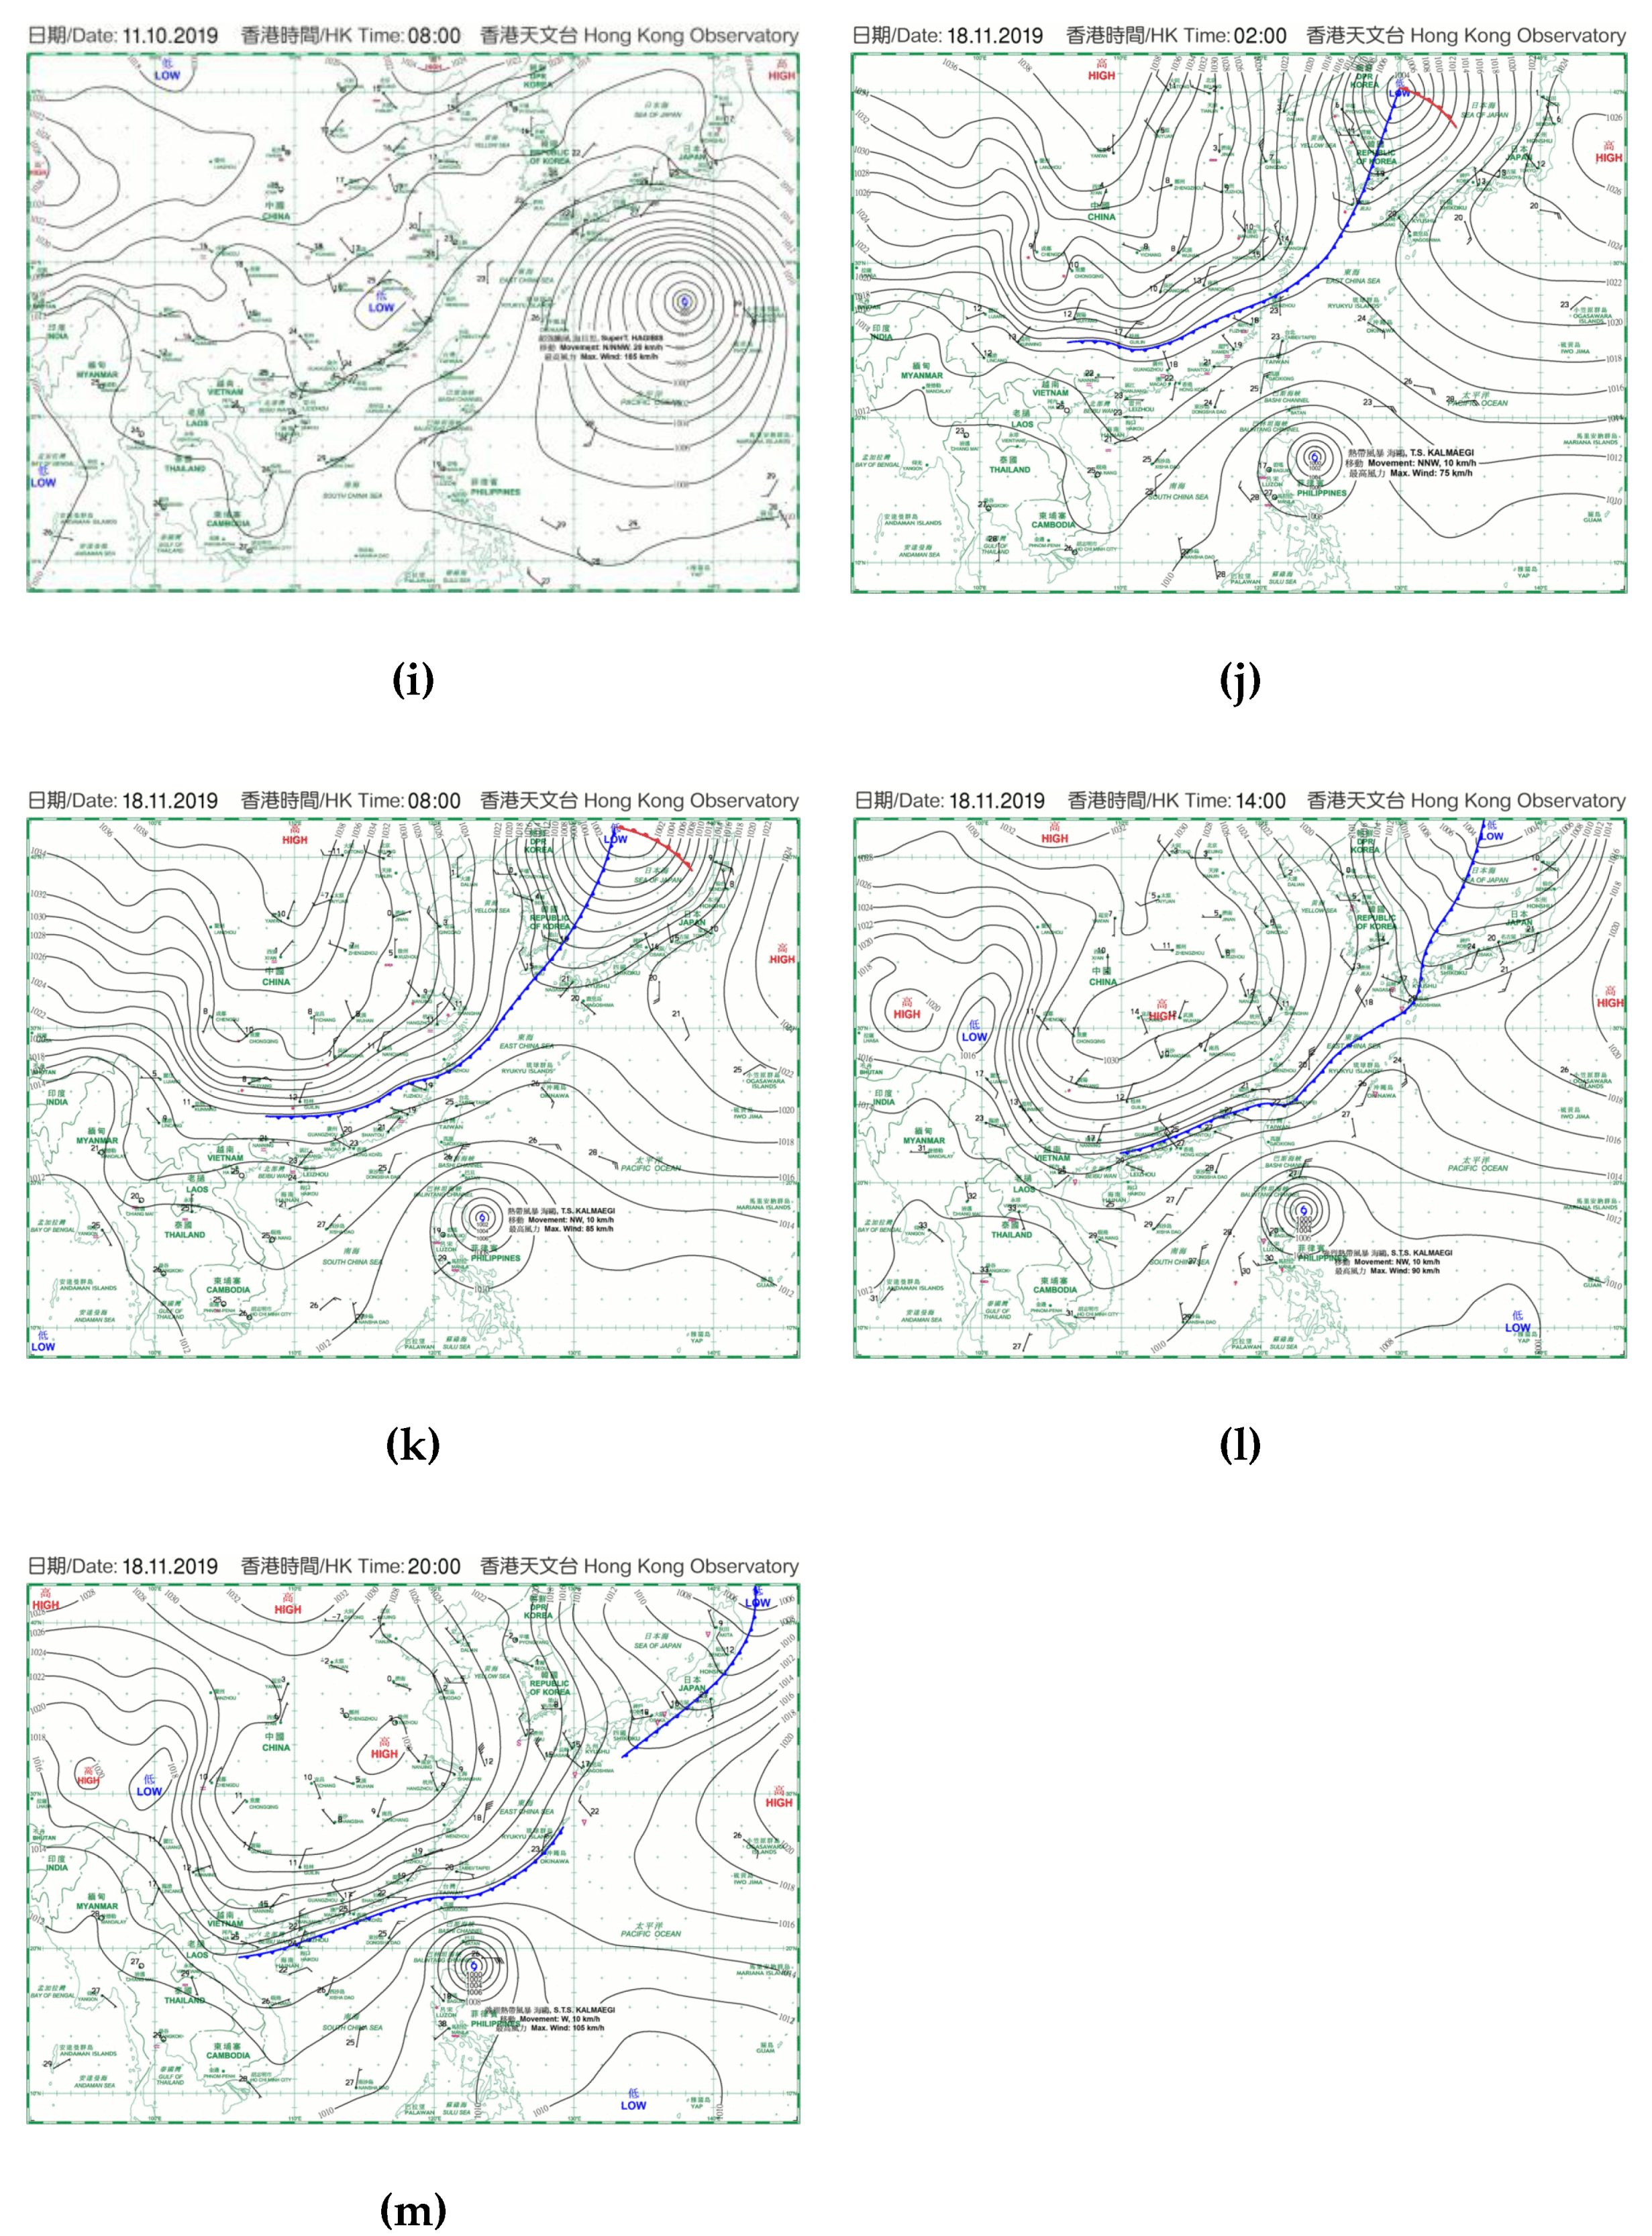
The prevailing horizontal wind directions for heights less than 0.60 km were south and southwest at the CUHK site and west and southwest at the KP site. In addition to lower horizontal wind speed, the prevailing westerly wind during HPEs introduced regional TAP from the Greater Bay Area to Hong Kong. Figure 11 depicts the weather chart of each HPE. The weather charts show that, in each HPE, a typhoon was located in South China sea (east of Hong Kong). The westerly wind was induced by the typhoon-associated counterclockwise wind flow, providing a wind environment for transboundary air pollution within the region [25] and thus, the formation of a HPE. For heights from 0.60 to 1.20 km, northerly and northwesterly wind predominated. For heights from 1.20 to 1.90 km, the prevailing horizontal wind directions was north and northeast. For heights greater than 1.90 km, the easterly winds predominated.

3.5.2. Vertical Wind Velocity

Figure 12 shows the vertical profiles of vertical wind velocity at the two LiDAR sites. At CUHK, the annual vertical wind velocity for heights less than 0.66 km exhibited upward air motion (positive), whereas the HPE profiles exhibited downward air motion. Although upward air motions were observed for heights from 0.66 to 1.00 km, these motions were weak. For heights less than 1.00 km at KP, the strong downward air motions in the annual profile weakened during HPEs. The overall vertical air motions caused the accumulation of heat energy and air pollutants close to ground level.
Figure 13 shows the mean aerosol backscatter profiles at the two LiDAR sites during the nine identified HPEs. Higher aerosol backscatter was observed for heights less than 1.00 km at nighttime and heights less than 1.20 km in the afternoon. The increased height of the top of the aerosol layer in the afternoon may be attributable to the higher mixing height at this time due to the peak in solar radiation. The aerosol backscatter profiles also reveal that that aerosol backscatter was typically the highest for heights less than 0.60 km. This demonstrates an association with the vertical wind velocity profiles in Figure 12. For heights less than 0.66 km, downward air motions were observed at the CUHK site; the air motions for heights from 0.66 to 1.00 km were directed upward. At KP, the magnitude of downward wind velocity decreased with heights up to approximately 0.60 km and then increased up to 0.90 km. Compared with CUHK, KP had stronger downward air motions that resulted in higher aerosol backscatter.

3.6. A demonstration Case: Cold Front

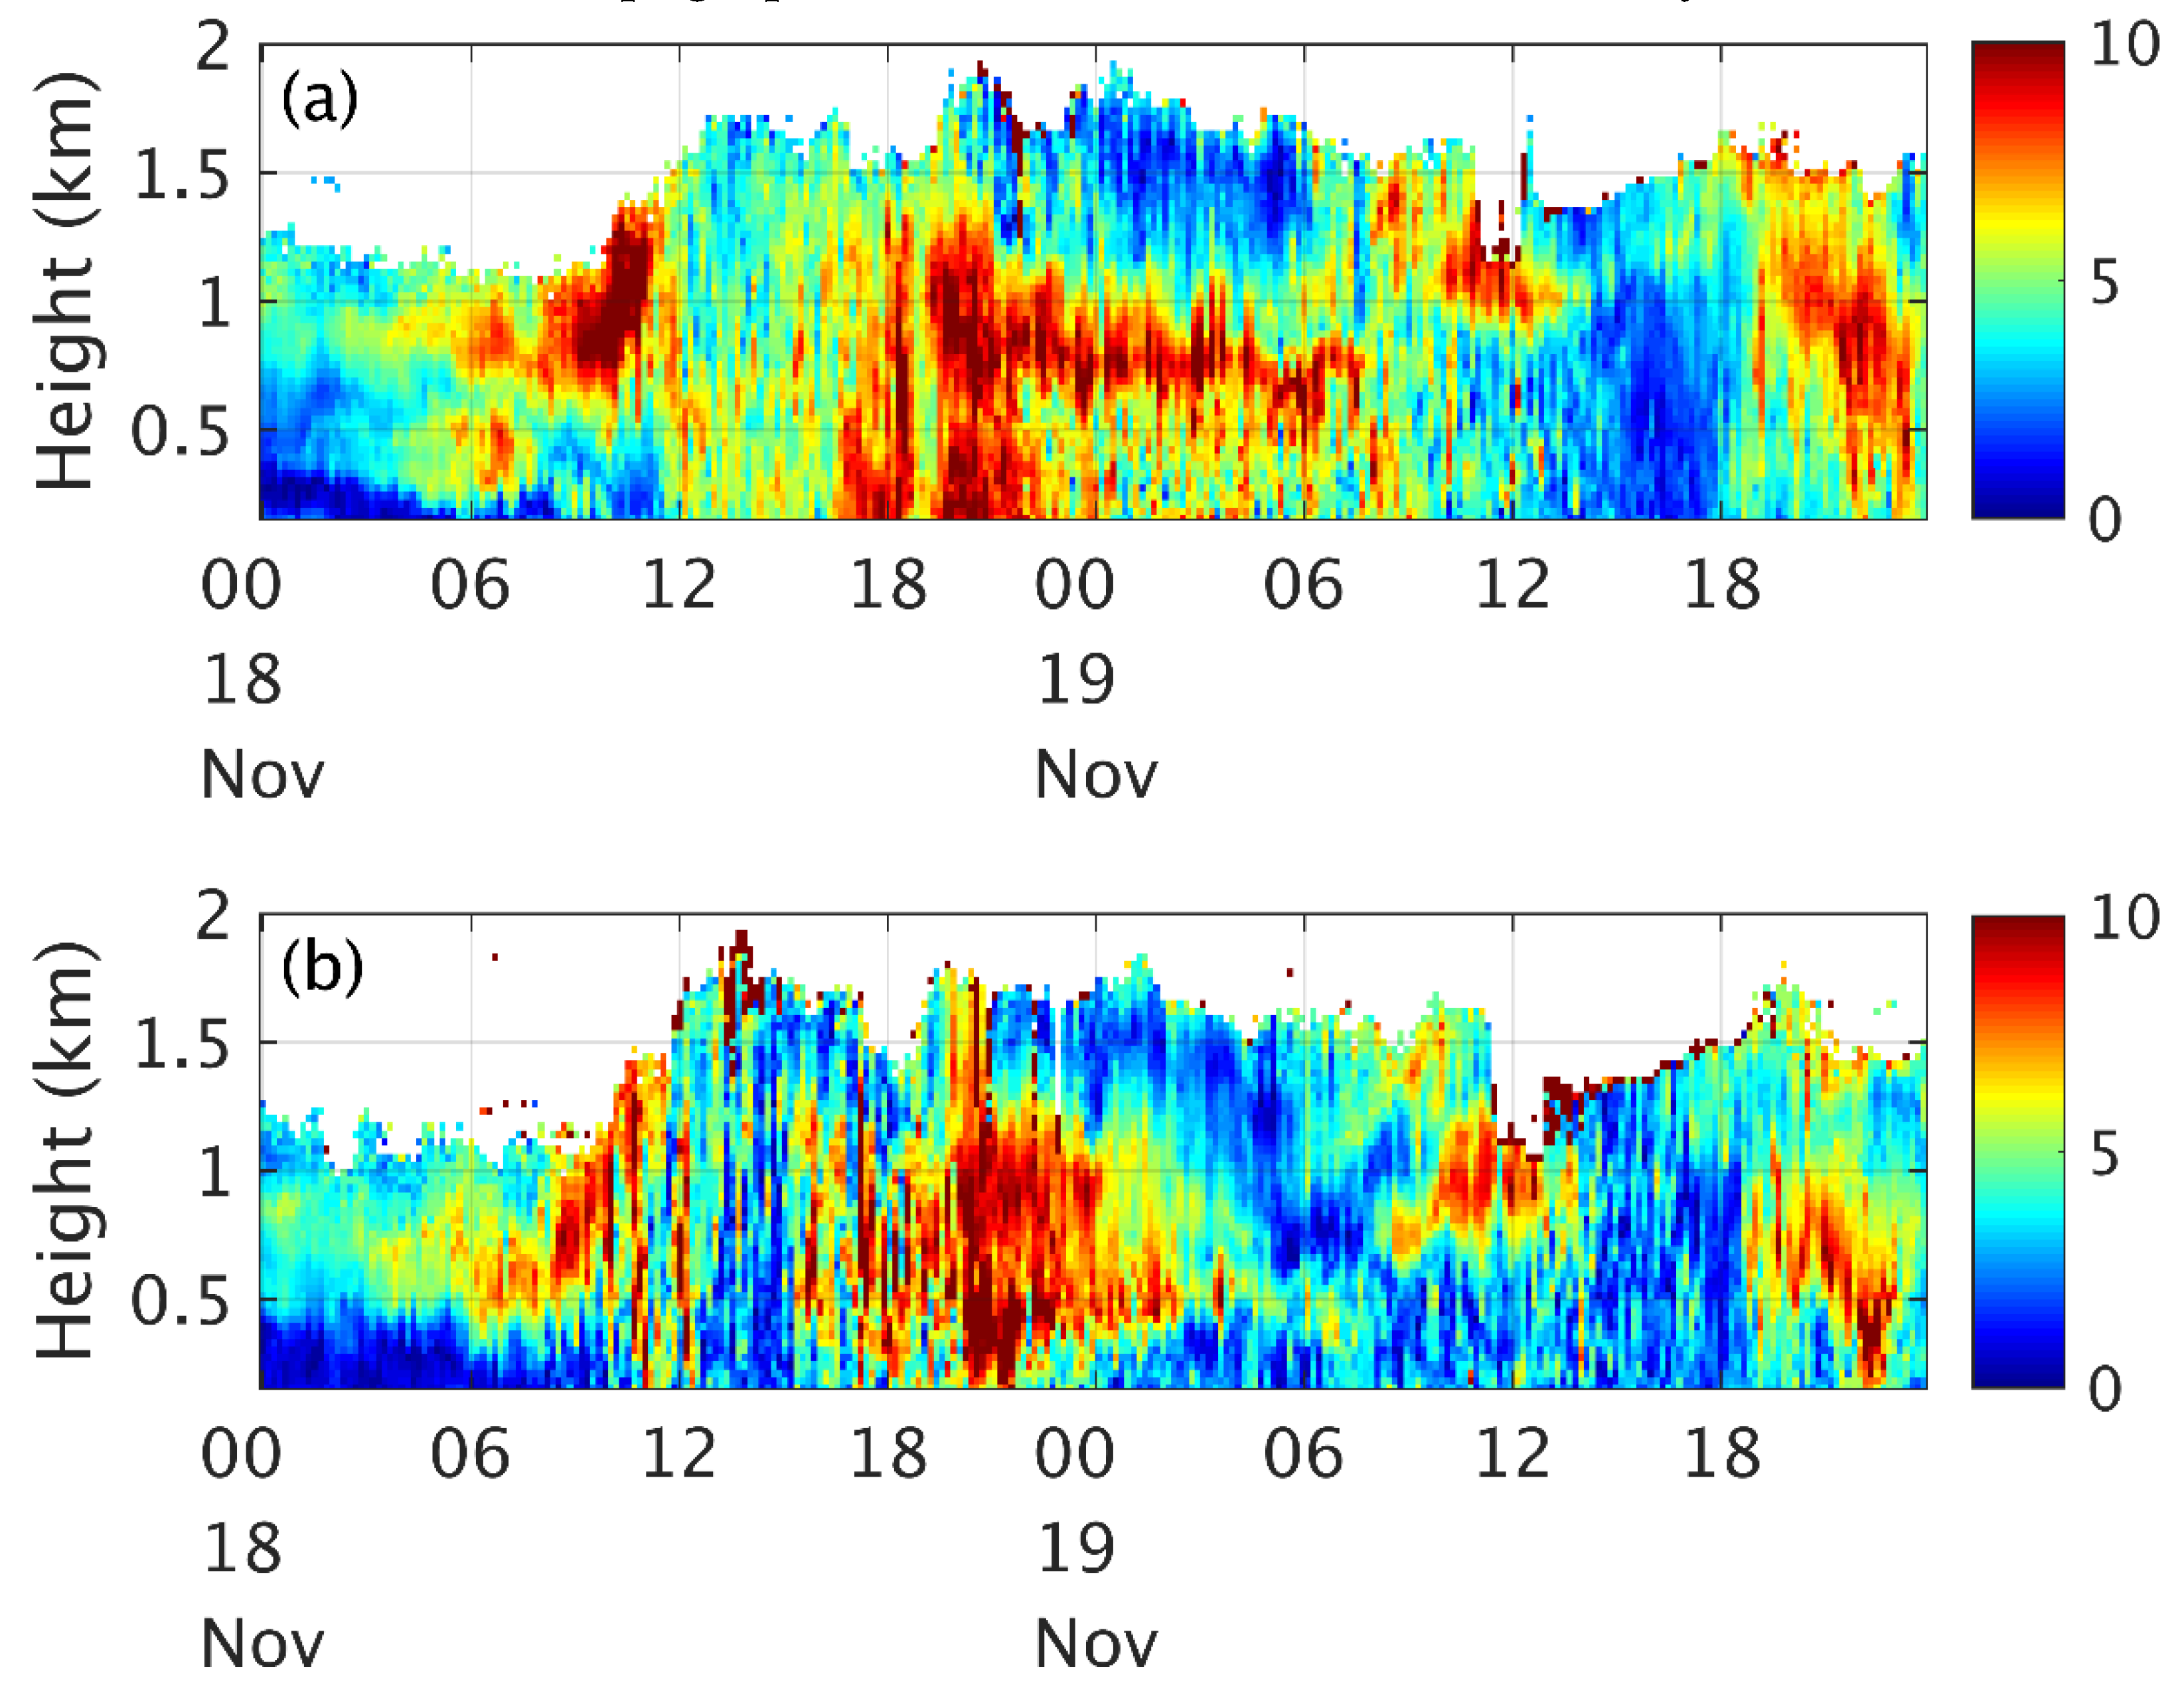
To demonstrate the real-time monitoring capability of 3DREAMS, a cold front case occurred on 18 Nov. 2019 was discussed. Figure 11j–m depicts the weather charts of the cold front case at 02:00, 08:00, 14:00 and 20:00 HKT on 18 Nov. 2019, respectively. The cold front arrived at HK in the afternoon on 18 Nov. 2019. Figure 14 shows the high-temporal-resolution vertical profiles of horizontal wind speed at the two sites on 18 and 19 Nov. 2019. The results show that 3DREAMS captured the first arrival of the cold front at the CUHK LiDAR site at between 16:30 and 17:00 HKT. The earlier arrival of the cold front at the CUHK LiDAR site was due to the fact that the site is located at the northeastern Hong Kong. When approaching from northwest, the cold front first hit the CUHK site. In addition, the CUHK LiDAR shows a clear increase in wind speed at the altitudes between 0.50 km and 1.00 km, which lasted until 08:00 HKT on the next day. It is noted that the increase in wind speed near the ground level at KP LiDAR site was not as high as that at the CUHK LiDAR site. This difference was due to the topographical effect that blocked the northerly flow to the KP LiDAR site.

4. Discussion

This study developed the 3DREAMS using two Doppler LiDAR units for instantaneously measuring wind and aerosol backscatter profiles, thus providing valuable datasets for wind and aerosol backscatter that can be employed in weather and air quality studies. Previous studies have relied heavily on data measured at the ground level. However, Tong et al. [24] identified significant influences of upper atmosphere meteorology on air quality. Although some studies have measured the vertical profiles of wind and air quality, the typically short measurement periods have resulted in limited understanding of the long-term characteristics of and relationships between weather and air quality. Other studies have relied on upper air sounding data that can be measured only two to three times per day, whereas the present study developed the 3DREAMS to collect real-time upper atmosphere wind and aerosol backscatter information critical for long-term meteorological and air quality studies. It should be highlighted that, while upper air sounding measurements are useful, LiDARs can fill the missing data gaps, providing higher time-resolution measurements.
Spatial wind variability at various altitudes is critical for weather forecasting and air quality studies. For example, local air pollutant emissions may be mixed or transported by lower-level wind; whereas transboundary air pollution may be transported by a higher-level wind. Significant spatial wind variability may affect local weather and thus, air quality at different altitudes and locations. Yim et al. [50] identified high spatial wind variability in Hong Kong due to its complex topography. Nevertheless, their study was limited to ground-level spatial wind variability. The current study reveals that this high spatial wind variability extends to heights of 0.30 km for the horizontal wind direction and 0.60 km for the vertical wind velocity. These findings suggest that further studies should investigate wind shear at various altitudes in Hong Kong. Improved understanding of wind shear is particularly critical for aviation safety at Hong Kong International Airport, which is located in an area with complex topography. The demonstrated cold front case provided a useful example of how the 3DREAMS can be used to study spatial and vertical variations of various horizontal wind speed in weather events.
Previous studies have mainly focused on the effects of extremely hot weather or air pollution episodes. The present study introduced and investigated HPEs, which can adversely affect human health as a result of the synergistic effects of high temperature and high PM2.5 concentration. The results reveal that a prevailing horizontal wind direction introducing TAP from the Greater Bay Area and significant reductions in horizontal wind speed at all altitudes and vertical wind velocity for heights less than 0.66 km enhanced the accumulation of heat and air pollutants in the lower atmosphere.

5. Conclusions

This study developed the 3DREAMS to measure the long-term vertical profiles of horizontal wind speed and direction and vertical wind velocity and aerosol backscatter in a highly dense city with complex topography. In addition, the vertical profiles of nine identified HPEs were analyzed to assess the influences of horizontal wind speed and direction and vertical wind velocity on heat and aerosol accumulation. The results reveal high spatial wind variability for heights less than approximately 0.60 km in Hong Kong, highlighting the influence of mountainous topography on the wind environment in the city. Both upslope and downslope winds were observed at CUHK site, whereas downward air motions predominated at KP site. The different air vertical motions resulted in different vertical profiles of aerosol backscatter at the two sites during HPEs. Combining the analyses of horizontal wind speed and direction and vertical wind velocity reveal that high temperatures and PM2.5 concentrations were due to a prevailing westerly wind that introduced TAP from the Greater Bay Area. Moreover, a substantial reduction in horizontal wind speed and vertical wind velocity resulted in heat and air pollutant accumulation during HPEs. The findings of this study can provide critical insight for weather forecast and future air quality research. The 3DREAMS will be further developed to integrate new and existing LiDARs into the system and to include more sites to monitor wind and air quality for the Greater Bay Area.

Author Contributions

The research was solely done by S.H.L.Y. including conceptualization, methodology, software, validation, formal analysis, investigation, resources, data curation, writing—original draft preparation, writing—review and editing, visualization, funding acquisition. The author has read and agreed to the published version of the manuscript.

Funding

This work was jointly funded by The Vice-Chancellor’s Discretionary Fund of The Chinese University of Hong Kong (grant no. 4930744) and Dr. Stanley Ho Medicine Development Foundation (grant no. 8305509).

Acknowledgments

The author would like to thank the Hong Kong Observatory (HKO) for providing not only weather data but also the measurement site at King’s Park weather station. Without the HKO full support, the 3DREAMS may not be able to be built smoothly. In addition, the author also appreciates the Hong Kong Environmental Protection Department for providing air quality data.

Conflicts of Interest

The authors declare no conflict of interest.

References

  1. Akimoto, H. Global Air Quality and Pollution. Science 2003, 302, 1716–1719. [Google Scholar] [CrossRef] [Green Version]
  2. Mage, D.; Ozolins, G.; Peterson, P.; Webster, A.; Orthofer, R.; Vandeweerd, V.; Gwynne, M. Urban air pollution in megacities of the world. Atmos. Environ. 1996, 30, 681–686. [Google Scholar] [CrossRef]
  3. Miralles, D.G.; Teuling, A.J.; van Heerwaarden, C.C.; Vilà-Guerau de Arellano, J. Mega-heatwave temperatures due to combined soil desiccation and atmospheric heat accumulation. Nat. Geosci. 2014, 7, 345–349. [Google Scholar] [CrossRef]
  4. Perkins, S.E.; Alexander, L.V.; Nairn, J.R. Increasing frequency, intensity and duration of observed global heatwaves and warm spells. Geophys. Res. Lett. 2012, 39. [Google Scholar] [CrossRef]
  5. Brauer, M.; Freedman, G.; Frostad, J.; van Donkelaar, A.; Martin, R.V.; Dentener, F.; van Dingenen, R.; Estep, K.; Amini, H.; Apte, J.S.; et al. Ambient Air Pollution Exposure Estimation for the Global Burden of Disease 2013. Environ. Sci. Technol. 2016, 50, 79–88. [Google Scholar] [CrossRef] [PubMed]
  6. Cohen, A.J.; Brauer, M.; Burnett, R.; Anderson, H.R.; Frostad, J.; Estep, K.; Balakrishnan, K.; Brunekreef, B.; Dandona, L.; Dandona, R.; et al. Estimates and 25-year trends of the global burden of disease attributable to ambient air pollution: An analysis of data from the Global Burden of Diseases Study 2015. Lancet 2017, 389, 1907–1918. [Google Scholar] [CrossRef] [Green Version]
  7. Grynszpan, D. Lessons from the French heatwave. Lancet 2003, 362, 1169–1170. [Google Scholar] [CrossRef]
  8. Gu, Y.; Yim, S.H.L. The air quality and health impacts of domestic trans-boundary pollution in various regions of China. Environ. Int. 2016, 97, 117–124. [Google Scholar] [CrossRef]
  9. Gu, Y.; Wong, T.W.; Law, S.C.; Dong, G.H.; Ho, K.F.; Yang, Y.; Yim, S.H.L. Impacts of sectoral emissions in China and the implications: Air quality, public health, crop production, and economic costs. Environ. Res. Lett. 2018, 13, 084008. [Google Scholar] [CrossRef]
  10. Hou, X.; Chan, C.K.; Dong, G.H.; Yim, S.H.L. Impacts of transboundary air pollution and local emissions on PM2.5 pollution in the Pearl River Delta region of China and the public health, and the policy implications. Environ. Res. Lett. 2018, 14, 034005. [Google Scholar] [CrossRef]
  11. Lee, H.-H.; Iraqui, O.; Gu, Y.; Yim, S.H.-L.; Chulakadabba, A.; Tonks, A.Y.-M.; Yang, Z.; Wang, C. Impacts of air pollutants from fire and non-fire emissions on the regional air quality in Southeast Asia. Atmos. Chem. Phys. 2018, 18, 6141–6156. [Google Scholar] [CrossRef] [Green Version]
  12. Lye, M.; Kamal, A. Effects of a Heatwave on mortality-rates in elderly inpatients. Lancet 1977, 309, 529–531. [Google Scholar] [CrossRef]
  13. Semenza, J.C.; Rubin, C.H.; Falter, K.H.; Selanikio, J.D.; Flanders, W.D.; Howe, H.L.; Wilhelm, J.L. Heat-Related Deaths during the July 1995 Heat Wave in Chicago. N. Engl. J. Med. 1996, 335, 84–90. [Google Scholar] [CrossRef] [PubMed]
  14. Wang, M.Y.; Yim, S.H.L.; Wong, D.C.; Ho, K.F. Source contributions of surface ozone in China using an adjoint sensitivity analysis. S. Total Environ. 2019, 662, 385–392. [Google Scholar] [CrossRef]
  15. Wang, Y.; Chan, A.; Lau, G.N.-C.; Li, Q.; Yang, Y.; Yim, S.H.L. Effects of urbanization and global climate change on regional climate in the Pearl River Delta and thermal comfort implications. Int. J. Climatol. 2019, in press. [Google Scholar] [CrossRef]
  16. Yim, H.L.S.; Wang, M.Y.; Gu, Y.; Yang, Y.; Dong, G.H.; Li, Q. Effect of Urbanization on Ozone and Resultant Health Effects in the Pearl River Delta Region of China. J. Geophys. Res. Atmos. 2019, 124, 11568–11579. [Google Scholar] [CrossRef]
  17. Yim, S.H.L.; Barrett, S.R.H. Public Health Impacts of Combustion Emissions in the United Kingdom. Environ. Sci. Technol. 2012, 46, 4291–4296. [Google Scholar] [CrossRef]
  18. Yim, S.H.L.; Lee, G.L.; Lee, I.H.; Allroggen, F.; Ashok, A.; Caiazzo, F.; Eastham, S.D.; Malina, R.; Barrett, S.R.H. Global, regional and local health impacts of civil aviation emissions. Environ. Res. Lett. 2015, 10, 034001. [Google Scholar] [CrossRef] [Green Version]
  19. Yim, S.H.L.; Stettler, M.E.J.; Barrett, S.R.H. Air quality and public health impacts of UK airports. Part II: Impacts and policy assessment. Atmos. Environ. 2013, 67, 184–192. [Google Scholar] [CrossRef]
  20. Lee, J.D.; Lewis, A.C.; Monks, P.S.; Jacob, M.; Hamilton, J.F.; Hopkins, J.R.; Watson, N.M.; Saxton, J.E.; Ennis, C.; Carpenter, L.J.; et al. Ozone photochemistry and elevated isoprene during the UK heatwave of august 2003. Atmos. Environ. 2006, 40, 7598–7613. [Google Scholar] [CrossRef]
  21. Stedman, J.R. The predicted number of air pollution related deaths in the UK during the August 2003 heatwave. Atmos. Environ. 2004, 38, 1087–1090. [Google Scholar] [CrossRef]
  22. Yim, S.H.L.; Gu, Y.; Shapiro, M.; Stephens, B. Air quality and acid deposition impacts of local emissions and transboundary air pollution in Japan and South Korea. Atmos. Chem. Phys. 2019, 19, 13309–13323. [Google Scholar] [CrossRef] [Green Version]
  23. Liu, Z.; Ming, Y.; Zhao, C.; Lau, N.C.; Guo, J.; Yim, S.H.L. Contribution of local and remote anthropogenic aerosols to intensification of a record-breaking torrential rainfall event in Guangdong province. Atmos. Chem. Phys. Discuss. 2018, 1–35. [Google Scholar] [CrossRef] [Green Version]
  24. Tong, C.H.M.; Yim, S.H.L.; Rothenberg, D.; Wang, C.; Lin, C.-Y.; Chen, Y.; Lau, N.C. Assessing the impacts of seasonal and vertical atmospheric conditions on air quality over the Pearl River Delta region. Atmos. Environ. 2018, 180, 69–78. [Google Scholar] [CrossRef]
  25. Luo, M.; Hou, X.; Gu, Y.; Lau, N.-C.; Yim, S.H.-L. Trans-boundary air pollution in a city under various atmospheric conditions. Sci. Total Environ. 2018, 618, 132–141. [Google Scholar] [CrossRef] [PubMed]
  26. Yim, S.H.L.; Hou, X.; Guo, J.; Yang, Y. Contribution of local emissions and transboundary air pollution to air quality in Hong Kong during El Niño-Southern Oscillation and heatwaves. Atmos. Res. 2019, 218, 50–58. [Google Scholar] [CrossRef]
  27. Tong, C.H.M.; Yim, S.H.L.; Rothenberg, D.; Wang, C.; Lin, C.-Y.; Chen, Y.D.; Lau, N.C. Projecting the impacts of atmospheric conditions under climate change on air quality over the Pearl River Delta region. Atmos. Environ. 2018, 193, 79–87. [Google Scholar] [CrossRef]
  28. Wang, M.Y.; Yim, S.H.L.; Dong, G.H.; Ho, K.F.; Wong, D.C. Mapping ozone source-receptor relationship and apportioning the health impact in the Pearl River Delta region using adjoint sensitivity analysis. Atmos. Environ. 2020, 222, 117026. [Google Scholar] [CrossRef]
  29. Rohde, R.A.; Muller, R.A. Air pollution in China: Mapping of concentrations and sources. PLoS ONE 2015, 10, e0135749. [Google Scholar] [CrossRef]
  30. Wang, Y.; Ying, Q.; Hu, J.; Zhang, H. Spatial and temporal variations of six criteria air pollutants in 31 provincial capital cities in China during 2013–2014. Environ. Int. 2014, 73, 413–422. [Google Scholar] [CrossRef]
  31. Guo, J.; Su, T.; Li, Z.; Miao, Y.; Li, J.; Liu, H.; Xu, H.; Cribb, M.; Zhai, P. Declining frequency of summertime local-scale precipitation over eastern China from 1970 to 2010 and its potential link to aerosols. Geophys. Res. Lett. 2017, 44, 5700–5708. [Google Scholar] [CrossRef]
  32. Guo, J.; Deng, M.; Lee, S.S.; Wang, F.; Li, Z.; Zhai, P.; Liu, H.; Lv, W.; Yao, W.; Li, X. Delaying precipitation and lightning by air pollution over the Pearl River Delta. Part I: Observational analyses. J. Geophys. Res. Atmos. 2016, 121, 6472–6488. [Google Scholar] [CrossRef]
  33. Guo, J.-P.; Zhang, X.-Y.; Wu, Y.-R.; Zhaxi, Y.; Che, H.-Z.; La, B.; Wang, W.; Li, X.-W. Spatio-temporal variation trends of satellite-based aerosol optical depth in China during 1980–2008. Atmos. Environ. 2011, 45, 6802–6811. [Google Scholar] [CrossRef]
  34. Guo, J.; Liu, H.; Wang, F.; Huang, J.; Xia, F.; Lou, M.; Wu, Y.; Jiang, J.H.; Xie, T.; Zhaxi, Y.; et al. Three-dimensional structure of aerosol in China: A perspective from multi-satellite observations. Atmos. Res. 2016, 178, 580–589. [Google Scholar] [CrossRef]
  35. Guo, J.; Miao, Y.; Zhang, Y.; Liu, H.; Li, Z.; Zhang, W.; He, J.; Lou, M.; Yan, Y.; Bian, L.; et al. The climatology of planetary boundary layer height in China derived from radiosonde and reanalysis data. Atmos. Chem. Phys. 2016, 16, 13309–13319. [Google Scholar] [CrossRef] [Green Version]
  36. Guo, J.; Li, Y.; Cohen, J.B.; Li, J.; Chen, D.; Xu, H.; Liu, L.; Yin, J.; Hu, K.; Zhai, P. Shift in the Temporal Trend of Boundary Layer Height in China Using Long-Term (1979–2016) Radiosonde Data. Geophys. Res. Lett. 2019, 46, 6080–6089. [Google Scholar] [CrossRef] [Green Version]
  37. Collis, R.T.H. Lidar: A new atmospheric probe. Q. J. R. Meteorol. Soc. 1966, 92, 220–230. [Google Scholar] [CrossRef]
  38. Milroy, C.; Martucci, G.; Lolli, S.; Loaec, S.; Sauvage, L.; Xueref-Remy, I.; Lavrič, J.V.; Ciais, P.; Feist, D.G.; Biavati, G.; et al. An Assessment of Pseudo-Operational Ground-Based Light Detection and Ranging Sensors to Determine the Boundary-Layer Structure in the Coastal Atmosphere. Available online: https://www.hindawi.com/journals/amete/2012/929080/ (accessed on 7 February 2020).
  39. Lolli, S.; Delaval, A.; Loth, C.; Garnier, A.; Flamant, P.H. 0.355-micrometer direct detection wind lidar under testing during a field campaign in consideration of ESA’s ADM-Aeolus mission. Atmos. Meas. Tech. 2013, 6, 3349–3358. [Google Scholar] [CrossRef] [Green Version]
  40. Bozier, K.E.; Pearson, G.N.; Collier, C.G. Doppler lidar observations of Russian forest fire plumes over Helsinki. Weather 2007, 62, 203–208. [Google Scholar] [CrossRef] [Green Version]
  41. Pearson, G.; Davies, F.; Collier, C. Remote sensing of the tropical rain forest boundary layer using pulsed Doppler lidar. Atmos. Chem. Phys. 2010, 10, 5891–5901. [Google Scholar] [CrossRef] [Green Version]
  42. Pearson, G.; Davies, F.; Collier, C. An Analysis of the Performance of the UFAM Pulsed Doppler Lidar for Observing the Boundary Layer. J. Atmos. Ocean. Technol. 2009, 26, 240–250. [Google Scholar] [CrossRef]
  43. Chan, P.W. Generation of an Eddy Dissipation Rate Map at the Hong Kong International Airport Based on Doppler Lidar Data. J. Atmos. Ocean. Technol. 2010, 28, 37–49. [Google Scholar] [CrossRef]
  44. Chan, P.W.; Lee, Y.F. Application of Short-Range Lidar in Wind Shear Alerting. J. Atmos. Ocean. Technol. 2011, 29, 207–220. [Google Scholar] [CrossRef]
  45. Hon, K.K.; Chan, P.W. Application of LIDAR-derived eddy dissipation rate profiles in low-level wind shear and turbulence alerts at Hong Kong International Airport. Meteorol. Appl. 2014, 21, 74–85. [Google Scholar] [CrossRef]
  46. Shun, C.M.; Chan, P.W. Applications of an Infrared Doppler Lidar in Detection of Wind Shear. J. Atmos. Ocean. Technol. 2008, 25, 637–655. [Google Scholar] [CrossRef]
  47. Shu, Z.R.; Li, Q.S.; He, Y.C.; Chan, P.W. Observations of offshore wind characteristics by Doppler-LiDAR for wind energy applications. Appl. Energy 2016, 169, 150–163. [Google Scholar] [CrossRef]
  48. Liu, H.; Chan, J.C.L.; Cheng, A.Y.S. Internal boundary layer structure under sea-breeze conditions in Hong Kong. Atmos. Environ. 2001, 35, 683–692. [Google Scholar] [CrossRef]
  49. Yang, Y.; Yim, S.H.L.; Haywood, J.; Osborne, M.; Chan, J.C.S.; Zeng, Z.; Cheng, J.C.H. Characteristics of Heavy Particulate Matter Pollution Events over Hong Kong and Their Relationships with Vertical Wind Profiles Using High-Time-Resolution Doppler Lidar Measurements. J. Geophys. Res. Atmos. 2019, 124, 9609–9623. [Google Scholar] [CrossRef] [Green Version]
  50. Yim, S.H.L.; Fung, J.C.H.; Lau, A.K.H.; Kot, S.C. Developing a high-resolution wind map for a complex terrain with a coupled MM5/CALMET system. J. Geophys. Res. 2007, 112, 1–15. [Google Scholar] [CrossRef]
  51. Hofsäß, M.; Clifton, A.; Cheng, P.W. Reducing the Uncertainty of Lidar Measurements in Complex Terrain Using a Linear Model Approach. Remote Sens. 2018, 10, 1465. [Google Scholar] [CrossRef] [Green Version]
  52. Pauscher, L.; Vasiljevic, N.; Callies, D.; Lea, G.; Mann, J.; Klaas, T.; Hieronimus, J.; Gottschall, J.; Schwesig, A.; Kühn, M.; et al. An Inter-Comparison Study of Multi-and DBS Lidar Measurements in Complex Terrain. Remote Sens. 2016, 8, 782. [Google Scholar] [CrossRef] [Green Version]
  53. Bingöl, F.; Mann, J.; Foussekis, D. Conically scanning lidar error in complex terrain. Meteorol. Z. 2009, 18, 189–195. [Google Scholar] [CrossRef]
  54. Chan, E.Y.Y.; Goggins, W.B.; Kim, J.J.; Griffiths, S.M. A study of intracity variation of temperature-related mortality and socioeconomic status among the Chinese population in Hong Kong. J. Epidemiol. Community Health 2012, 66, 322–327. [Google Scholar] [CrossRef] [PubMed] [Green Version]
  55. Pal Arya, S. Air Pollution Meteorology and Dispersion; Oxford University Press: Oxford, UK, 1999; ISBN 0-19-507398-3. [Google Scholar]
Figure 1. Locations of the two LiDAR sites (CUHK and KP), topography near the CUHK site, and schematic of the upslope and downslope winds. The arrows refer to wind direction. The arrow colors refer to altitude: orange: lower altitude; purple: higher altitude. This CUHK site is surrounded by mountains, including Ma On Shan (≈700 m), Lion Rock (≈500 m), Kam Shan (≈370 m), and Tai Mo Shan (≈957 m). The figure was built on a map obtained from Google Earth, earth.google.com/web/.
Remotesensing 12 01036 g001
Figure 2. The schematic diagram of both stare and velocity-azimuth display (VAD) scanning methods. The number of bean directions for a VAD scan was 6. The Doppler LiDAR laser beam pointed upward with a constant elevation angle θ and a constant angle Φ with respect to the vertical Z. The laser beam rotated around the vertical Z with a constant interval of an azimuth angle α.
Remotesensing 12 01036 g002
Figure 3. (a) Comparison of horizontal wind speed (m/s) according to KP LiDAR data (red cross) and upper air sounding data (blue circles) over a 4-day period (1 June 2019, 00:00 UTC to 4 June 2019, 12:00 UTC). (b) Comparison of horizontal wind direction according to LiDAR data (red cross) and upper air sounding data (blue circles) over a 4-day period (1 June 2019, 00:00 UTC to 4 June 2019, 12:00 UTC).
Remotesensing 12 01036 g003
Figure 4. (a) Annual (black) and HPE (red) vertical profiles of horizontal wind speed (m/s) at CUHK (solid) and KP (dashed) sites. Seasonal vertical profiles at (b) CUHK and (c) KP derived from LiDAR data. (d) Seasonal and (e) annual vertical profiles of horizontal wind speed (m/s) based on the upper air sounding data collected at 08:00 (HKT) and 20:00 (HKT) every day. For (bd): spring (black), summer (red), fall (blue), and winter (magenta). For (e): 08:00 (HKT) (blue) and 20:00 (HKT) (red).
Remotesensing 12 01036 g004
Figure 5. Diurnal vertical profiles of horizontal wind speed at the CUHK (blue) and KP (red) sites.
Remotesensing 12 01036 g005
Figure 6. The diurnal vertical profiles of prevailing wind direction (a,c) and the mean horizontal wind speed (m/s) of the prevailing horizontal wind direction (b,d) at the two LiDAR stations, CUHK (upper panel) and KP (lower panel).
Remotesensing 12 01036 g006
Figure 7. Annual vertical profiles of horizontal wind direction frequency at CUHK (left) and KP (right).
Remotesensing 12 01036 g007
Figure 8. Seasonal vertical profiles of horizontal wind direction frequency in spring (a,e), summer (b,f), fall (c,g), and winter (d,h) at CUHK and KP, respectively. The upper panel (ad) is CUHK, whereas the lower panel (eh) is KP.
Remotesensing 12 01036 g008aRemotesensing 12 01036 g008b
Figure 9. (a) Annual vertical profiles of vertical wind velocity (cm/s) at CUHK (blue) and KP (red) and seasonal vertical profiles at CUHK (b) and KP (c) during spring (black), summer (red), fall (blue), and winter (magenta). Positive values refer to upward motions; whereas negative values refer to download motions.
Remotesensing 12 01036 g009
Figure 10. Vertical profiles of horizontal wind direction frequency during HPEs at CUHK (a) and KP (b).
Remotesensing 12 01036 g010
Figure 11. The weather charts (08:00 HKT) of each HPE (ai) and of a cold front case occurred on 18 Nov. 2019: (j) 02:00 HKT; (k) 08:00 HKT; (l) 14:00 HKT and (m) 20:00 HKT. The weather charts were obtained from the Hong Kong Observatory web site (https://www.hko.gov.hk/en/wxinfo/currwx/wxcht.htm) on 2 Mar. 2020.
Remotesensing 12 01036 g011aRemotesensing 12 01036 g011b
Figure 12. Vertical profiles of annual (solid) and HPE (dashed) vertical wind velocity at CUHK (left) and KP (right). Positive values refer to upward air motions, whereas negative values represent downward air motions.
Remotesensing 12 01036 g012
Figure 13. Mean aerosol backscatter log10(β) at CUHK (upper) and KP (lower) during the nine identified HPEs.
Remotesensing 12 01036 g013
Figure 14. The high-temporal-resolution (10 minutes) vertical profiles of horizontal wind speed (m/s) at the (a) CUHK and (b) KP LiDAR sites.
Remotesensing 12 01036 g014
Table 1. Nine identified HPEs during 2019 with the mean daily PM2.5 concentration (µg/m3) at both general and roadside stations and daily mean temperature (°C).
HPE #MonthDayMean of daily PM2.5 Concentration at General Stations (µg/m3)Mean of Daily PM2.5 Concentration at Roadside Stations (µg/m3)Daily Mean Temperature (°C)
171731.938.630.3
271843.554.831.0
38932.238.131.0
482445.461.930.7
592944.551.828.3
693060.579.329.9
710148.152.729.9
810236.541.829.0
9101131.338.028.3
Table 2. The seasonal surface horizontal wind speed (unit: m/s) at the Hong Kong Observatory automatic weather stations: Sha Tin, King’s Park and Waglan Island. The data was extracted from https://www.hko.gov.hk/en/cis/climat.htm on 7 Mar. 2020.
Sha TinKing’s ParkWaglan Island
>Latitude22°24′09′′22°18′43′′22°10′56′′
>Longitude114°12′36′′114°10′22′′114°18′12′′
>spring7.3710.4023.27
>summer8.409.8823.60
>fall6.309.6522.35
winter6.809.6725.00