Estimating Ground-Level Particulate Matter in Five Regions of China Using Aerosol Optical Depth

Abstract

1. Introduction
2. Materials and Methods
2.1. Data
2.1.1. Ground-Measured Aerosol Optical Depth (AOD)
2.1.2. Visible Infrared Imaging Radiometer Suite AOD
2.1.3. PM2.5 Data
2.1.4. Auxiliary Data
2.2. Model and Validation
3. Results
3.1. Validation of VIIRS AOD
3.2. Model Fitting and Validation
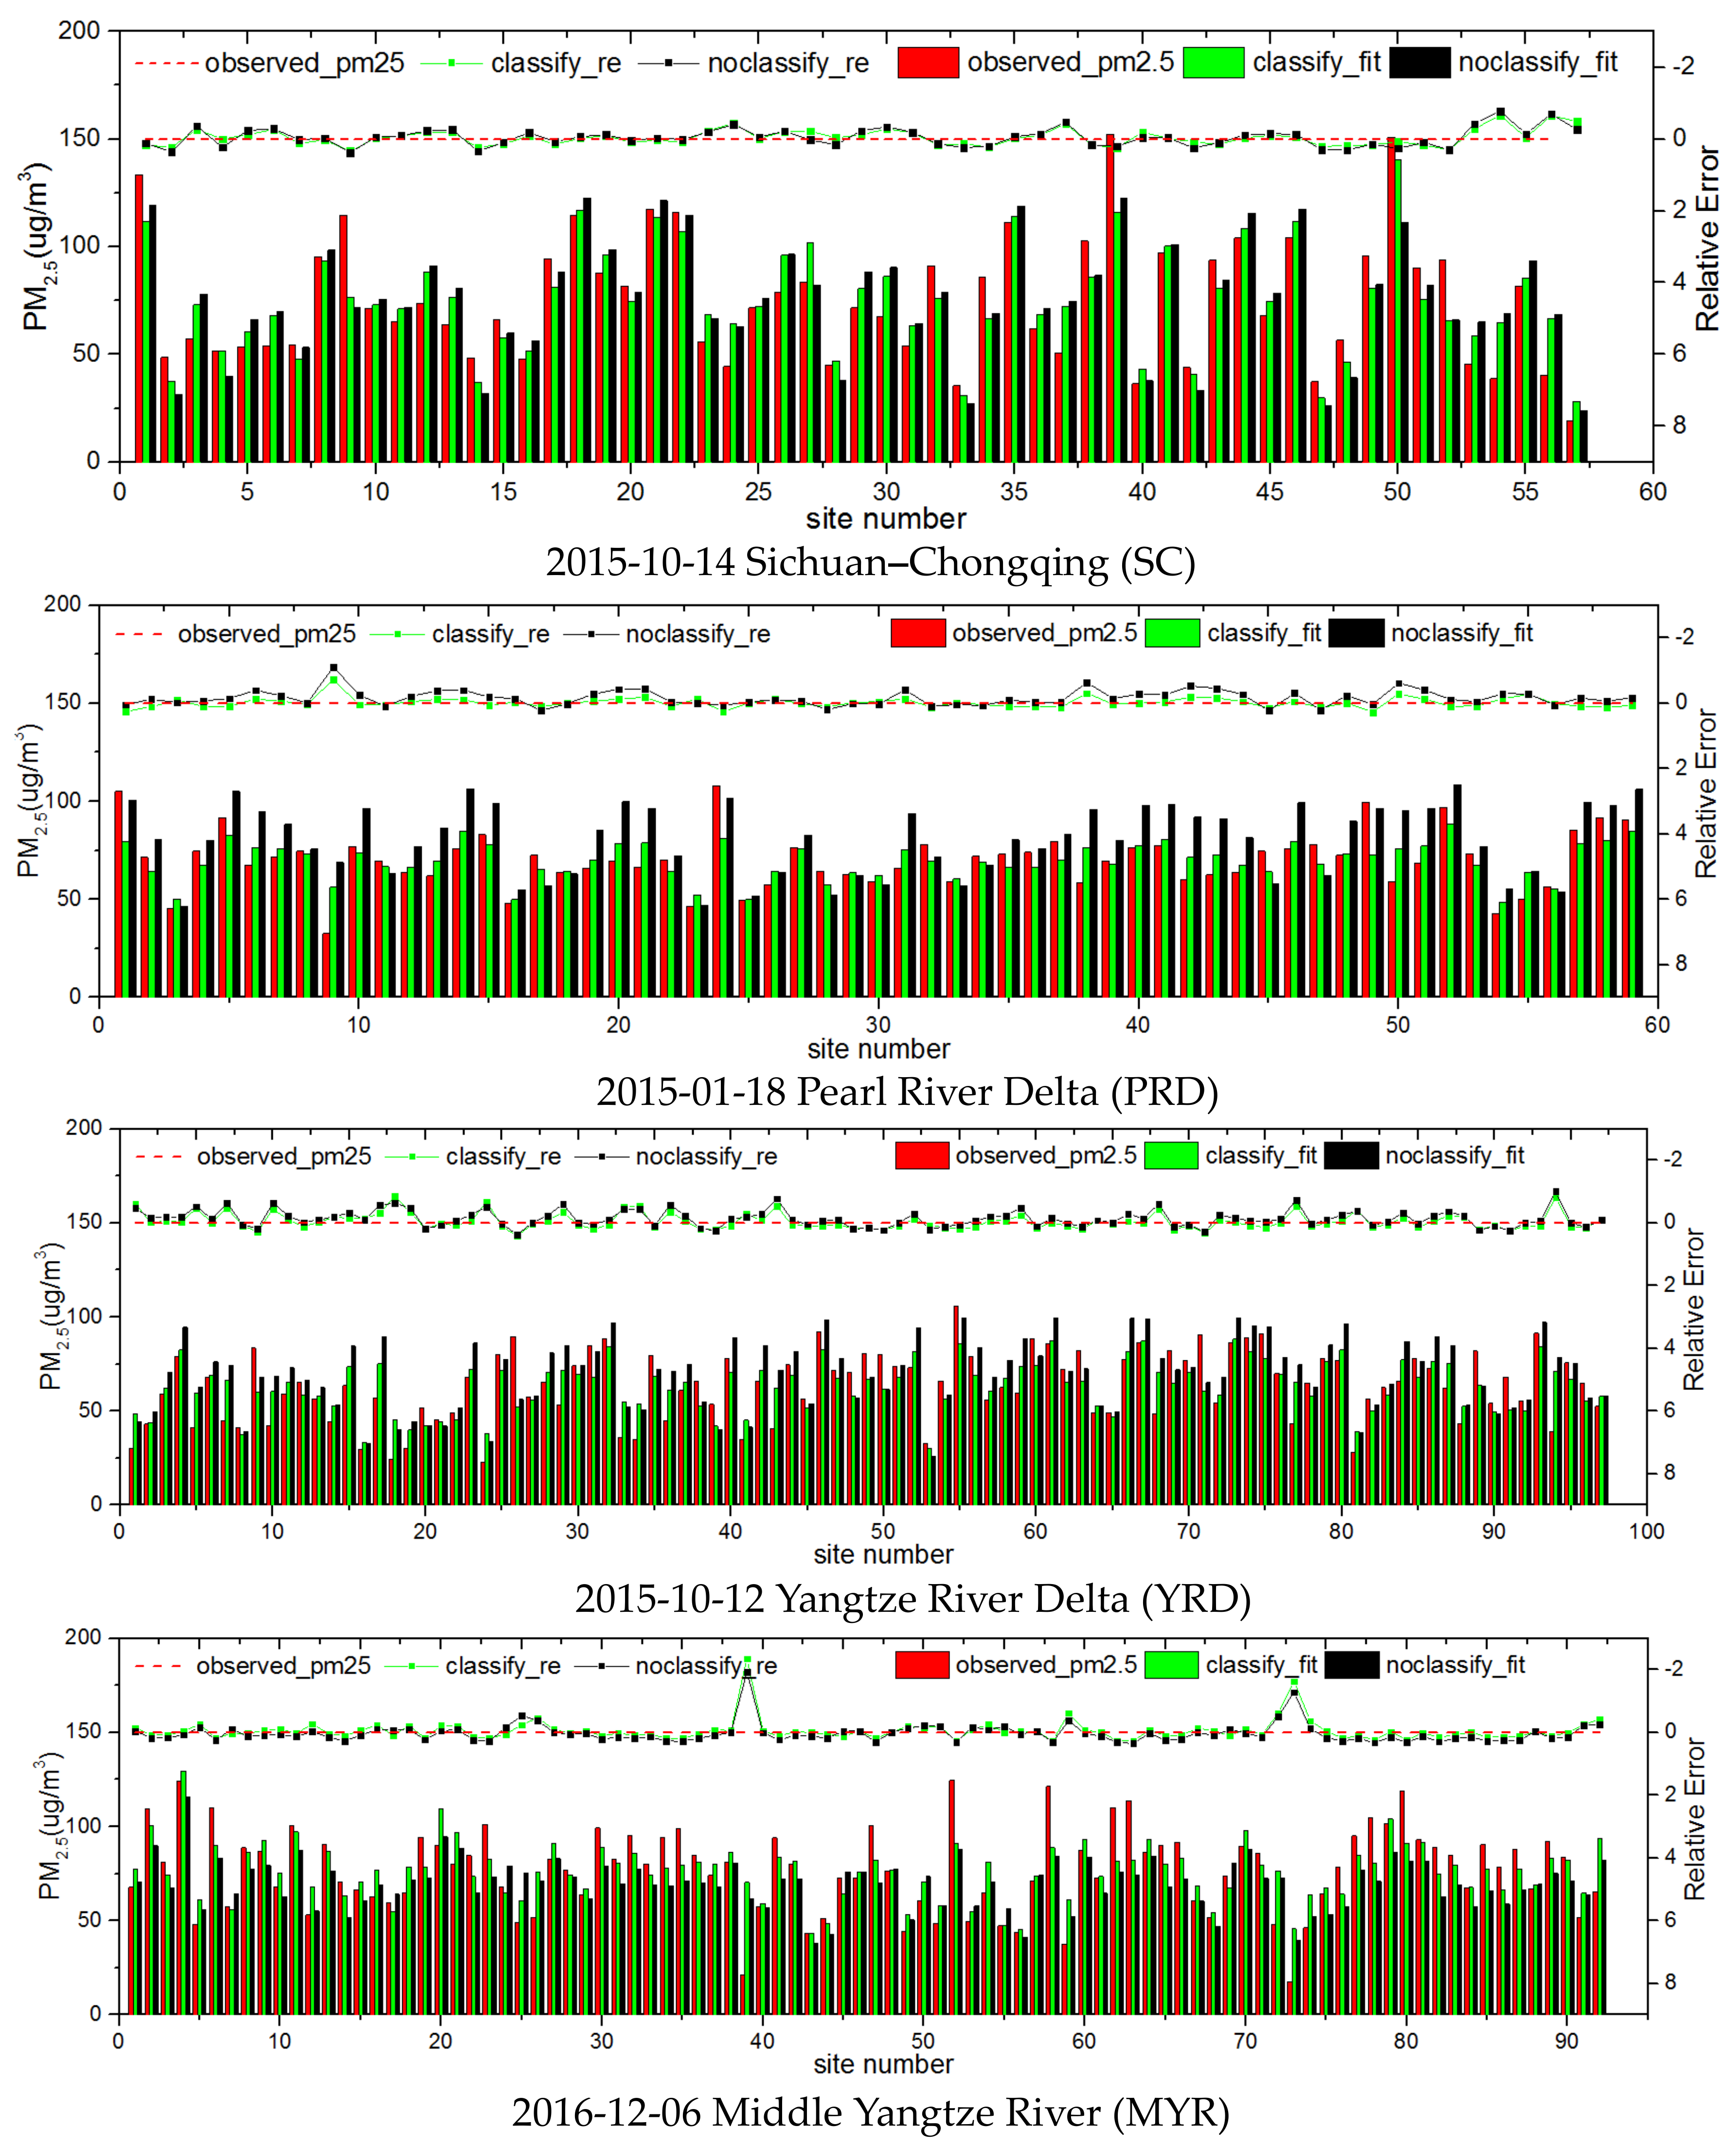
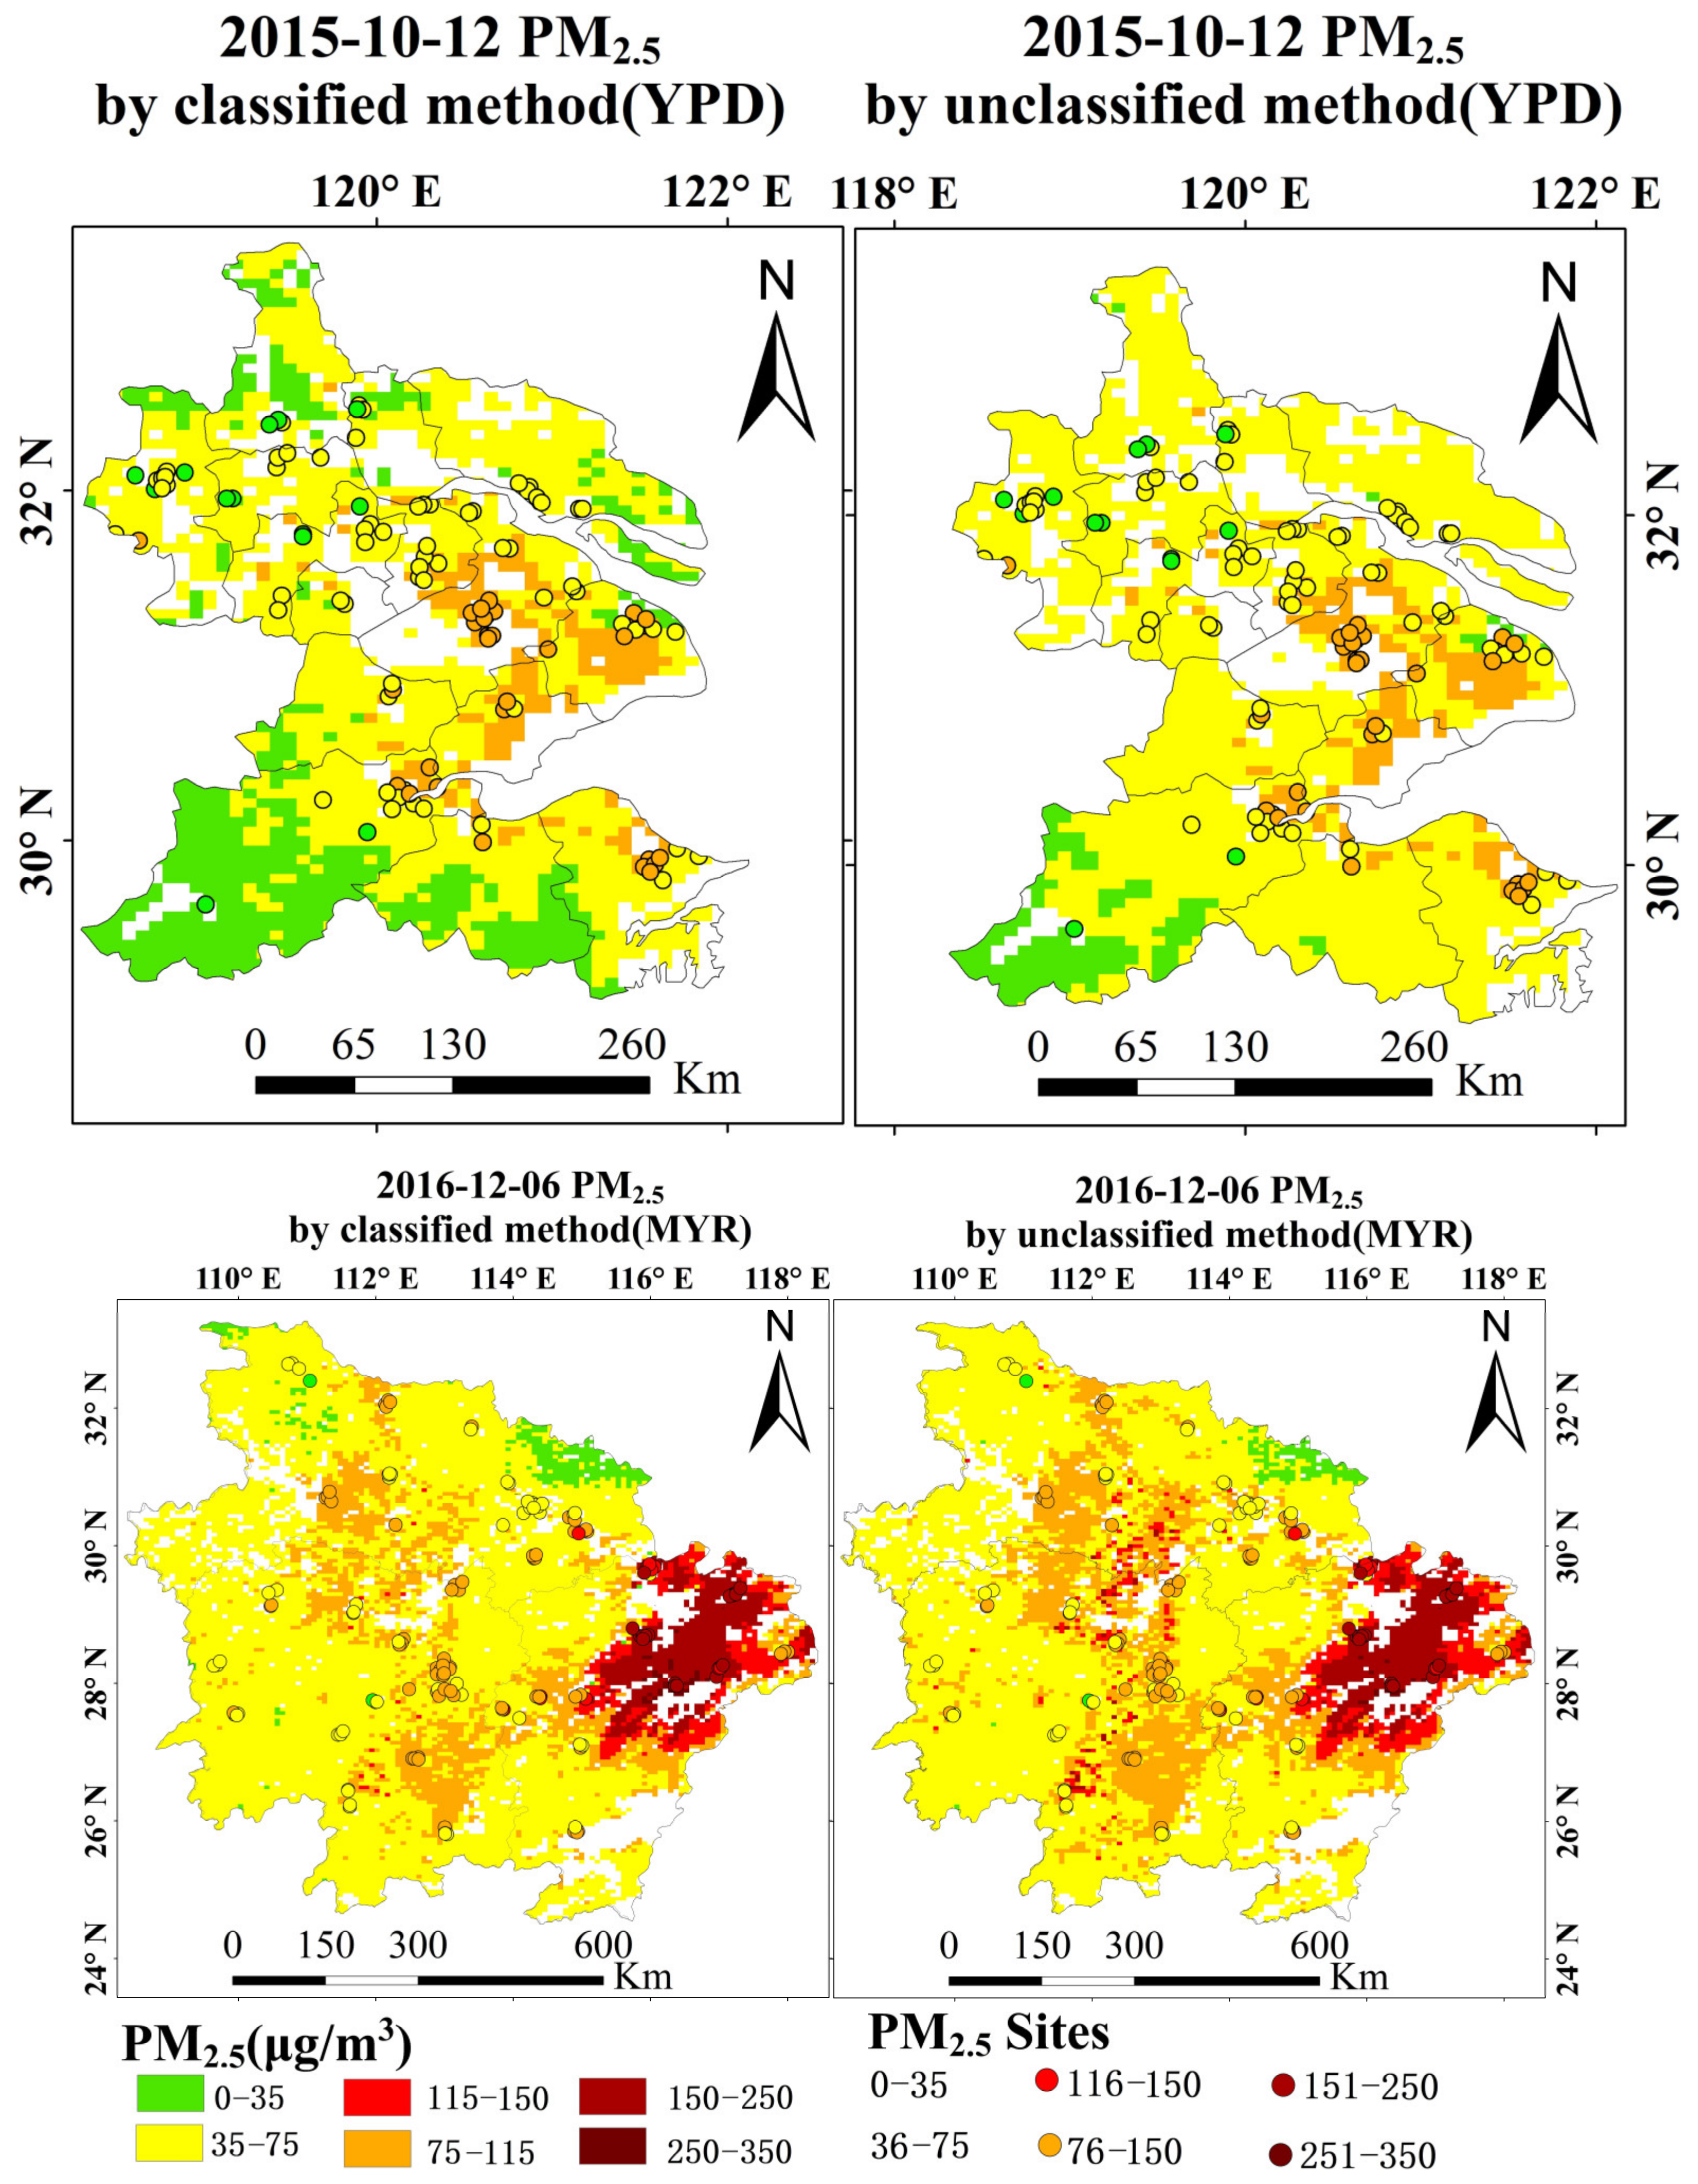
3.3. Comparison of PM2.5 Daily Estimates
3.4. Spatiotemporal Variations in Satellite-Retrieved PM2.5
4. Discussion
5. Conclusions
- (1)
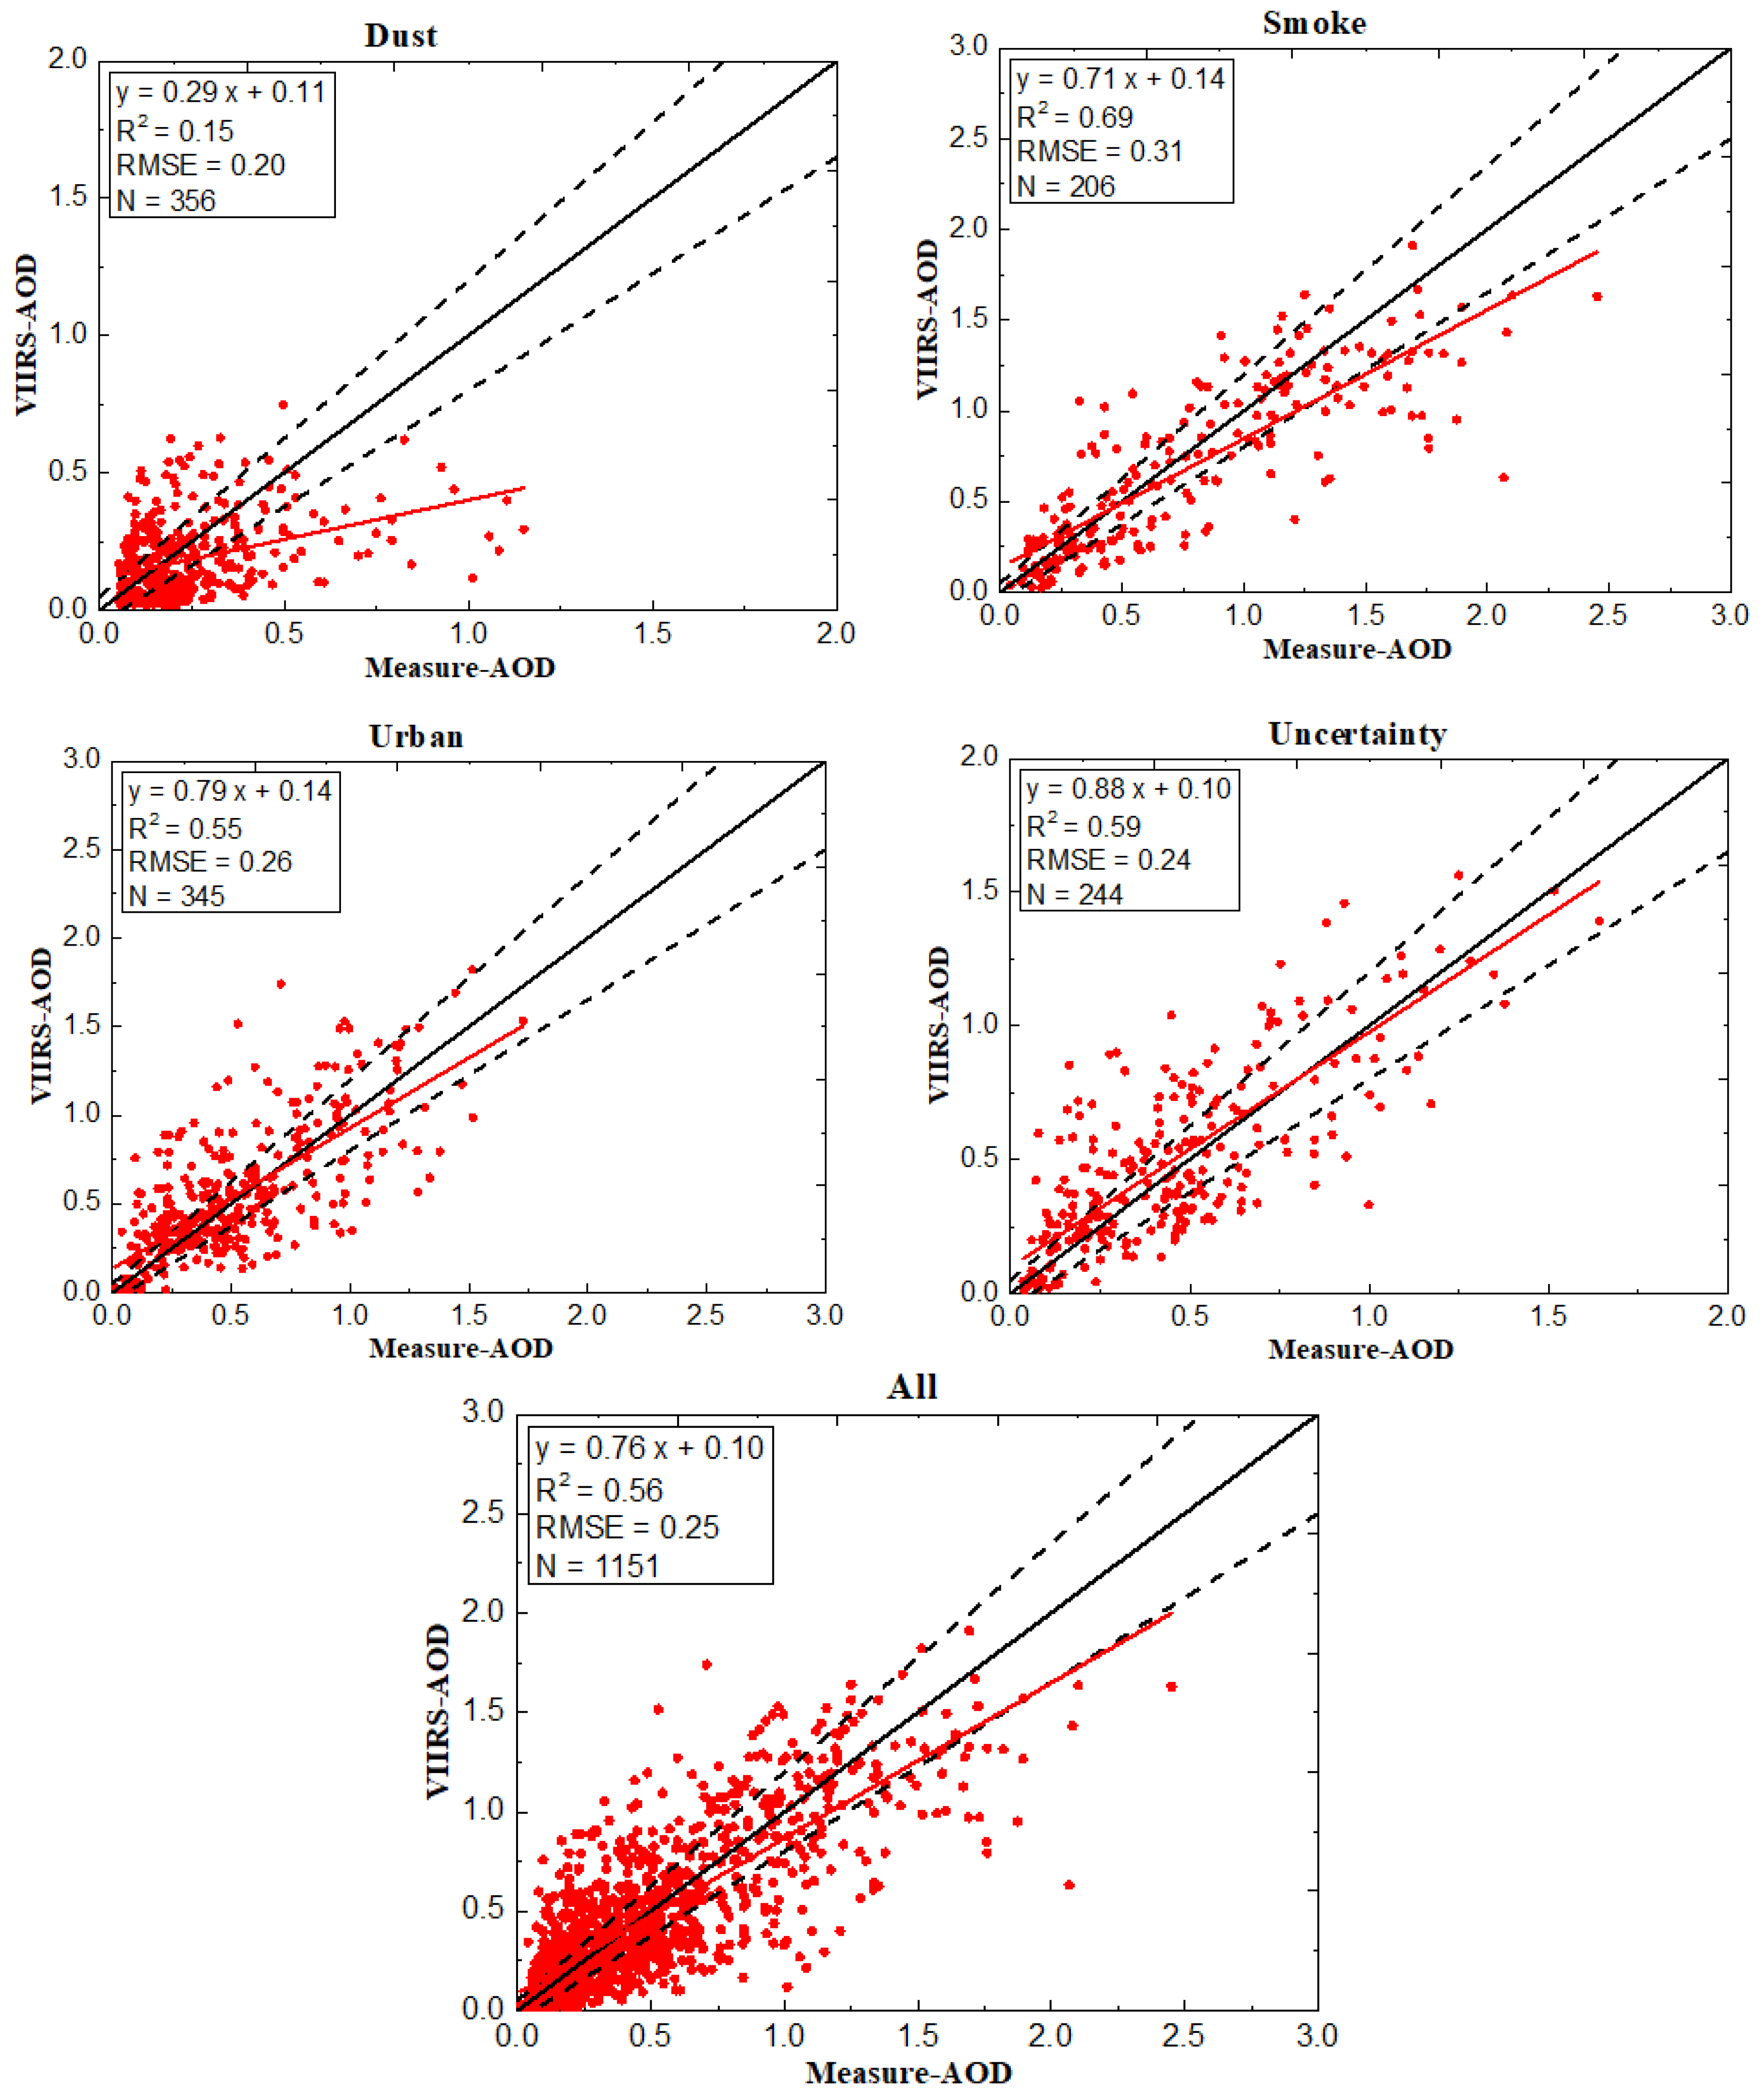
- Using the ground-measured AOD to verify the accuracy of the VIIRS AOD (Figure 1 and Figure 2), the correlation was high (R2 > 0.5) in dense-vegetation-coverage regions, and the correlation with mixed dust or sea salt particles was low (R2 < 0.3). The accuracy of retrieval for different aerosol types was discussed, and the correlation of the smoke (dust) aerosol was the highest, with R2 = 0.69 (lowest R2 = 0.15).
- (2)
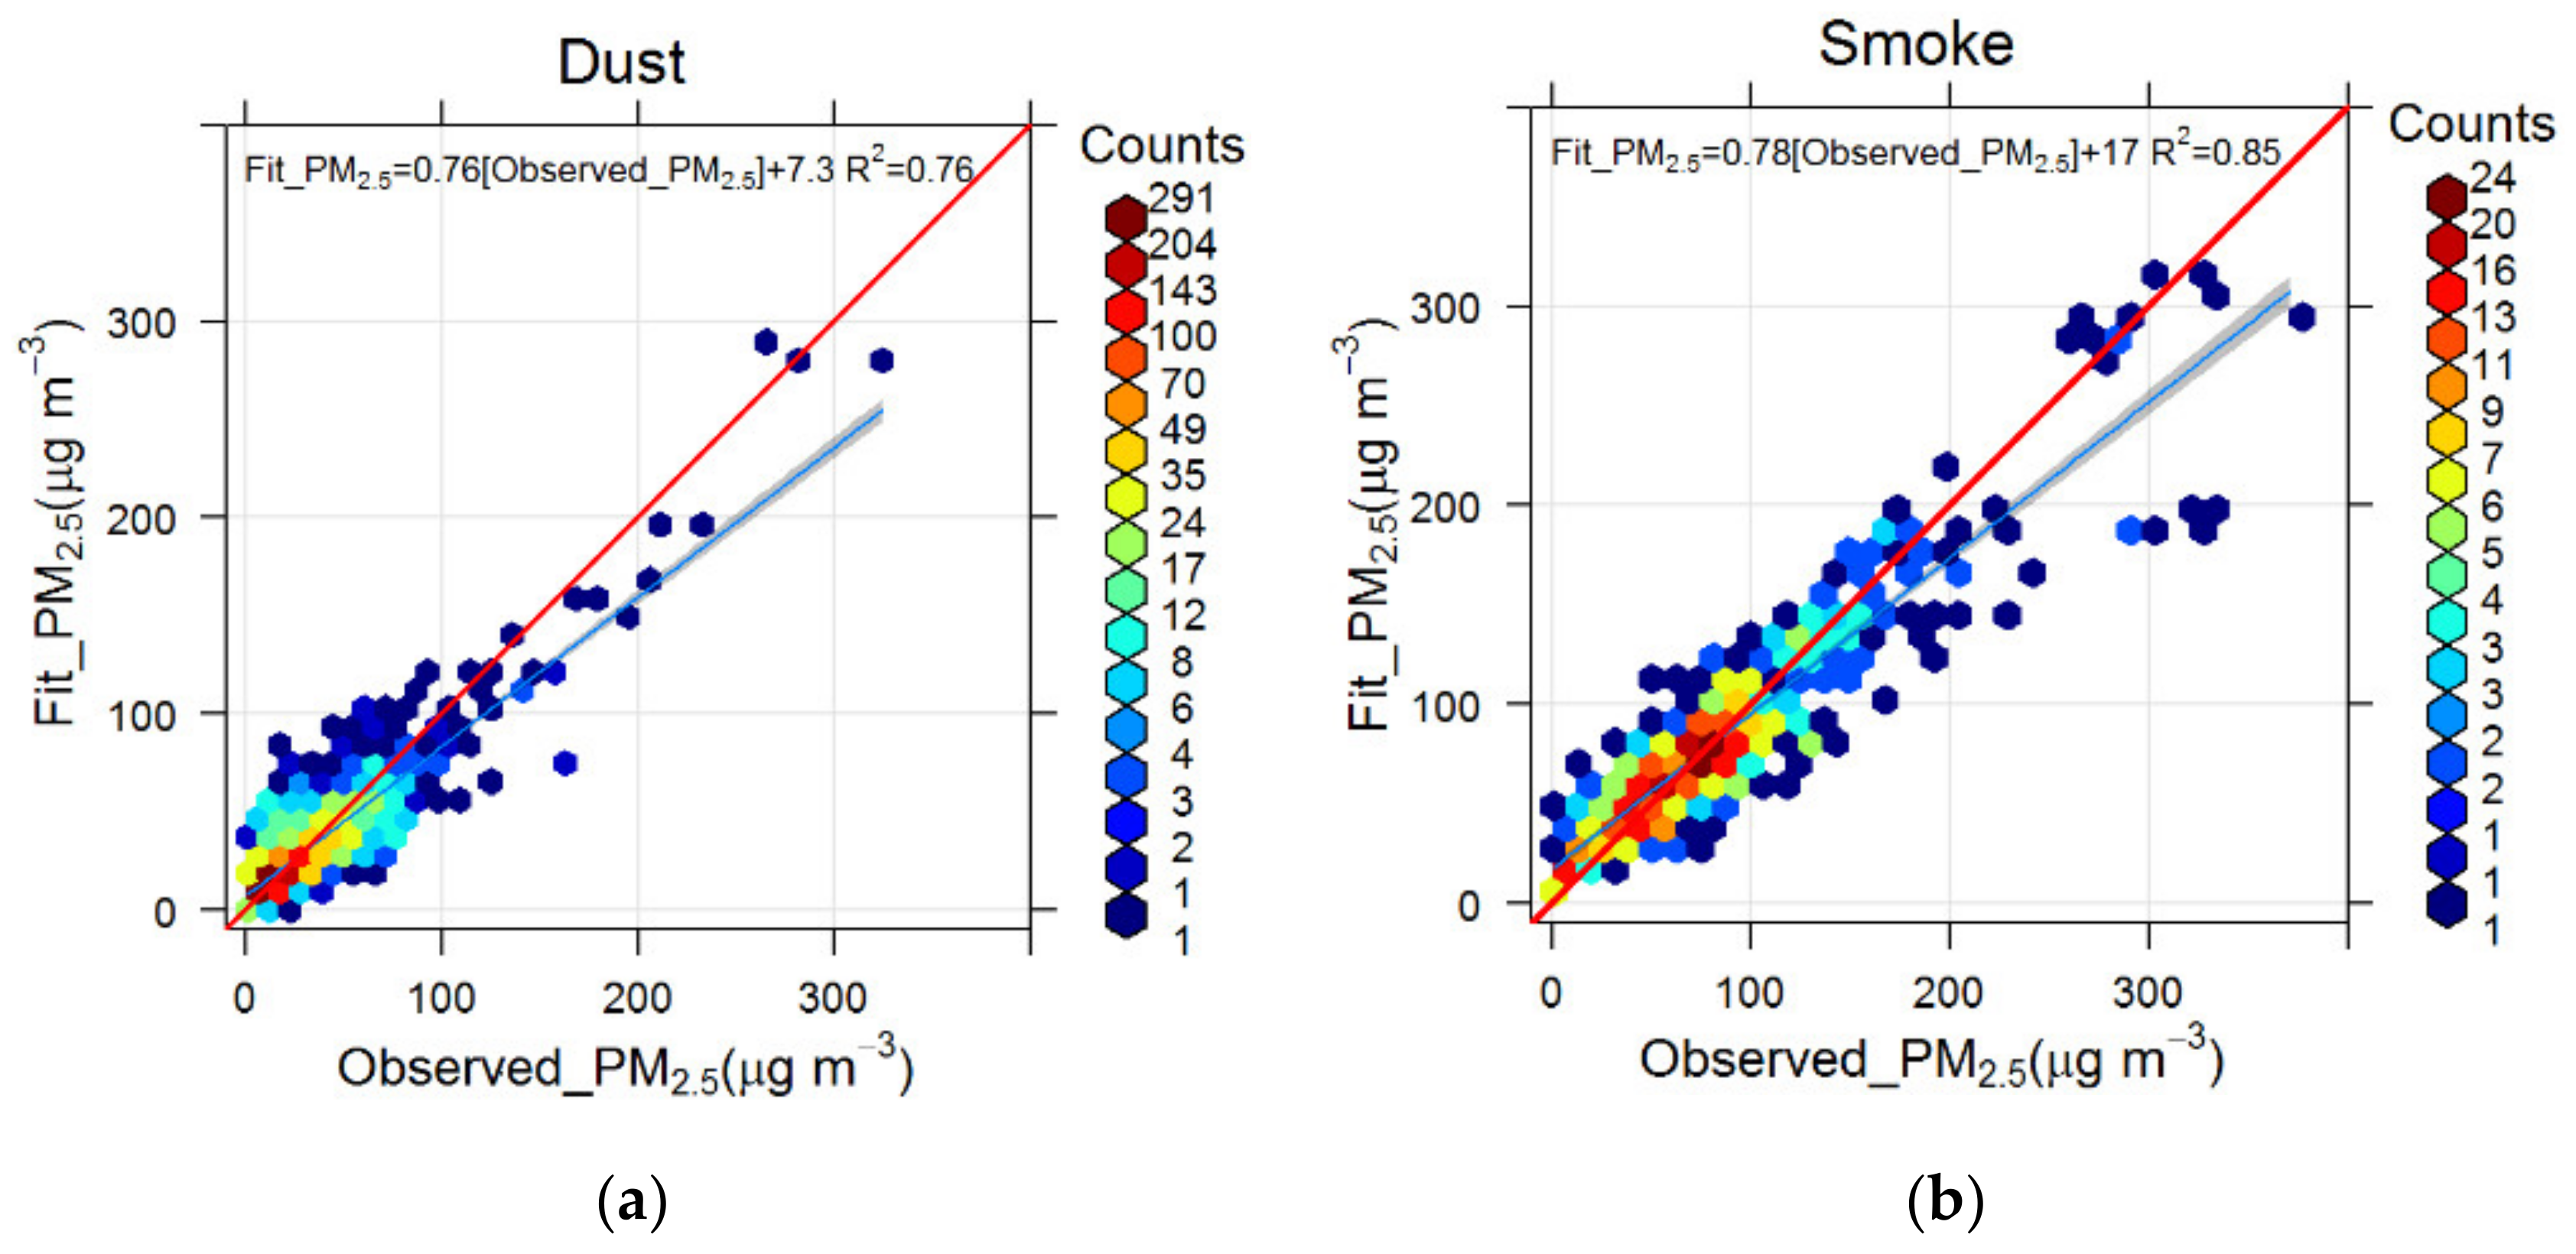
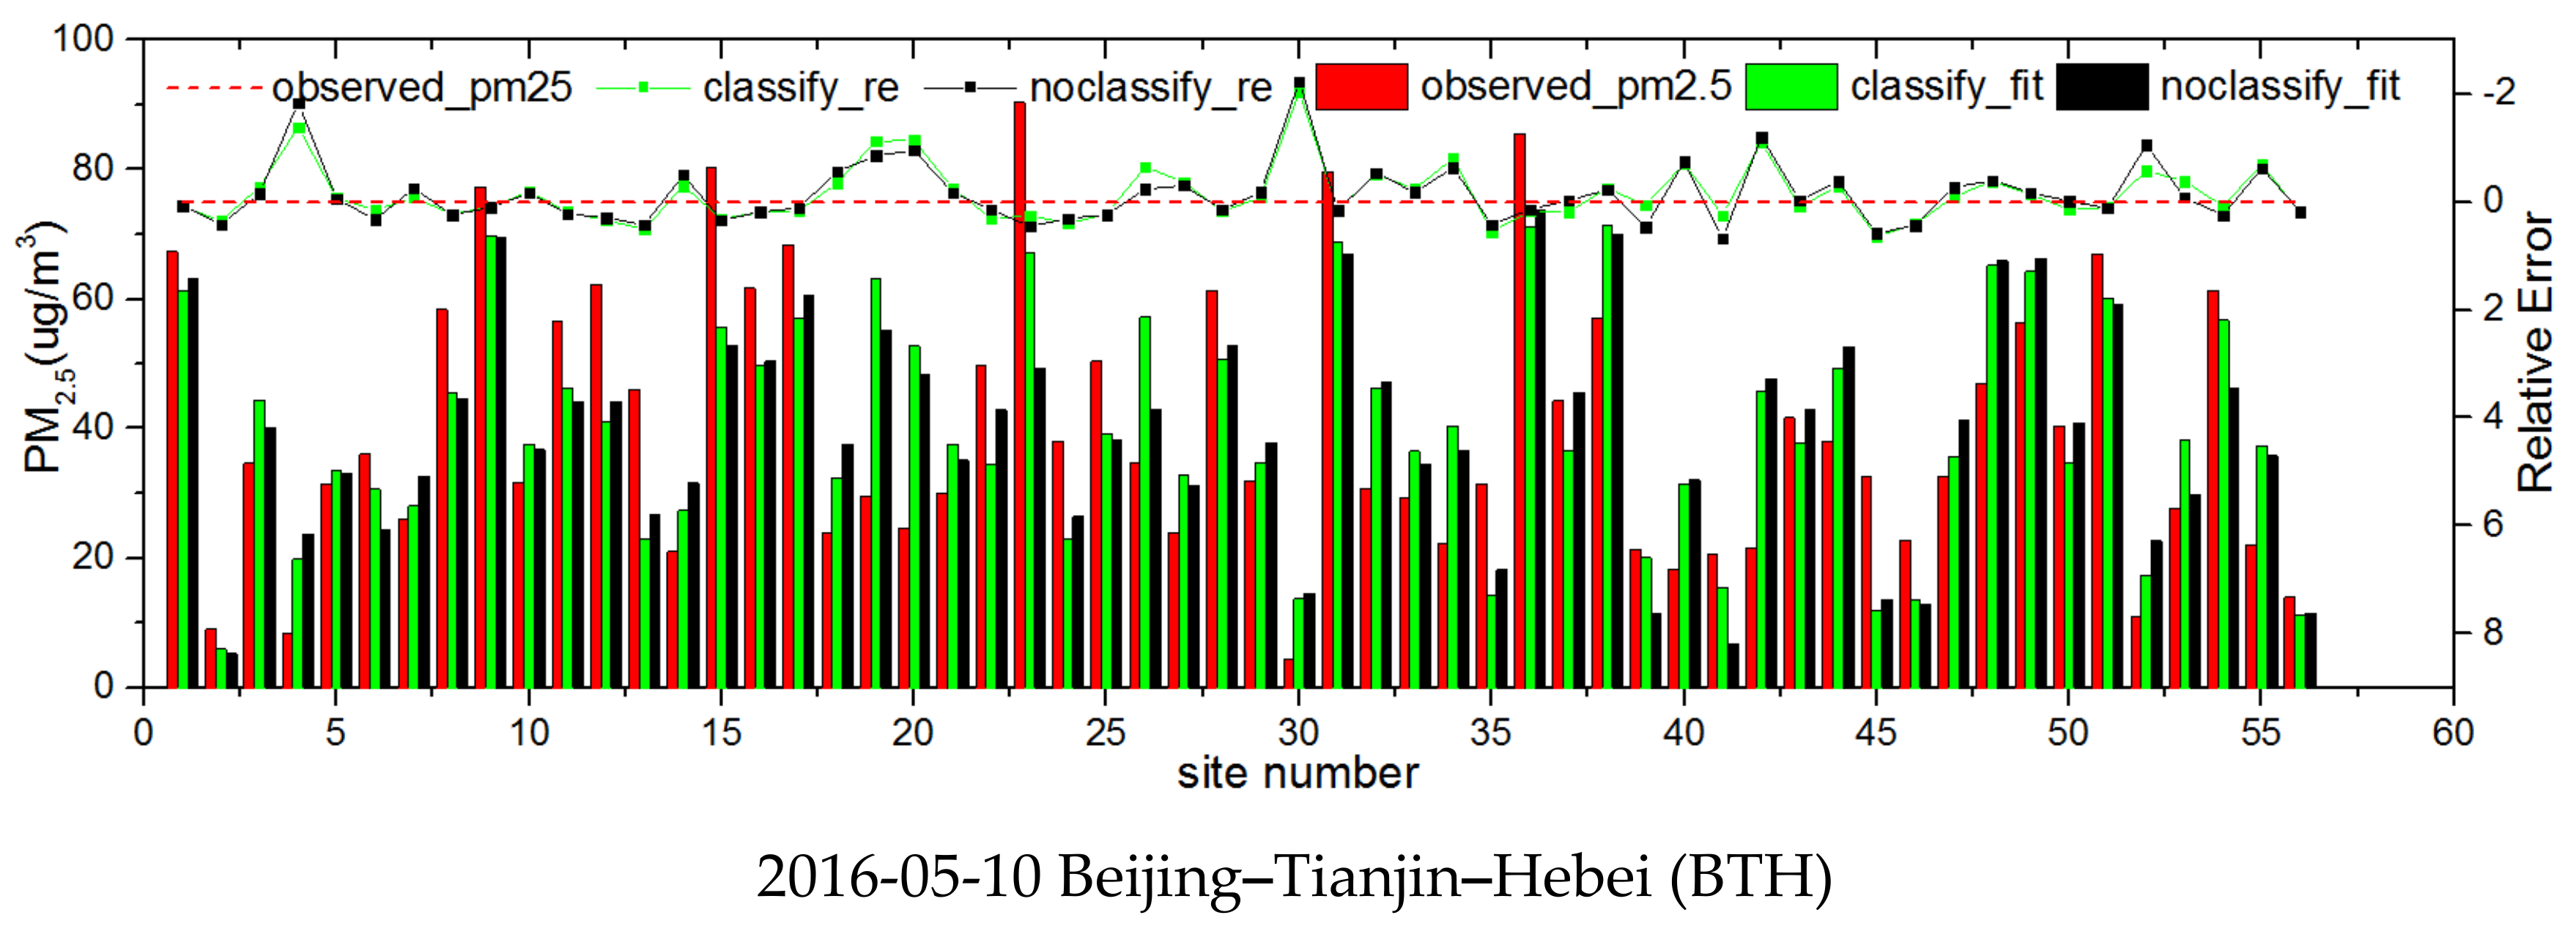
- The linear relationships between the four different aerosol types of AOD and PM2.5 in 2015 and 2016 were calculated. The smoke aerosol correlation was the highest (R2 values of 0.27 and 0.24, respectively), but was greatly improved after construction of the model estimates (Figure 3 and Table 5). The CV R2 was relatively low for dust aerosols and high for smoke and urban aerosols based on the two methods used to estimate the PM2.5 concentrations in BTH, SC, YRD, MYR, and PRD. The uncertain aerosol type had a certain influence on the accuracy of PM2.5 estimation.
- (3)
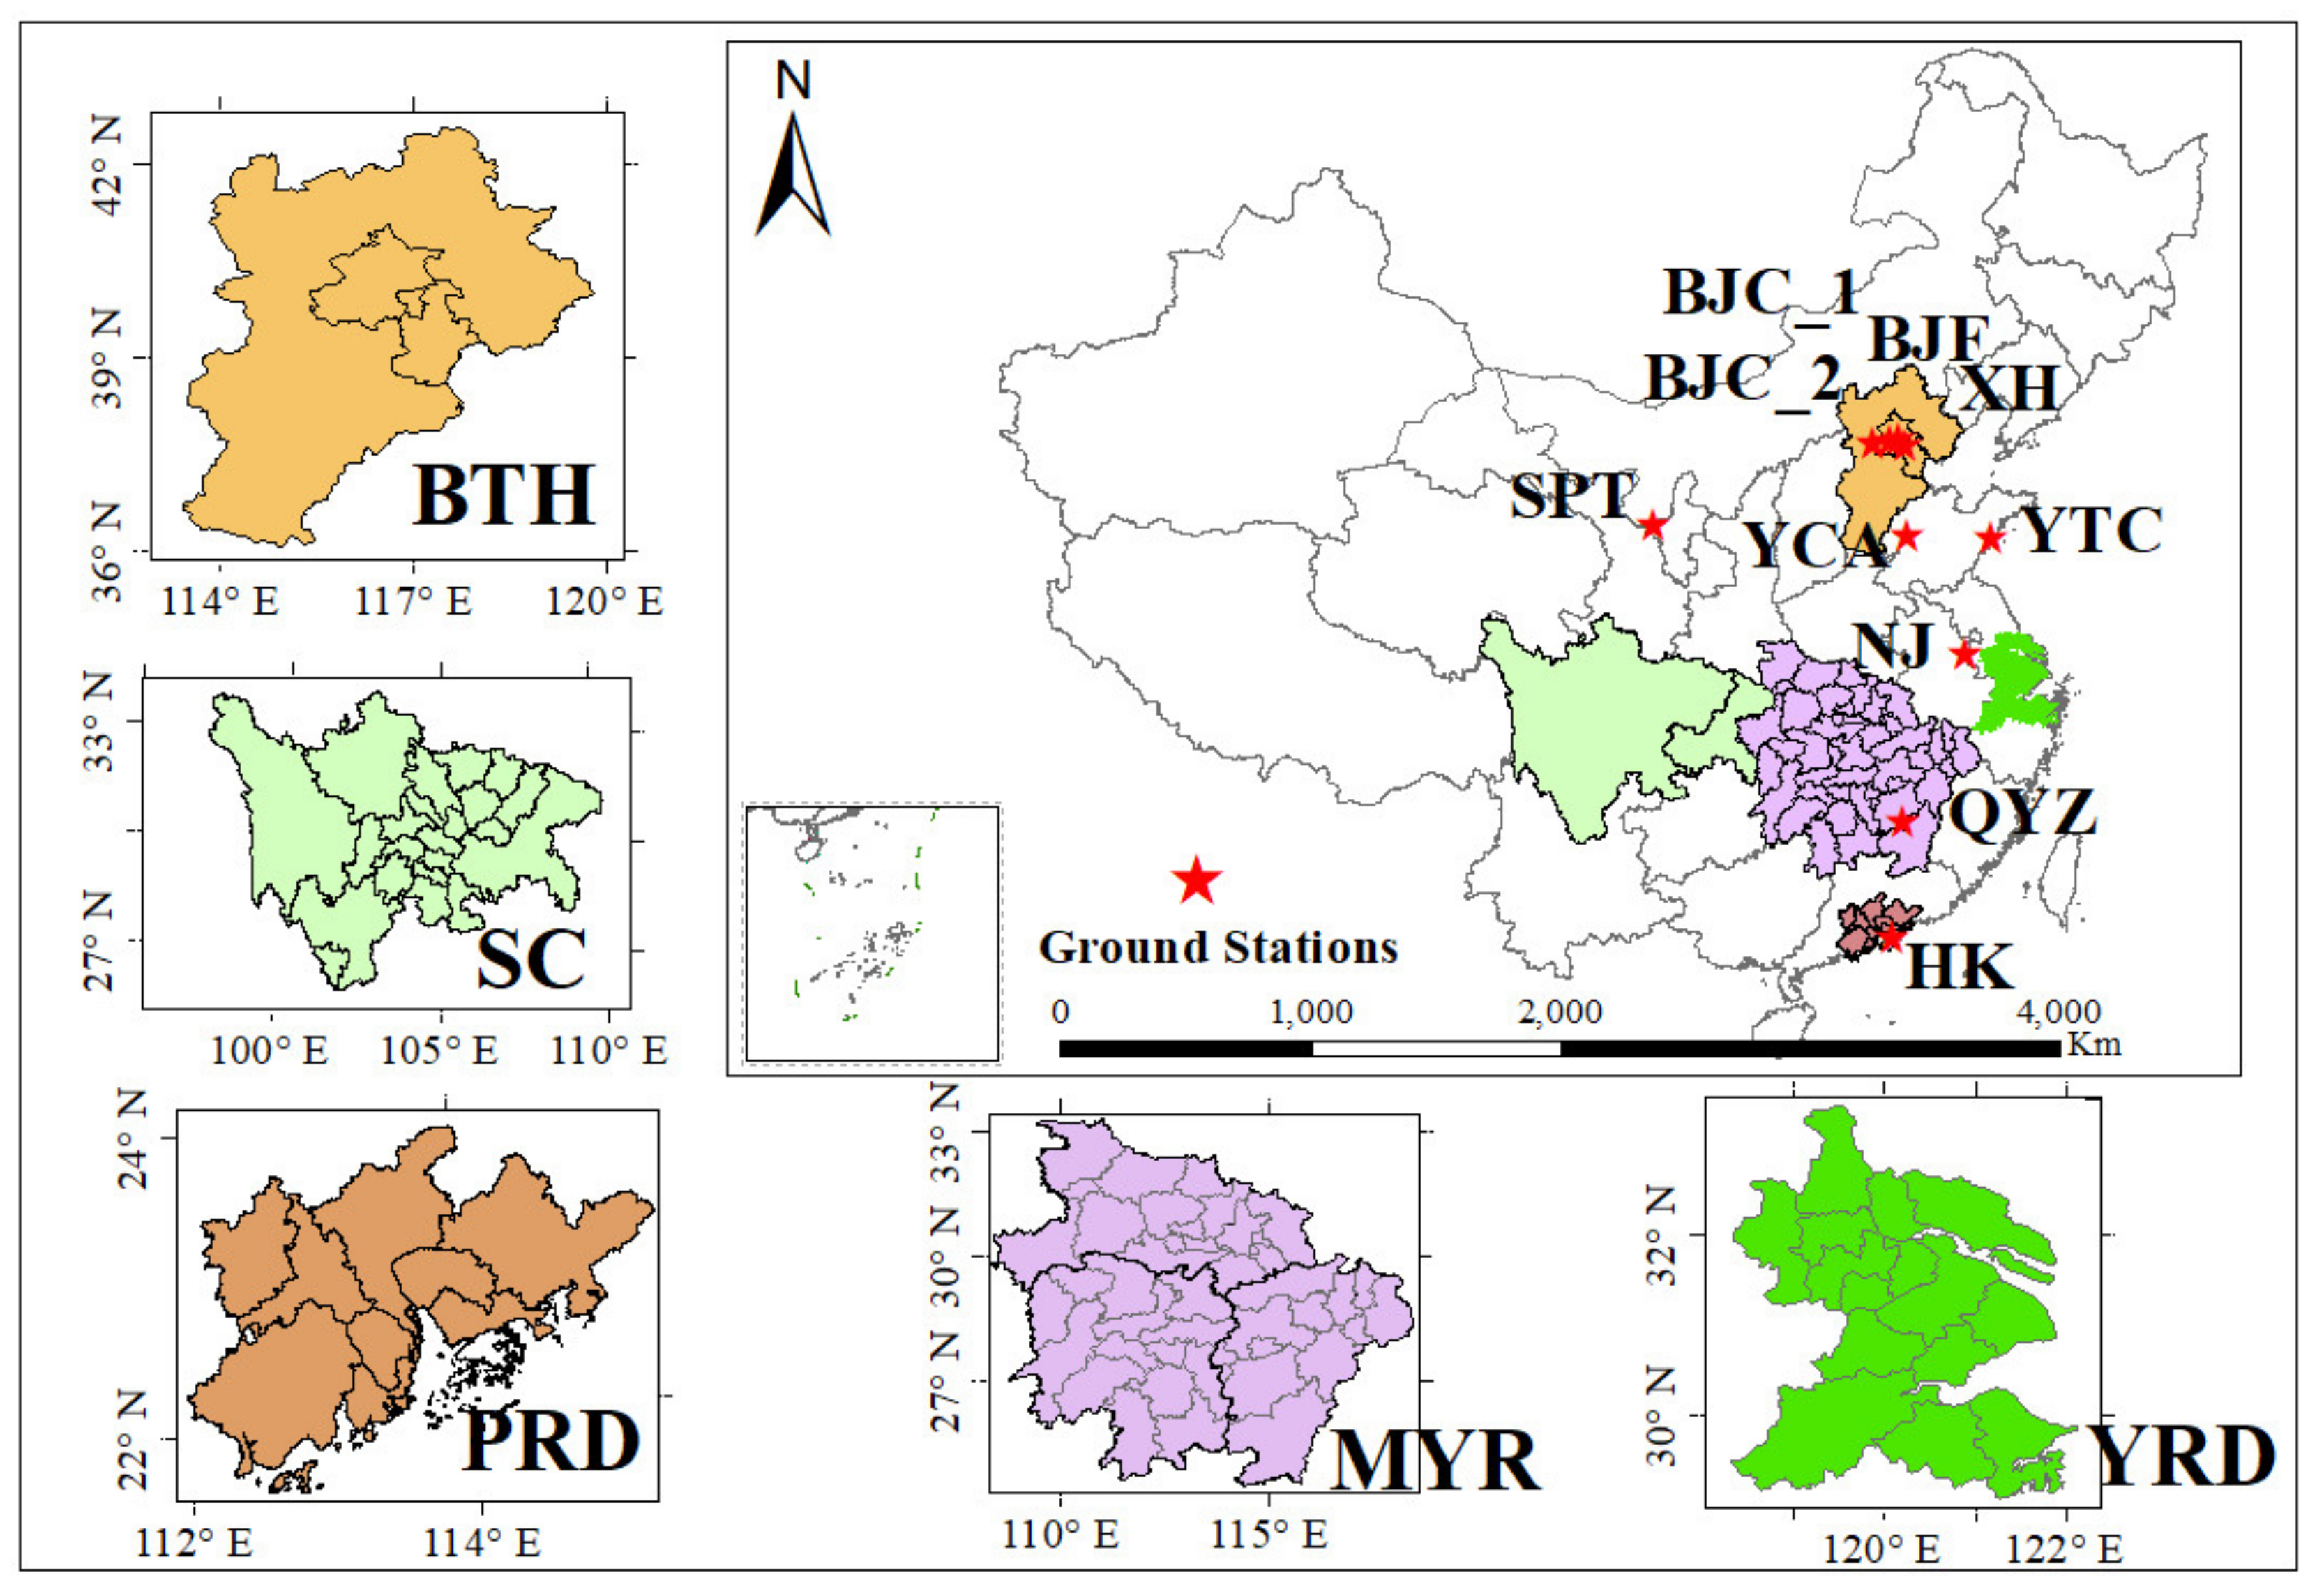
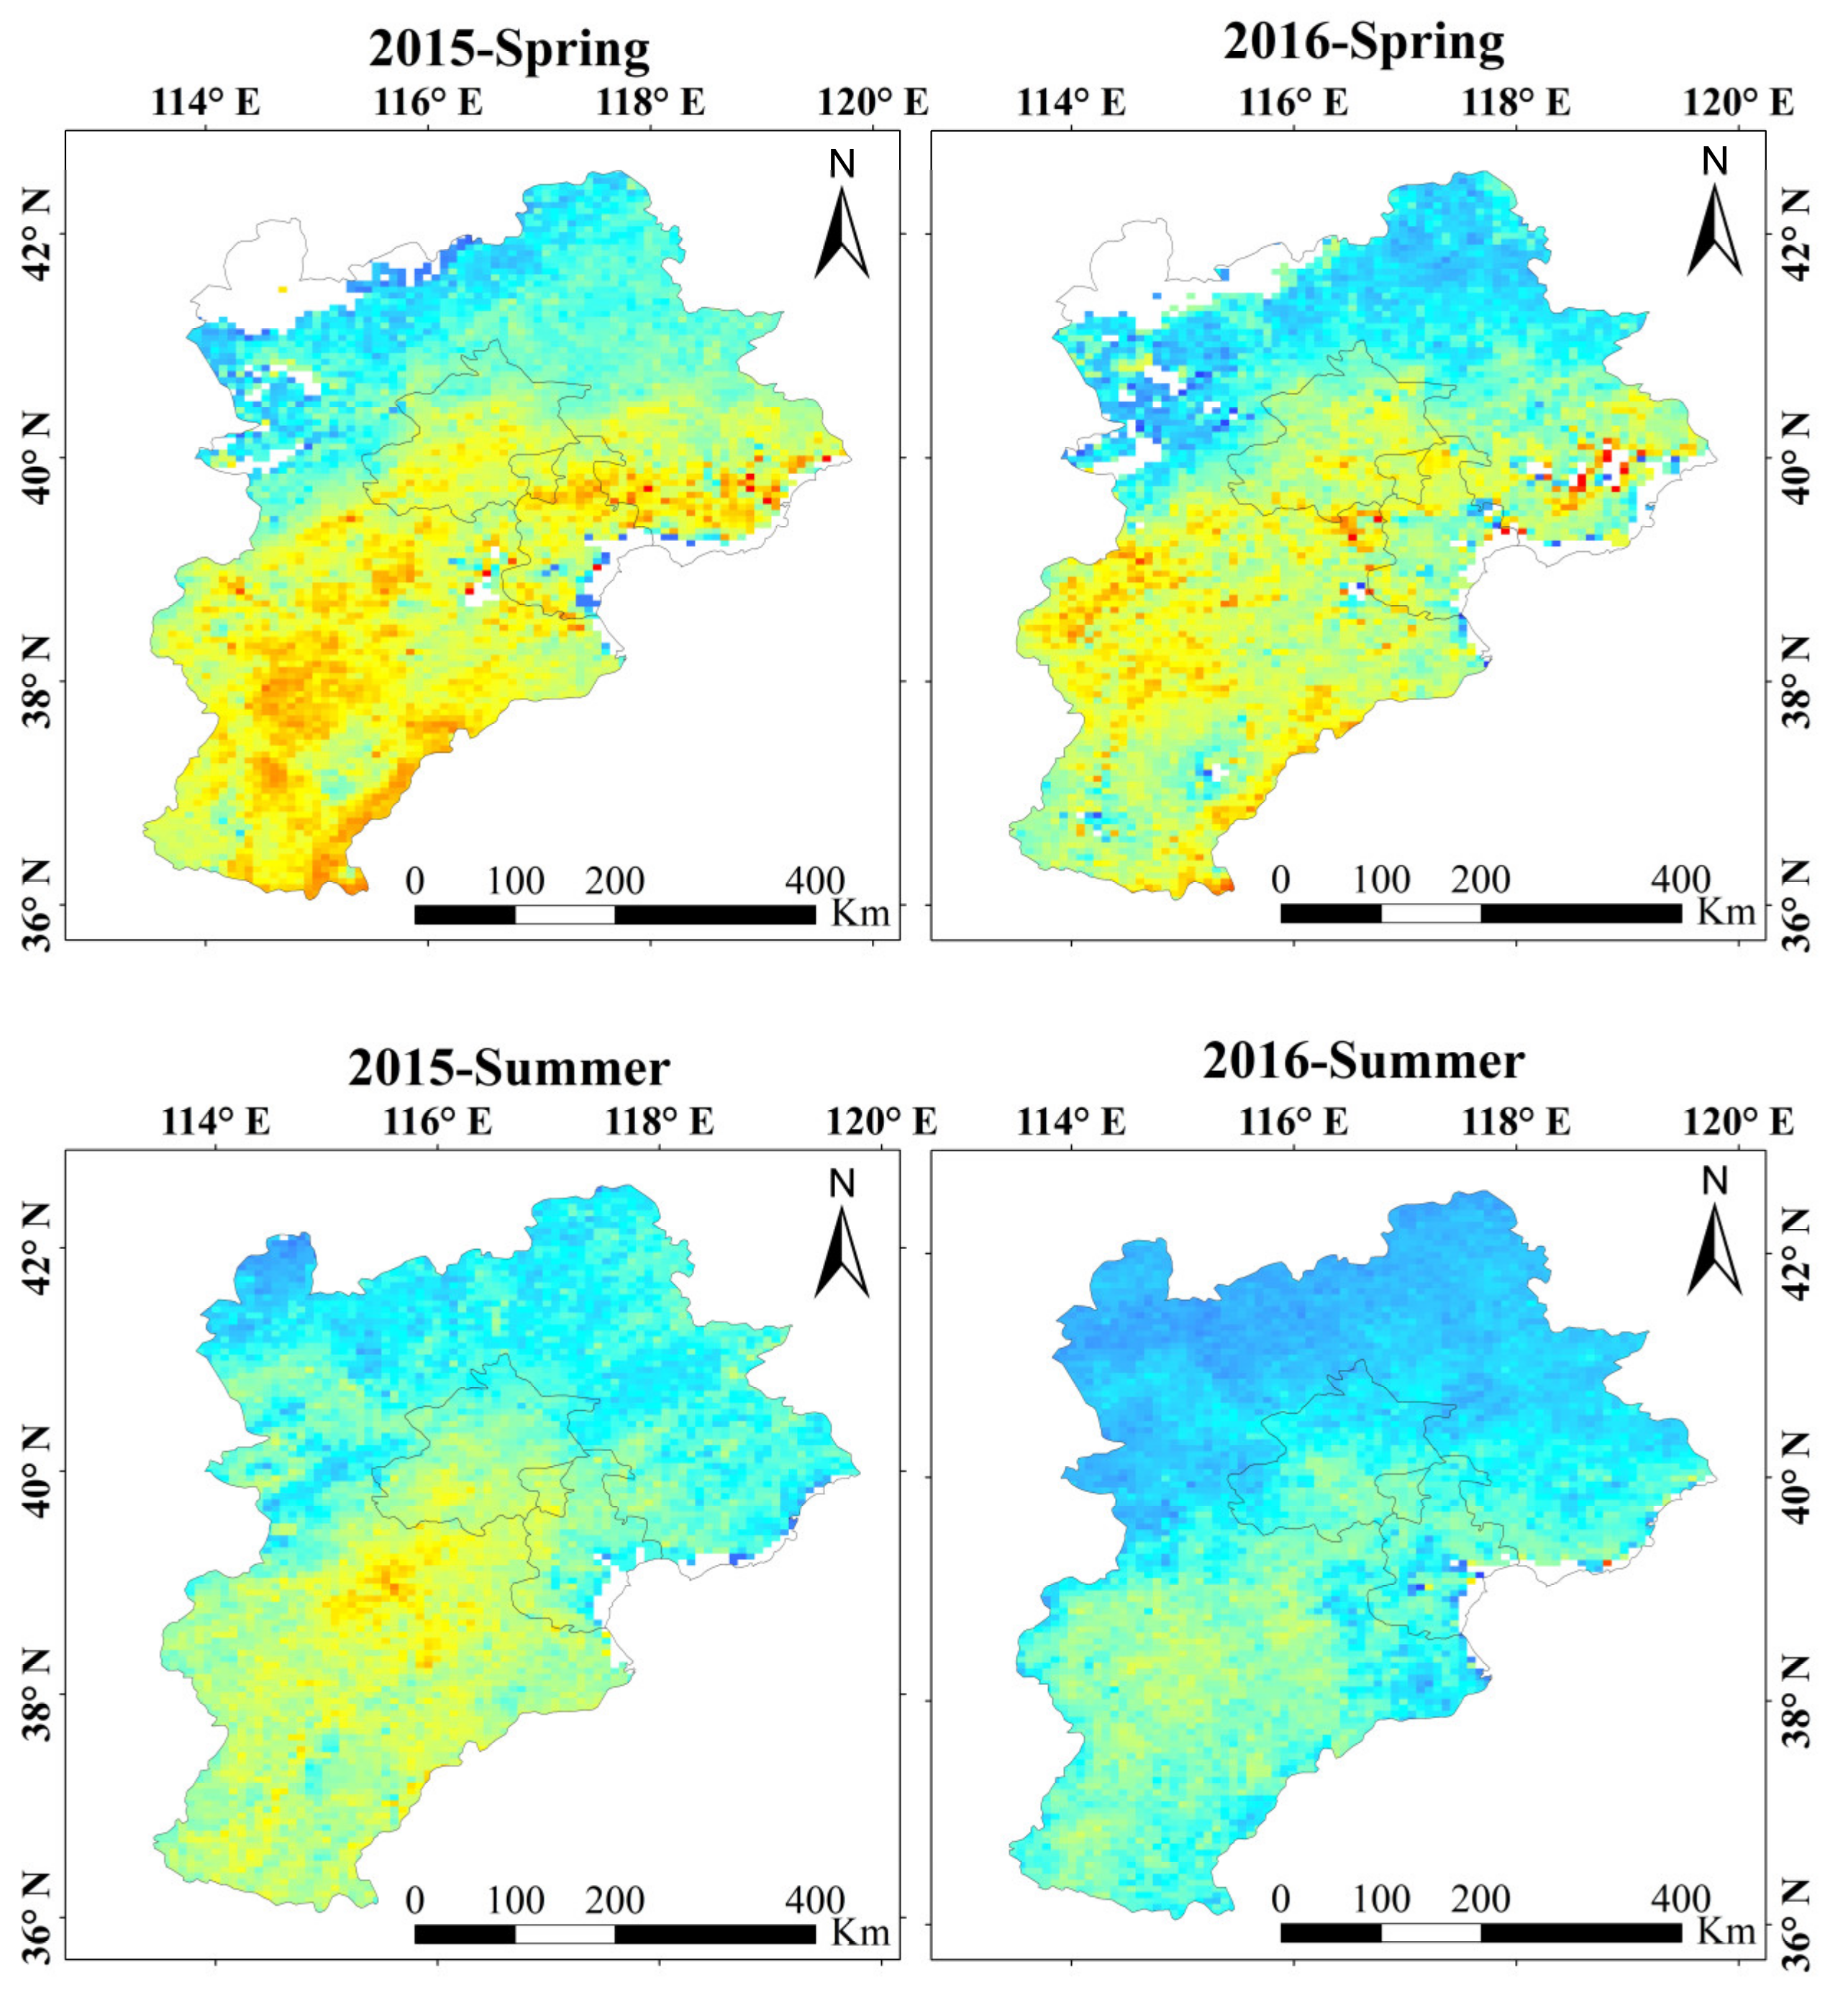
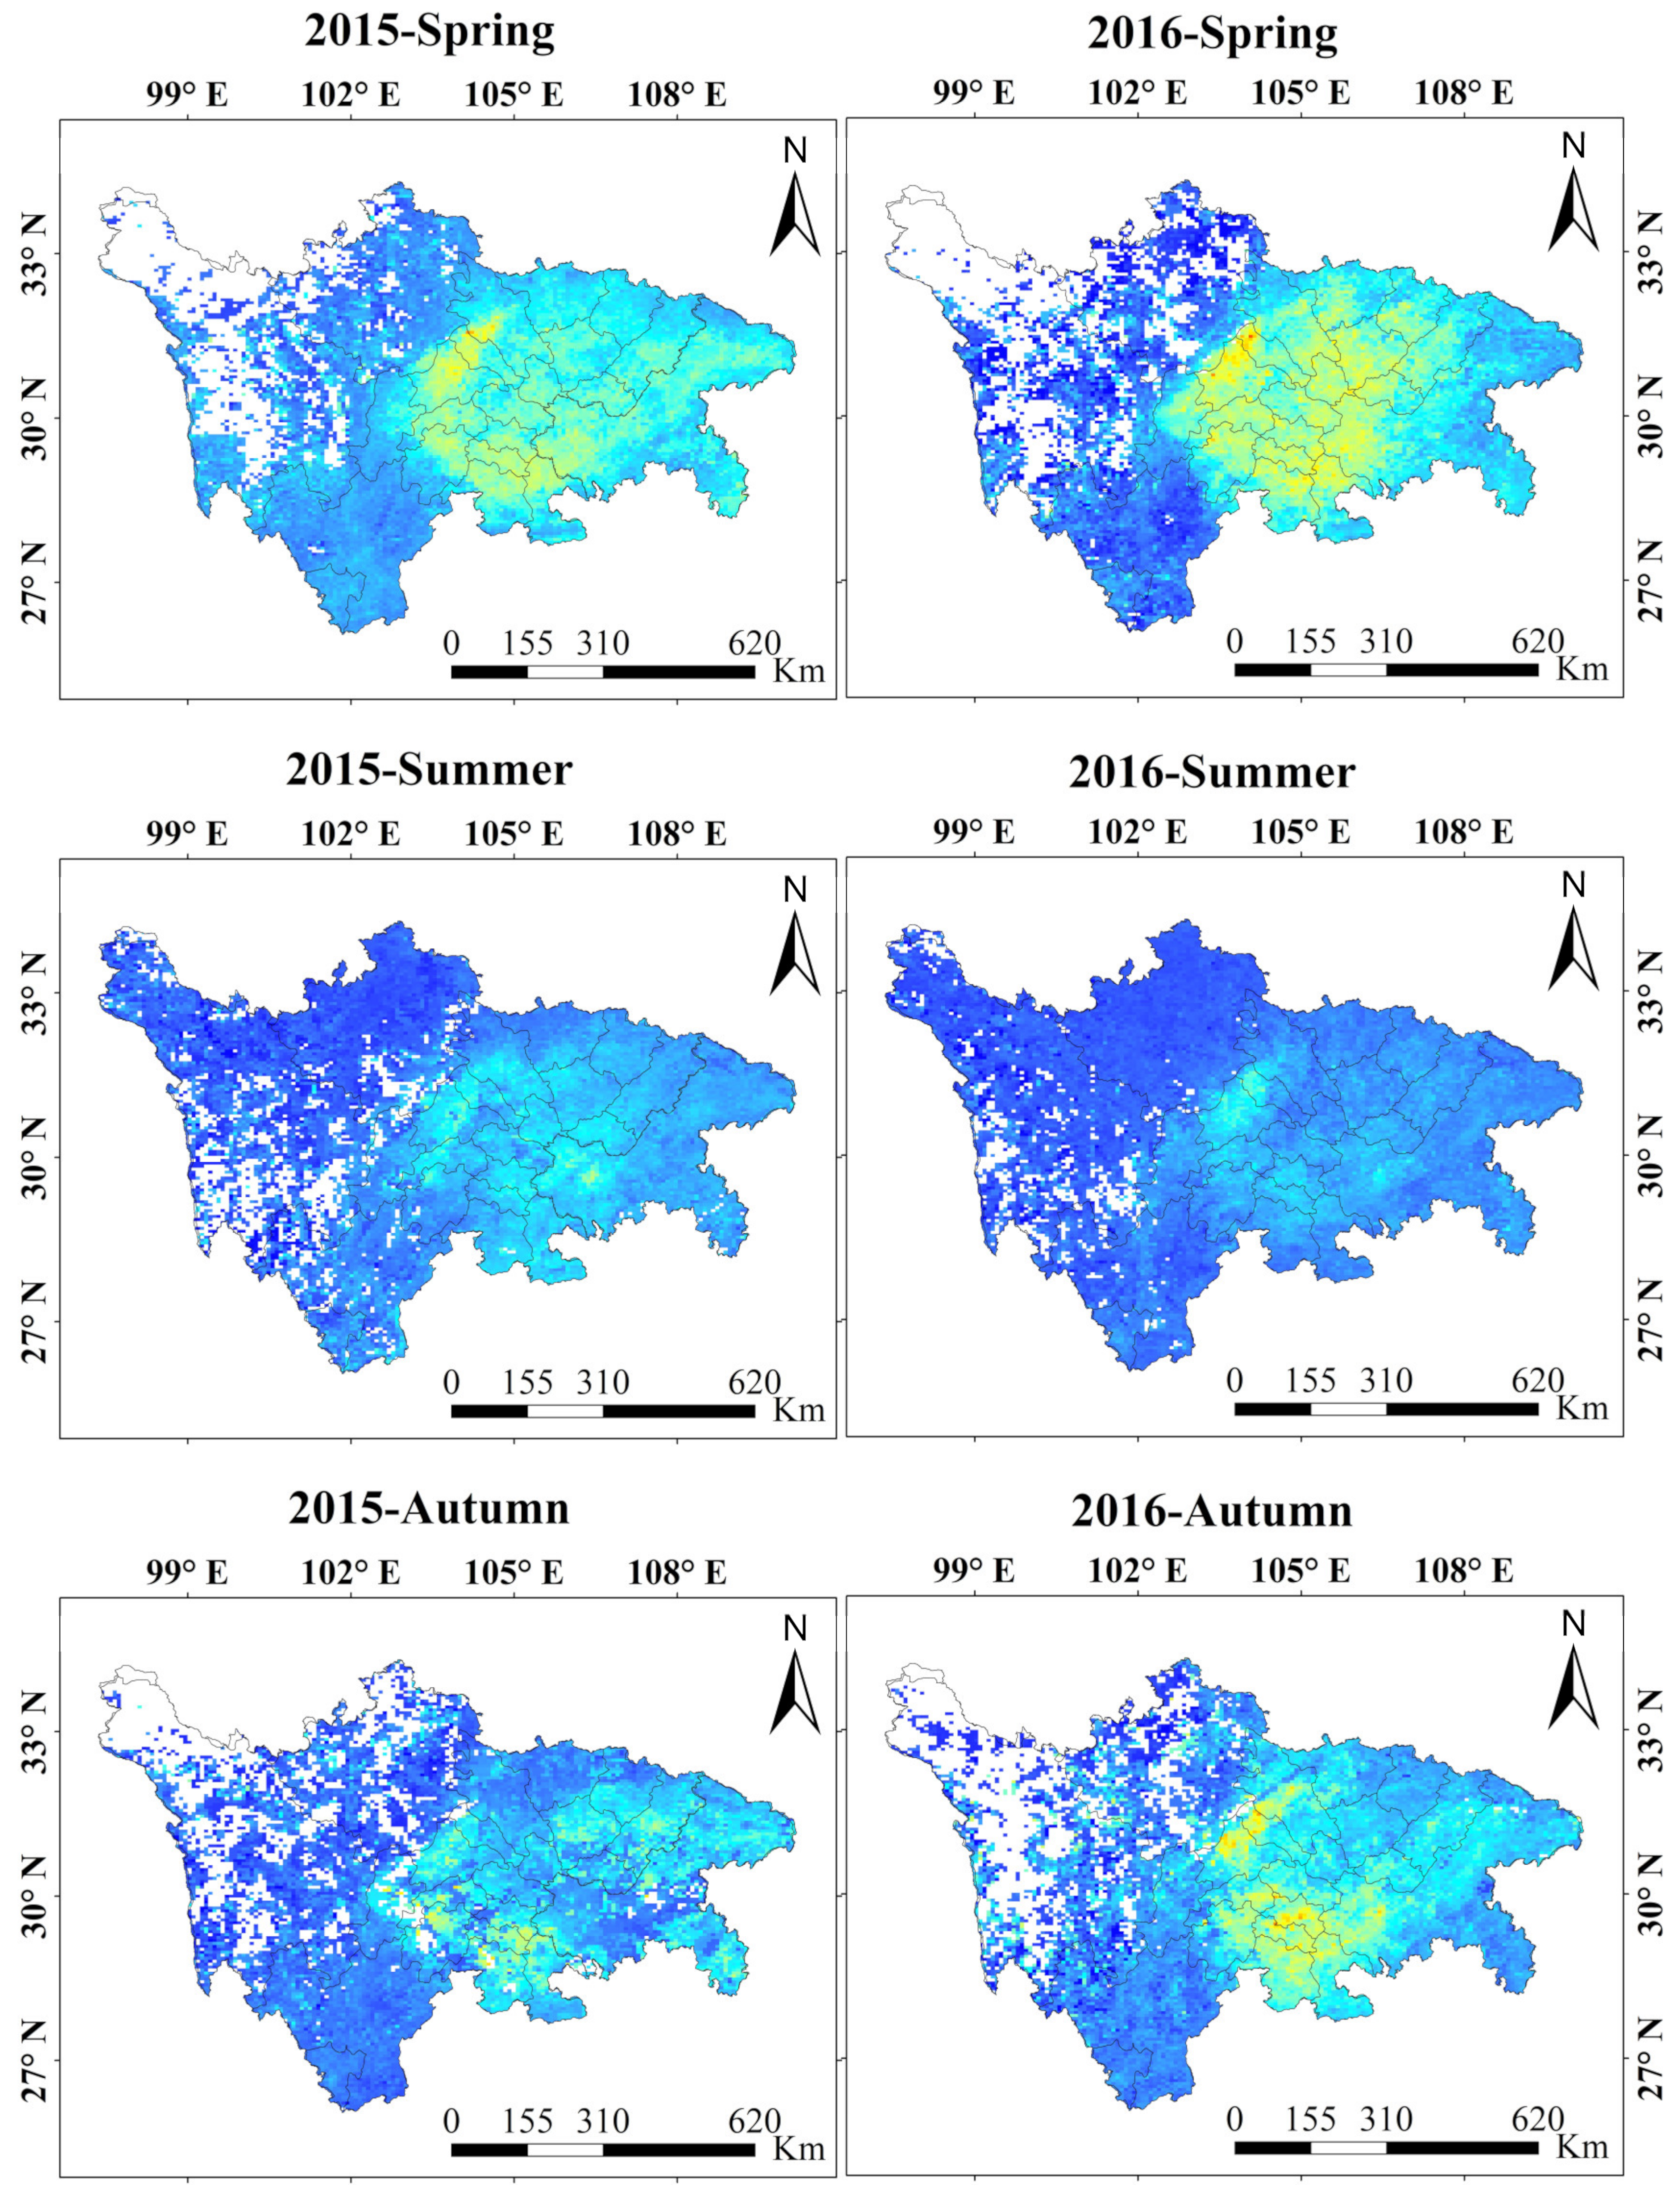
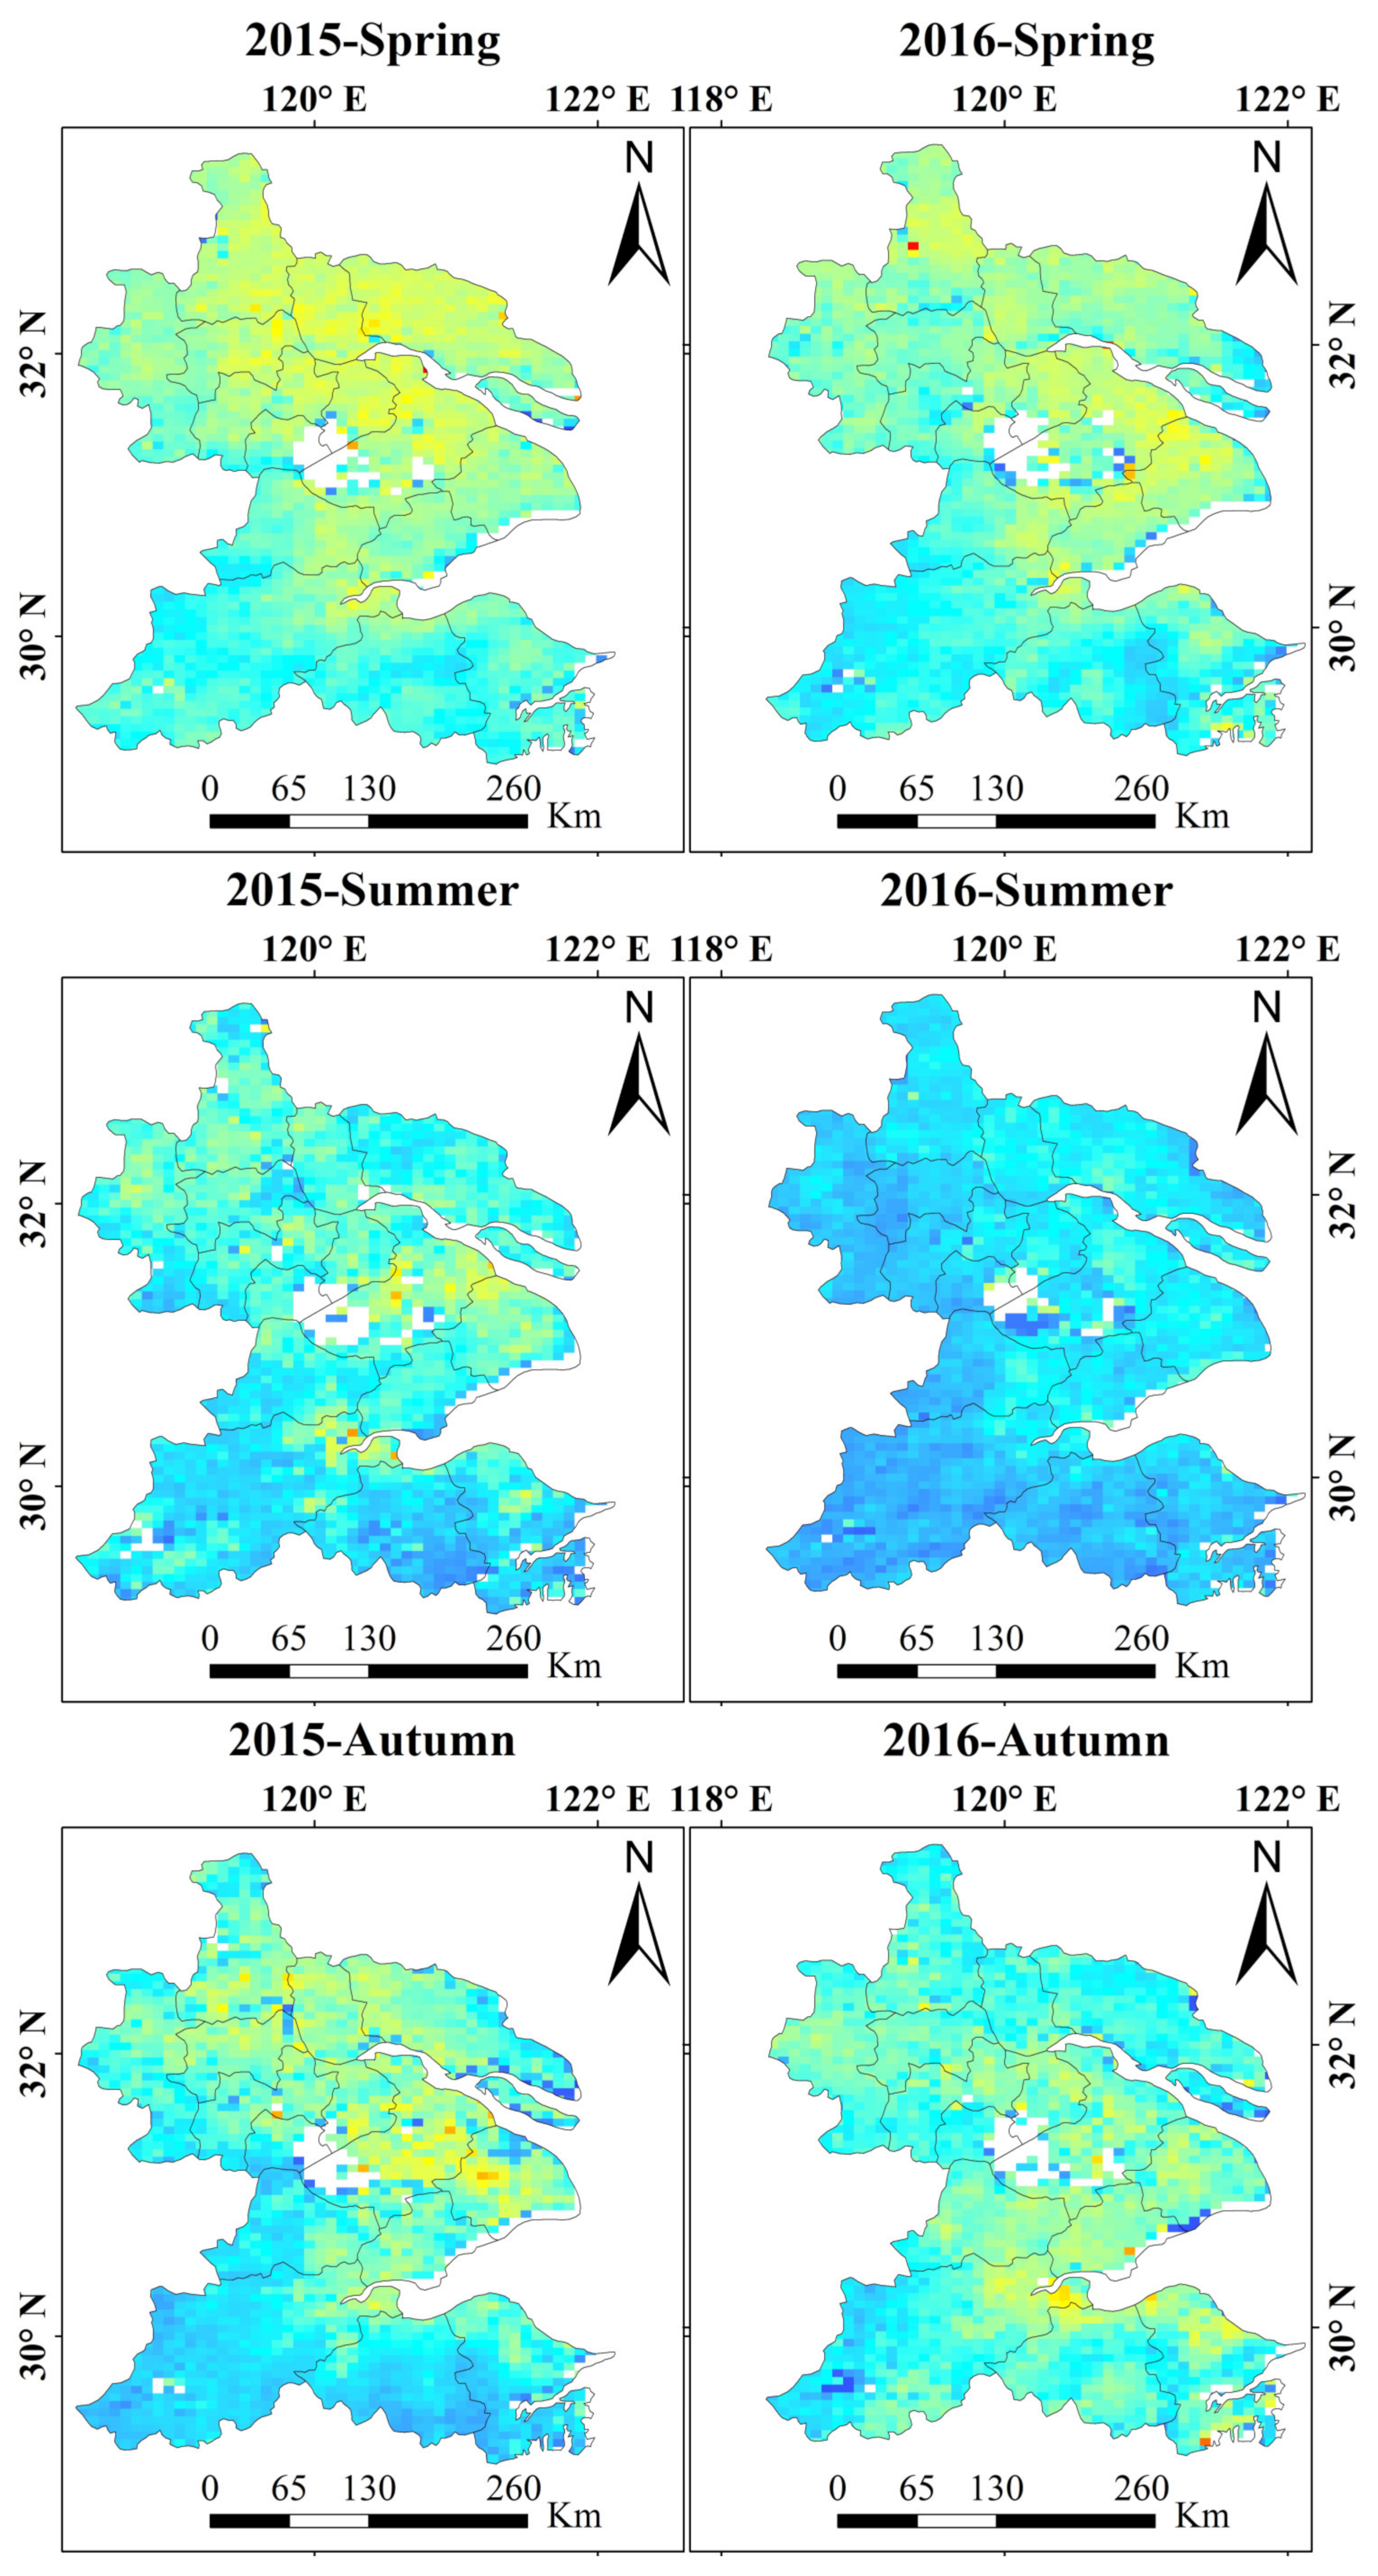
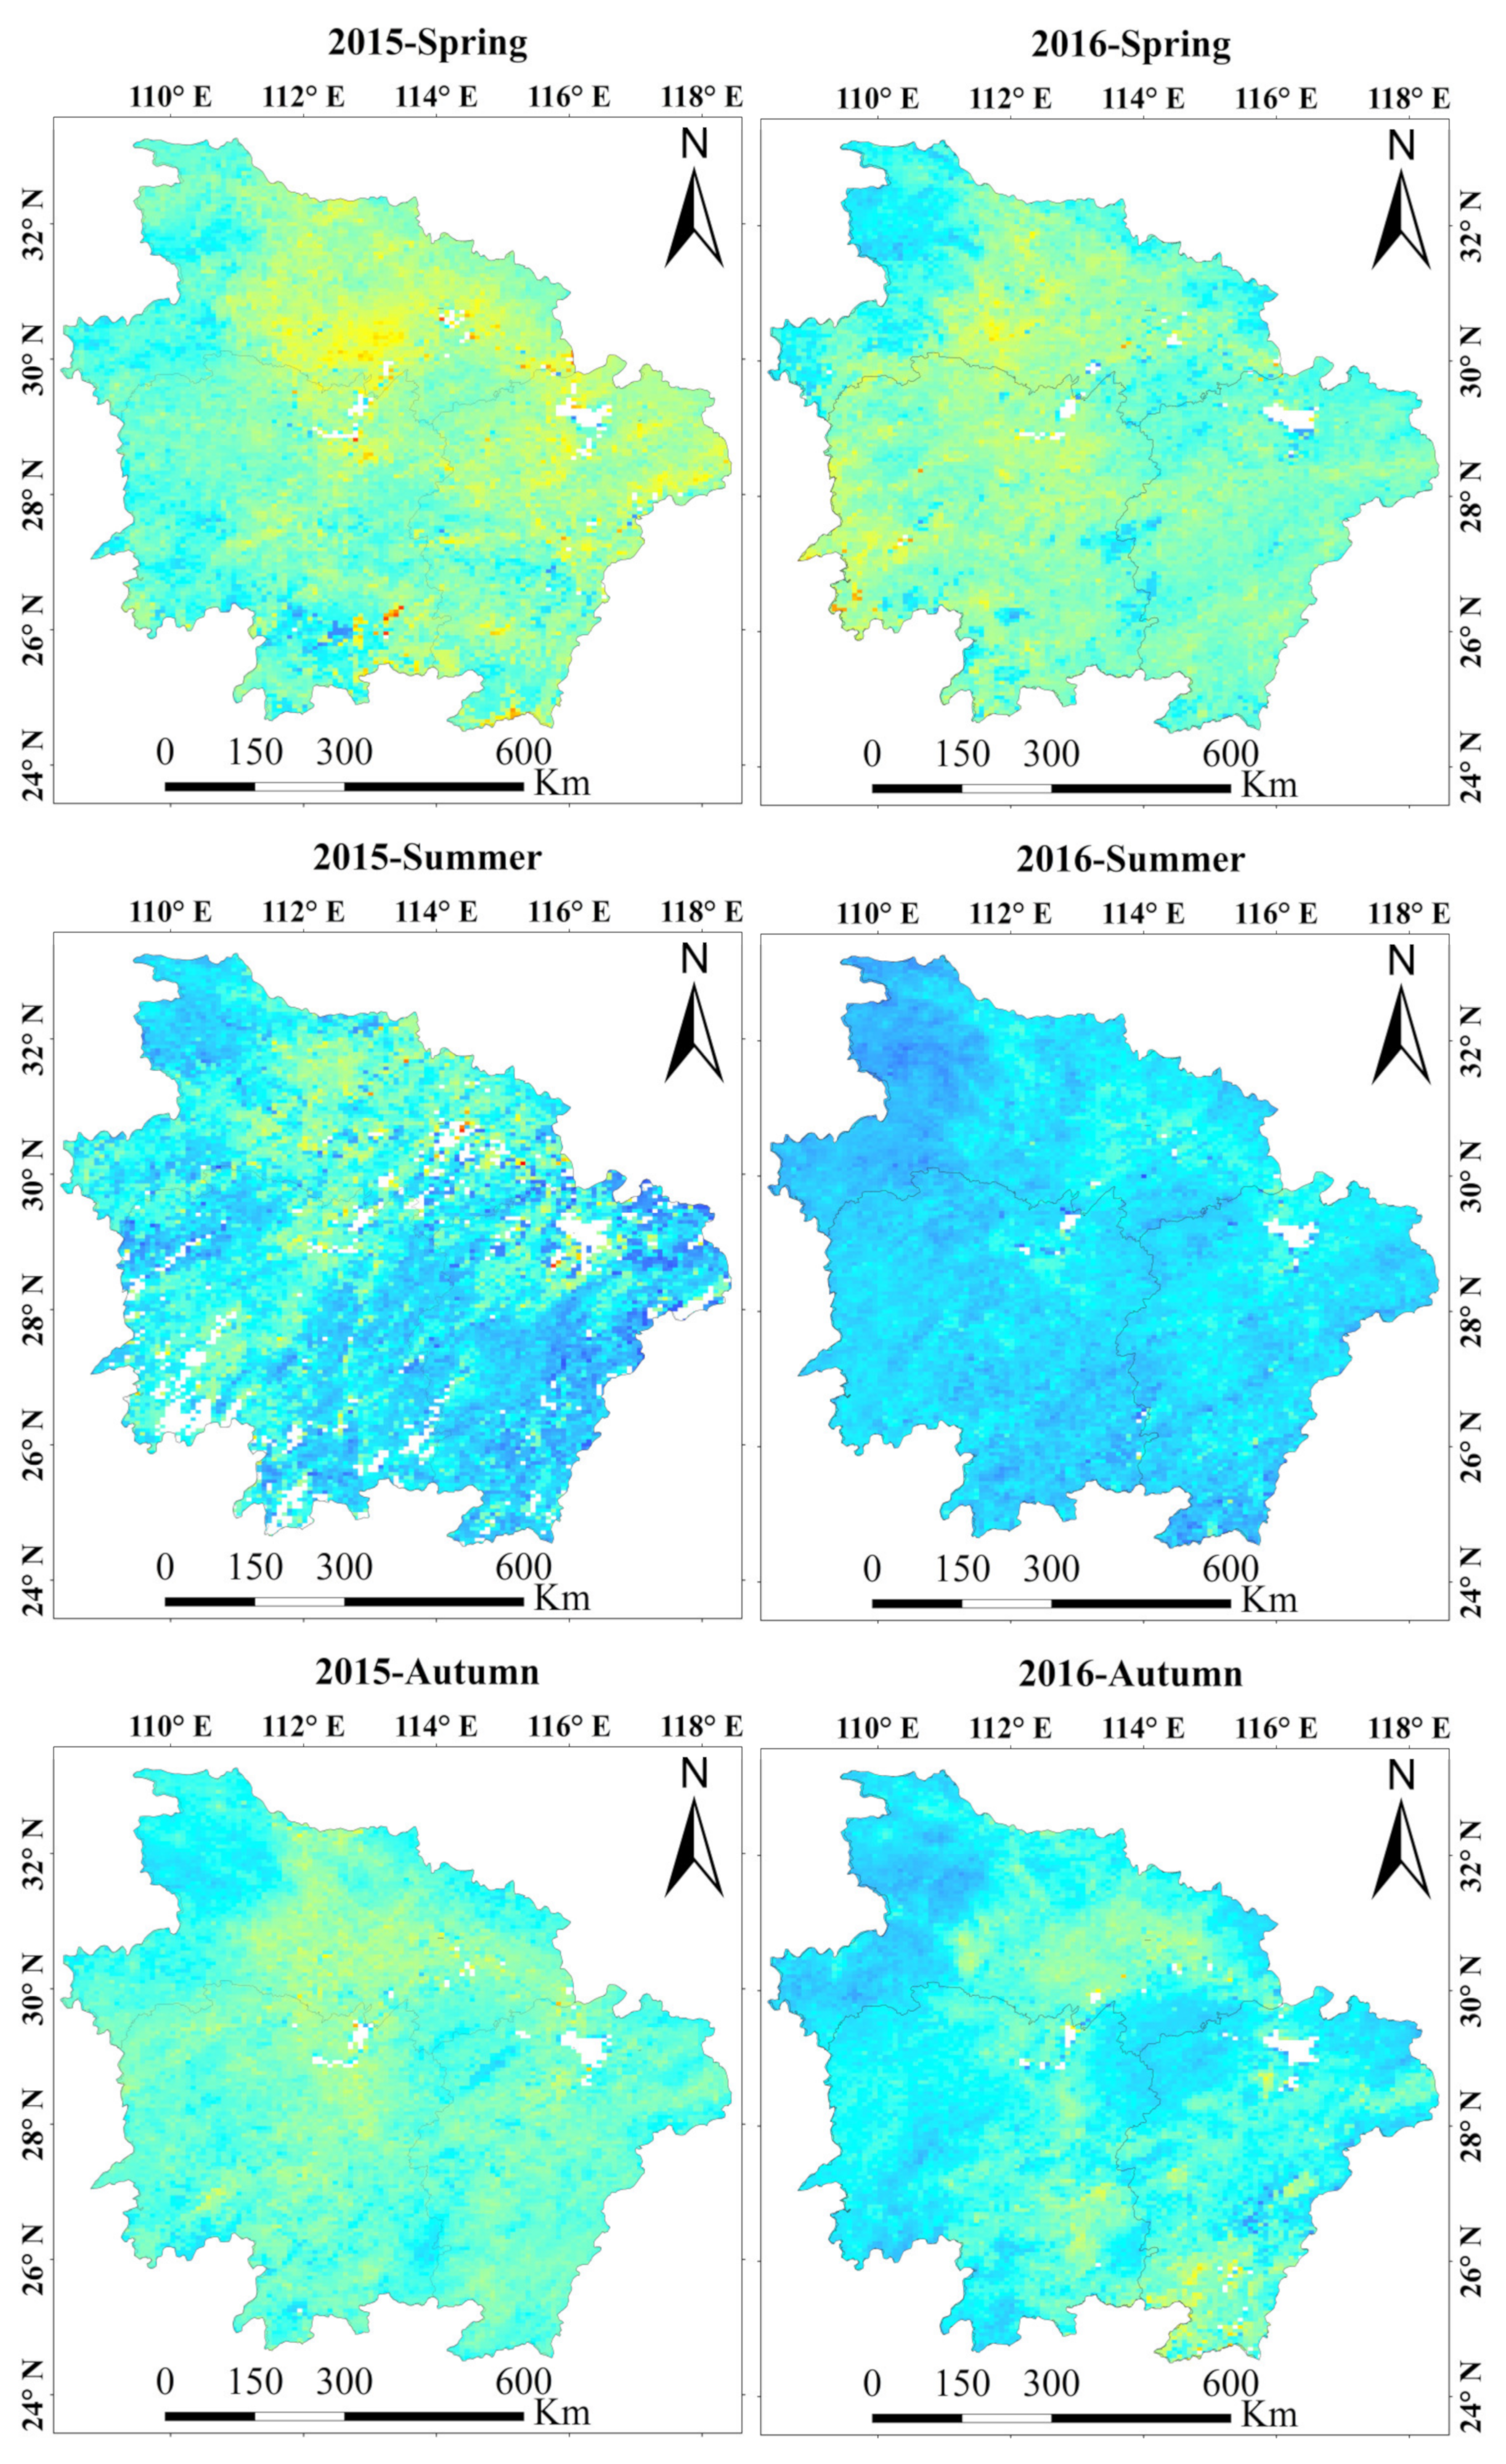
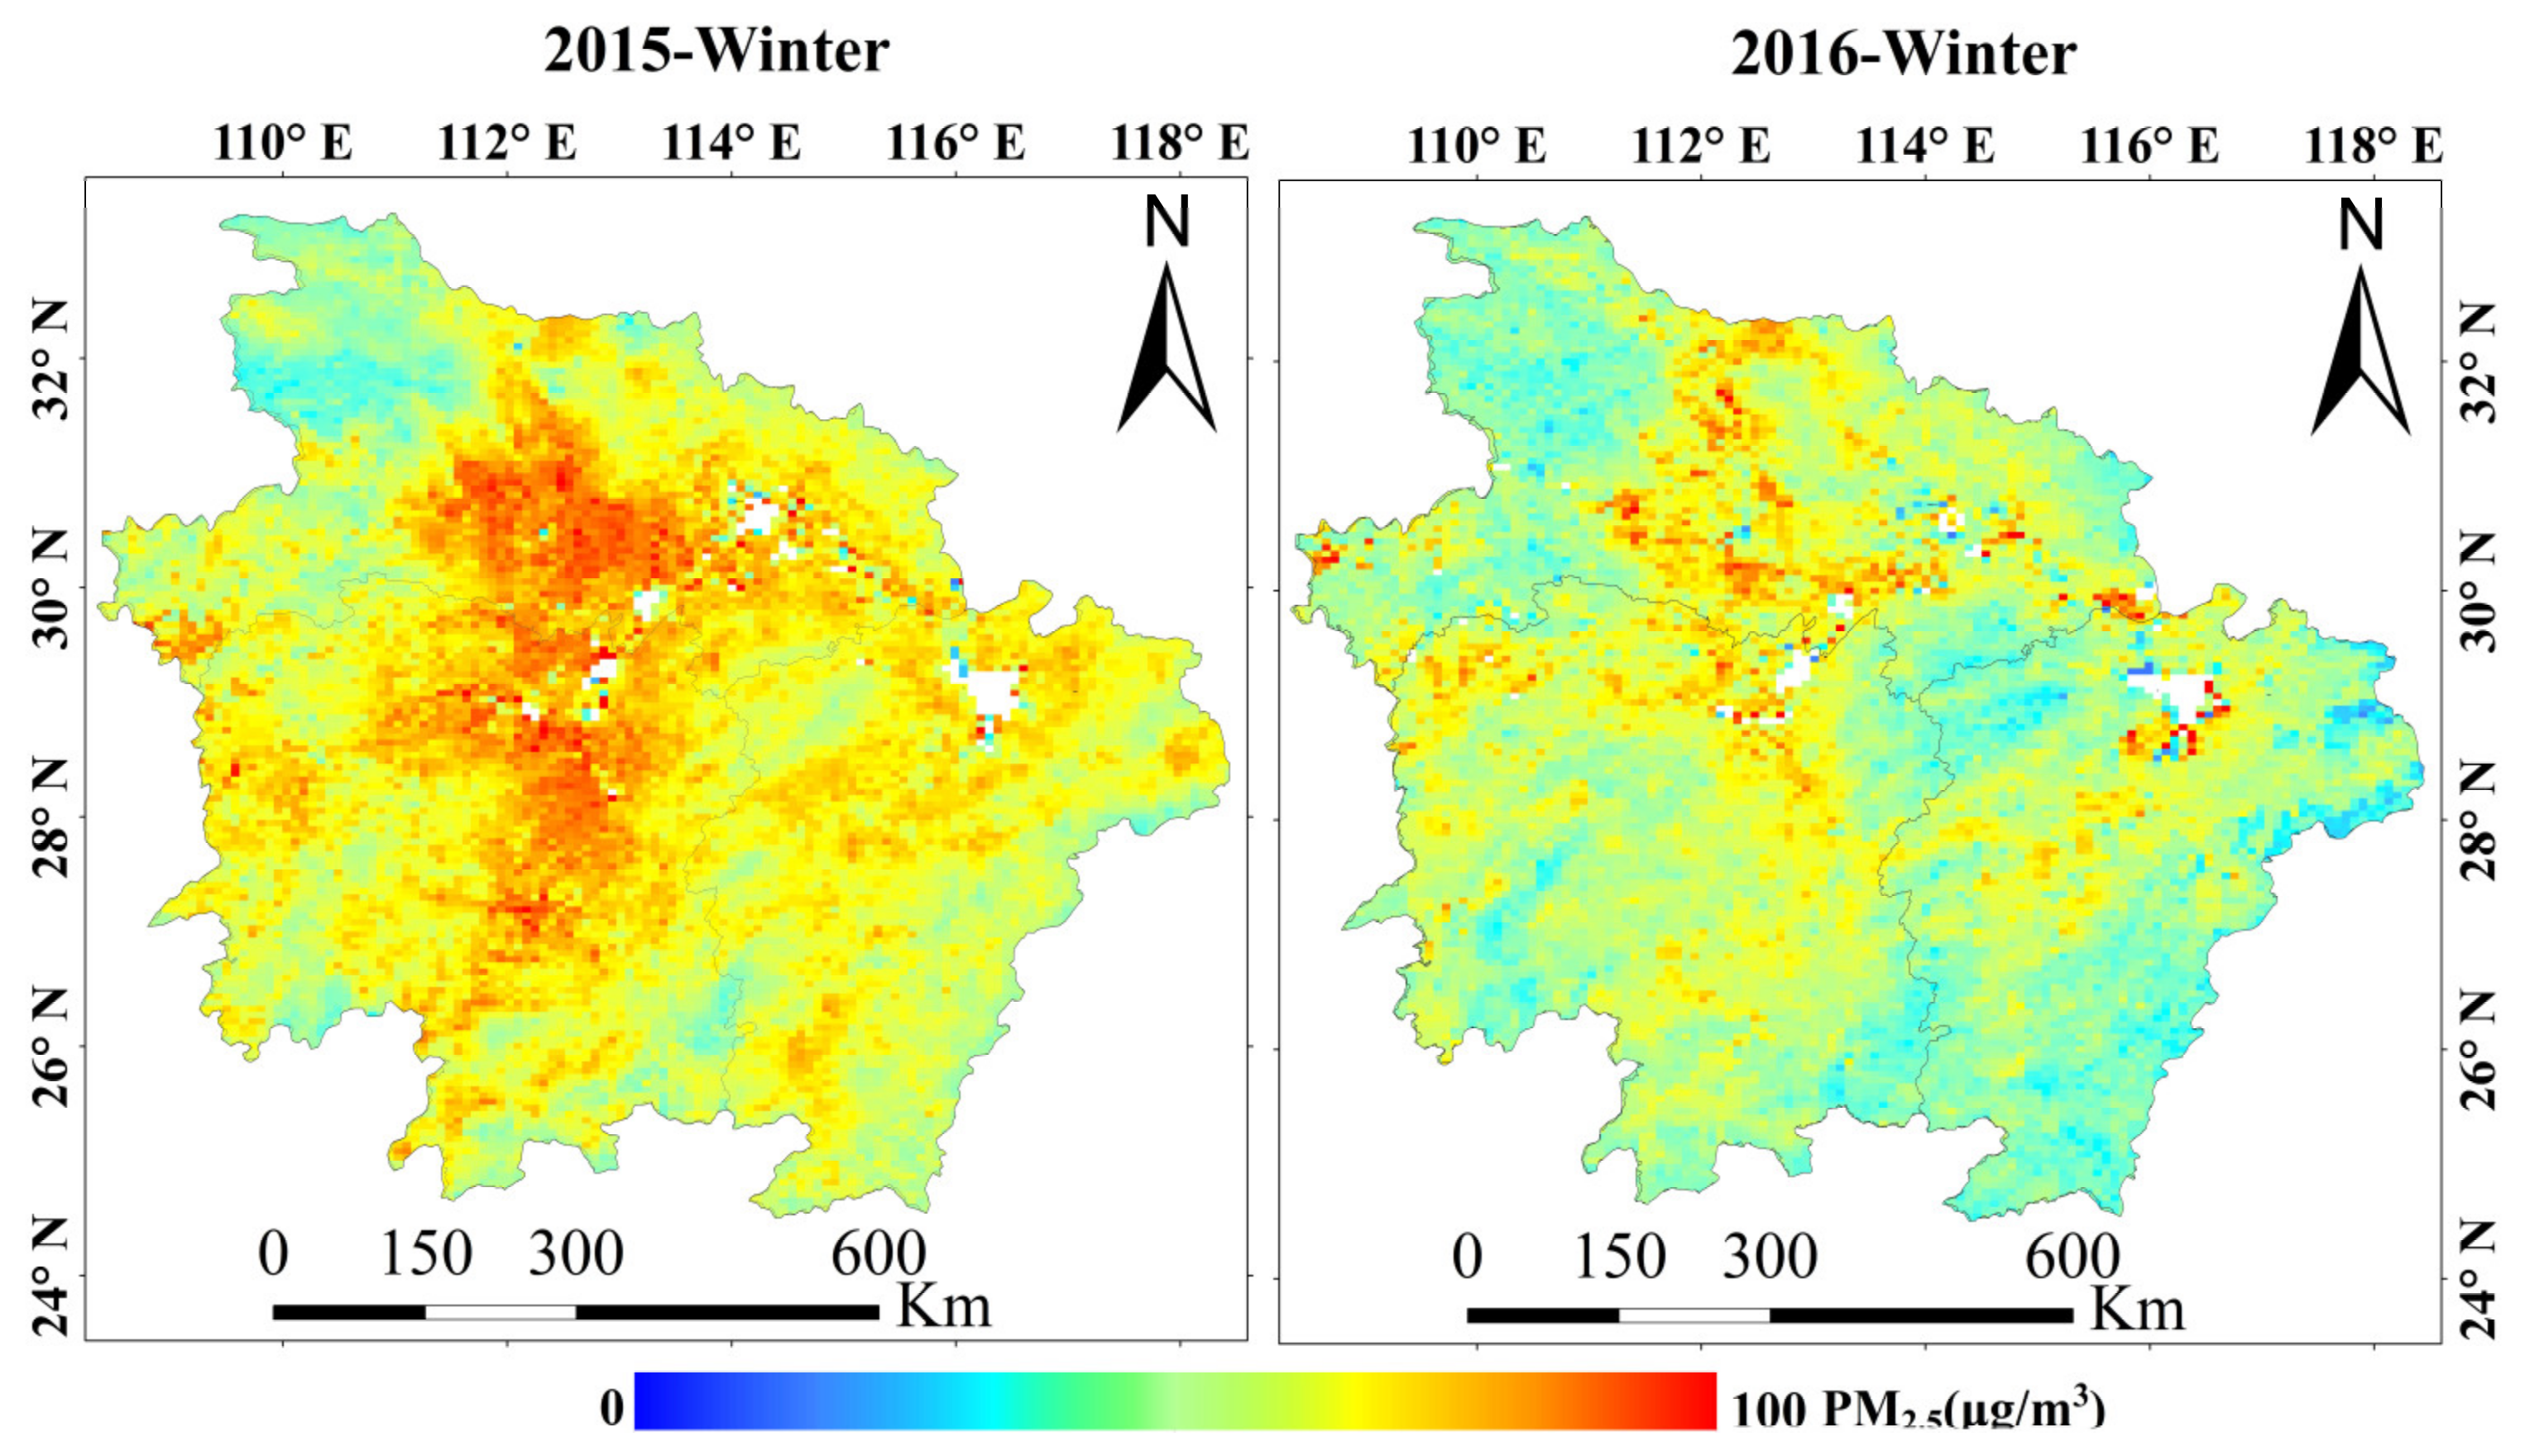
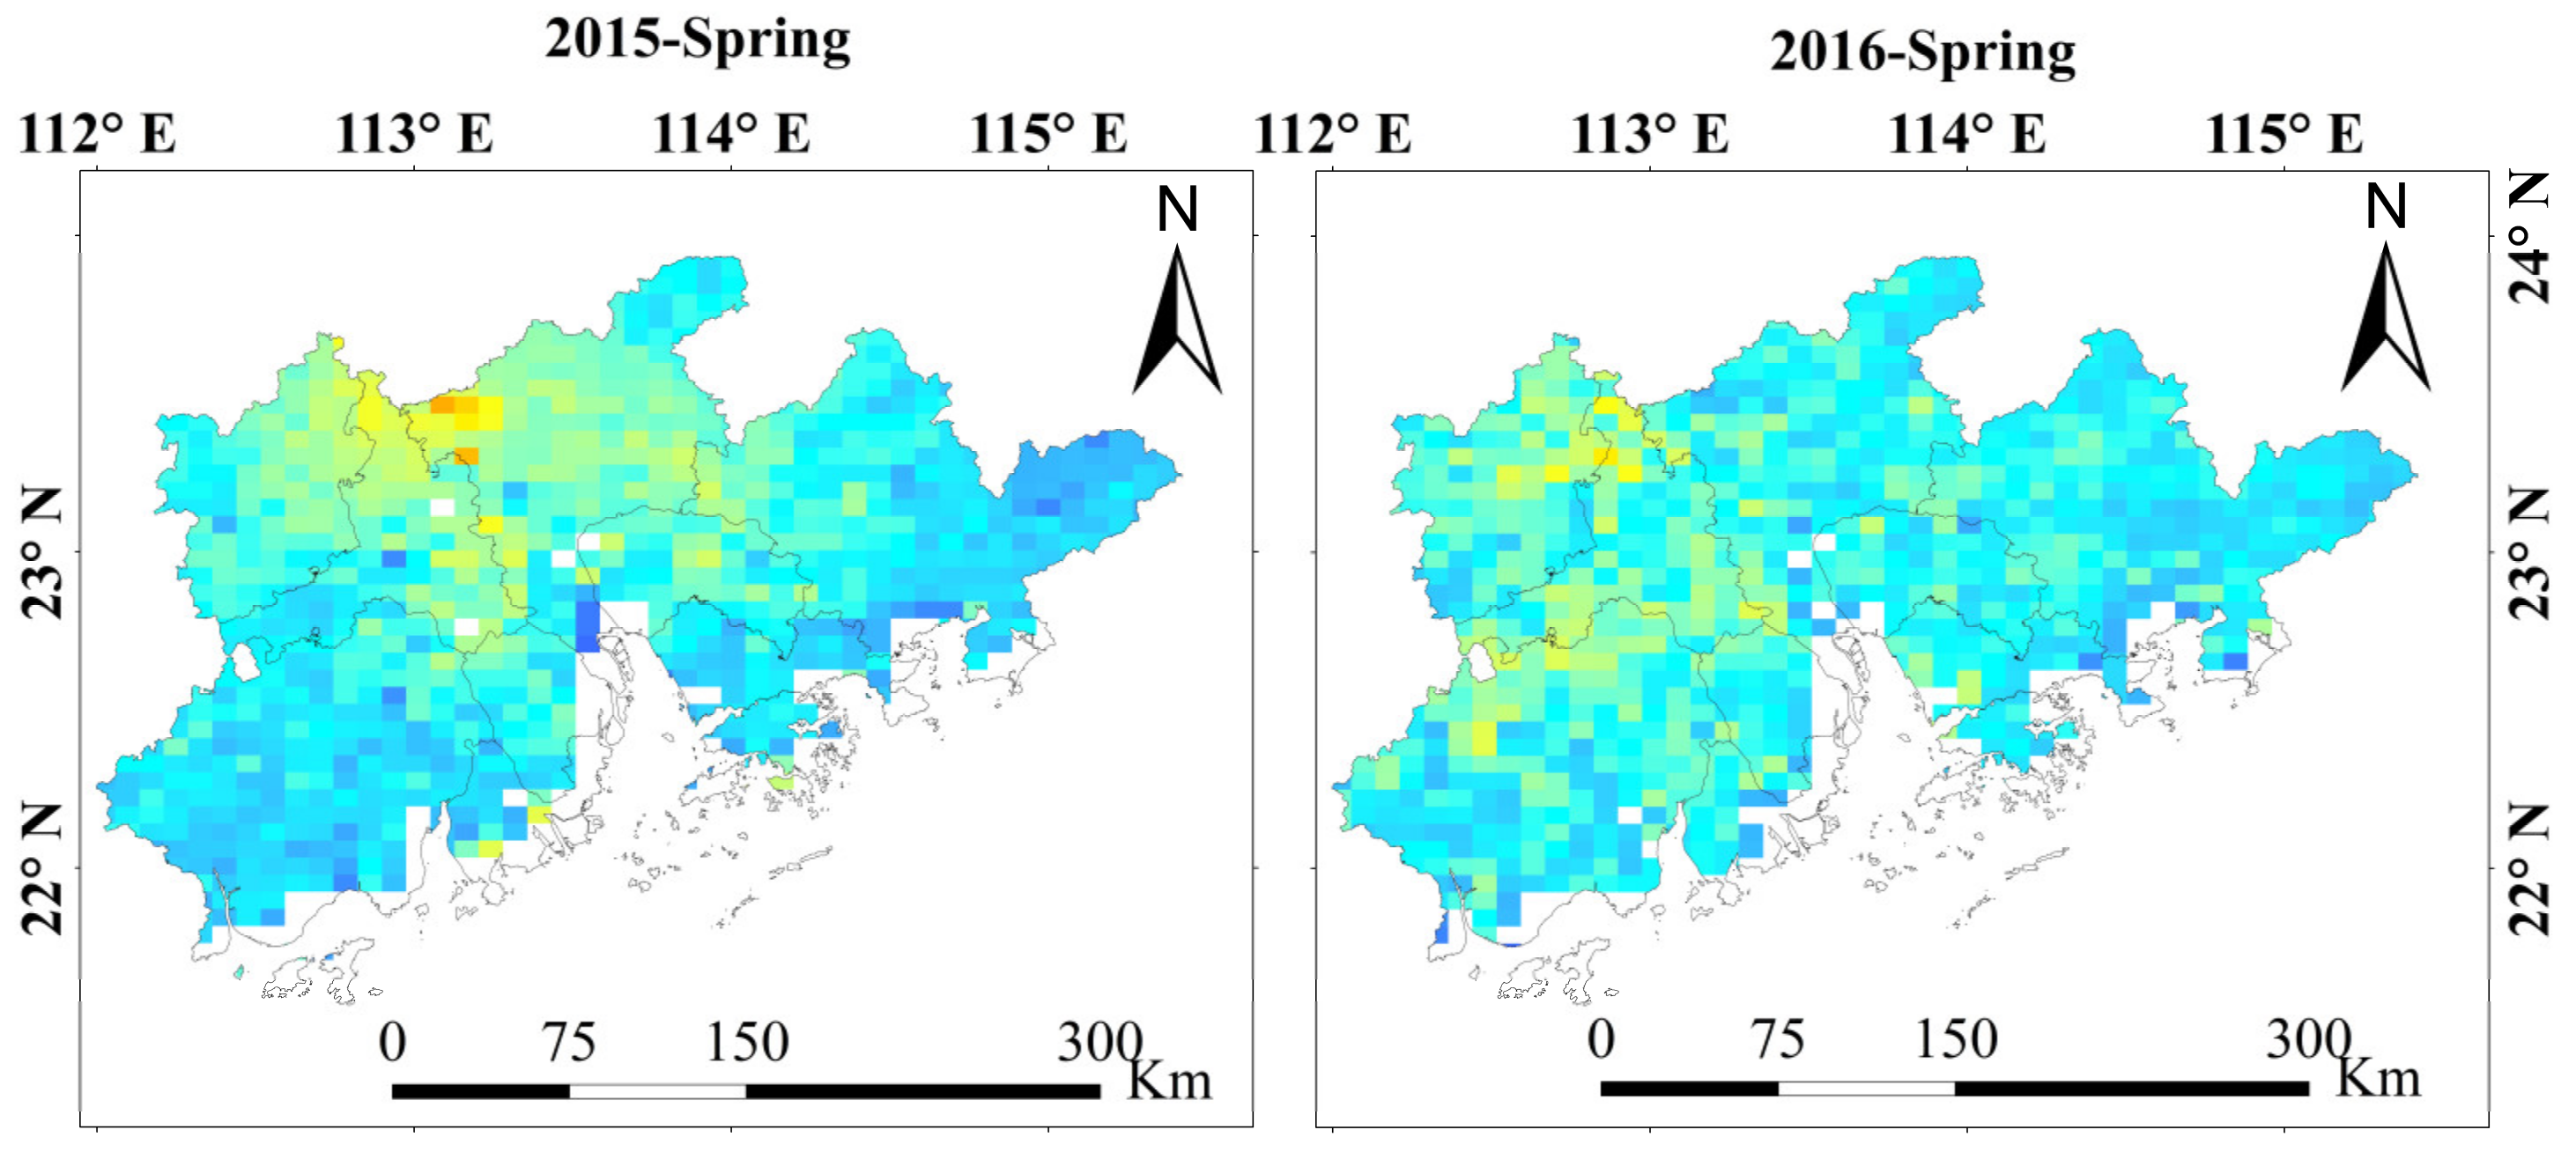
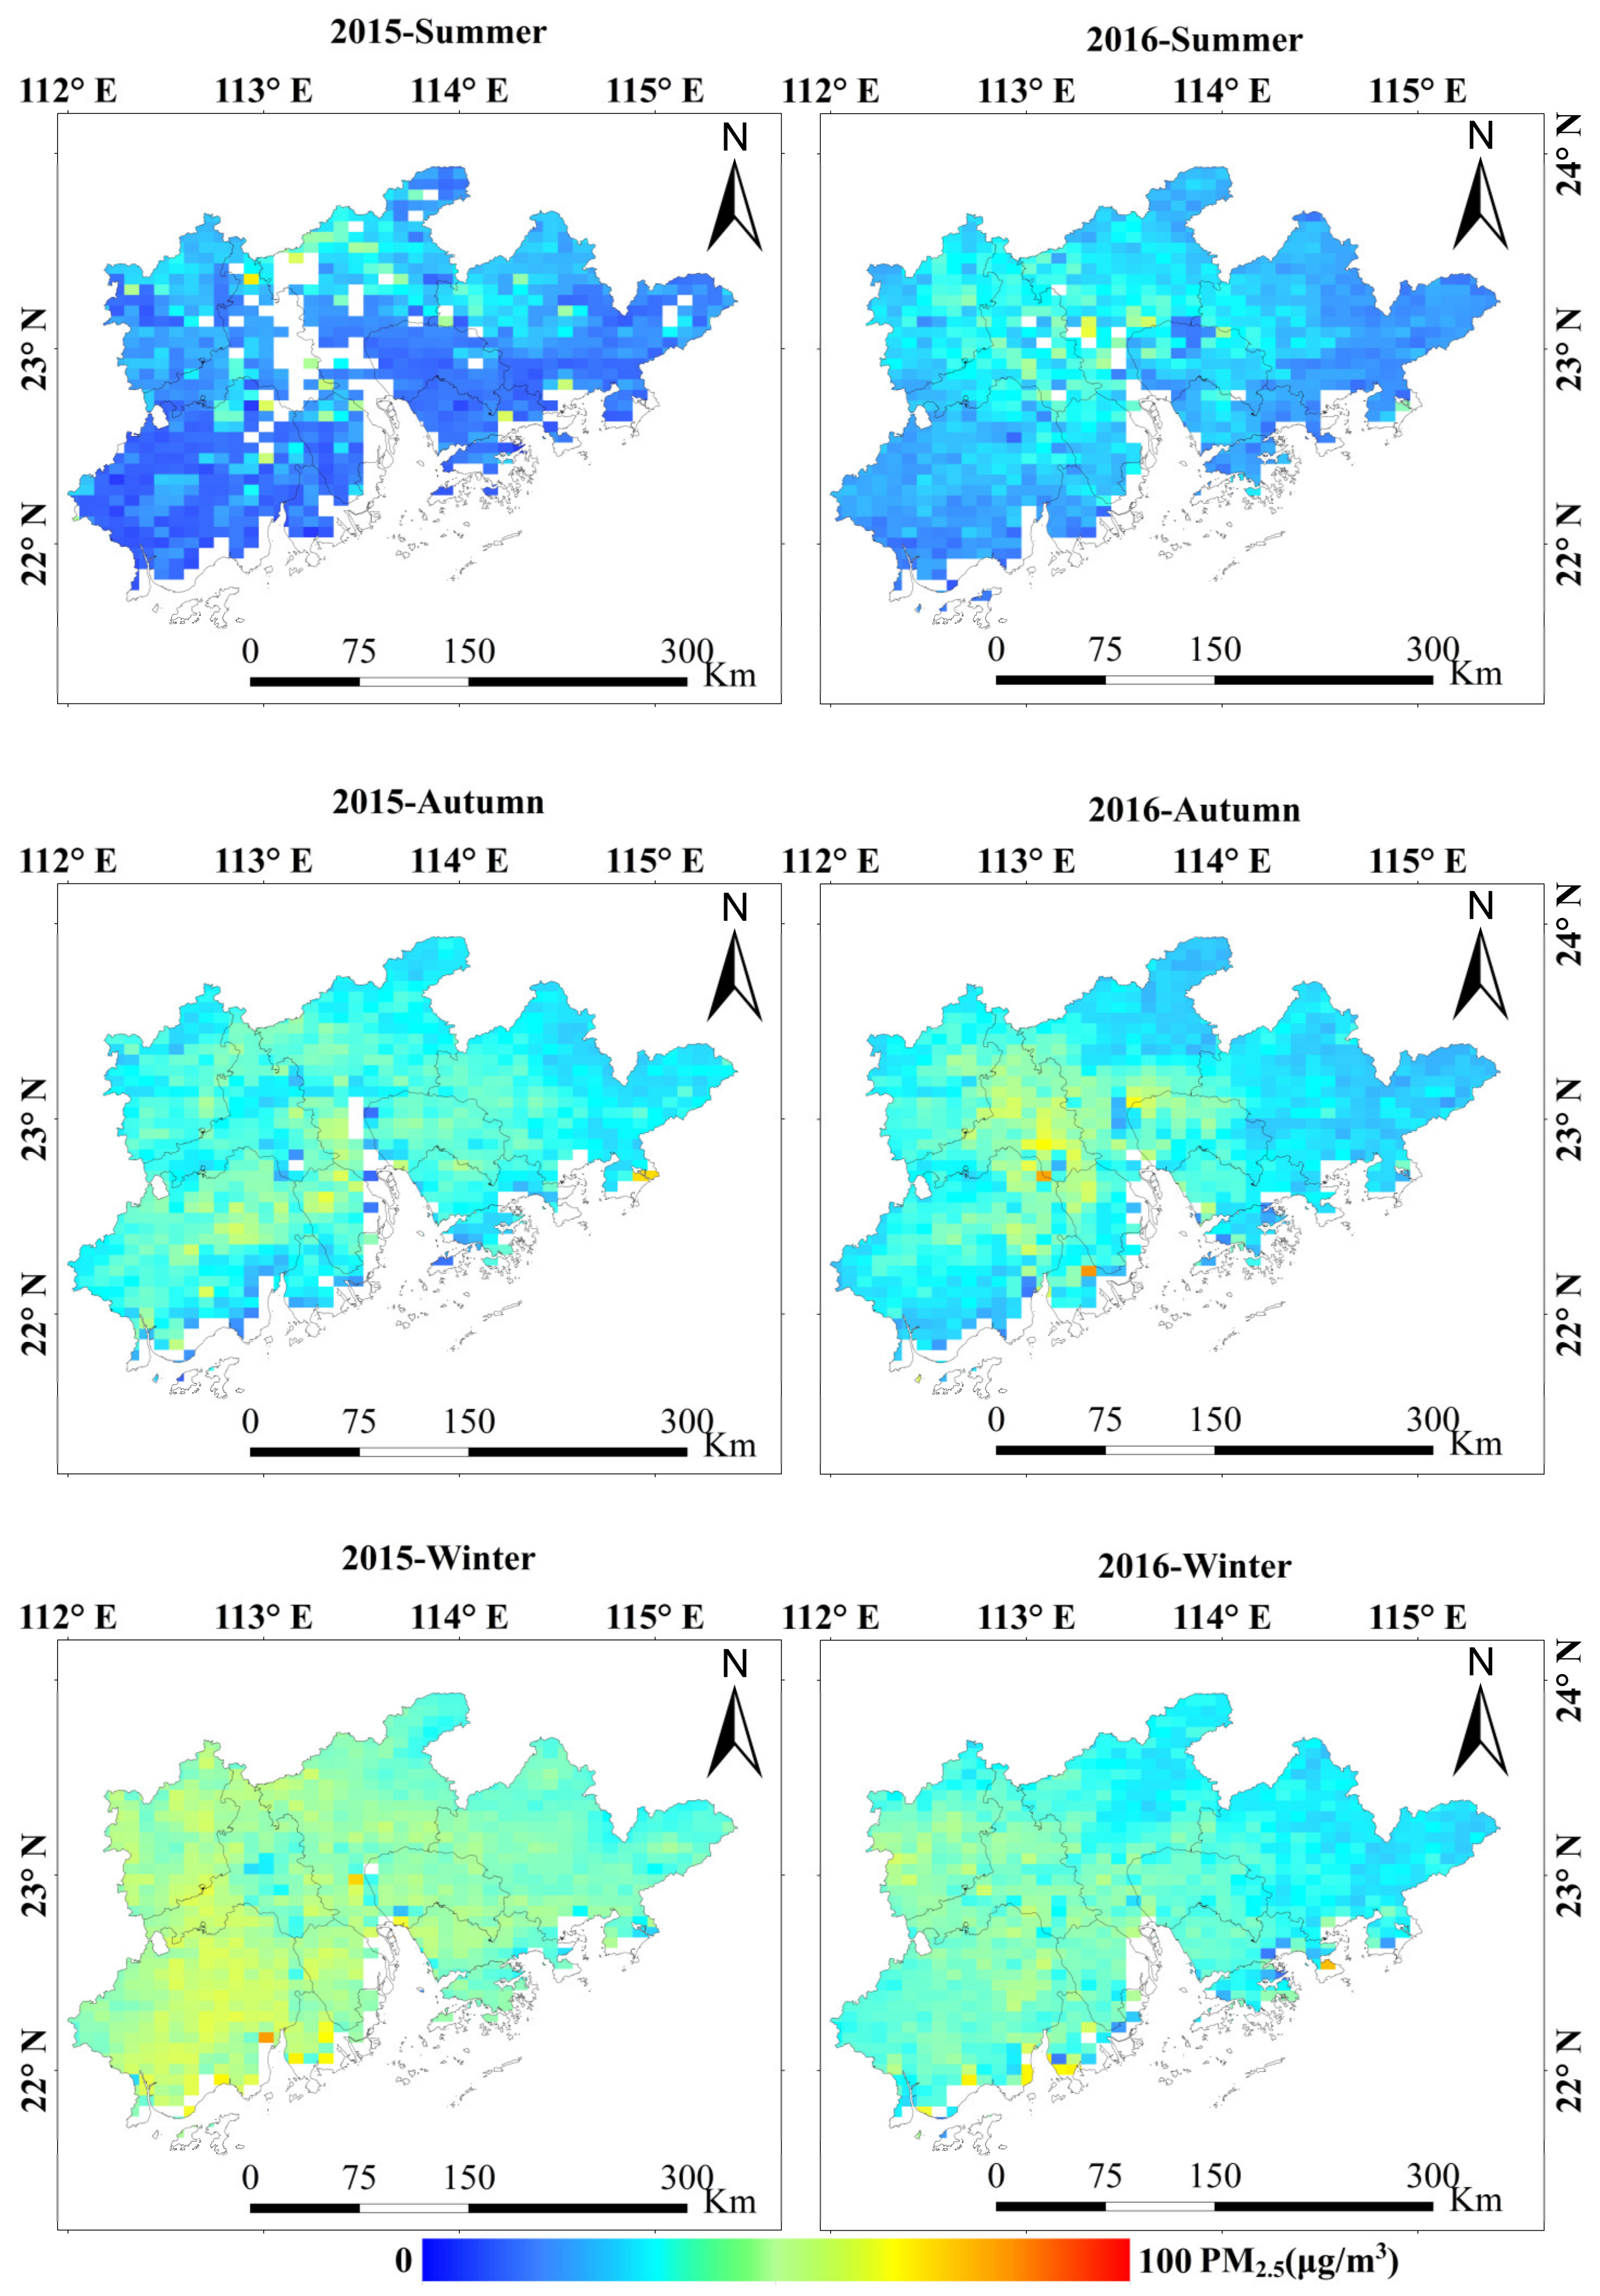
- The spatiotemporal distribution of PM2.5 from 2015 to 2016 was analyzed in BTH, SC, YRD, MYR, and PRD, and the regional PM2.5 concentrations were relatively low in the PRD. Spatially, high PM2.5 concentrations were located in the city clusters and industrially developed areas, and an unfavorable topographic factor resulted in higher PM2.5 concentrations. Some regions at high elevations with dense vegetation coverage and less pollution sources had a low PM2.5 concentration. Seasonally, the increase in emissions and unfavorable pollutant diffusion climatic conditions led to the highest PM2.5 concentrations in winter. The increase in heavy rainfall, higher WS, and unstable boundary layer height are favorable for the wet deposition and diffusion of pollutants, and the PM2.5 concentrations were relatively low in summer.
Author Contributions
Funding
Acknowledgments
Conflicts of Interest
References
- Wu, J.; Zhu, J.; Li, W.; Xu, D.; Liu, J. Estimation of the PM2.5 health effects in China during 2000–2011. Environ. Sci. Pollut. Res. Int. 2017, 24, 10695–10707. [Google Scholar] [CrossRef]
- Donkelaar, A.V.; Martin, R.V.; Brauer, M.; Kahn, R.; Levy, R.; Verduzco, C.; Villeneuve, P.J. Global Estimates of Ambient Fine Particulate Matter Concentrations from Satellite-Based Aerosol Optical Depth: Development and Application. Environ. Health Perspect. 2010, 118, 847. [Google Scholar] [CrossRef] [PubMed]
- See, S.W.; Balasubramanian, R. Chemical characteristics of fine particles emitted from different gas cooking methods. Atmos. Environ. 2008, 42, 8852–8862. [Google Scholar] [CrossRef]
- Pope, R.C.; Dockery, D.W. Health effects of fine particulate air pollution: Lines that connect. J. Air Waste Manag. Assoc. 2006, 56, 1368–1380. [Google Scholar] [CrossRef] [PubMed]
- Donkelaar, A.V.; Martin, R.V.; Brauer, M.; Hsu, N.C.; Kahn, R.A.; Levy, R.C.; Lyapustin, A.; Sayer, A.M.; Winker, D.M. Global Estimates of Fine Particulate Matter using a Combined Geophysical-Statistical Method with Information from Satellites, Models, and Monitors. Environ. Sci. Technol. 2016, 50, 3762. [Google Scholar] [CrossRef] [PubMed]
- Boys, B.L.; Martin, R.V.; Van, D.A.; Macdonell, R.J.; Hsu, N.C.; Cooper, M.J.; Yantosca, R.M.; Lu, Z.; Streets, D.G.; Zhang, Q. Fifteen-year global time series of satellite-derived fine particulate matter. Environ. Sci. Technol. 2014, 48, 11109. [Google Scholar] [CrossRef] [PubMed]
- Hu, X.; Waller, L.A.; Al-Hamdan, M.Z.; Crosson, W.L.; Estes, S.M., Jr.; Quattrochi, D.A.; Sarnat, J.A.; Liu, Y. Estimating ground-level PM (2.5) concentrations in the southeastern U.S. using geographically weighted regression. Environ. Res. 2013, 121, 1–10. [Google Scholar] [CrossRef]
- Tian, J.; Chen, D. A semi-empirical model for predicting hourly ground-level fine particulate matter (PM 2.5) concentration in southern Ontario from satellite remote sensing and ground-based meteorological measurements. Remote Sens. Environ. 2010, 114, 221–229. [Google Scholar] [CrossRef]
- Dawson, J.P.; Adams, P.J.; Pandis, S.N. Sensitivity of PM 2.5 to climate in the Eastern U.S.: A modeling case study. Atmos. Chem. Phys. Discuss. 2007, 7, 4295–4309. [Google Scholar] [CrossRef]
- Hu, X.; Waller, L.A.; Lyapustin, A.; Wang, Y.; Al-Hamdan, M.Z.; Crosson, W.L.; Estes, S.M., Jr.; Quattrochi, D.A.; Puttaswamy, S.J. Estimating ground-level PM 2.5 concentrations in the Southeastern United States using MAIAC AOD retrievals and a two-stage model. Remote Sens. Environ. 2014, 140, 220–232. [Google Scholar] [CrossRef]
- Engel-Cox, J.A.; Hoff, R.M. Qualitative and quantitative evaluation of MODIS satellite sensor data for regional and urban scale air quality. Atmos. Environ. 2004, 38, 2495–2509. [Google Scholar] [CrossRef]
- Wang, J.; Christopher, S.A. Intercomparison between satellite-derived aerosol optical thickness and PM 2.5 mass: Implications for air quality studies. Geophys. Res. Lett. 2003, 30, 267–283. [Google Scholar] [CrossRef]
- Yao, F.; Si, M.; Li, W.; Wu, J. A multidimensional comparison between MODIS and VIIRS AOD in estimating ground-level PM 2.5 concentrations over a heavily polluted region in China. Sci. Total Environ. 2018, 618, 819–828. [Google Scholar] [CrossRef] [PubMed]
- Sreekanth, V.; Mahesh, B.; Niranjan, K. Satellite Remote Sensing of Fine Particulate air pollutants over Indian Mega Cities. Adv. Space Res. 2017, 60, 2268–2276. [Google Scholar] [CrossRef]
- Ma, Z.; Hu, X.; Sayer, A.M.; Levy, R.; Zhang, Q.; Xue, Y.; Tong, S.; Bi, J.; Huang, L.; Liu, Y. Satellite-Based Spatiotemporal Trends in PM 2.5 Concentrations: China, 2004–2013. Env. Health Perspect. 2016, 124, 184–192. [Google Scholar] [CrossRef] [PubMed]
- Zhang, Y.; Li, Z. Remote sensing of atmospheric fine particulate matter (PM 2.5) mass concentration near the ground from satellite observation. Remote Sens. Environ. 2015, 160, 252–262. [Google Scholar] [CrossRef]
- Lee, H.J.; Liu, Y.; Coull, B.A.; Schwartz, J.; Koutrakis, P. A novel calibration approach of MODIS AOD data to predict PM 2.5 concentrations. Atmos. Chem. Phys. 2011, 11, 9769–9795. [Google Scholar] [CrossRef]
- You, W.; Zang, Z.; Pan, X.; Zhang, L.; Chen, D. Estimating PM 2.5 in Xi’an, China using aerosol optical depth: A comparison between the MODIS and MISR retrieval models. Sci. Total Environ. 2015, 505, 1156–1165. [Google Scholar] [CrossRef]
- Liu, Y.; Franklin, M.; Kahn, R.; Koutrakis, P. Using aerosol optical thickness to predict ground-level PM 2.5 concentrations in the St. Louis area: A comparison between MISR and MODIS. Remote Sens. Environ. 2007, 107, 33–44. [Google Scholar] [CrossRef]
- Liu, Y.; Paciorek, C.J.; Koutrakis, P. Estimating regional spatial and temporal variability of PM 2.5 concentrations using satellite data, meteorology, and land use information. Environ. Health Perspect. 2009, 117, 886. [Google Scholar] [CrossRef]
- Zhang, X.; Hu, H. Improving Satellite-Driven PM 2.5 Models with VIIRS Nighttime Light Data in the Beijing–Tianjin–Hebei Region, China. Remote Sens. 2017, 9, 908. [Google Scholar] [CrossRef]
- Wang, J.; Aegerter, C.; Xu, X.; Szykman, J.J. Potential application of VIIRS Day/Night Band for monitoring nighttime surface PM 2.5 air quality from space. Atmos. Environ. 2016, 124, 55–63. [Google Scholar] [CrossRef]
- Li, W.; Zeng, R.; Wu, J. Remote sensing monitoring of ground-level PM 2.5 concentrations in China: A comparison between VIIRS and MODIS. In Proceedings of the Association of American Geographers (AAG) Annual Meeting 2014, Tampa, FL, USA, 8–12 April 2014. [Google Scholar]
- Wang, W.; Mao, F.; Du, L.; Pan, Z.; Gong, W.; Fang, S. Deriving Hourly PM 2.5 Concentrations from Himawari-8 AODs over Beijing–Tianjin–Hebei in China. Remote Sens. 2017, 9, 858. [Google Scholar] [CrossRef]
- Van, D.A.; Martin, R.V.; Brauer, M.; Boys, B.L. Use of Satellite Observations for Long-Term Exposure Assessment of Global Concentrations of Fine Particulate Matter. Environ. Health Perspect. 2015, 123, 135. [Google Scholar]
- Liu, Y.; Park, R.J.; Jacob, D.J.; Li, Q.; Kilaru, V.; Sarnat, J.A. Mapping annual mean ground–level PM 2.5 concentrations using Multiangle Imaging Spectroradiometer aerosol optical thickness over the contiguous United States. J. Geophys. Res. Atmos. 2004, 109. [Google Scholar] [CrossRef]
- He, Q.; Zhou, G.; Geng, F.; Gao, W.; Yu, W. Spatial distribution of aerosol hygroscopicity and its effect on PM 2.5 retrieval in East China. Atmos. Res. 2016, 170, 161–167. [Google Scholar] [CrossRef]
- Lin, C.; Li, Y.; Lau, A.K.H.; Deng, X.; Tse, T.K.T.; Fung, J.C.H.; Li, C.; Li, Z.; Lu, X.; Zhang, X. Estimation of long-term population exposure to PM 2.5 for dense urban areas using 1-km MODIS data. Remote Sens. Environ. 2016, 179, 13–22. [Google Scholar] [CrossRef]
- Xiao, Q.; Wang, Y.; Chang, H.H.; Meng, X.; Geng, G.; Lyapustin, A.; Liu, Y. Full-coverage high-resolution daily PM 2.5 estimation using MAIAC AOD in the Yangtze River Delta of China. Remote Sens. Environ. 2017, 199, 437–446. [Google Scholar] [CrossRef]
- Sun, K.; Chen, X. Spatio-temporal distribution of localized aerosol loading in China: A satellite view. Atmos. Environ. 2017, 163, 35–43. [Google Scholar] [CrossRef]
- Chen, Q.X.; Yuan, Y.; Huang, X.; Jiang, Y.Q.; Tan, H.P. Estimation of surface-level PM 2.5 concentration using aerosol optical thickness through aerosol type analysis method. Atmos. Environ. 2017, 159, 26–33. [Google Scholar] [CrossRef]
- Lin, C.Q.; Li, Y.; Yuan, Z.B.; Lau, A.K.H.; Li, C.C.; Fung, J.C.H. Using satellite remote sensing data to estimate the high-resolution distribution of ground-level PM 2.5. Remote Sens. Environ. 2015, 156, 117–128. [Google Scholar] [CrossRef]
- Gao, C.; Zhang, X.L.; Wang, W.Y.; Xiu, A.J.; Tong, D.Q.; Chen, W.W. Spatiotemporal Distribution of satellite-retrieved ground-level PM 2.5 and near real-time daily retrieval algorithm development in Sichuan Basin, China. Atmosphere 2018, 9, 78. [Google Scholar] [CrossRef]
- Chen, G.B.; Li, S.S.; Knibbs, L.D.; Hamm, N.A.S.; Cao, W.; Li, T.T.; Guo, J.P.; Ren, H.Y.; Abramson, M.J.; Guo, Y.M. A machine learning method to estimate PM 2.5 concentrations across China with remote sensing, meteorological and land use information. Sci. Total Environ. 2018, 636, 52–60. [Google Scholar] [CrossRef] [PubMed]
- Wang, Y.S.; Xin, J.Y.; Li, Z.Q.; Wang, P.C.; Wang, S.G.; Wen, T.X.; Sun, Y. AOD and Angstrom parameters of aerosols observed by the Chinese Sun Hazemeter Network from August to December 2004. Environ. Sci. 2006, 27, 1703–1711. [Google Scholar]
- Aeronet.gsfc.nasa.gov. Aerosol Robotic Network (AERONET) Homepage. Available online: https://aeronet.gsfc.nasa.gov (accessed on 7 March 2020).
- Bou.class.noaa.gov. NOAA’s Comprehensive Large Array-data Stewardship System. Available online: https://www.bou.class.noaa.gov/saa/products/welcome (accessed on 7 March 2020).
- Ouyang, S.H. Summarization on PM 2.5 Online Monitoring Technique. China Environ. Prot. Ind. 2012, 13, 14–18. [Google Scholar]
- Gupta, P.; Christopher, S.A.; Wang, J.; Gehrig, R.; Lee, Y.; Kumar, N. Satellite remote sensing of particulate matter and air quality assessment over global cities. Atmos. Environ. 2006, 40, 5880–5892. [Google Scholar] [CrossRef]
- Barman, S.C.; Singh, R.; Negi, M.P.S.; Bhargava, S.K. Fine Particles (PM 2.5) in Residential Areas of Lucknow City and Factors Influencing the Concentration. Clean Soil Air Water 2010, 36, 111–117. [Google Scholar] [CrossRef]
- Pateraki, S.; Asimakopoulos, D.N.; Flocas, H.A.; Maggos, T.; Vasilakos, C. The role of meteorology on different sized aerosol fractions (PM 10, PM 2.5, PM 2.5–10). Sci. Total Environ. 2012, 419, 124–135. [Google Scholar] [CrossRef]
- Liu, Y.; Sarnat, J.A.; Kilaru, V.; Jacob, D.J.; Koutrakis, P. Estimating ground-level PM 2.5 in the eastern United States using satellite remote sensing. Environ. Sci. Technol. 2005, 39, 3269. [Google Scholar] [CrossRef]
- ECMWF. ECMWF. Available online: http://www.ecmwf.int/ (accessed on 7 March 2020).
- Srtm.csi.cgiar.org. CGIAR-CSI SRTM—SRTM 90m DEM Digital Elevation Database. Available online: http://srtm.csi.cgiar.org/ (accessed on 7 March 2020).
- Song, W.; Jia, H.; Huang, J.; Zhang, Y. A satellite-based geographically weighted regression model for regional PM 2.5 estimation over the Pearl River Delta region in China. Remote Sens. Environ. 2014, 154, 1–7. [Google Scholar] [CrossRef]
- Zeng, Q.; Wang, Z.; Tao, J.; Wang, Y.; Chen, L.; Zhu, H.; Yang, J.; Wang, X.; Li, B. Estimation of Ground-Level PM 2.5 Concentrations in the Major Urban Areas of Chongqing by Using FY-3C/MERSI. Atmosphere 2017, 9, 3. [Google Scholar] [CrossRef]
- Zhao, S.; Yu, Y.; Yin, D.; Qin, D.; He, J.; Dong, L. Spatial patterns and temporal variations of six criteria air pollutants during 2015 to 2017 in the city clusters of Sichuan Basin, China. Sci. Total Environ. 2017, 624, 540–557. [Google Scholar] [CrossRef] [PubMed]
- Zou, J.; Yang, L. The ambient air quality and trends in cities of Sichuan province. Sichuan Environ. 2010, 29, 4. [Google Scholar]
- Xu, J.H.; Jiang, H. Estimation of PM 2.5 concentration over the Yangtze Delta using remote sensing: Analysis of spatial and temporal variations. Environ. Sci. 2015, 36, 3119–3127. [Google Scholar]
- Zeng, Q.; Wang, Y.; Chen, L.; Wang, Z.; Zhu, H.; Li, B. Inter-Comparison and Evaluation of Remote Sensing Precipitation Products over China from 2005 to 2013. Remote Sens. 2018, 10, 168. [Google Scholar] [CrossRef]
- Chen LW, A.; Chow, J.C.; Doddridge, B.G.; Dickerson, R.R.; Ryan, W.F.; Mueller, P.K. Analysis of a summertime PM 2.5 and haze episode in the mid-Atlantic region. Air Repair 2003, 53, 946–956. [Google Scholar]
- Zhu, S.; Zhou, M.; Qiao, L.; Li, L.; Lou, S.; Yan, S.; Chen, C. Impact of the air mass trajectories on PM 2.5 concentrations and distribution in the Yangtze River Delta in December 2015. J. Environ. Sci. 2015, 36, 10. [Google Scholar]
- Chen, N.; Xu, K.; Cao, Z.; Liu, D.; Hu, H.; Quan, J.; Xinjiang Jinghe County Environmental Protection Bureau. Analysis on the pollution levels of atmospheric particles and the correlation of pollutants in hHubei province. Environ. Sci. Technol. 2016, 39, 194–198. [Google Scholar]
- Deng, X.; Huang, Y.; Li, Z.; Li, H. Temporal and spatial variations characteristics of atmospheric particulate matter in Hubei province, China. J. Environ. Sci. 2017, 11, 5152–5158. [Google Scholar]
- Tian, P.; Cao, X.; Zhang, L.; Sun, N.; Sun, L.; Logan, T.; Huang, Z. Aerosol vertical distribution and optical properties over China from long-term satellite and ground-based remote sensing. Atmos. Chem. Phys. 2017, 17, 2509–2523. [Google Scholar] [CrossRef]
- Dubovik, O.; Holben, B.; Eck, T.F.; Smirnov, A.; Kaufman, Y.J.; King, M.D.; Tanré, D.; Slutsker, I. Variability of Absorption and Optical Properties of Key Aerosol Types Observed in Worldwide Locations. J. Atmos. Sci. 2002, 59, 590–608. [Google Scholar] [CrossRef]


| No. | Station | Lon (° E) | Lat (° N) | Time | Station type | Source |
|---|---|---|---|---|---|---|
| 1 | Shapoou (SPT) | 104.95 | 37.45 | 2013. Jan–Dec | Desert background | CARE |
| 2 | Beijing Forest (BJF) | 115.43 | 39.97 | 2013. Jan–Dec | North China background | CARE |
| 3 | Beijing City_1 (BJC_1) | 116.28 | 39.98 | 2013. Jan–Dec, 2016. Jun–Dec | Megacity | CARE |
| 4 | Beijing City_2 (BJC_2) | 116.38 | 39.98 | 2015. Jan-2016. Dec | Megacity | AERONET |
| 5 | Xianghe (XH) | 116.96 | 39.75 | 2015. Jan–2016. Dec | City suburb | AERONET |
| 6 | Nanjing (NJ) | 118.42 | 32.12 | 2016. Jun–Dec | Central city | CARE |
| 7 | Yucheng Agriculture (YCA) | 116.57 | 36.85 | 2013. Jan–Dec | North China country | CARE |
| 8 | Yantai Coast (YTC) | 120.27 | 36.05 | 2013. Jan-Dec | East China sea coast | CARE |
| 9 | Qianyanzhou (QYZ) | 115.03 | 26.45 | 2016. Jun–Dec | South China country | CARE |
| 10 | Hong Kong (HK) | 114.18 | 22.30 | 2015. Jan–2016. Dec | South China sea coast | AERONET |
| Variable | Unit | Description |
|---|---|---|
| i | Unit less | Aerosol type |
| AOD | Unit less | VIIRS AOD |
| TMP | °C | Temperature |
| WS | m/s | Wind speed |
| WD | ° | Wind direction |
| RH | % | Relative humidity |
| SP | hPa | Surface pressure |
| PBLH | m | Boundary layer height |
| ELEV | m | Elevation |
| Pop | Ten thousand/km2 | Population density |
| α | Unitless | Fixed effects intercept |
| ω | Unitless | Random effects intercept |
| β1–β9 | Unitless | Fixed effects slope |
| μ1–μ7 | Unitless | Random effects slope |
| ε | Unitless | Random errors |
| Station | Expression | R2 | RMSE | N |
|---|---|---|---|---|
| Shapotou | Y = 0.43 X + 0.01 | 0.27 | 0.32 | 182 |
| Hongkong | Y = 0.56 X + 0.33 | 0.25 | 0.29 | 61 |
| Yantai Coast | Y = 0.54 X + 0.30 | 0.33 | 0.32 | 155 |
| Beijing Forest | Y = 0.72 X + 0.04 | 0.52 | 0.14 | 180 |
| Xianghe | Y = 0.65 X+ 0.08 | 0.64 | 0.33 | 279 |
| Yucheng Agriculture | Y = 0.87 X + 0.33 | 0.66 | 0.28 | 239 |
| Beijing-City1 | Y = 0.62 X + 0.10 | 0.62 | 0.27 | 132 |
| Beijing-City2 | Y = 0.77 X + 0.18 | 0.66 | 0.26 | 198 |
| Nanjing | Y = 0.97 X – 0.04 | 0.59 | 0.19 | 43 |
| Qianyanzhou | Y = 0.78 X + 0.08 | 0.48 | 0.22 | 67 |
| Year | Dust | Smoke | Urban | Uncertain | All |
|---|---|---|---|---|---|
| 2015 | 0.12 | 0.27 | 0.17 | 0.24 | 0.16 |
| 2016 | 0.13 | 0.24 | 0.16 | 0.22 | 0.15 |
| Location | Value | All | Smoke | Urban | Uncertain |
|---|---|---|---|---|---|
| PRD | R2 | 0.76 | 0.83 | 0.83 | 0.78 |
| RMSE (μg/m3) | 8.7 | 9.6 | 7.95 | 7.83 | |
| MYR | R2 | 0.73 | 0.77 | 0.79 | 0.75 |
| RMSE (μg/m3) | 15.01 | 9.47 | 16.3 | 13.55 | |
| SC | R2 | 0.79 | 0.83 | 0.83 | 0.79 |
| RMSE (μg/m3) | 14.45 | 11.36 | 14.31 | 13.08 | |
| YRD | R2 | 0.80 | 0.89 | 0.85 | 0.81 |
| RMSE (μg/m3) | 12.58 | 9.61 | 12.31 | 10.80 |
| Regions | Time | Classified | Unclassified | ||
|---|---|---|---|---|---|
| r | RMSE (μg/m3) | r | RMSE (μg/m3) | ||
| BTH | 2016-05-10 | 0.76 | 11.0 | 0.73 | 11.1 |
| SC | 2015-10-14 | 0.80 | 16.45 | 0.75 | 19.65 |
| PRD | 2015-01-18 | 0.75 | 6.34 | 0.65 | 13.8 |
| YPD | 2015-10-12 | 0.73 | 9.15 | 0.71 | 12.85 |
| MYR | 2016-12-06 | 0.94 | 10.98 | 0.92 | 12.54 |
© 2020 by the authors. Licensee MDPI, Basel, Switzerland. This article is an open access article distributed under the terms and conditions of the Creative Commons Attribution (CC BY) license (http://creativecommons.org/licenses/by/4.0/).
Share and Cite
Zeng, Q.; Tao, J.; Chen, L.; Zhu, H.; Zhu, S.; Wang, Y. Estimating Ground-Level Particulate Matter in Five Regions of China Using Aerosol Optical Depth. Remote Sens. 2020, 12, 881. https://doi.org/10.3390/rs12050881
Zeng Q, Tao J, Chen L, Zhu H, Zhu S, Wang Y. Estimating Ground-Level Particulate Matter in Five Regions of China Using Aerosol Optical Depth. Remote Sensing. 2020; 12(5):881. https://doi.org/10.3390/rs12050881
Chicago/Turabian StyleZeng, Qiaolin, Jinhua Tao, Liangfu Chen, Hao Zhu, SongYan Zhu, and Yang Wang. 2020. "Estimating Ground-Level Particulate Matter in Five Regions of China Using Aerosol Optical Depth" Remote Sensing 12, no. 5: 881. https://doi.org/10.3390/rs12050881
APA StyleZeng, Q., Tao, J., Chen, L., Zhu, H., Zhu, S., & Wang, Y. (2020). Estimating Ground-Level Particulate Matter in Five Regions of China Using Aerosol Optical Depth. Remote Sensing, 12(5), 881. https://doi.org/10.3390/rs12050881