Abstract
With the increase of sea surface wind speed, whitecaps will appear on the sea surface. Generally, for Electromagnetic (EM) scattering of the foam-covered sea surface, medium-scale waves are used to replace the breaking waves of the real sea surface. Another treatment in computation is to adopt one of the whitecap coverages and fixed foam layer thickness. In fact, the evolution process of a breaking wave goes through two stages: stage A (crest foam) and stage B (static foam). In this paper, a geometric model of the sea surface covered with crest foam and static foam is established. The coverage ratio of stage A and stage B is proposed for the first time for a given sea state. In addition, different foam layer thickness distributions in each foam for various wind speeds are also considered. Based on the facet scattering theory of sea surface, this paper adopts the modified facet-based scattering model to deal with the scattering contribution of the sea surface and the effect of foam. Finally, in order to verify the accuracy of the geometric modeling and the scattering model of the sea surface, the EM backscattering of sea surface under different sea states are calculated. Simulation results show that the results of the proposed model are more consistent with the measured data than the results of the sea surface covered with individual crest foam or the sea surface covered with individual static foam.
1. Introduction
In the research field of Electromagnetic (EM) scattering of the sea surface, the EM mechanism of radar echo under high sea conditions and large incident angles has attracted lots of attention. When the wind speed reaches 7 m/s, the sea surface is beginning to froth, while more than 30% of the sea surface area is covered with foam as the wind speed reaches 25 m/s [1]. Goldstein et al. [2] pointed out that the high polarization ratio of single-polarization Horizontal/Vertical (HH/VV) is mainly caused by the whitecap at X-band. More attention has been paid in the study of EM scattering of the foam-covered sea surface.
Many scholars have done related work on the EM scattering effects of the foam-covered sea surface. Martin [3] proposed that with the increase of sea surface wind speed, the waves break up, then, the foam and water droplets at the crest of the waves are formed. The air at the interface is dragged into the seawater, at last, a large number of bubbles inside and on the surface of the seawater are produced. It is well-known that foam has a considerable impact on the EM scattering of the sea surface. Raizer [4] observed the foam-covered sea surface with high-resolution radar and estimated the variation law of the EM backscattering coefficient of the sea surface. Droppleman and Rosenkranz [5,6] regarded the foam-covered sea surface as one or more layers of medium. Anguelova and Gaiser [7] analyzed the physical parameters of the foam layer on the sea surface. Tsang [8,9] adopted the Monte Carlo method to study the EM scattering of dense foam on the sea surface. In addition, Kalmykov [10] pointed out that the wedge model could be able to simulate the crest breaking wave, which would enhance the polarization ratio. Lyzenga et al. [11] calculated the EM scattering of the wedge model to modify the scattering coefficient of the sea surface. Churyumov [12] regarded the medium-scale breaking wave as scatterers capable of generating non-Bragg scattering. Kudryavtsev et al. [13,14] established a semi-empirical model to modify the scattering coefficient of the sea surface by considering the breaking wave and whitecap coverage. West and Zhao [15] adopted a Multi-Level Fast Multipole Algorithm (MLFMA) to calculate the EM scattering of the LONGTANK wave model, and the results illustrated the high polarization ratio and sea spike. Li et al. [16] established a 3-D scattering model based on the wedge model and the capillary wave modification facet scattering model (CWMFSM), which to some extent interprets the “super events” under high sea conditions. The above works almost adopt the medium-scale waves or a single breaking wave model to replace the real breaking wave of the sea surface. Thus, from the geometric modeling of the foam-covered sea surface, they do not accord with the real situation of the sea surface.
As a matter of fact, in [17,18,19], in terms of the time evolution of whitecap, the process of a whitecap goes through two stages: stage A and stage B. Stage A is the growth process, called crest foam, located on the breaking wave. It is produced by a combination of active breaking waves and dragged air. Stage B is the decay process, called static foam. It occurs after stage A, with “striplike” structures and exponential decay characteristics after stage A. Similarly, the foam thicknesses of stage A and stage B should not be ignored. Although the measured data of foam thickness reported in [20] did not distinguish stage A and stage B, the peak thicknesses of foam were close to 1.3 cm and 3.3 cm. Reul et al. [21] proposed an approach to calculate the foam thickness of crest foam and static foam, which compared well with the experimental data in [20]. Anguelova and Gaiser [22] also agreed on the function of foam thickness distributions of these two stages. In addition, different foam has different whitecap coverage. The expressions for individual whitecap coverages of crest foam and static foam in [21] agreed well with the measured formula values in [18]. However, crest foam and static foam should coexist in the same sea state at the same time. Therefore, the coverage ratio of crest foam and static foam in the same sea area should be determined.
In this paper, a 3-D scattering model of sea surface covered with crest foam and static foam is proposed. Different foam layer thickness distributions in each foam for various wind speeds are considered. The main idea is to find out the geometric modeling of real sea states and the coverage proportion of crest foam and static foam in a given sea state. In order to verify the correctness and the effectiveness of the proposed model, the numerical results of the EM backscattering coefficient are simulated in some cases for different wind speeds, incident angles, operation frequencies and wave polarizations. Compared with the measured data (part of the Joint Ocean Surface Study (JOSS-I), Four Frequency Radar System (4FRS) [23,24]), the proposed model works very well.
The remainder of this paper is organized as follows. The foam layer thickness and coverage ratio of crest foam and static foam are discussed in Section 2. The geometric modeling and dielectric characteristic of the sea surface and foam-covered sea surface are established in Section 3. The EM backscattering method to calculate the foam-covered sea surface is proposed in Section 4. In order to prove the effectiveness of the proposed model, comparisons with measured data are discussed in Section 5. The EM backscattering results of the foam-covered sea surface for different sea states are obtained and analyzed. Some discussions and conclusions are presented in the final section.
2. Two Whitecap Stages: Crest Foam and Static Foam
2.1. Foam Coverage and Foam Thickness
The evolution of an individual whitecap bubble cloud includes two processes: crest foam and static foam. Crest foam is owing to actively breaking waves, while the static foam is the decaying process after crest foam [17,18,19]. Firstly, according to [21], the whitecap coverage is obtained by
where cp is the phase speed of the dominant wave, g = 9.81. cmin = (gλmin/2π)1/2 (λmin = 20 cm). c = (2g/kp) 1/2 (kp is the spectral peak wavenumber). U10 is the wind speed at 10 m above the sea surface, in m/s. ∆T is the sea–air temperature difference (∆T = Tsea − Tair), in °C. 𝑎 = 0.8 is for crest foam and 𝑎 = 5 is for static foam. This expression of whitecap coverage fits well with the measured model in [18]. The coverages of individual crest foam and static foam in [18] are obtained by
Secondly, Reul and Chapron [21] proposed the expressions of globally averaged foam-layer thickness of crest and static foam, the expression for averaged globally foam layer thickness distribution weighted by
where
where τ’ is an appropriate exponential time constant (τ’ ≈ 3.8). These foam thickness values compare well with measured data for foam thickness histogram reported by Reising et al. [20]. The experimental data in [20] for peak foam layer thicknesses are close to 1.3 cm and 3.3 cm. Anguelova and Gaiser [22] also agree on the correctness of Equation (5). In order to satisfy the laws in [20,22], suppose ΔT = 10 °C. Figure 1 shows the foam coverage and foam-layer thickness from Equations (1)–(5).
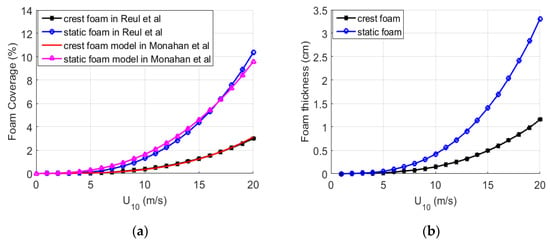
Figure 1.
Foam coverage and foam thickness at different wind speeds. (a) Foam coverage models for crest foam and static foam. (b) Foam thickness distributions for crest foam and static foam.
In Figure 1a, the four lines represent the individual crest foam coverage and the individual static foam coverage at different wind speeds from [21,18], respectively. Obviously, the Reul model fits well with the Monahan model. In Figure 1b, the two lines illustrate the foam thicknesses of crest foam and static foam for various wind speeds. It can be seen from the figure that for different wind speeds, the two stages of foam will have different foam thickness. By the way, with the increase of wind speed, the difference of foam thickness between the two stages of foam will become larger. On this basis, it is necessary to consider the foam thickness in the EM scattering calculation of the foam-covered sea surface.
2.2. The Ratio of Crest Foam and Static Foam in the Same Sea State
For any given sea state, crest foam and static foam should coexist in the sea surface covered with whitecap [18]. As far as we know, present studies only propose the whitecap coverage empirical laws of individual crest foam and static foam. There is no research on the coverage ratio for the coexisted case, i.e., including both crest foam and static foam. One of the contributions of this paper is to figure out the proportion of crest foam and static foam in the same sea condition.
Studies have shown that the whitecap coverage relates to the wind speed, wind stress and the roughness of sea surface, etc. Hwang et al. [25,26] establish the expression of foam coverage, which is in good agreement with the whitecap measurements by Callaghan et al., Meissner and Wentz, Anguelova and Webster, Sugihara et al. and Lafon et al. [27,28,29,30,31]. The expression of the whitecap coverage model in [25,26] is obtained by
where
Equation (7) is the global whitecap coverage, contains both the crest foam and static foam coverage. We assume the proportion of crest foam is m, the proportion of static foam is (1−m), the individual whitecap coverage of crest foam and static foam are Wa and Wb (the expressions of Wa and Wb are in Equations (1) and (2)), respectively. Therefore, we obtain the formula
In Figure 2a, the solid line shows the proportion of crest foam in the foam-covered sea surface for different wind speeds according to Equations (10) and (11), the dotted line is the ratio of static foam in the foam-covered sea surface. In Figure 2b, for the sea surface at various wind speeds, the four lines show the new coverage ratio of crest foam (m × Wa), the new coverage ratio of static foam ((1−m) × Wb), the new model and the global whitecap coverage model, respectively. It can be seen that the new crest foam coverage reaches 2% at U10 = 20 m/s, while the individual crest foam coverage in Figure 1a is 3% at U10 = 20 m/s. The new static foam coverage is close to 4% at U10 = 20 m/s, while the individual static foam coverage in Figure 1a is about 10%. The global whitecap coverage model fitting well with the measured data of foam coverage in the northern and southern halfspheres, while the crest foam and static foam are not distinguished in the model, it only represents the whole whitecap coverage in the world ocean. The new model is the sum of the new crest foam coverage and the new static foam coverage. Obviously, the agreement of the new model is consistent with the global whitecap coverage model. The difference between the new model and the model in [26] is that the new model divides the crest foam and static foam, and points out the different contributions of crest foam and static foam in a given sea state. Because of the crest foam and static foam have different contributions on EM scattering, thus compared with the model in [26], this new model can better describe the EM scattering of the foam-covered sea surface.
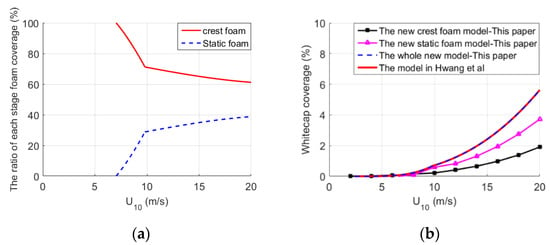
Figure 2.
Foam coverage at different wind speeds. (a) The ratio of crest foam and static foam. (b) Comparison of the Hwang model and the new whitecap coverage summed by crest foam and static foam.
3. The Modeling of Sea Surface Covered with Foam
3.1. Sea Spectrum
In this paper, Elfouhaily’s sea spectrum [32] and the creamer model [33] are adopted to generate sea surface. The wave height of the creamer sea surface is obtained by
where
where and are the sea spectrum and the directional spectrum, respectively. is a complex Gaussian series with a mean 0 and a variance of 1. BH and BL are the capillary waves and gravity waves of the sea surface. The formulas of BH and BL and the other parameters are illustrated in Appendix A. Figure 3 shows the sea spectrum when the wind speed (U10) is 5 m/s, 10 m/s and 15 m/s, separately.
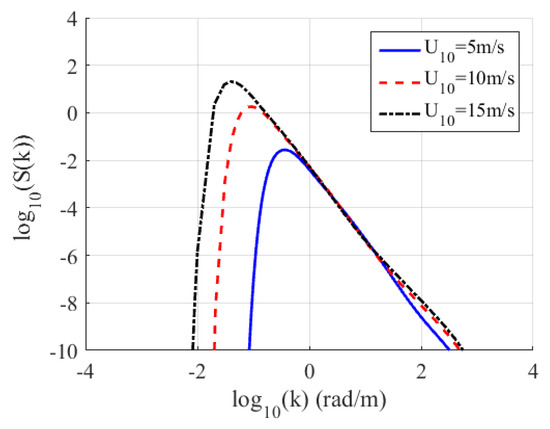
Figure 3.
The sea spectrum for various wind speeds.
3.2. The Foam-Covered Sea Surface
As wind speed increases, the sea surface is covered with whitecap, including crest foam and static foam. The most important thing for the geometric modeling of sea surface covered with whitecap is to figure out the distribution of the two stages of foam. To solve the problem, many researchers have proposed various kinds of guidelines. For example, in [34,35], the product of breaking point amplitude and wave number is between 0.103 and 0.628. Phillips et al. [36] said the wave breaks when it reaches the maximum wave height, which is related to the wave phase velocity and drift velocity. Stokes et al. [37] proposed that a break wave exists when the internal angle of the wave surface is less than 120°. Longuet-Higgins et al. [38] adopted the surface slope criterion to decide the break wave points. To make the model simple and easy to implement, in this paper, the surface slope criterion is used to distinguish the crest foam and static foam. The specific steps are as follows. In the simulation, the incident frequency f = 10 GHz, U10 = 10 m/s, the size of the sea surface is 300 m × 300 m. M and N are the sampling numbers of facets along x- and y-axes, respectively. ΔT = 10 °C. Figure 4a shows the sea surface with no foams. Figure 4b shows the sea surface covered with individual crest foam marked with red asterisk, Nc = Wa × M × N facets with higher slope in the sea surface are selected for crest foam. Figure 4c shows the sea surface covered with individual static foam marked with a green triangle, Ns = Wb × M × N facets with higher slope are chosen for static foam. Furthermore, Figure 4d shows the crest foam and static foam coexisting in the sea surface, Nc = m × Wa × M × N facets with a higher slope for crest foam, the next Ns = (1−m) × Wb × M × N facets with a higher slope are chosen for the static foam. Figure 4e shows the uniform distribution of foam fragments, while the wind speed increases to U10 = 15 m/s, Figure 4e shows the distribution of foam starting to pile up, consistent with the measured sea surface image [17]. Meanwhile, the roughness of the sea surface increases.
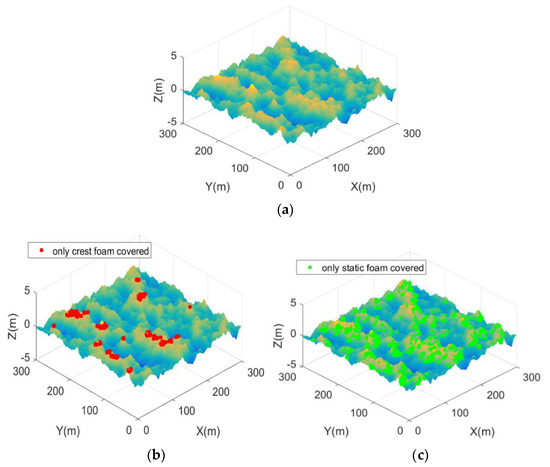
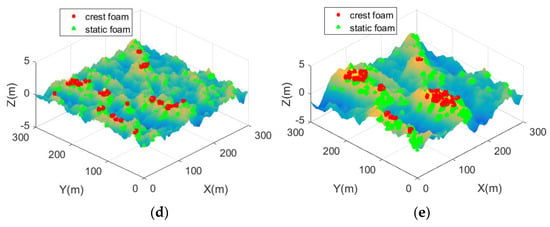
Figure 4.
The whitecap coverage in the sea surface. (a) The sea surface without foam. (b) The sea surface covered with crest foam only. (c) The sea surface covered with static foam only. (d) The sea surface covered with the proposed distribution of crest foam and static foam for U10 = 10 m/s. (e) The sea surface covered with the proposed distribution of crest foam and static foam for U10 = 15 m/s.
3.3. The Dielectric Constant of Sea Surface Covered with Foam
Generally, seawater is a mixture of pure water and salts dissolved in water and often considered as an inhomogeneous lossy medium. The dielectric constant of the sea surface is related to the incident frequency of EM waves, sea temperature and other factors. Meissner et al. [39] proposed the double Debye seawater dielectric constant model. The formula is
where f is the incident frequency. T = 20 °C, ωs = 32.54‰, ε∞ = 4.9. ε0 = 8.854 × 10⁻¹² F/m. The detailed formulas of other parameters are shown in Appendix B.
In this paper, the Maxwell Garnett model [40] is adopted to compute the dielectric constant of the foam-covered sea surface. The expression is obtained by
where ε’ is the real part of the dielectric constant for seawater. V represents the amount of air in the foam, also called the duty cycle, which is generally set as V = 97%. Figure 5a,b show the dielectric constant of seawater and foam-covered sea surface, respectively.
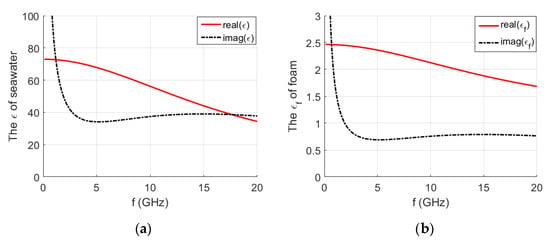
Figure 5.
(a) The dielectric constant of seawater. (b) The dielectric constant of sea surface covered with foam.
4. Electromagnetic Calculation Method
4.1. The Modified Facet-Based Two-Scale Model
The improved facet-based Two-Scale Model (TSM) [41] calculates the scattering field of sea surface element with no foam covered. Kirchhoff approximation (KA) is adopted to compute the large-scale roughness of each facet. While the Integral Equation Method (IEM) has a larger application range than the Small Perturbation Method (SPM), the small-scale roughness value is calculated by IEM. In this paper, the phase delay exists due to the phase of each facet changes with the relative position. For large scale roughness, the Kirchhoff tangent plane approximation is adopted, while KA ignores the diffraction effect of incident waves on the surface. The fluctuations of large-scale components on the sea surface need to change slowly. Therefore, at large incident angles, the surface elements of large-scale components can no longer be considered as planes, but should be treated as curved surfaces. Finally, based on the scattering theory of facet in [42], the phase modified (k1·r+φ) field-based scattering model is proposed. The curvature modified factor (cpp) and the shadowing function (S(v)) are introduced, the scattering field of the facet-based two-scale model is obtained by
where p = h or v, R is the distance from the radar to the center of the observed sea area, k is the wave number of the EM wave. k1 is the projection of the k(ks − ki) on the tilted element. ki is the incident wave vector, ks is the scattering wave vector. Δx and Δy are the size of each facet along x and y-axes, respectively. r is the position vector of each facet relative to the origin of coordinates. k1·r is the phase delay caused by the relative position of each facet. k1·r+φ is the phase modified. Hypothesis the large-scale roughness waves are geometrically illustrated by a discrete set of ζ (ρ, t), then γx = ∂ζ/∂x and γy = ∂ζ/∂y are the corresponding slopes.φ = ξ·k1·(Δx,Δy,(γx·Δx + γy·Δy)), −1/2≤ξ≤1/2, the specific theory is in [42]. In each facet, KA is adopted to calculate the specular scattering, and IEM computes the diffusion scattering. The Radar Cross Section (RCS) formulas are obtained by Equations (18) and (19).
In Equation (18), Upp is the polarization coefficient. P(Zx, Zy) is the slope probability density distribution of Cox–Munk. In Equation (19), σ is the Root-Mean-Square (RMS) height of the small-scale sea surface. In each facet, the coordinate system is called the local coordinate. (x, y, z) is the global coordinate. θi is the global incident angle of each facet. θi’ is the local incident angle of each facet. The normal vector of the local coordinate is n = (−γx x−γy y + z)/(1+ γx2 + γy2 )1/2. ω(n) is the spectral function of the sea spectrum. This paper adopts the n = 1 of Equation (19) proposed by Fung et al. [43]. In the cartesian coordinates, ω(kx, ky) is the two-dimensional sea spectrum, from Equation (14), ω(kx, ky) = s(kcosφ, ksinφ). ω(2ksinθi’, 0) is the small-scale waves, and refers to the two-dimensional sea spectral density corresponding to the Bragg wave vector propagating along the radar line of sight. The formulas of the math symbols in Equations (17)–(19) from [44,45,46] are given in Appendix C.
In addition, in the classical Two scale model, it is necessary to figure out the cutoff wave number (kcut) to divide the large- and small-scale waves, the kcut has a great impact on the results of EM scattering. In this paper, the adaptive cutoff wavenumber [47] is chosen to generate the capillary wave for each facet of the sea surface. The expression is obtained by
where κ is the vonkarman constant, κ = 0.35, S(k) is sea spectrum. For a given sea spectrum and wind speed, kcut can be calculated from Equation (20).
4.2. The Foam Layer Scattering Model
The scattering model of each facet in sea surface covered with whitecap is a multilayer medium scattering model. There are mainly four scattering contributions in the multilayer medium. The first part of EM scattering comes from the upper sea surface. The second part comes from the foam layer. The third part is from the bottom sea surface. The last part is the interaction between the upper surface and the foam layer or between the lower surface and the foam layer. Figure 6 shows the four scattering contributions of the foam-covered sea surface. The RMS heights of the top surface and bottom surface are the same value.
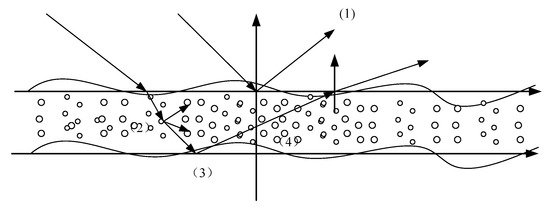
Figure 6.
The scattering model of the sea surface covered with the foam layer. (1), (2), (3) and (4) represent the four scattering contributions for Electromagnetic (EM) scattering model.
This paper adopts the scattering model of the multilayer medium proposed by Fung et al. [46]. The expressions of the four contributions are as follows.
The scattering of the upper surface adopts IEM to compute. σupper = σIEM = Equation (19).
The volume scattering of the foam layer is
The scattering of bottom sea surface contains the following processes: the incident EM wave crosses the top surface and is partially attenuated by the foam layer before reaching the bottom surface, then it is scattered backward and again goes through foam layer attenuation before it can pass through the top surface and head into the observed direction. The expression is obtained by
The interaction scatterings between the foam layer and the upper/bottom sea surface are
where I and Is are the power density of incident wave and scattered wave, respectively. μ = cosθ, μs = cosθs, μo = cosθo, μt = cosθt. σb is the standard deviation height of the bottom sea surface and kl is the spatial wave number of the foam layer. κs, κa and κe are volume scattering, absorption and extinction rate. κe = κs+κa. τ = κed is the optical thickness and a = κs/κe is the polarization absorption. The expressions of them are as follows
where kbi and kbr are the imaginary and real parts of the host medium wave number.
where N is the number density, related to the volume fraction f
The other parameters are shown in [46].
Figure 7 shows the RCS of the foam layer varying with foam layer thickness for θi = 10° and θi = 60°. In the simulation, f = 10 GHz, U10 = 10 m/s, for HH polarization. It can be seen that foam layer thickness and the incident angle have a great influence on the RCS. As the incident angle increases, the RCS gets smaller than it was before. This is why foam layer thickness is considered in this paper.
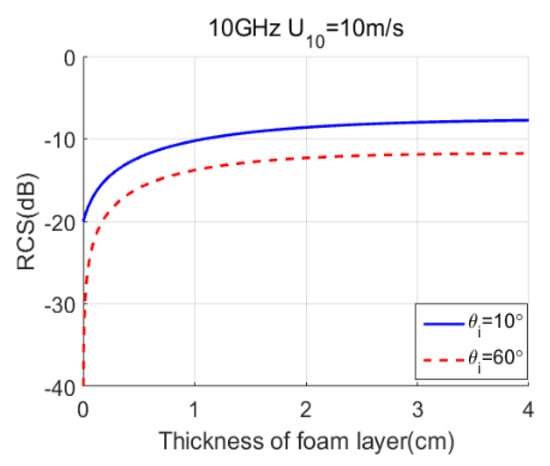
Figure 7.
The scattering of foam layer varying with foam layer thickness for θi = 10° and θi = 60°.
The formula of complex scattering amplitude from the foam layer in each facet takes the following relationship.
To sum up, the whole scattering field of the foam-covered sea surface is obtained by
where c = 0 or 1, d = 1 or 0, represents the facet whether or not covered with a crest or static foam.
Overall, by combining Equations (17)–(19), (26), (31) and (32), we can get the Normalized RCS (NRCS) of a sea surface covered with crest foam and static foam. The expression of NRCS is as follows
where A is the area of the observed sea surface.
5. Numerical Results and Discussion
For the purpose of verifying the correctness of the geometric model and the effectiveness of the modified EM scattering model, the EM backscattering results of the sea surface covered with two stages of foam and two different foam thicknesses were simulated and compared with measured data from level 3 to level 6 sea state (JOSS-I, 4FRS [23,24]).
5.1. Comparison with Measured Data at Level 3 Sea State
Figure 8 shows the EM backscattering NRCS plots of 300 samples for VV and HH polarization. In the simulation, the size of the sea surface is 300 m × 300 m, Δx = Δy = 1 m, M × N = 300 × 300. f = 4.455 GHz, U10 = 7.7 m/s, ε = (68.9, 34.4), εf = (2.38, 0.69), the measured data is level 3 sea state from JOSS-I model for the wind speed between 7.2 m/s and 8.23 m/s. The numerical results of five sea surface models are shown in Figure 8 at VV and HH polarization. The five sea surface models are sea without foam, the proposed sea model, sea surface covered with individual crest foam, sea surface covered with individual static foam and sea surface covered with half ratio of crest foam and half static foam, respectively. The green circles in Figure 8 are the measured data from the JOSS-I model.
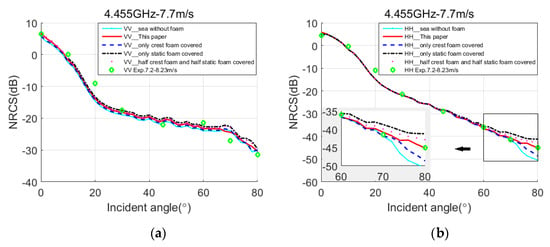
Figure 8.
Comparison results of Normalized RCS (NRCS) by the proposed model, the sea surface covered with crest foam only, the sea surface covered with static foam only, the sea surface covered half crest foam and half static foam, and the measured data from JOSS-I model. f = 4.455 GHz, U10 = 7.7 m/s. (a) VV polarization. (b) HH polarization.
For the simulation wind speed U10 = 7.7 m/s, in the sea surface covered with individual static foam, the whitecap coverage is 0.8% and the foam thickness for static foam is ds = 2 mm. In the sea surface covered with individual crest foam, the whitecap coverage is 0.16% and the foam thickness for crest foam is dc = 0.8 mm. In the sea surface covered with half ratio of crest foam and half static foam, the crest foam coverage is 0.08%, while the static foam coverage is 0.4%. At present, two kinds of foam thicknesses coexist on the sea surface: dc = 0.8 mm and ds = 2 mm. While in the proposed model, the whitecap coverages of crest foam and static foam are 0.15% and 0.05%, respectively.
In Figure 8, it can be seen that for VV polarization, the results of all kinds of models agree well with the measured data, because the vertical polarization is mainly due to the Bragg scattering. For HH polarization, the results of the sea surface without foam are clearly inaccurate at the large incident angle from 70° to 80°. On the contrary, the results of the foam-covered sea surface are much better. However, different coverage ratios of foam also have different effects. Compared with the results of the sea surface covered with individual crest foam, the sea surface covered with individual static foam, and the sea surface covered with half ratio of crest foam and half static foam, the results of the proposed model agree better with the measured data. The maximum difference of the sea surface covered with individual static foam is about 4 dB larger than the measured data at a large incident angle. The sea surface at this moment has the biggest whitecap coverage (0.8%) and the thickest foam layer (ds = 2 mm). In addition, the maximum difference of the sea surface covered with individual crest foam is about 3 dB less than measured data at a large incident angle. The sea surface at this moment has the fewest whitecap coverage (0.16%) and the thinnest foam layer (ds = 0.8 mm). While for the sea surface covered with half crest foam and half static foam, the maximum difference is about 2.5 dB larger than measured data at a large incident angle. This suggests that the EM scattering contributions of different coverage ratios of crest foam and static foam have an obvious effect on horizontal polarization. Therefore, for a given sea state, it is important to determine the coverage ratio of the crest foam and static foam, and consider the different foam layer thickness of each foam.
5.2. Comparison with Measured Data at Level 4 Sea State
Figure 9 illustrates the EM backscattering NRCS plots of 300 samples for VV and HH polarization. In the simulation, the size of the sea surface is 300 m × 300 m, Δx = Δy = 1 m, M × N = 300 × 300. f = 4.455 GHz, U10 = 10.5 m/s, ε = (68.9, 34.4), εf = (2.38, 0.69), the measured data is level 4 sea state from JOSS-I model for the wind speed between 9.26 m/s and 11.32 m/s.
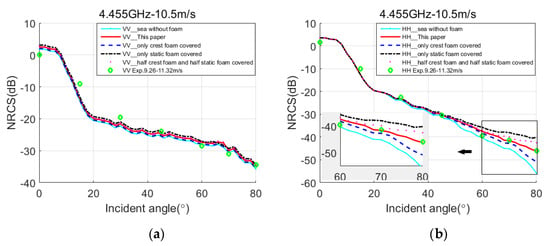
Figure 9.
Comparison results of NRCS by the proposed model, the sea surface covered with crest foam only, the sea surface covered with static foam only, the sea surface covered half crest foam and half static foam, and the measured data from JOSS-I model. f = 4.455 GHz, U10 = 10.5 m/s. (a) VV polarization. (b) HH polarization.
For the sea surface covered with individual static foam, the whitecap coverage is 1.9%, ds = 4.8 mm. In the sea surface covered with individual crest foam, the whitecap coverage is 0.41%, dc = 1.7 mm. In the sea surface covered with half ratio of crest foam and half static foam, the whitecap coverages of crest foam and static foam are 0.2% and 0.95%, respectively. There are also two foam thicknesses that coexist: dc = 1.7 mm, ds = 4.8 mm. While in the proposed model, the whitecap coverages of crest foam and static foam are 0.29% and 0.56%, respectively.
For VV polarization, all models are in good agreement with measured data. For HH polarization, compared with the numerical results of Figure 8, the results of sea without foam in Figure 9 are getting worse. As the sea state increases from level 3 to level 4, the whitecap coverage of each foam increases and the foam layer thickness thickens as the wind speed goes up. The influences of different coverage ratios of crest foam and static foam become larger. Meanwhile, the maximum difference of the sea surface covered with individual static foam is about 6 dB larger than measured data at a large incident angle, which is even greater than the same model in Figure 8. In addition, the maximum difference of the sea surface covered with individual crest foam is about 4 dB less than measured data at a large incident angle. The maximum difference is about 4 dB larger than measured data at a large incident angle for the sea surface covered with half ratio of crest foam and half static foam. While the results of the proposed model always agree well with the experimental results.
5.3. Comparison with Measured Data at Level 5 Sea State
Figure 10 illustrates the EM backscattering NRCS plots of 300 samples for VV and HH polarization. In the simulation, the size of the sea surface is 300 m × 300 m, Δx = Δy = 1 m, M × N = 300 × 300. f = 8.91 GHz, U10 = 12.5 m/s, ε = (58.8, 36.6), εf = (2.18, 0.74) and the measured data is level 5 sea state from JOSS-I model for the wind speed between 11.83 m/s and 13.89 m/s.
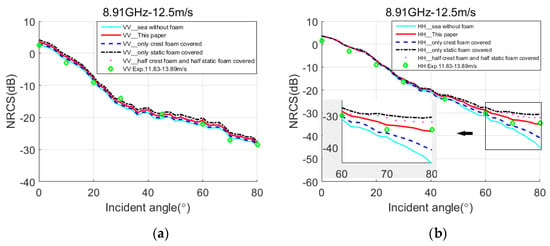
Figure 10.
Comparison results of NRCS by the proposed model, the sea surface covered with crest foam only, the sea surface covered with static foam only, the sea surface covered half crest foam and half static foam and the measured data from JOSS-I model. f = 8.91 GHz, U10 = 12.5 m/s. (a) VV polarization. (b) HH polarization.
In the simulation, for the sea surface covered with individual static foam, the whitecap coverage is 2.9%, ds = 8.2 mm. In the sea surface covered with individual crest foam, the whitecap coverage is 0.74%, the dc = 3 mm. In the sea surface covered with half crest foam and half static foam, the whitecap coverage of crest foam and static foam are 0.37% and 1.45%, respectively. While in the proposed model, the crest foam coverage is 0.5%, and the static foam coverage is 0.93%. Compared with the results of Figure 8 and Figure 9, Figure 10 shows that as the sea state comes to level 5, the whitecap coverages of crest foam and static foam increase accompanied by an increase in foam thickness of each foam. For the results of all the models on HH polarization, the proposed model has a better agreement with the measured data than the other sea models.
5.4. Comparison with Measured Data at Level 6 Sea State
Figure 11 illustrates the EM backscattering NRCS plots of 300 samples for VV and HH polarization. In the simulation, the size of the sea surface is 300 m × 300 m, Δx = Δy = 1 m, M × N = 300 × 300. f = 8.91 GHz, U10 = 16 m/s, ε = (58.8, 36.6), εf = (2.18, 0.74), the measured data is level 6 sea state from the 4FRS model for the wind speed between 15.43 m/s and 17 m/s.
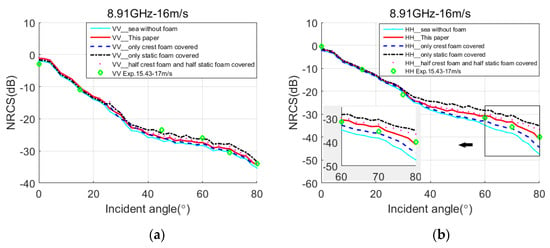
Figure 11.
Comparison results of NRCS by the proposed model, the sea surface covered with crest foam only, the sea surface covered with static foam only, the sea surface covered half crest foam and half static foam and the measured data from 4FRS model. f = 8.91 GHz, U10 = 16 m/s. (a) VV polarization. (b) HH polarization.
In the simulation, for the sea surface covered with individual static foam, the whitecap coverage is 5.5%, ds = 17 mm. In the sea surface covered with individual crest foam, the whitecap coverage is 1.5%, dc = 6 mm. In the sea surface covered with half ratio of crest foam and half static foam, the whitecap coverage of crest foam and static foam are 0.75% and 2.75%, respectively. While in the proposed model, the crest foam coverage is 0.96%, and the static foam coverage is 1.97%. There are also two foam thicknesses that coexist: dc = 6 mm, ds = 17 mm. It can be seen that the foam thickness of static foam reaches a new order of magnitude. Compared with the results of Figure 8, Figure 9 and Figure 10, the EM scattering contributions of coverage ratios of crest foam and static foam have a greater impact on HH polarization. The numerical results of sea surface covered with individual static foam, sea surface covered with individual crest foam, sea surface covered with half ratio of static foam and half crest foam are getting worse. However, the results of the proposed model from level 3 to level 6 sea state are still consistent with the measured data, which verifies the correctness of the geometric modeling of the foam-covered sea surface and the effectiveness of the EM scattering model.
5.5. Discussion
The above numerical results are obtained from level 3 to level 6 sea state. For VV polarization, the results of all sea models are in good agreement with measured data. This reveals that whether it is crest foam or static foam, the difference in vertical polarization is very small. For HH polarization, at the incident angle from 0° to 40°, the results of all the models are consistent with the measured data. However, for the incidence angle is greater than 40°, the results of all models start to differ gradually, and the larger the incident angle, the greater the difference in the results of all the models. Meanwhile the greater the sea state, the greater the difference. This illustrates that the EM scattering contributions of crest foam and static foam are different at HH polarization. Therefore, the results of the proposed model separating crest foam and static foam are in good agreement with the measured data from level 3 to level 6 sea state.
6. Conclusions
In this paper, a modified model for EM scattering of the sea surface covered with a new coverage ratio of crest foam and static foam is proposed. In consideration of the real sea surface condition, modeling of sea surface covered with crest foam and static foam is proposed. Different coverage ratios of crest foam and static foam in various sea states are established. In addition, sea surface covered with different foam layer thicknesses in each foam is also analyzed. The scattering field superposition-based method is adopted to calculate the sea surface covered with a new coverage ratio of crest foam and static foam. Compared with the numerical results of four sea surface models, namely, sea surface without foam, sea surface covered with individual crest foam, sea surface covered with individual static foam, sea surface covered with half ratio of static foam and half crest foam, the proposed model provides a better calculation accuracy in terms of different frequencies and sea states.
Author Contributions
D.L. drafted the manuscript and was responsible for the research design and experiment; Z.Z. supervised the research and contributed to the editing and review of the manuscript; Y.Z., Y.H., and Z.N. reviewed the manuscript and were responsible for the analysis. All authors have read and agreed to the published version of the manuscript.
Funding
This research was supported in part by the National Natural Science Foundation of China (Nos. 61871083 and 61721001).
Acknowledgments
The authors would like to thank the reviewers and editors for providing constructive suggestions and comments.
Conflicts of Interest
The authors declare no conflict of interest.
Appendix A
The Elfouhaily sea spectrum contains two parts, i.e., the capillary waves BH and gravity waves BL of the sea spectrum. They are given as [32],
where Km = 363 rad/m, Kp = gΩ2/U102, the wave age is Ω≈U10/c(kp). The expressions of phase velocity of the wave and the other parameters are obtained by
where is the friction wind speed.
Appendix B
The permittivity constant of sea water is given as [39],
where εs(T, 0) and τ(T, 0) are the permittivity change of pure water and the relaxation time of pure water, respectively. T = 20 °C, ωs = 32.54‰, ε∞ = 4.9. ε0 = 8.854 × 10⁻¹² F/m. The expressions of other parameters are obtained by
where is the electrical conductivity of sea water at T = 25 °C, Δ = 25-T.
Substituted the above parameters into Equations (15) and (16), the permittivity constants of sea water and foam are obtained.
Appendix C
The scattering field of facet-based two-scale model is in Equation (17). The curvature modified factor (cpp) and the shadowing function (S(v)) are introduced by
The RCS formulas of KA and IEM are obtained by Equations (18) and (19). P(Zx, Zy) is the slope probability density distribution of Cox–Munk model
The In in Equation (19) is expressed by
where
Substitute the above parameters into Equations (17)–(19), one can get the RCS of KA and IEM, and the scattering fields of the sea surface.
References
- Nordberg, W.; Conaway, J.; Ross, D.B. Measurements of Microwave Emission from a Foam-Covered Wind-Driven Sea. J. Atmos. Sci. 1971, 28, 429–435. [Google Scholar] [CrossRef]
- Goldstein, H. Attenuation by Condensed Water. In Propagation of Short Radio Waves; Kerr, D.E., Ed.; McGraw-Hill: New York, NY, USA, 1951. [Google Scholar]
- Martin, S. An Introduction to Ocean Remote Sensing; Cambridge University Press: Cambridge, UK, 2004. [Google Scholar]
- Raizer, V. Microwave Scattering Model of Sea Foam. In Proceedings of the IEEE International Geoscience and Remote Sensing Symposium (IGRSS), Munich, Germany, 22–27 July 2012; pp. 5836–5839. [Google Scholar]
- Droppleman, J.D. Apparent microwave emissivity of sea foam. J. Geophys. Res. 1970, 75, 696–698. [Google Scholar] [CrossRef]
- Rosencratz, P.W.; Staelin, D.H. The microwave emissivity of ocean foam and its effect on nadiral radiometric measurements. J. Geophys. Res. 1972, 77, 6528–6538. [Google Scholar]
- Anguelova, M.D.; Gaiser, P.W. Dielectric and Radiative Properties of Sea Foam at Microwave Frequencies: Conceptual Understanding of Foam Emissivity. Remote Sens. 2012, 4, 1162–1189. [Google Scholar] [CrossRef]
- Zhou, L.; Tsang, L. Polarimetric passive microwave remote sensing of wind vectors with foam-covered rough ocean surfaces. Radio Sci. 2003, 38, 1073–1086. [Google Scholar] [CrossRef]
- Guo, J.; Tsang, L. Applications of Dense Media Radiative Transfer Theory for Passive Microwave Remote Sensing of Foam Covered Ocean. IEEE Trans. Geosci. Remote Sens. 2001, 39, 1019–1027. [Google Scholar] [CrossRef]
- Kaimykov, A.I.; Pustovoytenkov, V.V. On polarization features of radio signals scattered from the sea at small grazing angles. J. Geophys. Res. 1976, 81, 1960–1964. [Google Scholar] [CrossRef]
- Lyzenga, D.R.; Maffett, A.I.; Shuchman, R.A. The contribution of wedge scattering to the radar cross section of the ocean surface. IEEE Trans. Geosci. Remote Sens. 1983, 21, 502–505. [Google Scholar] [CrossRef]
- Churyumov, A.N.; Kravtsov, Y.A. Microwave backscatter from mesoscale breaking waves on the sea surface. Waves Random Media 2002, 10, 1–15. [Google Scholar] [CrossRef]
- Kudryavtsev, V.; Hauser, D.; Caudal, G. A semi-empirical model of the normalized radar cross section of the sea surface:1. the background model. J. Geophys. Res. 2003, 108, 1–24. [Google Scholar]
- Kudryavtsev, V.; Hauser, D.; Caudal, G. A semi-empirical model of the normalized radar cross section of the sea surface: surface: 2. radar modulation transfer function. J. Geophys. Res. 2003, 108, 1–16. [Google Scholar]
- West, J.C.; Zhao, Z.Q. Electromagnetic modeling of multipath scattering from breaking water waves with rough faces. IEEE Trans. Geosci. Remote Sens. 2002, 40, 583–592. [Google Scholar] [CrossRef]
- Li, J.X.; Zhang, M.; Fan, W.N.; Nie, D. Facet-Based Investigation on Microwave Backscattering From Sea Surface With Breaking Waves: Sea Spikes and SAR Imaging. IEEE Trans. Geosci. Remote Sens. 2017, 55, 2313–2325. [Google Scholar] [CrossRef]
- Monahan, E. Oceanic whitecaps. J. Phys. Oceanogr. 1971, 1, 139–144. [Google Scholar] [CrossRef]
- Monahan, E.; Woolf, D.K. Comments on variations of whitecap coverage with wind stress and water temperature. J. Phys. Oceanogr. 1989, 19, 706–709. [Google Scholar] [CrossRef]
- Sharkov, Y.A. Experimental investigations of the lifetime for breaking wave dispersive zone. Izv. Atmos. Ocean. Phys. 1995, 30, 808–811. [Google Scholar]
- Reising, S.C.; Asher, W.E.; Rose, L.A. Polarimetric emissivity of whitecaps experiment (POEWEX): Preliminary results. In WindSat Science Workshop, November; Noesis, Inc.: Arlington, VA, USA, 2002. [Google Scholar]
- Reul, N.; Chapron, B. A model of sea–foam thickness distribution for passive microwave remote sensing application. J. Geophys. Res. 2003, 108. [Google Scholar] [CrossRef]
- Anguelova, D.A.; Gaiser, W.G. Microwave emissivity of sea foam layers with vertically inhomogeneous dielectric properties. Remote Sens. Environ. 2013, 139, 81–96. [Google Scholar]
- Daley, J.C.; Ransone, J.R.; Burkett, J.A. Radar Sea Return-JOSS I; U.S. Naval Research Laboratory: Washington, DC, USA, 1971. [Google Scholar]
- Daley, J.C.; Davis, W.T.; Mills, N.R. Radar Sea Return-high Sea States; U.S. Naval Research Laboratory: Washington, DC, USA, 1970. [Google Scholar]
- Hwang, P.A. Foam and roughness effects on passive microwave remote sensing of the ocean. IEEE Trans. Geosci. Remote Sens. 2012, 50, 2978–2985. [Google Scholar] [CrossRef]
- Hwang, P.A.; Reul, N.; Meissner, T.; Yueh, S.H. Whitecap and Wind Stress Observations by Microwave Radiometers: Global Coverage and Extreme Conditions. J. Phys. Oceanogr. 2019, 49, 2291–2307. [Google Scholar] [CrossRef]
- Callaghan, A.H.; Leeuw, G.D.; Cohen, L.H.; O’Dowd, C.D. The relationship of oceanic whitecap coverage to wind speed and wind history. J. Geophys. Res. Lett. 2008, 35. [Google Scholar] [CrossRef]
- Meissner, T.; Wentz, F.J. Wind-vector retrievals under rain with passive satellite microwave radiometers. IEEE Trans. Geosci. Remote Sens. 2009, 47, 3065–3083. [Google Scholar] [CrossRef]
- Anguelova, M.D.; Webster, F. Whitecap coverage from satellite measurements: A first step toward modeling the variability of oceanic whitecaps. J. Geophys. Res. 2006, 111. [Google Scholar] [CrossRef]
- Sugihara, Y.H.; Tsumori, T.; Yoshioka, O.H.; Serizawa, S. Variation of whitecap coverage with wave-field conditions. J. Mar. Syst. 2007, 66, 47–60. [Google Scholar] [CrossRef]
- Lafon, C.; Piazzola, J.; Forget, P.; Despiau, S. Whitecap coverage in coastal environment for steady and unsteady wave field conditions. J. Mar. Syst. 2007, 66, 38–46. [Google Scholar] [CrossRef]
- Elfouhaily, T.; Chapron, B.; Katsaros, K. A unified directional spectrum for long and short wind-driven waves. J. Geophys. Res. 1997, 102, 15781–15796. [Google Scholar] [CrossRef]
- Creamer, D.B.; Henyey, F.; Schult, R.; Wright, J. Improved linear representation of sea surface waves. J. Fluid Mech. 1989, 205, 135–161. [Google Scholar] [CrossRef]
- Longuet-Higgins, M.S. Integral properties of periodic gravity waves of finite amplitude. Proc. R. Soc. Lond. 1975, 342, 157–174. [Google Scholar]
- McLean, J.W.; Ma, Y.C.; Martin, D.U.; Saffman, P.G.; Yuen, H.C. Three-dimensional instability of finite-amplitude water waves. Phys. Rev. Lett. 1981, 46, 817–820. [Google Scholar] [CrossRef]
- Phillips, O.M.; Banner, M.L. Wave breaking in the presence of wind drift and swell. J. Fluid Mech. 1974, 66, 625–640. [Google Scholar] [CrossRef]
- Stokes, G.G. On the theory of oscillatory waves. Trans. Camb. Philos. Soc. 1847, 8, 441–455. [Google Scholar]
- Longuet-Higgins, M.S.; Fox, M.J.H. Theory of the almost-highest wave: The inner solution. J. Fluid Mech. 1977, 80, 721–741. [Google Scholar] [CrossRef]
- Meissner, T.; Wentz, J. The complex dielectric constant of pure and sea water from microwave satellite observations. IEEE Trans. Geosci. Remote Sens. 2004, 42, 1836–1849. [Google Scholar] [CrossRef]
- Ruppin, R. Evaluation of extended Maxwell-Garnett Theories. Opt. Commun. 2000, 182, 273–279. [Google Scholar] [CrossRef]
- Li, D.F.; Zhao, Z.Q.; Zhao, Y.W.; Huang, Y.; Liu, Q.H. An Improved Facet-Based Two-scale model for Electromagnetic Scattering from Sea Surface and Wave breaking. In Proceedings of the IEEE Radar Conference, Boston, MA, USA, 22–26 April 2019; pp. 1–4. [Google Scholar]
- Kozlov, A.; Ligthart, I.; Logvin, L.; Besieris, P.; Pusone, M. Mathematical and Physical Modelling of Microwave Scattering and Polarimetric Remote Sensing; Springer: Dordrecht, The Netherlands, 2002; Volume 3. [Google Scholar]
- Fung, A.K. Microwave Scattering and Emission Models and Their Applications; Artech House: Norwood, MA, USA, 1994. [Google Scholar]
- Bourlier, C.; Berginc, G.; Saillard, J. One- and two- dimentional shadowing functions for any height and slope stationary uncorrelated surface in the monostatic and bistatic configurations. IEEE Trans. Antennas Propag. 2002, 50, 312–324. [Google Scholar] [CrossRef]
- Cox, C.; Munk, M. Statistics of the sea surface derived from sun glitter. J. Mar. Res. 1954, 13, 198–227. [Google Scholar]
- Voronovich, A.G. On the theory of electromagnetic waves scattering from the sea surface at low grazing angles. Radio Sci. 1996, 31, 1519–1530. [Google Scholar] [CrossRef]
- Li, D.F.; Zhao, Z.Q.; Qi, C.H.; Huang, Y.; Zhao, Y.W.; Nie, Z.P. An Improved Two-Scale Model for Electromagnetic Backscattering from Sea Surface. IEEE Geosci. Remote Sens. Lett. 2019, 1–5. [Google Scholar] [CrossRef]
© 2020 by the authors. Licensee MDPI, Basel, Switzerland. This article is an open access article distributed under the terms and conditions of the Creative Commons Attribution (CC BY) license (http://creativecommons.org/licenses/by/4.0/).