Nonlinear Manifold Learning Integrated with Fully Convolutional Networks for PolSAR Image Classification
Abstract
1. Introduction
1.1. SAR Imagery Feature Extraction
1.2. Nonlinear Learning for PolSAR Data
1.3. Problems and Motivation
1.4. Contributions and Structure
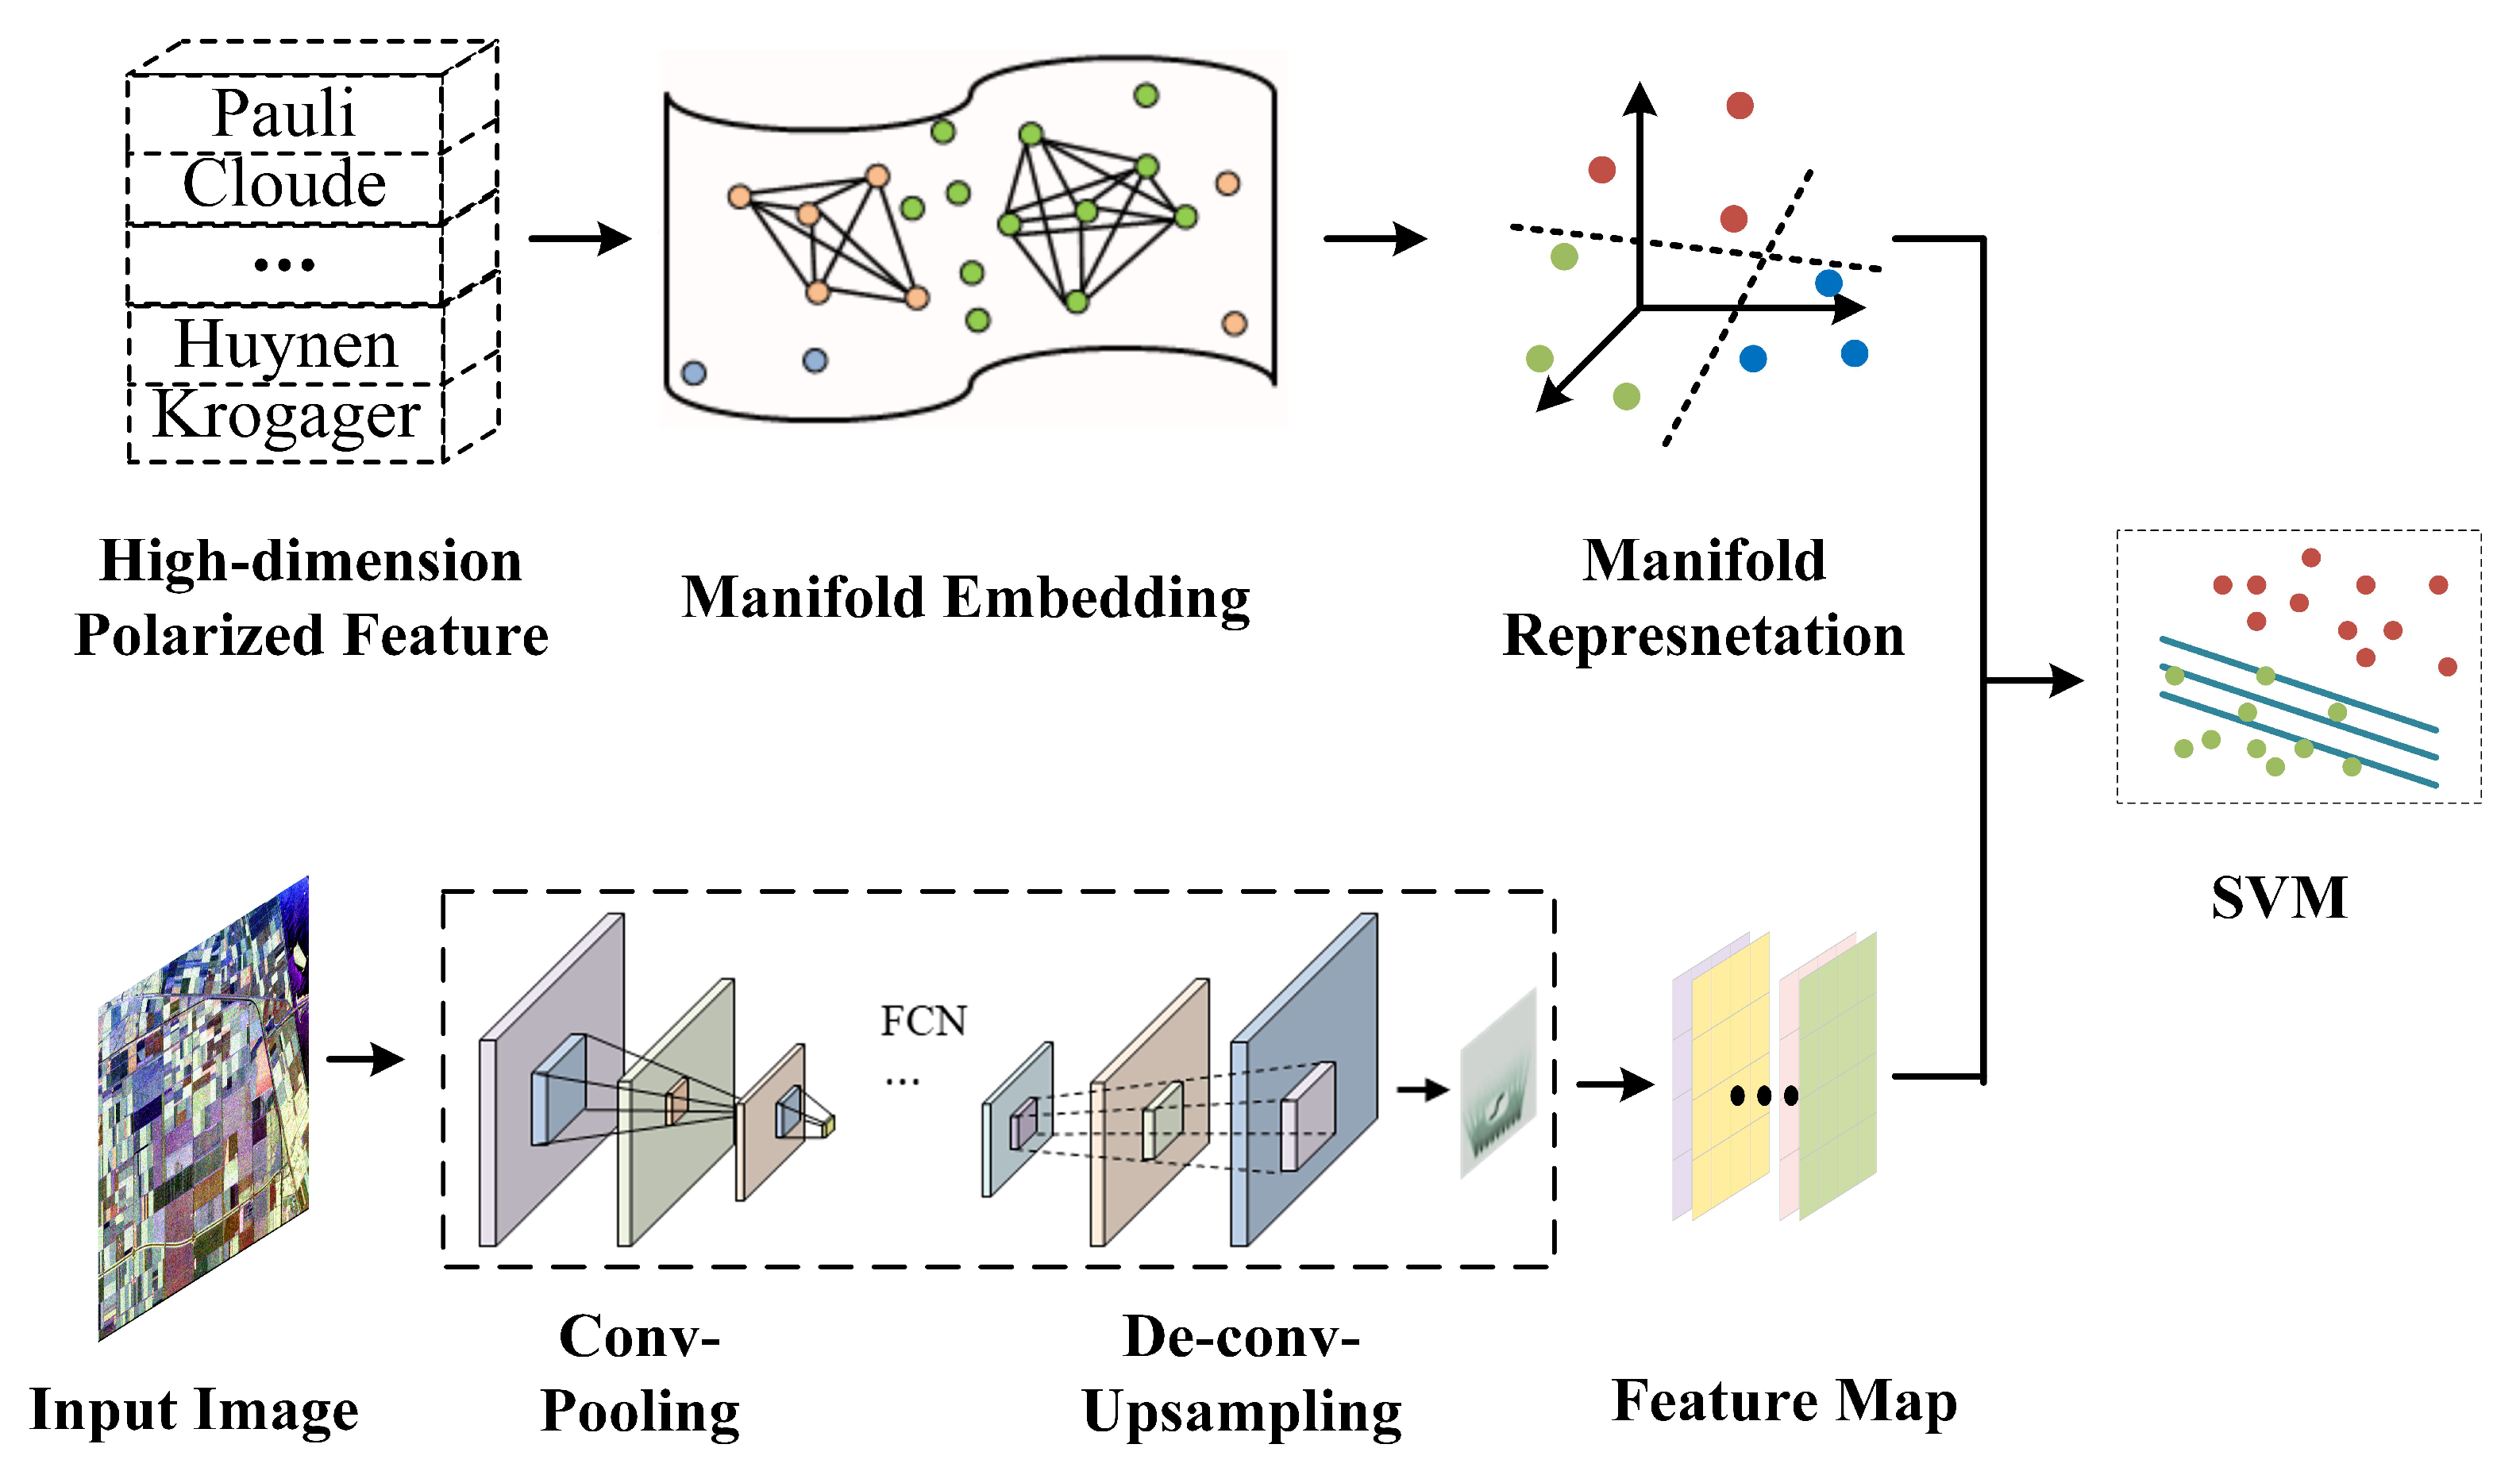
- To automatically learn effective features, deep network is employed and it breaks through the limitation of manual features. In this paper, FCN model, pre-trained on optical images, is transferred to learn nonlinear deep multi-scale spatial information of PolSAR image. Specifically, “RGB” pseudo color maps serve as the input of FCN, to fit well-trained parameters, the high-level semantic information adaptively learned by FCN can greatly promote classification.
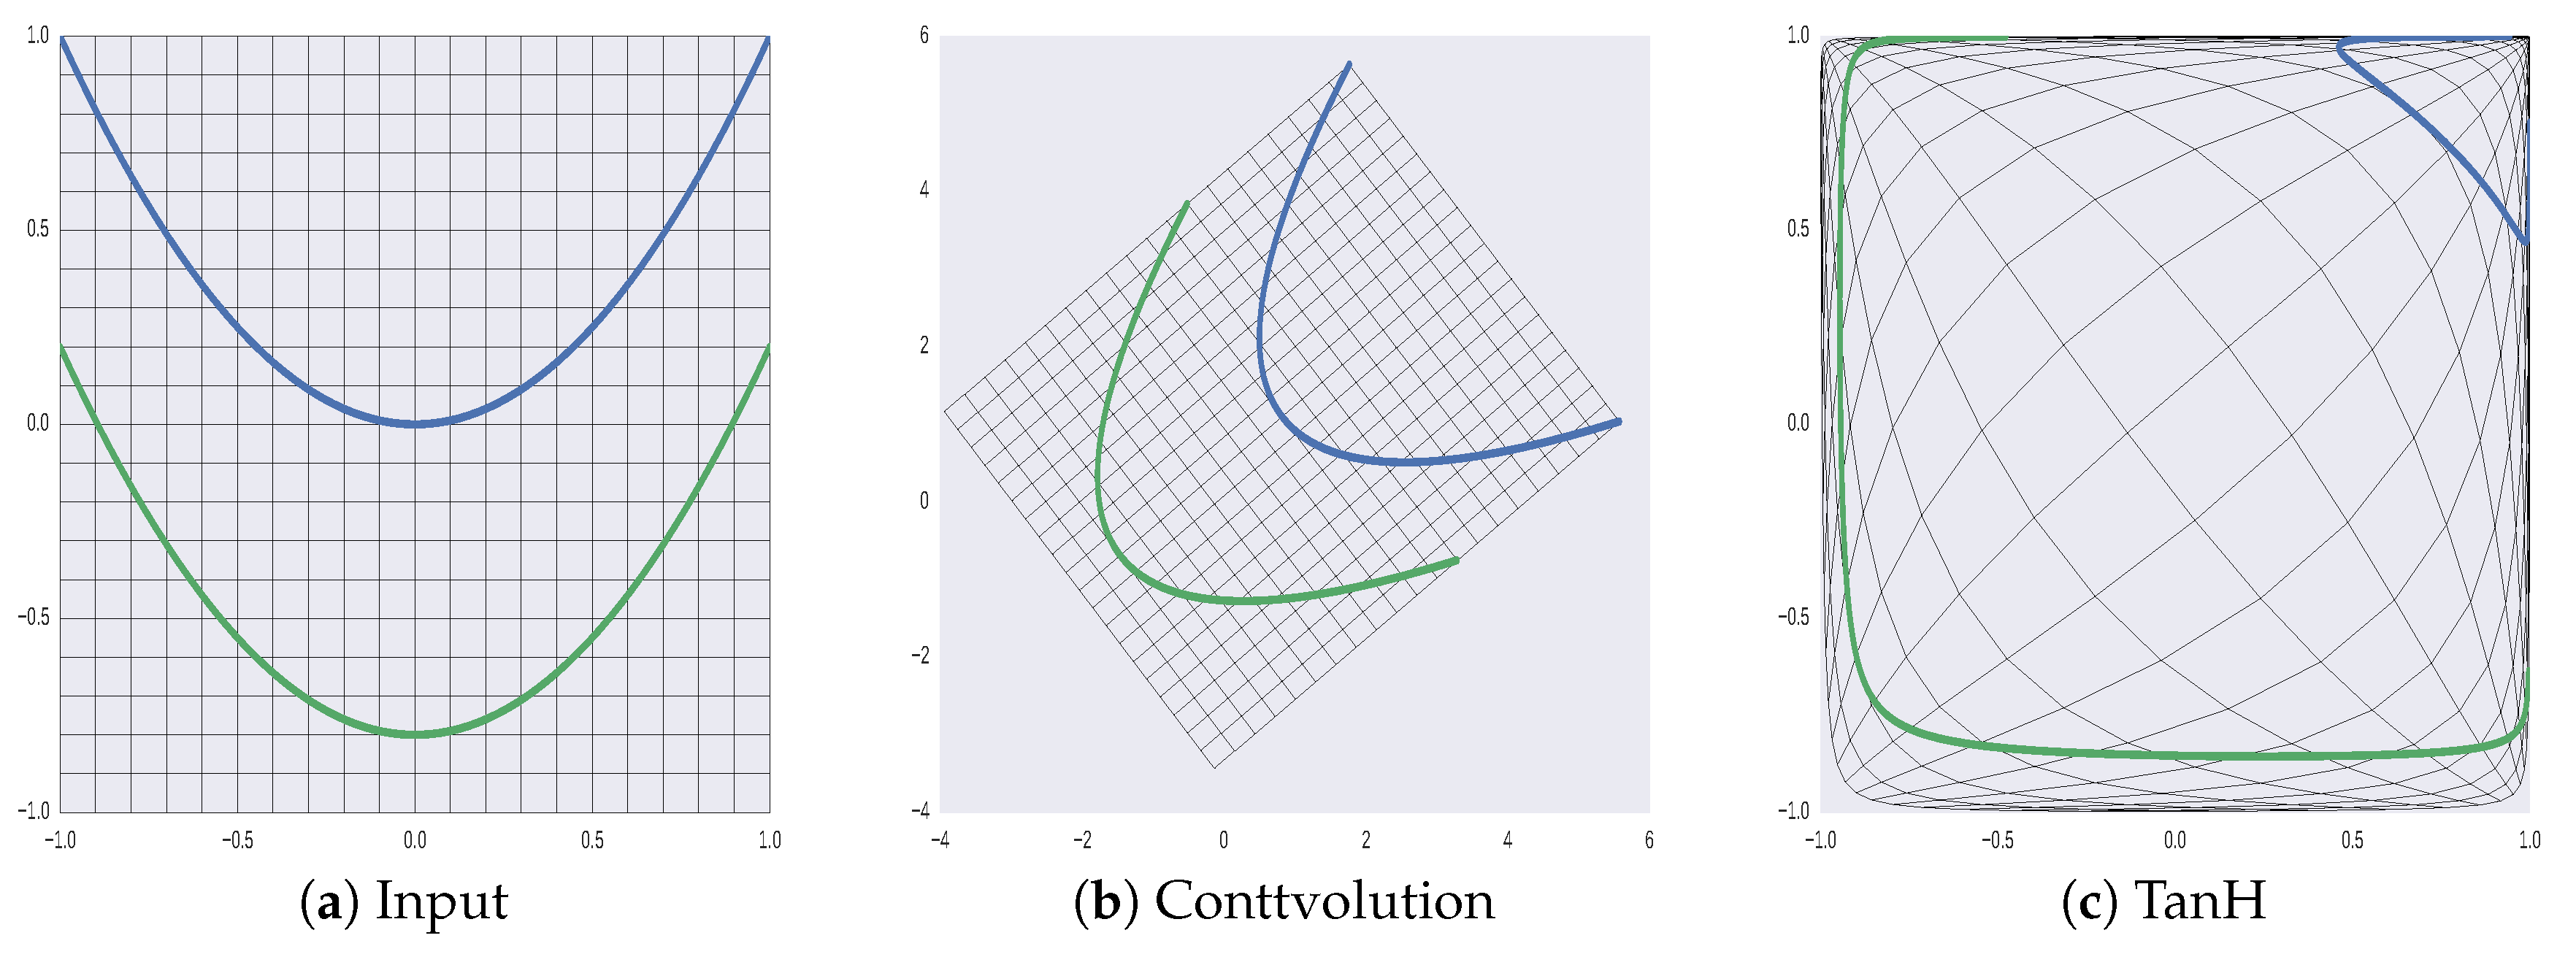
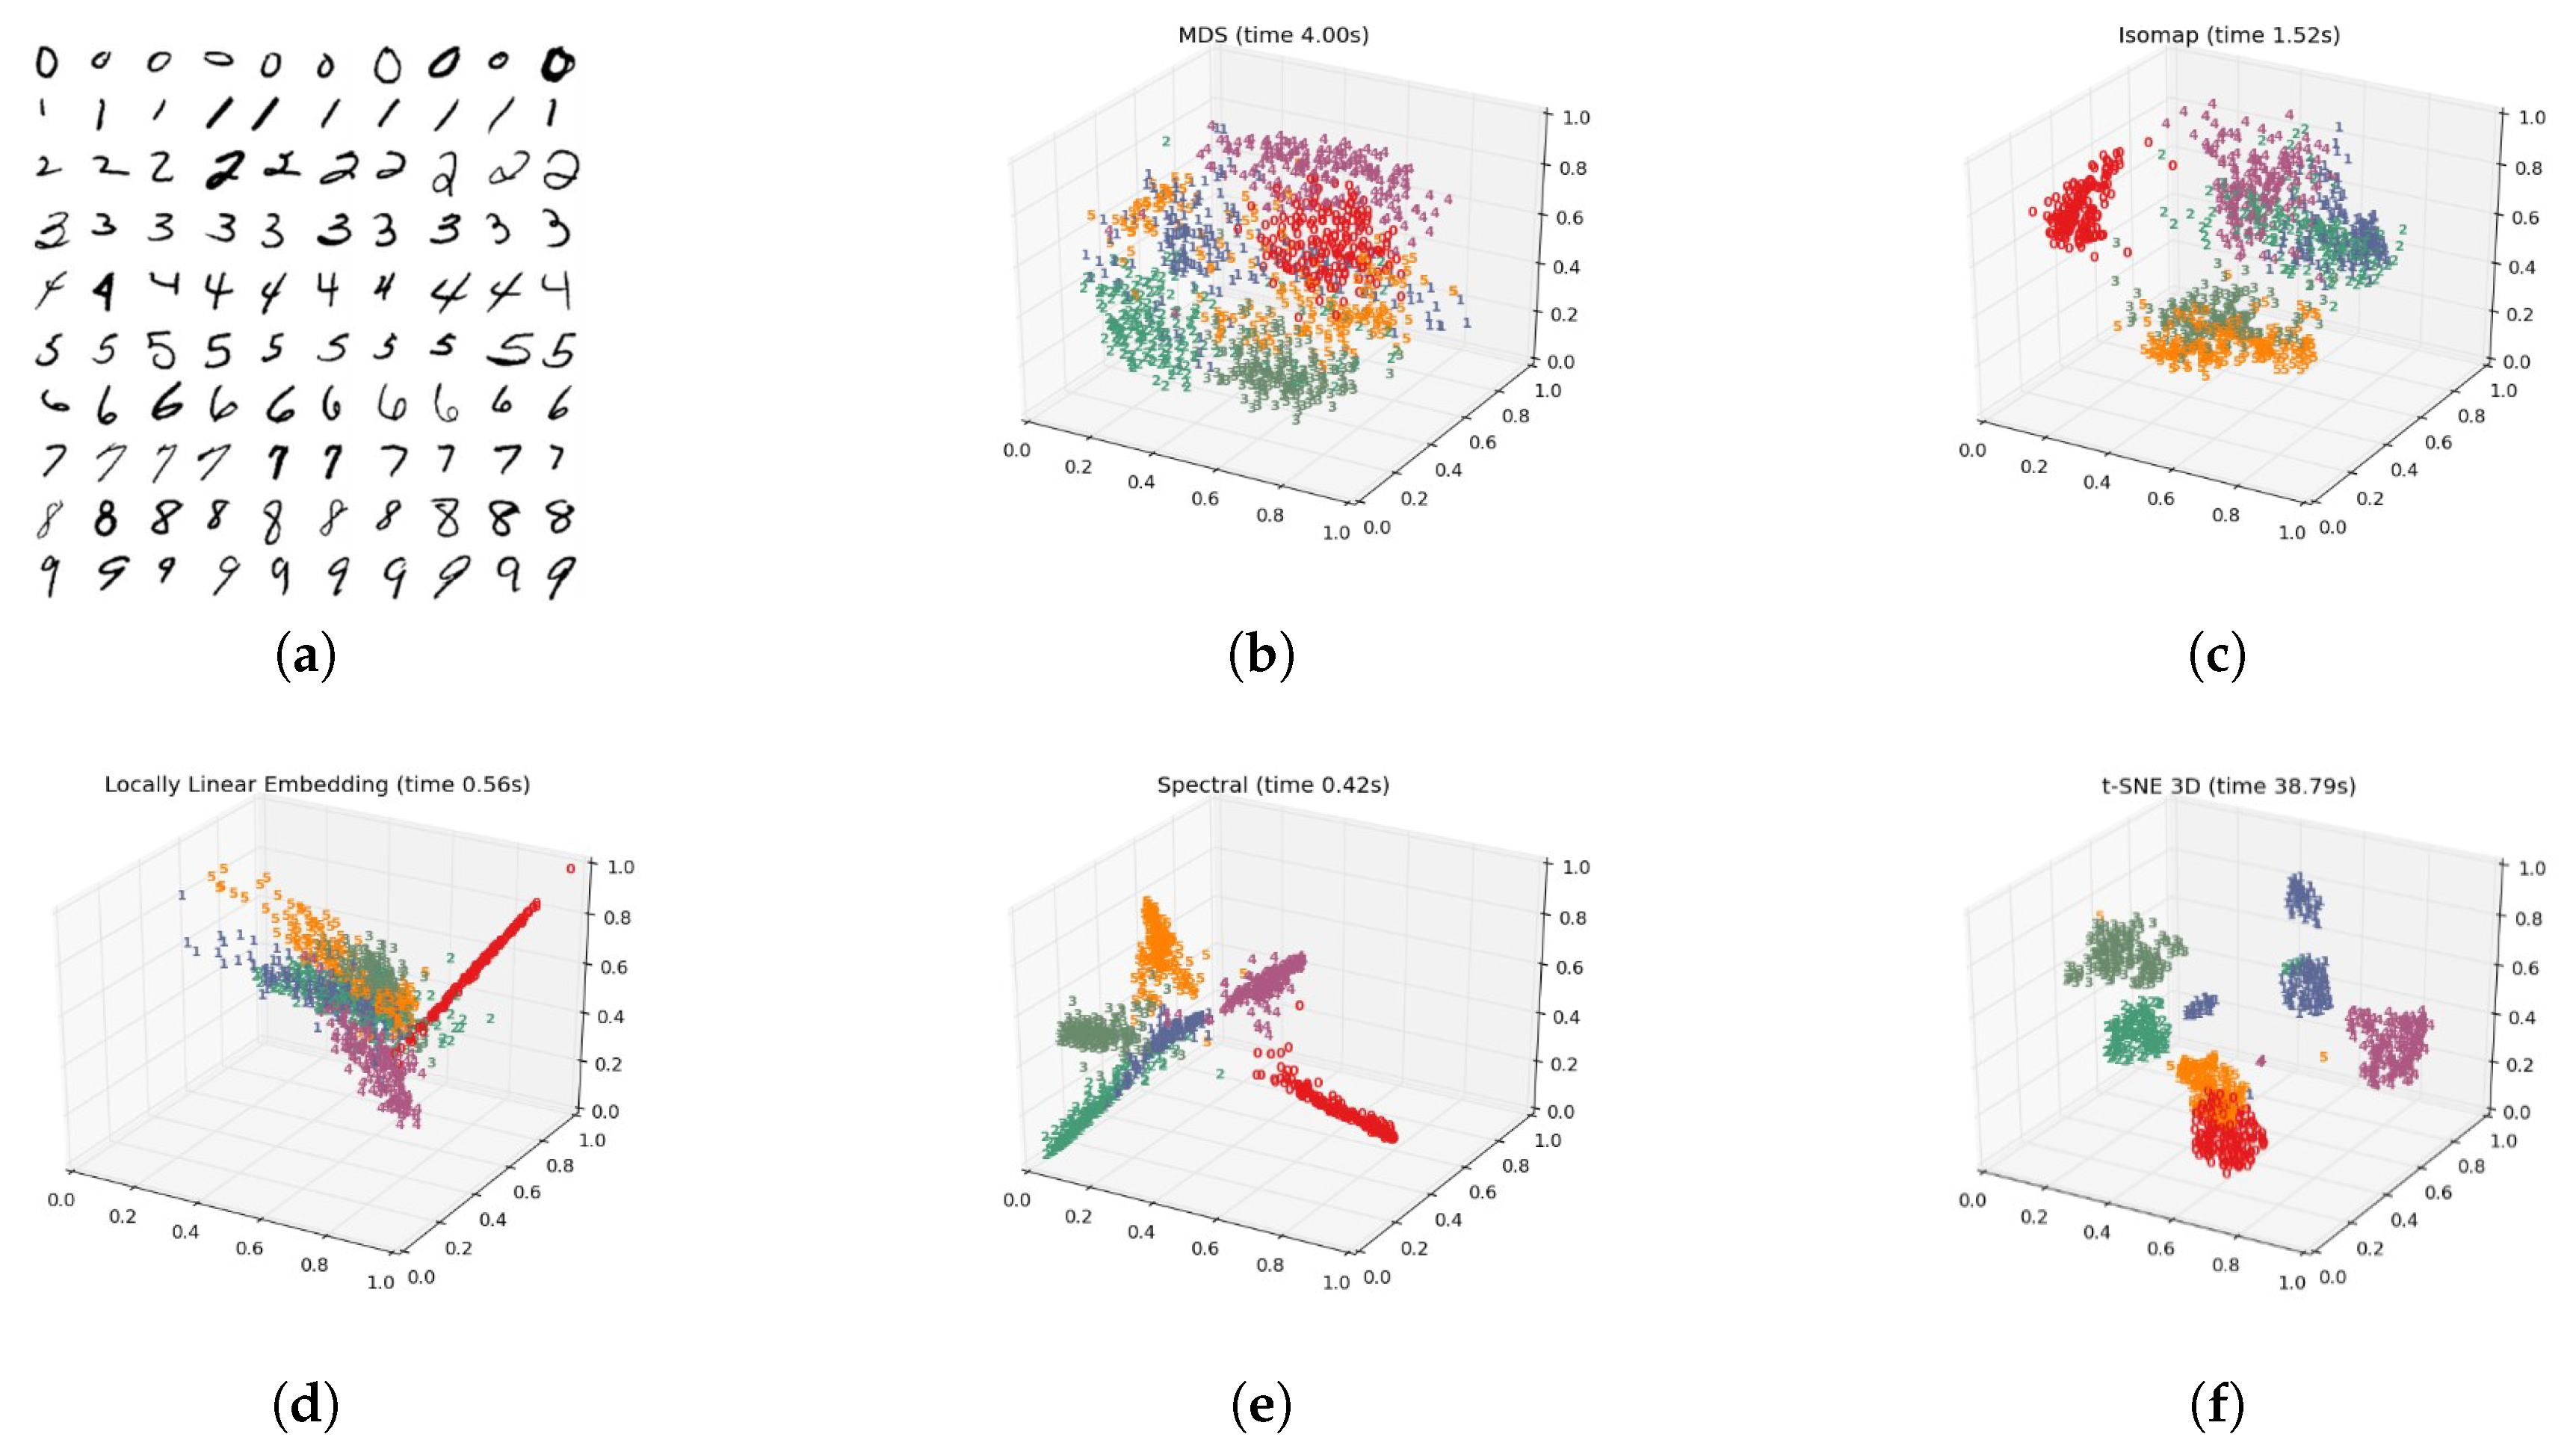
- To nonlinear model non-uniform areas in PolSAR image, a manifold-based nonlinear learning method is employed to capture the most essential structure of high-dimensional polarized data. Nonlinear manifold modeling can supplement the mapping ability of deep network with finite layers. In addition to removing redundant information in high-dimensional polarized data, nonlinear manifold method can also explore intrinsic representation in low-dimensional subspace, to improve feature’s distinguishing ability.
- The shallow manifold subspace representation is embedded into deep spatial features learned by FCN in a weighted way, which makes their advantages complementary. The final fused features contain multiple types of information, from local to global, polarization to space, enhancing representation ability for classification.
2. Related Work
2.1. Multi-Dimensional Polarization Data Space
2.2. FCN Structure
2.3. Classical Manifold Methods
3. Proposed Method
3.1. Transfer Learning Based on FCN-8s
3.2. Manifold Mapping Based on TSNE
3.3. The Proposed Algorithm Framework
4. Experiments and Analysis
4.1. Experiment Datasets and Evaluation Standards
4.1.1. Flevoland Dataset
4.1.2. Foulum Dataset
4.1.3. San Francisco Dataset
4.1.4. Evaluation Standards
4.2. Experiment Setup
4.2.1. Comparison Schemes
4.2.2. Params Setting
4.3. Experimental Analysis and Results
4.4. Discussion
- The feature effectiveness. The experimental results of FCN alone have shown that spatial features learnt by migrated FCN are of great significance in classification. Meanwhile, considering the coherence principle of PolSAR image, nonlinear manifold learning is adopted to model ground objects more effectively. Two types of features are fused for classification and good results are achieved. However, the original features in our work do not take phase information into account. Phase information might play an important role in distinguishing some object types, in future research, how to encode phase information into pseudo color images should be explored.
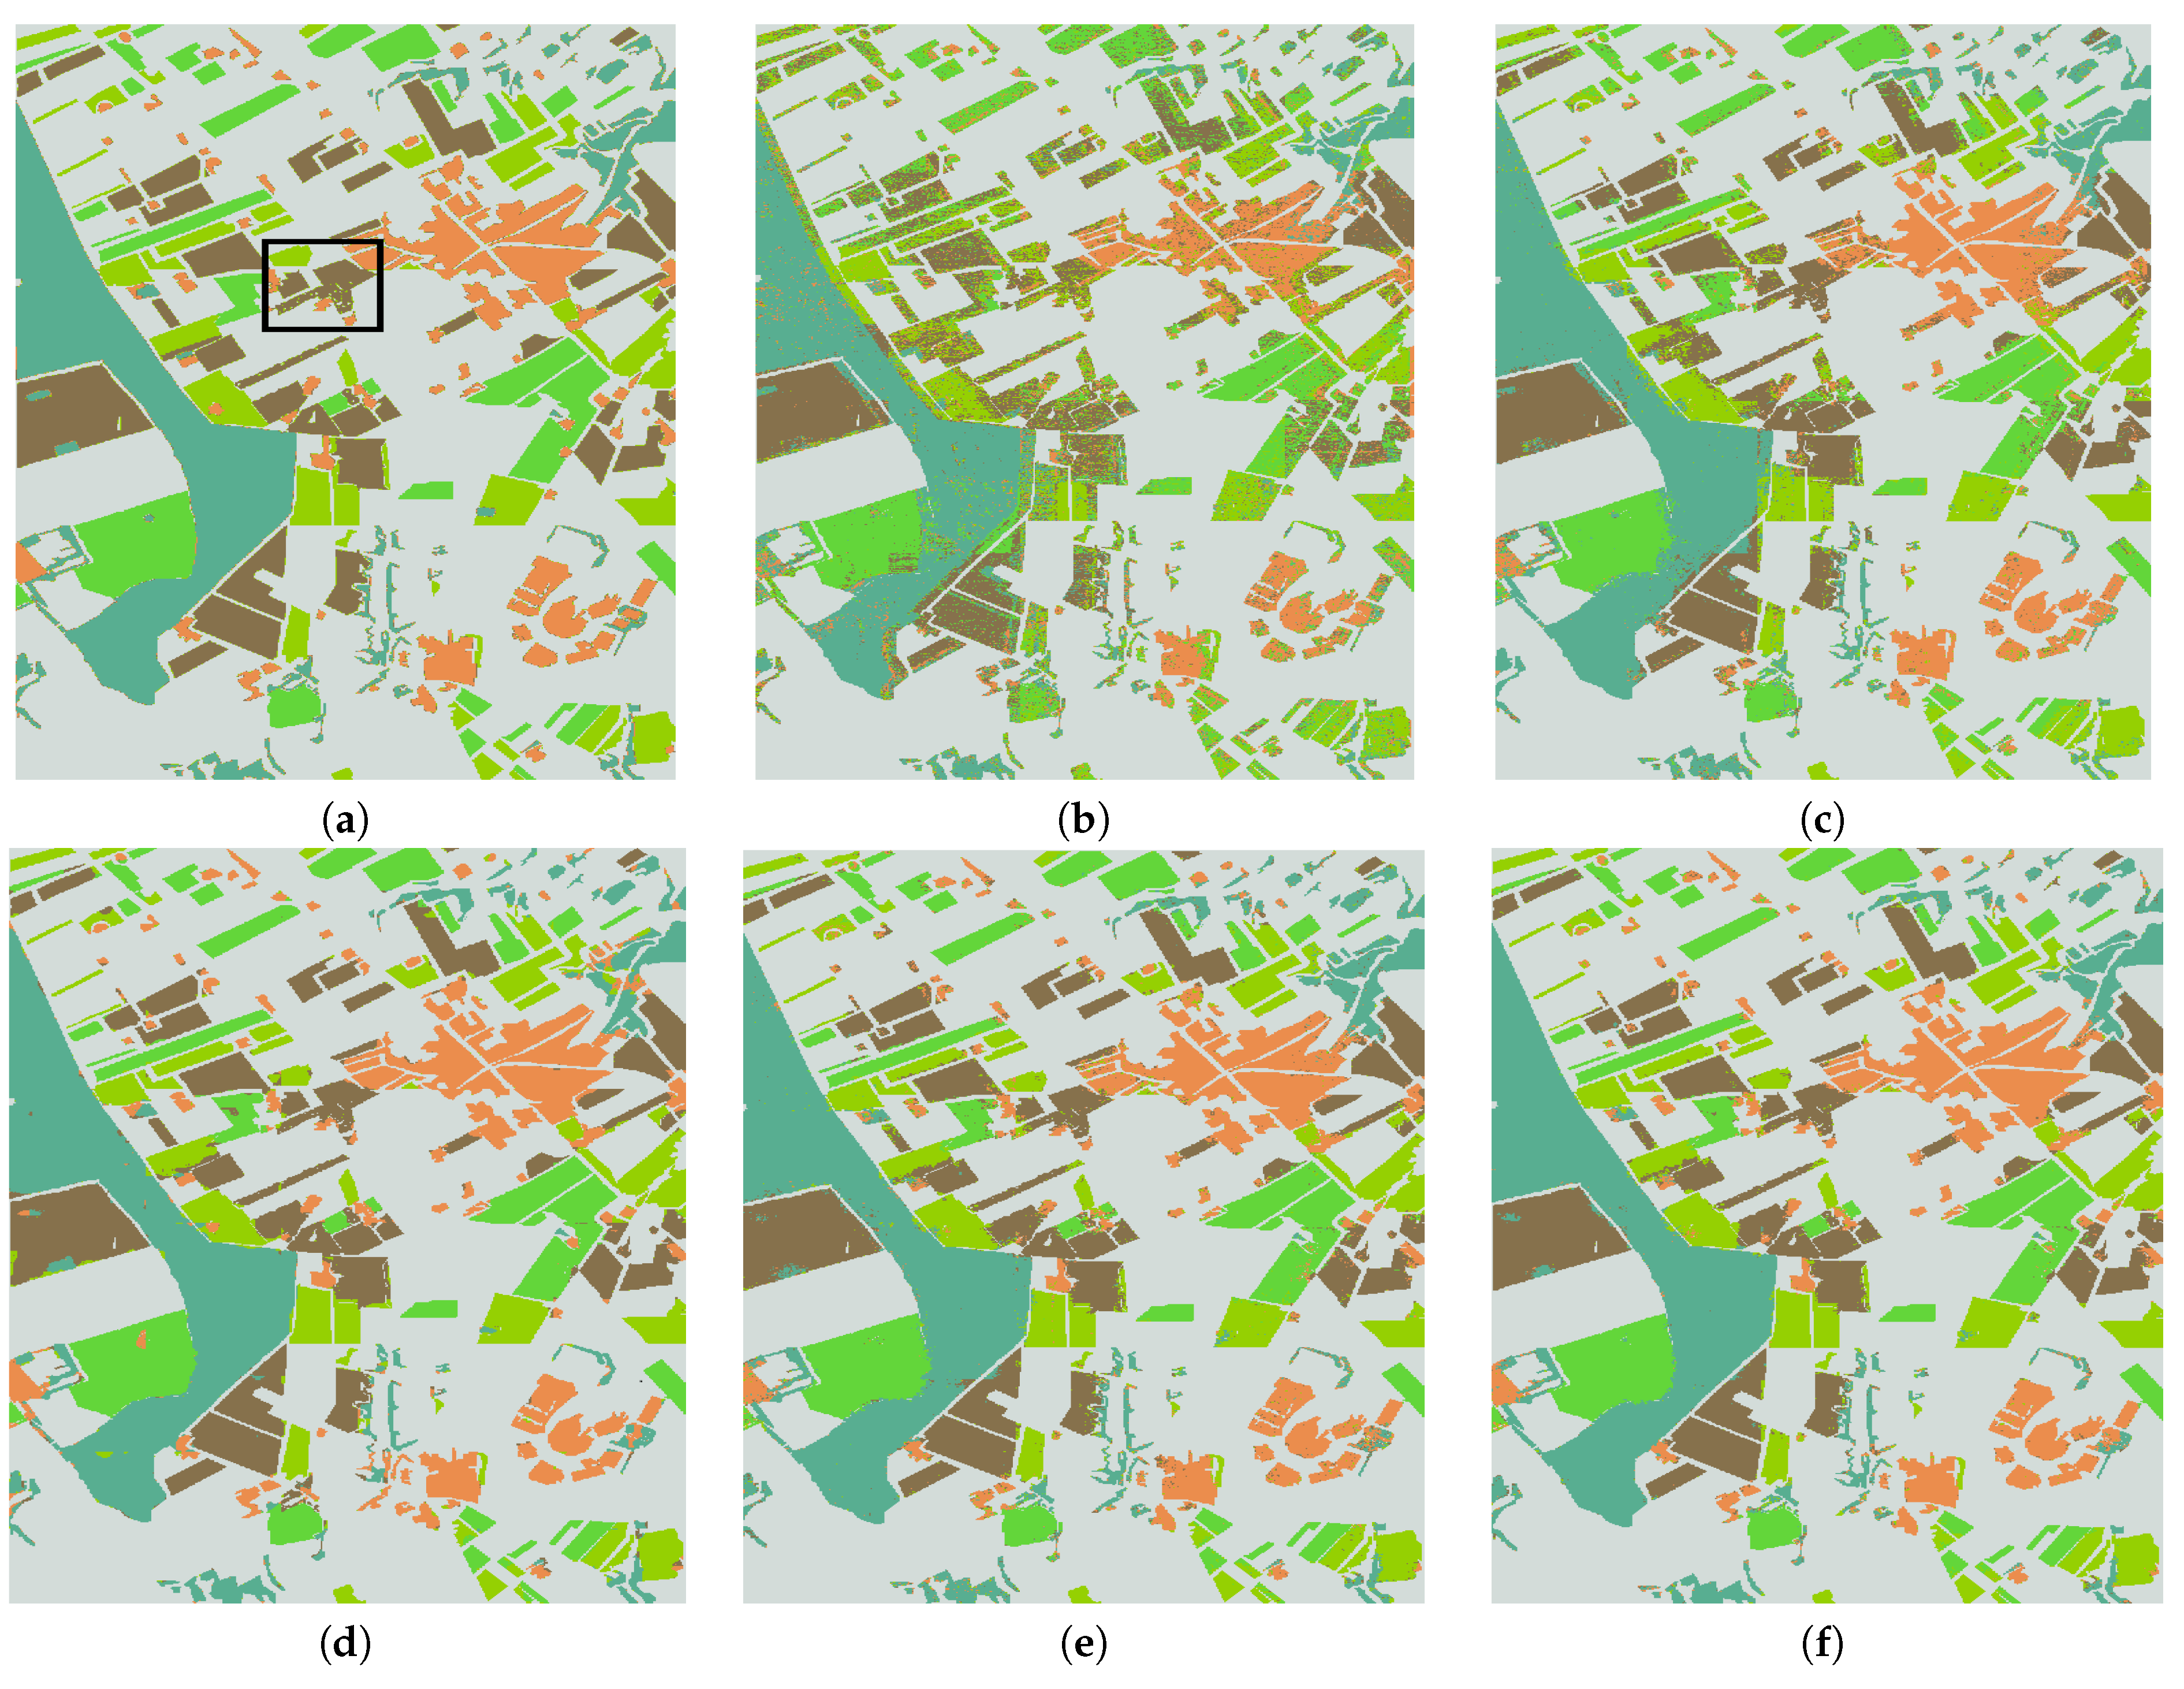
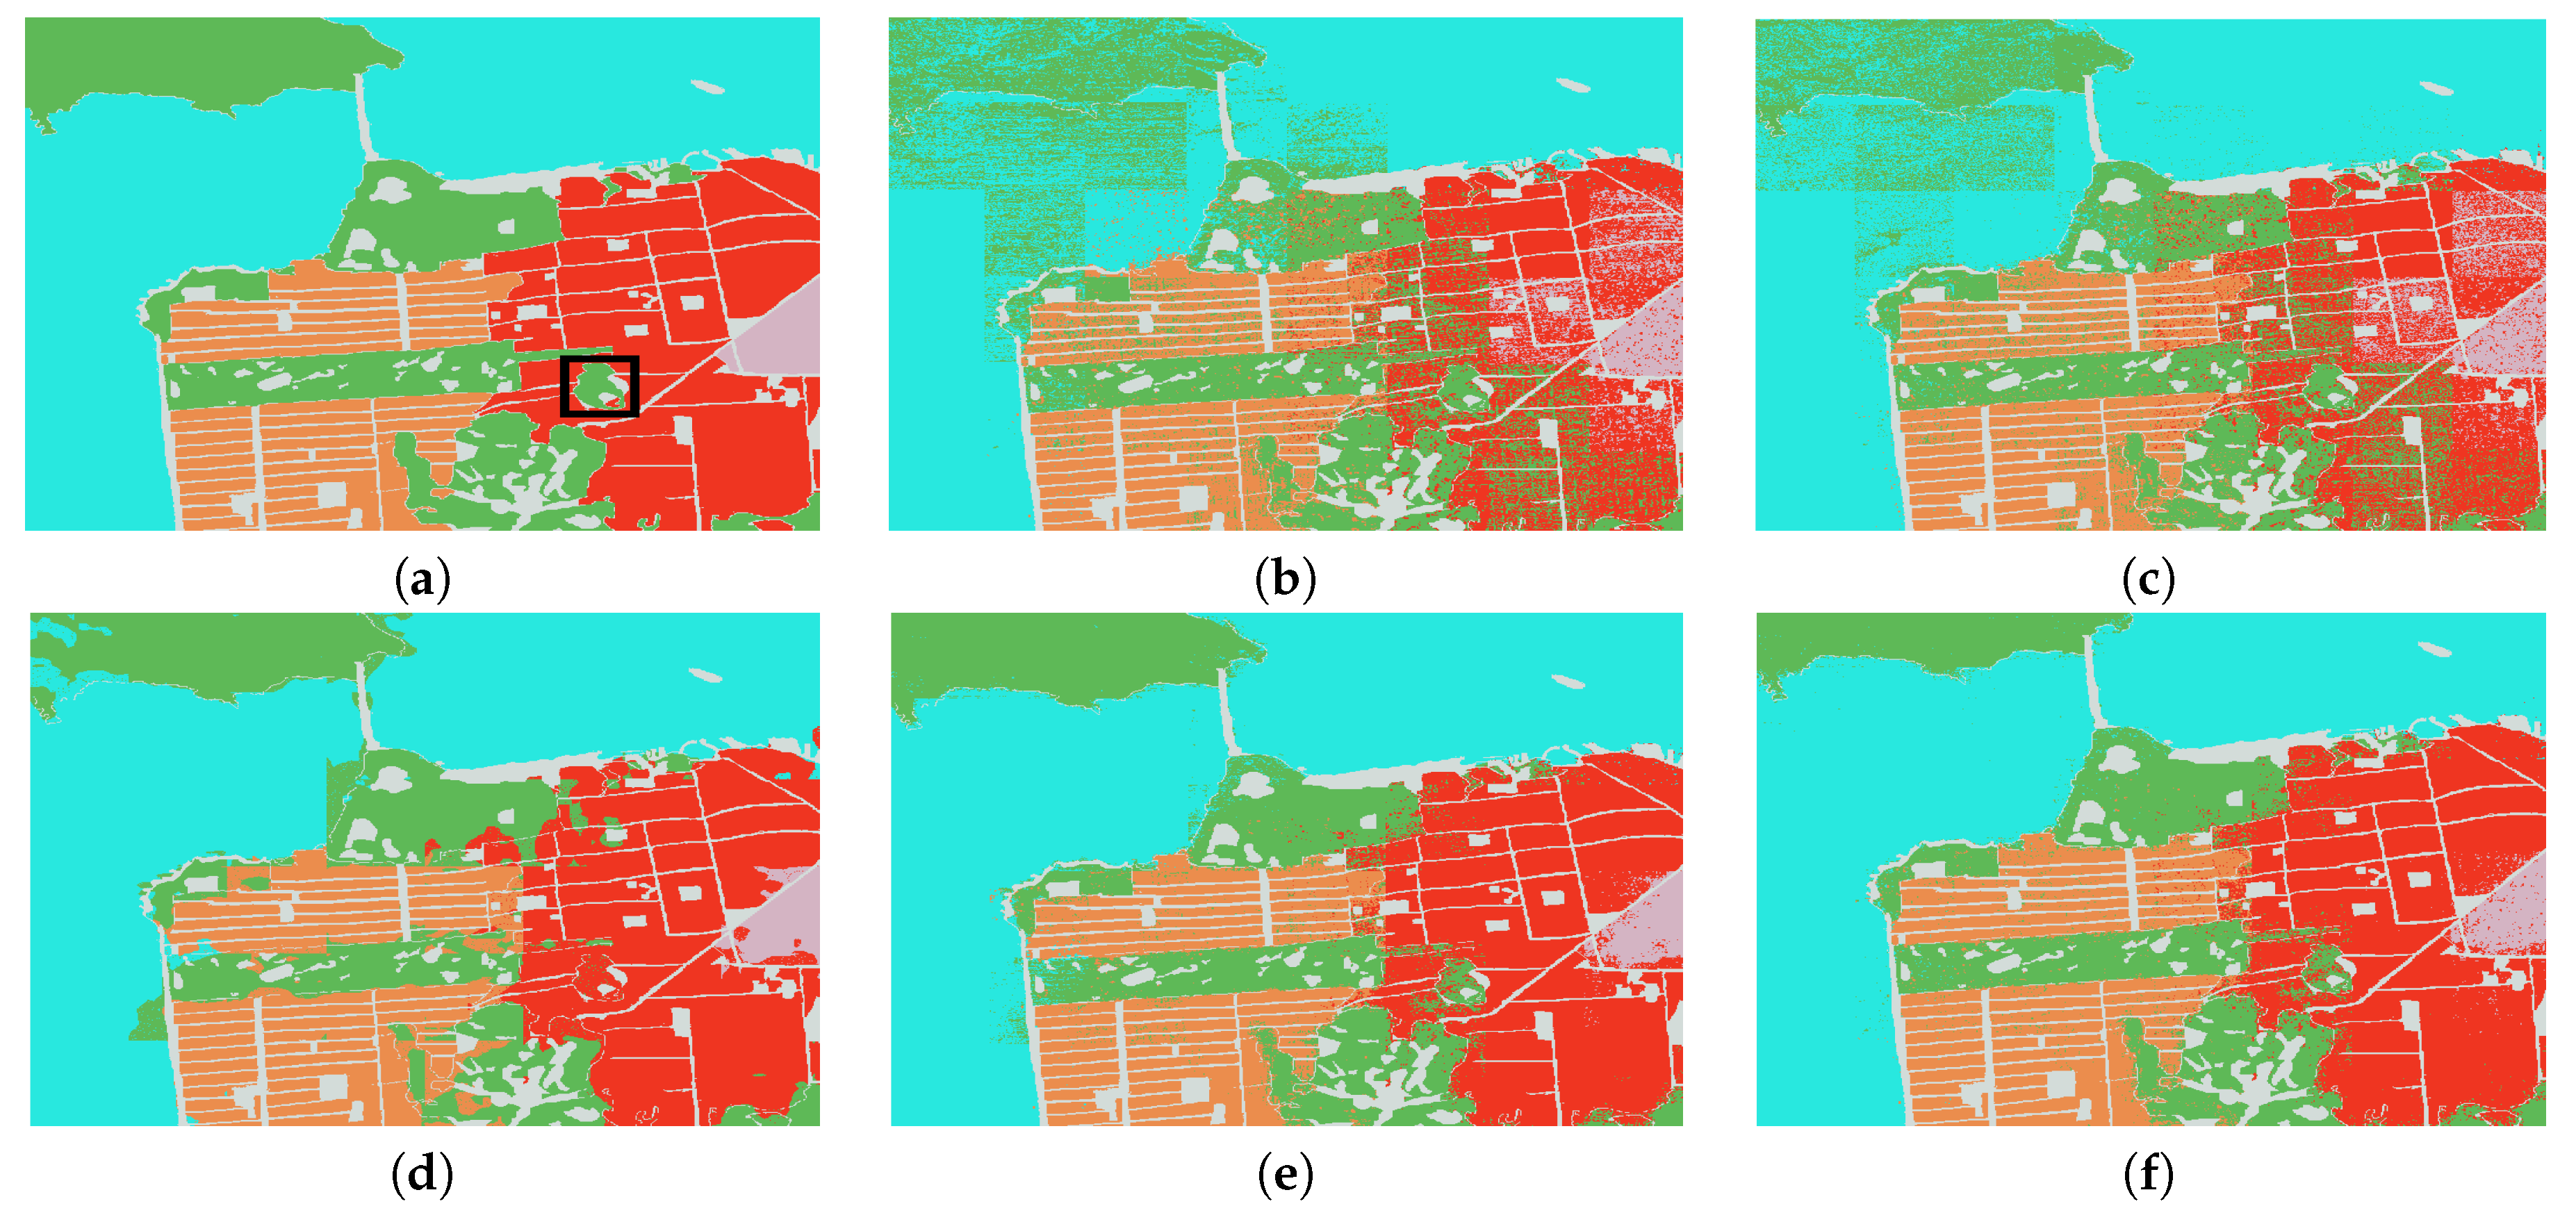
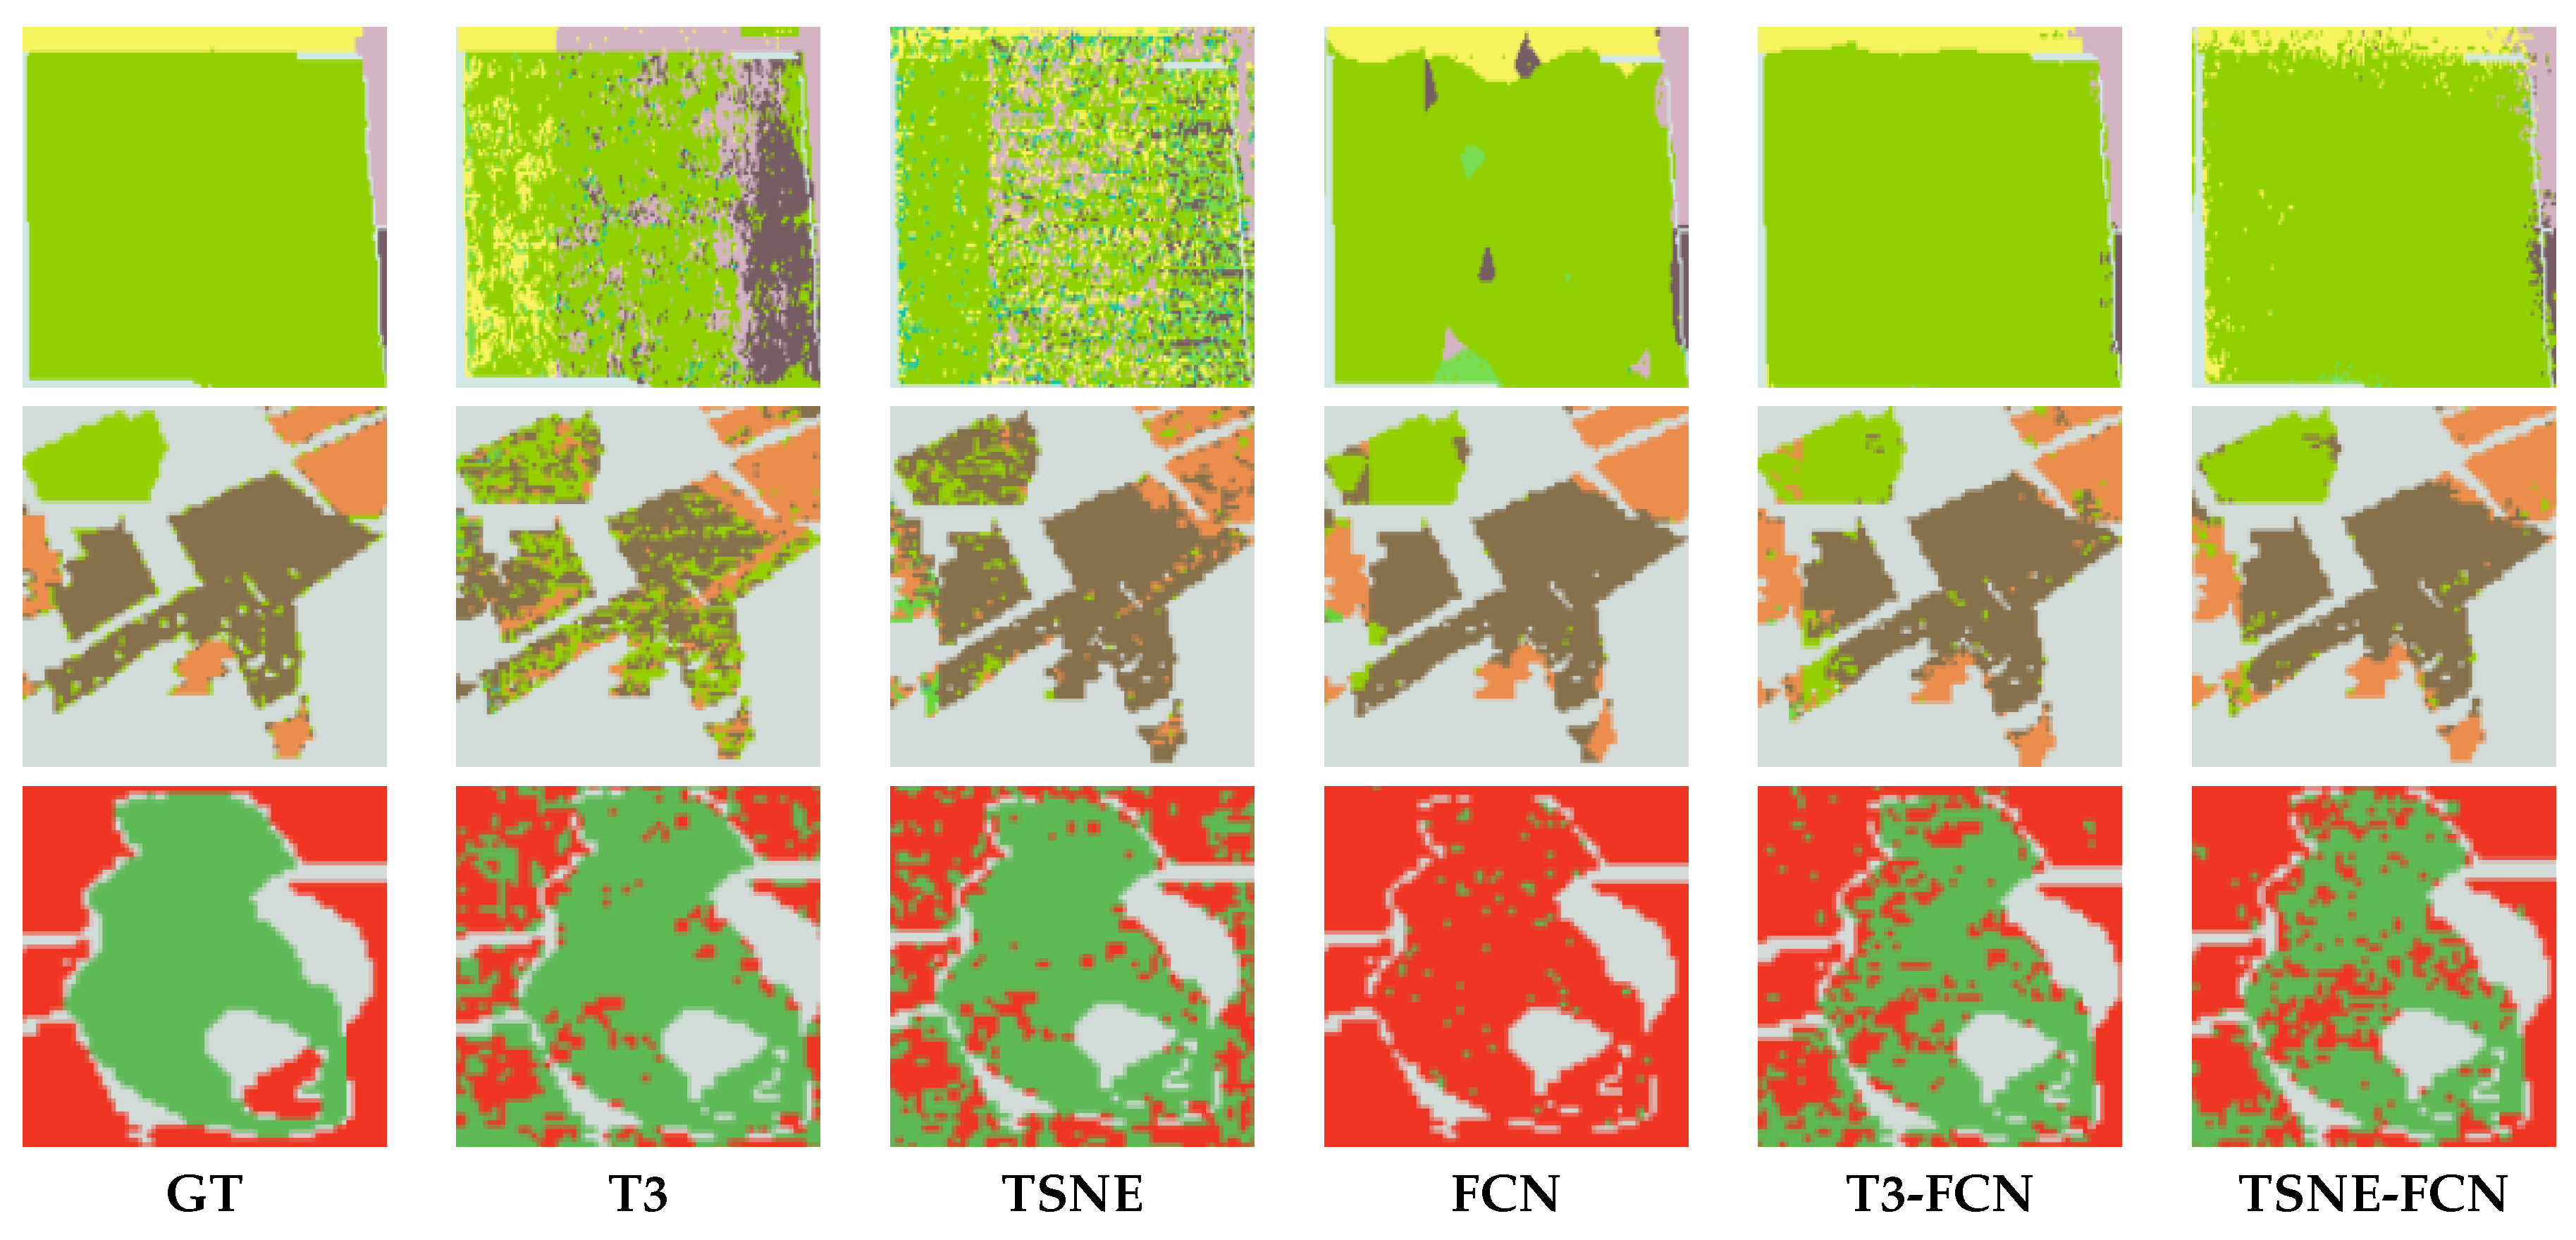
- The synergism of FCN and nonlinear manifold learning. From the experimental results of Flevoland and Foulum datasets, it can be found that a method that shows synergistic effect on one dataset may presents a totally different pattern on the other dataset. On the one hand, it is due to the property of data itself. But on the other hand, this also reflects the instability of the ‘collaborative’ method, such as T3-FCN. However, our method has been showing robust enhancement, which demonstrates the superiority of the proposed scheme.
- In fact, the success of our approach can provide a common framework to integrate any other existing approach that is consistent with our theory. We can substitute a better deep neural network for FCN, TSNE can also be replaced if the new manifold is good enough. However, most manifold methods are not explicitly expressed. Embedding manifold into neural networks through approximation for joint optimization can be a good direction. Current valuable work will lay a solid foundation for the research of automatic classification network.
5. Conclusions
Author Contributions
Funding
Conflicts of Interest
References
- Lee, J.S.; Pottier, E. Polarimetric Radar Imaging: From Basics to Applications; CRC Press: Boca Raton, FL, USA, 2009. [Google Scholar]
- Lee, J.S.; Grunes, M.R.; Pottier, E.; Ferro-Famil, L. Unsupervised terrain classification preserving polarimetric scattering characteristics. IEEE Trans. Geosci. Remote Sens. 2004, 42, 722–731. [Google Scholar]
- Kong, J.; Swartz, A.; Yueh, H.; Novak, L.; Shin, R. Identification of terrain cover using the optimum polarimetric classifier. J. Electromagn. Waves Appl. 1988, 2, 171–194. [Google Scholar]
- Novak, L.; Burl, M. Optimal speckle reduction in polarimetric SAR imagery. IEEE Trans. Aerosp. Electron. Syst. 1990, 26, 293–305. [Google Scholar] [CrossRef]
- Cloude, C.S. Group Theory and Polarisation Algebra. Optik 1986, 75, 26–36. [Google Scholar]
- Freeman, A.; Durden, S.L. A Three-Component Scattering Model for Polarimetric SAR Data. IEEE Trans. Geosci. Remote Sens. 2002, 36, 963–973. [Google Scholar] [CrossRef]
- Zhang, L.; Zhang, L.; Du, B. Deep learning for remote sensing data: A technical tutorial on the state of the art. IEEE Geosci. Remote Sens. Mag. 2016, 4, 22–40. [Google Scholar] [CrossRef]
- Hansch, R.; Hellwich, O. Classifcation of Polarimetric Sar Data by Complex Valued Neural Networks. 2014. Available online: https://www.isprs.org/proceedings/xxxviii/1_4_7-W5/paper/Haensch-147.pdf (accessed on 28 December 2019).
- He, C.; Liu, X.; Feng, D.; Shi, B.; Luo, B.; Liao, M. Hierarchical terrain classifcation based on multilayer bayesian network and conditional random feld. Remote Sens. 2017, 9, 96. [Google Scholar] [CrossRef]
- Sellami, A.; Farah, M.; Farah, I.R.; Solaiman, B. Hyperspectral imagery classification based on semi-supervised 3-D deep neural network and adaptive band selection. Expert Syst. Appl. 2019, 129, 246–259. [Google Scholar] [CrossRef]
- Li, Y.; Zhang, H.; Shen, Q. Spectral-spatial classification of hyperspectral imagery with 3D convolutional neural network. Remote Sens. 2017, 9, 67. [Google Scholar] [CrossRef]
- Goodman, J. Statistical Properties of Laser Speckle Patterns. In Laser Speckle and Related Phenomena; Springer: Berlin/Heidelberg, Germany, 1975. [Google Scholar]
- Lee, J.S. Speckle suppression and analysis for synthetic aperture radar images. In Proceedings of the International Conference on Speckle, San Diego, CA, USA, 20–23 August 1985. [Google Scholar]
- Song, H.; Yang, W.; Zhong, N.; Xu, X. Unsupervised Classification of PolSAR Imagery via Kernel Sparse Subspace Clustering. IEEE Geosci. Remote Sens. Lett. 2016, 13, 1487–1491. [Google Scholar] [CrossRef]
- Tu, S.T.; Chen, J.Y.; Yang, W.; Sun, H. Laplacian Eigenmaps-Based Polarimetric Dimensionality Reduction for SAR Image Classification. IEEE Trans. Geosci. Remote Sens. 2012, 50, 170–179. [Google Scholar] [CrossRef]
- Roweis, S.T.; Saul, L.K. Nonlinear dimensionality reduction by locally linear embedding. Science 2000, 290, 2323–2326. [Google Scholar] [CrossRef] [PubMed]
- Balasubramanian, M.; Schwartz, E.L. The Isomap Algorithm and Topological Stability. Science 2002, 295, 7. [Google Scholar] [CrossRef] [PubMed]
- Ainsworth, T.L.; Lee, J.S. Optimal Polarimetric Decomposition Variables-non-linear Dimensionality Reduction. In Proceedings of the IGARSS 2001—IEEE 2001 International Geoscience and Remote Sensing Symposium (Cat. No.01CH37217), Sydney, Australia, 9–13 July 2001; pp. 928–930. [Google Scholar]
- Ainsworth, T.L.; Lee, J.S. Polarimetric SAR Image Classification Exploiting Optimal Variables Derived from Multiple Image Data Sets. In Proceedings of the IGARSS 2004, 2004 IEEE International Geoscience and Remote Sensing Symposium, Anchorage, AK, USA, 20–24 September 2004; pp. 188–191. [Google Scholar]
- Belkin, M.; Niyogi, P. Laplacian Eigenmaps for Dimensionality Reduction and Data Representation. Neural Comput. 2003, 15, 1373–1396. [Google Scholar] [CrossRef]
- Shi, L.; Zhang, L.; Yang, J.; Zhang, L.; Li, P. Supervised Graph Embedding for Polarimetric SAR Image Classification. IEEE Geosci. Remote Sens. Lett. 2013, 10, 216–220. [Google Scholar] [CrossRef]
- Mhaskar, H. Approximation properties of a multilayered feedforward artifcial neural network. Adv. Comput. Math. 1993, 1, 61–80. [Google Scholar] [CrossRef]
- Olah, C. Neural Networks, Manifolds, and Topology. Available online: https://colah.github.io/posts/2014-03-NN-Manifolds-Topology/ (accessed on 10 January 2020).
- Wang, Y.; He, C.; Liu, X.; Liao, M. A hierarchical fully convolutional network integrated with sparse and low-rank subspace representations for polsar imagery classifcation. Remote Sens. 2018, 10, 342. [Google Scholar] [CrossRef]
- Jonathan, L.; Evan, S.; Trevor, D. Fully convolutional networks for semantic segmentation. In Proceedings of the IEEE Conference on Computer Vision and Pattern Recognition, Boston, MA, USA, 7–12 June 2015; pp. 3431–3440. [Google Scholar]
- Yamaguchi, Y.; Moriyama, T.; Ishido, M.; Yamada, H. Four-component scattering model for polarimetric SAR image decomposition. IEEE Trans. Geosci. Remote Sens. 2005, 43, 1699–1706. [Google Scholar] [CrossRef]
- Hinton, G. Visualizing high-dimensional data using t-sne. Vigiliae Christ. 2008, 9, 2579–2605. [Google Scholar]
- Bengio, Y. Deep Learning of Representations for Unsupervised and Transfer Learning. JMLR: Workshop Conf. Proc. 2012, 27, 17–36. [Google Scholar]



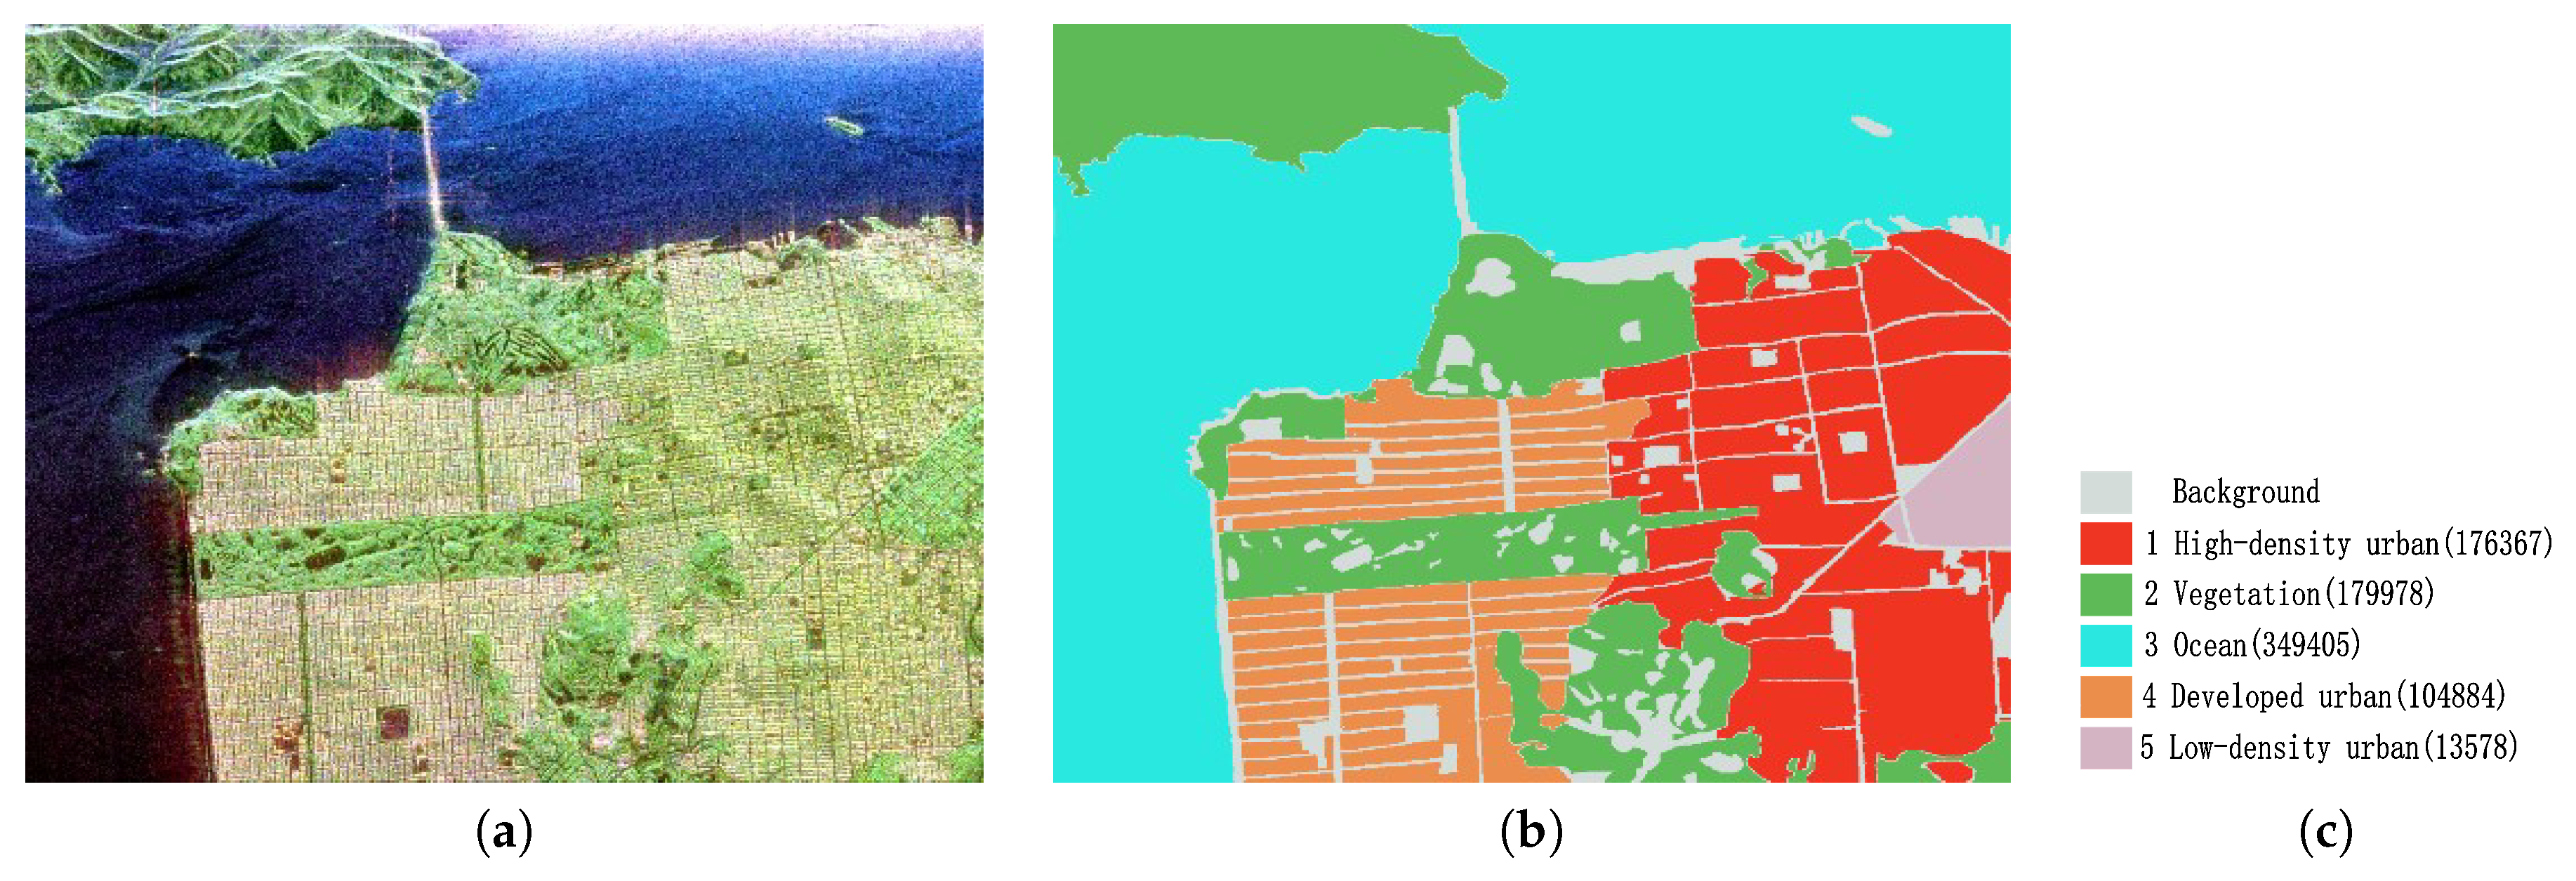
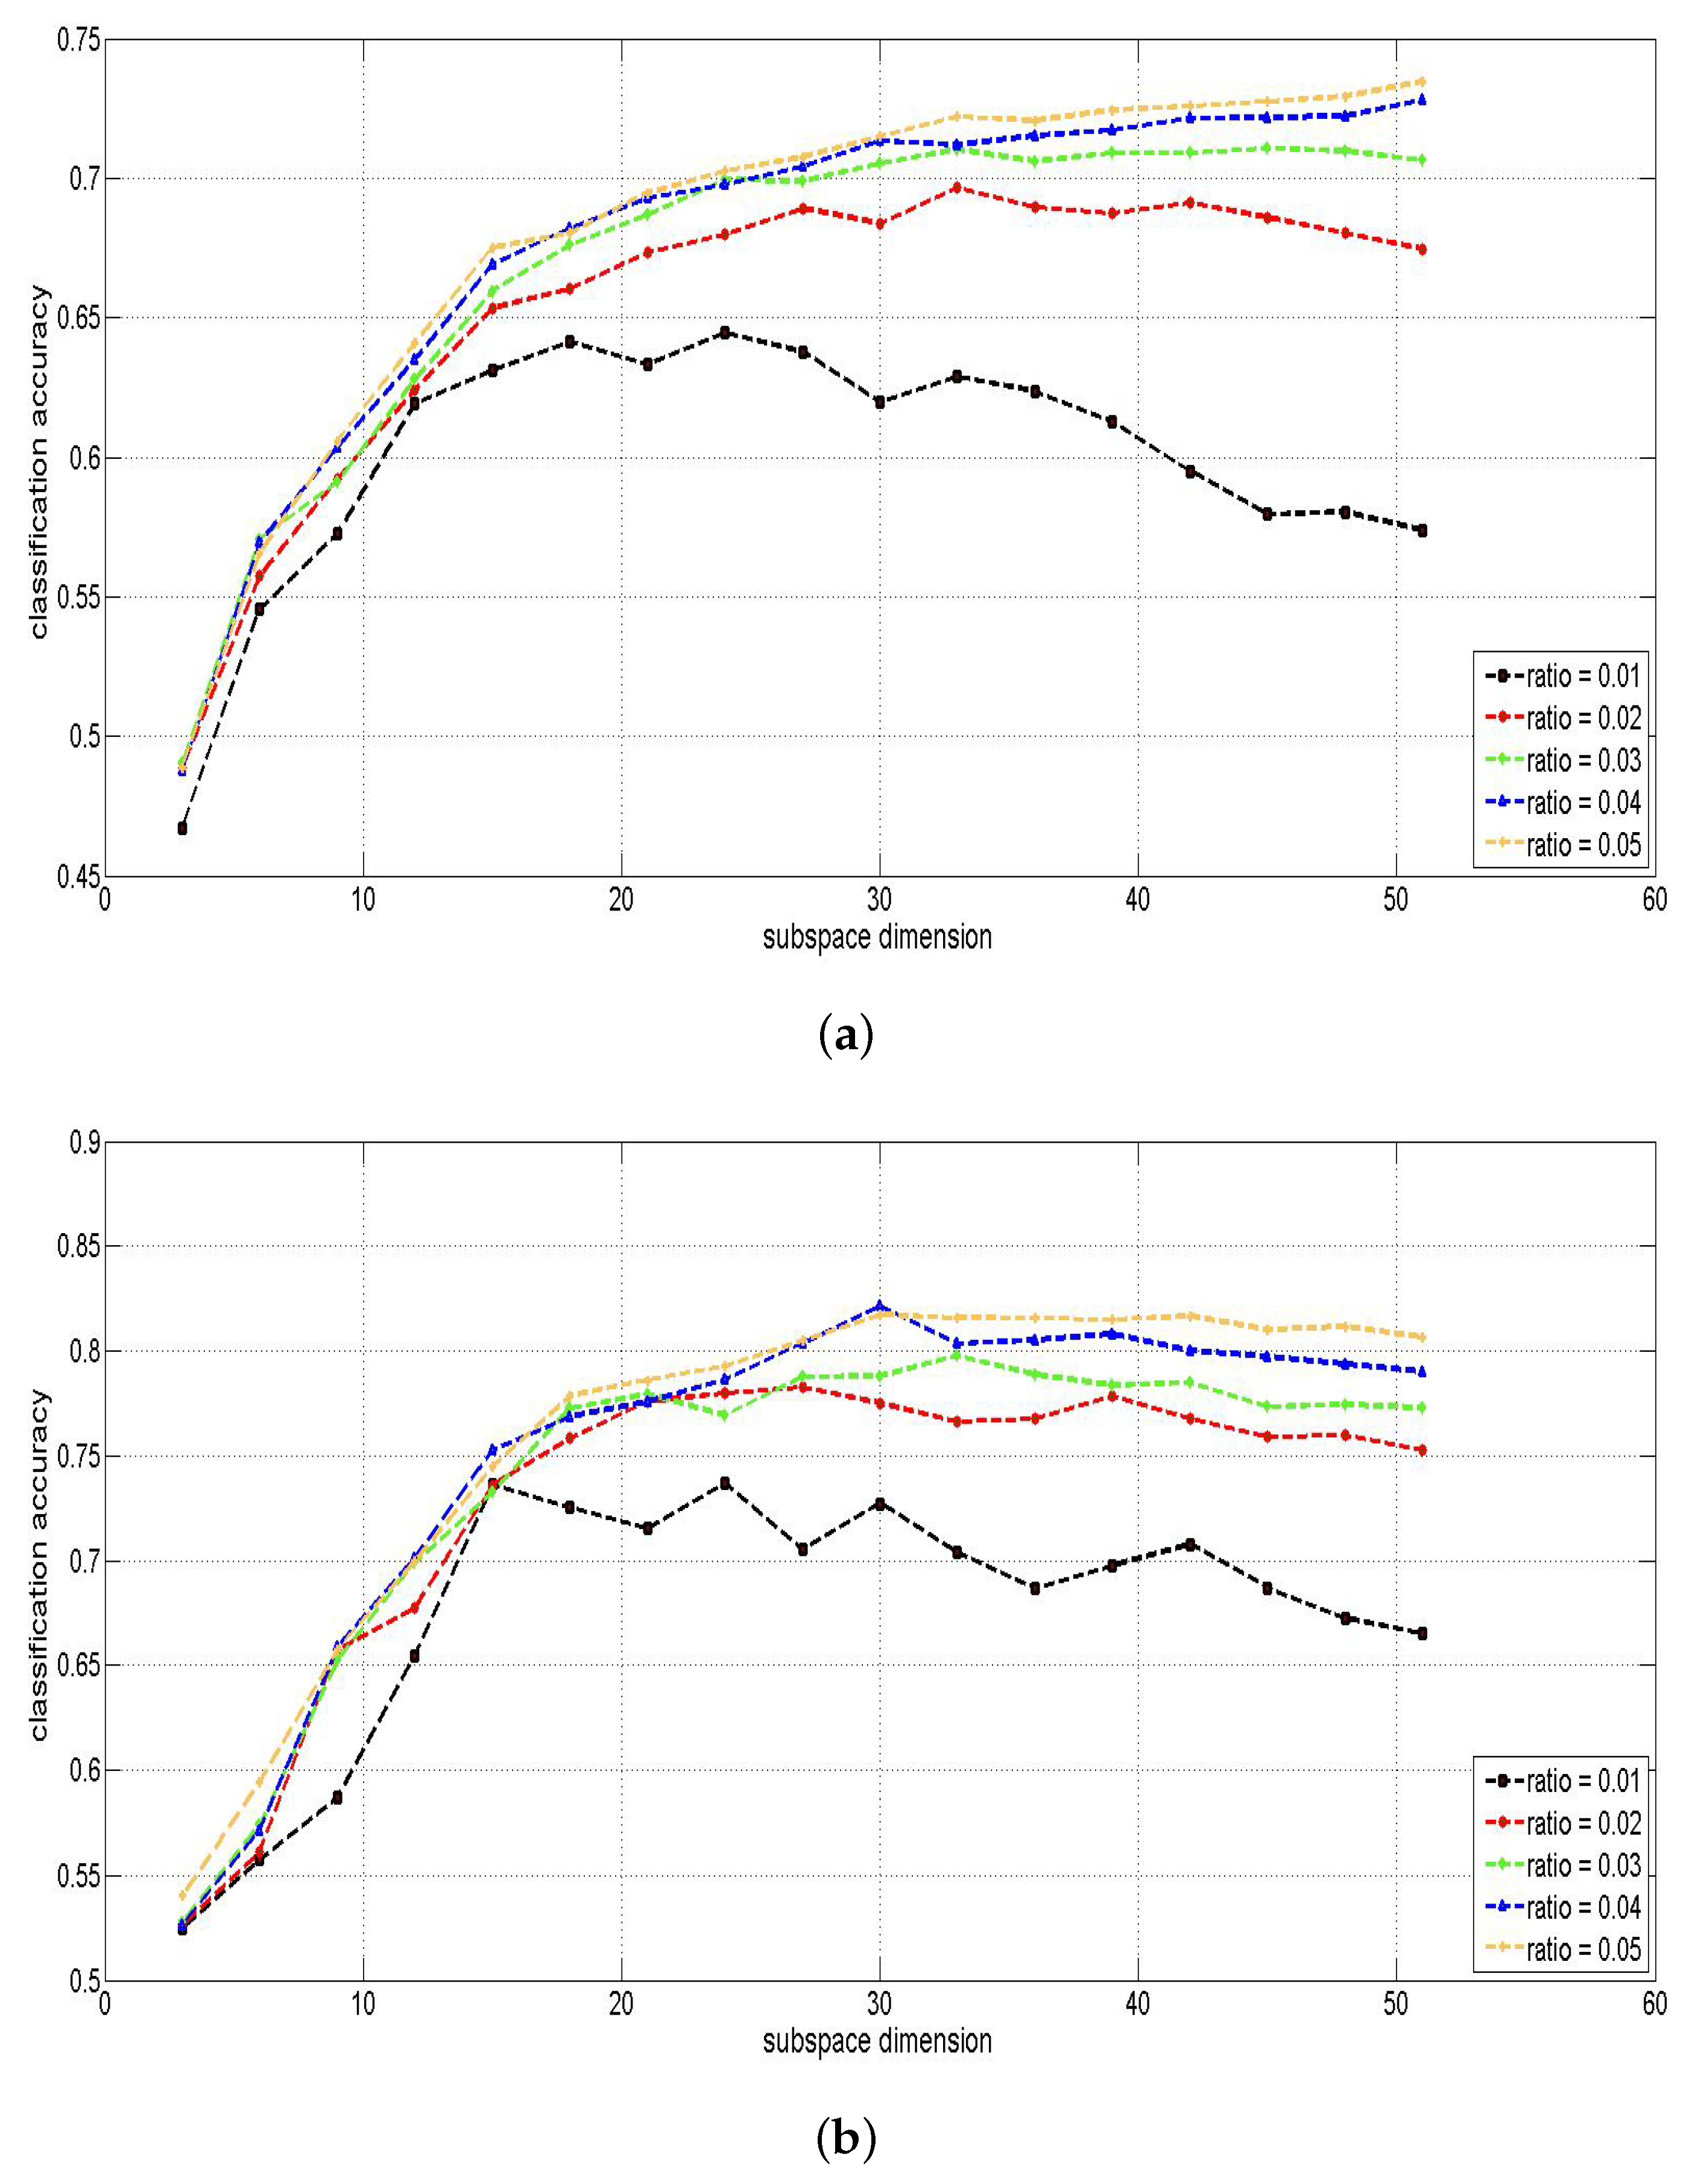
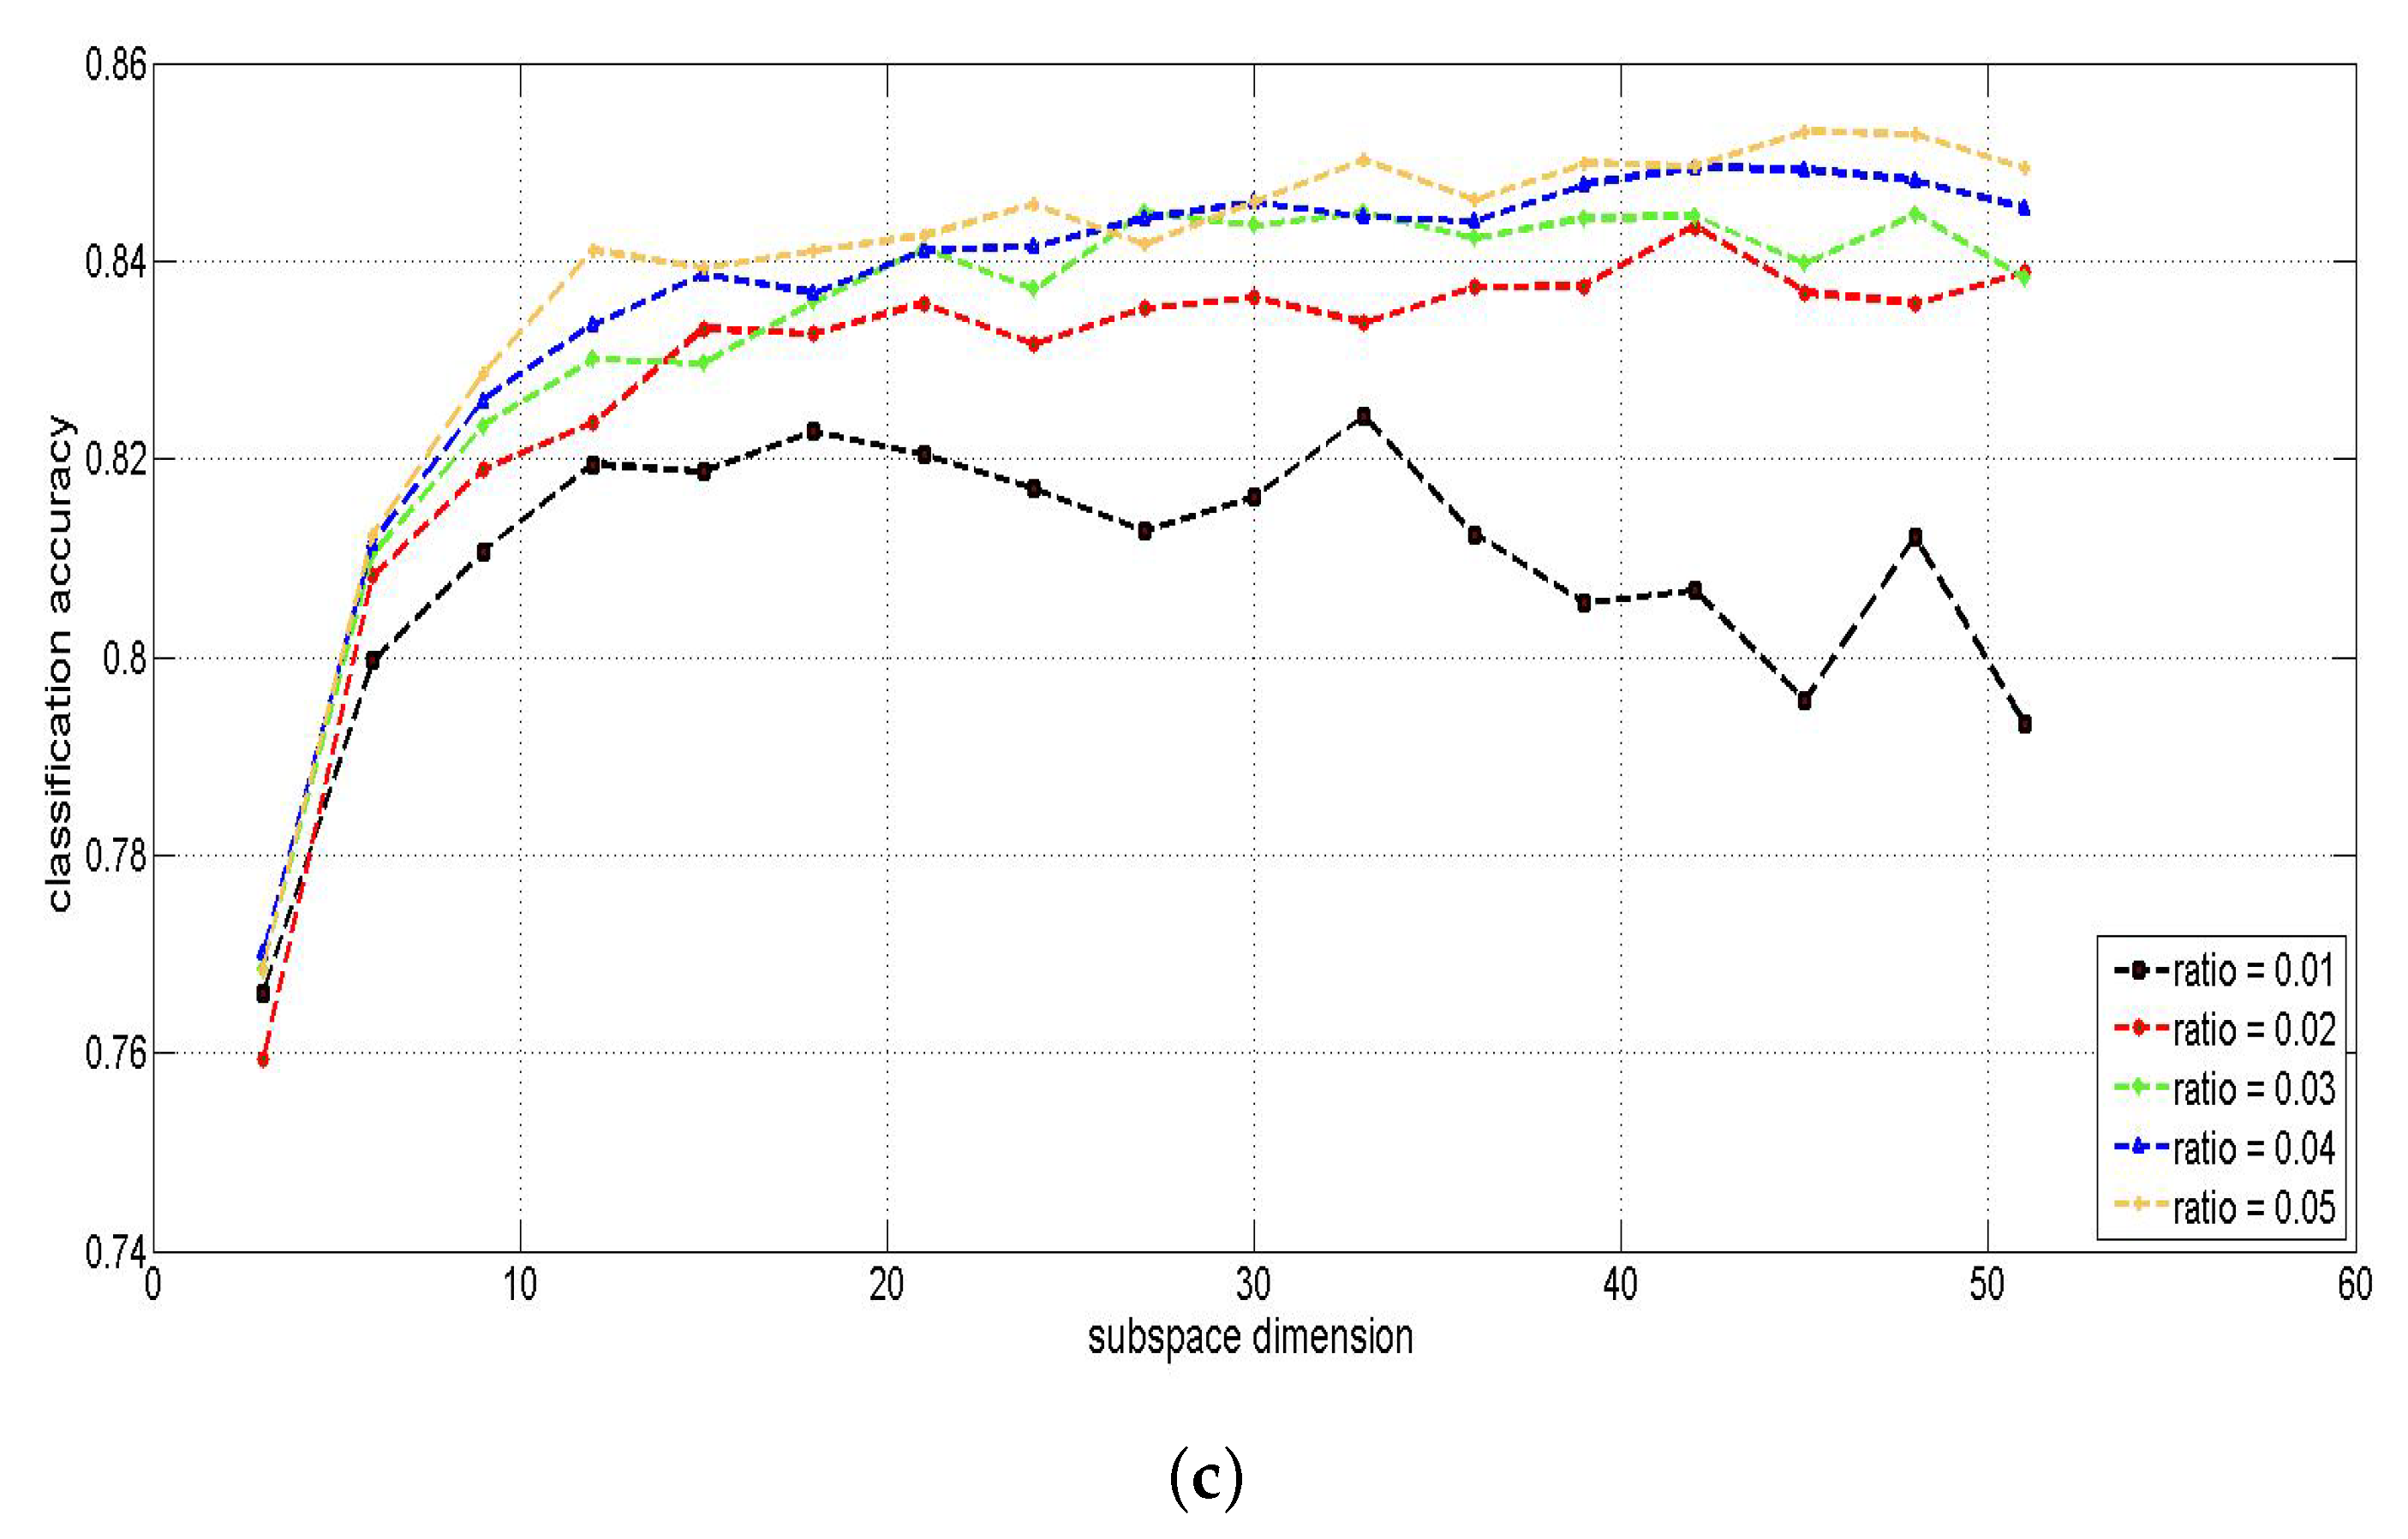
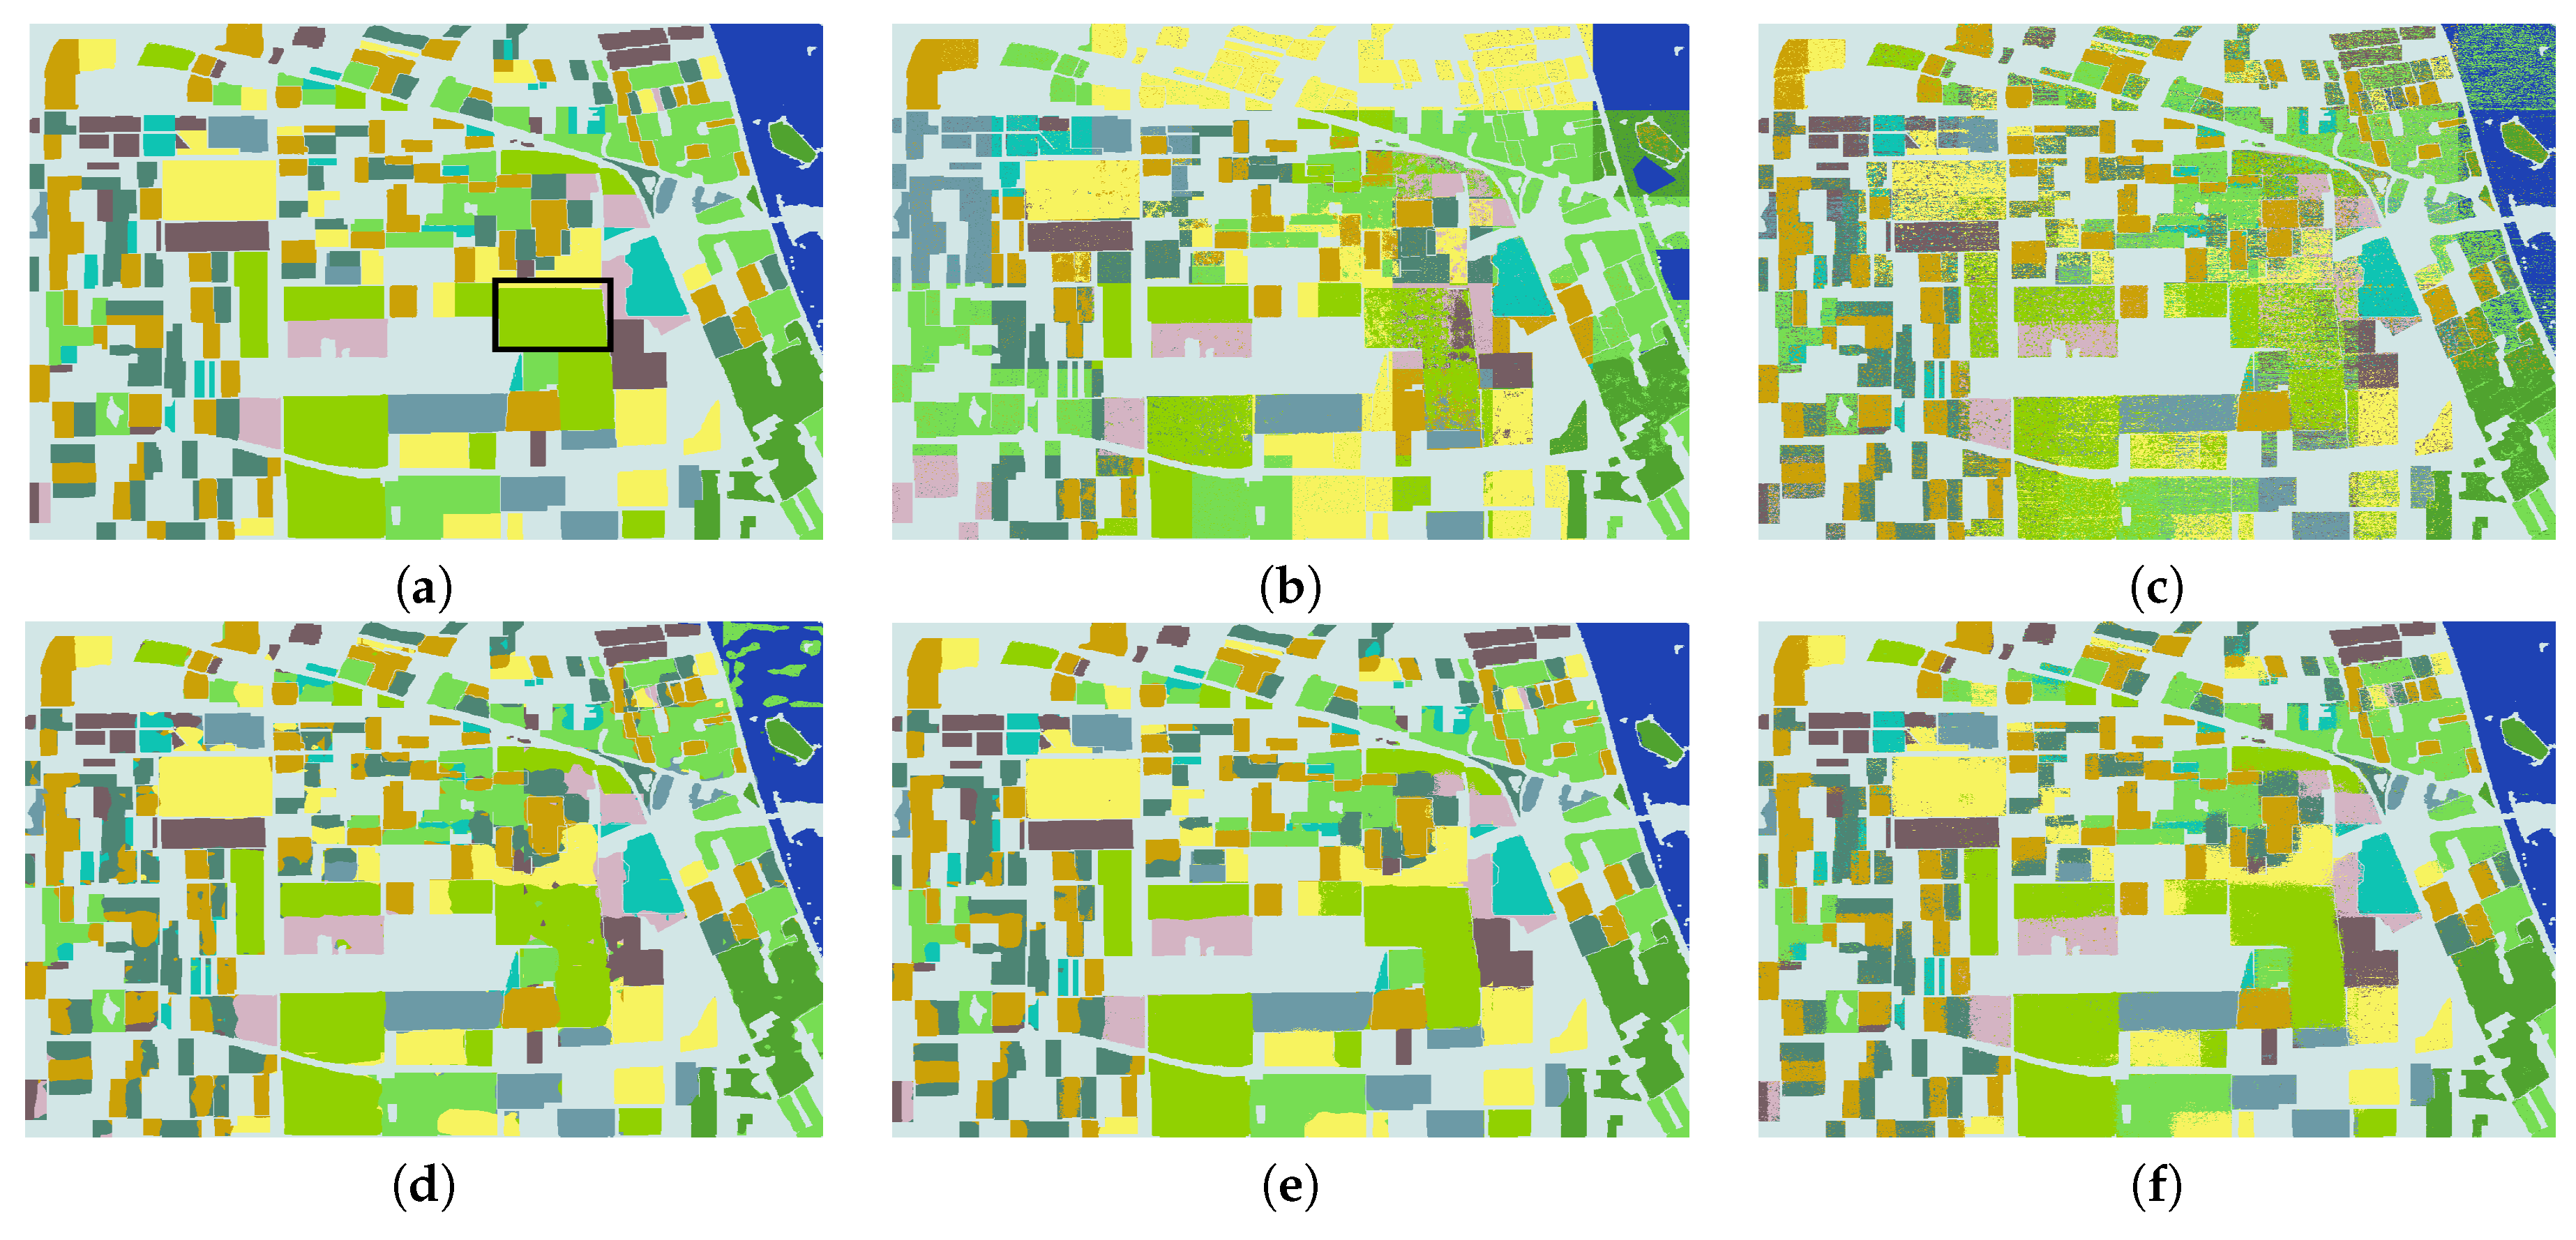
| Category | Method | Optimization |
|---|---|---|
| Global Manifold | Multi-Dimensional Scaling | |
| Isometric Mapping | ||
| Local Manifold | Locally Linear Embedding | |
| Local Tangent Space Alignment | ||
| Laplacian Eigenmap | ||
| Global and local equilibrium | TSNE |
| Categories | T3 | TSNE | FCN | T3-FCN | TSNE-FCN |
|---|---|---|---|---|---|
| 1/rapeseed | 70.16 | 64.20 | 95.61 | 97.40 | 93.89 |
| 2/grassland | 68.84 | 71.09 | 93.49 | 96.71 | 95.40 |
| 3/forest | 80.09 | 86.25 | 96.58 | 99.05 | 98.35 |
| 4/pea | 74.24 | 69.82 | 93.06 | 94.70 | 92.14 |
| 5/alfalfa | 58.30 | 70.48 | 96.36 | 97.76 | 95.65 |
| 6/wheat | 60.21 | 65.83 | 96.26 | 98.84 | 96.90 |
| 7/beet | 28.81 | 55.14 | 89.33 | 93.39 | 88.75 |
| 8/bare land | 33.31 | 67.11 | 95.09 | 97.53 | 95.45 |
| 9/stem bean | 45.44 | 69.60 | 88.91 | 93.66 | 86.42 |
| 10/water | 58.91 | 73.86 | 86.31 | 99.88 | 99.91 |
| 11/potato | 36.76 | 87.51 | 94.67 | 95.44 | 94.19 |
| OA | 54.10 | 70.92 | 93.58 | 96.76 | 94.48 |
| Kappa | 0.4843 | 0.6720 | 0.9275 | 0.9634 | 0.9377 |
| Categories | T3 | TSNE | FCN | T3-FCN | TSNE-FCN |
|---|---|---|---|---|---|
| 1/high-density urban area | 69.48 | 71.21 | 93.08 | 95.20 | 95.72 |
| 2/vegetation | 77.33 | 79.84 | 82.66 | 91.97 | 93.64 |
| 3/ocean | 86.28 | 91.91 | 96.73 | 99.04 | 99.57 |
| 4/developed urban area | 88.32 | 90.42 | 93.39 | 95.53 | 96.03 |
| 5/low-density urban area | 88.57 | 84.38 | 83.53 | 82.46 | 86.09 |
| OA | 81.03 | 84.53 | 92.23 | 95.96 | 96.77 |
| Kappa | 0.7363 | 0.7838 | 0.8908 | 0.9430 | 0.9546 |
| Categories | T3 | TSNE | FCN | T3-FCN | TSNE-FCN |
|---|---|---|---|---|---|
| 1/broad-leaved crop | 60.20 | 82.53 | 97.84 | 95.45 | 97.18 |
| 2/fine-stem crop | 49.76 | 68.98 | 83.88 | 82.17 | 84.14 |
| 3/bare land | 61.93 | 81.65 | 89.86 | 89.03 | 89.97 |
| 4/town | 55.37 | 71.57 | 90.12 | 83.46 | 87.38 |
| 5/forest | 73.60 | 88.78 | 92.88 | 94.08 | 95.49 |
| OA | 61.71 | 80.05 | 91.06 | 89.49 | 91.31 |
| Kappa | 0.5157 | 0.7468 | 0.8868 | 0.8667 | 0.8899 |
| Classes | Rapeseed | Grassland | Forest | Pea | Alfalfa | Wheat | Beet | Bare Land | Stem Bean | Water | Potato |
|---|---|---|---|---|---|---|---|---|---|---|---|
| rapeseed | 93.89 | 1.25 | 0 | 0.24 | 0.63 | 1.44 | 1.26 | 0.61 | 0.16 | 0 | 0.52 |
| grassland | 0.71 | 95.40 | 0.19 | 0.03 | 0.21 | 0.61 | 0.96 | 0.31 | 0.61 | 0.04 | 0.92 |
| forest | 0.05 | 0.69 | 98.35 | 0 | 0.21 | 0.04 | 0.24 | 0.01 | 0.01 | 0.15 | 0.26 |
| pea | 0.96 | 0.20 | 0.01 | 92.14 | 0.02 | 2.12 | 2.60 | 0.61 | 0.82 | 0 | 0.53 |
| alfalfa | 0.96 | 0.64 | 0.15 | 0 | 95.65 | 1.37 | 0.30 | 0.35 | 0.15 | 0 | 0.44 |
| wheat | 0.93 | 0.50 | 0 | 0.52 | 0.48 | 96.90 | 0.13 | 0.22 | 0.02 | 0 | 0.28 |
| beet | 1.36 | 1.70 | 0.11 | 0.52 | 0.12 | 0.51 | 88.75 | 0.54 | 0.88 | 0.02 | 5.49 |
| bare land | 1.12 | 0.83 | 0.01 | 0.35 | 0.27 | 0.62 | 0.65 | 95.45 | 0.11 | 0 | 0.59 |
| stem bean | 0.58 | 3.41 | 0 | 0.60 | 0.07 | 0.33 | 4.73 | 0.69 | 86.42 | 0 | 3.17 |
| water | 0.02 | 0.04 | 0.01 | 0 | 0 | 0 | 0.02 | 0 | 0 | 99.91 | 0 |
| potato | 0.29 | 0.73 | 0.06 | 0.16 | 0.12 | 0.14 | 3.42 | 0.22 | 0.65 | 0.01 | 94.19 |
| Classes | Broad-Leaved Crop | Fine-Stem Crop | Bare Land | Town | Forest |
|---|---|---|---|---|---|
| broad-leaved crop | 97.18 | 1.18 | 0.57 | 0.50 | 0.57 |
| fine-stem crop | 1.40 | 84.14 | 7.21 | 4.21 | 3.04 |
| bare land | 0.45 | 2.49 | 89.97 | 4.18 | 2.91 |
| town | 0.92 | 3.14 | 4.00 | 87.38 | 4.56 |
| forest | 0.43 | 1.39 | 1.14 | 1.55 | 95.49 |
| Classes | High-Density Urban Area | Vegetation | Ocean | Developed Urban Area | Low-Density Urban Area |
|---|---|---|---|---|---|
| high-density urban area | 95.72 | 2.81 | 0.06 | 0.95 | 0.47 |
| vegetation | 3.16 | 93.64 | 1.21 | 1.99 | 0 |
| ocean | 0.03 | 0.37 | 99.57 | 0.03 | 0 |
| developed urban area | 0.67 | 3.21 | 0.10 | 96.03 | 0 |
| low-density urban area | 13.91 | 0 | 0 | 0 | 86.09 |
© 2020 by the authors. Licensee MDPI, Basel, Switzerland. This article is an open access article distributed under the terms and conditions of the Creative Commons Attribution (CC BY) license (http://creativecommons.org/licenses/by/4.0/).
Share and Cite
He, C.; Tu, M.; Xiong, D.; Liao, M. Nonlinear Manifold Learning Integrated with Fully Convolutional Networks for PolSAR Image Classification. Remote Sens. 2020, 12, 655. https://doi.org/10.3390/rs12040655
He C, Tu M, Xiong D, Liao M. Nonlinear Manifold Learning Integrated with Fully Convolutional Networks for PolSAR Image Classification. Remote Sensing. 2020; 12(4):655. https://doi.org/10.3390/rs12040655
Chicago/Turabian StyleHe, Chu, Mingxia Tu, Dehui Xiong, and Mingsheng Liao. 2020. "Nonlinear Manifold Learning Integrated with Fully Convolutional Networks for PolSAR Image Classification" Remote Sensing 12, no. 4: 655. https://doi.org/10.3390/rs12040655
APA StyleHe, C., Tu, M., Xiong, D., & Liao, M. (2020). Nonlinear Manifold Learning Integrated with Fully Convolutional Networks for PolSAR Image Classification. Remote Sensing, 12(4), 655. https://doi.org/10.3390/rs12040655


