Article

Airborne Tree Crown Detection for Predicting Spatial Heterogeneity of Canopy Transpiration in a Tropical Rainforest

1
Tropical Silviculture and Forest Ecology, University of Goettingen, Buesgenweg 1, 37077 Goettingen, Germany
2
Forest Management, campus Darmaga Bogor Jawa Barat, Bogor Agricultural University, Bogor 16680, Indonesia
3
Centre of Biodiversity and Sustainable Land Use, University of Goettingen, Buesgenweg 1, 37077 Goettingen, Germany
*
Author to whom correspondence should be addressed.
Remote Sens. 2020, 12(4), 651; https://doi.org/10.3390/rs12040651
Submission received: 9 January 2020 / Revised: 11 February 2020 / Accepted: 12 February 2020 / Published: 16 February 2020
(This article belongs to the Special Issue 3D Forest Structure Observation)

Abstract

:
Tropical rainforests comprise complex 3D structures and encompass heterogeneous site conditions; their transpiration contributes to climate regulation. The objectives of our study were to test the relationship between tree water use and crown metrics and to predict spatial variability of canopy transpiration across sites. In a lowland rainforest of Sumatra, we measured tree water use with sap flux techniques and simultaneously assessed crown metrics with drone-based photogrammetry. We observed a close linear relationship between individual tree water use and crown surface area (R2 = 0.76, n = 42 trees). Uncertainties in predicting stand-level canopy transpiration were much lower using tree crown metrics than the more conventionally used stem diameter. 3D canopy segmentation analyses in combination with the tree crown–water use relationship predict substantial spatial heterogeneity in canopy transpiration. Among our eight study plots, there was a more than two-fold difference, with lower transpiration at riparian than at upland sites. In conclusion, we regard drone-based canopy segmentation and crown metrics to be very useful tools for the scaling of transpiration from tree- to stand-level. Our results indicate substantial spatial variation in crown packing and thus canopy transpiration of tropical rainforests.

Graphical Abstract

1. Introduction

Tropical rainforests comprise a complex 3D structure, rich tree species diversity and encompass heterogeneous site conditions [1,2]. Transpiration (Et) is a central flux in hydrological cycles and contributes to cloud formation, turbulence and atmospheric cooling [3], and is thus an ecosystem service related to climate regulation. The prediction of canopy Et by tropical rainforests including its spatial heterogeneity may be fostered by a better understanding of the linkage between structure and function and forest structure variability across sites.
Rainforest Et can be derived from sap flux measurements in individual trees. Therein, tree-level Et is scaled-up to the stand-level by using allometric relationships with stand inventory variables such as tree diameter at breast height (DBH) [4]. Due to often relatively high unexplained variability in the DBH to water use relationship, resulting uncertainties of Et at the stand-level are also relatively high. In a tropical agroforest, Ahongshangbam et al. [5] found that drone-derived crown metrics correlated much better with tree water use than DBH. In consequence, uncertainties associated with the scaling to stand-level Et were reduced considerably. However, the studied stands were relatively simply structured and the trees were small in stature. The reported crown metrics vs. water use relationship cannot be applied to other vegetation types such as more heterogeneous tropical forest without further testing. Airborne tree crown assessments are also potentially promising for reducing Et scaling uncertainties in tropical forests, but there are no studies confirming this yet.
The spatial heterogeneity in rainforest Et is potentially related to variability in site conditions. In North-America, several upland-to-wetland gradients were analysed in order to evaluate the significance of site conditions for tree and stand Et [6,7,8]; pronounced differences in Et were observed and it was concluded that it is necessary to include plots in different topographic positions for landscape-level assessments. For tropical rainforest regions, such studies are rare, but the influence of the water table on Et of certain species was analysed in northern Australia [9] and on Hawaii [10]. In lowland Sumatra, topography and flooding resulted in differences in Et between upland and riparian oil palm and rubber tree stands [11].
Rainforest structure assessments with conventional ground-based techniques face difficulties in reliably estimating key variables such as crown dimensions, which influence forest-atmosphere water exchange. Drones equipped with LiDAR [12,13] or optical cameras [14,15] appear more suitable for crown assessments. The latter produce high resolution images, from which 3D point clouds can be computed with the Structure from Motion technique (SfM) [16,17,18]. Once a certain crown assessment methodology is established, relatively large areas can be assessed in a short time [19,20,21].
Rainforest canopy heterogeneity analyses for predicting Et across sites and at larger scales would benefit from an automated delineation of individual tree crowns. Individual tree crown (ITC) detection algorithms often use canopy height model (CHM) based tree segmentations derived from local maxima in the CHM [22,23,24]. However, CHM-based approaches have limitations in dense stands and multi-layered forests as they tend to merge crowns and fail to detect understory trees with narrow crowns [25,26]. More recently, ITC detection based on 3D point clouds showed promising results, with more accurate tree segmentation in intermediate canopy strata compared to CHM-based approaches [25,27,28]. However, many of these studies were carried out in boreal and temperate forests [29,30] which tend to be less complex in structure than tropical rainforests. In a recent study AMS3D (Adaptive MeanShift 3D), a multimodal point-cloud-based ITC detection algorithm, was reported to be suitable for heterogeneous tropical rainforest stands [25] and to perform better than other ITC detection methods in a lowland tropical rainforest in French Guiana [31]. AMS3D was further reported to be able to detect even suppressed or smaller trees with narrow canopies [32].
The present study was conducted in the Harapan rainforest in the lowlands of Sumatra, Indonesia. The forest landscape is undulating with upland and riparian regions. We conducted sap flux measurements and drone-based crown and canopy assessments at four upland and four riparian forest plots. The objectives of our study were (1) to test the relationship between tree water use and crown metrics, and (2) to predict spatial variability of rainforest canopy Et within and across plots, including differences between riparian and upland plots.

2. Materials and Methods

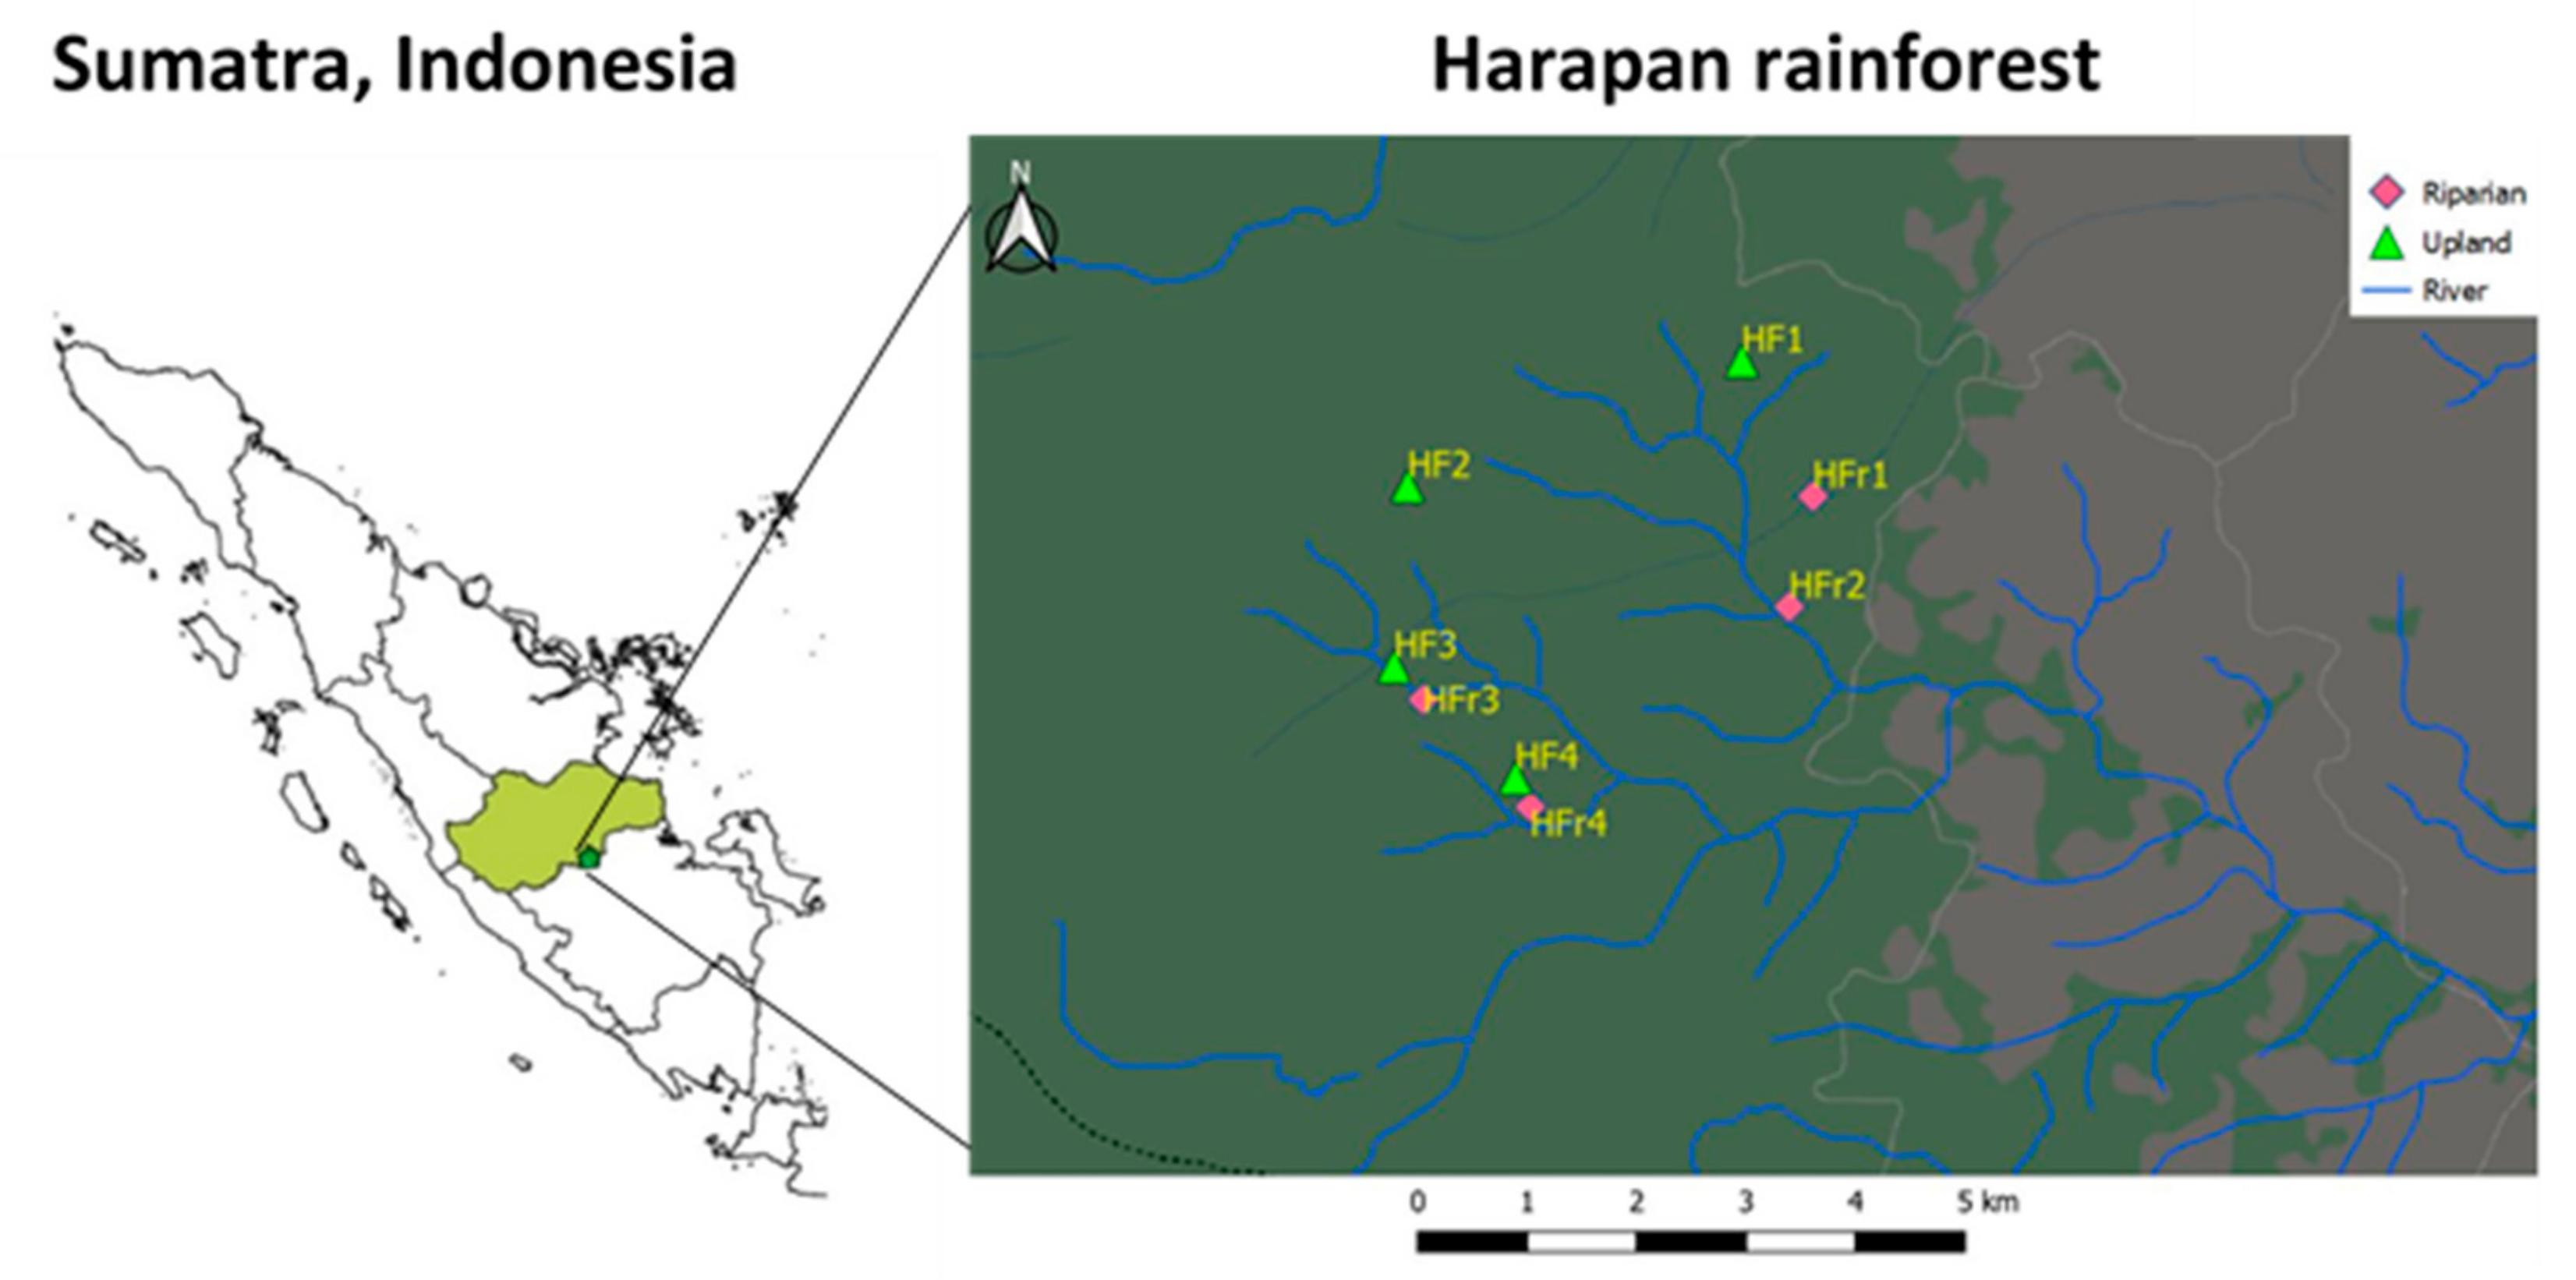
2.1. Study Region and Sites

The study was conducted in the lowlands of Jambi province, Sumatra, Indonesia (Figure 1). The region is tropical humid, with a mean annual precipitation of 2235 mm yr−1 and an average annual temperature of 26.7 °C [33]. The study sites were located in the Harapan rainforest, approx. 50 km south-west of the province capital Jambi. The Harapan rainforest was previously selectively logged but is now a protected area [33]. The region is characterised by mixed dipterocarp-dominated lowland rainforest [34]. A previous assessment in the Harapan rainforest covering four upland study plots (2500 m2 each) found a total of 201 tree species with a DBH ≥ 10 cm [35]. The terrain is undulating, dividing the landscape into upland and riparian valley sites. The soil characteristics at upland and riparian sites are sandy loam Acrisols [36] and acidic clay-loam Stagnosols [37], respectively.

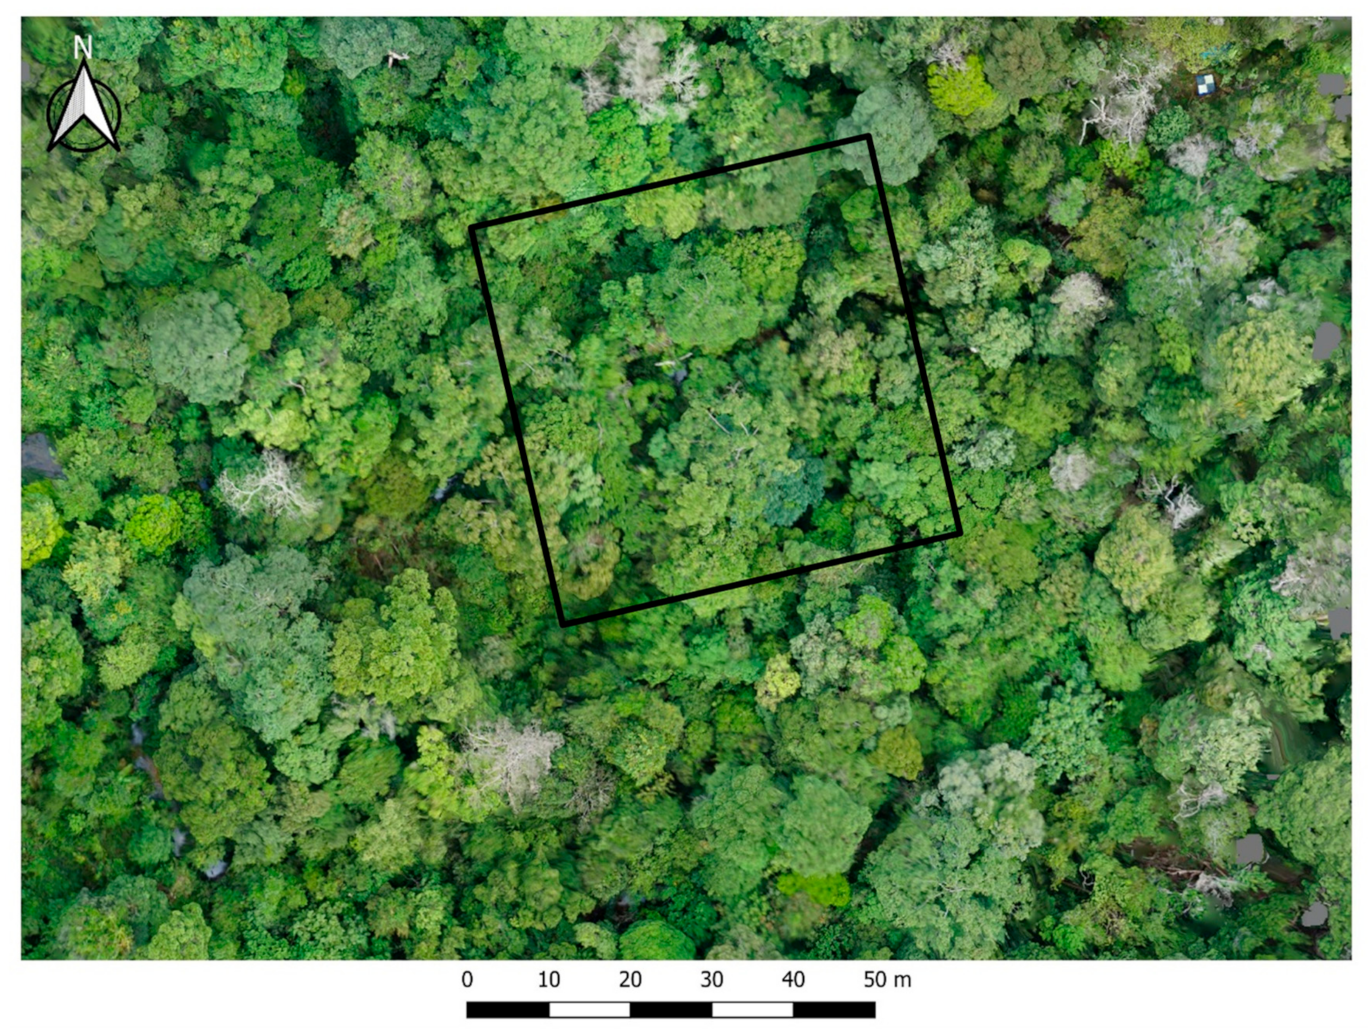
2.2. Study Plots and Stand Characteristics

Four study plots were established at upland sites (plot codes HF1, HF2, HF3, HF4) and four at riparian sites (HFr1, HFr2, HFr3, HFr4) within the Harapan rainforest as part of the EFForTs project [33]. The plots were 50 x 50 m2 in size. Mean elevation at the upland and riparian plots is 65 m and 52 m asl., respectively. At upland plots, the mean tree height was 21.8 ± 0.8 m; at riparian plots, the mean tree height was 18.9 ± 0.8 m (for trees with a DBH ≥ 10 cm; Table 1). Among the upland plots, the mean nearest distance to neighboring plots was 2.1 km, among riparian plots it was 1.7 km. The mean nearest distance between upland and riparian plots (‘plot pairs’) was 0.3 km, only for one pair the distance was larger (2.5 km) (Figure 1).

2.3. Sap Flux Measurements

To assess tree water use, we measured sap flux with thermal dissipation probes (TDP) [38]. We selected one upland plot (HF2) and all four riparian plots (HFr1, HFr2, HFr3, HFr4) for these measurements; the remaining three upland plots had already been measured in a previous sap flux study [39]. The three plots not studied with sap flux methods served as independent tests for stand-scale transpiration derived from two different methods. In each plot, 15 trees were equipped with two TDP sensors each, with the exception of HFr1, where only 12 trees were equipped due to a lack of sap flux instrumentation, as this plot was measured at the end of the field campaign. Installation of sap flux sensors and calculation of sap flux density (JS, g cm−2 h−1) followed the methods described in [39] for lowland rainforest in the same region; therein, the original Granier’s [38] equation for deriving JS was applied. Night time zero-flux conditions, as described in Oishi et al. [40], were met during the early morning hours. Tree-level water use was derived by considering the water conductive area (AC, cm2) of trees and radial sap flux patterns measured by the heat field deformation technique [39].

2.4. Remote Sensing

2.4.1. Drone Image Acquisition

Drone flights were conducted within the sap flux measurement period between August and December 2016. An octocopter drone (MikroKopter EASY Okto V3, HiSystems GmbH, Germany) equipped with an RGB camera (Sony Alpha 5000 with Sony E PZ 16-50mm lens) was used to capture the images. The drone was additionally equipped with GPS (MKBNSS V3 GPS/Glonass, HiSystems, Germany); the accuracy of the GPS measurements was ± 5 m. Flight routes were planned with MikroKopter-Tool V2.14b and the flight path followed superposing circular and grid patterns. Images were taken at an altitude of 80 m above ground (i.e., 30–40 m above canopy). Further flight specifications are provided in Table A1.

2.4.2. 3D Point Cloud Generation, Individual Tree Crown Detection and Crown Metrics

An average of 209 images per plot were used to build 3D point clouds and derive orthomosaics. Images of insufficient quality (e.g., blurry images) were removed from the datasets. Each image was aligned and geo-referenced with the drone GPS logs using Agisoft Photoscan Professional 1.2.6 [41]. The drone-based GPS measurements provide higher accuracy than ground-based measurements under the dense canopies; we used more than 200 GPS points at each study plot from the geo-tagged images for georeferencing the whole plot map. The workflow included building dense point clouds, creating a mesh from the clouds, generating digital elevation models (DEM) and then generating the orthomosaics. 3D point clouds were generated using the Structure from Motion (SfM) technique [17,18] in Agisoft Photoscan Professional 1.2.6 software. An example of such an orthomosaic is depicted in Figure 2.
Based on ground inventories, tree location information with tree ID and plot corner GPS coordinates were available. The tree location maps were in local Cartesian coordinates; they were georeferenced in UTM WGS 84 using the GPS points of the plot corners. The georeferenced location maps were overlain with the RGB orthomosaic images to manually identify the sap flux sample trees. The identification of the sample trees was based on the visible tree crowns with respect to the tree location points in the RGB orthomosaic image. To analyse the tree crown to water use relationship, the corresponding tree crowns were delineated manually through visual interpretations using QGIS 3.6 software [42] and cloud compare v.2.9 software [43]. Overall, the crowns of 42 out of the 72 sap flux sample trees could clearly be identified in the images, 5 in the upland plot and 3, 9, 13 and 12, respectively, in the four riparian plots. Due to this limited sample size for testing crown metrics vs. water use relationships, we pooled the data across all plots. The crown polygons were used for extraction of the point clouds with the lasclip function of the lidR R package [44]; for computing different crown metrics, the rLIDAR R package was used [45]. We extracted the metrics crown volume, crown projection area and crown surface area for the identified sap flux trees.

2.4.3. Automatic Crown Detection Using AMS3D

In contrast to the manually delineated crowns of the 42 clearly identified sap flux trees, we followed an automated tree segmentation approach to detect and delineate the tree crowns of all other trees in the plots for scaling-up to stand transpiration; the time-consuming manual delineation for the hundreds of trees within a given stand would not be feasible. For all eight study plots, dense point clouds were extracted and the automated individual tree crown (ITC) detection algorithm AMS3D was applied [25]. AMS3D follows a non-parametric approach independent of pre-defined crown shape models and uses a multi-scale bandwidth technique that does not rely on single biophysical parameters. Due to its self-adaptive approach, which calibrates kernel bandwidth as a function of local tree allometric models, the segmentation process has the ability to characterize complex dense crowns and can deal with different crown shapes and multiple layers in the tropical forest [25]. As the AMS3D was previously only used with LiDAR, we adapted our high-resolution SfM point clouds to LiDAR standards by reducing the point density from 198 to 58 points m-2. The point cloud density was reduced based on minimum distance between points as threshold criteria using the cloud compare v.2.9 software [43]. We cleared all points from the point clouds that lay below the minimum tree height of the respective plot to filter out non-canopy points and avoid interferences of single ground points in crown modelling. We then used the meanshiftR R package [46] which allows individual tree crown segmentation using the Adaptive Mean Shift 3D (AMS3D) clustering algorithm [25]. In our study, we calibrate the kernel bandwidth value based on the ratio of crown diameter and tree diameter as observed from ground inventories. In contrast, the original AMS3D approach uses local allometric models constructed from CHM to further calibrate kernel bandwidth. In our case, a CHM could not reliably be constructed from the point cloud data at our study plots due to the lack of clearly identifiable ground points. After ITC segmentation, we removed all crowns that comprised relatively low point cloud densities (fewer than 40 points per crown) in order to avoid irrelevant crowns (also see Aubry-Kientz et al. [31]). All individually segmented crowns of a given study plot were vectorised and crown metrics were computed analogously to the previously described methodology for manually selected trees.
We compared the number of segmented crowns per plot to ground stem counts (trees ≥ 10 cm DBH) and performed accuracy assessments by matching the ground-recorded stem locations of each tree to the centroid of delineated crowns. Matching was performed by finding the nearest neighbour distance within threshold criteria, i.e., a distance to nearest ground measured tree location below the segmented crown diameter of the tree (Figure A1). The threshold distance thus varied depending on the crown diameter. The accuracy assessment defines True Positives (TP), i.e., the detected trees match the actual trees in terms of tree location and threshold nearest neighbour distance, False Positives (FP) or commission error and False Negatives (FN) or omission error. From TP, FP and FN, the accuracy metrics precision (Pr), recall (Re) and F-score were calculated. Re indicates the tree detection rate, Pr indicates the correctness of the detected trees and the F-score is the overall accuracy considering both commission and omission errors [47].

2.5. Drone-Based Scaling, Uncertainties And Heterogeneity Assessment of Transpiration

To test the relationship between tree water use and different crown metrics, we used linear regressions, followed by residual plot analysis for normality and homoscedasticity tests. The allometric relationships from the linear regression served as the basis for scaling-up from individual tree water use to stand-level canopy Et. The uncertainties associated with the scaling to stand Et were compared among the different crown metrics and conventional ground-based approaches. Uncertainties in stand Et estimates were assessed by bootstrapping the linear relationships between water use and the according predictor variables with the R package ‘boot’ (50,000 iterations) [48,49]. This yielded estimates of means for slope and intercept, as well as corresponding standard deviations as measures of uncertainty. For deriving stand Et, the best performing crown metric (i.e., the metric with the lowest uncertainty) was applied to the stand-level crown datasets from the automated delineation algorithm. To test for differences in stand-level canopy Et between upland and riparian plots, we performed an ANOVA. All statistical analyses were performed with R version 3.4.3 [50]. Plotting was performed using the Seaborn library [51].

3. Results

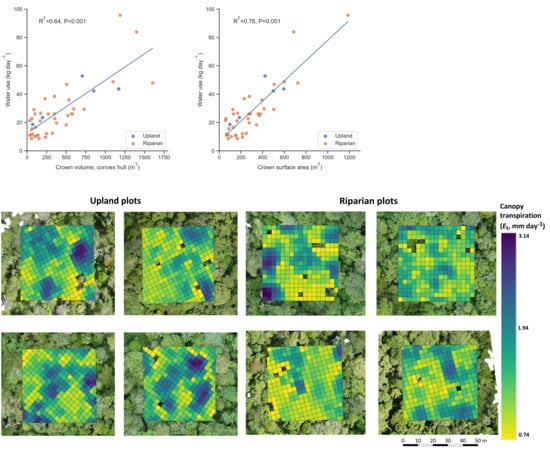
3.1. Tree Water Use vs. Crown Metrics

Out of the initial 72 sap flux sample trees 42 could clearly be identified and delineated in the aerial images and thus constituted the sample for further analyses. Their daily water use ranged from 8.5 to 95.7 kg day−1 (average of three sunny days). Crown volume and crown surface area ranged from 36 to 1604 m3 and from 57.5 to 724.5 m2, respectively. Linear regression models between sap flux-derived daily tree water use and drone-derived crown metrics (Table A2) suggest highly significant linear relationships (P < 0.001) that explain 64% (crown volume) and 76% (crown surface area) of the observed variability in tree water use (Figure 3). For the conventionally applied ground-based inventory variable DBH, the regression model explained 38% of the observed variability (P < 0.001).

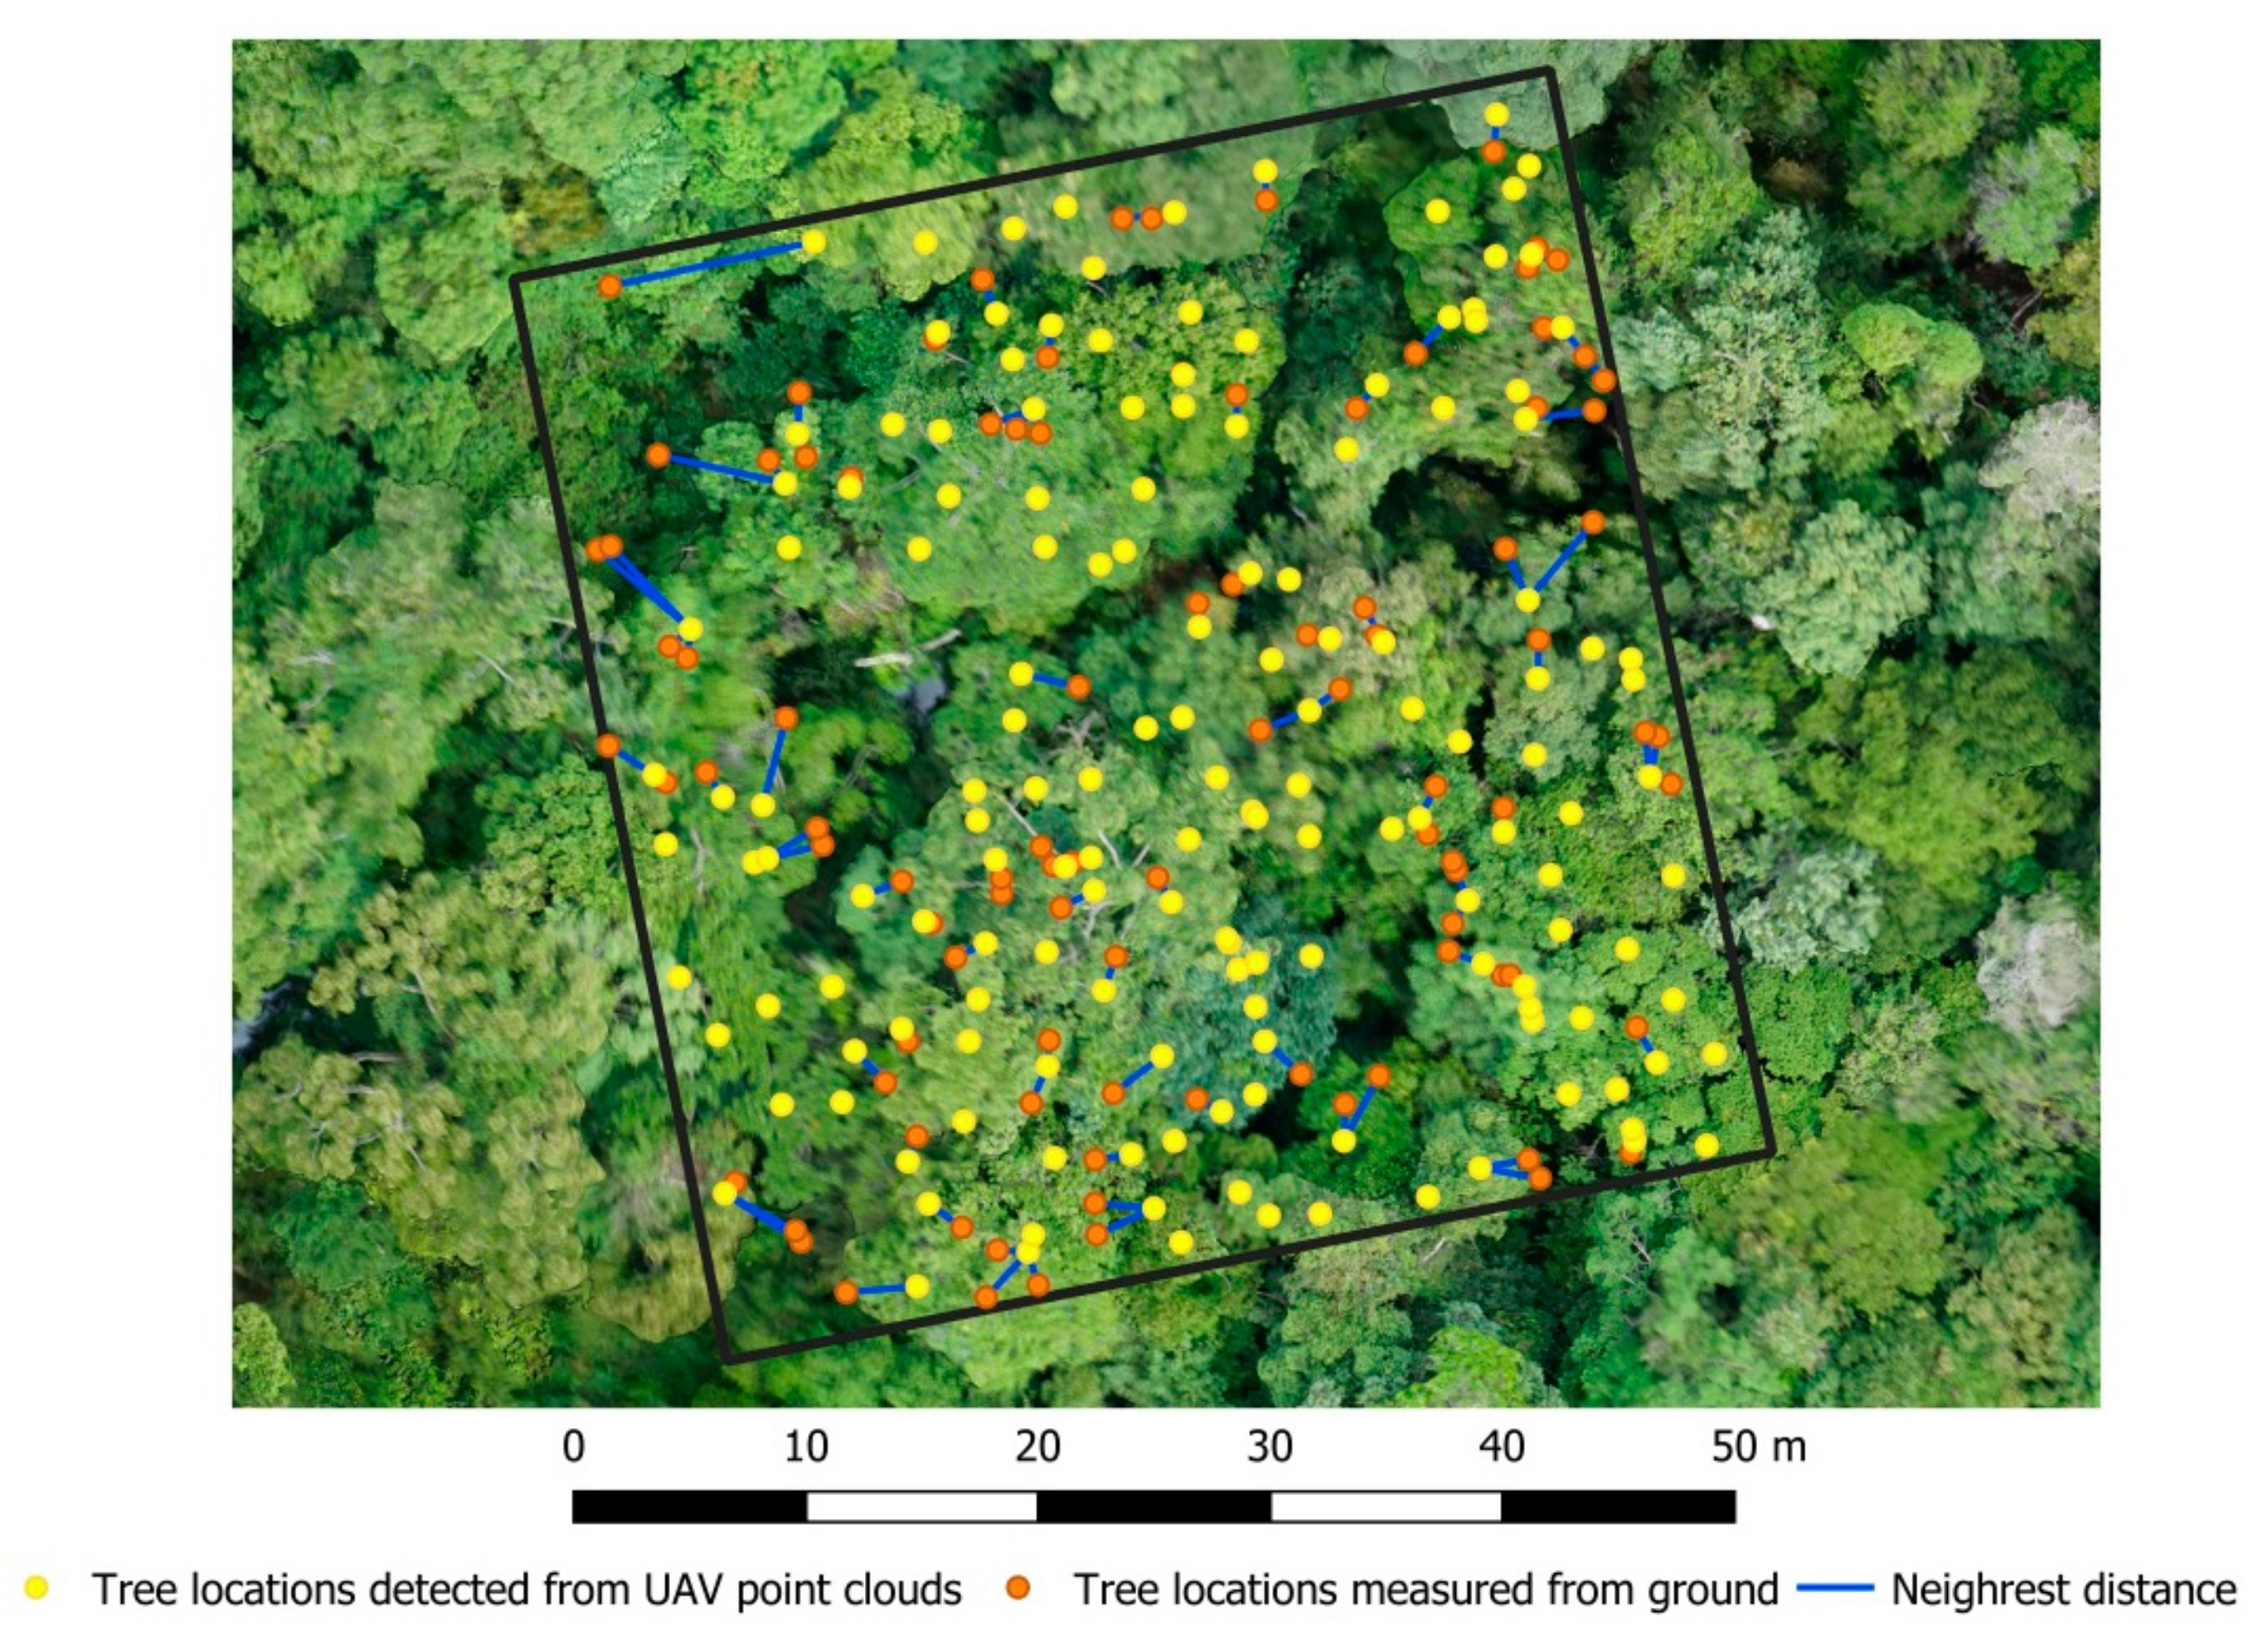
3.2. Individual Tree Crown Segmentation

The AMS3D algorithm produced between 140 and 181 segmented crowns per study plot. The difference between crown counts of the automated AMS3D approach and stem counts from the ground was 7% on average (Table 2). The F-score, which indicates the overall tree identification accuracy of the aerial method, had a moderate value of 60%, wherein a recall and precision of 65% and 56% were achieved, respectively (Table 2). The subsequently derived crown surface areas of the automatically segmented trees ranged from 7.7 to 1578.0 m2, respectively (Table 3). A visualization of segmented crowns is shown as an example in Figure A2.

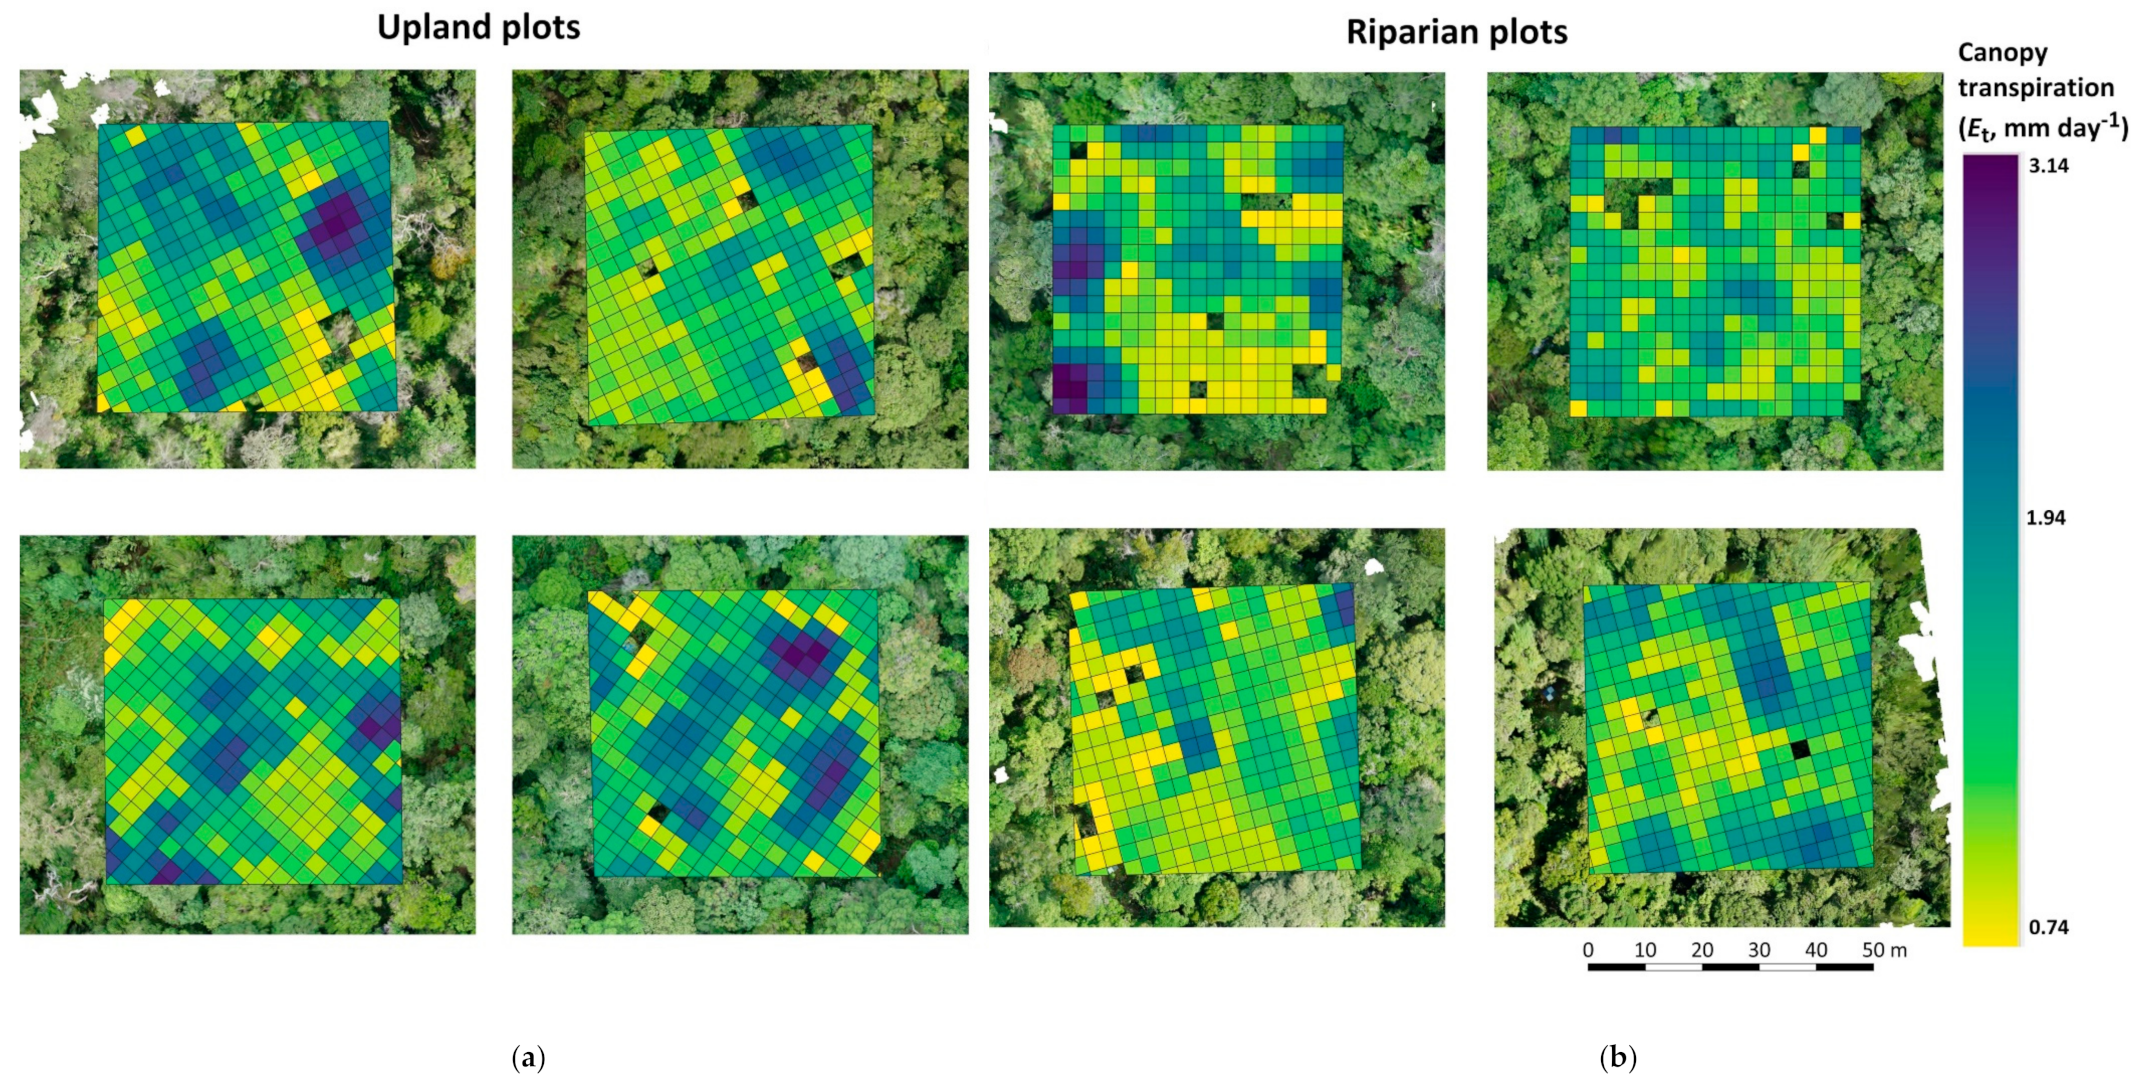
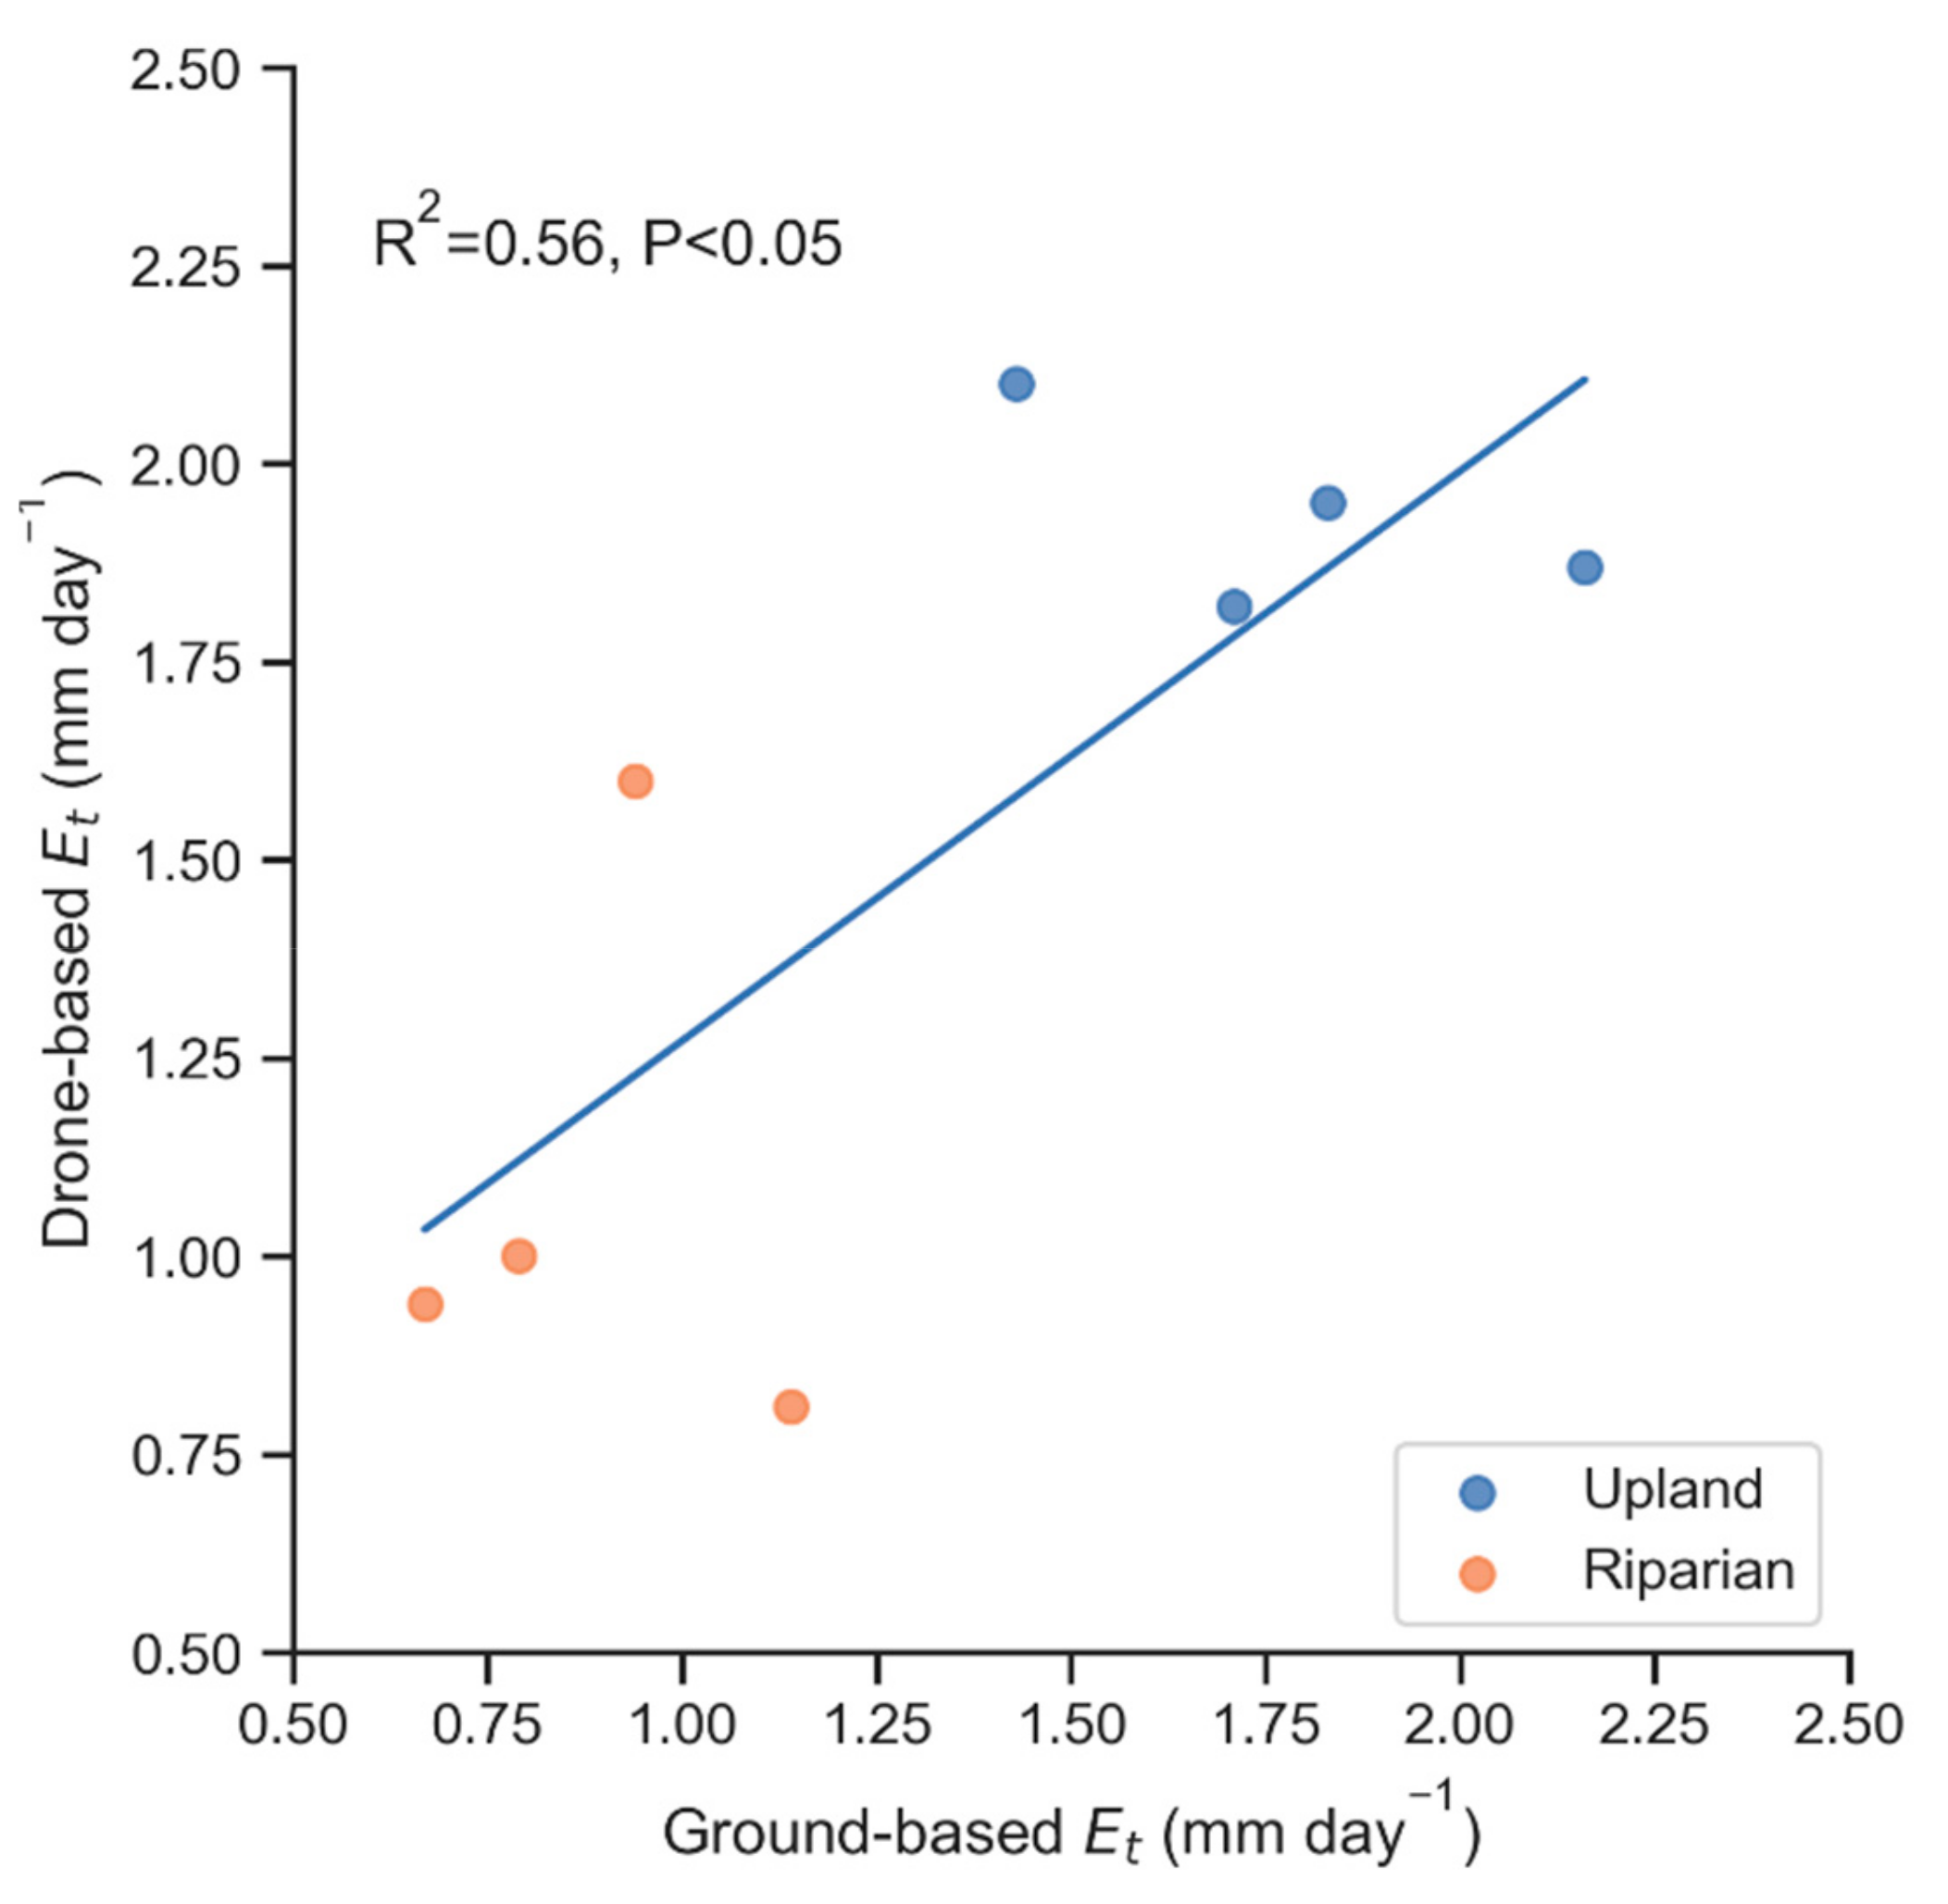
3.3. Canopy Transpiration: Scaling, Uncertainties and Spatial Heterogeneity

The bootstrapping method suggests large differences in the uncertainties associated with the respective stand Et estimates derived from crown metrics vs. conventional ground-based methods. As such, uncertainties when using crown surface area for Et scaling were much smaller (17%) than when using the conventional DBH-based approach (51%) (Table 4). The drone-based Et estimates ranged from 1.82 to 2.1 mm day−1 at the four upland plots and from 0.81 to 1.60 mm day−1 at the four riparian plots. Mean Et was significantly higher (44%) in upland plots (1.9 ± 0.1 mm day−1, mean ± SE) than in riparian plots (1.0 ± 0.2 mm day−1, mean ± SE) (ANOVA, P = 0.004) (Table A3).
Based on the scaling variable with the lowest uncertainty (crown surface area, Table 4), we further assessed the spatial heterogeneity of Et at different scales. Plot-to-plot heterogeneity of Et was much higher among the four riparian plots (28.0% coefficient of variation, CV) than among the four upland plots (5.3% CV). In contrast, the relative within-plot variability of Et was similar for riparian and upland plots (ANOVA, P = 0.72), with respective mean CV values of 30.1 % and 31.2%; however, the absolute within-plot variability of Et was higher at the upland plots (Figure 4).

4. Discussion

Airborne tree crown detection in the studied tropical rainforest reduced the uncertainties in estimating canopy transpiration considerably. The newly established workflow resulted in scaling uncertainties from tree to stand of 17%, which is considered a great improvement compared to conventional DBH-based scaling (51% uncertainty). The predicted canopy transpiration suggests high stand-level differences between upland and riparian plots, with a 31% lower mean value at riparian plots, but higher plot-to-plot variation; these differences are driven by differences in crown packing among the plots. Likewise, the considerable variation of transpiration within plots is driven by local small-scale differences in crown packing. Overall, our study demonstrates the great potential of new drone-based methods for ecohydrological research, but it also points to some challenges.
Identifying the 72 sap flux sample trees in the aerial images proved to be difficult due to the dense and multi-layered canopy; only 42 of the sampled trees could be clearly identified to be used for further analyses. The 30 unidentifiable sap flux trees were uniformly distributed in terms of DBH. Therein, due to the linear relationship between crown surface area (or crown volume) and water use, all unidentified trees matter proportionally to their respective crown surface area (or volume). This seemingly stands in contrast to a previous study reporting over-proportional contributions of large emergent trees to stand Et in old-growth tropical lowland forest [53] however, this divergence is likely due to the lack of considerable emergent trees within our study plots in previously-logged lowland tropical forest. In previous studies applying airborne remote sensing approaches, the detection of small-statured trees was also reported to be particularly low and difficult [54,55]. For tree identification, we used tree location maps in local Cartesian coordinates drawn in ground surveys. These maps were georeferenced with the respective corner coordinates of the plots and subsequently overlain with their orthomosaics to locate the targeted trees from above. A clear identification was partially hindered by the lack of ground control points or tree markers, which would have likely facilitated the identification of smaller sub-canopy crowns within the dense forest canopy. Our attempts of letting helium balloons rise to the top of selected tree crowns (following [56]) were unsuccessful due to the high, dense and multi-layered canopies, wind and difficulty in controlling the balloons.
The high canopy closure of tropical forest canopies makes it difficult to classify ground points as a prerequisite for deriving CHMs from SfM point clouds. Thus, we opted for an exclusively point-cloud-based tree segmentation approach due to the reported enhanced performance in structurally diverse stands such as tropical forests [31]. We applied the self-adaptive approach called AMS3D, which calibrates kernel bandwidth as a function of local tree allometric models [25]. Before applying this algorithm, we reduced the initial high density of our SfM point clouds (198 points m−2) to the density (58 points m−2) in order to increase the speed and quality of the clustering process [57]. Our adapted approach resulted in an overall moderate accuracy of tree detection (60%); however, the number of detected crowns at the plot-level was similar to ground stem counts, with a mean difference of less than 7%. Previous studies achieved higher detection rates, e.g., 69% in multi-layered Mediterranean forest [58] or 74% in French Guianian tropical rainforest [31], which is the best performance of an automated segmentation algorithm in a tropical forest so far. Other point cloud based methods such as Li2012 [27] performed well in woodlands dominated by few tree species, with accuracies over 81%; however, lower accuracy (<60%) was achieved in stands characterized by a dense canopy [59]. We further compared the automatically segmented crowns with the manually delineated crowns of the sap flux sample trees with respect to crown metrics. A linear regression model of automatically vs. manually derived crown surface area of the sap flux trees (forced through origin, R2 = 0.50, P < 0.001 has a slope of 1.25, suggesting that the automated algorithm on average overestimates the crown surface area of individual trees by 25% compared to manual delineation. However, due to the linear relationship between water use and the applied scaling variable, crown surface area, individual segmentation accuracy is not a constraint when assessing stand Et: the sum of individual over- or under-segmented crowns within the plot boundaries will inevitably equal stand crown surface area and thus the predicted stand transpiration value.
Among the 42 identified sap-flux trees, we found close correlations between tree water use and crown metrics (best: crown surface area, R2 = 0.76). Such a relationship has already been indicated for trees and palms in an agroforest [5]. Pooling these data suggests that a universal scaling may apply for trees, but palms are different, and seem to follow another scaling factor (Figure A3). However, these relationships still need further exploration. In accordance with our results, several previous studies also explained variability in tree water use with crown or leaf area metrics [39,60,61,62]. Further studies from related ecological fields have also pointed to the high potential of using drone-derived crown metrics as predictors and scalars, e.g., for above ground biomass and canopy biomass [63].
Using crown surface area to scale-up from tree water use to stand-level Et resulted in a substantial reduction of Et estimation uncertainties compared to conventional ground-based approaches. In conventional approaches, DBH or DBH-derived sapwood area are used for scaling to Et (e.g., [4,64], but associated uncertainties can be substantial when estimating Et in heterogeneous stands [52]. Compared to the DBH approach (51% uncertainty), our crown-metric-based approach reduced scaling uncertainties (17%). This finding is in line with a previous study, where drone-derived crown volume substantially reduced Et uncertainties in oil palm agroforests and monocultures [5].
The three upland plots with previous sap flux measurements were used for testing the quality of predictions. Although the sap flux was not measured concurrently, the results indicated low divergence of stand-scale means, with a much-reduced uncertainty (Table A3). Plotting stand Et derived from crown metrics vs. Et derived from conventional ground-based approaches for the eight study plots shows a significant linear relationship (R2 = 0.56, P < 0.001) and also suggests low divergence among the two methods (Figure A4). The stand-level canopy Et estimates derived from the new drone-based methodology were significantly higher for the four upland than the four riparian study plots. One may have expected that Et at riparian sites is higher than at upland sites. However, a previous sap flux-based study at the same four upland plots showed no indications of soil water limitation of tree water use, in 2013 and 2014 (non-ENSO years) [39]. Further in accordance with our results, rubber and oil palm plantations in the lowlands of Sumatra had lower Et at riparian sites than at upland sites [11]. Heterogeneity in Et among sites at different topographic positions was also observed in other previous studies [6,7]. A study of Japanese cypress (Chamaecyparis obtusa) found Et to be higher in valleys than at upland sites [65], while being similar for Japanese cedar (Cryptomeria japonica) [66]. In our study, the observed much lower Et in riparian than in upland plots may be due to several factors. Rainforest species indicating disturbance (e.g., genus Macaranga) were more abundant in the riparian plots [67], and aboveground biomass was 43% lower than in upland plots [68]. The trees in the riparian plots were also smaller than in upland plots, which may go along with less turbulent energy exchange at the canopy level. Additionally, the position of the riparian study plots in moist landscape depressions probably induces higher air humidity at the canopy level and thus reduced atmospheric evaporative demand.
In addition to this spatial Et variation between riparian sites and upland sites, we found varying plot-to-plot variation of Et within each of the two categories. Relative Et variation was low among the upland plots (5% CV) and more pronounced among the riparian plots (28% CV). These findings are in line with biomass assessments at these same sites that also point to a larger relative variability in the riparian sites than in upland sites [68]. Furthermore, our findings are in line with a previous study in an oil palm and rubber monoculture plantation in the same region, where Et variability was enhanced by factors between 2.4 and 4.2 at (partially flooded) valley sites compared to adjacent upland sites [11].
We further used the new method to analyse spatial variability of transpiration within the plots. The canopy of the rainforest shows different degrees of crown packing, which we assessed with 3D canopy analyses; individually segmented trees would not be necessary but were used for calibration. The depicted differences in predicted transpiration per 9 m2 tile of ground area (Figure 4) are driven by these local differences in crown packing. The minimum and maximum values of a derived ‘crown surface area index’ across the eight study plots were 0.18 and 32 m2 m−2, respectively. The strong differences in canopy packing result in the observed substantial small-scale variability of Et; whether such small-scale differences can be considered realistic requires further investigation. Overall, our study underlines that topography and differences between riparian and upland forest sites exhibit Et heterogeneity.

5. Conclusions

Crown surface area derived from drone-based imagery was a well-suited predictor of tree water use. In its application for scaling tree water use to stand-level transpiration, uncertainties were largely reduced compared to conventional diameter-based scaling approaches. The scaling was facilitated by an automated tree crown segmentation algorithm, which yielded moderately accurate results. Applying the method to the studied tropical rainforest in lowland Sumatra suggests large variations in spatial transpiration, both among and within study plots. Overall, we see great potential and improvement in drone-based methods for better understanding canopy structure and related ecohydrological responses in tropical forests and beyond.

Author Contributions

Conceptualization: J.A., A.R., D.H.; Formal analysis: J.A., A.R.; Funding acquisition: D.H.; Methodology: J.A., A.R., F.E.; Software: J.A.; Supervision: A.R., D.H.; Visualization: J.A.; Writing—original draft preparation, J.A.; Writing—review and editing: J.A., A.R., F.E., H., D.H. All authors have read and agreed to the published version of the manuscript.

Funding

This study was financially supported by the Deutsche Forschungsgemeinschaft (DFG) in the framework of a collaborative German–Indonesian research project (CRC 990 ‘EFForTS’ project: sub-project A02). We further acknowledge support by the Open Access Publication Funds of Göttingen University and the DFG.

Acknowledgments

We would like to thank the Ministry of Research, Technology and Higher Education, Indonesia, for providing the research permit for field work (No. 285/SIP/FRP/E5/Dit.KI/VIII/2016 and No. 322/SIP/FRP/E5/Dit.KI/IX/2016). Furthermore, we would like to thank our field assistant Erwin Pranata for great support during the field campaigns. We would like to thank Katja Rembold, Pierre André Waite, Fabian Brambach and Martyna Kotowska for providing the tree inventory data. Thanks to all ‘EFForTS’ colleagues and friends in Indonesia, Germany, and around the world.

Conflicts of Interest

The authors declare no conflict of interest.

Appendix A

Table A1. Specifications of the drone flight campaigns.
ItemSpecification
CameraSony A5000
DroneMikroKopter OktoXL V3
Flight altitude80 m
Number of images220 per 50x50 m2 plot
Focal length16 mm
Ground resolution1.8 cm/pixel
Point density198 points m−2
Table A2. Linear regression models between tree water use and different drone-derived crown metrics and ground-based variables.
Equation
Y = Tree Water Use
X = Variables
R2P Value
Drone-based
Crown surface area (m2)Y = 0.07 * X + 6.650.76P < 0.001
Crown volume (m3)Y = 0.04 * X + 12.440.64P < 0.001
Crown projection area (m2)Y = 0.25 * X + 7.330.69P < 0.001
Ground-based
DBH (cm)Y = 0.94 * X - 1.170.38P < 0.001
Sapwood area (cm2)Y = 0.08 * X + 0.250.37P < 0.001
Table A3. Stand transpiration and uncertainty estimates using drone-based and ground-based methods.
Transpiration (mm Day−1)
Estimate ± Uncertainty
Plot typePlot IDDrone-basedGround-basedDivergence %
Upland plotsHF11.87 ± 0.362.16 ± 1.2313
HF21.82 ± 0.351.71 ± 0.986
HF31.95 ± 0.371.83 ± 1.047
HF42.10 ± 0.401.43 ± 0.8246
Riparian plotsHFr10.94 ± 0.180.67 ± 0.3839
HFr20.81 ± 0.151.14 ± 0.6529
HFr31.00 ± 0.190.79 ± 0.4527
HFr41.60 ± 0.300.94 ± 0.5470
Mean 13
Figure A1. Distance matrix between ground-based tree locations and locations of the centroid of automatically segmented crowns (with the AMS3D individual tree crown delineation method) at one of the riparian study plots (HFr2).
Remotesensing 12 00651 g0a1
Figure A2. 3D RGB point cloud (left) and segmented tree crown map (with the AMS3D individual tree crown delineation method, right) of one of the riparian study plots (HFr2).
Remotesensing 12 00651 g0a2
Figure A3. Relationship between water use and crown surface area.
Remotesensing 12 00651 g0a3
Figure A4. Linear relationship between stand transpiration (Et, mm day−1) estimates based on drone-derived crown surface area and ground-measured sapwood area in eight plots.
Remotesensing 12 00651 g0a4

References

  1. Whitmore, T.C. An Introduction to Tropical Rain Forests, 2nd ed.; Oxford University Press: Oxford, NY, USA, 1998; ISBN 978-0-19-850147-3. [Google Scholar]
  2. Whitten, T.; Damanik, S.J. The Ecology of Sumatra; Periplus Editions (HK) Limited: Hong Kong, China, 2000; ISBN 978-962-593-074-9. [Google Scholar]
  3. Ellison, D.; Morris, C.E.; Locatelli, B.; Sheil, D.; Cohen, J.; Murdiyarso, D.; Gutierrez, V.; Noordwijk, M.; van Creed, I.F.; Pokorny, J.; et al. Trees, forests and water: Cool insights for a hot world. Glob. Environ. Chang. 2017, 43, 51–61. [Google Scholar] [CrossRef]
  4. Wullschleger, S.D.; Meinzer, F.C.; Vertessy, R.A. A review of whole-plant water use studies in tree. Tree Physiol. 1998, 18, 499–512. [Google Scholar] [CrossRef] [Green Version]
  5. Ahongshangbam, J.; Khokthong, W.; Ellsäßer, F.; Hendrayanto, H.; Hölscher, D.; Röll, A. Drone-based photogrammetry-derived crown metrics for predicting tree and oil palm water use. Ecohydrology 2019, 12. [Google Scholar] [CrossRef]
  6. Loranty, M.M.; Mackay, D.S.; Ewers, B.E.; Adelman, J.D.; Kruger, E.L. Environmental drivers of spatial variation in whole-tree transpiration in an aspen-dominated upland-to-wetland forest gradient. Water Resour. Res. 2008, 44. [Google Scholar] [CrossRef] [Green Version]
  7. Mackay, D.S.; Ewers, B.E.; Loranty, M.M.; Kruger, E.L. On the representativeness of plot size and location for scaling transpiration from trees to a stand. J. Geophys. Res. Biogeosci. 2010, 115. [Google Scholar] [CrossRef] [Green Version]
  8. Angstmann, J.L.; Ewers, B.E.; Barber, J.; Kwon, H. Testing transpiration controls by quantifying spatial variability along a boreal black spruce forest drainage gradient. Ecohydrology 2013, 6, 783–793. [Google Scholar] [CrossRef]
  9. McJannet, D.; Wallace, J.; Fitch, P.; Disher, M.; Reddell, P. Water balance of tropical rainforest canopies in north Queensland, Australia. Hydrol. Process. 2007, 21, 3473–3484. [Google Scholar] [CrossRef]
  10. Santiago, L.S.; Goldstein, G.; Meinzer, F.C.; Fownes, J.H.; Mueller-Dombois, D. Transpiration and forest structure in relation to soil waterlogging in a Hawaiian montane cloud forest. Tree Physiol. 2000, 20, 673–681. [Google Scholar] [CrossRef] [Green Version]
  11. Hardanto, A.; Röll, A.; Niu, F.; Meijide, A.; Hendrayanto Hölscher, D. Oil palm and rubber tree water use patterns: Effects of topography and flooding. Front. Plant Sci. 2017, 8. [Google Scholar] [CrossRef] [Green Version]
  12. Lin, Y.; Hyyppä, J.; Jaakkola, A. Mini-UAV-borne LiDAR for fine-scale mapping. IEEE Geosci. Remote Sens. Lett. 2011, 8, 426–430. [Google Scholar] [CrossRef]
  13. Wallace, L.; Lucieer, A.; Watson, C.; Turner, D. Development of a UAV-LiDAR system with application to forest inventory. Remote Sens. 2012, 4, 1519–1543. [Google Scholar] [CrossRef] [Green Version]
  14. Asner, G.P.; Palace, M.; Keller, M.; Pereira, R., Jr.; Silva, J.N.; Zweede, J.C. Estimating canopy structure in an amazon forest from laser range finder and IKONOS satellite observations. Biotropica 2002, 34, 483–492. [Google Scholar] [CrossRef]
  15. Mlambo, R.; Woodhouse, I.H.; Gerard, F.; Anderson, K. Structure from Motion (SfM) photogrammetry with drone data: A low cost method for monitoring greenhouse gas emissions from forests in developing countries. Forests 2017, 8, 68. [Google Scholar] [CrossRef] [Green Version]
  16. Dandois, J.P.; Ellis, E.C. High spatial resolution three-dimensional mapping of vegetation spectral dynamics using computer vision and hobbyist unmanned aerial vehicles. Remote Sens. Environ. 2013, 136, 259–276. [Google Scholar] [CrossRef] [Green Version]
  17. Lowe, D.G. Distinctive image features from scale-invariant keypoints. Int. J. Comput. Vis. 2004, 60, 91–110. [Google Scholar] [CrossRef]
  18. Westoby, M.J.; Brasington, J.; Glasser, N.F.; Hambrey, M.J.; Reynolds, J.M. ‘Structure-from-Motion’ photogrammetry: A low-cost, effective tool for geoscience applications. Geomorphology 2012, 179, 300–314. [Google Scholar] [CrossRef] [Green Version]
  19. Cunliffe, A.M.; Brazier, R.E.; Anderson, K. Ultra-fine grain landscape-scale quantification of dryland vegetation structure with drone-acquired structure-from-motion photogrammetry. Remote Sens. Environ. 2016, 183, 129–143. [Google Scholar] [CrossRef] [Green Version]
  20. Ota, T.; Ogawa, M.; Mizoue, N.; Fukumoto, K.; Yoshida, S. Forest structure estimation from a UAV-based photogrammetric point cloud in managed temperate coniferous forests. Forests 2017, 8, 343. [Google Scholar] [CrossRef]
  21. Wallace, L.; Lucieer, A.; Malenovskỳ, Z.; Turner, D.; Vopěnka, P. Assessment of forest structure using two UAV techniques: A comparison of airborne laser scanning and Structure from Motion (SfM) point clouds. Forests 2016, 7, 62. [Google Scholar] [CrossRef] [Green Version]
  22. Chen, Q.; Baldocchi, D.; Gong, P.; Kelly, M. Isolating individual trees in a savanna woodland using small footprint lidar data. Photogramm. Eng. Remote Sens. 2006, 8, 923–932. [Google Scholar] [CrossRef] [Green Version]
  23. Dalponte, M.; Coomes, D.A. Tree-centric mapping of forest carbon density from airborne laser scanning and hyperspectral data. Methods Ecol. Evol. 2016, 7, 1236–1245. [Google Scholar] [CrossRef] [PubMed] [Green Version]
  24. Silva, C.A.; Hudak, A.T.; Vierling, L.A.; Loudermilk, E.L.; O’Brien, J.J.; Hiers, J.K.; Jack, S.B.; Gonzalez-Benecke, C.; Lee, H.; Falkowski, M.J.; et al. Imputation of individual longleaf pine (Pinus palustris Mill.) tree attributes from field and LiDAR data. Can. J. Remote Sens. 2016, 42, 554–573. [Google Scholar] [CrossRef]
  25. Ferraz, A.; Saatchi, S.; Mallet, C.; Meyer, V. Lidar detection of individual tree size in tropical forests. Remote Sens. Environ. 2016, 183, 318–333. [Google Scholar] [CrossRef]
  26. Koch, B.; Heyder, U.; Weinacker, H. Detection of individual tree crowns in airborne lidar data. Photogramm. Eng. Remote Sens. 2006, 357–363. [Google Scholar] [CrossRef] [Green Version]
  27. Li, W.; Guo, Q.; Jakubowski, M.K.; Kelly, M. A new method for segmenting individual trees from the lidar point cloud. Photogramm. Eng. Remote Sens. 2012, 78, 75–84. [Google Scholar] [CrossRef] [Green Version]
  28. Xiao, W.; Zaforemska, A.; Smigaj, M.; Wang, Y.; Gaulton, R. Mean shift segmentation assessment for individual forest tree delineation from airborne lidar data. Remote Sens. 2019, 11, 1263. [Google Scholar] [CrossRef] [Green Version]
  29. Morsdorf, F.; Meier, E.; Kötz, B.; Itten, K.I.; Dobbertin, M.; Allgöwer, B. LiDAR-based geometric reconstruction of boreal type forest stands at single tree level for forest and wildland fire management. Remote Sens. Environ. 2004, 92, 353–362. [Google Scholar] [CrossRef]
  30. Vega, C.; Hamrouni, A.; El Mokhtari, S.; Morel, J.; Bock, J.; Renaud, J.-P.; Bouvier, M.; Durrieu, S. PTrees: A point-based approach to forest tree extraction from lidar data. Int. J. Appl. Earth Obs. Geoinf. 2014, 33, 98–108. [Google Scholar] [CrossRef]
  31. Aubry-Kientz, M.; Dutrieux, R.; Ferraz, A.; Saatchi, S.; Hamraz, H.; Williams, J.; Coomes, D.; Piboule, A.; Vincent, G. A comparative assessment of the performance of individual tree crowns delineation algorithms from ALS data in tropical forests. Remote Sens. 2019, 11, 1086. [Google Scholar] [CrossRef] [Green Version]
  32. Amiri, N.; Yao, W.; Heurich, M.; Krzystek, P.; Skidmore, A.K. Estimation of regeneration coverage in a temperate forest by 3D segmentation using airborne laser scanning data. Int. J. Appl. Earth Obs. Geoinf. 2016, 52, 252–262. [Google Scholar] [CrossRef]
  33. Drescher, J.; Rembold, K.; Allen, K.; Beckschäfer, P.; Buchori, D.; Clough, Y.; Faust, H.; Fauzi, A.M.; Gunawan, D.; Hertel, D.; et al. Ecological and socio-economic functions across tropical land use systems after rainforest conversion. Philos. Trans. R. Soc. B 2016, 371, 20150275. [Google Scholar] [CrossRef] [PubMed]
  34. Laumonier, Y. The Vegetation and Physiography of Sumatra: Maps; Springer: Berlin/Heidelberg, Germany, 1997; ISBN 978-0-7923-3761-4. [Google Scholar]
  35. Rembold, K.; Mangopo, H.; Tjitrosoedirdjo, S.S.; Kreft, H. Plant diversity, forest dependency, and alien plant invasions in tropical agricultural landscapes. Biol. Conserv. 2017, 213, 234–242. [Google Scholar] [CrossRef]
  36. Guillaume, T.; Damris, M.; Kuzyakov, Y. Losses of soil carbon by converting tropical forest to plantations: Erosion and decomposition estimated by δ13C. Glob. Chang. Biol. 2015, 21, 3548–3560. [Google Scholar] [CrossRef] [PubMed]
  37. Koks, J.A. Tropical Forest Conversion to Rubber and Oil Palm Plantations: Landscape-scale and Inter-annual Variability of Soil Greenhouse Gas (GHG) Fluxes and the Contribution of Tree-stem Emissions to the Soil GHG Budget in Jambi Province, Sumatra, Indonesia. Ph.D. Thesis, University of Goettingen, Göttingen, Germany, 2019. Unpublished. [Google Scholar]
  38. Granier, A. Une nouvelle méthode pour la mesure du flux de sève brute dans le tronc des arbres. In Annales des Sciences Forestières; EDP Sciences: Les Ulis, France, 1985; Volume 42, pp. 193–200. [Google Scholar] [CrossRef]
  39. Röll, A.; Niu, F.; Meijide, A.; Ahongshangbam, J.; Ehbrecht, M.; Guillaume, T.; Kreft, H. Transpiration on the rebound in lowland Sumatra. Agric. For. Meteorol. 2019, 274, 160–171. [Google Scholar] [CrossRef]
  40. Oishi, A.C.; Oren, R.; Stoy, P.C. Estimating components of forest evapotranspiration: A footprint approach for scaling sap flux measurements. Agric. For. Meteorol. 2008, 148, 1719–1732. [Google Scholar] [CrossRef] [Green Version]
  41. AgiSoft PhotoScan Professional (Version 1.5.1) (Software). 2019. Available online: http://www.agisoft.com/downloads/installer/ (accessed on 25 December 2019).
  42. QGIS Development Team. QGIS Geographic Information System; Open Source Geospatial Foundation Project. 2019. Available online: http://qgis.osgeo.org/ (accessed on 25 December 2019).
  43. CloudCompare. CloudCompare (version 2.9) [GPL software]. 2019. Available online: http://www.cloudcompare.org/ (accessed on 25 December 2019).
  44. Roussel, J.R.; Auty, D. lidR: Airborne LiDAR Data Manipulation and Visualization for Forestry Applications; R Package Version 1.6.1. 2018. Available online: https://rdrr.io/cran/lidR/ (accessed on 10 October 2019).
  45. Silva, C.A.; Crookston, N.L.; Hudak, A.T.; Vierling, L.A. rLiDAR: An R Package for Reading, Processing and Visualizing LiDAR (Light Detection and Ranging) Data, R Package Version 0.1. 2015. Available online: http://cran.rproject.org/web/packages/rLiDAR/index.html (accessed on 20 September 2017).
  46. Knapp, N. MeanShiftR: Tree Delineation from Lidar Using Mean Shift Clustering. R Package. 2019. Available online: https://rdrr.io/github/niknap/MeanShiftR/ (accessed on 10 October 2019).
  47. Goutte, C.; Gaussier, E. A Probabilistic Interpretation of Precision, Recall and F-Score, with Implication for Evaluation. In Advances in Information Retrieval; Losada, D.E., Fernández-Luna, J.M., Eds.; Springer: Berlin/Heidelberg, Germany, 2005; pp. 345–359. [Google Scholar]
  48. Angelo Canty and B. D. Ripley Boot: Bootstrap R (S-Plus) Functions. R Package Version 13-24. 2019. Available online: https://cran.r-project.org/web/packages/boot/index.html (accessed on 10 October 2019).
  49. Davison, A.C.; Hinkley, D.V. Bootstrap Methods and Their Application; Cambridge University Press: Cambridge, UK, 1997; ISBN 0-521-57391-2. [Google Scholar]
  50. R Core Team. R: A Language and Environment for Statistical Computing; R Foundation for Statistical Computing: Vienna, Austria, 2019. [Google Scholar]
  51. Michael, W.; Olga, B.; Paul, H.; John, B.C.; Yaroslav, H.; Stephan, H.; Alistair, M.; Tom, A.; Tal, Y.; Tobias, M.; et al. Seaborn: Statistical Data Visualization. Python Library Version 0.9.0. 2018. Available online: https://zenodo.org/record/1313201#.Xhcqt1VKiUk (accessed on 10 October 2019).
  52. Granier, A.; Biron, P.; Bréda, N.; Pontailler, J.-Y.; Saugier, B. Transpiration of trees and forest stands: Short and long-term monitoring using sapflow methods. Glob. Chang. Biol. 1996, 2, 265–274. [Google Scholar] [CrossRef]
  53. Kunert, N.; Aparecido, L.M.T.; Wolff, S.; Higuchi, N.; Santos, J.; dos Araujo, A.C.; de Trumbore, S. A revised hydrological model for the Central Amazon: The importance of emergent canopy trees in the forest water budget. Agric. For. Meteorol. 2017, 239, 47–57. [Google Scholar] [CrossRef]
  54. Lindberg, E.; Holmgren, J. Individual tree crown methods for 3D data from remote sensing. Curr. For. Rep. 2017, 3, 19–31. [Google Scholar] [CrossRef] [Green Version]
  55. Næsset, E.; Nelson, R. Using airborne laser scanning to monitor tree migration in the boreal–alpine transition zone. Remote Sens. Environ. 2007, 110, 357–369. [Google Scholar] [CrossRef]
  56. Parker, G.G.; Stone, P.J.; Bowers, D. A balloon for microclimate observations within the forest canopy. J. Appl. Ecol. 1996, 33, 173–177. [Google Scholar] [CrossRef]
  57. Pirotti, F.; Kobal, M.; Roussel, J.R. A comparison of tree segmentation methods using very high density airborne laser scanner data. ISPRS Int. Arch. Photogramm. Remote Sens. Spat. Inf. Sci. 2017, 42W7, 285. [Google Scholar] [CrossRef] [Green Version]
  58. Ferraz, A.; Bretar, F.; Jacquemoud, S.; Gonçalves, G.; Pereira, L.; Tomé, M.; Soares, P. 3-D mapping of a multi-layered Mediterranean forest using ALS data. Remote Sens. Environ. 2012, 121, 210–223. [Google Scholar] [CrossRef]
  59. Zaforemska, A.; Xiao, W.; Gaulton, R. Individual tree detection from UAV LiDAR data in a mixed species woodland. ISPRS Int. Arch. Photogramm. Remote Sens. Spat. Inf. Sci. 2019, XLII-2/W13, 657–663. [Google Scholar] [CrossRef] [Green Version]
  60. Hatton, T.J.; Moore, S.J.; Reece, P.H. Estimating stand transpiration in a Eucalyptus populnea woodland with the heat pulse method: Measurement errors and sampling strategies. Tree Physiol. 1995, 15, 219–227. [Google Scholar] [CrossRef]
  61. Hatton, T.J.; Wu, H.-I. Scaling theory to extrapolate individual tree water use to stand water use. Hydrol. Process. 1995, 9, 527–540. [Google Scholar] [CrossRef]
  62. Oren, R.; Phillips, N.; Ewers, B.E.; Pataki, D.E.; Megonigal, J.P. Sap-flux-scaled transpiration responses to light, vapor pressure deficit, and leaf area reduction in a flooded Taxodium distichum forest. Tree Physiol. 1999, 19, 337–347. [Google Scholar] [CrossRef] [Green Version]
  63. Vauhkonen, J.; Næsset, E.; Gobakken, T. Deriving airborne laser scanning based computational canopy volume for forest biomass and allometry studies. ISPRS J. Photogramm. Remote Sens. 2014, 96, 57–66. [Google Scholar] [CrossRef]
  64. Cermak, J.; Kucera, J. Scaling up Transpiration Data Between Trees, Stands and Watersheds. Silva Carelica Finl. 1990. Available online: http://agris.fao.org/agris-search/search.do?recordID=FI9500013 (accessed on 20 November 2019).
  65. Kume, T.; Tsuruta, K.; Komatsu, H.; Shinohara, Y.; Katayama, A.; Ide, J.; Otsuki, K. Differences in sap flux-based stand transpiration between upper and lower slope positions in a Japanese cypress plantation watershed. Ecohydrology 2016, 9, 1105–1116. [Google Scholar] [CrossRef]
  66. Kumagai, T.; Tateishi, M.; Shimizu, T.; Otsuki, K. Transpiration and canopy conductance at two slope positions in a Japanese cedar forest watershed. Agric. For. Meteorol. 2008, 148, 1444–1455. [Google Scholar] [CrossRef]
  67. Rembold, K.; Brambach, F.; Waite, P.A. Tree location map and inventory dataset of trees with a DBH ≥ 10 cm in four riparian and four upland plots in Harapan rainforest. Unpublished.
  68. Kotowska, M.; Waite, P.A. Datasets of aboveground biomass in four upland and four riparian plots in Harapan rainforest. Unpublished.
Figure 1. Location of the four upland and four riparian study plots in Jambi Province in the lowlands of Sumatra, Indonesia.
Remotesensing 12 00651 g001
Figure 2. RGB orthomosaic image of one of the riparian study plots (HFr2).
Remotesensing 12 00651 g002
Figure 3. Tree water use vs. (a) crown volume and (b) crown surface area. Water use rates were estimated with sap flux techniques; 42 sap flux sample trees could be clearly identified in the aerial images (pooled data from upland and riparian plots). Crown metrics were derived from simultaneously carried out drone-based surveys.
Remotesensing 12 00651 g003
Figure 4. Spatial heterogeneity of canopy transpiration (Et, mm day−1) within the (a) four upland and (b) four riparian study plots derived from the water use vs. crown surface area relationship (Figure 3b). The blank tiles are due to the exclusion of low level canopies.
Remotesensing 12 00651 g004
Table 1. Trees per plot, diameters at breast height (DBH, ≥ 10 cm) and tree heights at the eight study plots (50 x 50 m2).
PlotTrees per Plot (n)DBH (cm)Height (m)
meanminmaxmeanminmax
HF112521.910.167.919.78.352.2
HF217220.110.467.518.47.848.0
HF314622.610.280.221.14.344.5
HF414322.510.076.821.02.548.2
HFr113517.810.067.016.91.142.5
HFr213620.110.056.318.31.434.4
HFr316017.910.151.019.95.236.7
HFr414020.710.1108.120.44.644.0
Table 2. Accuracy assessment of the automatically segmented trees by the AMS3D individual tree crown delineation method. Tree counts from the ground vs. aerial assessments, relative differences and accuracy metrics for each of the eight study plots.
Ground-Based Counted TreesDrone-Based Detected TreesDifference (%)True PositiveFalse PositiveFalse NegativePrecisionRecallF-Index
HF112516222.87884400.480.680.56
HF21721815.08299650.450.600.52
HF31461598.29663440.600.590.60
HF41421516.08566510.560.560.56
HFr11351403.67466310.530.680.60
HFr213615512.38669110.560.860.68
HFr315714012.110139330.720.540.62
HFr41401527.98864290.580.690.63
Mean1441557.08668380.560.650.60
Table 3. Tree counts at the eight study plots based on automated crown segmentation using the AMS3D individual tree crown delineation method. Subsequently, the crown metrics volume, surface area and projection area were derived for all segmented trees.
Plot IDDrone-Based Detected TreesCrown Volume (m3)Crown Surface Area (m2)Crown Projection Area (m2)
meanminmaxmeanminmaxmeanminmax
HF1162409.15.42817.0311.918.61217.030.53.3165.0
HF2181338.93.93659.0260.118.61292.035.62.5249.6
HF3159512.11.74826.0337.510.91578.039.32.2299.5
HF4151610.31.44702.0393.212.01493.045.92.5251.9
HFr1140121.00.9843.6141.07.7588.112.51.749.0
HFr215561.60.7427.690.87.8353.210.02.338.4
HFr3140153.91.31068.0155.910.1562.721.42.3126.6
HFr4152370.51.64221.0275.79.91376.035.91.7298.5
Table 4. Uncertainties associated with the scaling of transpiration from tree-level to stand-level based on different ground and drone-based methods. R2 and P-values of linear regressions between plant water use and the according scaling variables. Uncertainties associated with scaling-up to stand transpiration based on these relationships, derived from parametric bootstrapping (with 50,000 iterations). N is the sample size of trees with sap flux measurements.
Scaling ApproachR2P ValueMean Tree Water Use (WUmean) kg day−1Bootstrapped Scaling Uncertainty %
Ground-based measurementsN x WUmean--27.63 (measured)67.51
DBH (cm)0.38<0.00127.5250.6
Drone-based crown metricsCrown volume (convex hull, m3)0.63<0.00127.6319.9
Crown surface area (m2)0.76<0.00127.5517.0
Crown projection area (m2)0.68<0.00127.5121.6
1 no bootstrapping possible, instead CV-based approach Granier [52].

