Letter

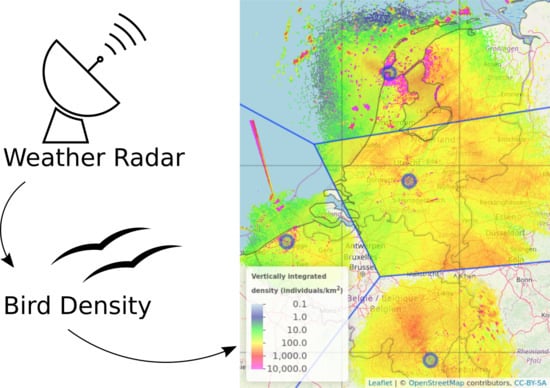
High-Resolution Spatial Distribution of Bird Movements Estimated from a Weather Radar Network

by
Bart Kranstauber
1,*,
Willem Bouten
1,
Hidde Leijnse
2,
Berend-Christiaan Wijers
1,
Liesbeth Verlinden
1,
Judy Shamoun-Baranes
1 and
Adriaan M. Dokter
1,3
1
Institute for Biodiversity and Ecosystem Dynamics, University of Amsterdam, P.O. Box 94248, 1090 GE Amsterdam, The Netherlands
2
R&D Observations and Data Technology, Royal Netherlands Meteorological Institute, 3731 GA De Bilt, The Netherlands
3
Cornell Lab of Ornithology, Cornell University, Ithaca, NY 14850, USA
*
Author to whom correspondence should be addressed.
Remote Sens. 2020, 12(4), 635; https://doi.org/10.3390/rs12040635
Submission received: 18 December 2019 / Revised: 5 February 2020 / Accepted: 7 February 2020 / Published: 14 February 2020
(This article belongs to the Special Issue Radar Aeroecology)

Abstract

:
Weather radars provide detailed information on aerial movements of organisms. However, interpreting fine-scale radar imagery remains challenging because of changes in aerial sampling altitude with distance from the radar. Fine-scale radar imagery has primarily been used to assess mass exodus at sunset to study stopover habitat associations. Here, we present a method that enables a more intuitive integration of information across elevation scans projected in a two-dimensional spatial image of fine-scale radar reflectivity. We applied this method on nights of intense bird migration to demonstrate how the spatial distribution of migrants can be explored at finer spatial scales and across multiple radars during the higher flying en-route phase of migration. The resulting reflectivity maps enable explorative analysis of factors influencing their regional and fine-scale distribution. We illustrate the method’s application by generating time-series of composites of up to 20 radars, achieving a nearly complete spatial coverage of a large part of Northwest Europe. These visualizations are highly useful in interpreting regional-scale migration patterns and provide detailed information on bird movements in the landscape and aerial environment.

Graphical Abstract

1. Introduction

Quantitative information about the spatio-temporal distribution of migratory birds is important for conservation and reducing human-wildlife conflicts [1,2]. Of the variety of methods used to study migration, only a few are suitable to provide insight into spatio-temporal changes in abundance of migrants, especially across large regions and across a broad range of avian taxa; one highly suitable method is the use of networks of weather radars, e.g., [3,4,5]. Existing radar infrastructure maintained by meteorological institutes provides information on bird migration over extended temporal and spatial scales. Weather radars are continuously operated and generally scan the airspace in cycles of five to 15 min. Recent studies using weather radars have provided insight into questions that require a broad-scale perspective on migration and movement, such as the influence of light pollution on broad-front migration [6,7], the seasonal changes in population sizes and routes [3], spatio-temporal variation in migration patterns [5], and the decline of migratory populations [8].
Networks of weather radars cover large parts of the globe, (see Figure 1 in [9]). In Europe, there are already 164 radars that regularly exchange data in the Operational Programme for the Exchange of Weather Radar (OPERA) network [10], while there are 160 in the North American Next-Generation Radar (NEXRAD) network [9], with more radars distributed in many other countries [11]. A quick calculation assuming a detection range of 100 km for biological targets while accounting for overlap shows that the current European network continuously surveys a large part of the European landmass (2/3). In North America (United States and Canada), coverage is one fourth due to a sparser radar network; globally, this is one eighth, (using the reported radars; [12]). Radar networks thus provide ongoing measurements of bird migration across continents. While separating bird echos from others, many studies using multiple weather radars have aggregated the spatially explicit radar images into one single vertical profile of migration speed, direction, and density for each altitude of interest per radar, e.g., [3,5,7,8]. Although profile-based analyses provide great insights on a continental scale, they limit the interpretation on a regional scale and remove any information about spatial heterogeneity within the field of view of a single radar. This interpretation on a regional scale is of great importance to gain insight into responses to habitat and land use, as well as to inform the fine-scale planning of wind energy or aviation flight planning [2].
An important factor complicating the interpretation of radar imagery is the change of observed airspace with distance from the radar. Each elevation scan samples only part of the airspace. As the distance from the radar increases, a given scan measures the airspace at higher altitudes above the Earth’s surface, because of the curvature of the Earth and the elevation angle of the beam. Furthermore, the beam width increases with distance; therefore, measurements at larger distances sample a wider height band. Even the lowest elevation scans miss information at lower altitudes, and broader altitude bands are sampled at larger distances from the radar. As a result, altitudinal variability in the density of migrants can give rise to apparent spatial patterns in individual elevation scans, e.g., high altitude migration layers appear as spatial donuts when projected on the Earth (Figure 1). In many studies of migration using weather radar, the loss of information at lower altitudes with increasing distance from the radar is avoided by analyzing data within a relatively small radius around the radar [13,14]. Even though most commonly used software includes functionality to visualize radar data using “plan position indicator” (PPI) plots, these visualize one elevation scan and do not correct for a difference in observation height or height distribution with increasing distance from the radar. Furthermore, migration at higher altitudes is missed close to the radar in lower elevation scans. These problems are not unique to aeroecology; in radar meteorology, the vertical variability of precipitation can cause apparent horizontal structures in radar imagery. This type of pattern is often seen when the zero degree isotherm is at the height of the radar beam and is known as the bright band, caused by melting snow [15,16].
Figure 1 illustrates the challenges arising when trying to interpret a two-dimensional representation of migration density from one elevation scan when migration takes place at a high altitude. On this night, bird migration was concentrated in a layer between 2 and 3 km a.s.l. (see the vertical profile in Figure 1A). Elevation scans of such layering events typically show a donut-shaped reflectivity pattern (Figure 1B,C), with high reflectivities appearing at locations where the radar beam intersects with the high-altitude migration layer. This donut-shaped pattern poorly represents the spatial distribution in the number of migrants aloft.
Earlier work of Buler and Diehl [17] investigated corrections to radar imagery for these distance effects. Their work focused on the distribution of birds at departure after sunset [17,18], to identify areas in the landscape where migratory birds stop to rest and refuel. Flight altitudes are still low at this time, with birds observed primarily in the lowest elevation scans of the radar. The correction method therefore only needs to be applied to the lowest elevation angle scan.
For studies focusing on bird migration en-route, birds fly at multiple altitude layers [19], and a corrected image cannot be obtained from the lowest elevation scans alone. We, therefore, develop an approach that vertically integrates radar reflectivity over all elevation scans to estimate a spatially explicit image of radar reflectivity that accounts for changes in beam shape with distance from the radar. The vertical integration of elevation scans that we present can be applied across radars to get a detailed spatial representation of radar reflectivity from local to regional scales. Our goal is to get more insight into bird movements by providing a two-dimensional representation of radar reflectivity independent of distance. We apply our method to create a spatial distribution of the estimated vertically integrated density (VID) for 20 radars, which we display as a single composite. This composite visualizes the VID over regional and continental scales. We use this composite to explore dynamic visualizations and show its value in interpreting the spatial distribution of the VID and highlight multiple migratory phenomena. We also discuss some of the limitations of this approach and suggest areas for future research.

2. Materials and Methods

Here, we first explain the calculation of the VID map. To demonstrate the value of the method, we discuss observed patterns of several case studies described in more detail below. We emphasize the general application of the algorithm without radar specific optimizations.

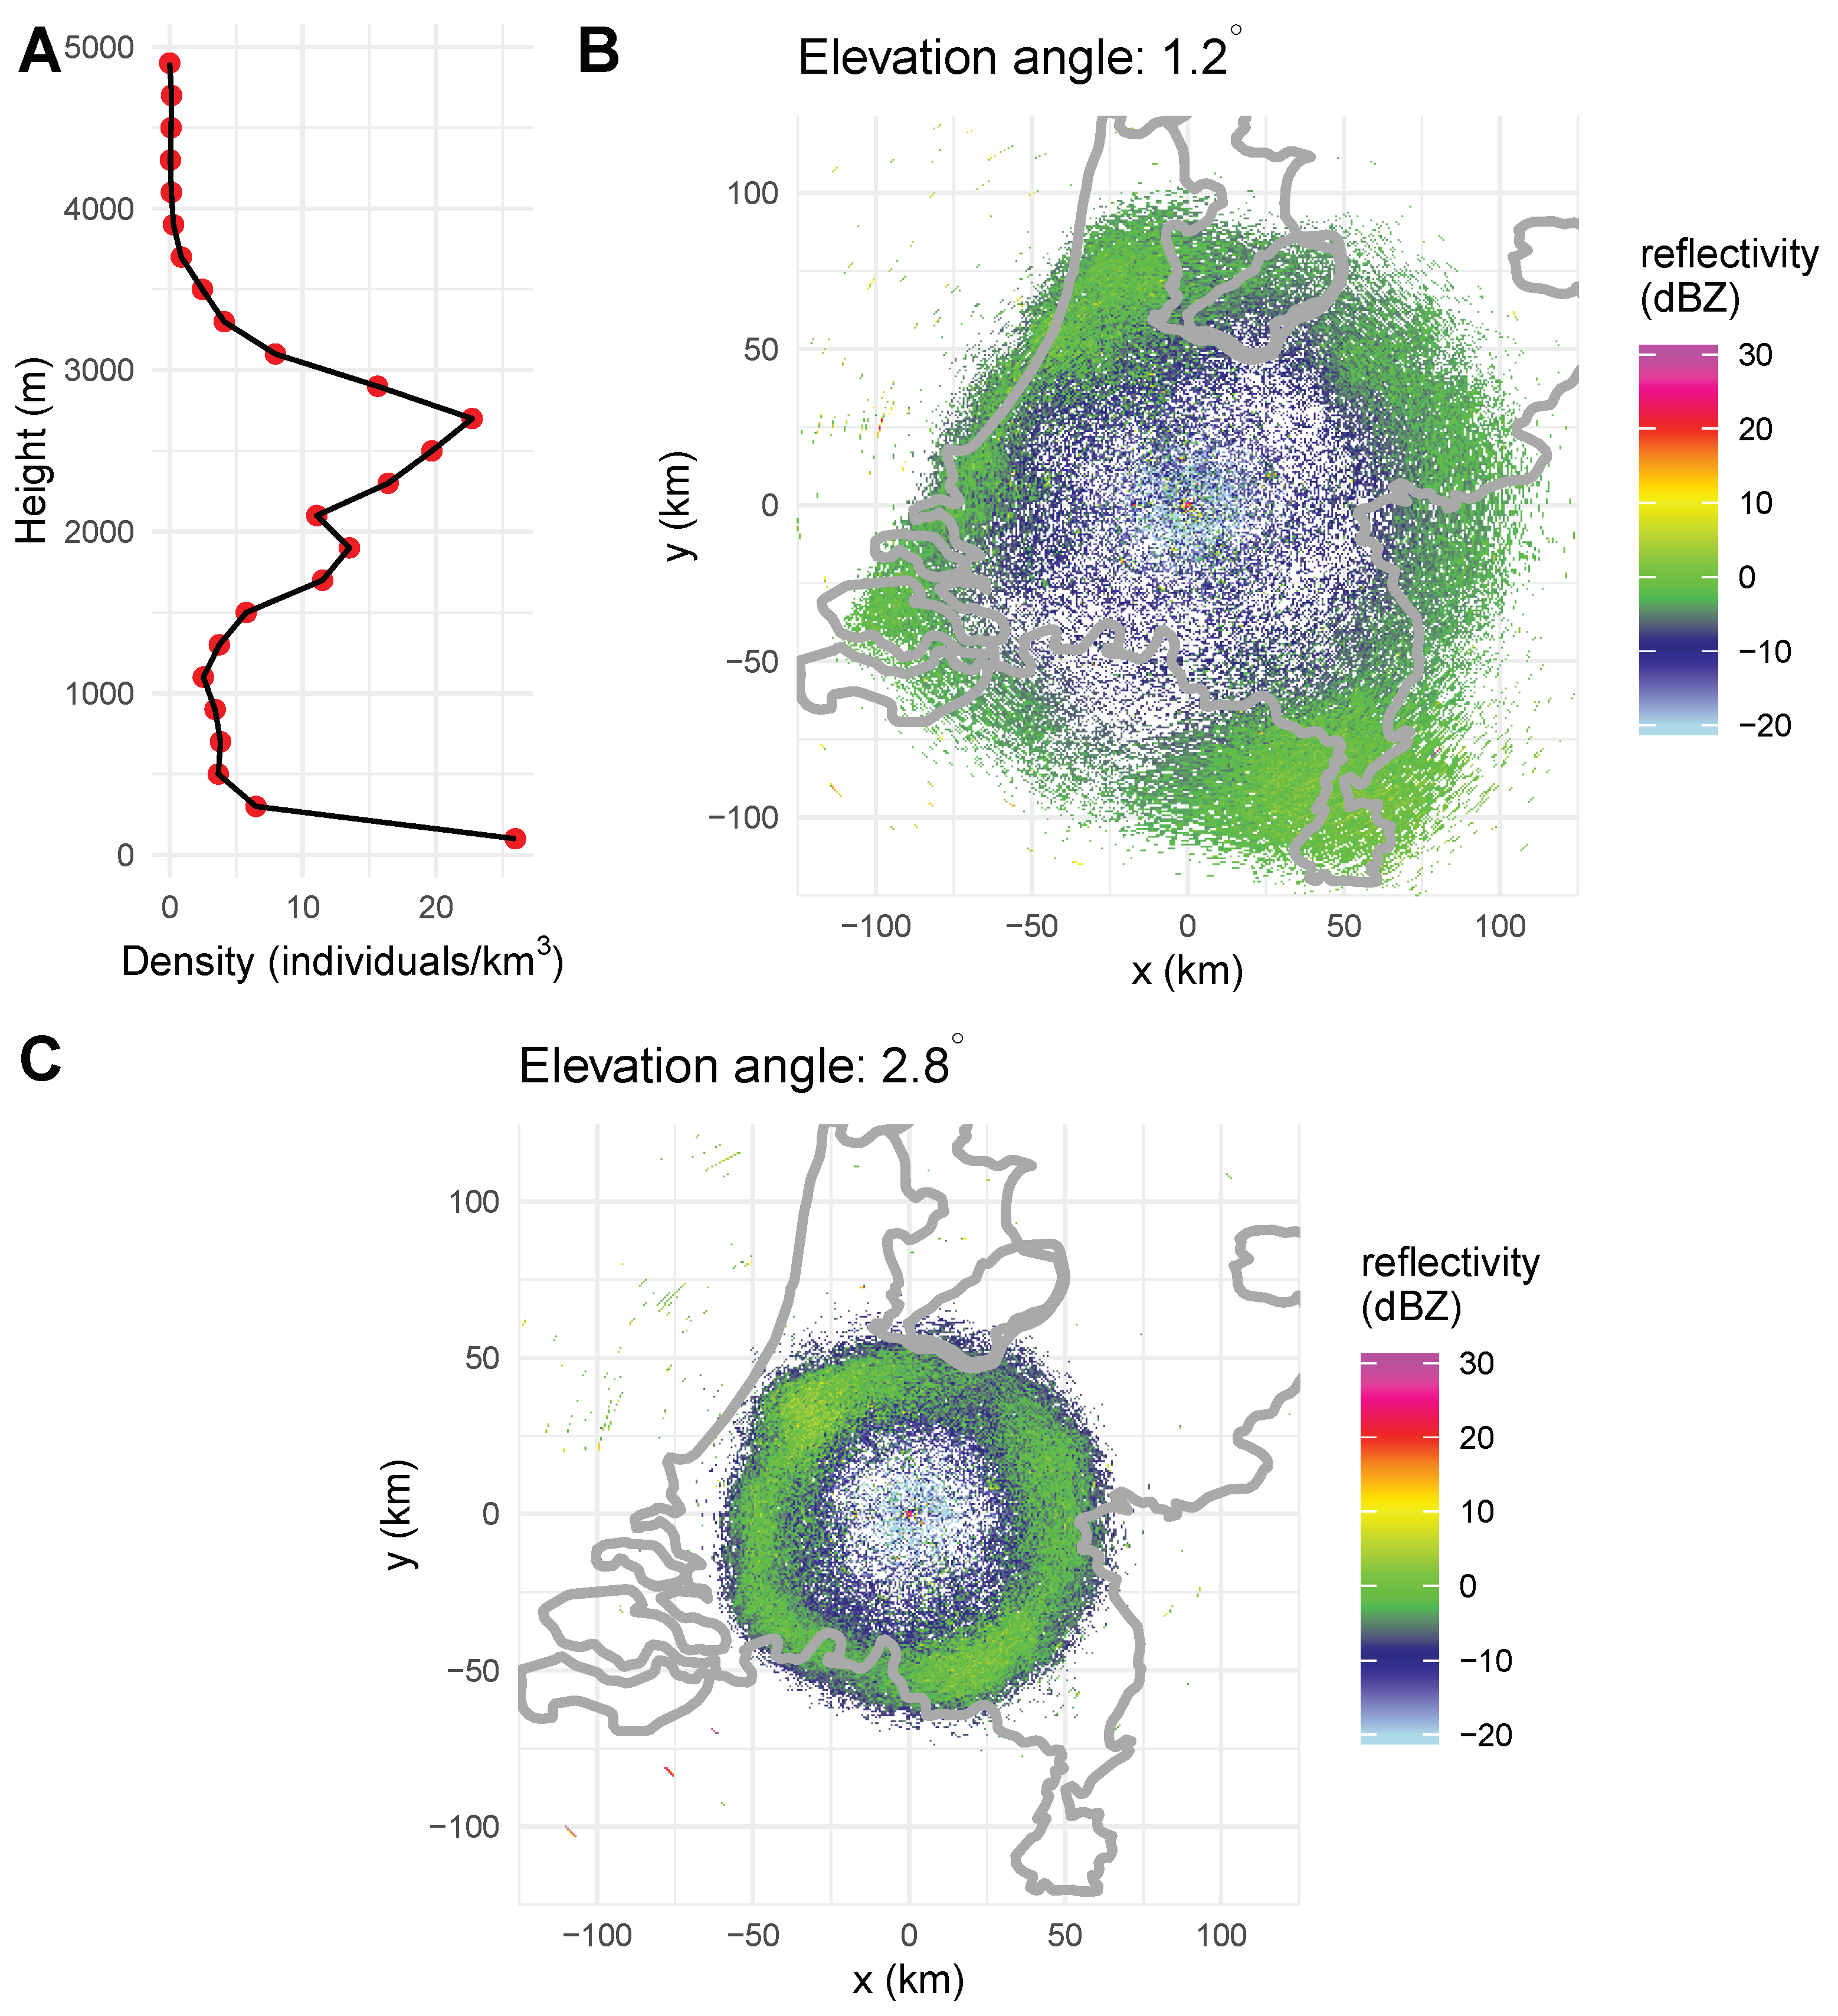
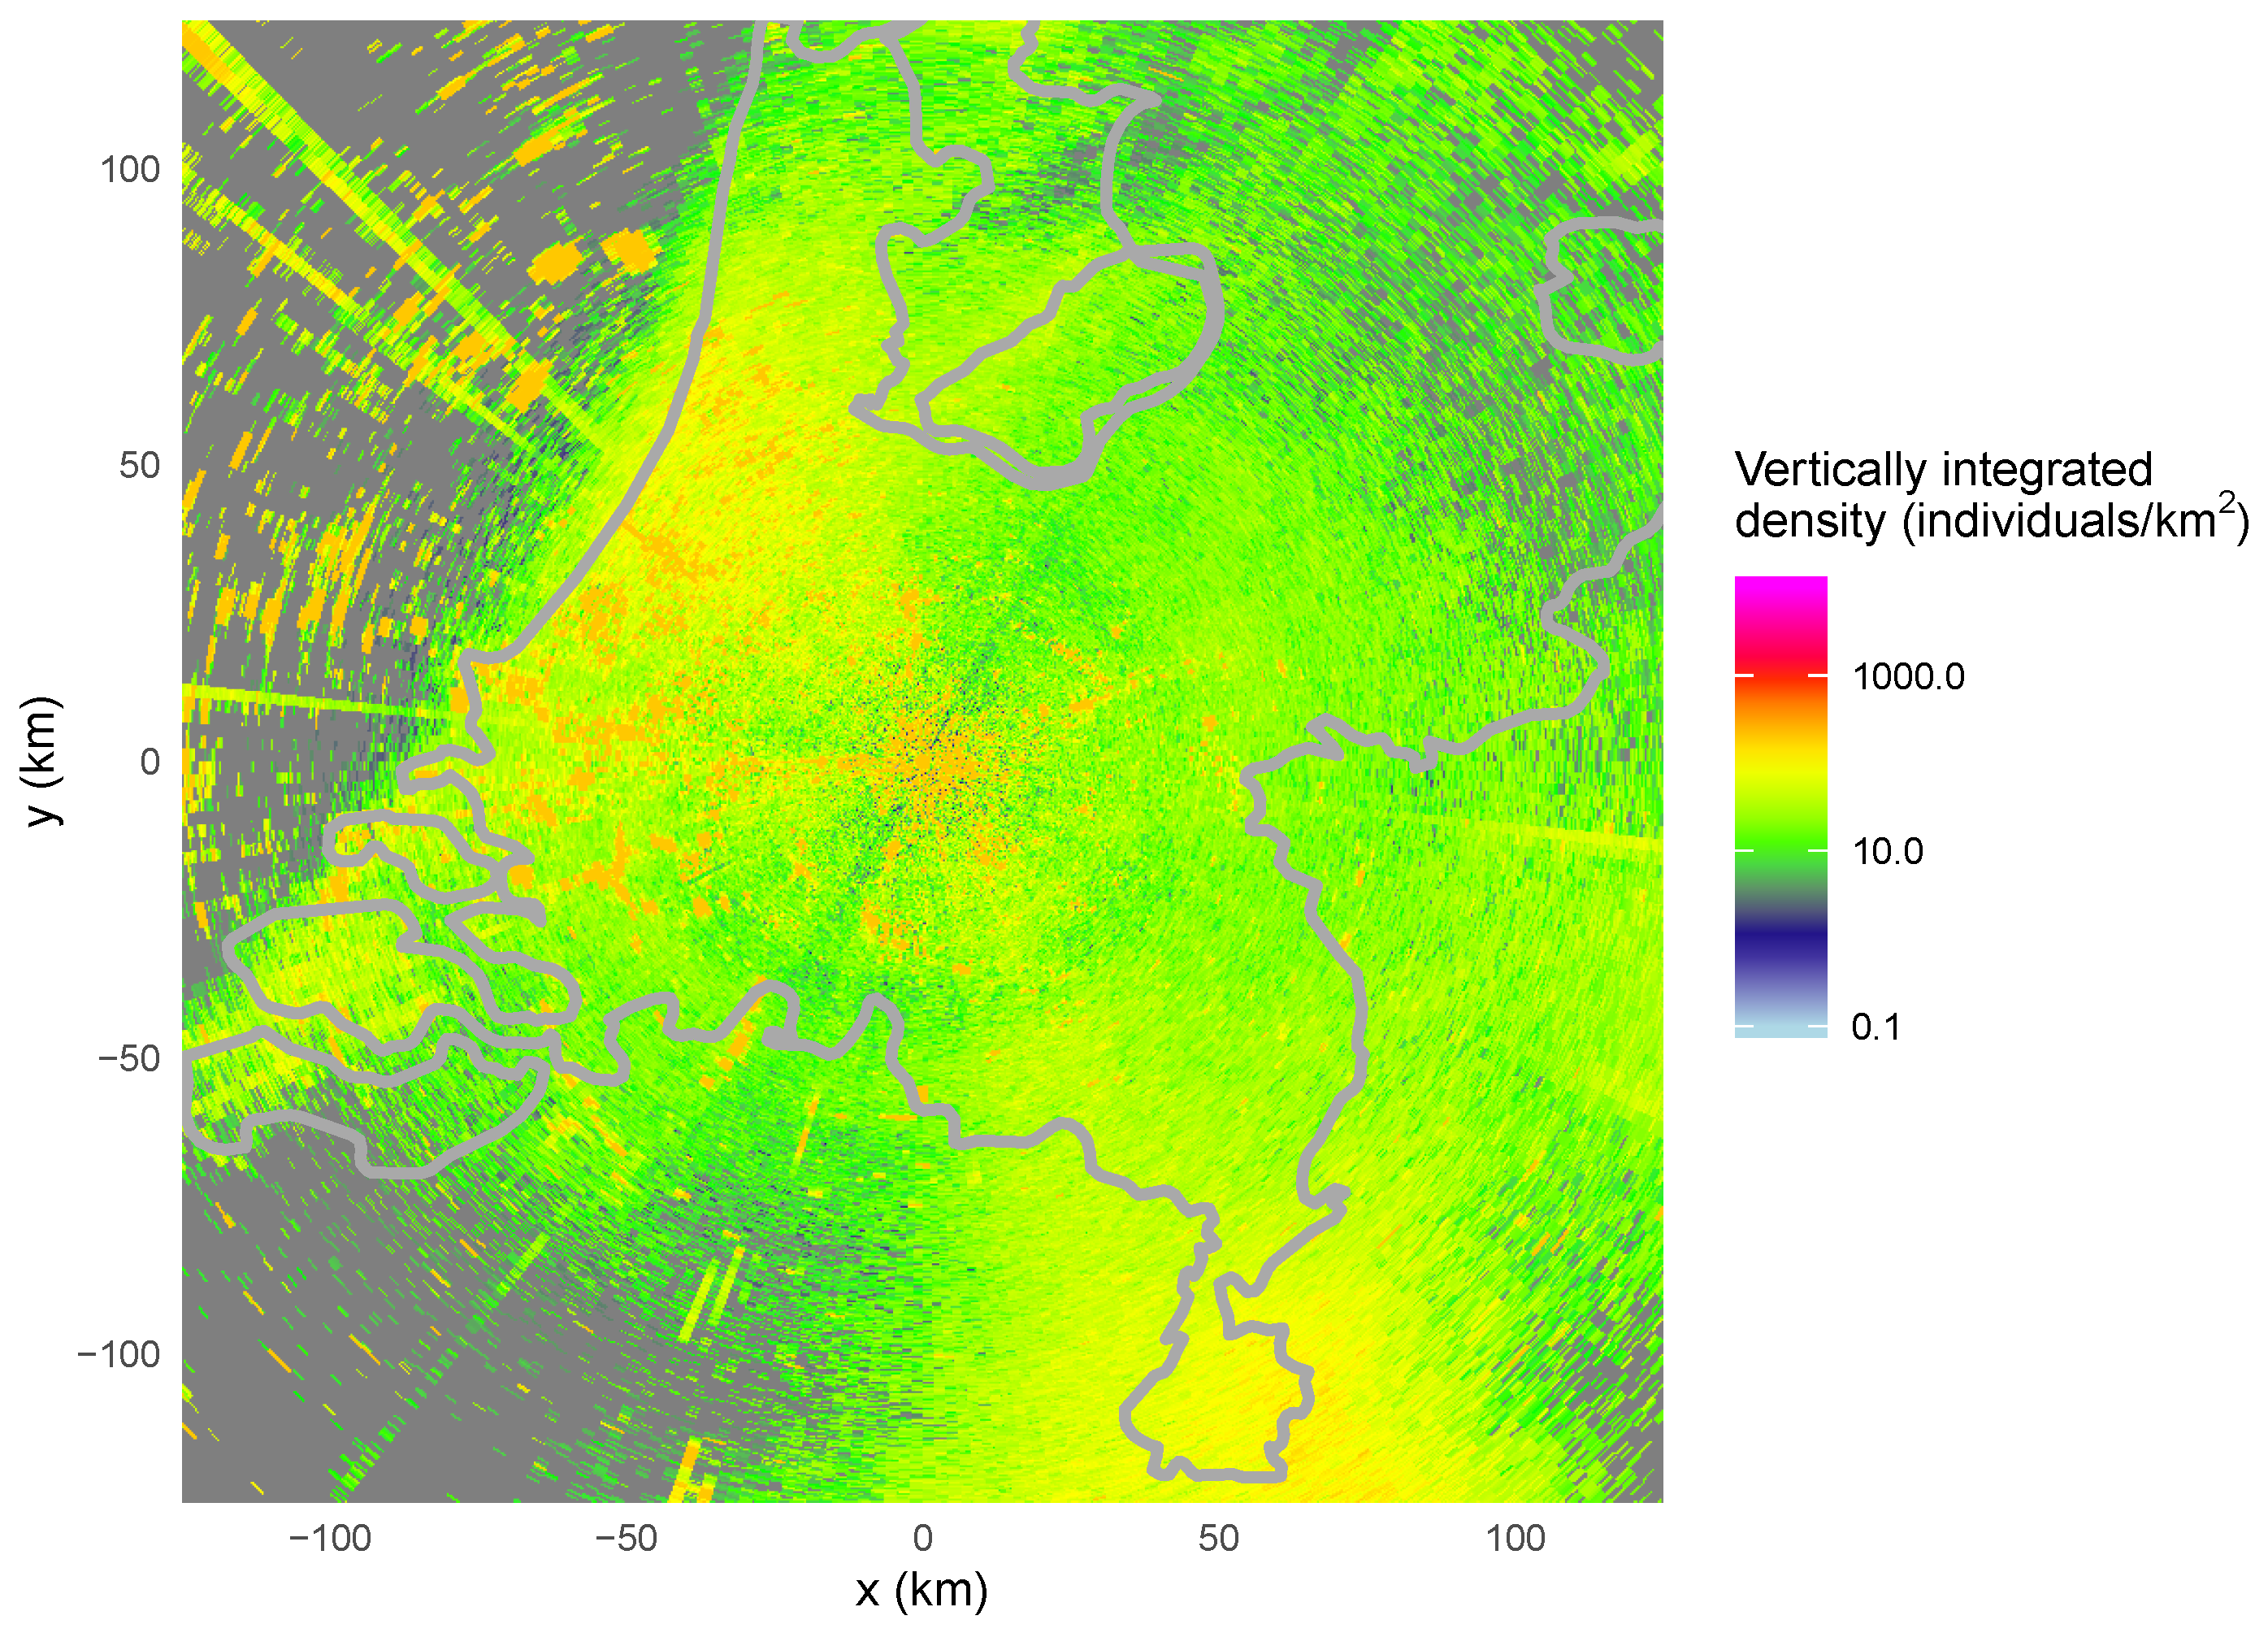
2.1. Spatial estimates of Vertically Integrated Density

Our goal is to account for beam shape effects and to estimate a map revealing the spatial distribution of the number of birds aloft. To do so, we will:
  • integrate over the vertical dimension by taking into account all radar scans recorded at different elevations
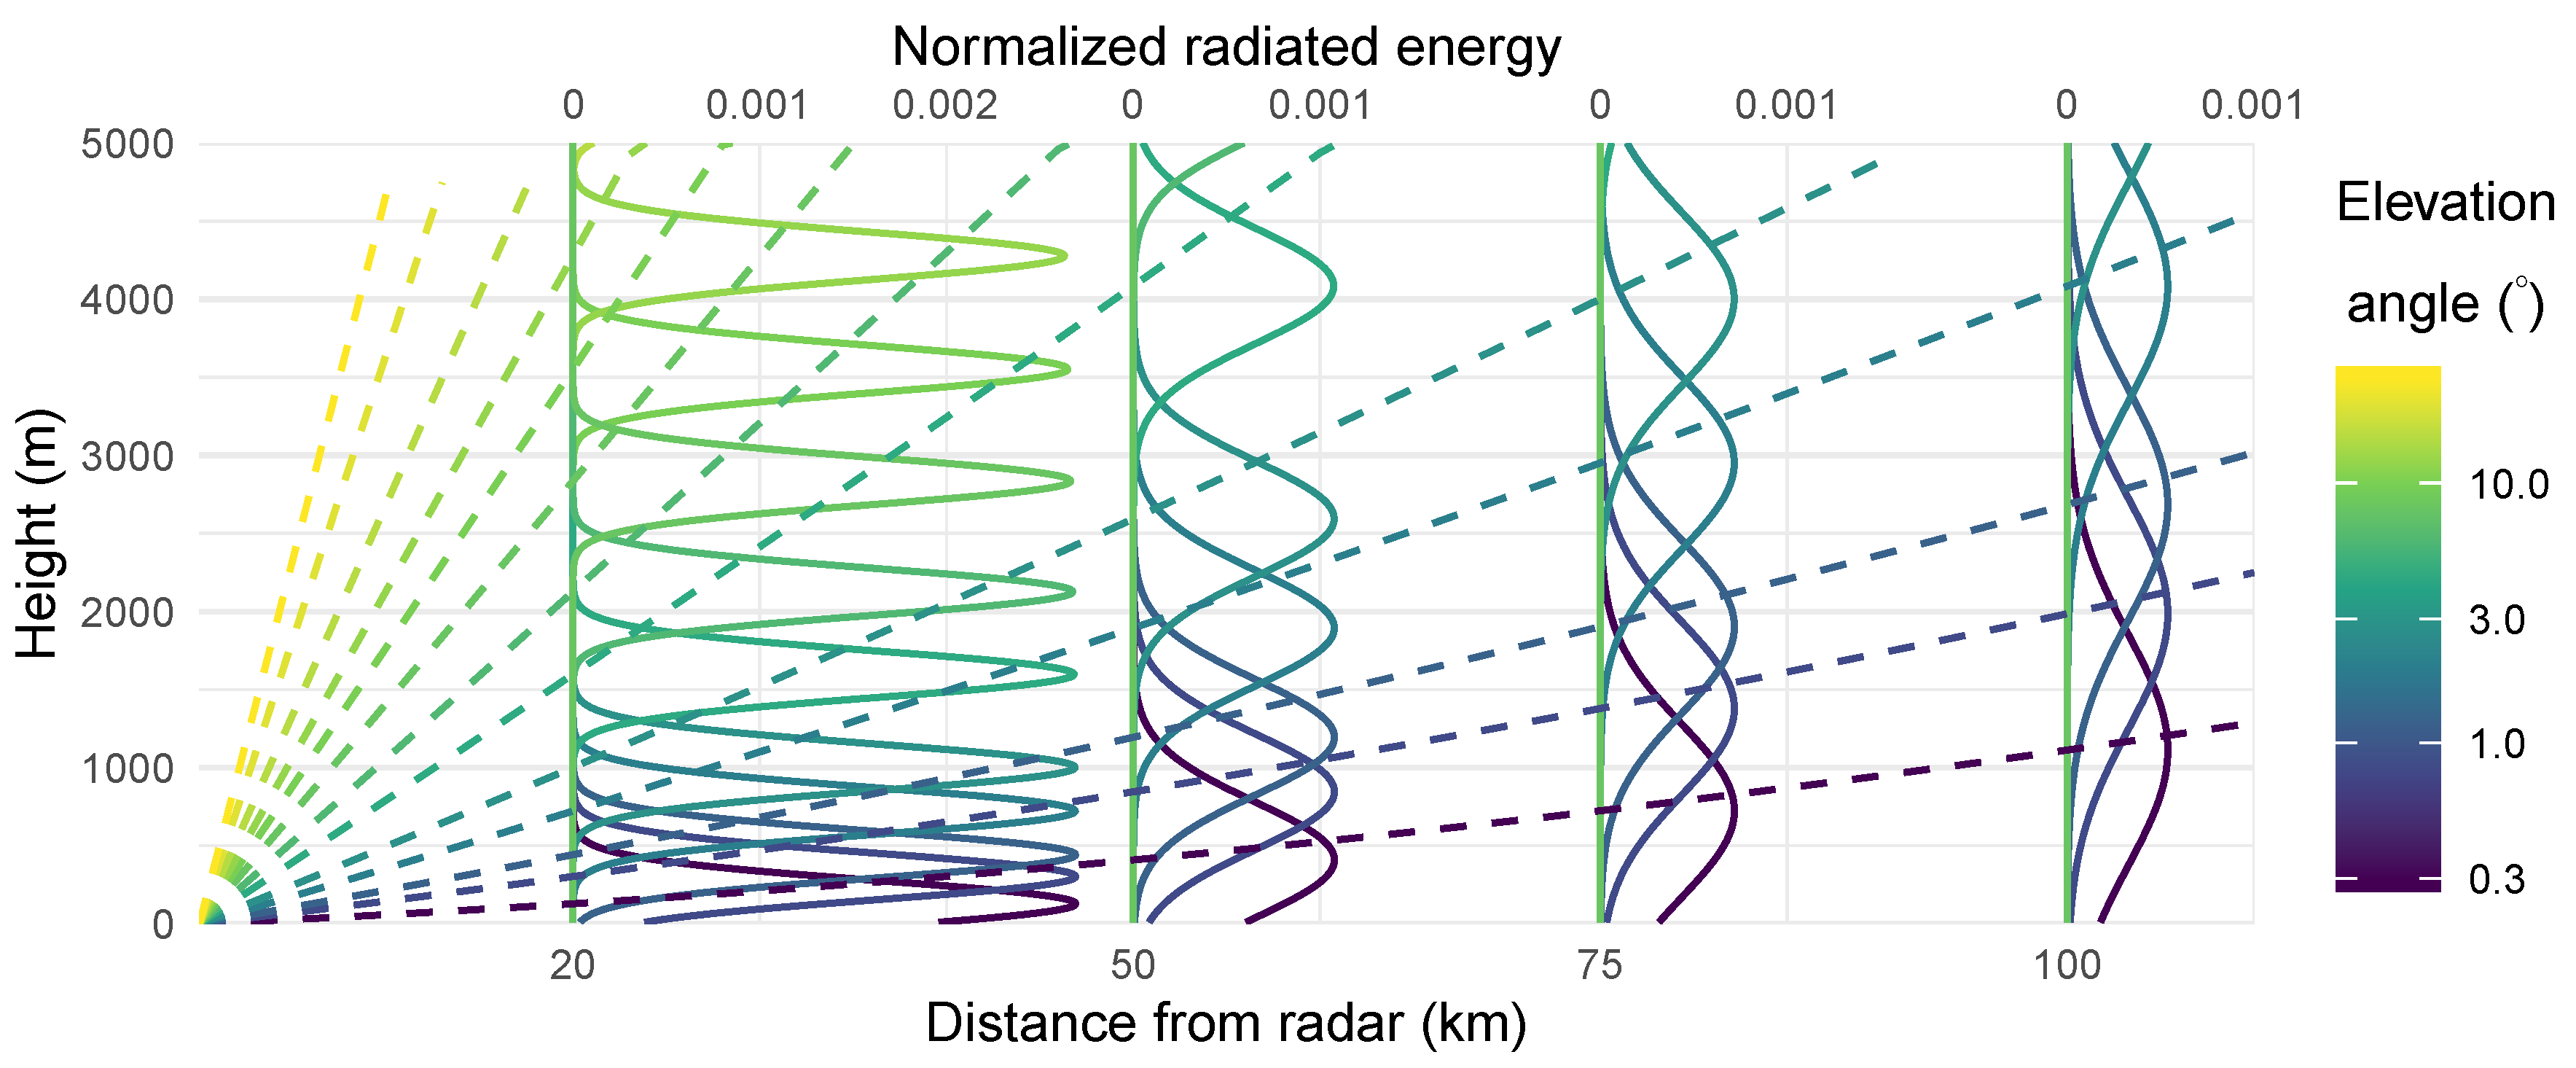
  • account for the changing overlap between the radar beams as a function of range
In our analysis, we will treat the (normalized) altitudinal distribution and the number of birds at a radar location separately, because of different expected spatial auto-correlations for these two quantities. Wind and temperature patterns strongly govern the altitudinal distribution of flying birds (e.g., [19,20,21]). Since atmospheric circulation patterns vary relatively gradually geographically [22], we expect birds within the radar domain to select fairly similar flight altitudes [but note the possibility of substantial differences in flight altitude at water-land interfaces, e.g., [23] or Archibald et al. [24] on the descent of nocturnal migrants at dawn over the Great Lakes]. We will, therefore, treat the normalized altitudinal distribution of birds as constant within the radar domain. In contrast, we expect more geographic variation in the total numbers of birds aloft, as a result of variation in the take-off distribution, which reflects variation in land cover and available stopover habitat [17]. Additional spatial variation will be caused by the geometry of landmasses and coastlines that structure the migratory flow.
We estimate the normalized altitudinal distribution of birds using a vertical profiling method to distinguish birds from other sources of reflectivity and estimate density with altitude [13]. This provides us with the average reflectivity by birds η ( h ) as a function of height h. The vertical profile is estimated only from data collected close to the radar (between 5 and 25 km range), since at longer ranges, the radar beam becomes too broad to resolve altitudinal patterns and may start to overshoot the layer of migration. We apply an often used algorithm; however, our approach is not specific to the vertical profiling method and is generalizable to other profiling methods, e.g., [14,25].
From the profile η ( h ) , we calculate the vertically integrated reflectivity ( vir ) [26] as:
vir = 0 h m a x η ( h ) d h
which gives us a measure that is proportional to the total number of birds in a vertical column for the area around the radar for which the profile was calculated. h m a x is the maximum altitude that will be considered in the analysis, in our case 5 km.
Given a geographic grid with grid cell centers ( x , y ) in the radar domain, we calculate for each elevation scan i the polar coordinate ( r i ( x , y ) , α ( x , y ) ) that defines the point in space vertically above location ( x , y ) at height h i , with r i ( x , y ) range and α ( x , y ) azimuth. Geographic coordinates ( x , y ) are converted to polar coordinates ( r i , α ) using a spheroid Earth model with an equatorial radius of 6378 km and a polar radius of 6357 km, while accounting for beam refraction in the atmosphere using the 4/3 effective Earth’s radius model [27]. Here, we use a standard model for atmospheric propagation. The work of Buler and Diehl [17] accounted for changes due to non-standard refraction effects using radiosonde data. They noticed only minor improvements in the accuracy of their final model. For this reason and the complications of including additional separate sources of information, we did not include this additional correction. The reflectivity (in linear units (cm2/km3)) measured at this location in scan i we denote as η i ( x , y ) [13,28].
We assumed that the antenna pattern b ( h , r , θ i ) had a Gaussian shape, see [29] and could hence be expressed as a function of height h, range r, and beam elevation: θ i as:
b ( h , r , θ i ) = 1 2 π e 1 2 ( h h b ( r , θ i ) w b ( r ) ) 2 ,
with h b ( r , θ i ) the height of the center of the beam (accounting for the radar’s antenna height) and w b ( r ) the beam’s width expressed as a normal standard deviation. Heights are expressed in meters above mean sea level throughout.
b ( h , r , θ i ) is plotted in Figure 2 for a volume scan of the Herwijnen radar in the Netherlands, with different elevations θ i indicated by different colors, and the radiated energy for four different ranges (20 km, 50 km, 75 km, and 100 km). The profiles of radiated energy broaden with range, and the overlap between the lower beams is considerable for heights below 5 km at longer ranges.
For each grid location ( x , y ) , we calculate the reflectivity η i ˜ ( x , y ) that we expect to measure if the altitude distribution of birds aloft at this location would be identical to the vertical profile η ( h ) measured at close range to the radar:
η i ˜ ( x , y ) = 0 h m a x b [ h , r i ( x , y ) , θ i ( x , y ) ] η ( h ) d h
Finally, we obtain a spatial image of the adjusted vertically integrated reflectivity ( VIR a ), as follows:
VIR a ( x , y ) = vir × R ( x , y ) , with   R = i η i ( x , y ) i η i ˜ ( x , y )
Our spatial image of VIR a equals the vir of the profile, times a spatial adjustment factor R. R is the ratio between the total sum of observed reflectivity values η i and the total sum of expected reflectivity values η ˜ i (i.e., expected given the bird’s vertical profile η ( h ) and the radar’s beam shape b ( h , r , θ i ) for each elevation scan at that location). If higher reflectivities are observed at ( x , y ) than expected based on the average profile η ( h ) , then the ratio R > 1 , and the vir value is adjusted upward. Likewise, if a lower reflectivity sum is detected at ( x , y ) , then ratio R < 1 , and the vir value is adjusted downward. The combined effect of this operation is a correction for changing overlap between the radar beams and the layer of birds and an integration over the altitudinal dimension.
In order to present biologically meaningful data, we converted integrated reflectivity to bird density by assuming a radar cross-section of 11 cm2 [13] for a single bird. This size is representative for passerine birds, which are the dominant nocturnal migrants in this region at this time of year.
An implementation of this approach is readily available within the biorad R package [26,30], through the function integrate_to_ppi.

2.2. Data

We illustrate the method using two case studies of composite radar images. We obtained data directly from the respective national weather services, of the Netherlands, Belgium, and Germany. All radars operated at C-band with a wavelength between 5.25 and 5.35 cm. The polar volume data (named “level II data” in the USA) was converted to the ODIM format where needed [31] and processed into vertical profiles, based on data within the 5–25 km range from the radar [13]. The calculation of vertical profiles used several filtering steps to identify birds, for example filtering out rain by a threshold on the value of the correlation coefficient moment.
There are a few consistent differences in the volume coverage pattern of radars between countries. The radars in the Netherlands have a lower first elevation angle of 0.3°, while both Germany and Belgium have a lowest elevation angle of 0.5°. The Dutch radars furthermore conduct three different scans within a five minute volume at this lowest elevation, two of which have a lower pulse repetition frequency, allowing the radar to look further. Our method accounted for these differences in volume coverage pattern as we calculated the vertically integrated reflectivity based on all available scans.

2.3. Case Studies

The first case study, a dataset of four radars across the Netherlands and Belgium, covered one night (3–4 October 2016) with intense migration across Europe [5]. In these countries, radars produced a full volume scan every five minutes, allowing for detailed interpretation of fine-scale temporal patterns. Sunset was at 17:07 (UTC; all times are UTC), while sunrise was at 05:49. To visualize these data, we made a composite by using estimates of bird densities from the closest radar. We also showed Voronoi polygons around the radar locations and a buffer of 200 km around each radar to indicate which radar was responsible for which area. The polygons ensured we always visualized data from the closest radar. For comparison across images, we used a fixed color scale. We visualized values beyond the color scale as the most extreme value of the color scale. When we could not calculate a vertical profile for biological echoes, for example, because of temporary rain close to a radar, we could not calculate the VID image, and therefore, the data of that radar are not shown.
A second case study is presented for a larger region that includes Germany. We generated a similar visualization to the first case study, for the night of 18 October 2017 at 21:00 that included in total 20 different radars. Exploration of the German data revealed that strong filtering was applied to the processed reflectivity data (quantity DBZH). After this filtering, hardly any biological signal was retained especially further away from the radar. Therefore, we opted to use the total unfiltered reflectivity, quantity: TH; see [31] and removed the part of the signal that was due to static objects as determined by a Doppler notch filter (quantity CCORH; [27]).

3. Results

The effect of vertical integration was evident from the result that the donut shape visible in individual scans (Figure 1B,C) was no longer visible in the VID product (Figure 3). The spatial VID estimate highlighted a region of high migratory density in the southeast of the Netherlands that was only visible in a limited number of scans as for most scans, the radar beam was either too low or too high (e.g., Figure 1C).
In the first case study, many features of migration were visible in the animations of the VID (Figure 4, Supplement S1, [32]). As the height profile varied over the night (Supplement S2), many of these features would either not be visible or more difficult to identify in normal PPI plots of the lowest elevation scan. Just before sunrise, very weak migration was visible (Figure 4A); bird densities were very low (speckled pattern around each radar), with very high reflectivity representing non-biological features (see below). Migration started between 17:40 and 18:00, and VID increased across the whole region surveyed by radars. Immediately thereafter, estimated densities above the sea off the coast of Belgium and the Netherlands also considerably increased as birds flew in the west-southwest direction. Besides these large-scale patterns, more local features were visible, for example, in the northern regions of the Netherlands where the density of birds considerably increased from 22:30 onwards (Figure 4C). This high density of migrants then moved across the IJsselmeer (the large lake in the northwest of the Netherlands) towards the west, seemingly avoiding the longest lake crossings. These waves of high density propagated across the borders between radars, showing that spatio-temporal patterns in migratory density were an actual phenomenon that could be observed in different radars. After sunrise at 5:10, most migration over land stopped. At sea, off the coast of the west of the Netherlands, a dawn ascent was visible starting around 5:30 (Figure 4D), a phenomenon resulting from birds quickly increasing their flight altitude at dawn. We recognized this ascent by the simultaneous increase in bird density across regions above the sea in consecutive time slices. At the same time, there was an increase in daytime movements above land presumably due to migratory take-off of diurnally migrating species.
Non-biological features were also visible in the animations. By combining knowledge from online resources, these could be attributed to several sources. Several rainfall events were visible as patches of very high reflectivity moving with the wind from northeast to southwest and early in the morning turning to northwest (Figure 4A). Off the northwest coast of the Netherlands, shipping lanes were recognizable by a series of moving spots of high reflectivity (Figure 4C). Wind farms, both at sea and land, and oil platforms at sea were recognized as restricted static regions of high reflectivity (Figure 4B). Other more detailed dynamic features were, for example, the smoke of a fire in an industrial building southeast of the Herwijnen radar in the Netherlands between 23:00 and 00:00 (Figure 4C, [33]).
When visualizing over a larger spatial region in the second case study (Figure 5), other phenomena became visible. The reflectivity as caused by birds taking off increased first in the northeast, where the Sun set about 35 min earlier compared to the western part of the visualization. Over the next half hour, the reflectivity increased gradually and spread to the west (Supplement S3, [34]). Once the sun set over the whole region, a fully joint picture of the high bird densities across the region was observed. The resulting image was spatially relatively uniform, despite operational differences between radars, such as differences in elevation angles. Some radars showed an apparent higher bird density on the axis perpendicular to the main migratory direction from northeast to southwest. This was an aspect effect, related to the birds having a higher radar cross-section in side view compared to the frontal or rear view [35]. The radar in the northeast of Germany, close to Berlin, stood out as having a high reflectivity. A detailed inspection of individual PPI plots indicated that this radar was affected by anomalous atmospheric propagation. The fact that a Doppler filtered reflectivity product (DBZH) was not available for this radar for biological echoes further complicated the removal of the resulting ground clutter. Towards the Alps in southern Germany, radars also seemed to have an overestimation of densities at larger distances from the radar.

4. Discussion

The spatial patterns of aerial bird density that we presented reflect the effects of habitat, coastlines, and upstream source areas. These effects are frequently more fine-scale than the distances between radars and would not be identified when aggregating data to a single point of information for each radar. Here, we show that visualizations of vertically integrated range-corrected reflectivity measured across weather radars can be used on a regional scale to gain insights into the distribution of birds and their movement. The high density of the radar network in Europe is advantageous for showing this continuous overview, compared to the sparser network in North America. Our method effectively integrates over the vertical dimension, while accounting for the different scanning angles of each radar station. Many of the features we identify are much harder, if not impossible, to identify if we had not estimated VID images to account for the distance effect or when not using animations of sequences of composites. By removing range effects, it is possible to focus on biological phenomena and avoid the distraction of non-uniform sampling. This work thus makes it possible to generate and test hypotheses on the spatial-temporal distributions of migratory behaviors of all migrating birds. One such phenomenon is the increased density we see in Figure 4C; this can be caused by improved weather conditions northwards of the observed area. Alternatively, birds that depart synchronized at sunset from a stopover region and move in a common direction can have a similar effect (e.g., coastal areas before a sea crossing). Animations over larger spatial regions can help to disentangle these hypotheses. Better understanding of local movement patterns is important for reducing human-wildlife conflicts, for example, when planning wind farms. Detailed investigation of spatial distributions of birds in the air can help to quantify the influence of landscape geometry on local aggregations of birds that should be avoided to reduce impact.
Differences in the radar cross-section of individual birds related to body orientation reduce the accuracy of the algorithm. This problem will be especially relevant when birds have a common orientation, as is the case during migration. The magnitude of this error will not exceed the magnitude of differences in radar cross-section between orientation (e.g., a factor of two, [36]). Robust and automated methods for estimating animal’s body orientation are needed in order to apply spatial corrections for such aspect effects, e.g., based on patterns in dual-polarization moments [37], which would be a valuable future improvement.
At large distances where even the lowest elevation scans start to overshoot the migration layer, both the observed and expected η values become increasingly small, which will compromise the accuracy of our methods. At larger distances, weak signals of migratory animals may not reach above the lower detection limit of the radar. In our visualizations of northwest Europe, the average nearest neighbor distance between radars is 125 km; radars are thus frequently only visualized up to half this distance, where such limits on detection are typically not reached.
We assume the vertical distribution of birds to be constant within the field of view of a single radar; however, there might be cases where this assumption is not valid. Vertical distributions of birds are likely driven by weather patterns [20], and weather conditions are fairly smooth over the range of a single radar, except perhaps in mountainous terrain or along coastlines [38]. Hence, our assumption is expected to be valid when meteorological conditions, which strongly determine the vertical profile, are correlated over the domain of a radar. Such conditions will be more common in relatively homogenous topography and in the absence of direct interaction with precipitation, which might force birds abruptly down. Vertical distribution of birds can also differ between land masses and large water bodies, e.g., [23,39]. Vertical profiles are derived close to the radar and thus mostly over land and will therefore be more adequate for migration over land. It is possible to account for these heterogeneous altitude distributions between land and sea by estimating a separate vertical profile above the sea if the radar is sufficiently close to water. Furthermore, birds might follow the contours of the landscape and fly at a constant altitude above ground level, while in other cases, birds may maintain a constant altitude above mean sea level regardless of the underlying topography, e.g., [13,19,40]. Since the elevation of the terrain can change considerably over the area of observation, this might create inaccuracies in the VID estimate. Here, we have mostly shown applications in a relatively flat environment where topography effects are expected to be limited. However, in southern Germany, radars are placed within mountainous regions or at least cover mountains in their respective domains. In these radars, the VID image seems to capture the spatial distribution of birds less accurately. Here, the vertical profile shows high bird densities close to the ground, while further, towards the Alps, birds might have been forced up by the topography resulting in an overestimation by the VID. Furthermore, radars might suffer from (partial) beam blockage in mountainous areas, e.g., [41], resulting in underestimates of bird densities. Additionally, the light emitted from cities at night can influence the altitudinal distribution of birds moving during the night. A recent study investigating this effect found a relatively small effect meaning that these changes will not have a strong effect on our VID estimates [42].
In recent years, smaller, more mobile dedicated bird radars have become more common [43]. These provide insight into the local vertical distribution of migratory birds, up to a limited height. Future research using these radars will provide more insight into the spatial variability of the vertical distribution, by providing more insight into the effects of elevation or habitat on the vertical distribution. This work paves the way toward developing methods that make more accurate assumptions on the local vertical profile compared to the nearest neighbor interpolation (taking the vertical profile of the closest radar) that is currently used; for example, by taking into account the full auto-correlation structure between profiles [44]. Combining weather radar with local bird radars is a powerful combination in which weather radar can provide the context for bird radars. Alternatively, weather radars can identify interesting phenomena that warrant a more detailed investigation using bird radars.
By inspecting the areas at the border between two radars, the accumulation of all possible inaccuracies can be investigated. Our animations show that much of the temporal variation is consistent between radars and that events of high bird densities are visible across radars. In the animation of the Netherlands and Belgium, the case of 3–4 October 2016; see Figure 4 and Supplement S1; [32], we see twice that a high-density area arises in the northern part of the Netherlands (around 18:45 and 23:30) and can be observed later on the radar in the center of the Netherlands. Similarly, the presence of redundant information in the area of overlap between two radars offers opportunities to improve accuracy locally. There are however consistent differences between radars. The radars in Belgium, for example, seem to have consistently shorter detection ranges compared to Dutch radars, which is likely related to the different acquisition setting of the respective radar processors.
To conclude, our method for estimating spatial VID images will enable the exploration and qualitative analysis of migration density within the field of view of a single radar. The method also facilitates the creation of composite maps of vertically integrated density similar to meteorological composites [10]. These provide a powerful tool for experts to gain insight into a range of migratory phenomena. Future improvements are approaches that can account for regional variations in altitudinal distributions [44,45], as well as tools to exclude non-biological signals to ease the interpretation and work toward fully quantitative analysis. Lin et al. [46] already took important initial steps by segmenting out rain from the projected images using machine learning; alternatively, dual-polarization metrics can be used, e.g., [47]. We see an important future for investigating regional variation in migratory patterns using weather radar.

Supplementary Materials

The following are available online at https://www.mdpi.com/2072-4292/12/4/635/s1, Supplement S1: Image sequence of bird migration Netherlands and Belgium (2016-10-3) available at: https://doi.org/10.21942/uva.11365169.v2, Supplement S2: Migration profile per night, Supplement S3: Image sequence of bird migration Netherlands, Germany and Belgium (2017-10-18) available at: https://doi.org/10.21942/uva.11365295.v2.

Author Contributions

A.M.D., J.S.-B., B.K., and W.B. conceived of and designed the experiments; B.-C.W. organized the data; A.M.D., B.K., and L.V. worked on the implementation; B.K. and A.M.D. analyzed the data; B.K. wrote the paper with the contributions of others. All authors have read and agreed to the published version of the manuscript.

Funding

This research was financially supported by the Netherlands Ministry of Defence through the Bird Avoidance System (BAS) project, by the Ministry of Agriculture, Nature and Food Quality, the Ministry of Economic Affairs and Climate Policy, Rijkswaterstaat, and the Province of Groningen through wind farm projects, and by the 2017-2018 Belmont Forum and BiodivERsA joint call for research proposals, under the BiodivScen ERA-Net COFUND program, as well as with the funding organizations Swiss National Science Foundation (SNF 31BD30_184120), Belgian Federal Science Policy Office (BelSPO BR/185/A1/GloBAM-BE), Netherlands Organisation for Scientific Research (NWO E10008), Academy of Finland (aka 326315), and National Science Foundation (NSF 1927743). Financial support for A.D. (NSF ICER 1927743, NSF ABI 1661259).

Acknowledgments

We thank Hans van Gasteren for valuable discussions. We thank Stephan Klaus from Deutscher Wetterdienst (DWD) for providing radar data. Weather radar data from Belgium were kindly provided by the Royal Meteorological Institute (RMI) under user License Agreement 2018-UI-AD/084 with the assistance of Maarten Reyniers.

Conflicts of Interest

The authors declare no conflict of interest.

Abbreviations

The following abbreviations are used in this manuscript:
PPIPlan position indicator
VIDVertically integrated density
virvertically integrated reflectivity

References

  1. Bauer, S.; Chapman, J.W.; Reynolds, D.R.; Alves, J.A.; Dokter, A.M.; Menz, M.M.H.; Sapir, N.; Ciach, M.; Pettersson, L.B.; Kelly, J.F.; et al. From Agricultural Benefits to Aviation Safety: Realizing the Potential of Continent-Wide Radar Networks. BioScience 2017, 67, 912–918. [Google Scholar] [CrossRef]
  2. Gasteren, H.v.; Krijgsveld, K.L.; Klauke, N.; Leshem, Y.; Metz, I.C.; Skakuj, M.; Sorbi, S.; Schekler, I.; Shamoun-Baranes, J. Aeroecology meets aviation safety: Early warning systems in Europe and the Middle East prevent collisions between birds and aircraft. Ecography 2019, 42, 899–911. [Google Scholar] [CrossRef]
  3. Dokter, A.M.; Farnsworth, A.; Fink, D.; Ruiz-Gutierrez, V.; Hochachka, W.M.; Sorte, F.A.L.; Robinson, O.J.; Rosenberg, K.V.; Kelling, S. Seasonal abundance and survival of North America’s migratory avifauna determined by weather radar. Nat. Ecol. Evol. 2018, 2, 1603–1609. [Google Scholar] [CrossRef] [PubMed]
  4. Doren, B.M.V.; Horton, K.G. A continental system for forecasting bird migration. Science 2018, 361, 1115–1118. [Google Scholar] [CrossRef] [PubMed]
  5. Nilsson, C.; Dokter, A.M.; Verlinden, L.; Shamoun-Baranes, J.; Schmid, B.; Desmet, P.; Bauer, S.; Chapman, J.; Alves, J.A.; Stepanian, P.M.; et al. Revealing patterns of nocturnal migration using the European weather radar network. Ecography 2019, 42, 876–886. [Google Scholar] [CrossRef] [Green Version]
  6. McLaren, J.D.; Buler, J.J.; Schreckengost, T.; Smolinsky, J.A.; Boone, M.; Loon, E.E.v.; Dawson, D.K.; Walters, E.L. Artificial light at night confounds broad-scale habitat use by migrating birds. Ecol. Lett. 2018, 21, 356–364. [Google Scholar] [CrossRef]
  7. Horton, K.G.; Nilsson, C.; Doren, B.M.V.; Sorte, F.A.L.; Dokter, A.M.; Farnsworth, A. Bright lights in the big cities: Migratory birds’ exposure to artificial light. Front. Ecol. Environ. 2019, 17, 209–214. [Google Scholar] [CrossRef]
  8. Rosenberg, K.V.; Dokter, A.M.; Blancher, P.J.; Sauer, J.R.; Smith, A.C.; Smith, P.A.; Stanton, J.C.; Panjabi, A.; Helft, L.; Parr, M.; et al. Decline of the North American avifauna. Science 2019, 366, 120–124. [Google Scholar] [CrossRef]
  9. Saltikoff, E.; Friedrich, K.; Soderholm, J.; Lengfeld, K.; Nelson, B.; Becker, A.; Hollmann, R.; Urban, B.; Heistermann, M.; Tassone, C. An Overview of Using Weather Radar for Climatological Studies: Successes, Challenges, and Potential. Bull. Am. Meteorol. Soc. 2019, 100, 1739–1752. [Google Scholar] [CrossRef]
  10. Saltikoff, E.; Haase, G.; Delobbe, L.; Gaussiat, N.; Martet, M.; Idziorek, D.; Leijnse, H.; Novák, P.; Lukach, M.; Stephan, K. OPERA the Radar Project. Atmosphere 2019, 10, 320. [Google Scholar] [CrossRef] [Green Version]
  11. Rogers, R.M.; Buler, J.J.; Wainwright, C.E.; Campbell, H.A. Opportunities and challenges in using weather radar for detecting and monitoring flying animals in the Southern Hemisphere. Austral Ecol. 2019, 45, 127–136. [Google Scholar] [CrossRef]
  12. WMO Radar Database. Available online: https://wrd.mgm.gov.tr/home/Wrd (accessed on 17 December 2019).
  13. Dokter, A.M.; Liechti, F.; Stark, H.; Delobbe, L.; Tabary, P.; Holleman, I. Bird migration flight altitudes studied by a network of operational weather radars. J. R. Soc. Interface 2011, 8, 30–43. [Google Scholar] [CrossRef] [PubMed] [Green Version]
  14. Sheldon, D.; Farnsworth, A.; Irvine, J.; Van Doren, B.; Webb, K.; Dietterich, T.; Kelling, S. Approximate Bayesian Inference for Reconstructing Velocities of Migrating Birds from Weather Radar. In Proceedings of the 27th AAAI Conference on Artificial Intelligence, Bellevue, WA, USA, 14–18 July 2013; pp. 1334–1340. [Google Scholar]
  15. Sánchez-Diezma, R.; Zawadzki, I.; Sempere-Torres, D. Identification of the bright band through the analysis of volumetric radar data. J. Geophys. Res. Atmos. 2000, 105, 2225–2236. [Google Scholar] [CrossRef]
  16. Hazenberg, P.; Torfs, P.J.J.F.; Leijnse, H.; Delrieu, G.; Uijlenhoet, R. Identification and uncertainty estimation of vertical reflectivity profiles using a Lagrangian approach to support quantitative precipitation measurements by weather radar. J. Geophys. Res. Atmos. 2013, 118, 10243–10261. [Google Scholar] [CrossRef]
  17. Buler, J.J.; Diehl, R.H. Quantifying Bird Density During Migratory Stopover Using Weather Surveillance Radar. IEEE Trans. Geosci. Remote. Sens. 2009, 47, 2741–2751. [Google Scholar] [CrossRef]
  18. Buler, J.J.; Dawson, D.K. Radar analysis of fall bird migration stopover sites in the northeastern U.S.Análisis por radar de los sitios de parada migratoria en otoño en el noreste de Estados UnidosRadar Analysis of Fall Bird Stopover Distributions. Condor 2014, 116, 357–370. [Google Scholar] [CrossRef] [Green Version]
  19. Bruderer, B.; Peter, D.; Korner-Nievergelt, F. Vertical distribution of bird migration between the Baltic Sea and the Sahara. J. Ornithol. 2018, 159, 315–336. [Google Scholar] [CrossRef]
  20. Kemp, M.U.; Shamoun-Baranes, J.; Dokter, A.M.; van Loon, E.; Bouten, W. The influence of weather on the flight altitude of nocturnal migrants in mid-latitudes. Ibis 2013, 155, 734–749. [Google Scholar] [CrossRef]
  21. Dokter, A.M.; Shamoun-Baranes, J.; Kemp, M.U.; Tijm, S.; Holleman, I. High Altitude Bird Migration at Temperate Latitudes: A Synoptic Perspective on Wind Assistance. PLoS ONE 2013, 8, e52300. [Google Scholar] [CrossRef] [Green Version]
  22. Damousis, I.; Alexiadis, M.; Theocharis, J.; Dokopoulos, P. A fuzzy model for wind speed prediction and power generation in wind parks using spatial correlation. IEEE Trans. Energy Convers. 2004, 19, 352–361. [Google Scholar] [CrossRef]
  23. Diehl, R.H.; Larkin, R.P.; Black, J.E. Radar Observations of Bird Migration Over The Great Lakes. Auk 2003, 120, 278–290. [Google Scholar] [CrossRef]
  24. Archibald, K.; Buler, J.; Smolinsky, J.; Smith, R. Migrating birds reorient toward land at dawn over the Great Lakes, USA. Auk 2017, 134, 193–201. [Google Scholar] [CrossRef]
  25. Hu, C.; Cui, K.; Wang, R.; Long, T.; Ma, S.; Wu, K. A Retrieval Method of Vertical Profiles of Reflectivity for Migratory Animals Using Weather Radar. IEEE Trans. Geosci. Remote. Sens. 2019, 58, 1030–1040. [Google Scholar] [CrossRef]
  26. Dokter, A.M.; Desmet, P.; Spaaks, J.H.; Hoey, S.v.; Veen, L.; Verlinden, L.; Nilsson, C.; Haase, G.; Leijnse, H.; Farnsworth, A.; et al. bioRad: Biological analysis and visualization of weather radar data. Ecography 2019, 42, 852–860. [Google Scholar] [CrossRef] [Green Version]
  27. Doviak, R.; Zrnic, D. Doppler radar and weather observations; Academic Press: San Diego, CA, USA, 1993. [Google Scholar]
  28. Chilson, P.B.; Frick, W.F.; Stepanian, P.M.; Shipley, J.R.; Kunz, T.H.; Kelly, J.F. Estimating animal densities in the aerosphere using weather radar: To Z or not to Z? Ecosphere 2012, 3, art72. [Google Scholar] [CrossRef]
  29. Probert-Jones, J.R. The radar equation in meteorology. Q. J. R. Meteorol. Soc. 1962, 88, 485–495. [Google Scholar] [CrossRef]
  30. Dokter, A.M.; Desmet, P.; Hoey, S.V.; Spaaks, J.; Veen, L.; Verlinden, L.; Leijnse, H. bioRad: Biological Analysis and Visualization of Weather Radar Data. Available online: https://github.com/adokter/bioRad (accessed on 11 January 2019).
  31. Michelson, D.; Lewandowski, R.; Szewczykowski, M.; Beekhuis, H.; Haase, G.; Mammen, T.; Faure, D.; Simpson, M.; Leijnse, H.; Johnson, D. EUMETNET OPERA Weather Radar Information Model for Implementation with the HDF5 File Format, version 2.3; EUMETNET OPERA Document; EUMETNE: Bruxelles, Belgique, 2019. [Google Scholar]
  32. Image Sequence of Bird Migration Netherlands and Belgium (2016-10-3). Available online: https://doi.org/10.21942/uva.11365169.v2 (accessed on 17 December 2019).
  33. Grote brand in Uden geblust, van bedrijfspand is niets over. Available online: https://www.omroepbrabant.nl/nieuws/219533/Grote-brand-in-Uden-geblust-van-bedrijfspand-is-niets-over (accessed on 17 December 2019).
  34. Image sequence of bird migration Netherlands, Germany and Belgium (2017-10-18). Available online: https://doi.org/10.21942/uva.11365295.v2 (accessed on 17 December 2019).
  35. Stepanian, P.M.; Horton, K.G.; Melnikov, V.M.; Zrnić, D.S.; Gauthreaux, S.A. Dual-polarization radar products for biological applications. Ecosphere 2016, 7, e01539. [Google Scholar] [CrossRef]
  36. Dokter, A.M.; Liechti, F.; Holleman, I. Bird Detection by Operational Weather Radar; Technical Report WR 2009-06; KNMI: De Bilt, The Netherlands, 2009. [Google Scholar]
  37. Stepanian, P.M.; Horton, K.G. Extracting Migrant Flight Orientation Profiles Using Polarimetric Radar. IEEE Trans. Geosci. Remote. Sens. 2015, 53, 6518–6528. [Google Scholar] [CrossRef]
  38. Aurbach, A.; Schmid, B.; Liechti, F.; Chokani, N.; Abhari, R. Complex behaviour in complex terrain—Modelling bird migration in a high resolution wind field across mountainous terrain to simulate observed patterns. J. Theor. Biol. 2018, 454, 126–138. [Google Scholar] [CrossRef]
  39. Senner, N.R.; Stager, M.; Verhoeven, M.A.; Cheviron, Z.A.; Piersma, T.; Bouten, W. High-altitude shorebird migration in the absence of topographical barriers: Avoiding high air temperatures and searching for profitable winds. Proc. R. Soc. Biol. Sci. 2018, 285, 20180569. [Google Scholar] [CrossRef]
  40. Bowlin, M.S.; Enstrom, D.A.; Murphy, B.J.; Plaza, E.; Jurich, P.; Cochran, J. Unexplained altitude changes in a migrating thrush: Long-flight altitude data from radio-telemetry. Auk 2015, 132, 808–816. [Google Scholar] [CrossRef] [Green Version]
  41. Bech, J.; Gjertsen, U.; Haase, G. Modelling weather radar beam propagation and topographical blockage at northern high latitudes. Q. J. R. Meteorol. Soc. 2007, 133, 1191–1204. [Google Scholar] [CrossRef]
  42. Cabrera-Cruz, S.A.; Smolinsky, J.A.; McCarthy, K.P.; Buler, J.J. Urban areas affect flight altitudes of nocturnally migrating birds. J. Anim. Ecol. 2019, 88, 1873–1887. [Google Scholar] [CrossRef] [PubMed]
  43. Nilsson, C.; Dokter, A.M.; Schmid, B.; Scacco, M.; Verlinden, L.; Bäckman, J.; Haase, G.; Dell’Omo, G.; Chapman, J.W.; Leijnse, H.; et al. Field validation of radar systems for monitoring bird migration. J. Appl. Ecol. 2018, 55, 2552–2564. [Google Scholar] [CrossRef]
  44. Nussbaumer, R.; Benoit, L.; Mariethoz, G.; Liechti, F.; Bauer, S.; Schmid, B. A Geostatistical Approach to Estimate High Resolution Nocturnal Bird Migration Densities from a Weather Radar Network. Remote. Sens. 2019, 11, 2233. [Google Scholar] [CrossRef] [Green Version]
  45. Angell, R.; Sheldon, D. Inferring latent velocities from weather radar data using Gaussian processes. In Proceedings of the 32nd International Conference on Neural Information Processing Systems, Montreal, QC, Canada, 3–8 December 2018; Curran Associates Inc.: Montreal, QC, Canada, 2018. NIPS’18. pp. 8998–9007. [Google Scholar]
  46. Lin, T.Y.; Winner, K.; Bernstein, G.; Mittal, A.; Dokter, A.M.; Horton, K.G.; Nilsson, C.; Doren, B.M.V.; Farnsworth, A.; Sorte, F.A.L.; et al. MistNet: Measuring historical bird migration in the US using archived weather radar data and convolutional neural networks. Methods Ecol. Evol. 2019, 10, 1908–1922. [Google Scholar] [CrossRef]
  47. Kilambi, A.; Fabry, F.; Meunier, V.; Kilambi, A.; Fabry, F.; Meunier, V. A Simple and Effective Method for Separating Meteorological from Nonmeteorological Targets Using Dual-Polarization Data. J. Atmos. Ocean. Technol. 2018, 35, 1415–1424. [Google Scholar] [CrossRef]
Figure 1. An example of the estimated vertical profile and two plan position indicator plots from the Herwijnen radar on 19 April 2019 at 21:00. (A) shows the mean vertical distribution of birds between 5 and 25 km from the radar. Panels (B,C) show the reflectivity from two different scans at the elevation angles of 1.2 and 2.8 degrees. Each elevation angle here shows a specific reflectivity pattern including a donut shape that typically occurs in the case of high altitude migration. The areas of high density are in different locations and not informative for the vertically integrated densities.
Remotesensing 12 00635 g001
Figure 2. The theoretical vertical pattern of radiated energy ( b ( h , r , θ ) ) for various beam elevations ( θ i ) and at various distances. Close to the radar, the beam width is narrow, while at longer distances, the beam profile widens and covers a larger altitude band. The vertical gray lines indicate the distances for which beam profiles have been calculated.
Remotesensing 12 00635 g002
Figure 3. The vertically integrated bird density (individuals/km2) as observed by the Herwijnen radar on 19 April 2019. This figure uses the same data as Figure 1. Where single elevation scans show a clear pattern with distance to the radar (Figure 1B,C), the VID image corrects for most of those effects and reflects the spatial distribution across the region.
Remotesensing 12 00635 g003
Figure 4. Example of a vertically integrated bird ( V I D a ) density composite, showing a map of the estimated number of birds for different time slices through the night of 3–4 October 2016 over the Netherlands and Belgium. (Panel A) is just before sunset (17:00); (B) shows increased migration intensity at the beginning of the night (21:00); (C) shows continued migration during the night (23:30); and (D) is just after sunrise (6:00). Annotations were made based on combining inspection of the animations with online resources, such as historical weather reports and news items.
Remotesensing 12 00635 g004
Figure 5. A composite vertically integrated density ( V I D a ) for Northwest Europe at 21:00 on 18 October 2017 including data from 20 radars.
Remotesensing 12 00635 g005

