Article

Mapping Fine-Scale Urban Spatial Population Distribution Based on High-Resolution Stereo Pair Images, Points of Interest, and Land Cover Data

1
State Key Laboratory of Remote Sensing Science, Aerospace Information Research Institute, Chinese Academy of Sciences, Beijing 100101, China
2
School of Resources and Environmental Science, Wuhan University, Wuhan 430072, China
3
Department of Land Surveying and Geo-Informatics, The Hong Kong Polytechnic University, Hong Kong, China
4
International Initiative on Spatial Life course Epidemiology (ISLE), Hong Kong, China
5
Faculty of Geo-Information Science and Earth Observation, University of Twente, 7514 AE Enschede, The Netherlands
*
Author to whom correspondence should be addressed.
Remote Sens. 2020, 12(4), 608; https://doi.org/10.3390/rs12040608
Submission received: 26 December 2019 / Revised: 22 January 2020 / Accepted: 30 January 2020 / Published: 12 February 2020

Abstract

:
Fine-scale population distribution is increasingly becoming a research hotspot owing to its high demand in many applied fields. It is of great significance in urban emergency response, disaster assessment, resource allocation, urban planning, market research, and transportation route design. This study employed land cover, building address, and housing price data, and high-resolution stereo pair remote sensing images to simulate fine-scale urban population distribution. We firstly extracted the residential zones on the basis of land cover and Google Earth data, combined them with building information including address and price. Then, we employed the stereo pair analysis method to obtain the building height on the basis of ZY3-02 high-resolution satellite data and transform the building height into building floors. After that, we built a sophisticated, high spatial resolution model of population density. Finally, we evaluated the accuracy of the model using the survey data from 12 communities in the study area. Results demonstrated that the proposed model for spatial fine-scale urban population products yielded more accurate small-area population estimation relative to high-resolution gridded population surface (HGPS). The approach proposed in this study holds potential to improve the precision and automation of high-resolution population estimation.

Graphical Abstract

1. Introduction

Population distribution data on a fine scale are of great significance in many areas including public health, emergency evacuation, disaster management, resource allocation, urban planning, market research, and transportation route design [1]. Such data was once only presented as choropleth maps, where the population numbers, normally derived from demographic surveys (e.g., census data), were aggregated over enumeration units represented by irregular polygons (e.g., census blocks). Although this method obtains accurate population information, it takes a long time, requires large workloads, and high costs, and presents the information of population distribution in an aggregated way, sometimes due to confidentiality, which may hinder more accurate population-based analyses. Choropleth maps have some other limitations [2], including the inaccuracy caused by periodic changes of the boundary of enumeration units (e.g., administrative boundaries), time lag between data collection and publication, and the modifiable areal unit problem (MAUP) [3]. With the development of cities and the process of globalization, the number and distribution of the urban population are undergoing significant changes. Particularly, the mobility and variability of the population within the city have reached an unprecedented level of complexity. Compared with traditional statistics, the location of the population is crucial in many areas, such as decision- and policy-making, risk assessment, and human-induced and natural disasters [4,5,6,7,8,9]. Therefore, there is an urgent need for fine-scale population products which accurately describe spatial distribution of the population to make well informed and immediate decisions [7,10].
Dasymetric mapping is an approach of thematic mapping, which uses ancillary information to disaggregate population data onto spatial units within which the population distribution is more homogenous. It is an effective way of transferring spatial information from a set of source units to a different set of target units [11,12,13]. However, dasymetric maps are not widely popular to geographical researchers due to the limited automated tools to produce them. Dasymetric maps are becoming more prevalent in developing fields, such as conservation and sustainable development, though some fields, such as public health and applied cartography, still rely on choropleth maps. This particular mapping approach converts traditional choropleth information into a continuous gridded surface and disaggregates values over a given spatial unit rather than directly using aggregate values [2,14]. With the development of spatial technologies, such as remote sensing, geographic information systems (GIS), and artificial intelligence, modeling approaches for population distribution have rapidly developed. Studies of population distribution are undertaken on an array of scales, from city and county to global, and generate a number of influential population products, such as the Global Resource Information Database (GRID), developed by the United Nations Environment Programme (UNEP) [3], Gridded Population of the World (GPW) by the International Geosciences Information Network Center of Columbia University [2], LandScan by the U.S. National Oak Ridge Laboratory [15], and WorldPop [16].
Modern technologies of surveying and mapping, such as photogrammetry, airborne light detection and ranging (LiDAR) and high-resolution satellite observation provide technical supports by obtaining fine-scale ancillary information for dasymetric mapping, such as high-resolution images, aerial photographs, and three-dimensional surfaces. These data are processed into high-quality ancillary data which are closely related to population distribution, such as parcel footprint and type, so the population can be allocated to each parcel based mainly on parcel type and area, and sometimes the urbanicity of the place of the parcel [3,16]. However, in urban areas, especially those densely-populated metropolitan areas, population density greatly varies across parcels of the same type, area, and urbanicity, due to reasons ranging from land price to, in the simplest case, the height of the buildings on the parcel. There have been some dasymetric mapping studies which consider the variation of population density within the same type of parcels across regions with different socioeconomic status measured by GIS. Cadastral ancillary information is used in an aerial interpolation method, named Cadastral-based expert dasymetric system (CEDS), to delineate areas of homogeneous values which is particularly suitable for urban areas [7]. The heuristic sampling Method is applied for 2010 parcel data to disaggregate population counts from the 2010 U.S. Census into a quadrilateral grid composed of 30 × 30 m cells covering Alachua County, Florida, which provides an improved means of producing spatially-explicit population grids where fine-scale ancillary data is available [3]. The application of land-cover data integrated with parcel-based high-resolution gridded population surface (HGPS) is investigated to improve the accuracy of the HGPS [16]. The above methods have certain limitations in that they only consider the information of the two-dimensional space of the plot, and not information pertaining to the building height and volume. The volumetric methods are effective for estimating building population on the basis of census tracts and building footprint datasets [17]. Building height QuickBird imagery and light detection and ranging (LiDAR) data are employed for estimating population at the census-block level, which indicates that LiDAR-derived shape information such as height greatly improves population estimation compared to population estimation using only spectral data [18]. Results obtained through object-based image analysis (OBIA) of QuickBird imagery are used for a subset of a highly populated area in western Kenya, and shows that using houses as classified from very high spatial resolution remote sensing (VHR) imagery for a study area subset works well for redistributing human population at the regional level [19]. However, when the targeted area or parcel is complex (not only does it include various land use and cover, but also the buildings have different residential attributions), the single land-cover data, socioeconomic, or high-resolution remote sensing data is not enough as ancillary data to model the fine-scale population distribution.
To fill this gap, this study explores the frontier by presenting an approach to modeling urban nighttime population distribution at the building level with both the footprint and height of buildings considered as ancillary data. First, we classify the study area as residential and non-residential on the basis of land use, building address, housing price, and Google Earth data. Then, in residential zones we extract building footprint and height from high-resolution stereo pair remote sensing images and a digital terrain model (DTM). The building height is further transformed into the number of building floors on the basis of building standards adopted in the study area. Finally, weighted area metric and volumetric models are employed to disaggregate census population to individual residential buildings. The approach developed in this study can be used in the urban population survey and community emergency management. Findings of this study were assessed in 12 communities in Chaoyang district of Beijing, China. Through integrated high-resolution stereo pair images with points of interest and land cover data, a hierarchical classification and simulation approach is proposed to solve the mapping of fine-scale spatial population distribution in a complex urban area.

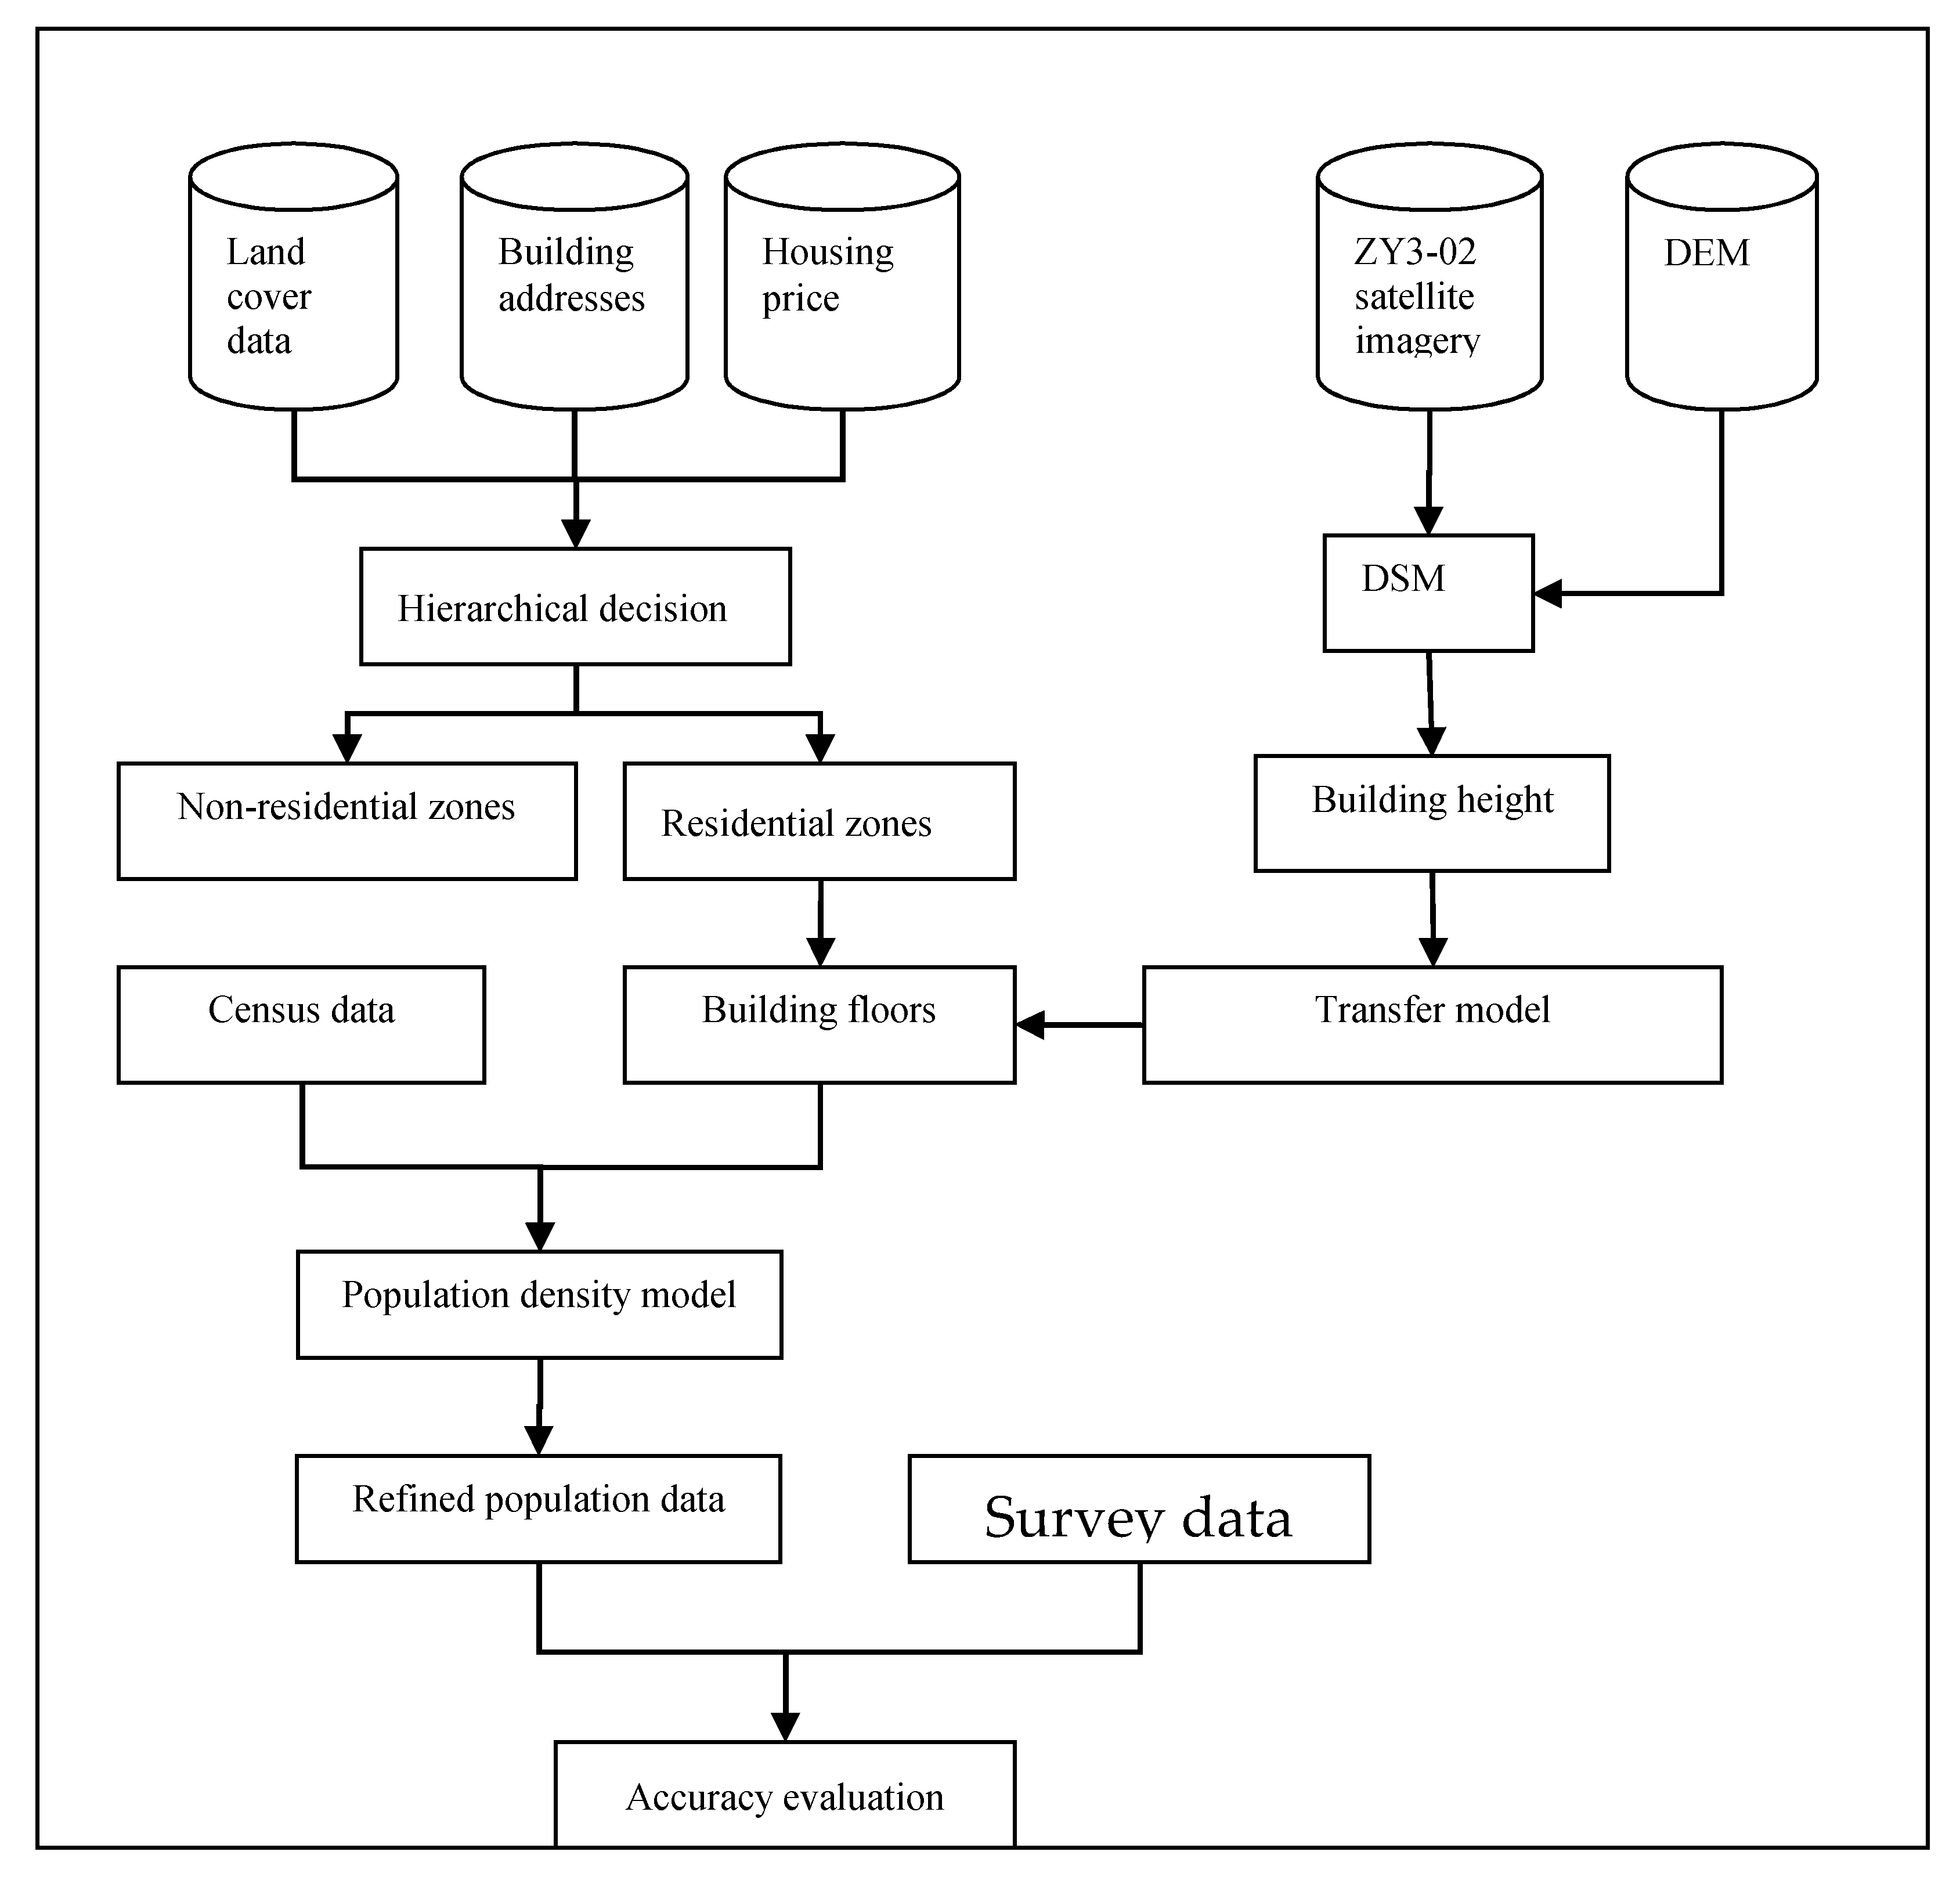
2. Materials and Methods
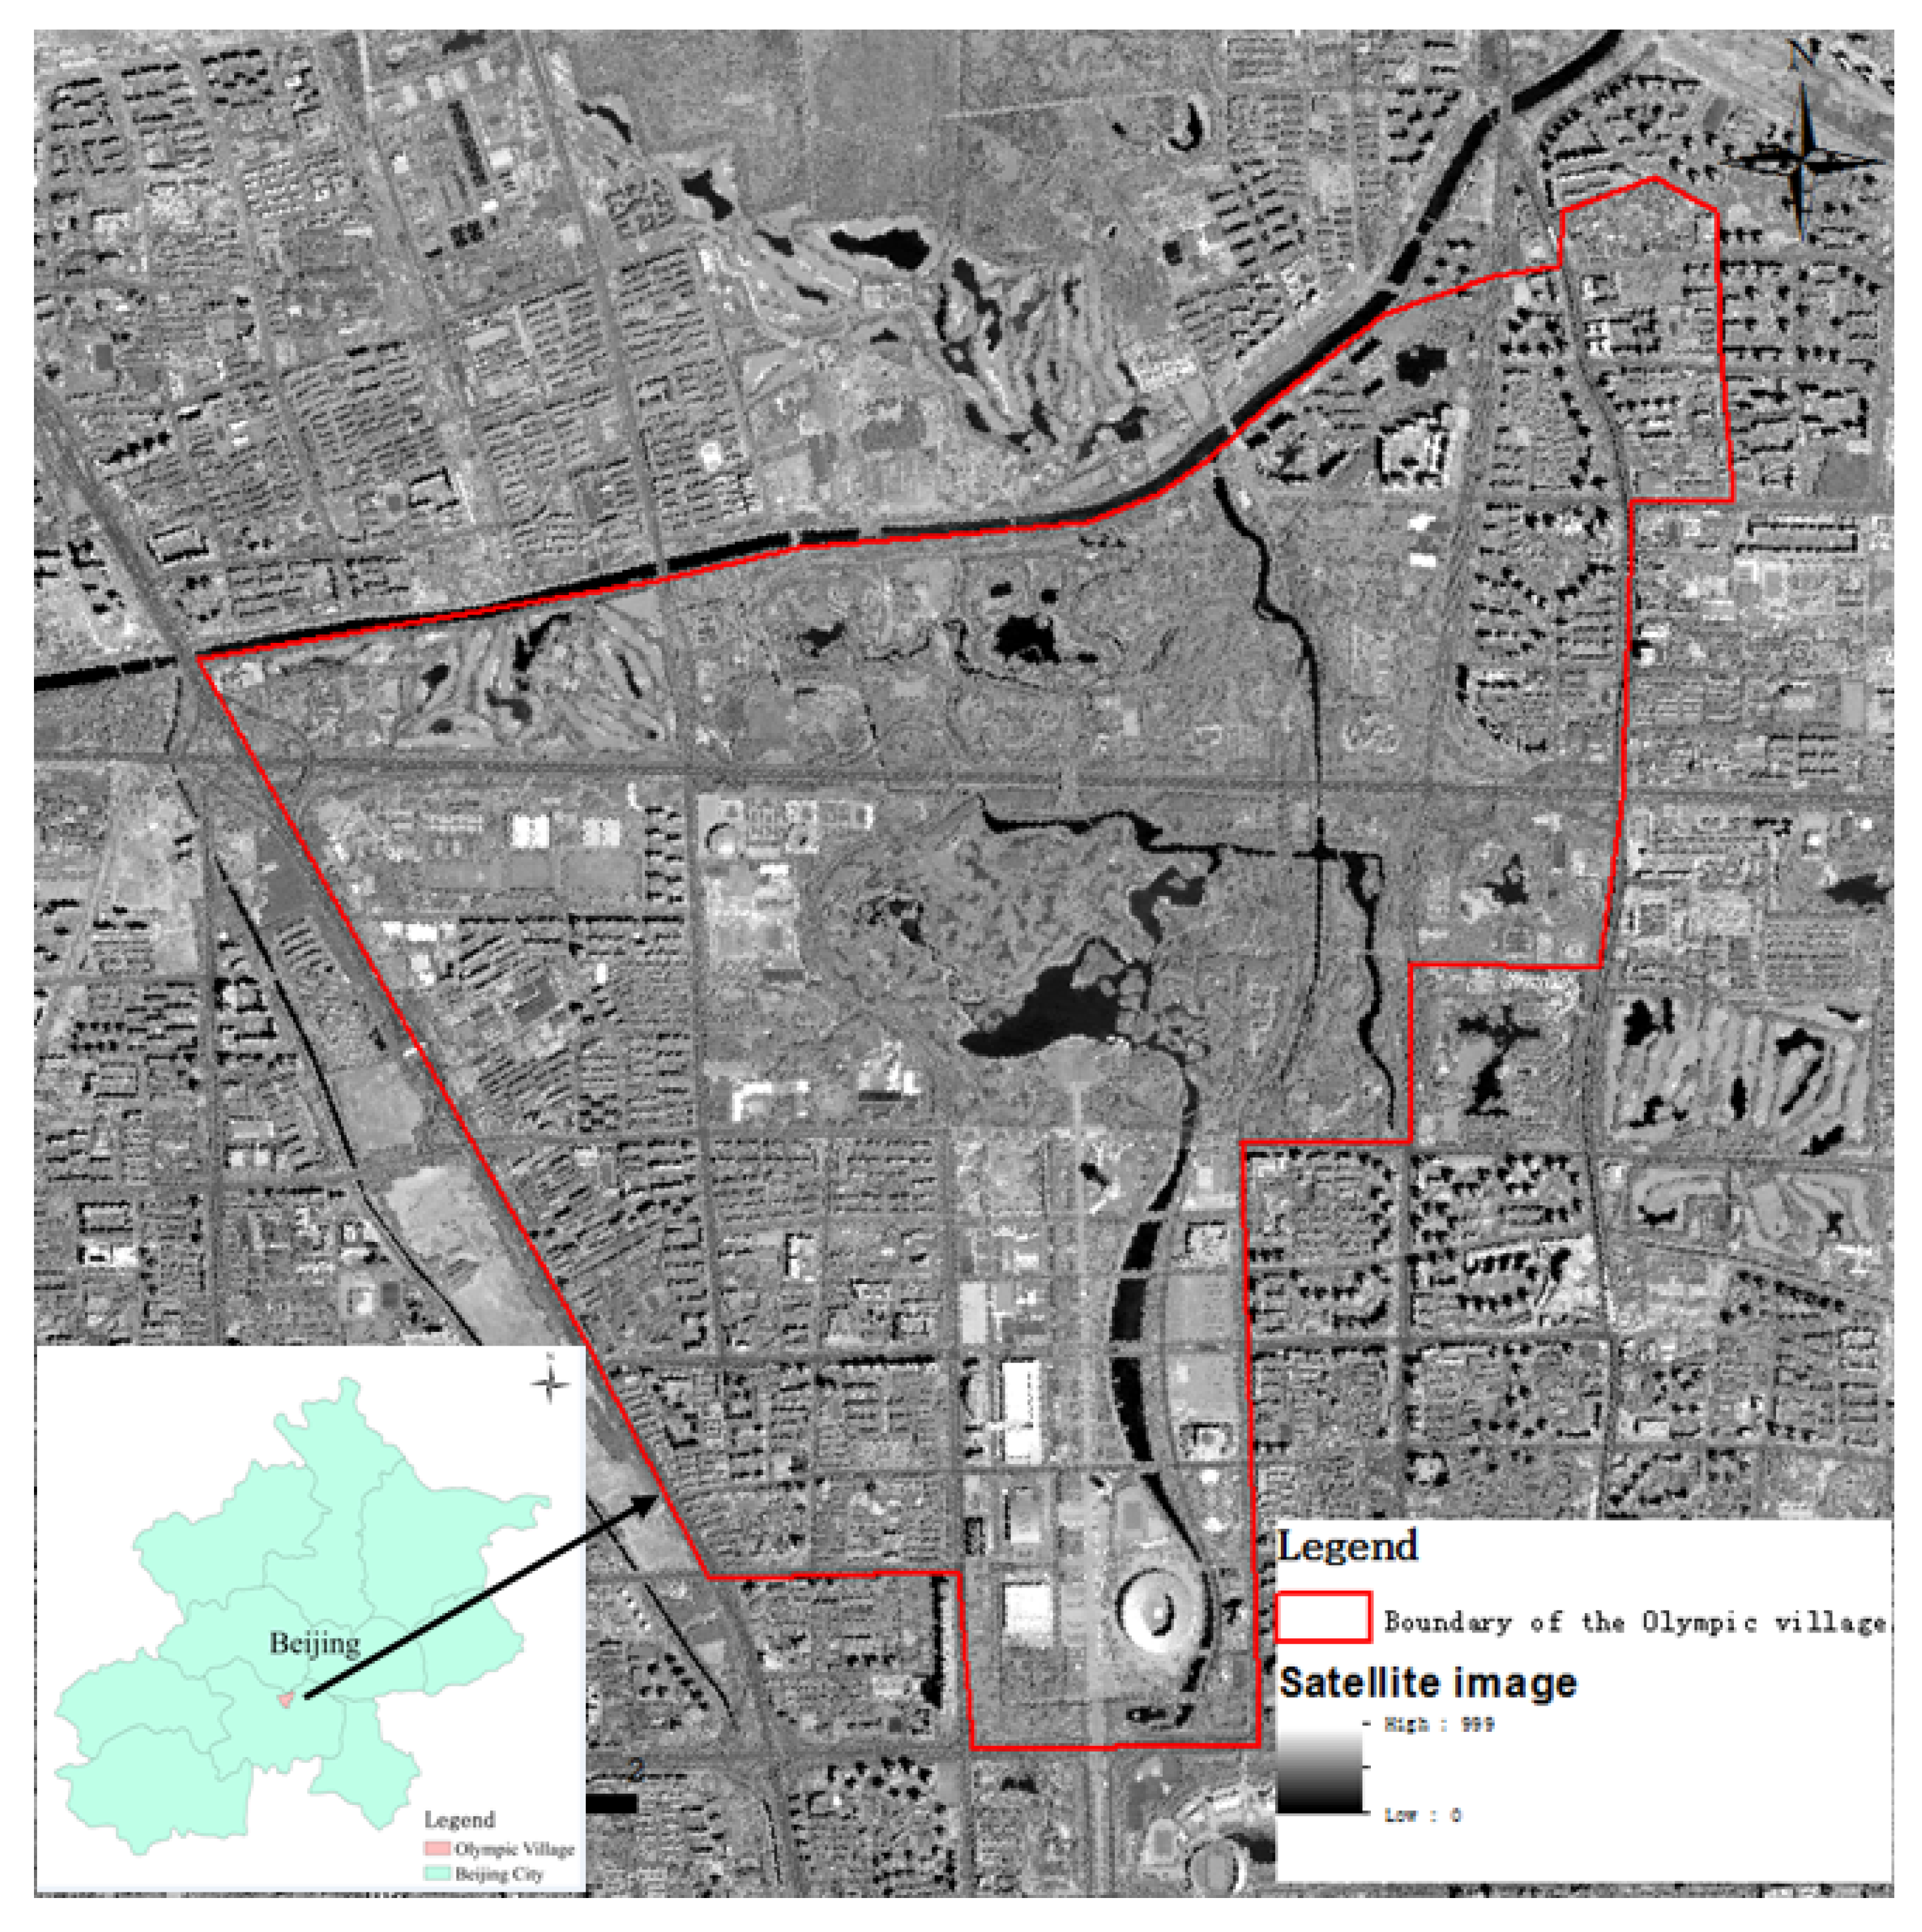
2.1. Study Area

The study area is the Olympic Village in Chaoyang District in Beijing, China, with an area of 19.6 km2 on a flat terrain and a population of about 130,000 as of 2015 living in 12 neighborhoods. The land use types of the study area include residential area, school, hospital, stadium, river, lake, and forest. The Olympic Village was initially built to accommodate athletes during the Beijing 2008 Olympic Games and was converted into residential areas afterwards. Compared to most conventional residential areas in Beijing, the population density in the Olympic Village is more homogeneous among buildings with the same physical properties, which makes it a suitable area for this study in which we focus on the relationship only between population density and the physical properties of buildings, with the hope of minimizing the effects of other factors on population density. The location of the study area is shown in Figure 1.

2.2. Data

The administrative boundary of the Olympic Village was acquired from the National Geomatics Center of China [20]. The census data were collected from the local Bureau of Statistics, surveyed in 2015, which recorded the total population in each neighborhood within the Olympic Village. The high-resolution stereo pair remote sensing images covering the Olympic Village in a spatial resolution of 2.1 m (nadir) and 2.5 m (forward and backward) for the panchromatic band were derived from the ZY3-02 satellite, which is the second satellite of the ZiYuan3 satellite series (China’s first civil three-line array stereo mapping satellite) [21]. Phased 180° apart in the same orbit, the ZY3-02 has increased the efficiency of in-orbit data acquisition and enhanced the acquisition of spatial geographic information, and hence could support mapping services for land resource surveys and monitoring.
The digital elevation model (DEM) data, with a spatial resolution of 10 m, was collected from Geographical Information Monitoring Cloud Platform [22]. The housing price data in the Olympic Village at the end of 2015 was collected from Homelink [23], which is the largest real estate trading platform in China. The points of interest (POI) data were obtained from Baidu Map [24], the most widely used web map service provider in China. The land cover data in 2010 were obtained at a spatial resolution of 30 m from the GlobeLand30 that included 10 land cover classes: water bodies, wetland, artificial surfaces, tundra, permanent snow and ice, grass lands, barren lands, cultivated land, shrub lands, and forest [25].

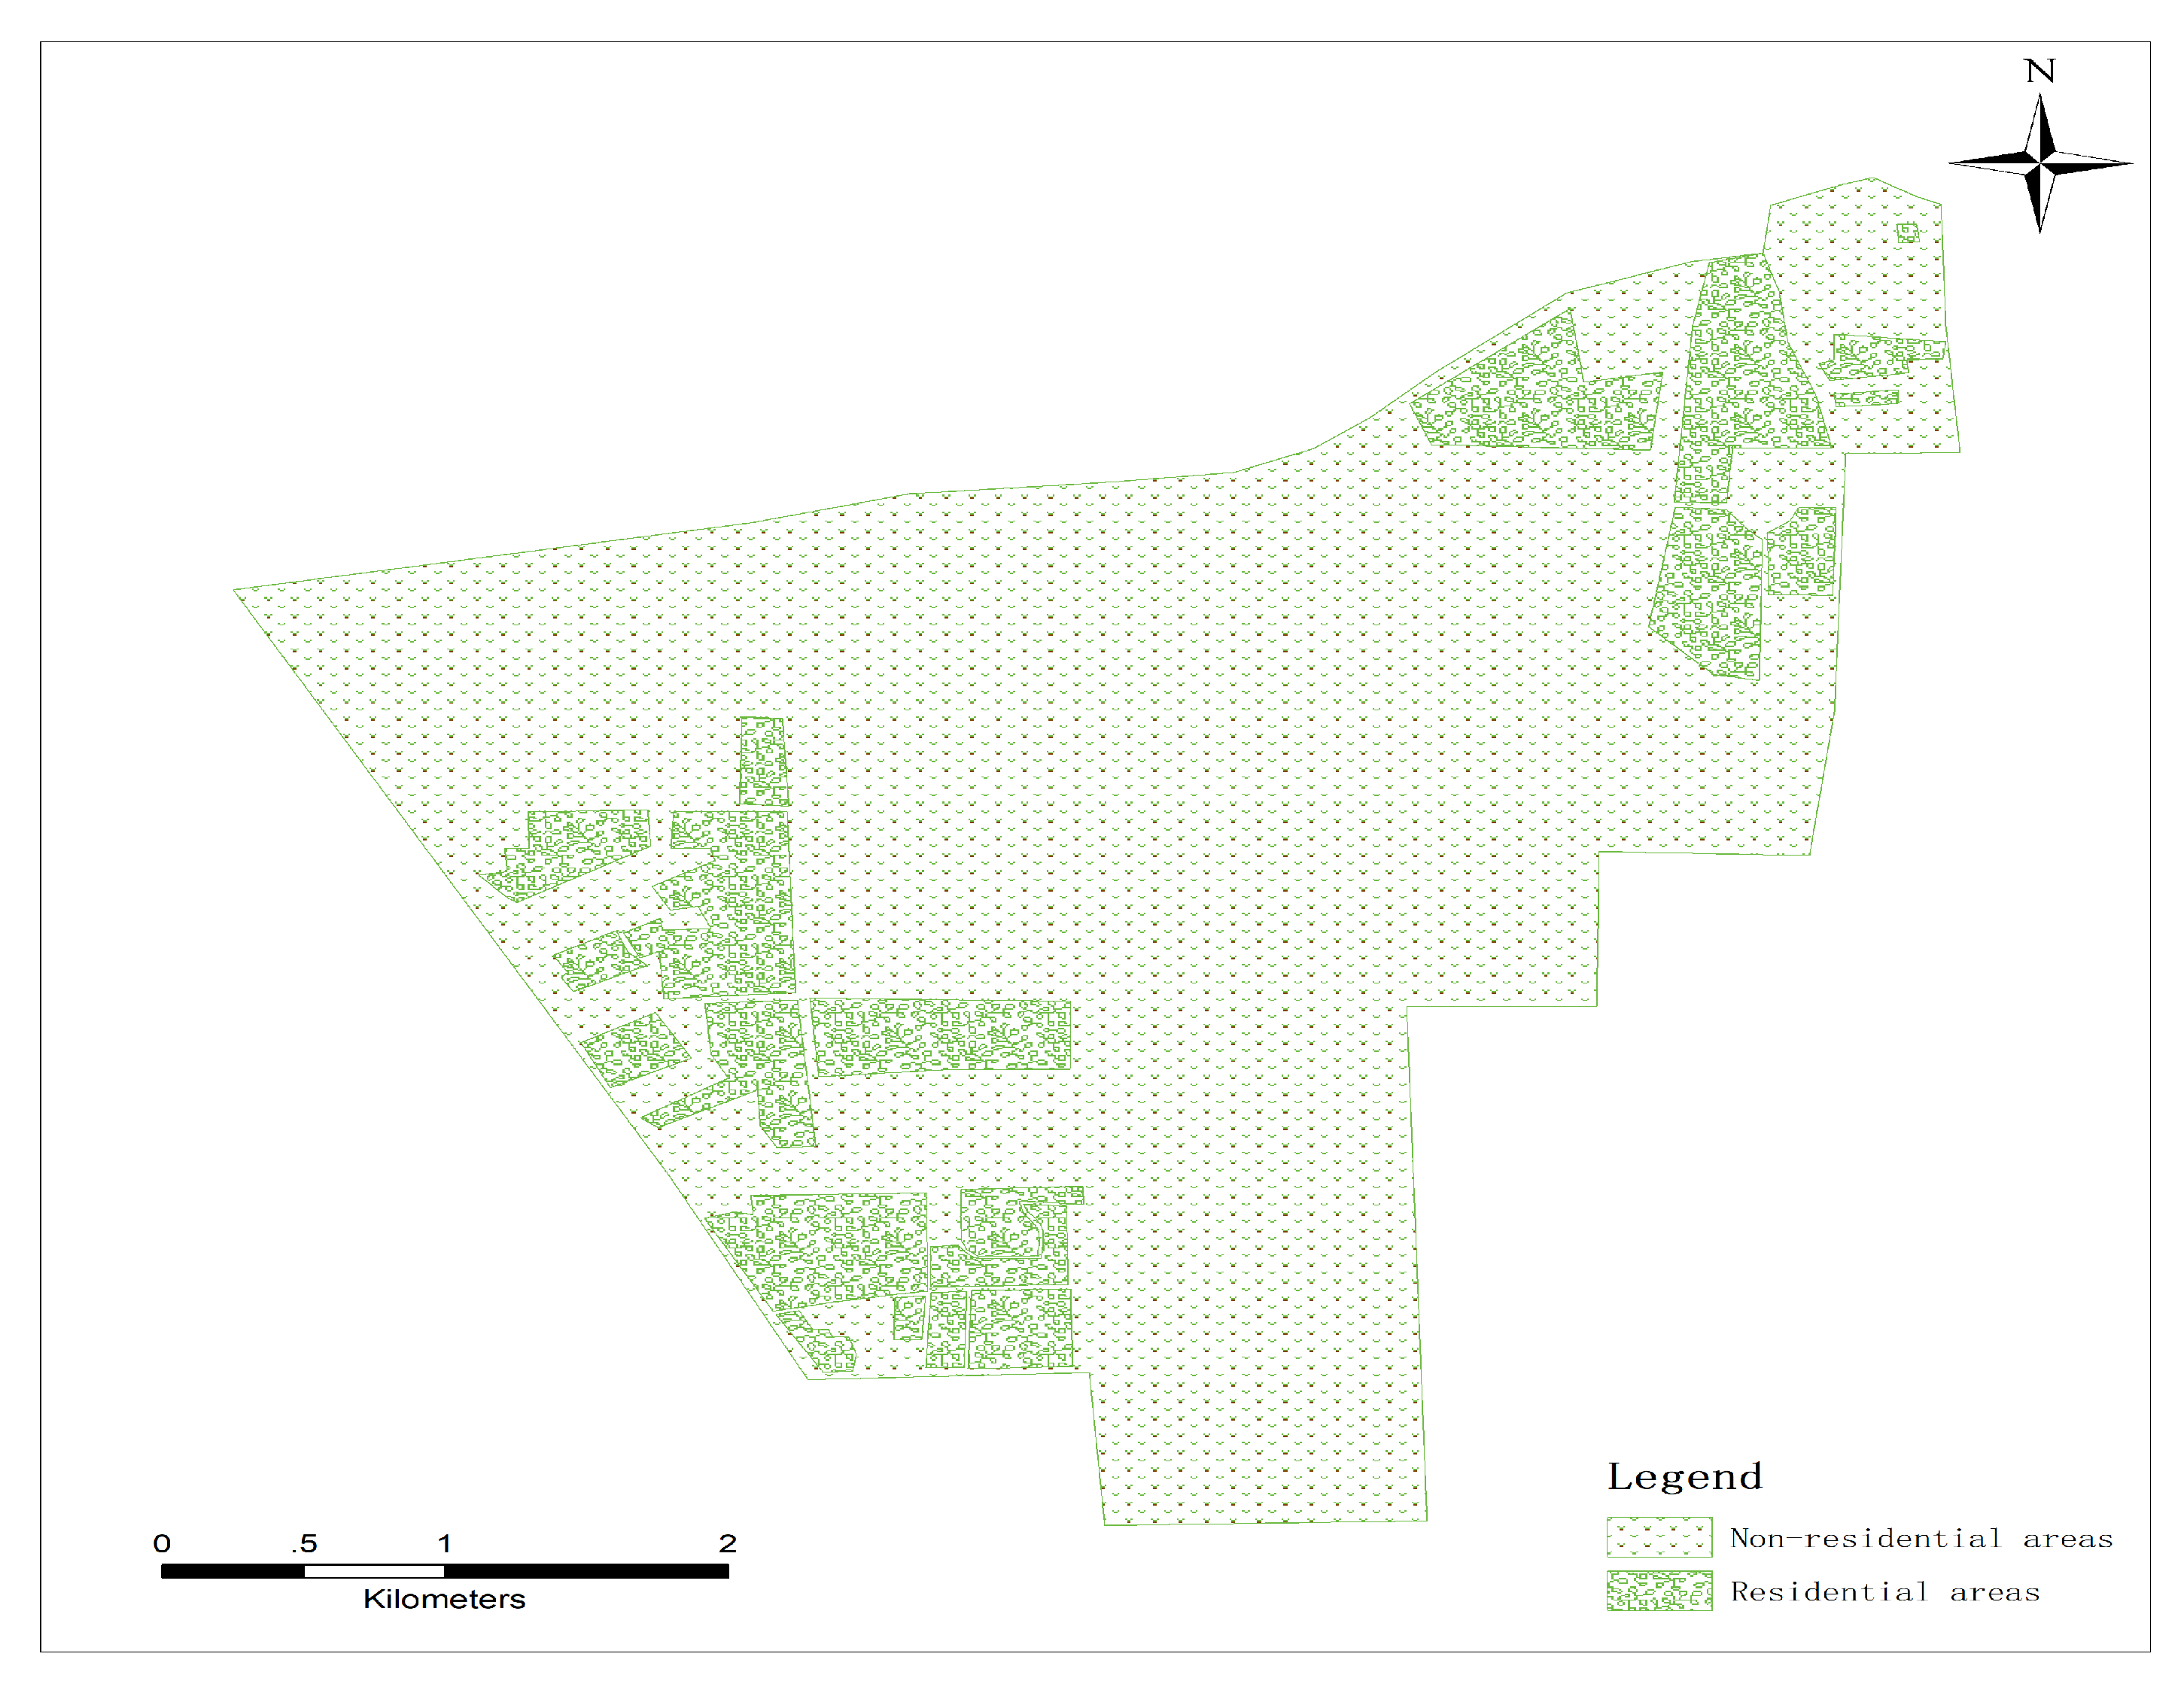
2.3. Extraction of Residential Buildings

Only the population in residential areas was considered in this study of nighttime population modeling. A three-step procedure was used to distinguish residential areas from other classes: residential zones extracted are divided into three steps through a classification of hierarchical decision. Firstly, separate the zones of rivers, lakes, and forests from residential areas on a coarse scale using the land cover data according to its type code for each type of land cover has a sole type code. Then, the zones of stadiums, hospitals, schools, and factories in the study area are separated from the residents’ layers according to the building addresses obtained from Google Earth. Finally, the commercial zones are separated from the ordinary residential zones using the housing price data to achieve a fine classification of urban residential communities, for there is a distinct difference in price between commercial buildings and housing buildings in Beijing.
The residential buildings are extracted through image classification in the residential zones after the residential zones are extracted from the study area because buildings have spectral reflectance very similar to roads and streets. Urban areas are also often full of buildings with multicolor roofs, of different shapes and sizes [1]. In such complex urban environments, conventional pixel-based image classification methods have limited capabilities in processing high resolution data [1,26], and often result in misclassification and low accuracy [27]. Object-based classification methods can produce better separation among spectrally similar classes with high accuracy [28]. A rule-based, object-based image classification approach was used to extract buildings on the basis of the information of image spectrum, texture, and gradient.

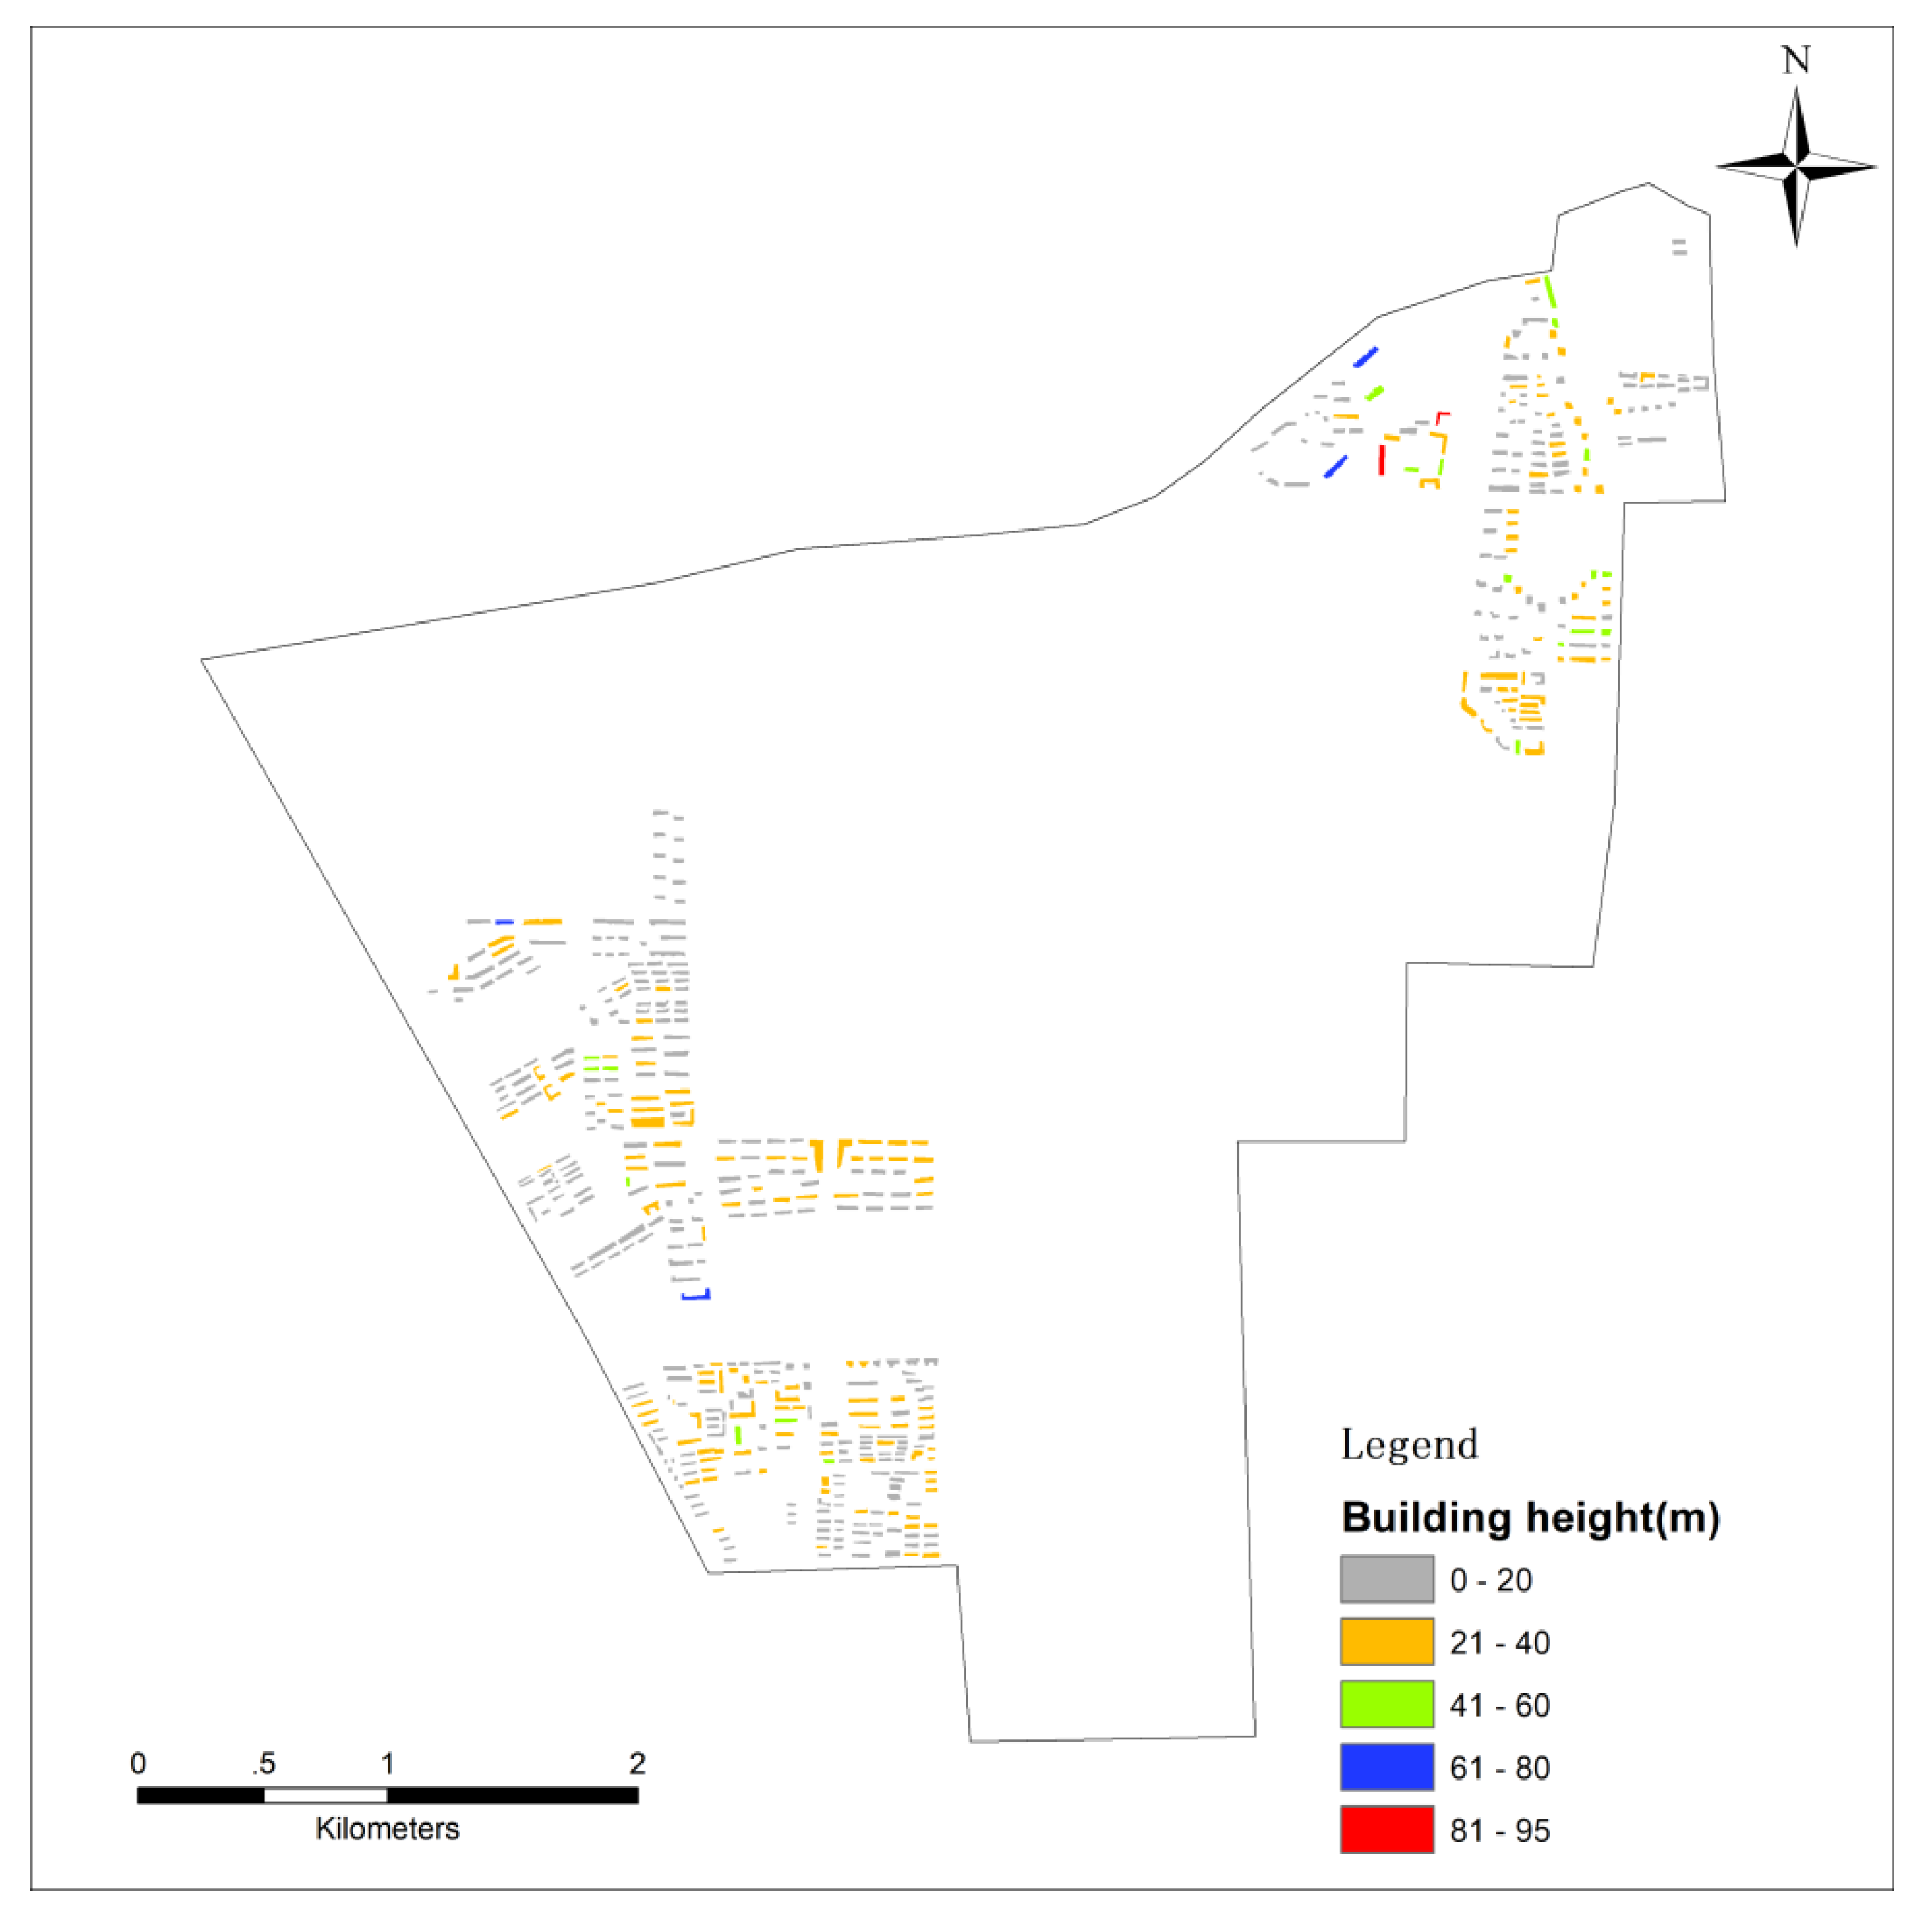
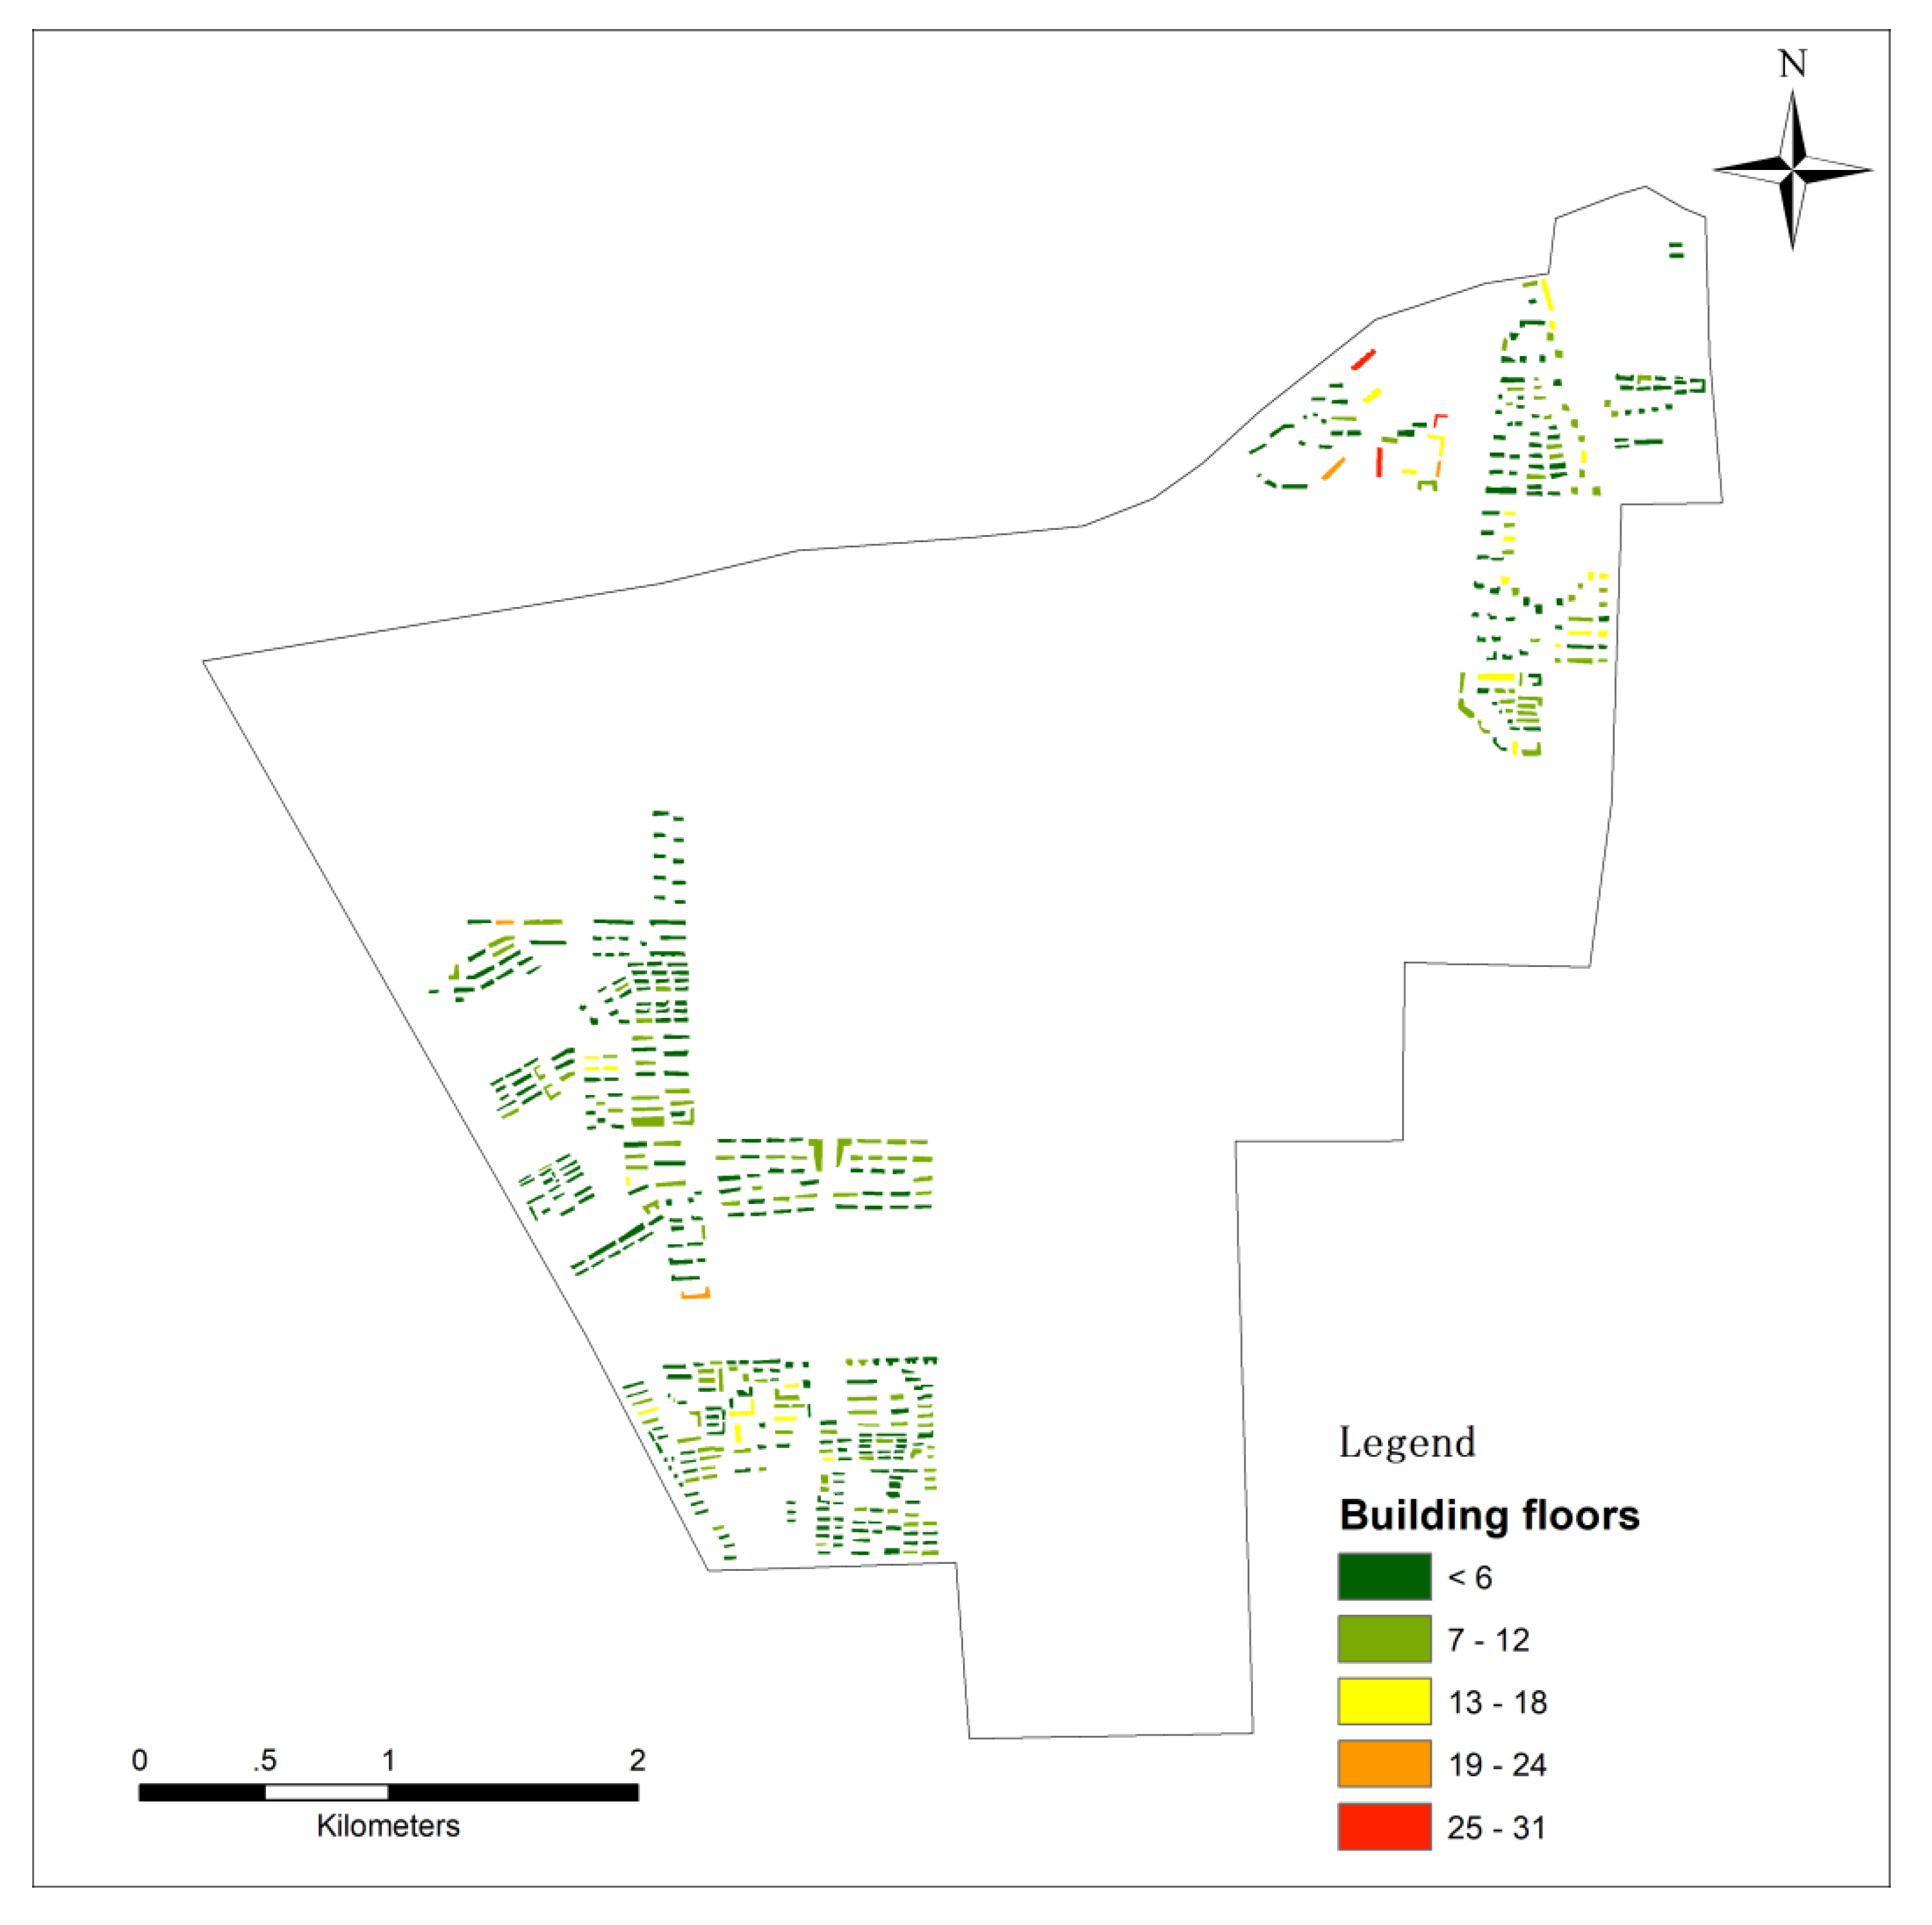
2.4. Estimation of Building Height

The ZY3-02 satellite images were used to build a stereo image pair to extract the building height. (1) Three sets of combinations of different pairs can be generated (i.e., nadir and forward (NF), nadir and backward (NB), and forward and backward (FB)). This study used the NF pair to extract the digital surface model (DSM). The DEM extraction module in the software of ENVI 5.0 was used based on the polynomial coefficients, ground control points (GCPs), and tie-points to calculate a mathematical model which relates the columns and rows of matched pixels with coordinates and elevations. (2) The rational polynomial coefficients (RPC) built on the WGS84 geocentric coordinate system were employed to establish the stereo image pair model and produce a DSM on the basis of the automatic matching method [29]. (3) The generated DSM has a spatial resolution of 2.1 m. It is then co-registered with the DEM layer and the value of it is subtracted and the height information in the residential zones is obtained.

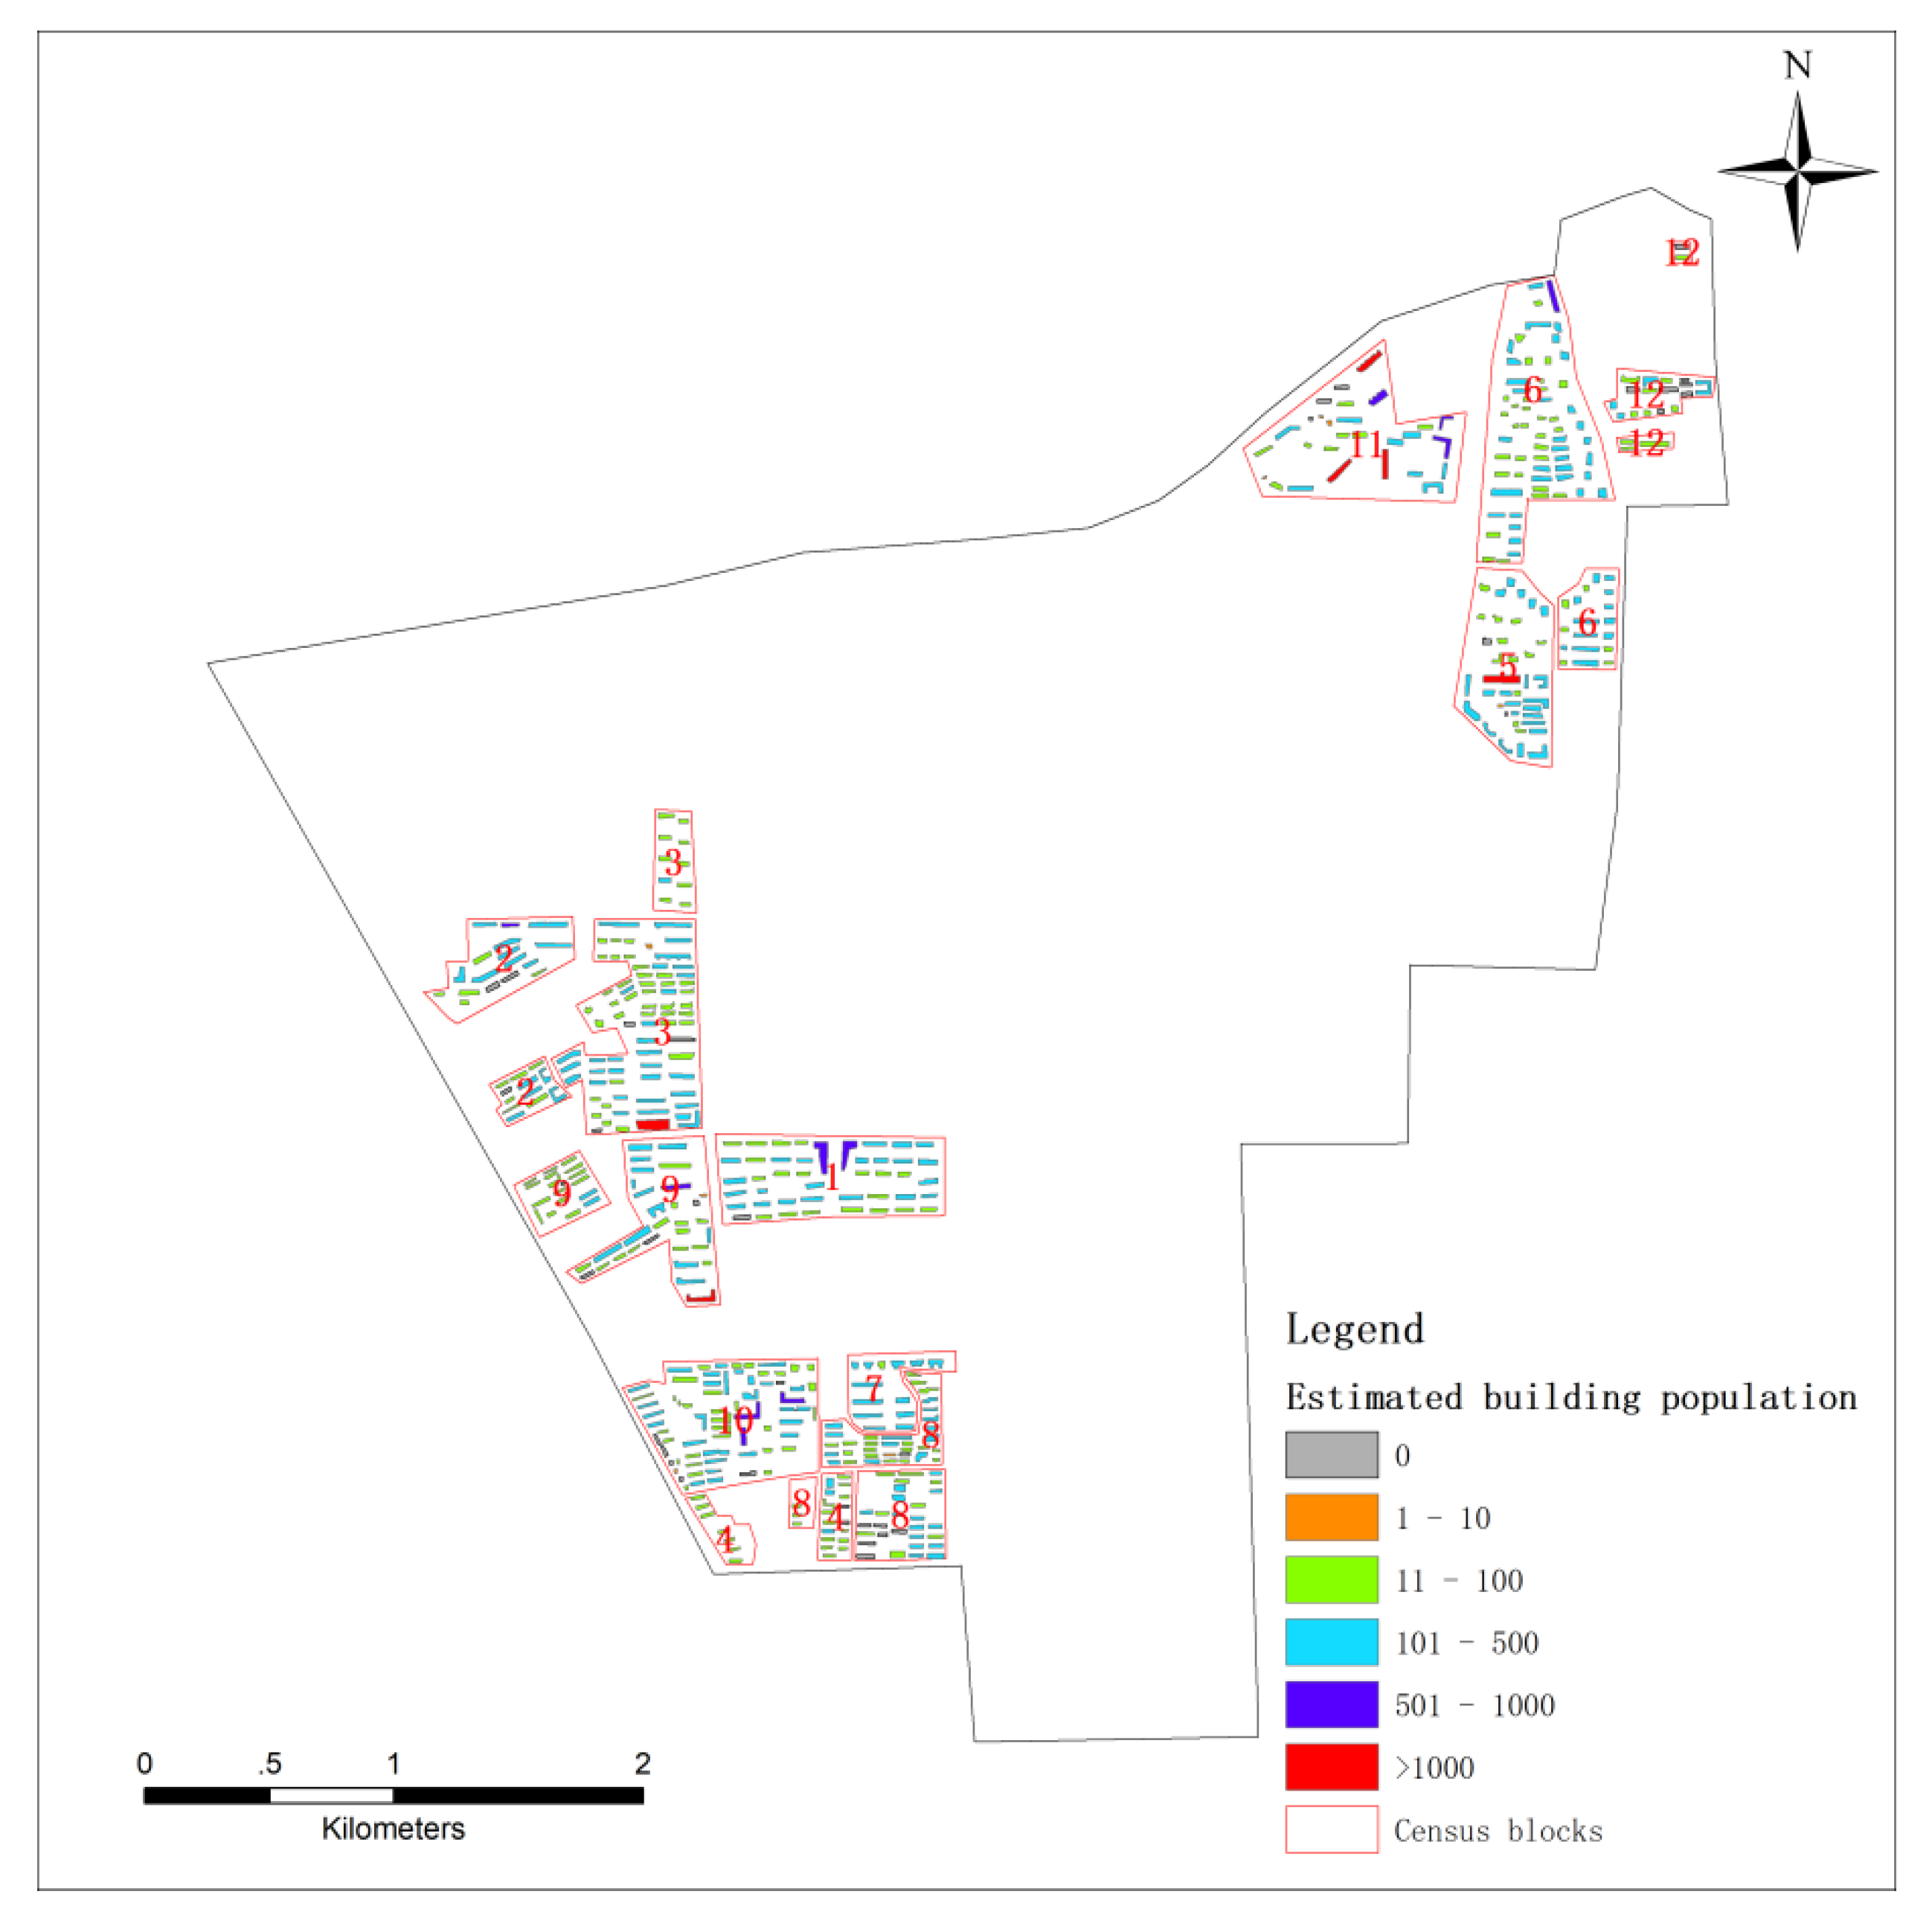
2.5. Population Modeling

We overlapped the height layer with the polygon layer of building location and assigned the mean height value in the polygon of the building as the building height. Since there is no single family housing in the study area of the Olympic Village, all the buildings are multi-family housing, considering that the building floor has a more close relationship with the population than building height, and the use of the building floor in the model can reduce the impact of building height inversion error on the accuracy of population distribution simulation. The study uses building floor to calculate the population density instead of the frequently-used building height in the model. The simplified format can be expressed as the following.
N i = H i F i
where i is the number of buildings, N i represents the account of the ith building floors in the residential zones. H i represents the height of the ith building in the residential zones. F i represents the average floor height of the ith building in the residential zones. Since different buildings have different floor heights the study area varies from 2.8–3.2 m. The floor height for each building or floor is difficult to survey. Therefore, we set a fixed value of 3 m instead of the average floor height of building F i in Equation (1).
The estimated population per building is calculated according to the census data, the building type, area, and the account of building floors.
D i = C i W j = 1 n ( N j A ) N i A i
where j is the number of pixels or grids in the study area; n is the total pixels in the study area; C j represents the building type (=1 if residential, =0 otherwise); W is the total population in the study area acquired from census; N j represent the building floors of pixel j; A represents the area of a pixel or grid in the study area (size = 2.1 m × 2.1 m). N i and A i represent the building floors and the area of building i. The whole flowchart of methods for dasymetric modeling is shown in Figure 2.

2.6. Validation

We compared our modeling results with true values in order to validate the model accuracy. There are no building scale demographic data in the study area. The minimum statistical demographic unit of the study area is community. Therefore, we took the population number of the modeling results in each community and then compared it with the demographics data of it to compute the model error in each community.

3. Results

Figure 3 shows the classified result of residential zones and non-residential zones in the study area. The residential zones are mainly distributed in the northeast and southwest of the Olympic Village. The area of the residential zones is 3.08 km2 which accounts for one sixth of the whole study area. The 12 communities in the study area are separated into 21 blocks.
Figure 4 shows the extracted buildings in the residential zones using objected-oriented classification. There are overall 542 buildings identified in the residential zones. The mean size of the buildings is 953 m2, the maximum is 5059 m2 and the minimum is 130 m2. The overall achieved accuracy and kappa are 94% and 0.92, respectively.
The extracted building heights in the residential zones are shown in Figure 5. As a statistic, we graded them into five ranges including <20 m, 21–40 m, 41–60 m, 61–80 m, and >80 m. In total, 358 buildings have a height below 20 m, and account for 66% of the residential buildings. The highest building is 95 m, and only two buildings have a height that is over 80 m.
Currently, building height information is widely used in high-resolution population estimation, but building floors have a closer correlation with the population than building height, and the use of the building floor in the model reduces the building height inversion error influence on population distribution simulation accuracy, and also improves the model calculation efficiency. Therefore, we used the building floor instead of the common building height in the model. The extracted building floor in the residential zones is as shown in Figure 6.
According to Equation (2), the estimated building population was calculated based on total population and building floor and area data. We classified the population density into six types including 0, 1–10, 11–100, 101–500, 501–1000, and >1000. The result is shown in Figure 7. Overall, 542 buildings have a total population of 139,223, with an average population of 257, a minimum of 0, a maximum of 3322, and a standard deviation of 342.
The study area includes 12 communities (census blocks, see Figure 8); we used the census data of 12 communities in 2017 to validate the estimated population produced by the model. The population estimation errors are shown in Figure 9. Six census blocks were overestimated, and the other six blocks were underestimated. The maximum is block 1, with an error of 34%. The minimum is block 8, with an error of −3%. The errors in the study were mainly caused by the processes of building area and height extraction. The accuracy of the population simulation relies on the methods of object classification and height extraction. The object-oriented classification used in the study is a comprehensive analysis on the basis of the spectral, shape, texture, shadow, and spatial position of each object. When the size, shape, and distribution of the buildings are relatively regular, the classification accuracy is high. However, there is an absolute error mainly ranging from 2 m to 5 m while using the stereo pair photogrammetry. The bigger the building height, the smaller the relative error. Therefore, our method is more effective for urban areas where residential buildings have a regular size, shape, distribution, and high-rise.

4. Discussion

The study proposed a new model to estimate the building-scale spatial population in an urban area. Combined with the ZY3 stereo pair remote sensing images, the method can also be used to produce a new fine-scale population data based on global population products such as GPW, LansScan, and WorldPop instead of census data. The population distribution has the characteristics of spatial dynamic. In order to simplify the model, this research ignored the time dynamic, mainly studied the static night population spatial distribution simulation method. According to the existing research results, although there are many factors that could affect the population distribution in residential buildings, the volume is the optimal factor of fine scale population distribution simulation. The use of remote sensing images, address data, housing price data, land use maps, DEM date, and other publicly available supplementary data is effective in identifying residential buildings.
Estimating the building height is a key step in the study of fine-scale population simulation. The methods of building height retrieval using remote sensing can be divided into four types including building shadow-based method, radar image-based method, LiDAR point cloud data-based method, and stereo pairs-based method. The building shadow-based method is a widely application on building height estimating [30], but it has great limitations in that it cannot obtain an accurate building height in the case of terrain interference or dense buildings. The building height estimating method based on the synthetic aperture radar still faces problems such as difficulty in image registration and interpretation and low degree of automation [31]. The three-dimensional (3D) reconstruction of buildings on the basis of LiDAR data is a method that has grown rapidly in recent years; it mainly uses the segmentation method to obtain the contours and heights of buildings with high precision. However, the LiDAR data are expensive, cover a small area, and the data are difficult to acquire [32,33]. The stereo pairs-based method of building height inversion has a distinct principle and the data is easy to obtain. The method is relatively easy and has a high accuracy, which is a viable and reliable method for building height estimating, but it is mainly on the basis of aerial stereo pairs [34].
Points of interest data such as mobile phones, Baidu, Wechat, Twitter, or OpenStreetMap is a very useful source to estimate the population density in an urban area [35,36,37]. In particular, combined points of interest data and remote sensing images improve the accuracy of population modeling [38]. However, remote sensing data employed in the model were always limited by the spatial resolution which mainly ranged from 30 m to 1 km. Our study is the first to use the ZY3-02 satellite images of stereo pairs to retrieve building height for fine-scale population simulation. Although it may not have very high accuracy, it has a meter level spatial resolution and provides potential for the global fine-scale spatial population estimation.
There are also some limitations in this study. First, the current models for population estimation or distribution simulation are mostly on the basis of the statistical regression methods, namely using population-related indicators to establish a population estimation model to obtain the spatial distribution of the population. The statistical regression method relies on the samples and has poor generalizability in larger areas. Second, the accuracy of object classification and height extraction could influence the accuracy of population modeling. However, there is not a single method of classification or object extraction that can avoid all errors. Yet we can improve the model by incorporating spatial data with higher resolution (e.g., airborne LiDAR data) and even the modern big data (e.g., individual-level tracking data) [39]. Third, this model is only for simulating night population spatial distribution, because during the daytime the population is mainly located at work, study, or leisure places such as factories, schools, and malls. Finally, the model may be more suitable for urban areas than rural areas.

5. Conclusions

The aim of this work was to simulate the urban nighttime population distribution on a fine spatial scale. We firstly extracted the residential zones based on the data of LUCC and Google Earth data, combined with the building address, prices, and other information. Then we employed the stereo pair analysis method to calculate the building height on the basis of high spatial resolution ZY3-02 satellite remote sensing data, and transformed building height into building floors. After that, we built a sophisticated, high spatial resolution model of population density. Finally, we evaluated the accuracy of the model using the survey data in 12 communities of the study area. The accuracy of the model is mainly in the methods of object classification and height extraction. On the basis of the object-oriented classification and stereo pair photogrammetry, our method is more effective to urban areas where the residential buildings are more regular in size, shape, distribution and high-rise. In our future work, higher spatial resolution remote sensing imagery will used to improve the accuracy of the building area exaction, and LiDAR data will be added to estimate the building height. The fine-scale urban population spatial products are expected to serve as a more accurate input in various research fields, such as public health, emergency rescue, and climate change. The approach outlined provides an improved means of producing spatially-explicit population data. Also, the widely used world population data such as high resolution settlement layer (HRSL) from Center for International Earth Science Information Network (CIESIN) can be added in our model to improve the accuracy in future research [40].

Author Contributions

Conceptualization, Writing-Review & Editing, Supervision and Visualization, P.J.; Methodology, Software Formal Analysis, Validation, Writing-Original Draft Preparation and Funding Acquisition, M.X.; Investigation, Resources, Data Curation and Project Administration, C.C. All authors have read and agreed to the published version of the manuscript.

Funding

The study was supported by the project of the National Key R&D Program of China “Research of Key Technologies for Monitoring Forest Plantation Resources (2017YFD0600900)” project, the Key Laboratory for National Geographic State Monitoring, National Administration of Surveying, Mapping and Geoinformation (2015NGCM), the Major Program on Science of State Key Laboratory of Remote Sensing Science (ZD12-5), the National Natural Science Foundation of China (41301502), and the State Key Laboratory of Urban and Regional Ecology of China (SKLURE2018-2-5).

Acknowledgments

We acknowledge the contribution of Kun Qin of Wuhan University for constructive comments. Peng Jia, Director of the International Initiative on Spatial Lifecourse Epidemiology (ISLE), thanks the Netherlands Organization for Scientific Research, the Royal Netherlands Academy of Arts and Sciences, the Chinese Center for Disease Control and Prevention, and the West China School of Public Health in Sichuan University for funding the ISLE and supporting ISLE’s research activities.

Conflicts of Interest

The authors declare no conflict of interest.

References

  1. Ural, S.; Hussain, E.; Shan, J. Building population mapping with aerial imagery and GIS data. Int. J. Appl. Earth Obs. Geoinf. 2011, 13, 841–852. [Google Scholar] [CrossRef]
  2. Martin, D. Directions in population GIS. Geogr. Compass 2011, 5, 655–665. [Google Scholar] [CrossRef]
  3. Jia, P.; Qiu, Y.; Gaughan, A.E. A fine-scale spatial population distribution on the high-resolution gridded population surface in Alachua County, Florida. Appl. Geogr. 2014, 50, 99–107. [Google Scholar] [CrossRef]
  4. Chakraborty, J.; Tobin, G.A.; Montz, B.E. Population evacuation: Assessingspatial variability in geophysical risk and social vulnerability to natural hazards. Nat. Hazards Rev. 2005, 6, 23–33. [Google Scholar] [CrossRef]
  5. Pal, A.; Graettinger, A.J.; Triche, M.H. Emergency evacuation modelingbased on geographical information system data. In Proceedings of the 2003 TRB Annual Meeting, Washington, DC, USA, 12–16 January 2003. [Google Scholar]
  6. Jia, P. Developing a flow-based spatial algorithm to delineate hospital service areas. Appl. Geogr. 2016, 75, 137–143. [Google Scholar] [CrossRef]
  7. Maantay, J.A.; Maroko, A.R.; Herrmann, C. Mapping population distribution in the urban environment: The cadastral-based expert dasymetric system(CEDS). Cartogr. Geogr. Inf. Sci. 2007, 34, 77–102. [Google Scholar] [CrossRef]
  8. Luo, W.; Wang, F. Measures of Spatial Accessibility to Health Care in a GIS Environment: Synthesis and a Case Study in the Chicago Region. Environ. Plan. B Plan. Des. 2003, 30, 865–884. [Google Scholar] [CrossRef] [Green Version]
  9. Tayman, J.; Pol, L. Retail site selection and Geographic Information Systems. J. Appl. Bus. Res. (JABR) 2011, 11, 46. [Google Scholar] [CrossRef]
  10. Krunic, N.; Bajat, B.; Kilibarda, M.; Tosic, D. Modelling the spatial distribution of Vojvodina’s population by using dasymetric method. Spatium 2011, 24, 45–50. [Google Scholar] [CrossRef]
  11. Langford, M. Rapid facilitation of dasymetric-based population interpolation by means of raster pixel maps. Comput. Environ. Urban Syst. 2007, 31, 19–32. [Google Scholar] [CrossRef]
  12. Lin, J.; Cromley, R.; Zhang, C. Using geographically weighted regression to solve the areal interpolation problem. Ann. GIS 2011, 17, 1–14. [Google Scholar] [CrossRef]
  13. Saporito, S.; Chavers, J.M.; Nixon, L.C.; McQuiddy, M.R. From here to there: Methods of allocating data between census geography and socially meaningful areas. Soc. Sci. Res. 2007, 36, 897–920. [Google Scholar] [CrossRef]
  14. Mennis, J. Dasymetric Mapping for Estimating Population in Small Areas. Geogr. Compass 2009, 3, 727–745. [Google Scholar] [CrossRef]
  15. Bhaduri, B.; Bright, E.; Coleman, P.; Urban, M.L. LandScan USA: A high-resolution geospatial and temporal modeling approach for population distribution and dynamics. GeoJournal 2007, 69, 103–117. [Google Scholar] [CrossRef]
  16. Jia, P.; Gaughan, A.E. Dasymetric modeling: A hybrid approach using land cover and tax parcel data for mapping population in Alachua County, Florida. Appl. Geogr. 2016, 66, 100–108. [Google Scholar] [CrossRef]
  17. Lwin, K.; Murayama, Y. A GIS estimation of building population for micro-spatial analysis. Trans. GIS 2009, 13, 401–404. [Google Scholar] [CrossRef]
  18. Lu, Z.; Im, J.; Quackenbush, L.; Halligan, K. Population estimation based on multi-sensor data fusion. Int. J. Remote Sens. 2010, 31, 5587–5604. [Google Scholar] [CrossRef]
  19. Lung, T.; Lübker, T.; Ngochoch, J.K.; Schaab, G. Human population distribution modelling at regional level using very high resolution satellite imagery. Appl. Geogr. 2013, 41, 36–45. [Google Scholar] [CrossRef]
  20. National Geomatics Center of China. Available online: http://ngcc.sbsm.gov.cn/ (accessed on 12 May 2016).
  21. Xu, K.; Jiang, Y.H.; Zhang, G.; Zhang, Q.J.; Wang, X. Geometric potential assessment for ZY3-02 triple linear array imagery. Remote Sens. 2017, 9, 658. [Google Scholar] [CrossRef] [Green Version]
  22. Geographical Information Monitoring Cloud Platform. Available online: http://www.dsac.cn/DataProduct (accessed on 14 July 2016).
  23. Homelink. Available online: http://bj.lianjia.com/ (accessed on 29 December 2015).
  24. Baidu Map. Available online: http://map.baidu.com/ (accessed on 24 February 2016).
  25. Jun, C.; Ban, Y.; Li, S. Open access to Earth land-cover map. Nature 2014, 514, 434. [Google Scholar] [CrossRef] [Green Version]
  26. Im, J.; Jensen, J.R.; Tullis, J.A. Object-based change detection using correlation image analysis and image segmentation. Int. J. Remote Sens. 2008, 29, 399–423. [Google Scholar] [CrossRef]
  27. Smith, G.M.; Fuller, R.M. An integrated approach to land cover classification: An example in the Island of Jersey. Int. J. Remote Sens. 2001, 22, 3123–3142. [Google Scholar] [CrossRef]
  28. Stow, D.; López, A.; Lippitt, C.; Hinton, S.; Weeks, J. Object-based classification of residential land use within Accra, Ghana based on QuickBird satellite data. Int. J. Remote Sens. 2007, 28, 5167–5173. [Google Scholar] [CrossRef] [PubMed]
  29. Ni, W.; Sun, G.; Ranson, K.J.; Pang, Y.; Zhang, Z.; Yao, W. Extraction of ground surface elevation from ZY-3 winter stereo imagery over deciduous forested areas. Remote. Sens. Environ. 2015, 159, 194–202. [Google Scholar] [CrossRef]
  30. Chen, F.; Thiel, K.H. Delimiting the building heights in city from the shadow in Panchromatic SPOT-image-Part 1. Test of Forty-two buildings. Remote Sens. 1995, 16, 409–415. [Google Scholar] [CrossRef]
  31. Tupin, F. Merging of SAR and optical features for 3D reconstruction in a radar grammetric framework. In Proceedings of the IEEE International Geoscience and Remote Sensing Symposium, Anchorage, AK, USA, 20–24 September 2004; pp. 395–398. [Google Scholar]
  32. Awrangjeb, M.; Ravanbakhsh, M. Automatic detection of residential buildings using LiDAR data and multispectral imagery. ISPRS-J. Photogramm. Remote Sens. 2010, 65, 457–467. [Google Scholar] [CrossRef] [Green Version]
  33. Dong, P.; Ramesh, S.; Nepali, A. Evaluation of small-area population estimation using LiDAR, Landsat TM and parcel data. Int. J. Remote Sens. 2010, 31, 5571–5586. [Google Scholar] [CrossRef]
  34. Baillard, C.; Maitre, H. 3D reconstruction of urban scenes from aerial stereo imagery: A focus of strategy. Comput. Vis. Image Underst. 1999, 76, 244–258. [Google Scholar] [CrossRef] [Green Version]
  35. Deville, P.; Linard, C.; Martin, S.; Gilbert, M.; Stevens, F.R.; Gaughan, A.E.; Blondel, V.D.; Tatem, A.J. Dynamic population mapping using mobile phone data. Proc. Natl. Acad. Sci. USA 2014, 111, 15888. [Google Scholar] [CrossRef] [Green Version]
  36. Stevens, F.R.; Gaughan, A.E.; Linard, C.; Tatem, A.J. Disaggregating census data for population mapping using random forests with remotely-sensed and ancillary data. PLoS ONE 2015, 10, e0107042. [Google Scholar] [CrossRef] [Green Version]
  37. Patel, N.N.; Stevens, F.R.; Huang, Z.; Gaughan, A.E.; Elyazar, I.; Tatem, A.J. Improving large area population mapping using Geotweet densities. Trans. GIS 2016, 21, 317–331. [Google Scholar] [CrossRef] [PubMed]
  38. Yang, X.; Ye, T.; Zhao, N.; Chen, Q.; Yue, W.; Qi, J.; Zeng, B.; Jia, P. Population mapping with multisensor remote sensing images and Point-of-Interest data. Remote Sens. 2019, 11, 574. [Google Scholar] [CrossRef] [Green Version]
  39. Jia, P.; Xue, H.; Liu, S.; Wang, H.; Yang, L.; Hesketh, T.; Ma, L.; Cai, H.; Liu, X.; Wang, Y.; et al. Opportunities and challenges of using big data for global health. Sci. Bull. 2019, 64, 1652–1654. [Google Scholar] [CrossRef] [Green Version]
  40. Facebook Connectivity Lab and Center for International Earth Science Information Network—CIESIN—Columbia University. Available online: https://www.ciesin.columbia.edu/data/hrsl/ (accessed on 21 January 2020).
Figure 1. The location and ZY3-02 remote sensing image of the study area. The red line area in the image is the study area of the Olympic village.
Remotesensing 12 00608 g001
Figure 2. Whole flowchart of methods for dasymetric modeling. DEM: digital elevation model.
Remotesensing 12 00608 g002
Figure 3. The classified result of residential zones and non-residential zones in the study area.
Remotesensing 12 00608 g003
Figure 4. The identified buildings in the residential zones.
Remotesensing 12 00608 g004
Figure 5. The extracted building height in the residential zones.
Remotesensing 12 00608 g005
Figure 6. The distribution of the corrected building floors in the study area.
Remotesensing 12 00608 g006
Figure 7. The distribution of refined population density of the study area.
Remotesensing 12 00608 g007
Figure 8. The partition of 12 communities in the study area.
Remotesensing 12 00608 g008
Figure 9. The population estimation errors of each community in the study area.
Remotesensing 12 00608 g009

