Article

Monitoring Rock Glacier Kinematics with Satellite Synthetic Aperture Radar

1
Gamma Remote Sensing, 3073 Gümligen, Switzerland
2
Department of Geosciences, Geography, University of Fribourg, 1700 Fribourg, Switzerland
3
Laboratoire EDYTEM, CNRS/Université Savoie Mont-Blanc, 73370 Le Bourget-du-Lac, France
4
Department of Geosciences, University of Oslo, 0316 Oslo, Norway
5
Asiaq, Greenland Survey, 3900 Nuuk, Greenland
6
Department of Geography, University of Bonn, 53115 Bonn, Germany
*
Author to whom correspondence should be addressed.
Remote Sens. 2020, 12(3), 559; https://doi.org/10.3390/rs12030559
Submission received: 24 December 2019 / Revised: 24 January 2020 / Accepted: 5 February 2020 / Published: 7 February 2020
(This article belongs to the Special Issue Remote Sensing of Permafrost Environment Dynamics)

Abstract

:
Active rock glaciers represent the best visual expression of mountain permafrost that can be mapped and monitored directly using remotely sensed data. Active rock glaciers are bodies that consist of a perennially frozen ice/rock mixture and express a distinct flow-like morphology indicating downslope permafrost creep movement. Annual rates of motion have ranged from a few millimeters to several meters per year, varying within the annual cycle, from year to year, as well as at the decennial time scale. During the last decade, in situ observations in the European Alps have shown that active rock glaciers are responding almost synchronously to inter-annual and decennial changes in ground temperature, suggesting that the relative changes of their kinematics are a general indicator of the evolution of mountain permafrost conditions. Here, we used satellite radar interferometry (InSAR) to monitor the rate of motion of various active rock glaciers in the Swiss Alps, Qeqertarsuaq (Western Greenland), and the semiarid Andes of South America. Velocity time series computed with Sentinel-1 SAR images, regularly acquired since 2014, every six days over Europe and Greenland and every 12 days over the Andes, show annual fluctuations, with higher velocities at the end of the summer. A JERS-1 image pair of 1996 and stacks of very high-resolution SAR images from TerraSAR-X and Cosmo-SkyMed from 2008 to 2017 were analyzed using InSAR and offset tracking over the Western Swiss Alps in order to extend the main observation period of our study. A quantitative assessment of the accuracy of InSAR and offset tracking was performed by comparison with in situ methods. Our results for the three different study regions demonstrate that Sentinel-1 InSAR can complement worldwide in situ measurements of active rock glacier kinematics.

Graphical Abstract

1. Introduction

Permafrost is a specific thermal condition that allows for the formation and preservation of ice in the ground as the associated ground temperature stays permanently at or below 0 °C. In mountain areas, permafrost underlays large areas at all latitudes worldwide [1,2]. Because of the influence of mountain topography on permafrost properties, the frozen ground in mountainous terrain is moving and considerable volumes of debris or fractured rocks are continuously displaced downslope under gravity [3]. Mountain permafrost is, thus, a key factor affecting slope stability in high mountains [4,5]. Mountain permafrost temperatures are in many mountain regions just below the thawing point, and therefore climate change can rapidly impact mountain regions inducing or contributing to permafrost degradation. This can increase related geohazards for mountain settlements and infrastructure [6]. In addition to influencing geohazards and representing an environmental indicator, mountain permafrost also affects the water cycle in high mountains [7].
Mapping and monitoring of mountain permafrost by remotely sensed data is most easily achieved by studying active rock glaciers. Rock glaciers are defined by material, landform, and process [4]. They are creeping sediment bodies consisting of a mixture of poorly sorted, angular debris that is cemented together by interstitial ice [8,9] and embed massive ice of glacial origin. Rock glaciers typically form at the foot of steep headlands in cirques or along valley walls or have a connection to a glacier or a morainic system [10,11]. Rock glaciers often have a distinct morphology of lobate ridges and furrows indicating high-viscosity flow-like downslope creep by deformation of the ice/rock mixture contained within them [4]. Rock glaciers typically occur in the following three forms: lobate (width-to-length ratio ≥1), tongue-shaped (width-to-length ratio <1), or spatulate (also termed piedmont type, these are tongue-shaped with a broadened terminus); depending on topography, several rock glaciers can merge or separate in flow direction [12,13].
Annual rates of motion of rock glaciers range from a few millimeters (i.e., the lower boundary of detection accuracy) to several meters per year, whereby the surface of a rock glacier typically moves faster than the base through lateral velocities decreasing with depth. In addition, motion rates vary within the annual cycle [14], from year to year, as well as at the decennial time scale (e.g., [15,16,17,18]). During the last decade, an increasing number of studies have monitored in situ creep behavior of active rock glaciers in the European Alps [3,18,19,20]. While on an annual cycle, rock glacier velocities are typically higher in November and lower in April, observations also showed that a majority of the surveyed rock glaciers, irrespective of their size and velocity, responded sensitively and almost synchronously to inter-annual and decennial ground temperature changes. Whereas the absolute motion rate of a rock glacier is related to a multitude of factors, including headwall erosion rates, debris origin, and liquid water pressure [4,11,21,22], relative variations over time scales from months to years appear to be particularly dependent on the temperature profile between the permafrost table and the main shear horizon at depth [23]. Changes in rock glacier motion are, thus, believed to be their most indicative short- to medium-term response to environmental changes and an indicator of mountain permafrost conditions in general.
The activity of rock glaciers cannot be determined easily using field observations or photographs only, as rock glaciers are composed of several superimposed rock glaciers of different generations and activity levels, and thus render a complex topography. Remote sensing techniques are, thus, key to a better understanding of rock glacier kinematics and permafrost development. Satellite radar interferometry (InSAR) has been efficiently used in the past to estimate rock glacier motion rates [24,25,26]. Previous work [27,28,29,30,31,32,33] has mainly involved the creation of regional inventories of rock glaciers and other periglacial processes in combination with optical data, providing outlines and state of activity (or class of motion) of the mapped landforms. The irregular acquisitions and long acquisition time intervals of past SAR missions, however, prevented the long-term monitoring of rock glacier kinematics. With the Sentinel-1 constellation, specifically designed for SAR interferometric applications and displacement monitoring [34], SAR images of the same orbit are nowadays regularly acquired every six days over Europe and every 12 days over other mountainous areas worldwide. The mission has been operational since 2014, with an expected lifetime of 20 years, and images are distributed following a free and open data policy, enabling more detailed and long-term scientific studies.
In this work we demonstrate the performance of high-resolution Sentinel-1 data for the monitoring of rock glacier kinematics. Various rock glaciers in the Western Swiss Alps, Qeqertarsuaq in Western Greenland, and in the semiarid Andes in Chile and Argentina are investigated with InSAR. Additionally, a JERS-1 image pair of 1996 and stacks of very high-resolution SAR images from TerraSAR-X and Cosmo-SkyMed, regularly acquired every summer between 2008 and 2017 over the Western Swiss Alps, are analyzed with InSAR and offset tracking [35,36] in order to extend the Sentinel-1 based observation period of our study. A quantitative assessment using in situ (continuous and repeated global navigation satellite system (GNSS) measurements) and remote sensing (matching of aerial optical images) data is presented in order to support the interpretation of the results.

2. Study Regions

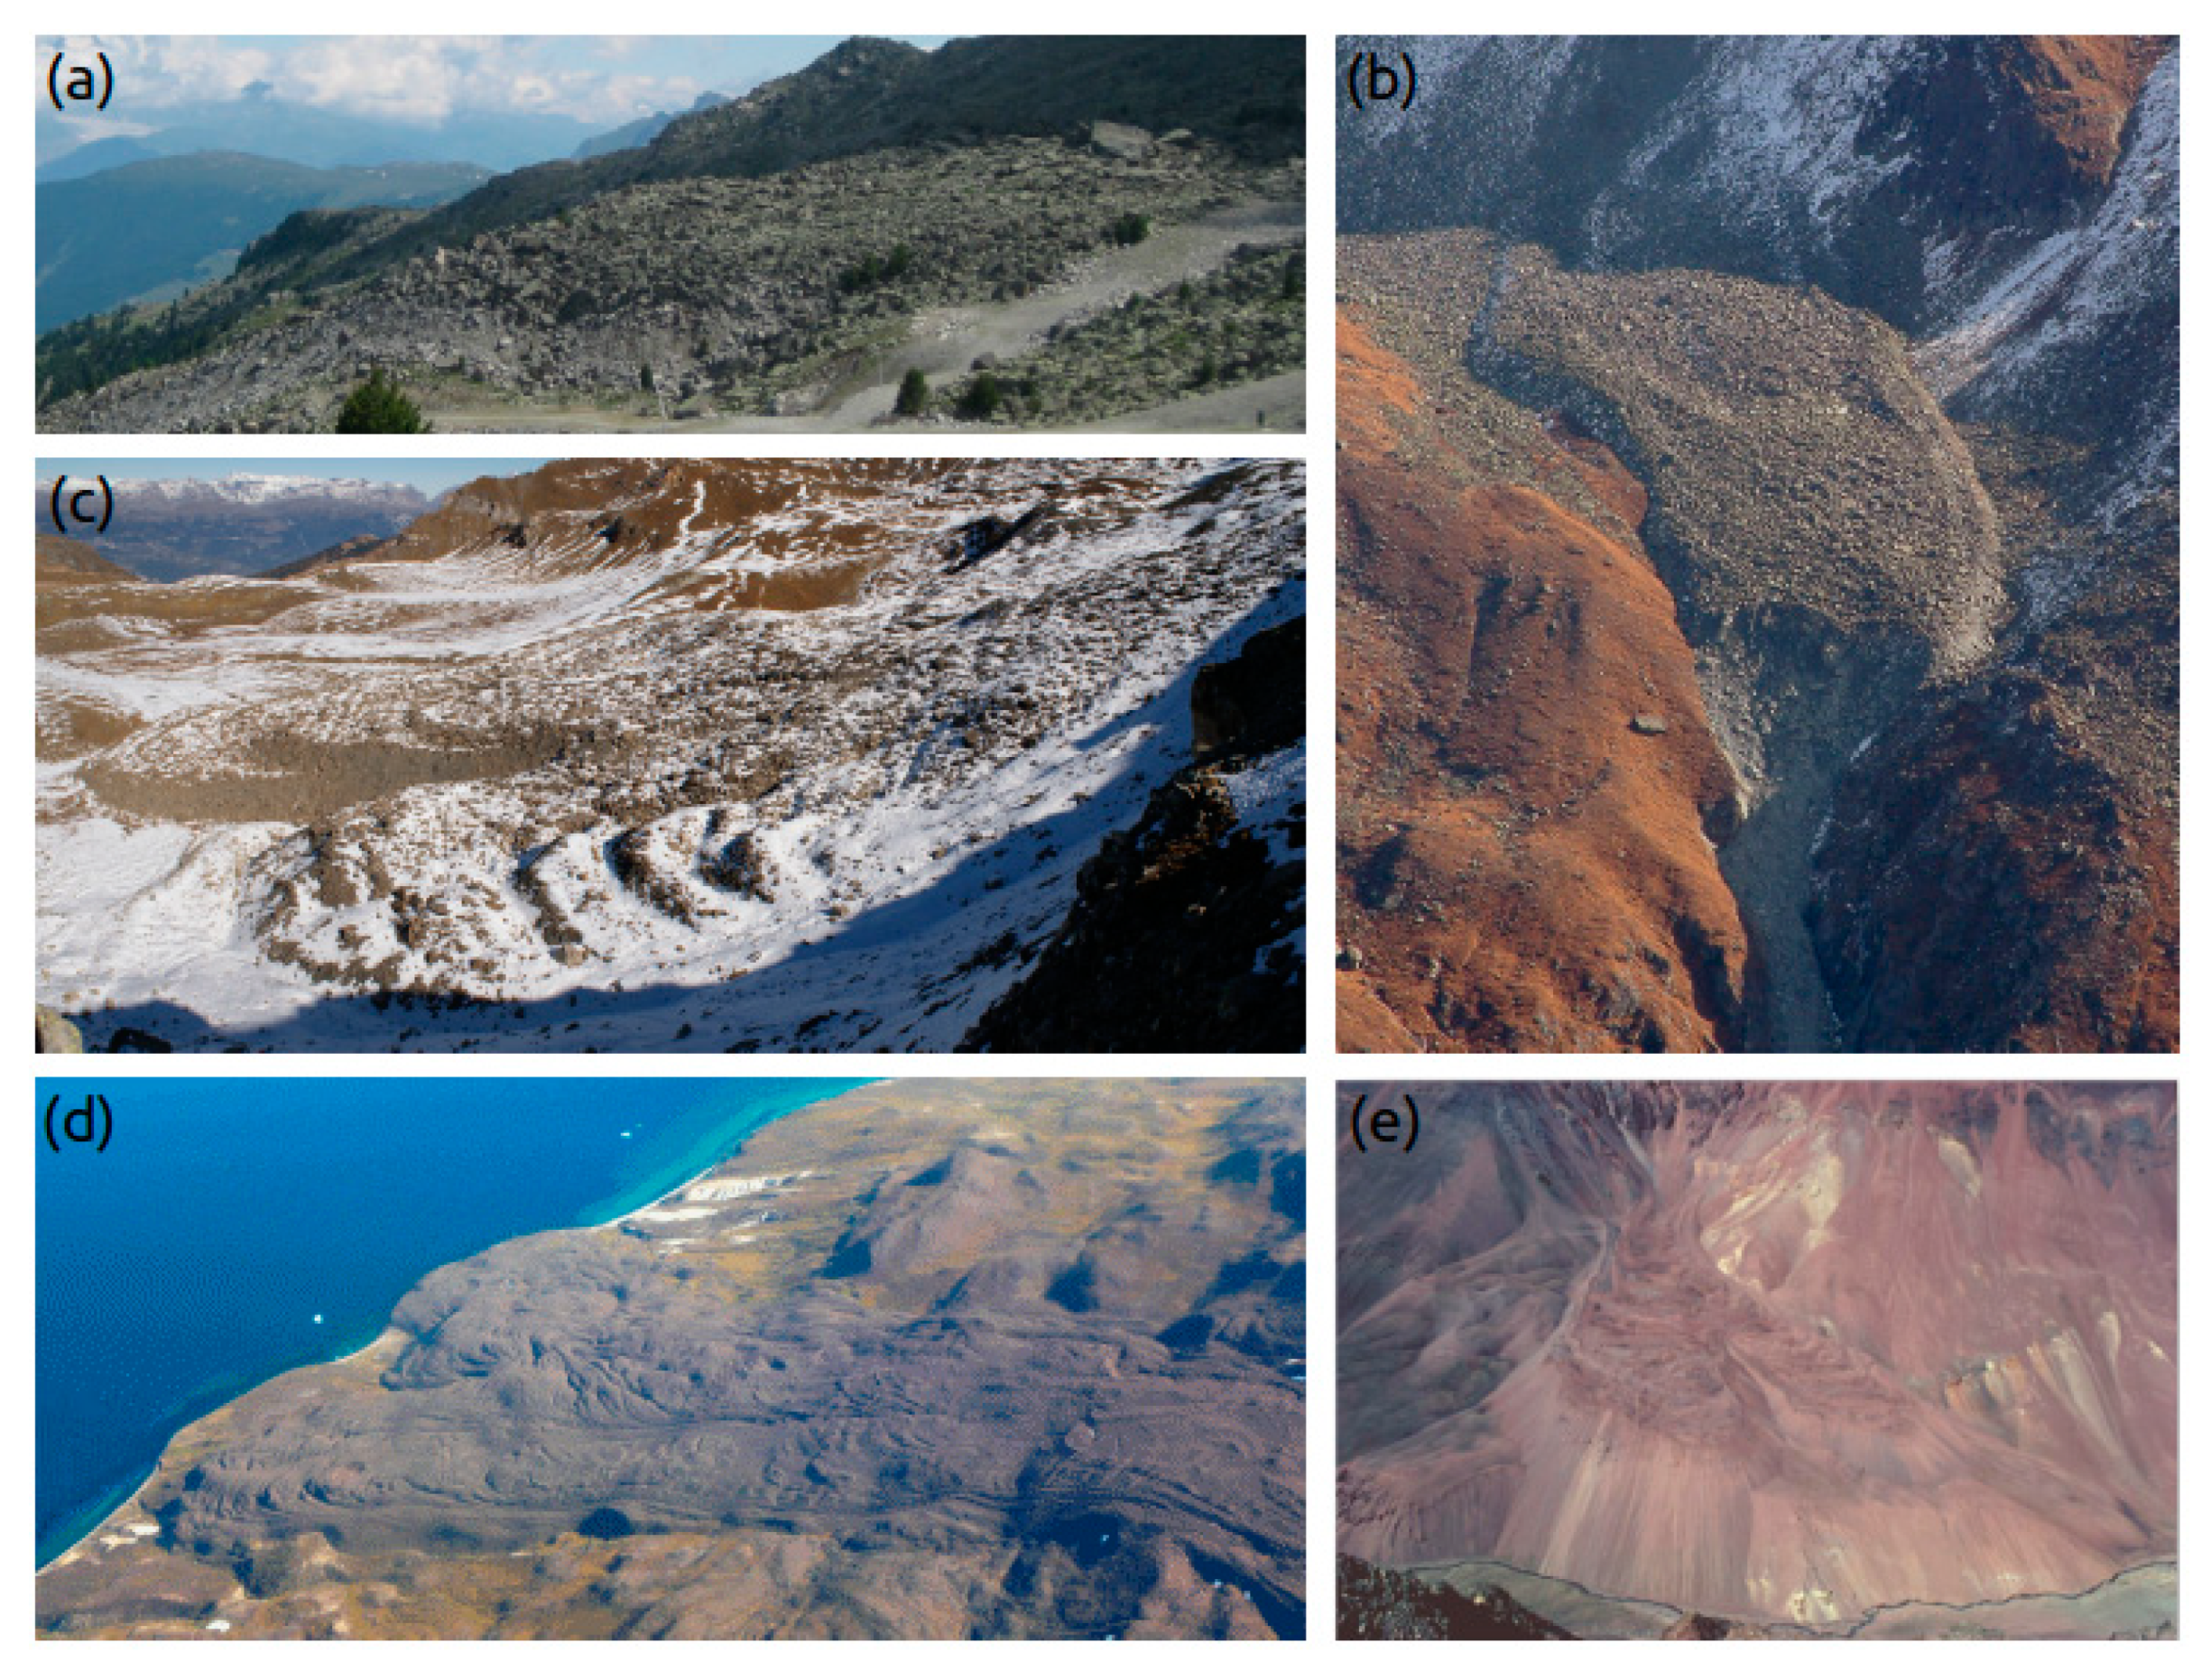
2.1. Western Swiss Alps

The Western Swiss Alps are located at approximately 7.5°E, 46°N and cover an area of around 3000 km2 encompassing deeply incised, mainly north-south oriented valleys at altitudes ranging between 500 m and more than 4000 m a.s.l. Semicontinental climate conditions prevail. The periglacial belt, defined as the sparsely vegetated portion of the mountain slope between the tree line and the bottom of the glaciated area, ranges from approximately 2300 m to 3000 m a.s.l. and is characterized by many different geomorphological processes [37]. Moving zones related to the creep of frozen debris (e.g., rock glaciers and push moraines) and shallow to deep-seated landslides affecting frozen, as well as unfrozen, debris or rocks are widespread. The lower limit of discontinuous permafrost is estimated at an altitude of about 2400 m a.s.l. in north-facing slopes and 2700 m a.s.l. at southern exposures [38,39].
The Western Swiss Alps encompass about 800 active rock glaciers with typical annual velocities on the order of 0.1 to 2 m/a. Among them, at least eleven rock glaciers have experienced, in the decades prior to 2010, strong changes in their kinematics and geometry [40]. These features, displaying exceptionally high velocities up to 10 m/a and more, and often showing distinct cracks as well as significant changes at their front, have been termed destabilized [41]. When located on steep slopes, they are the source for gravitative movements such as rock falls or debris flows [42]. Within the proposed study region, differential GNSS campaigns have been systematically repeated once to twice per year, at the beginning or at the end of the summer season, for about fifteen active rock glaciers [14,18,43]. In addition, permanent GNSS stations have been operated allowing for the continuous measurement (hourly, daily, etc.) of the movement of a single point [14,18,44]. On the basis of these observations, seasonal variations are found to occur on all monitored rock glaciers. The seasonal velocity pattern roughly resembles a sinusoidal curve and is characteristic for each rock glacier. As a common feature, velocity minima are reached every year at the end of the winter season (April to May), followed by an acceleration phase occurring during the snow melt season. Velocity maxima are reached on most rock glaciers every year in autumn or early winter (September to December), followed by a deceleration phase in the second half of the winter returning to the velocity minima at the end of the winter.
We focus our investigations on the Distelhorn rock glacier in Mattertal (Figure 1a), the Tsarmine rock glacier in Val d’Arolla (Figure 1b), and the Becs-de-Besson rock glacier in Val de Réchy (Figure 1c). The Distelhorn rock glacier is about 300 m wide and 700 m long. In 2012, the rock glacier had an average horizontal displacement of about 0.8 m/a measured with TerraSAR-X InSAR [45]. The fastest velocity was measured with a ground-based radar interferometer at the front [45], with values in the order of 3 to 4 mm per day (i.e., 1.1 to 1.5 m/a). Tsarmine is a west oriented tongue-shaped rock glacier of 100 m in width and 450 m in length and is integrated into the “Kinematics” observations of the Permafrost Monitoring in Switzerland network (PERMOS) [18]. Displacement measurements of the rock glacier started in 2004 using GNSS campaigns carried out seasonally and showed annual velocities of several meters per year. These values are considerably higher than those determined during previous decades analyzing historical aerial images [43]. Since 2012, a permanent mono-frequency GNSS station has been installed a few tens of meters upstream of the front line and gives information about interannual changes which sometimes exceed 50% of acceleration or deceleration in one year [14]. The last velocity maximum of 14 m/a was reached in the autumn of 2019, with the rock glacier having entered a destabilization phase for a few years. Bec-de-Besson is an active rock glacier with composite morphology (two active frontal lobes, push moraines, and historical glacier forefield). This rock glacier is about 300 m wide and 500 m long and has also been integrated into PERMOS. Displacement measurements started in 2004 using GNSS campaigns carried out seasonally, while two permanent mono-frequency GNSS stations have been in operation since 2012 and 2016, respectively. The deformation field of the rock glacier is complex, with maximum speeds locally exceeding two meters per year, while surface velocities over the main front are only a few centimeters per year.

2.2. Qeqertarsuaq (Greenland)

Qeqertarsuaq (Disko Island) is the largest island in Greenland, located off the Central West Coast at 53°W, 70°N and covering 8575 km2. It is mainly mountainous, with large glaciers and ice caps covering up to 20% of the total land area [46]. The landscape is characterized by cirque-carved lava plateaus, steep U-shaped valleys, and fjords. The average elevation of Qeqertarsuaq is ~500 m a.s.l., with the highest mountains found in the north and northeastern region [47]. The island’s highest peak is at 1905 m a.s.l. The mean annual air temperature at the Arctic Station on the southernmost part of Qeqertarsuaq is −3.0 °C ± 1.8 °C, with an overall increase of 0.2 °C per year between 1991 and 2011 [48]. Geologically, Qeqertarsuaq belongs to the Tertiary volcanic province of West Greenland, composed of plateau basalts [49].
Qeqertarsuaq is classified in the zone of continuous permafrost, and rock glaciers are common on the island both inland and especially along its eastern shores [10] which suggests that the high frequency of rock glaciers on Qeqertarsuaq is due to the high weathering rates of the basaltic rocks. Rock glaciers on Qeqertarsuaq strongly vary in length and thickness. Lobate rock glaciers are typically talus-derived and ice-cemented and collectively estimated as 30 to 300 m long and 10 to 30 m thick, with a general surface slope of only 5 to 25° while the frontal lobe slope inclined up to 35 to 50° [10,12]. Furrows and ridges form a relief up to 5 m on large rock glaciers and less than 2 m on smaller ones. According to [12], lobate rock glaciers are predominant on north-facing valley wall slopes and are rare on south-facing slopes. Tongue-shaped rock glaciers reach greater lengths of 500 to 6000 m with a thickness of 20 to 75 m. Frontal slopes are similarly inclined as lobate rock glaciers. A main difference is the presence of glaciers at the upper end of the majority of tongue-shaped rock glaciers, suggesting a glacial origin and ice-cored interior [12] and making them difficult to be distinguished from debris-covered glaciers. These rock glaciers generally form in steeper terrain and below cirque headwalls. Ridge and furrow topography are equally observed, however, appears to occur mainly towards the downstream end of the rock glacier. Spatulate rock glaciers are less frequent on Qeqertarsuaq. They are largely tongue-shaped rock glaciers, but with a much broader, spatulate-like front, which forms when the rock glacier flows onto a less constrained so-called “trunk” valley and spreads laterally [12,13]. This spread often results in the formation of two distinct lobes or tongues. We focus our analyses on Manissuarsuk, a large (1 × 3 km) and tongue-shaped northeastern oriented rock glacier along the eastern shores of Qeqertarsuaq (Figure 1c).

2.3. Tapado/Agua Negra Region (Chilean/Argentinian Andes)

The Tapado/Agua Negra region (2800 km2 for the footprint of the satellite images used in this work at approximately 70°W and 30°S) in the semiarid Chilean/Argentinean Andes corresponds to the upper part of the Elqui (Chile) and Jachal (Argentina) river catchments. It lies mostly above 2000 m a.s.l., with many mountain slopes and valleys above 4000 m a.s.l. From a climatological point of view, this semiarid portion of the Central Andes exhibits annual precipitations below 500 mm at 3200 m a.s.l. [50], with a strong influence of the ENSO (El Niño Southern Oscillation). Air temperature displays a regional 0 °C isotherm around 4200 m a.s.l. [51] and the warming measured is around 0.2 to 0.4 °C/decade at 3000 m a.s.l. [52]. Depending on solar incoming radiation, permafrost is present on most slopes above 4000 m a.s.l. [53]. For the Chilean side, more than half of the region is favorable to permafrost occurrence [51] with local irregularities due to the spatial variability of the ground thermal regime, the lithology, or the glacio-geomorphological characteristics of the terrain.
Because of the dry conditions, glaciers in the Tapado/Agua Negra region are scarce and the perennial cryosphere is dominated by rock glaciers and transitional landforms from debris-covered glaciers to rock glaciers, that is, ice-debris complexes [54,55]. Accordingly, the exceptionally high spatial density of rock glaciers in the central Andes has spurred controversial debates on their hydrological significance [51,53,56]. In Chile and Argentina, the rock glacier thematic is also important and much discussed on all political levels in connection to water resources and mining activities, which has led to substantial efforts from public authorities to evaluate the cryospheric resources in their respective territories [57]. For that purpose, comprehensive inventories of glaciers, rock glaciers, ice-debris complexes, and permanent snow patches have recently been released at the country scale in Argentina [58] and Chile [59]. Those inventories rely on geomorphological features indicative of the presence of ice-rich permafrost, mainly rock glaciers, mapped from morphological evidences as retrieved from aerial and satellite imagery.
Similar to what is observed in the Alps [3,41], some cases of rock glacier destabilization observed in this region suggest that the geomorphological processes related to rock glacier dynamics is changing because of warming conditions in the ground [60,61]. The assessment of the activity status of the rock glacier, which is of crucial importance for further studying their sensitivity to climate- and human-induced impacts, is, generally, only done based on expert knowledge. On the basis of visual interpretations of optical imagery, sometimes combined with in situ observations, this approach induces subjectivity-related biases and a limited reliability of the analysis. Monitoring efforts of rock glacier kinematics in the Central Andes are restricted to a few sites and has taken place since, generally, less than 10 years ago. Differential GNSS campaigns were, for example, have been performed annually since 2009 for the Tapado and Las Liebres rock glaciers in Chile [62]. In the same area, dynamics of rock glaciers have also been reconstructed based on remote sensing [63]. In addition, recently, repeated UAV surveys have been performed for Dos Lenguas (Argentina, Figure 1e, [64]) and El Paso rock glaciers. In this context, satellite InSAR has a high potential for studying rock glacier kinematics over large areas of the semiarid Chilean/Argentinean Andes in order to improve our understanding of regional dynamics of rock glaciers, as well as to investigate local cases [33,65].

3. Data and Methods

3.1. SAR Interferometry

InSAR is a popular and widely used application in mountain areas [37,66,67,68], as it allows systematic and continuous monitoring of the movement in the satellite line-of-sight (LOS) of entire landforms at a scale ranging from individual slope faces to whole mountain ranges. The InSAR analyses over representative rock glaciers in the Western Swiss Alps, Qeqertarsuaq, and the semiarid Andes in Chile and Argentina were mainly performed with C-band (wavelength 5.6 cm) Sentinel-1 data of the time period 2015 to 2019 [69]. Additionally, a L-band (wavelength 3.1 cm) JERS-1 SAR image pair of 1996 [70] and stacks of very high-resolution summer X-band (wavelength 23.5 cm) SAR images from TerraSAR-X from 2008 to 2012 over the Western Swiss Alps [71] were considered in order to extend the observation period of our study. Sensors, acquisition modes, acquisition periods, time intervals, and pixel resolution of the satellite SAR image pairs used in our study over the different study regions are summarized in Table 1.
Processing of SAR satellite data, for the projects discussed here, involves several steps and is carried out with the GAMMA software [72]. In general, these include initial preprocessing of a reference image acquired in summer to ensure maximum coherence and georeferencing with the respective Digital Elevation Model (DEM). For Switzerland, a very high-resolution DEM (SwissALTI3D © Swisstopo) with a spatial resolution of 2 m and an accuracy of all three dimensions reaching 1 to 3 m in alpine terrain is used, while TanDEM-X at 12 m [73] is chosen for Qeqertarsuaq and the Tapado/Agua Negra region. Subsequently, slave images are coregistered to the reference image with a geometrical approach which includes the scene topography, followed for Sentinel-1 by a refinement of the transformation determined by a spectral diversity method [74]. Should strong phase jumps or insufficient coherence prevail with Sentinel-1 data, images are re-coregistered to acquisitions directly before or after the image of interest. Differential interferograms (DInSAR), including removal of the topographic phase using the DEM, are, then, created in series for variable time periods of 6 to 24 days for Sentinel-1, 88 days for JERS-1, and 11 to 22 days for TerraSAR-X. Multi-looked interferogram generation was done to 4 range and 1 azimuth look for Sentinel-1 [74], 2 range and 6 azimuth look for JERS-1 [75] and 3 range and 3 azimuth look for TerraSAX-1 [37]. Phase unwrapping to render absolute LOS movement values is achieved using a minimum cost flow (MCF) algorithm [72] and choosing a reference point close to the active rock glacier of interest. Adaptive filtering of the interferograms to reduce phase noise was not performed before movement computation to not smooth the displacement pattern and remove the signal of the largest moving parts of the rock glaciers. Atmospheric phase trend corrections with respect to height were, first, applied over the entire area covered by the image and, then, refined to particular smaller areas around the rock glaciers. Velocity and coherence data were, then, extracted for the rock glaciers of interest contained in a specified frame, which was displayed in external programs for coherence levels >0.5. Conversion from LOS to displacement along the maximum slope direction was accomplished by use the DEM filtered over a distance of 200 m in order to smooth out local steps. A vector representing the assumed direction of motion based on the slope and aspect of the filtered DEM and LOS vectors for each sensor were calculated and the per pixel LOS correction factor was calculated by scalar product of the two vectors.

3.2. SAR Offset Tracking

The calculation of displacement fields with SAR data is also possible using offset tracking methods, largely adopted over glaciers in order to overcome InSAR signal decorrelation when using long time intervals or analyzing rapidly moving objects (e.g., [35,76,77,78]). We used stacks of TerraSAR-X [71] and Cosmo-SkyMed [79] images regularly acquired every summer between 2008 and 2017 over the Western Swiss Alps (Table 1) to retrieve time series of surface velocity maps over the Distelhorn and Tsarmine rock glaciers, respectively, using the offset tracking method of the GAMMA software [35,78]. Using a normalized cross-correlation of chips in amplitude SAR images, offsets are measured using rectangular windows at a set of positions uniformly distributed over the image scene. The size of the correlation matching window sizes was adjusted according to the image resolution to 64 × 64 pixels in range and azimuth for both TerraSAR-X and Cosmo-SkyMed images. In order to obtain an accurate subpixel precision estimate of the correlation peak, the correlation function values were fitted using a biquadratic polynomial surface. The time interval of the image pairs was adjusted according to the expected maximum displacement over the rock glacier to two years for the TerraSAR-X data over the Distelhorn rock glacier and to one year for the Cosmo-SkyMed data over the Tsarmine rock glacier. In both cases, late summer image pairs with short perpendicular baselines were considered. Mismatches or blunders were filtered by applying a threshold to the correlation coefficient (0.1 for both TerraSAR-X and Cosmo-SkyMed data), by iteratively discarding spurious matches based on the angle and size of displacement vectors in the surrounding area, and by using a low-pass filter on the resulting fields [77]. For validation with aerial photo matching and GNSS stations, slant range and azimuth offset fields were first combined to retrieve horizontal surface velocity maps. For comparison to the InSAR displacements computed along the maximum slope direction, slant range and azimuth offset fields were then also computed along the terrain surface determined from the DEM [35]. The final maps were geocoded using the DEM to a 25 m resolution raster.

4. Results

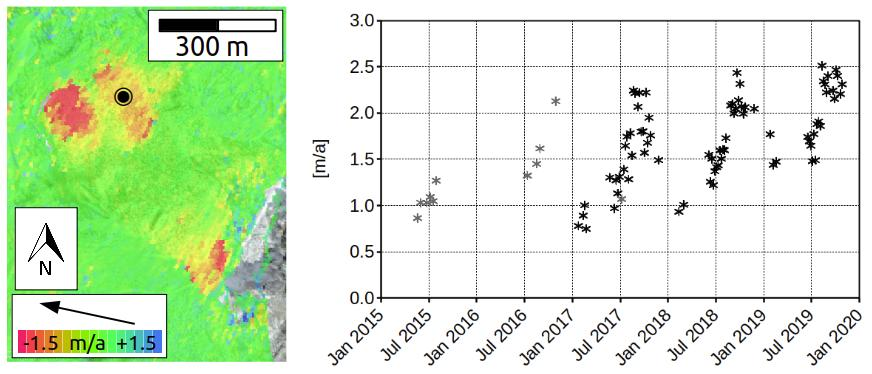
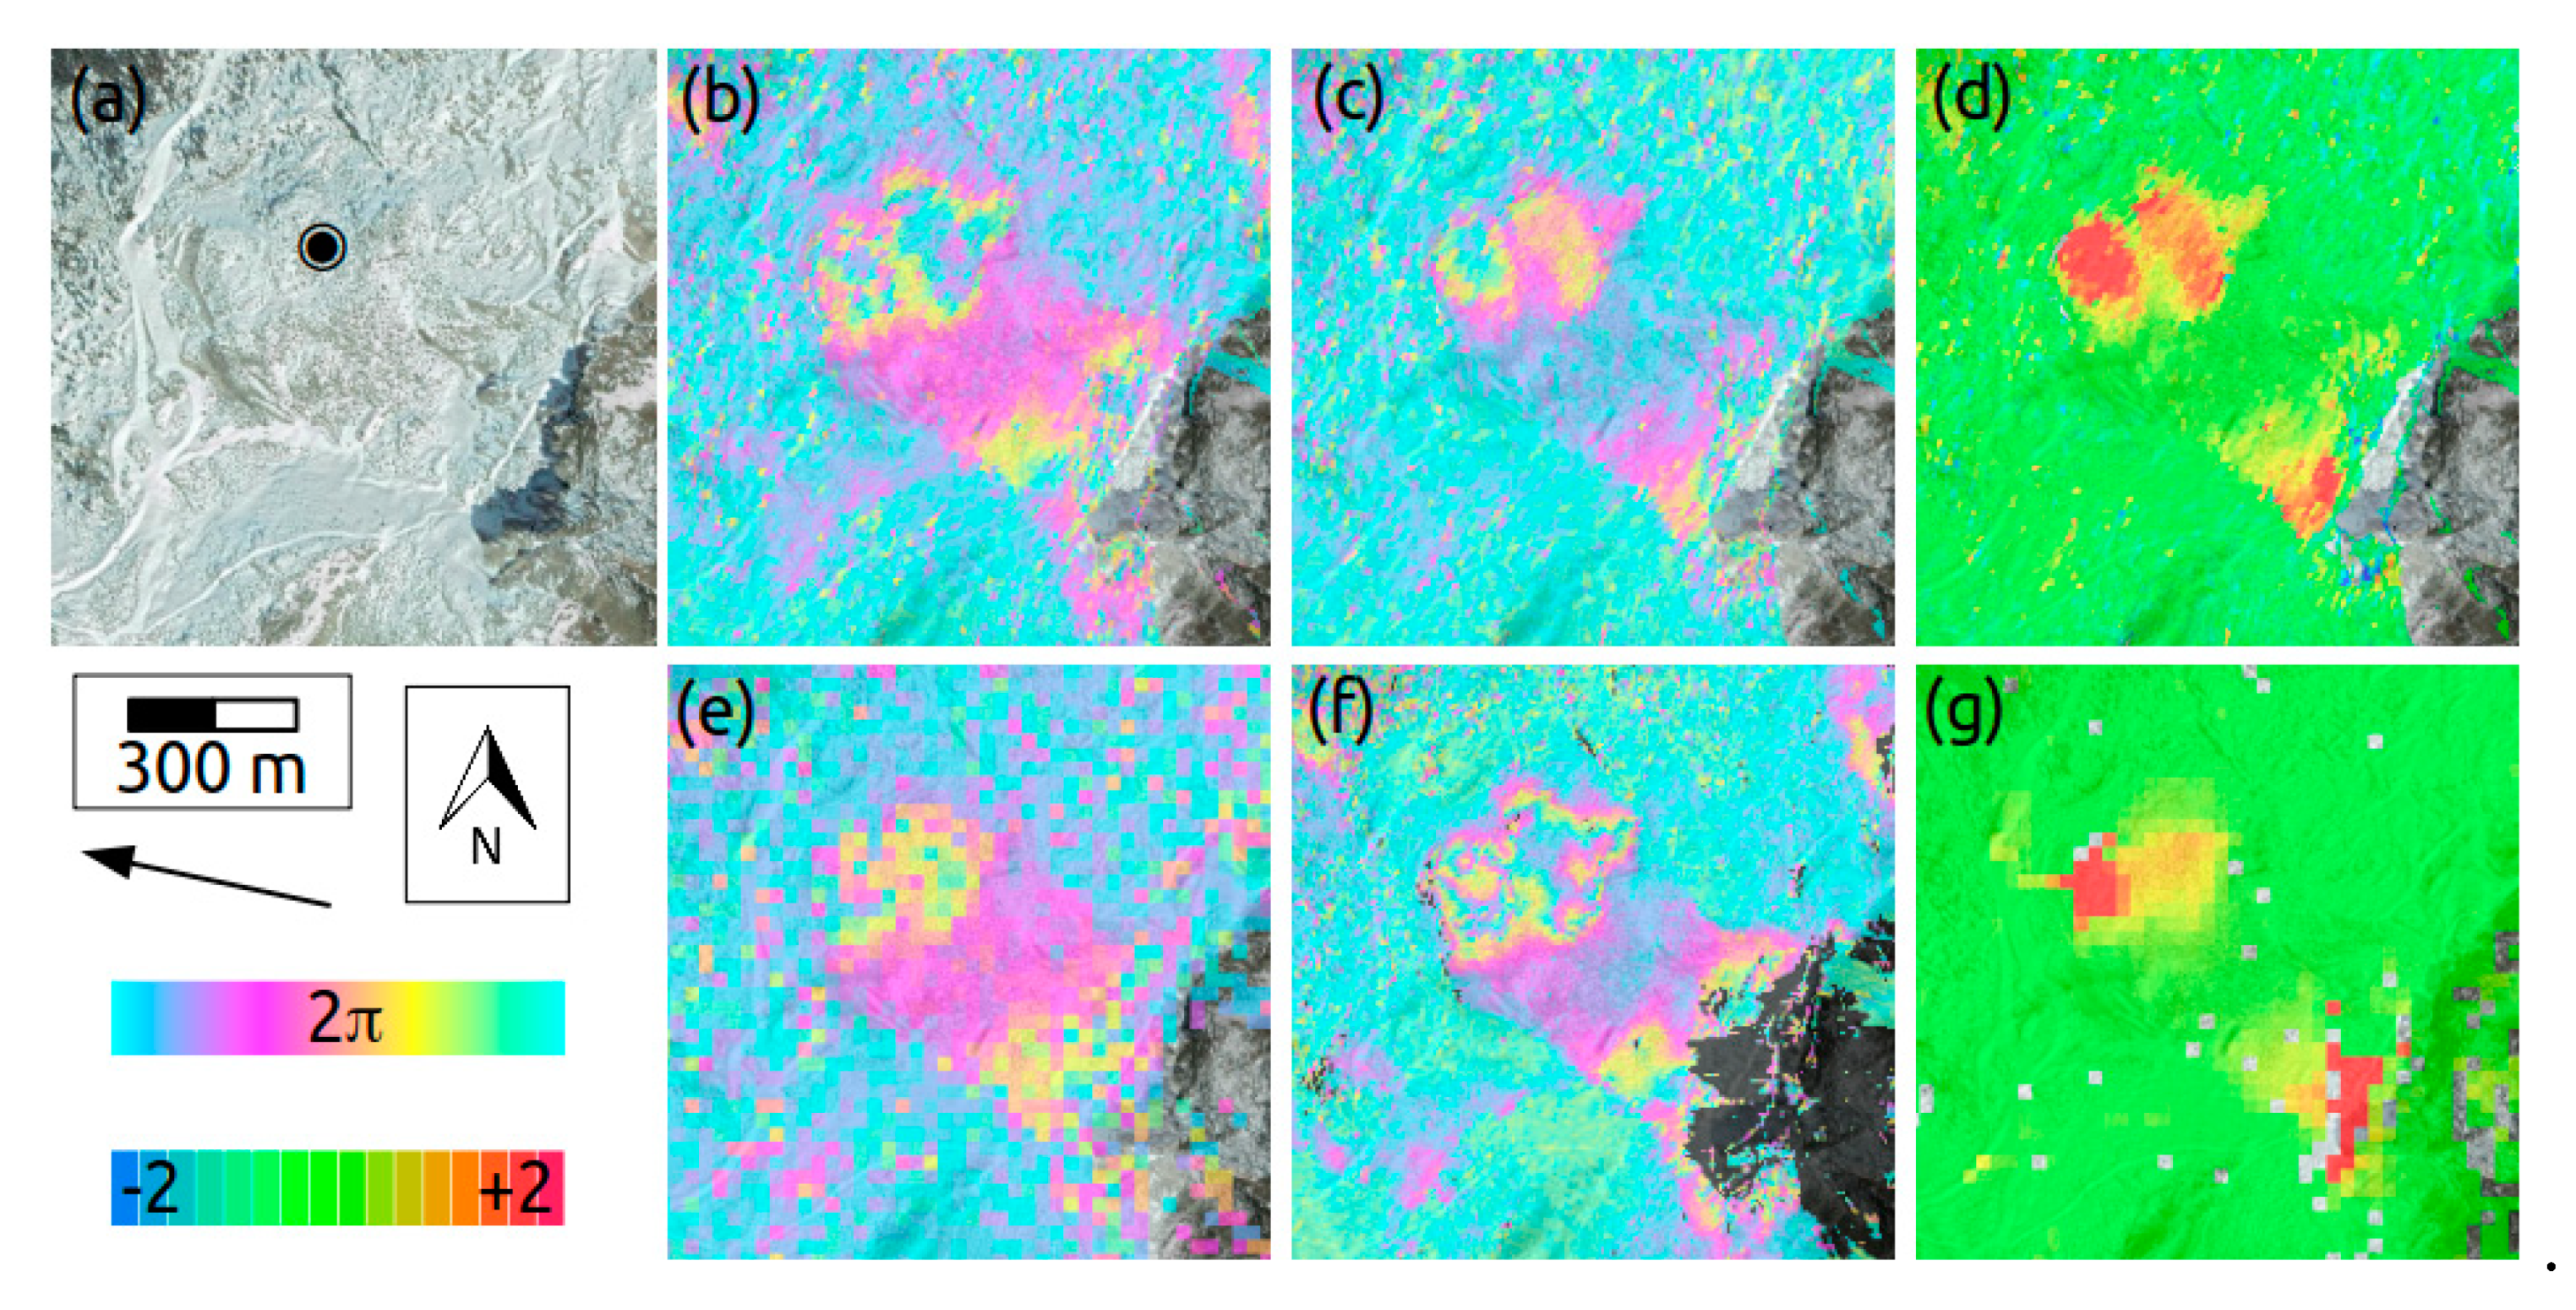
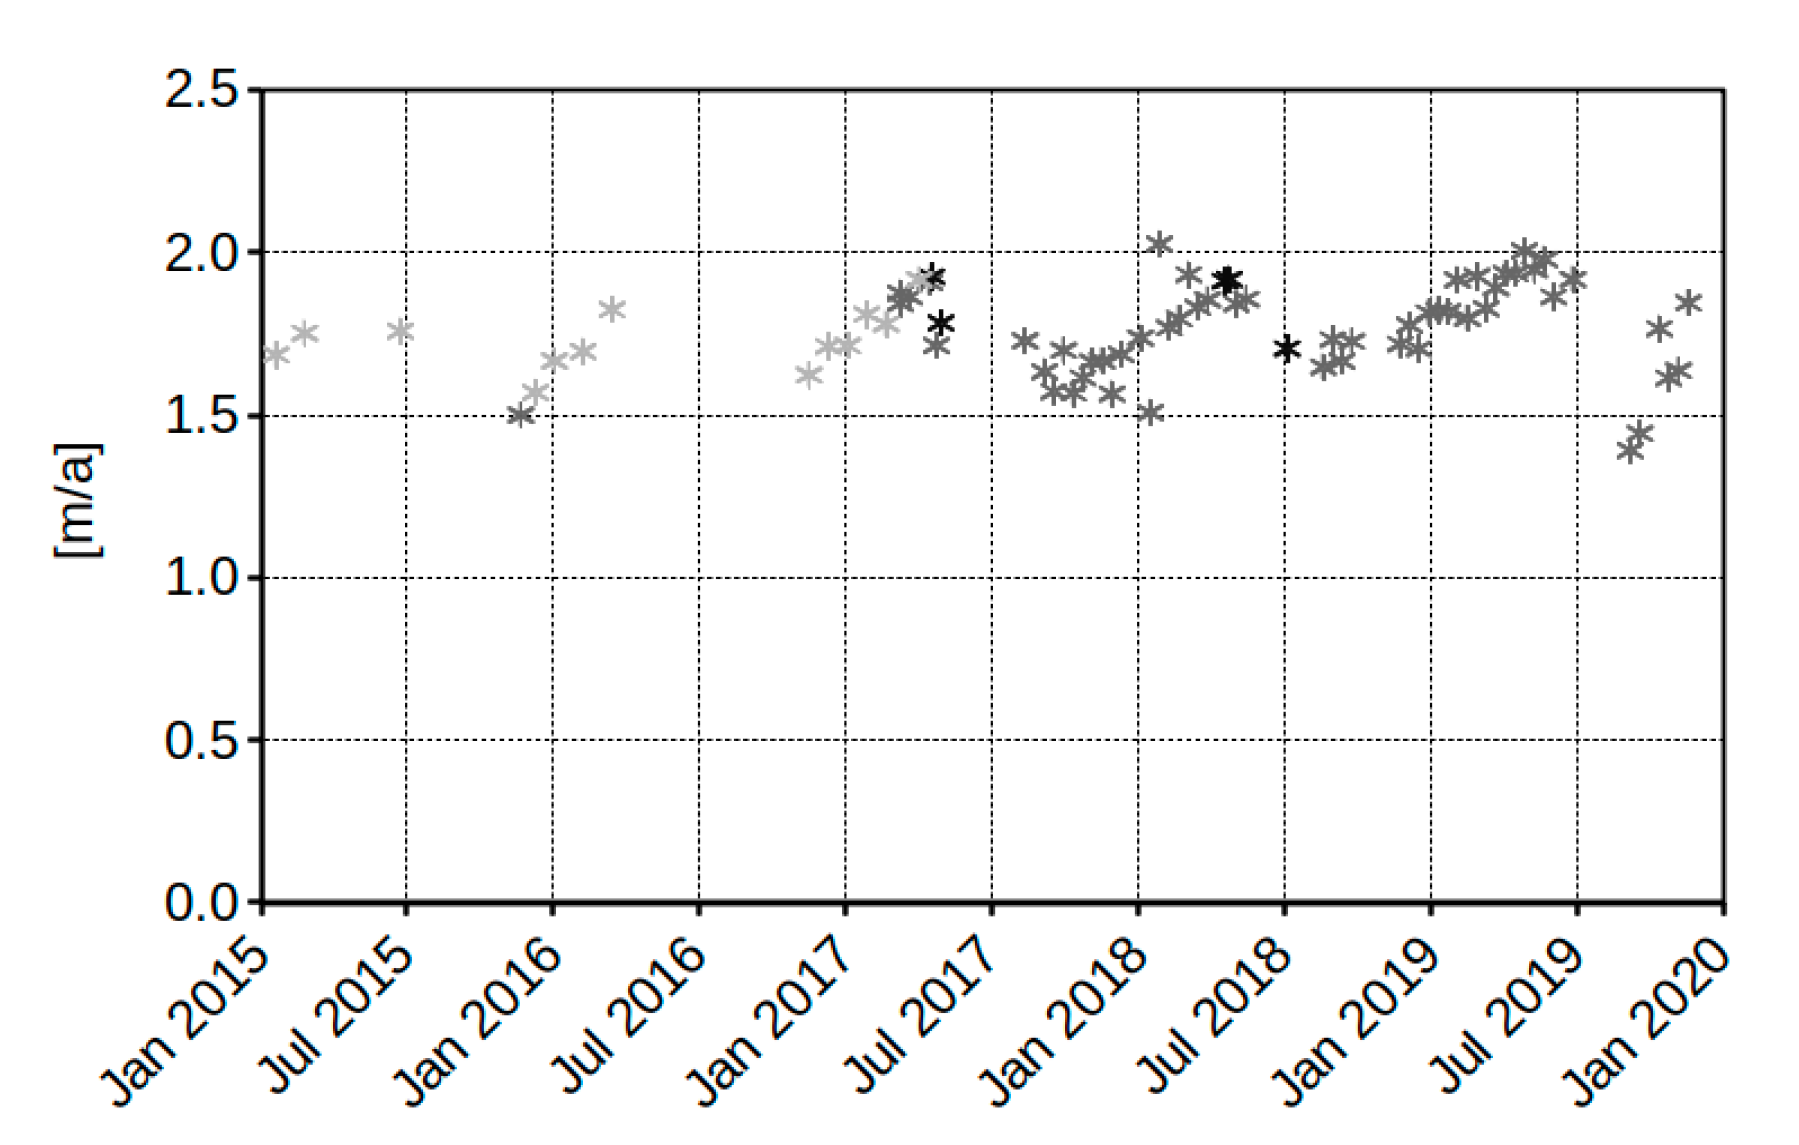
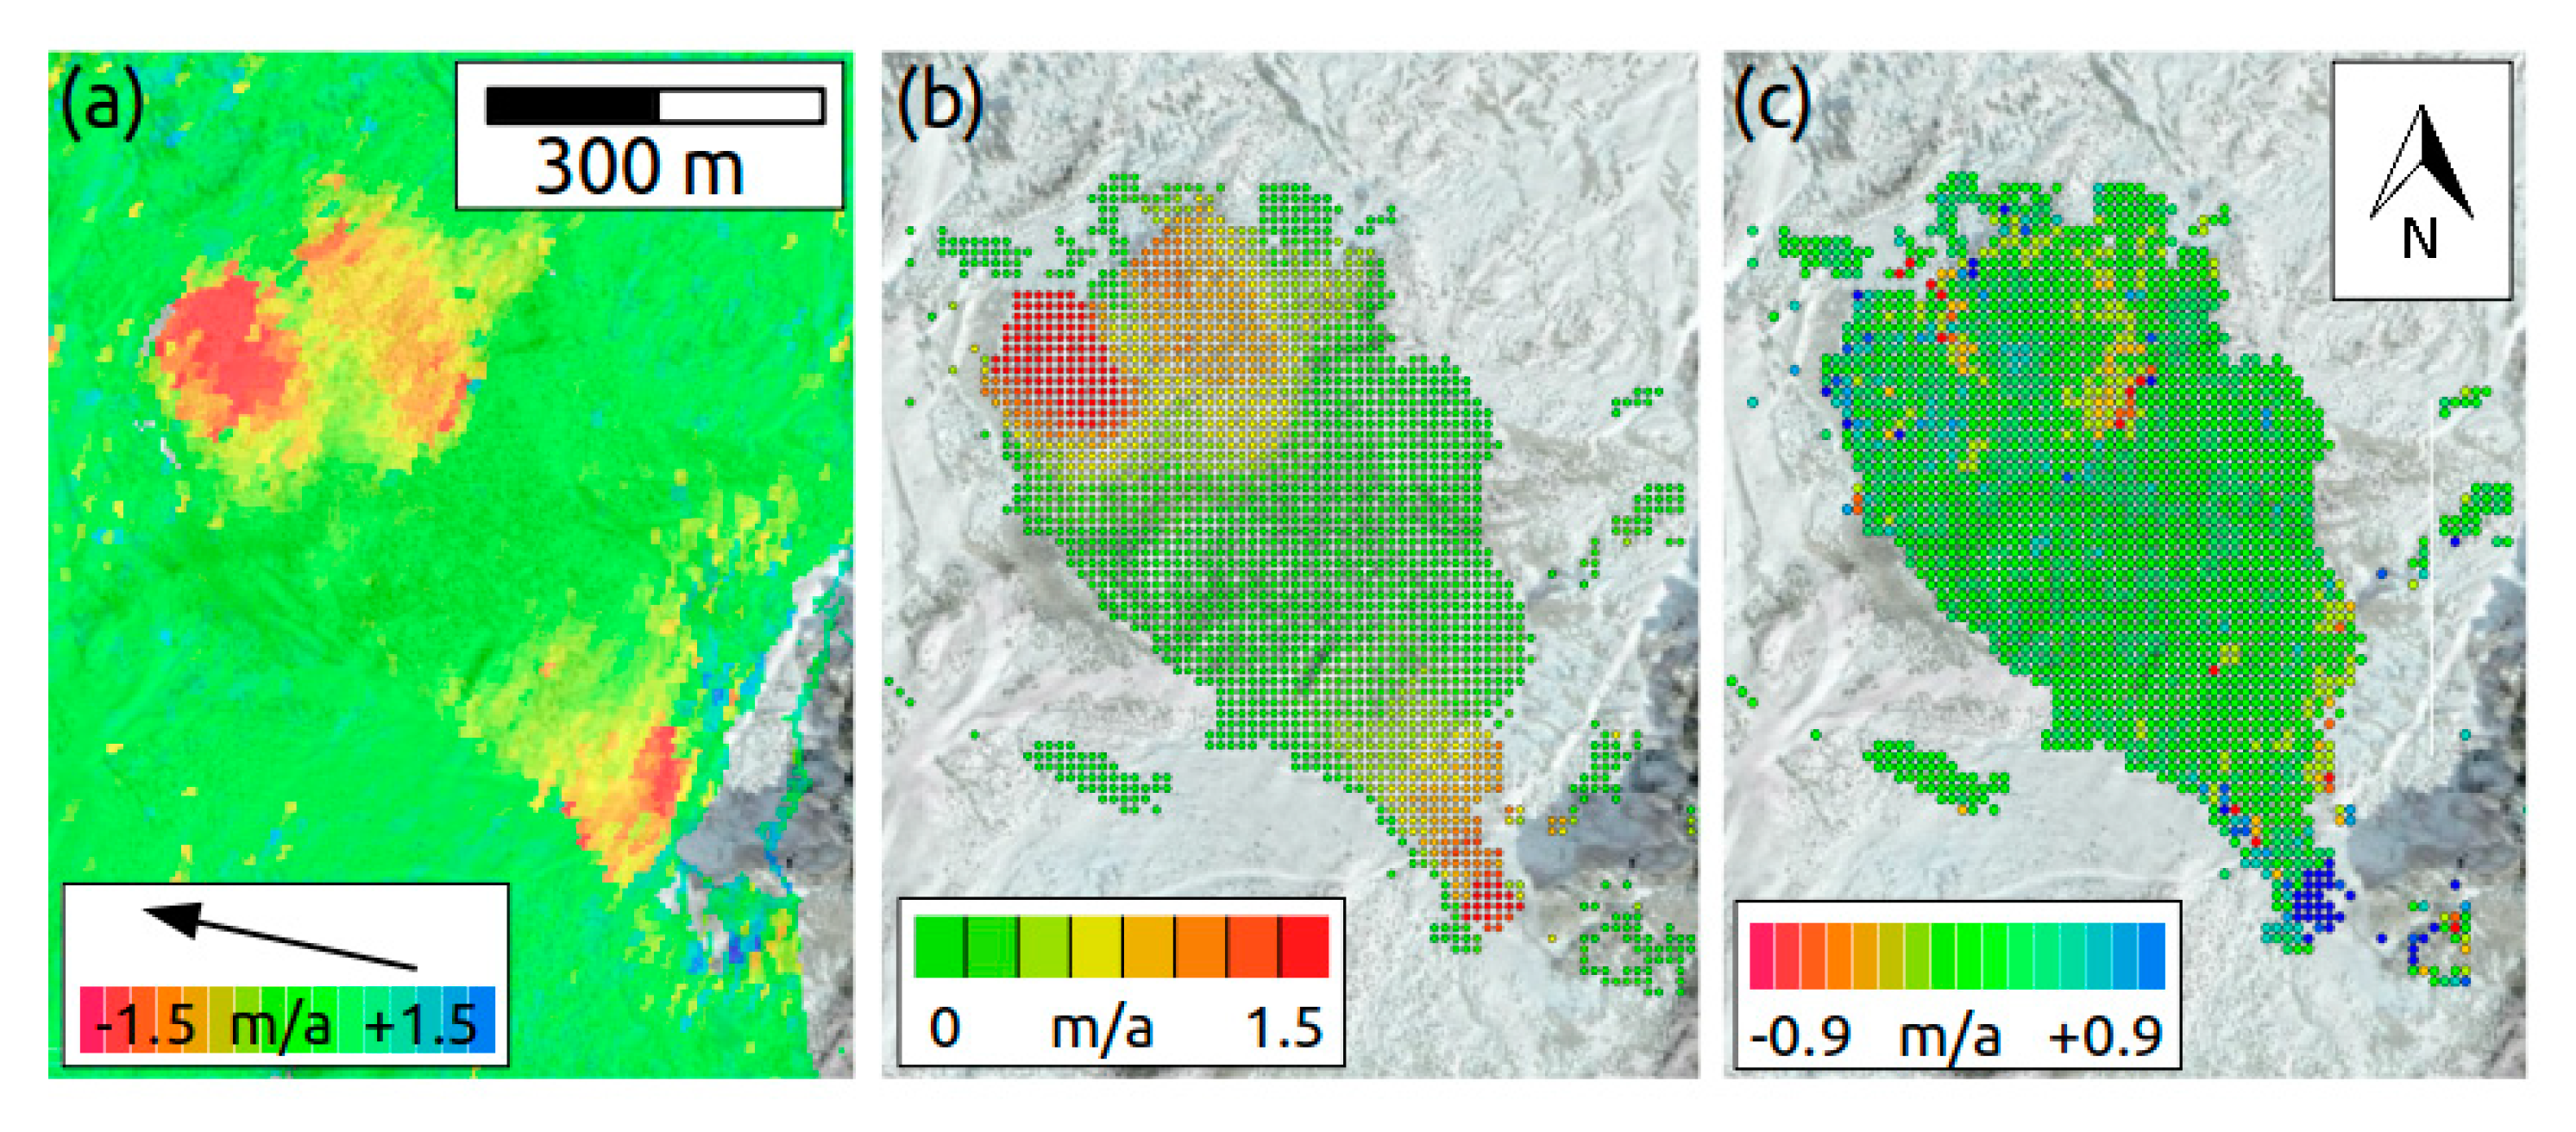
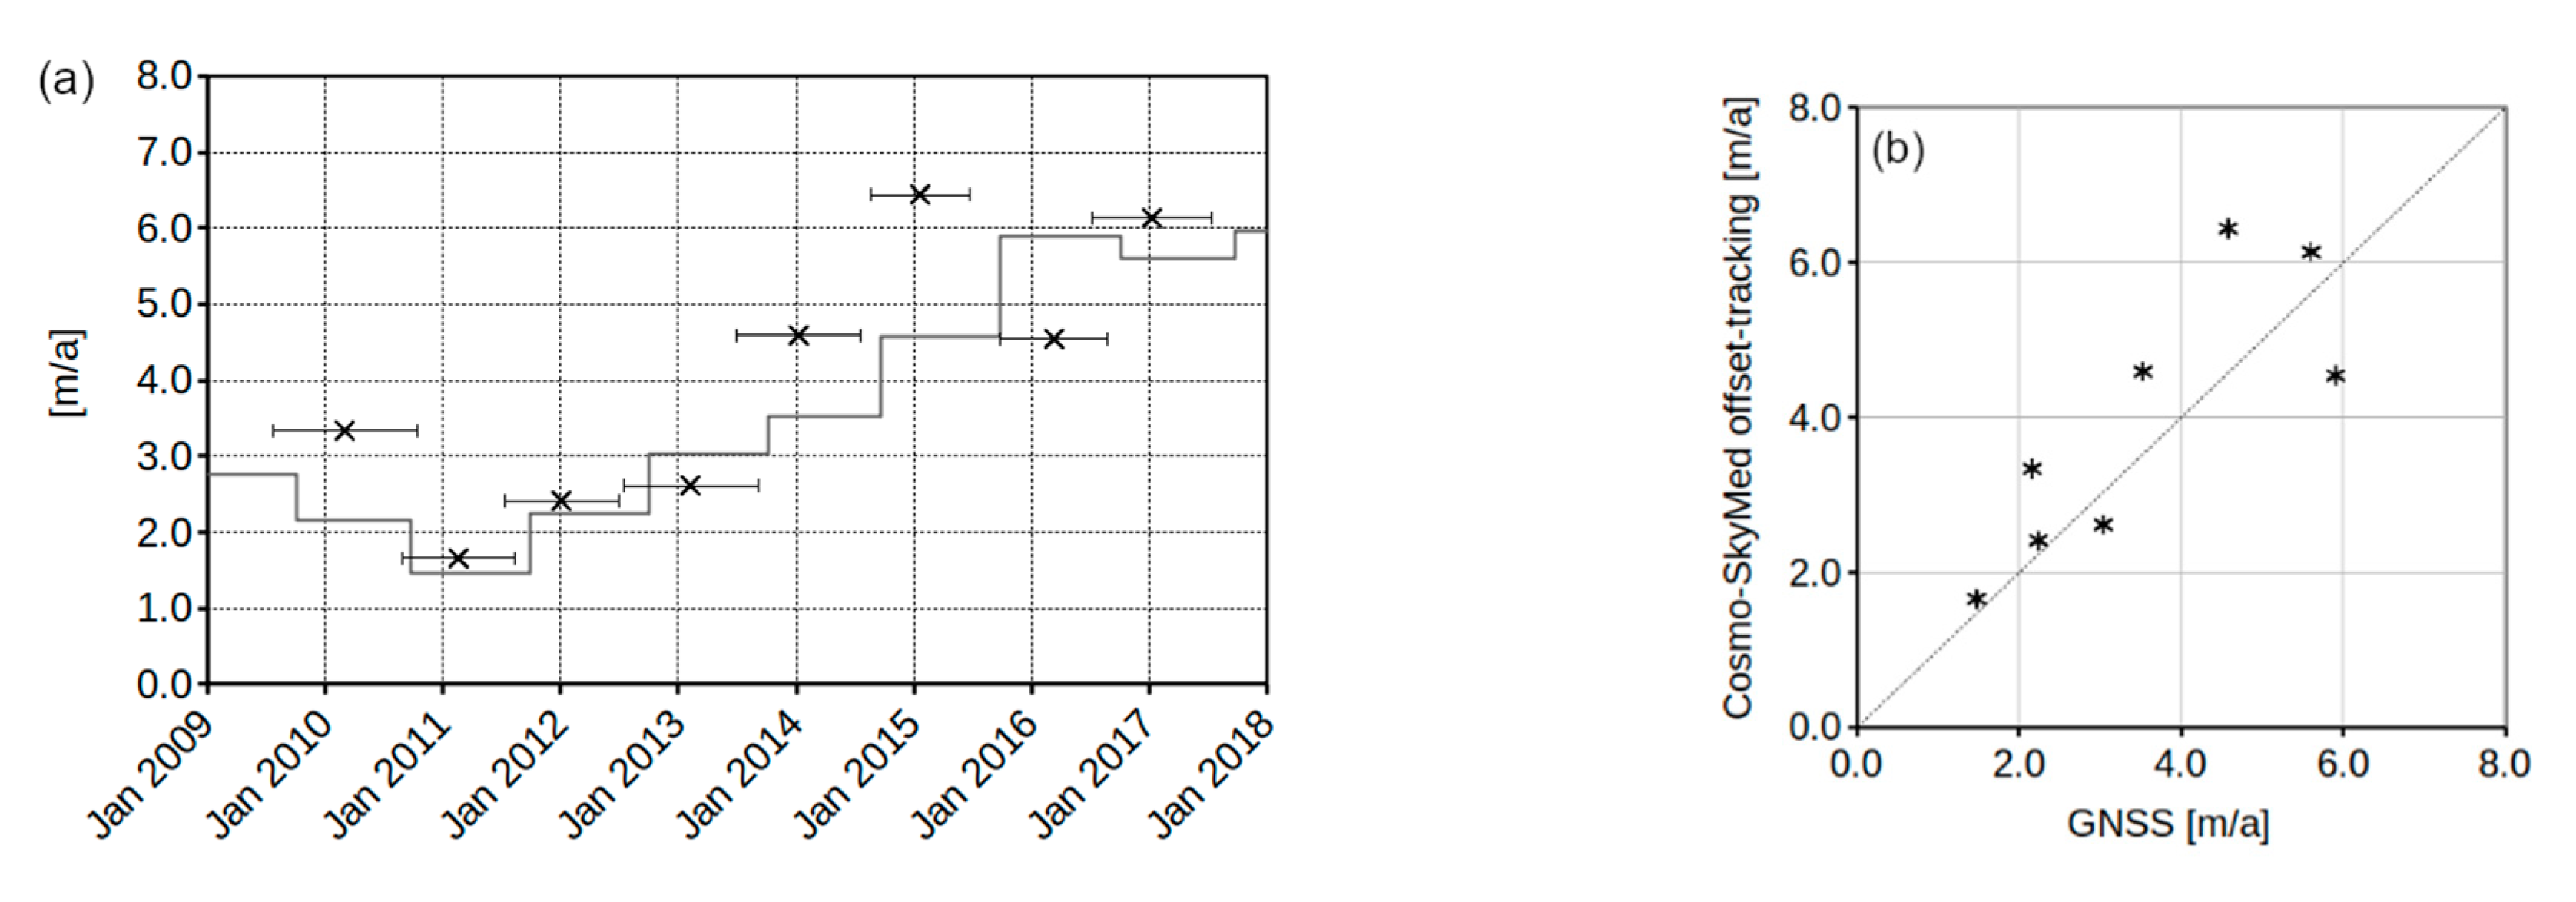
4.1. Distelhorn Rock Glacier (Western Swiss Alps)

The Distelhorn rock glacier (Figure 1a and Figure 2a) is northwest oriented, making it particularly well suited for InSAR investigations using images acquired along descending orbits. Sentinel-1, JERS-1, and TerraSAR-X differential interferograms over 12/6, 88, and 11 days, presented in Figure 2b,c,e,f, respectively, all indicate a clear displacement pattern over large parts of the rock glacier. However, more decorrelation is observed over both the front and at the rooting zone, in particular for the X-band data over 11 days and the C-band data over 12 days. The most complete pattern can be seen in the six days Sentinel-1 interferogram, which allowed us to successfully unwrap the phase to derive the LOS displacement map of Figure 2d. The front of the rock glacier was moving in the summer of 2018 with LOS displacement rates of about 1 to 2 m/a. This is well in agreement, although at a lower spatial resolution, with the results obtained using offset tracking of TerraSAR-X data with a time interval of about two years (Figure 2g).
In Figure 3a we plotted the velocities along the maximum slope direction from JERS-1, TerraSAR-X, and Sentinel-1 InSAR and the velocity along the terrain surface from TerraSAR-X offset tracking over the eastern frontal lobe of the Distelhorn rock glacier, which is moving slower than the western frontal lobe and thus is better suited for InSAR analyses to avoid phase unwrapping mistakes. From 1996 to 2016, only velocities over summer periods (InSAR) or for about two years (offset tracking) are available. They indicate rates of motion between 0.5 and 1 m/a without strong variability over time. Since 2016, much more measurements are available from Sentinel-1, revealing a larger variability and increased velocities up to more than 2 m/a. The enlargement of the Sentinel-1 InSAR results of Figure 3b indicates seasonal variations of the rock glacier velocity, with values higher in autumn and lower in spring, in agreement with the annual cycle observed in situ over other rock glaciers in Switzerland (e.g, [14,18]). In Figure 3b we notice that Sentinel-1 interferograms, over a 6 day time interval, permit to occasionally derive valid information also during the wintertime, possibly for periods with (cold?) stable snow conditions, in particular without snow melt or snowfall.

4.2. Tsarmine Rock Glacier (Western Swiss Alps)

The Tsarmine rock glacier (Figure 1b and Figure 4a) is smaller and faster than the Distelhorn rock glacier and the SAR interferograms are, thus, more decorrelated. Very high-resolution X-band data over nine days in mid-summer 2017 (Figure 4c) have a clear fringe pattern only in the central/upper part of the rock glacier, while at the front the fringe pattern is rather confuse. High-resolution C-band data over six days in September 2017 show again reasonable coherence in the central part of the rock glacier, while over the rest of the rock glacier coherence is low. Offset tracking of Cosmo-SkyMed data over one year permits to compute maps of the rock glacier velocity with a fairly good spatial coverage, in particular in the early years of investigations (e.g., between 2010 and 2011, see Figure 4b), when the overall rock glacier velocity was slower. The maximum displacement observed between the end of the summer of 2010 and the end of the summer of 2011 was in the order of 2 m. The time series of velocity along the terrain surface computed from Cosmo-SkyMed offset tracking over an area about 100 m upstream of the rock glacier front (Figure 5a) shows an increase of the rates of motion from around 2 to 3 m/a between 2009 and 2012 to more than 4 m/a since 2013. Velocity along the maximum slope direction from Sentinel-1 InSAR could be successfully retrieved from Sentinel-1 InSAR only over the central part of the rock glacier, where the rates of motion are slower than over the rock glacier front. The time series of Figure 5b indicates an increase of the rate of motion from about 3 m/a in early summer to more than 4 m/a in autumn. In general, Sentinel-1 InSAR results cannot be obtained over the Tsarmine rock glacier in winter (snow cover) and over 12 days (too fast), therefore, in the time series of Figure 5b only a part of the annual cycle of motion is contained for recent years. The few measurements available for 12 days in Figure 5b with coherence levels >0.5 are possibly affected by phase unwrapping errors. Indeed, one phase cycle at C-band (2.83 cm) corresponds to a LOS motion of 0.99 m/a if projected along the maximum slope.

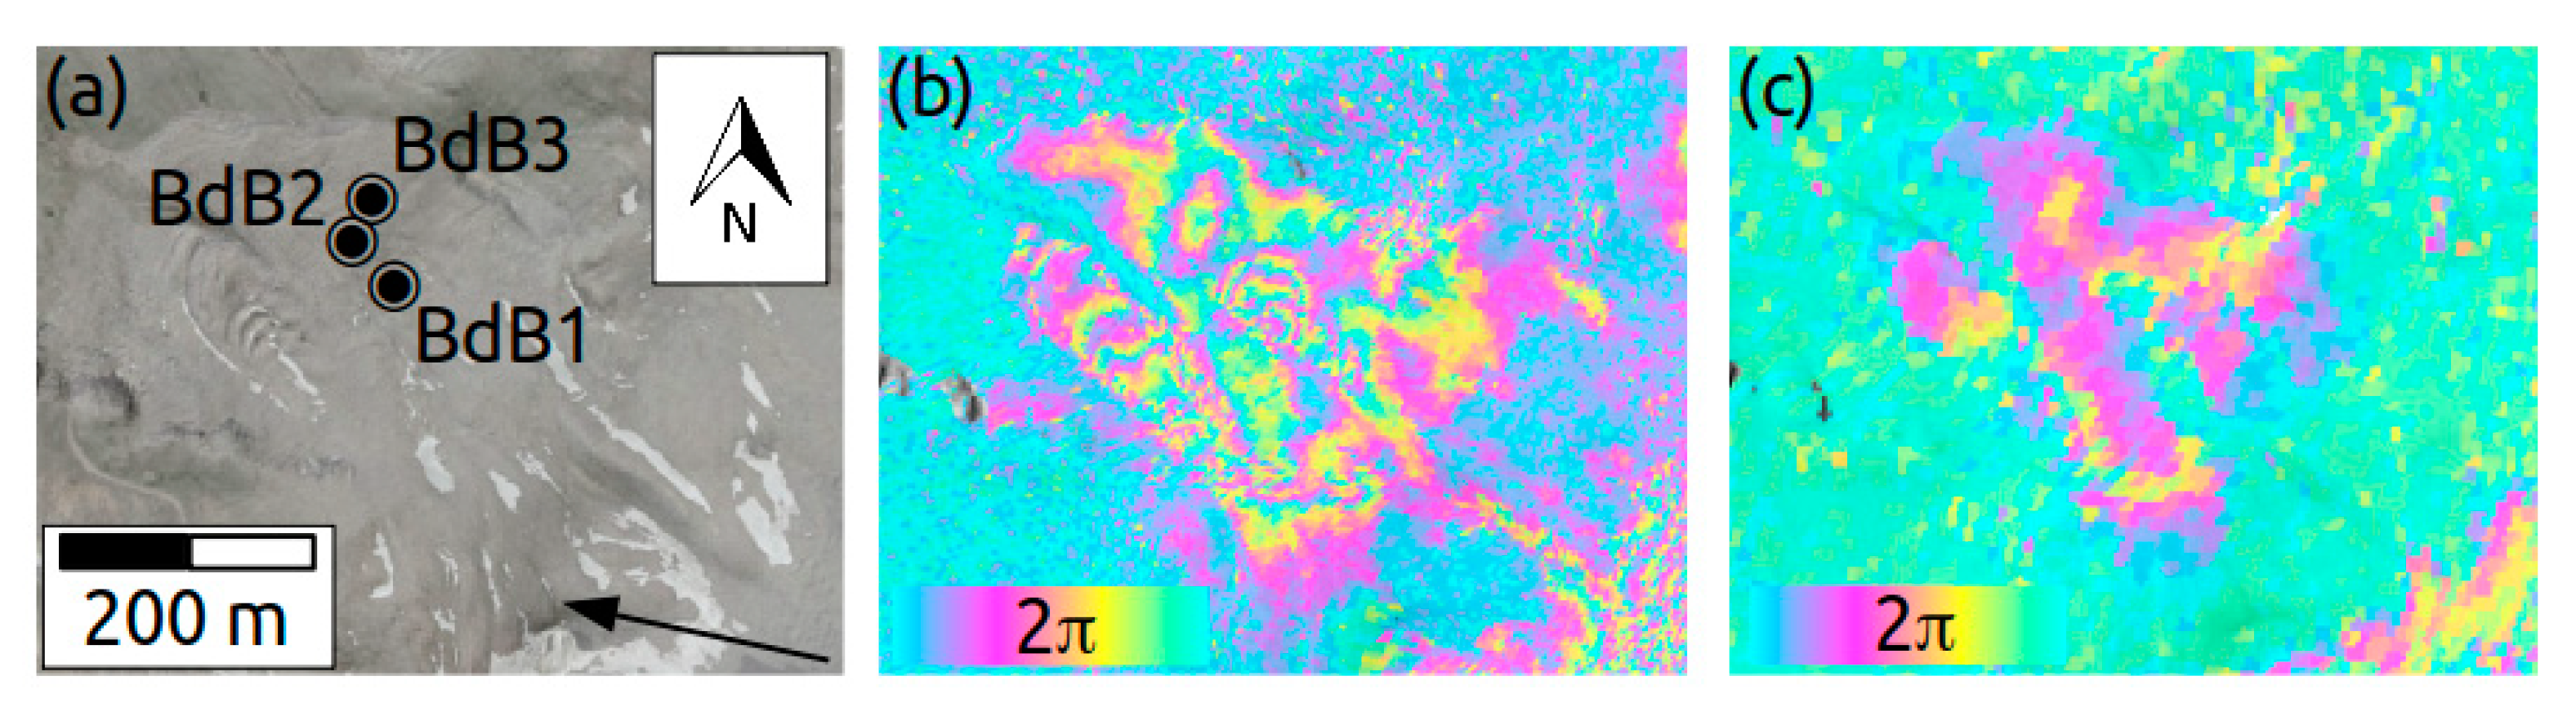
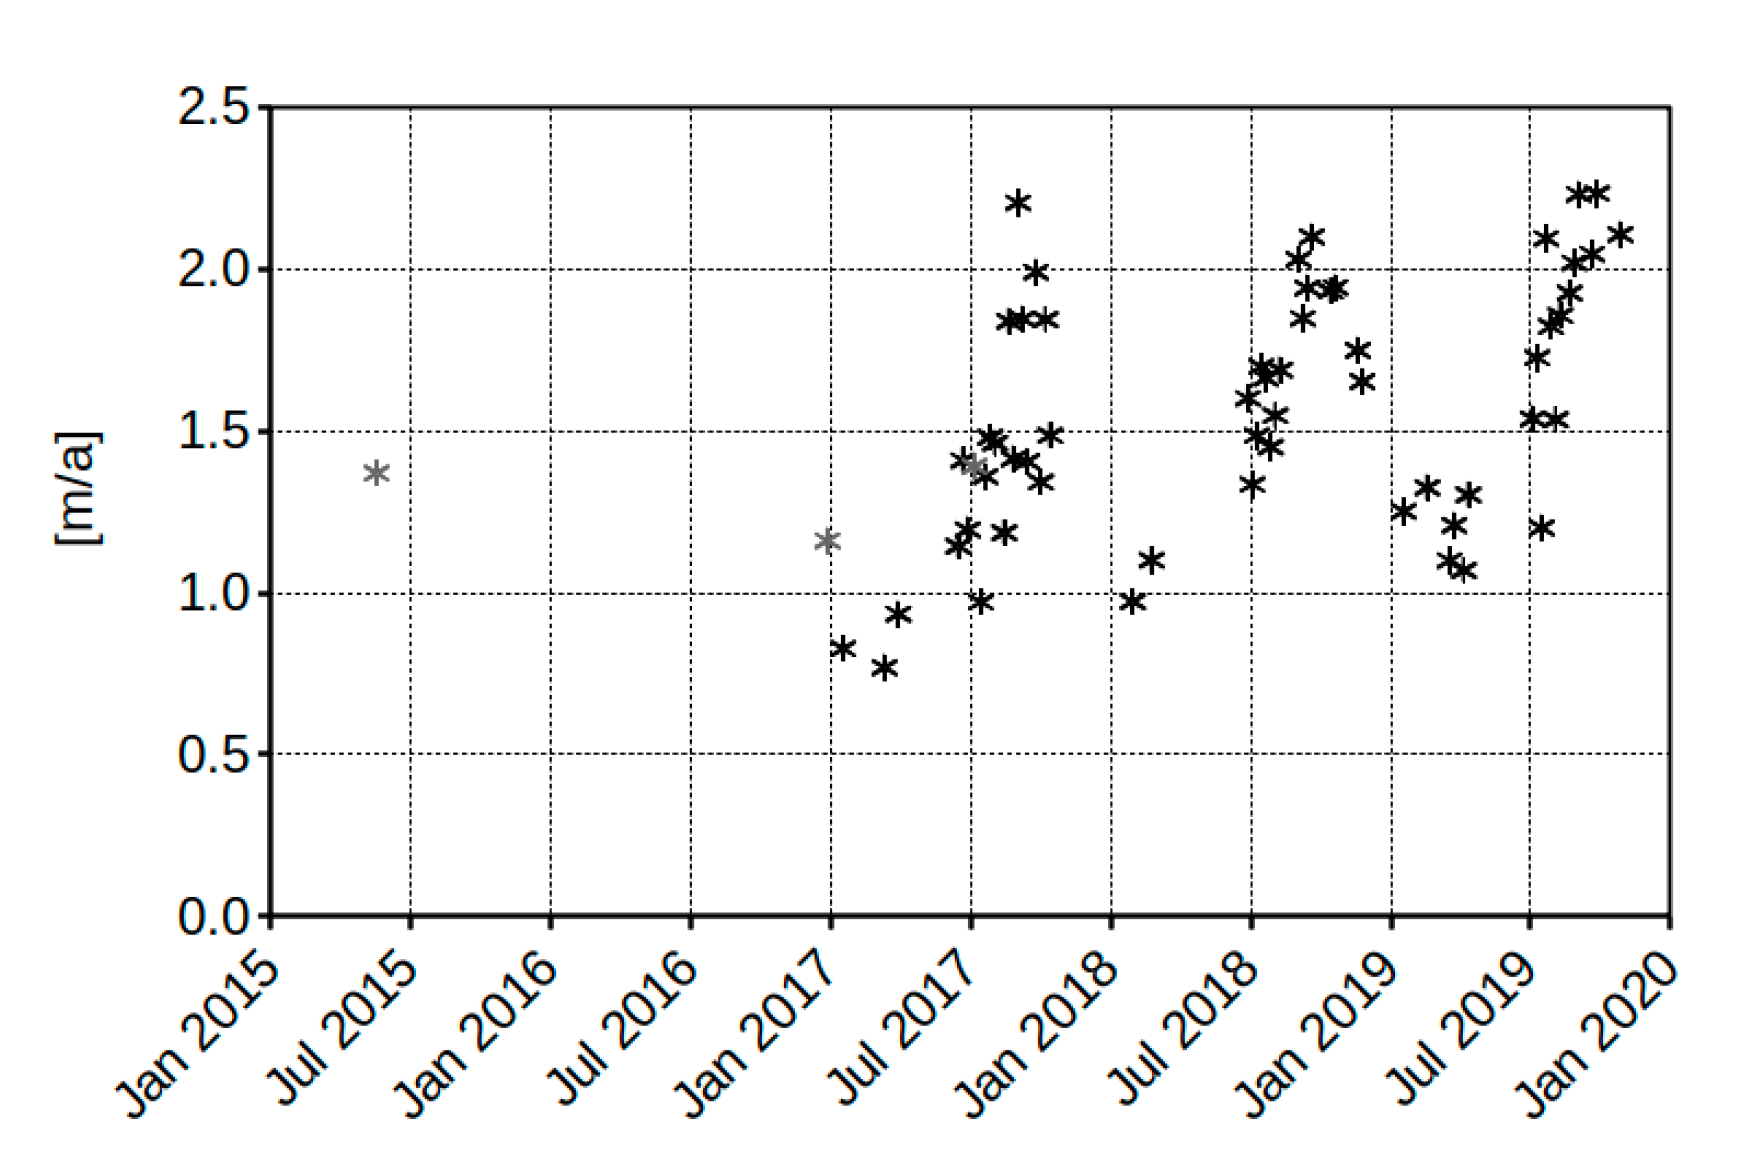
4.3. Becs-de-Besson Rock Glacier (Western Swiss Alps)

The complex deformation field of the Becs-de-Besson rock glacier (Figure 1c and Figure 6a) is well visible in the 11 days TerraSAR-X and six days Sentinel-1 differential interferograms of Figure 6b,c, respectively. One of the permanent GNSS stations (BdB1) indicated strong seasonal fluctuations of the velocities ranging, for example, from 4 m/a during the 2015 summer period to 1 m/a during the 2016/2017 winter period. In the area of the BdB1 station, the fringe patterns on the interferograms are unclear. A second permanent GNSS station (BdB2) was installed, in 2016, further down the rock glacier, where velocities are lower (around 1 m/a) and there is much less spatial variability. A velocity profile along the maximum slope direction from Sentinel-1 InSAR was retrieved over the fastest spot of this part of the rock glacier (BdB3). The time series of Figure 7 indicates an increase of the rate of motion from about 1 m/a in early summer to more than 2 m/a in autumn with a good representation of the annual cycle of motion.

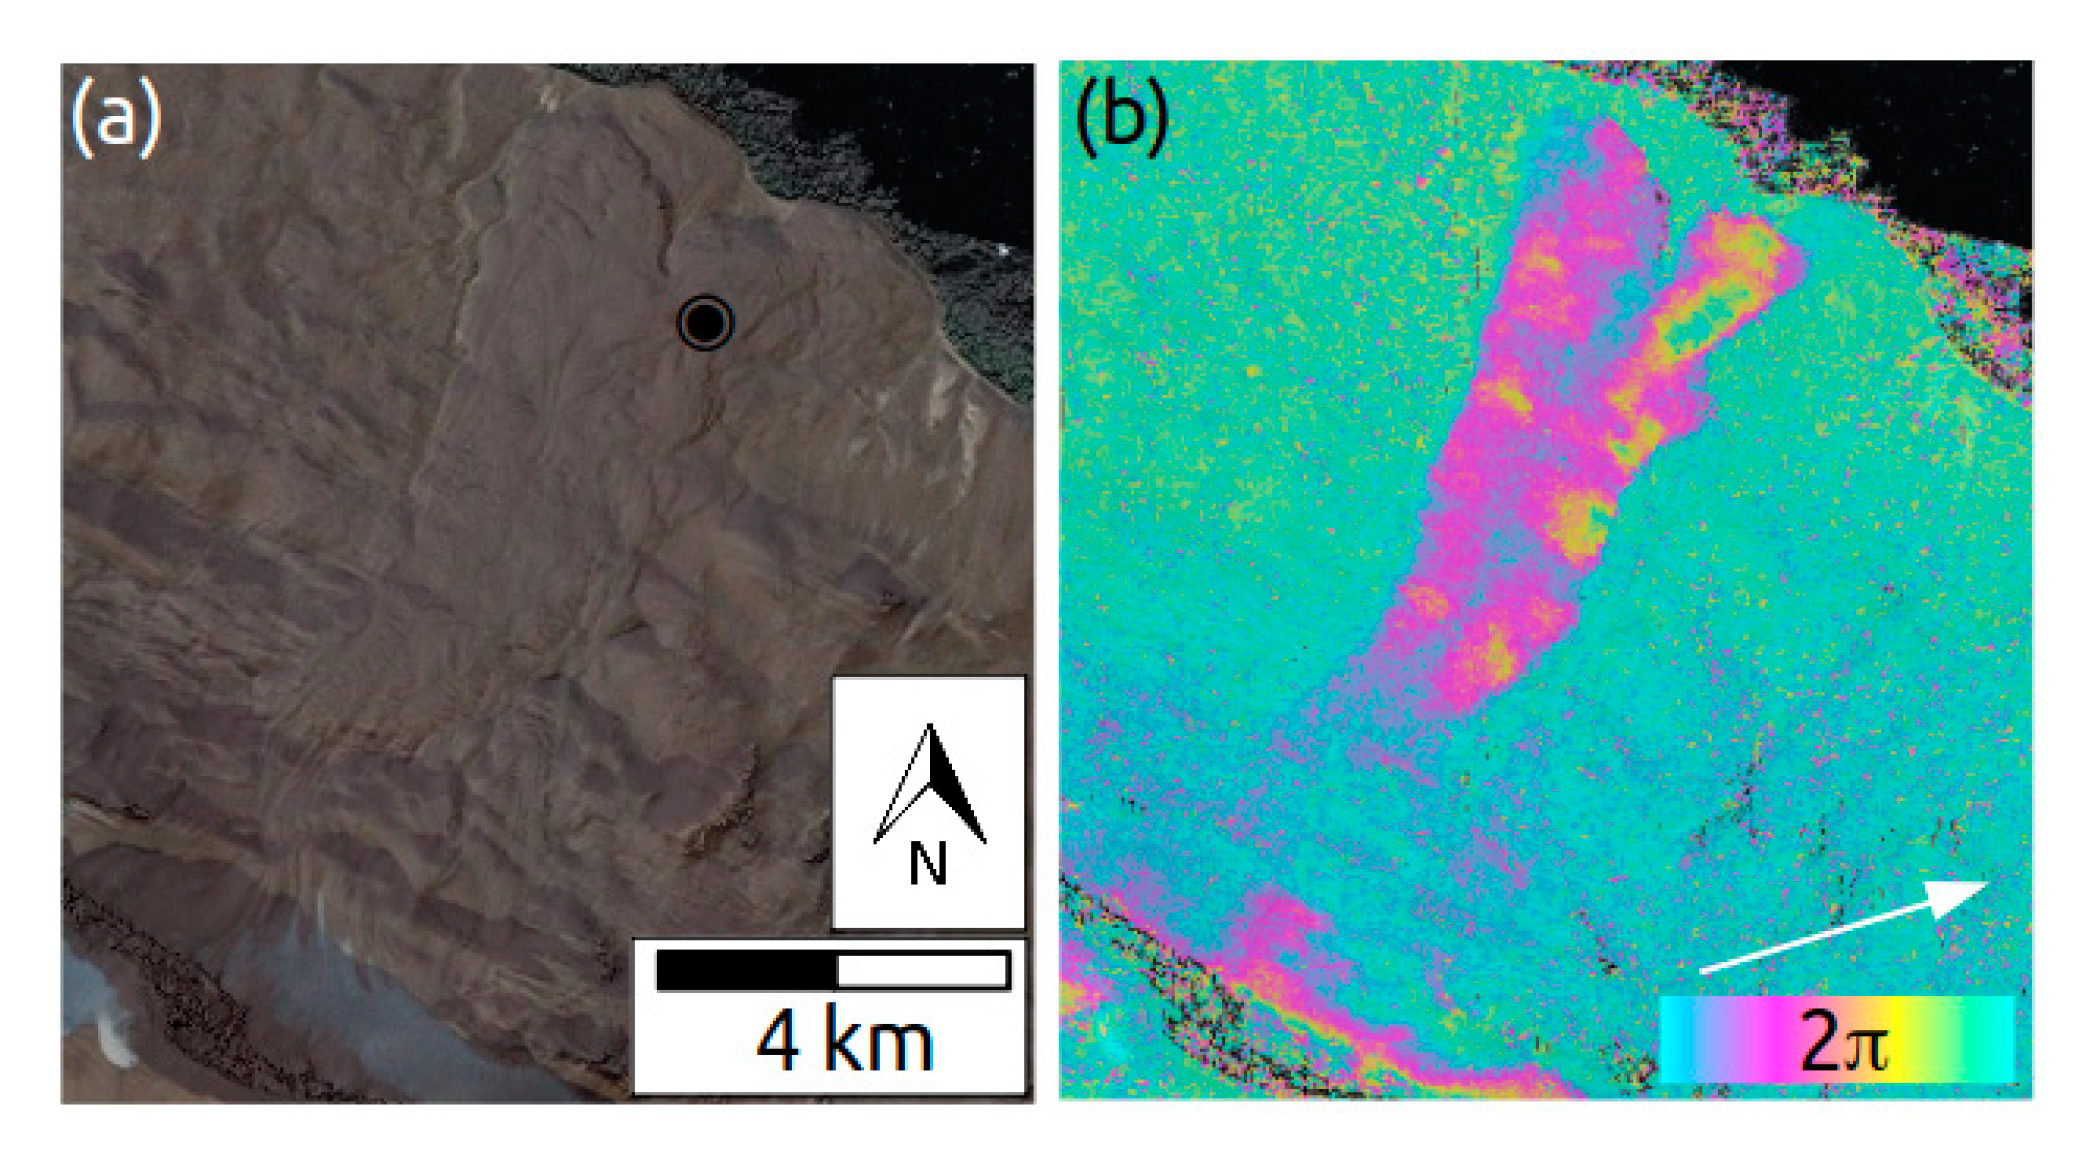
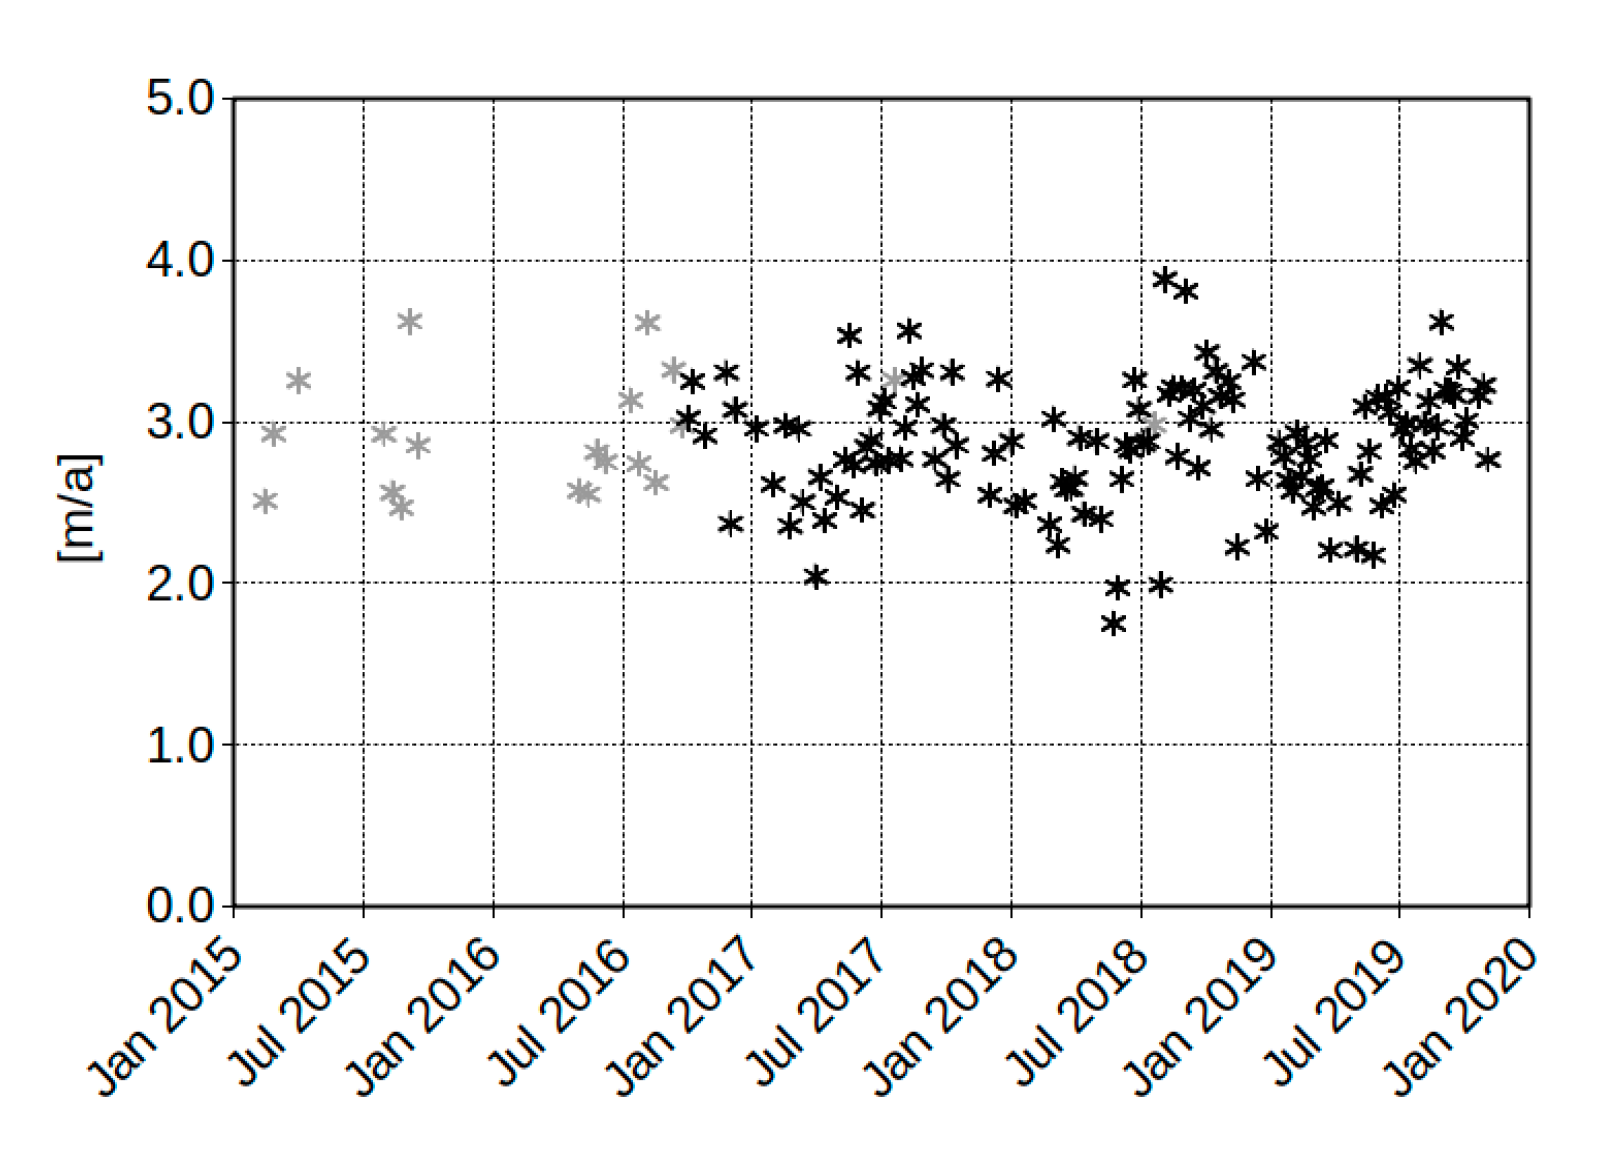
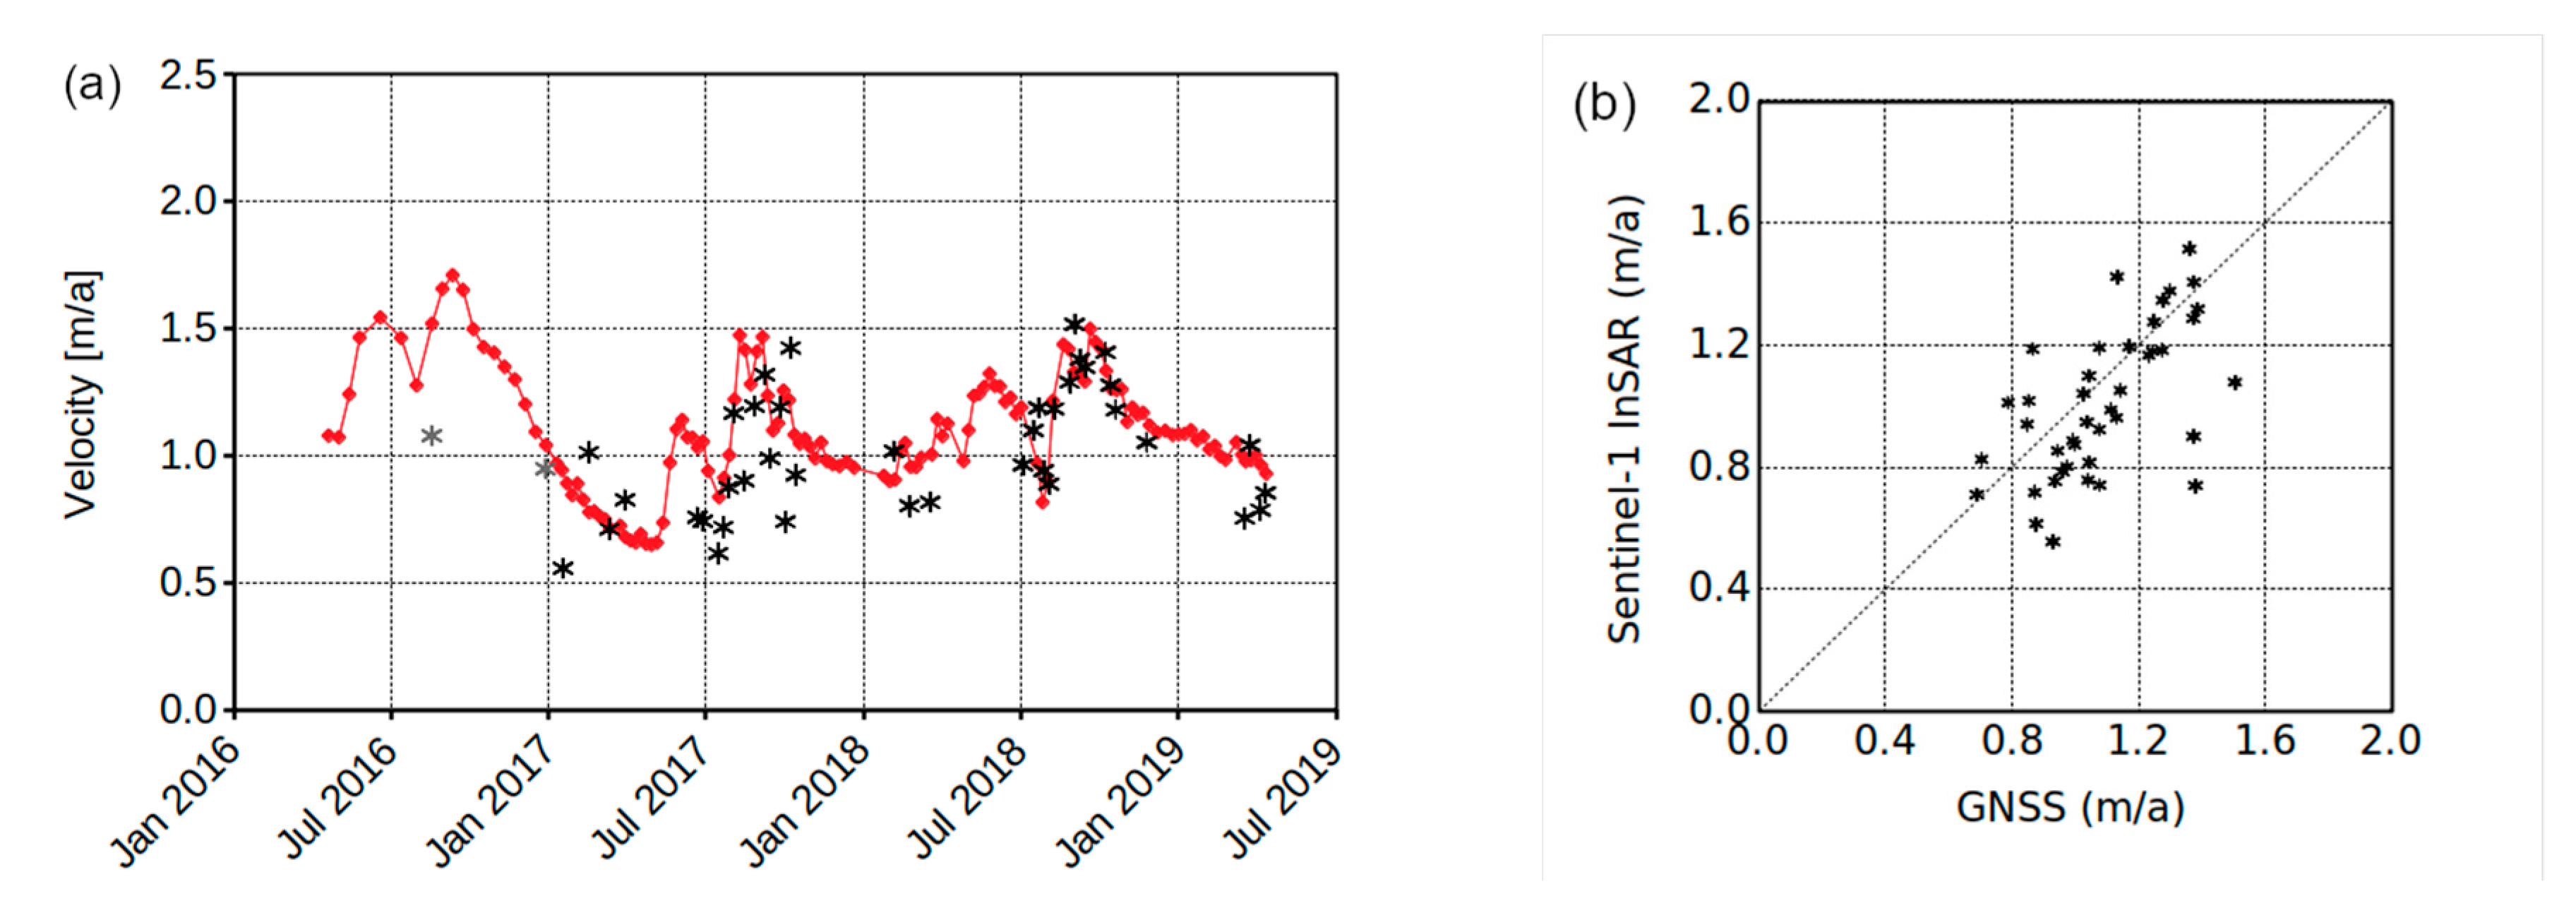
4.4. Qeqertarsuaq (Greenland)

We focus our analyses on Qeqertarsuaq on Manissuarsuk, a large (1 × 3 km) and tongue-shaped northeastern oriented rock glacier (Figure 1c and Figure 8a). A Sentinel-1 differential interferogram over six days in mid-winter (Figure 8b) very nicely depicts the displacement field of the rock glacier, with good coherence everywhere and larger displacement at the eastern front. The time series of motion at the eastern front of Manissuarsuk (Figure 9) indicates again that rock glacier activity is generally higher in autumn and lower in spring, although with a larger noise as compared with the Distelhorn (Figure 3b) and Becs-de-Besson rock glaciers (Figure 7) in the Swiss Alps. In this case, maximum velocities are approaching 4 m/a and minimum velocities around 2 m/a.

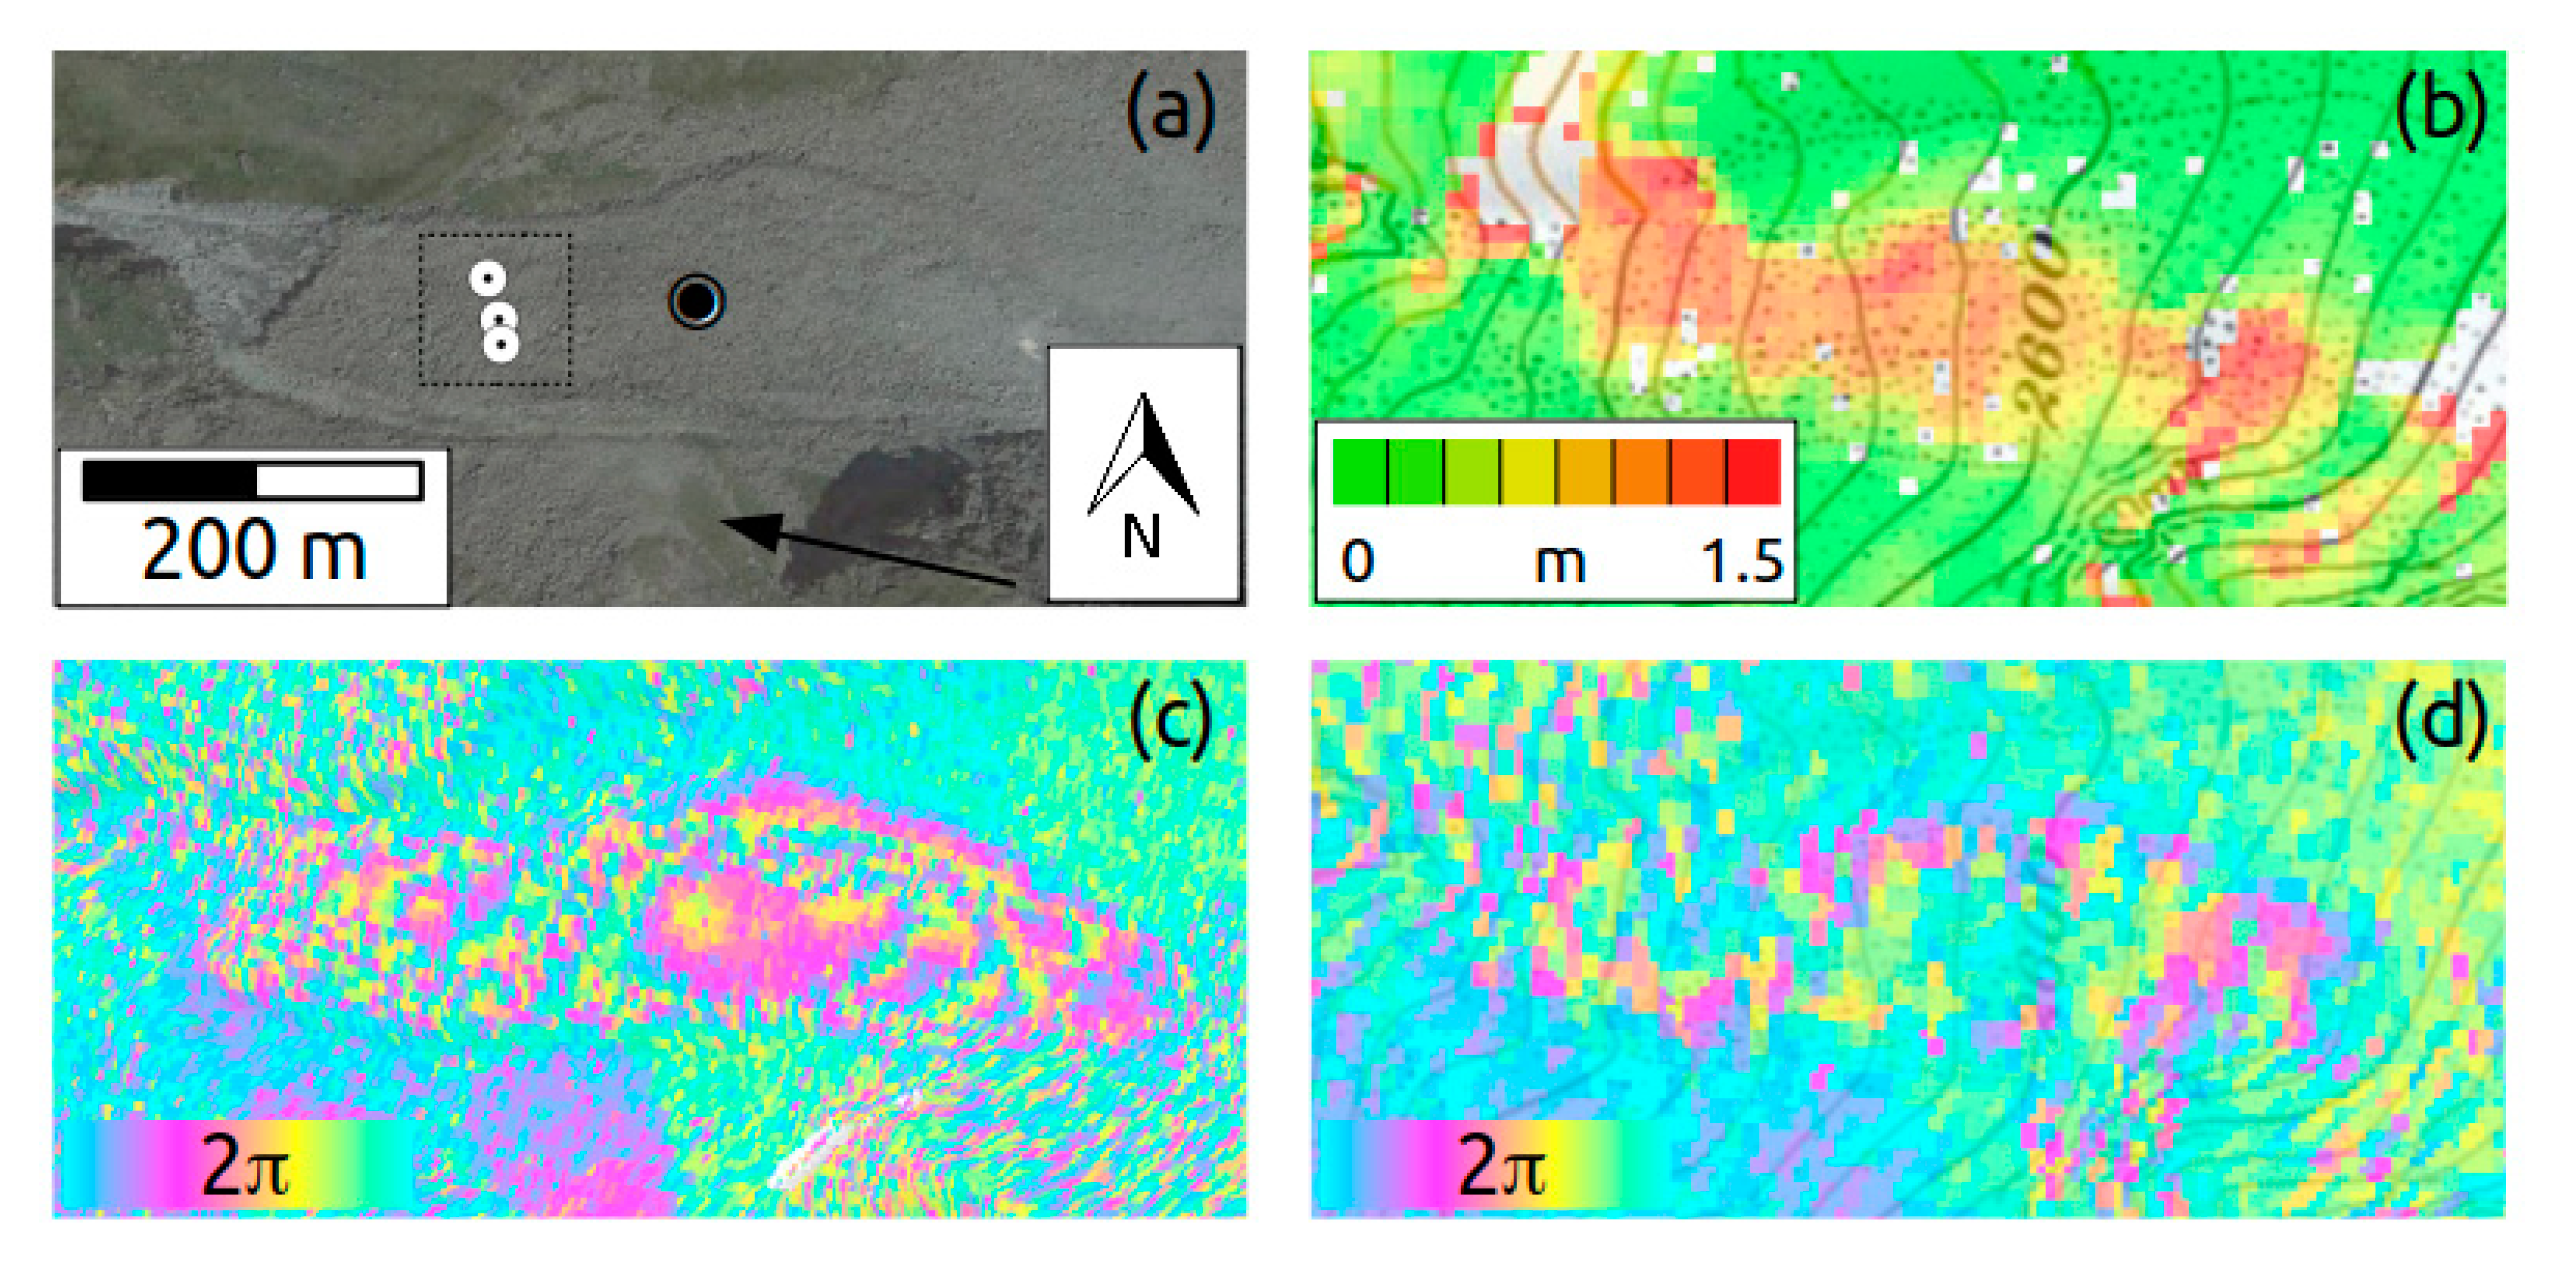
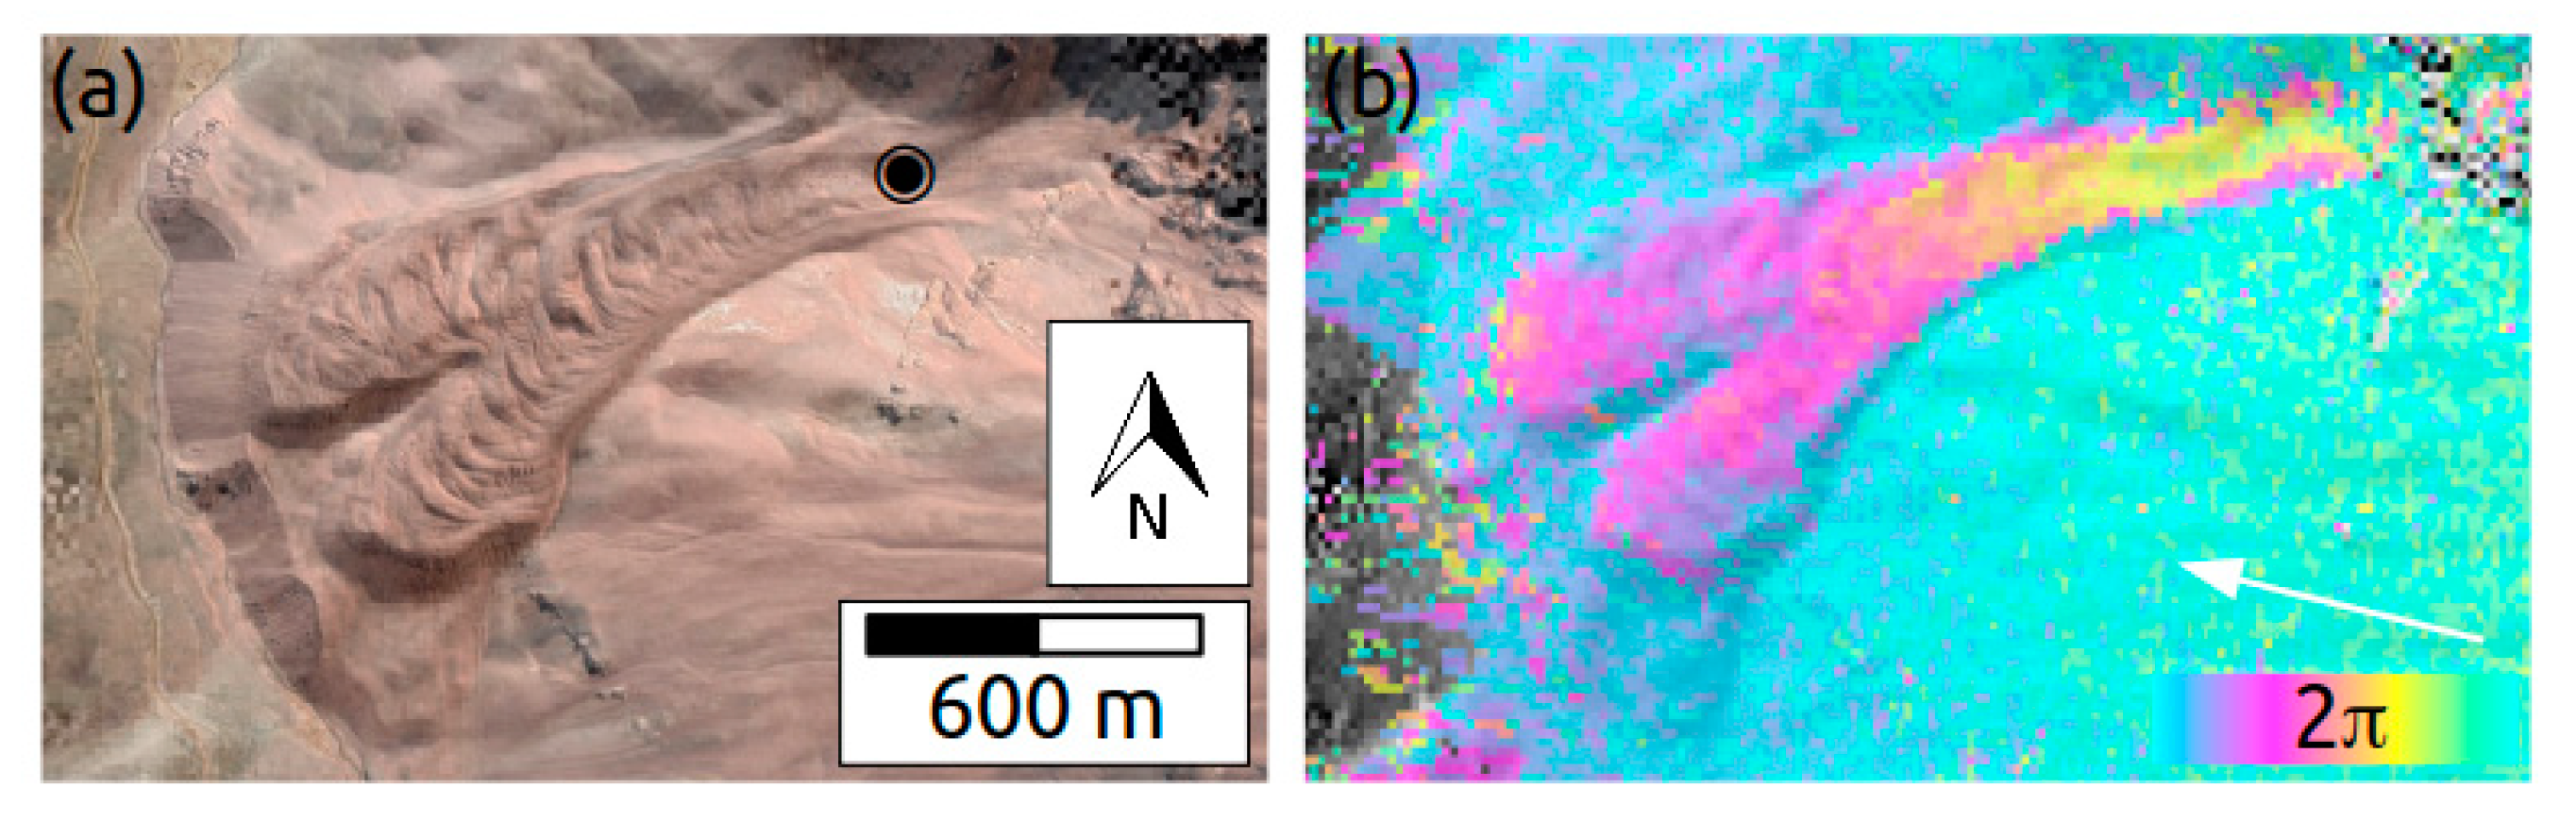
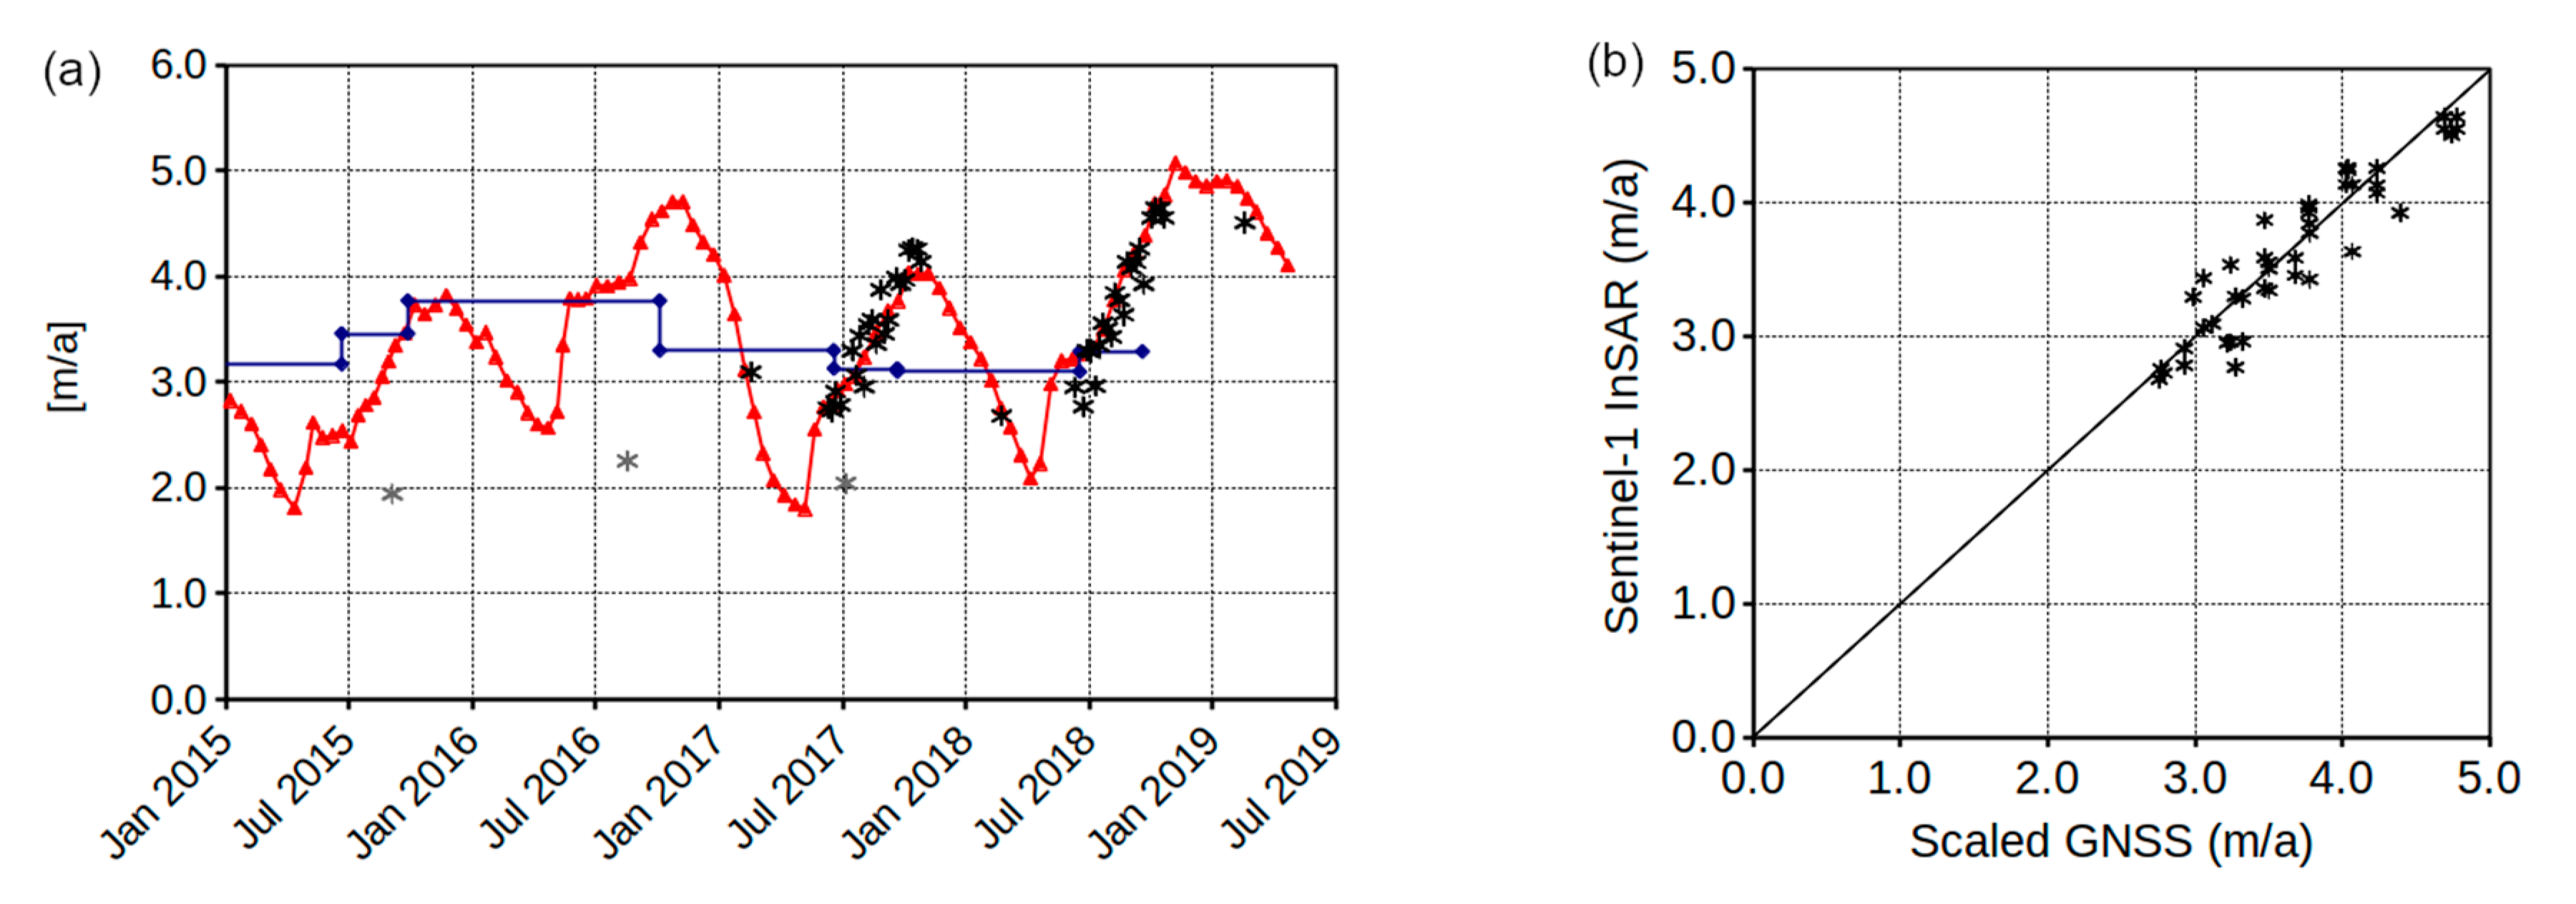
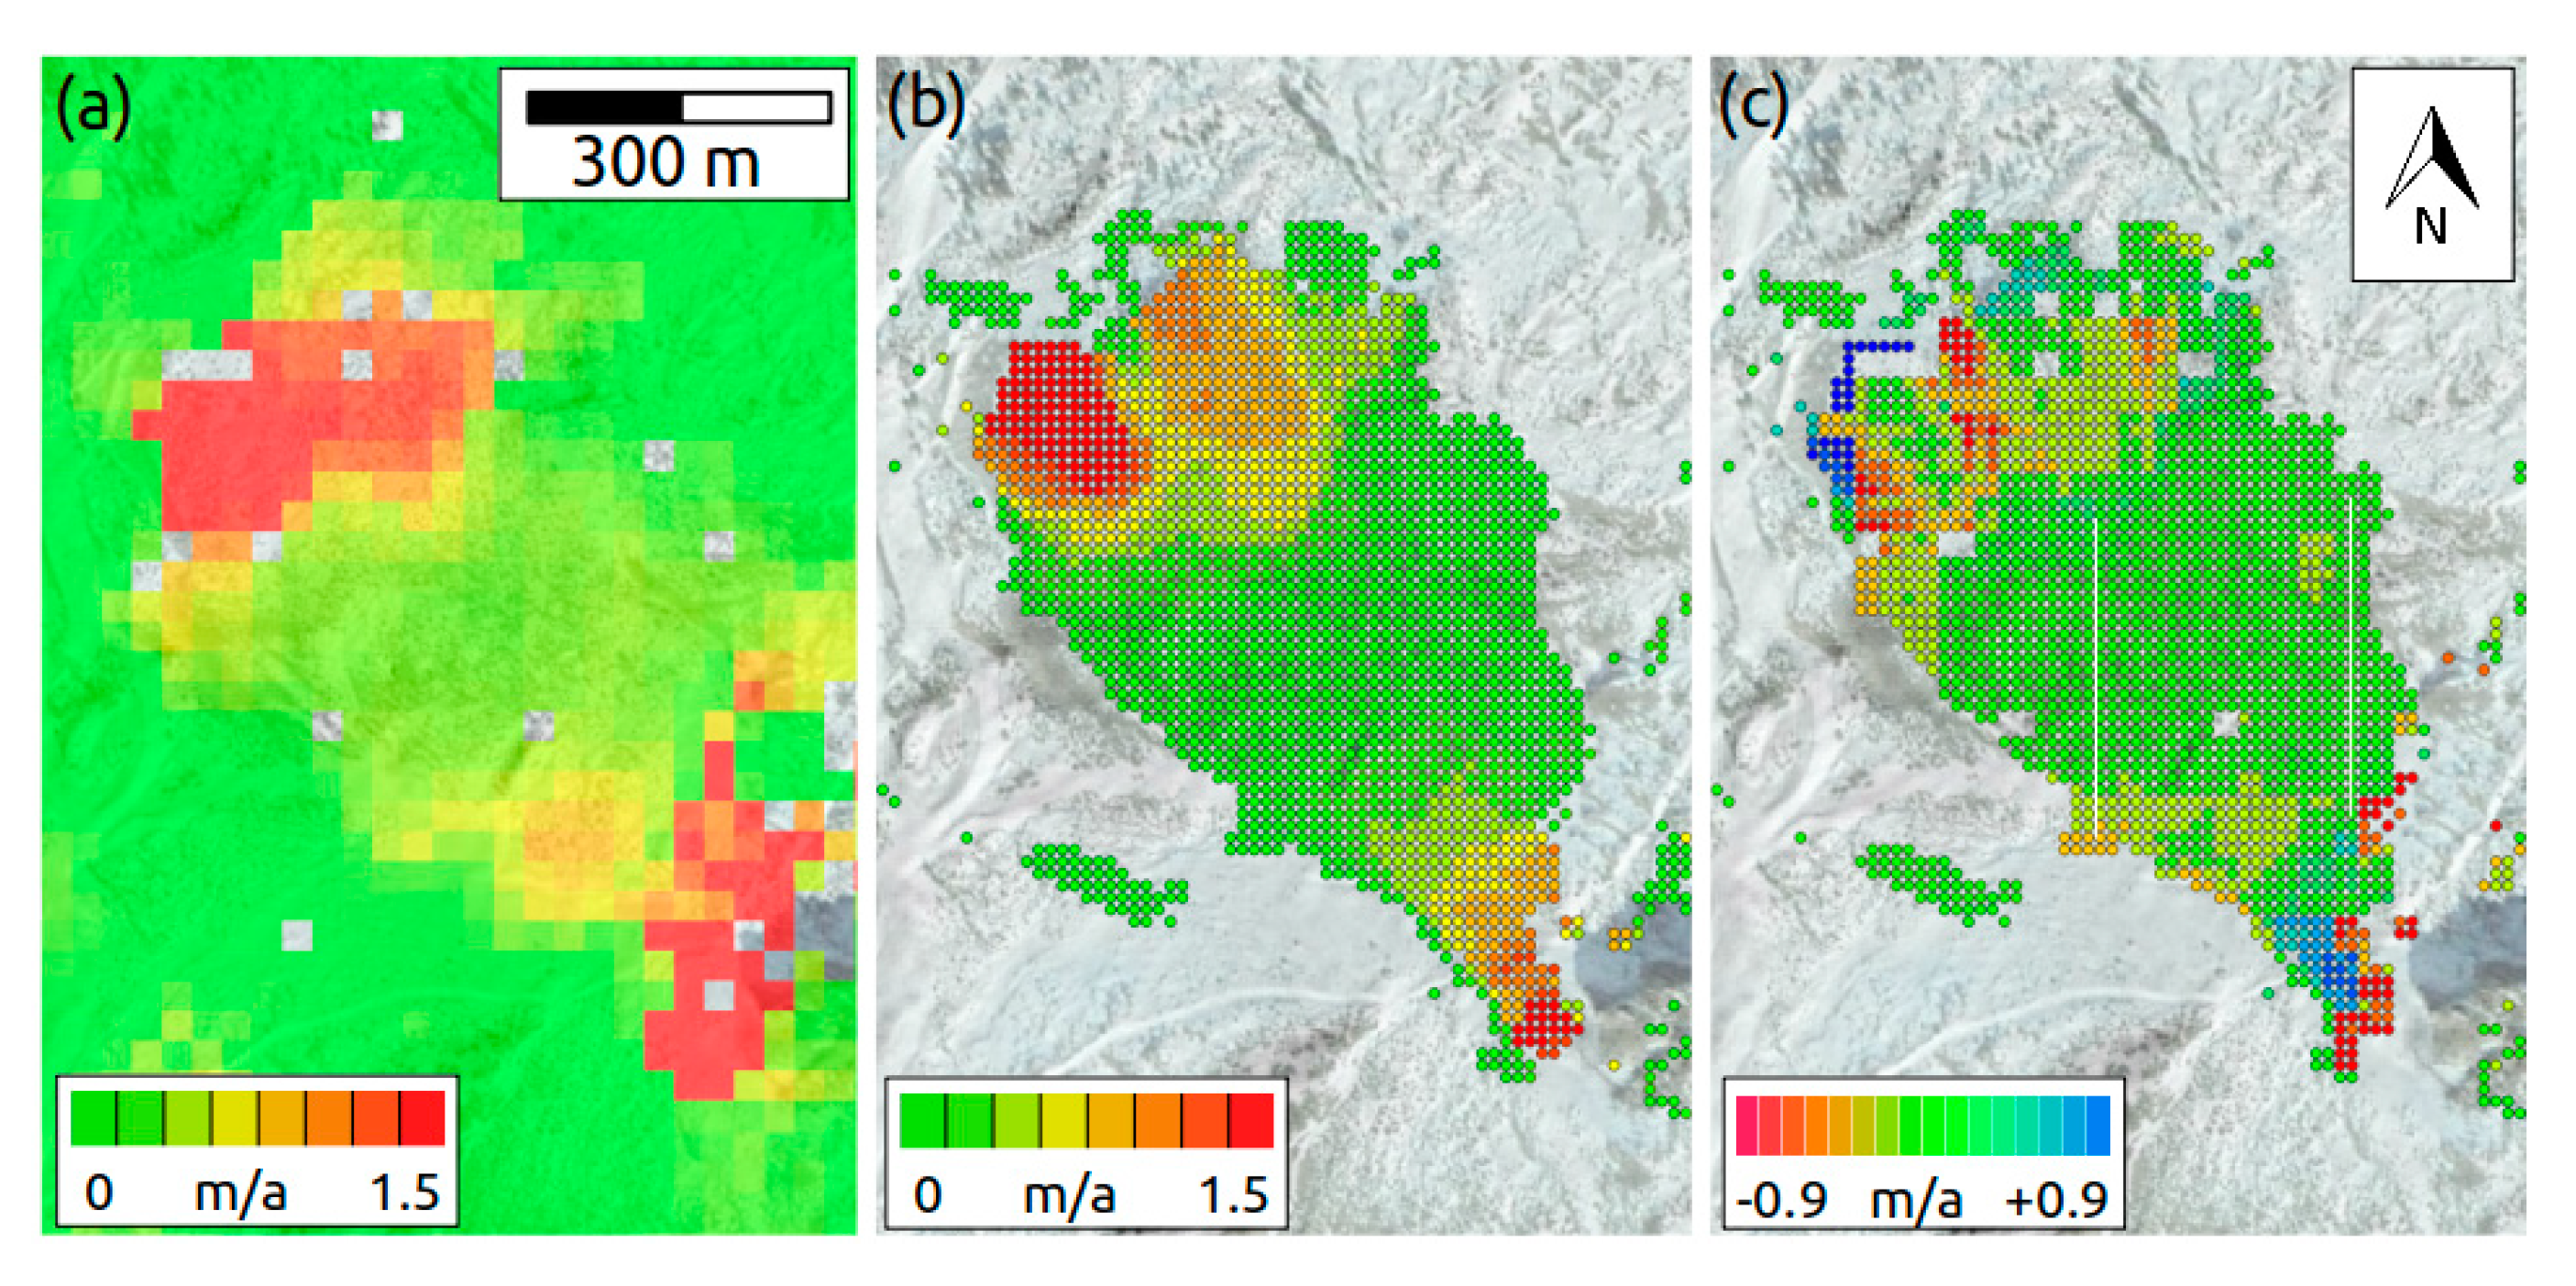
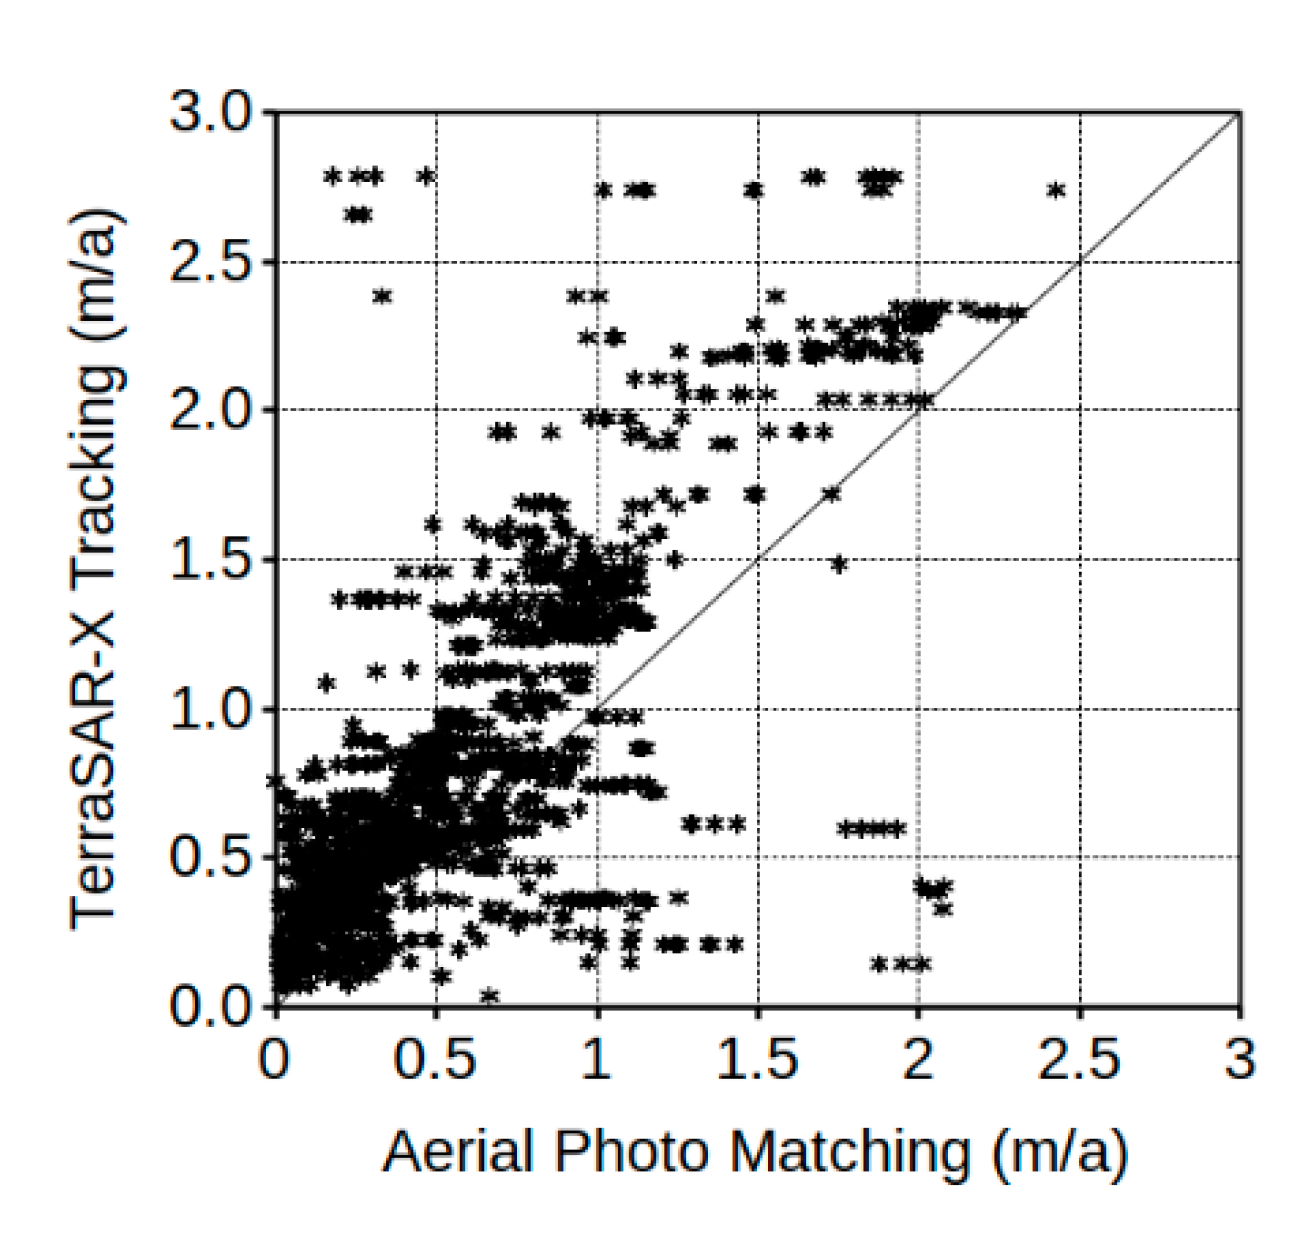
4.5. Dos Lenguas Rock Glacier (Agua Negra Region, Argentinian Andes)

Several areas of distinct velocity patterns related to the motion of rock glaciers are observed with InSAR over the Tapado/Agua Negra region. A Sentinel-1 differential interferogram over six days is presented in Figure 10 for one prominent rock glacier of the Agua Negra Region, Dos Lenguas. In this particular case, we observe higher rates of motion at the rooting zone in the east rather than at front(s) in the west. Rates of motion over the center of the rooting zone (Figure 11) range from 1.5 to 2 m/a, with less amplitude variations of the annual cycle than observed for the Swiss Alps. These rates of motion are very consistent with values obtained from recent studies on the Dos Lenguas rock glacier using a Phantom 3 Advanced Multicopter and Structure from Motion (SfM) techniques [64]. In this study, values ranging from 1.25 to 1.75 m for the periods March 2016 to March 2017 and March 2017 to March 2018, respectively, were obtained with SfM.

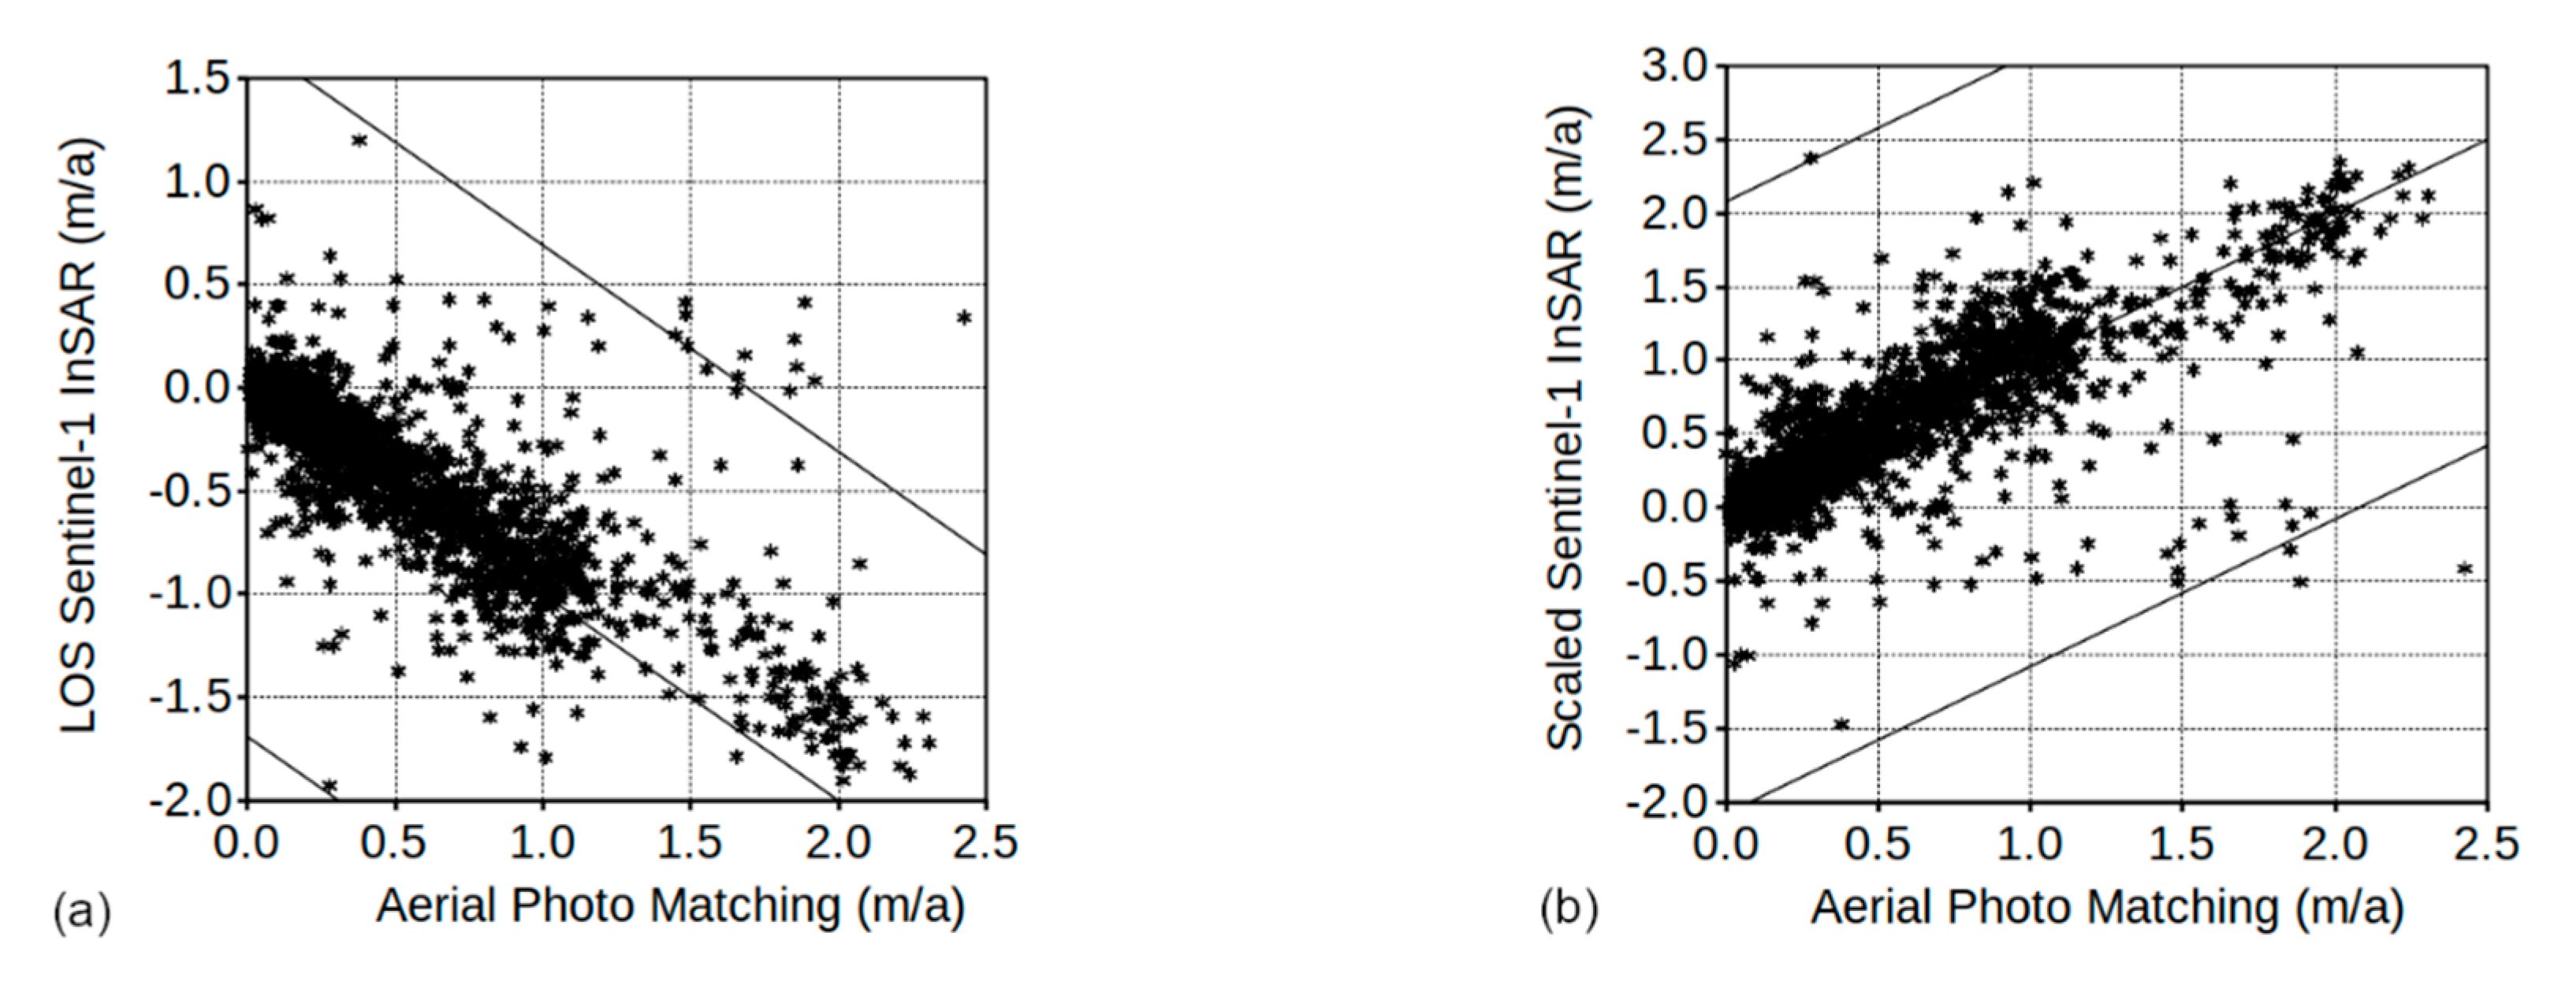
5. Measurement Uncertainty

5.1. SAR Interferometry

For single measurements at C-band, an error of 6 to 7 mm, partly attributed to noise (1 to 2 mm) and partly to atmospheric artifacts (5 to 6 mm), was estimated in a major validation project over urban areas [80], where a similar high degree of coherence over a multiannual period is typically observed as in 6 to 12 days over rock glaciers. This error translates to a LOS measurement uncertainty of ±0.4 m/a for Sentinel-1 interferograms over six days and of ±0.2 m/a for Sentinel-1 interferograms over 12 days. A similar phase error of one quarter of a phase cycle due to signal noise and atmospheric artefacts is typically observed also at X-band [68]. For TerraSAR-X interferograms over 11 days, this error corresponds to a measurement uncertainty in LOS displacement of ±0.1 m/a. At L-band the total phase error is minor [81], for example, one eighth of a phase cycle, leading to an error in LOS displacement of the JERS-1 interferogram over 88 days of ±0.1 m/a.
One of the permanent mono-frequency GNSS stations over Becs-de-Bosson rock glacier, BdB2, which was installed in 2016 at a location where velocities are rather spatially homogeneous (Figure 6), was used for a direct validation of the Sentinel-1 InSAR measurements. In local differential mode, with differential postprocessing computed with respect to a permanent local basis, the estimated accuracy of the mean planimetric and altimetric GNSS positioning over 24 h is in the order of +/−2 mm and that of the velocity over a 6 day period in the order of +/−0.24 m/a [43]. The 3D GNSS velocities computed with the average daily positions corresponding to the acquisition dates of the Sentinel-1 images are plotted together with the velocities along the maximum slope direction from Sentinel-1 InSAR in Figure 12a. For the 41 coincident measurement points (Figure 12b), the standard deviation of the velocity difference is 0.21 m/a, while average, minimum, and maximum of the velocity difference are −0.08 m/a, −0.67 m/a, and 0.33 m/a, respectively. Sentinel-1 InSAR is slightly underestimating the GNSS velocities, possibly because the rock glacier is not exactly moving along the steepest slope or as a result of the InSAR spatial resolution on the order of 15 m.
On the one hand, over the Tsarmine rock glacier the permanent mono-frequency GNSS station operates in a local differential mode. It is, however, located in a section where the Sentinel-1 interferograms are decorrelated, because the late summer rates of motion are overpassing, since 2015, 6 m/a, i.e., amount to nearly 9 cm in six days (Figure 4). Displacement measurements using GNSS campaigns carried out seasonally, on the other hand, are performed on about 60 positions, including the locations of the permanent GNSS station and the spot of the Sentinel-1 InSAR time-series of Figure 5b. Considering that during the last three years (2016 to 2018) the ratio between the annual rates of motion of these two positions remained constant (factor 0.54), we plotted in Figure 13a the scaled 3D GNSS velocities computed with the average daily positions corresponding to the acquisition dates of the Sentinel-1 images together with the velocities along the maximum slope direction from Sentinel-1 InSAR. Taking into account the scaling of the continuous GNSS data, the correspondence to the Sentinel-1 InSAR results is impressive. The scatter plot of scaled GNSS and Sentinel-1 velocities (Figure 13b) indicates even more clearly the very good accordance. For the 45 coincident measurement points, the standard deviation of the velocity difference is 0.22 m/a, whereas average, minimum, and maximum velocity differences are 0.03 m/a, −0.40 m/a, and 0.50 m/a, respectively. The results of the displacement measurements from the GNSS campaigns carried out seasonally are also shown in Figure 13a. In real-time GNSS kinematic mode, with the receiver left calculating its position for a few seconds, the standard deviation of positioning during this time lapse is usually less than 1 cm in the horizontal component and less than 2 cm in the vertical one [82]. As expected, differential GNSS measurements miss the strong seasonal variations, but the order of magnitude of the rate of motion fits the Sentinel-1 InSAR results.
Standard normalized image cross-correlation techniques enable surface displacement measurements from repeat optical images at subpixel horizontal accuracy [83,84]. We matched repeat orthorectified aerial images provided by Swisstopo, the Swiss national mapping agency, with a spatial resolution of 0.4 m acquired on 03.09.2014 and 21.09.2017 over the Distelhorn rock glacier. From matches over stable ground outside the rock glacier we estimate a displacement accuracy of ±0.15 m, that is, ±0.05 m/a. The horizontal displacement field from offset tracking in repeat orthoimages is compared to the Sentinel-1 InSAR LOS displacement field from 02.08.2018 to 08.08.2018 in Figure 14 along with the difference map between the two measurements. The results of Figure 14 indicate a good spatial correspondence between aerial photo matching and Sentinel-1 InSAR, but on the southern tip of the rock glacier the interferogram was not correctly unwrapped. Further discrepancies can be observed on the edges of the fastest moving parts of the rock glacier front. The scatter plot of the aerial photo matching and Sentinel-1 LOS velocities (Figure 15a) indicates the effect of the different time intervals (three years as compared with six days) and of the satellite look direction. In Figure 15b, we empirically fitted the Sentinel-1 LOS velocities to the aerial photo matching velocities by scaling them with a factor of −1.23 in order to maximize the one-to-one match and account, therefore, for these two effects. After scaling, the standard deviation of the velocity difference for the 2237 coincident measurement points is 0.30 m/a, while average, minimum and maximum velocity differences are 0.01 m/a, −2.09 m/a, and 2.84 m/a, respectively. After removal of the 17 wrongly unwrapped Sentinel-1 InSAR points in the southern tip of the rock glacier, the standard deviation of the velocity difference is 0.25 m/a, while average, minimum, and maximum velocity differences are 0.00 m/a, −1.28 m/a, and 1.50 m/a, respectively.

5.2. SAR Offset Tracking

Delaloye at al. [36] investigated the accuracy of SAR offset tracking for ice surface velocity estimation in various aspects, including a formal description of the error terms, matching on stable ground, comparison against results from SAR image data of equal or better resolution, and ground-based measurements from GNSS. They estimated the reliability of the cross-correlation algorithm to return coregistration parameters in the order of 1/10th of a SAR image pixel. This corresponds for the TerraSAR-X and Cosmo-SkyMed data of our study (Table 1) to an accuracy of about 0.3 m in measuring horizontal displacement.
Offset tracking based on TerraSAR-X images over the Distelhorn rock glacier was performed with time intervals of about two years. Therefore, a coregistration precision of 1/10th of a SAR image pixel would correspond to 0.15 m/a in measuring horizontal displacement. Statistical measures of displacement were computed for every TerraSAR-X image pair over 55,580 points on stable terrain surrounding the rock glacier. The mean of the horizontal velocities for the four image pairs 24.09.2008 to 20.09.2010, 09.09.2010 to 04.09.2012, 15.09.2012 to 22.09.2014, and 11.09.2014 to 06.09.2016 were 0.42 m, 0.43 m, 0.42 m, and 0.48 m, respectively, on average 0.22 m/a. The standard deviations of the estimates for the four image pairs were 0.45 m, 0.54 m, 0.44 m, and 0.46 m, respectively, on average 0.24 m/a. A visual comparison to the matching of aerial optical images acquired on 03.09.2014 and 21.09.2017 was drawn, as shown in Figure 16. These results clearly point to the lower spatial resolution of TerraSAR-X offset tracking with respect to matching of aerial optical images, with large discrepancies on the edges of the fastest moving parts of the rock glacier. The scatter plot of the aerial photo matching and TerraSAR-X velocities (Figure 17) also indicates a bias of the offset tracking results, which are generally lower than those from the matching of aerial images as a result of the larger cross-correlation window size used with SAR images. The standard deviation of the velocity difference for the 2197 coincident measurement points is 0.34 m/a, while average, minimum, and maximum velocity differences are −0.22 m/a, −2.61 m/a, and 1.87 m/a, respectively.
Offset tracking with Cosmo-SkyMed images over the Tsarmine rock glacier was performed with time intervals of about one year. Therefore, a coregistration precision of 1/10th of a SAR image pixel would correspond to 0.30 m/a in measuring horizontal displacement on the ground. Statistical measures of displacement were also computed for every Cosmo-SkyMed image pair over 20,326 points on stable terrain surrounding the rock glacier. The mean of the horizontal velocities for the eight image pairs 23.07.2009 to 10.14.2010, 27.08.2010 to 14.08.2011, 13.07.2011 to 29.06.2012, 15.07.2012 to 04.09.2013, 02.07.2013 to 21.07.2014, 22.08.2014 to 22.06.2015, 26.09.2015 to 27.08.2016, and 10.10.2016 to 13.07.2017 were 0.18 m, 0.18 m, 0.19 m, 0.17 m, 0.19 m, 0.20 m, 0.32 m, and 0.29 m, respectively, on average 0.21 m/a. The standard deviations of the estimates for the eight image pairs were 0.17 m, 0.20 m, 0.25 m, 0.29 m, 0.26 m, 0.30 m, 0.84 m, and 0.42 m, respectively, on average 0.34 m/a. Horizontal displacements for the central sector of the rock glacier assessed by GNSS campaigns carried out annually (points 022, 023, and 024 which are within about 40 m of each other) are well representative of the velocity evolution over time for the central sector of the rock glacier. The GNSS horizontal velocities over time averaged for the three points are compared to the velocities from Cosmo-SkyMed offset tracking in Figure 18a, while the scatter plot of GNSS and Cosmo-SkyMed velocities is presented in Figure 18b. For the eight coincident measurement points, the standard deviation of the velocity difference is 1.00 m/a, while average, minimum and maximum velocity differences are 0.40 m/a, −1.36 m/a, and 1.86 m/a, respectively. In Figure 18a,b we also observed that the deviation between GNSS and Cosmo-SkyMed velocities increases for larger values.
In summary, we note that rock glaciers in the Swiss Alps are rather small objects (e.g., 0.5 km long and 100 to 200 m width) and offset tracking is at the limit of its applicability even with very high-resolution SAR images with a resolution of about 2 m. The measurement uncertainty is, thus, larger than assessed over fast-flowing (e.g., >300 m/a) and large (e.g., >10 km) Arctic glaciers over shorter (e.g., few days) time periods [36]. For the TerraSAR-X images used for offset tracking over two years with image matching windows of 64 × 64 pixels, corresponding to a resolution of about 125 meters on the ground, the assessed measurement uncertainty over the Distelhorn rock glacier is about 0.3 m/a. For the Cosmo-SkyMed images used for offset tracking over one year with image matching windows of 64 × 64 pixels over the Tsarmine rock glacier, the assessed measurement uncertainty is in the order of 1.0 m/a. The Tsarmine rock glacier is only 150 m in width as compared with the width of about 300 m of the Distelhorn rock glacier, and the performance of SAR offset tracking is, therefore, well expected to be worse.

6. Discussion

With Sentinel-1, satellite SAR images that enable interferometry are nowadays regularly acquired worldwide. Therefore, this mission provides consistent time series of rock glacier velocities every six days over Europe and Greenland and every 12 days over other mountainous regions, including the Andes of South America. The estimated accuracy of the Sentinel-1 InSAR measurements is in the order of 0.2 m/a. Typical lower and upper limits of detection for six days data are in the order of 0.4 m/a (i.e., 6 mm or 1 mm/day) and 2 m/a (i.e., 2π or 2.8 cm), respectively. Monitoring the kinematics of rock glaciers with Sentinel-1 SAR interferometry is, however, limited by the spatial resolution of the SAR data of about 15 m on the ground for a multi-looking factor of 4 pixels in range and 1 pixel in azimuth. It is, therefore, essential to select a representative point over the rock glacier, where the spatial variability of the motion around is low, in order to extract a meaningful time series of motion. In addition, Sentinel-1, as all other SAR missions, suffers in rugged terrain from incomplete spatial coverage due to layover and shadow and with InSAR the sensitivity to motion is restricted to the LOS. For our analyses, we projected, therefore, the InSAR LOS motion along the maximum slope direction. In this contribution, we demonstrate the potential of the Sentinel-1 mission for monitoring rock glacier movement over three typical rock glaciers in the Swiss Alps, one on Qeqertarsuaq in Western Greenland, and one in the Andes.
Stacks of very high-resolution SAR images from TerraSAR-X and Cosmo-SkyMed, regularly acquired every summer between 2008 and 2017 over the Western Swiss Alps, were analyzed with InSAR and offset tracking in order to extend the observation period of our study. Very high-resolution X-band SAR data can be employed over rock glaciers using both InSAR and SAR offset tracking. In the former case, the estimated accuracy is in the order of 0.1 m/a, the upper limit of detection is in the order of 2 m/a, and the ground resolution is in the order of 6 m (for a 3 × 3 multi-looking factor). In the latter case, the estimated accuracy is in the order of 0.3 m/a for a time interval of two years and 0.6 m/a for a time interval of one year. Displacements of more than 6 m/a could be successfully detected with SAR offset tracking, but the spatial resolution is poor (~125 m), and therefore detailed spatial variabilities of motion cannot be captured.
Despite analyzing a limited number of rock glaciers, our study clearly indicates large spatial variability in rock glacier kinematics within the study regions. In [4], speed variations within individual rock glaciers are discussed in more detail and it was concluded that their kinematics appear to be related to the local topography in particular. The study, in [10], also observed large variations of rock glacier velocities on Qeqertarsuaq, with values ranging from 0.1 to 1 m/a. We also detected on all analyzed rock glaciers (Figure 3, Figure 5, Figure 7, Figure 9 and Figure 11) a seasonal variability of the rate of motion, with higher velocities at the end of the summer. This observation is in-line with in situ measurements, also pointing to seasonal variability of the rock glacier’s kinematics [14,16,23]. During the last decade, in situ data also showed that rock glaciers responded almost synchronously to inter-annual and decennial ground temperature changes. With the limited observations of our study we confirmed this trend at the Tsarmine rock glacier (Figure 5) and found an apparent change of the seasonal variability at the Distelhorn rock glacier, since 2016, over its eastern front (Figure 3a). In order to further study trends in rock glacier kinematics using InSAR to possibly confirm acceleration, longer time series of motion from Sentinel-1 InSAR are, however, necessary.

7. Conclusions and Outlook

Our results in three different regions worldwide (European Alps, Qeqertarsuaq in Western Greenland, and Andes of South America) demonstrate the good performance of high-resolution Sentinel-1 data for the monitoring of rock glacier kinematics. Coherent interferograms over six or 12 days are available not only for most of the snow-free acquisitions, but also in mid-winter by stable dry snow conditions. A typical annual cycle of rock glacier velocities with higher values in autumn and lower values in spring could be observed with an estimated accuracy on the order of 0.2 m/a. In this contribution, we selected representative rock glaciers for Sentinel-1 InSAR analyses. Our next step is to investigate which and how many rock glaciers per region can be analyzed with Sentinel-1 InSAR for more general analyses. A long-term analysis of the Sentinel-1 InSAR time series can possibly lead to observed changes in rock glacier motion as indicators of general mountain permafrost conditions.
Stacks of very high-resolution SAR images from TerraSAR-X and Cosmo-SkyMed analyzed using both InSAR and offset tracking were used to complement the Sentinel-1 InSAR analyses. In order to be acquired, however, very high-resolution SAR data must be programmed in advance and their use is, thus, limited. In Switzerland, for example, we only program TerraSAR-X data during the summer months for specific regions and Cosmo-SkyMed data are only available at the border to Italy. Over other regions worldwide, acquired very high-resolution SAR images are much more sparse. Studies of active rock glaciers would strongly benefit from having a much larger number of interferograms at very high-spatial resolution (i.e., TerraSAR-X or Cosmo-SkyMed) available with short repeat time intervals.
Facing the importance of documenting the changes occurring in the transfer rate of frozen debris over mountain slopes, the Swiss permafrost observation network PERMOS [18] has included a kinematics tier in its monitoring strategy, in addition to the observation of permafrost temperature and active layer trends. This is, however, not yet the case in other mountain regions or in the Global Terrestrial Network for Permafrost GTN-P [85], despite an increasing number of publications dedicated to this specific emerging geomorphological response to the climate warming [3,14,17,86,87]. In addition, inventories of rock glaciers and monitoring of rock glacier velocities is not explicitly mentioned by the Global Climate Observing System (GCOS) of the World Meteorological Organization (WMO) as being an essential climate variable (ECV) associated parameter, despite the fact that monitoring rock glacier velocities at the regional scale provides information on the impact of climate change on mountain slope stability, and rock glacier monitoring builds up a unique validation dataset of climate models for mountain regions, where direct permafrost (thermal state) measurements are scarce. An Action Group of the International Permafrost Association (IPA) is intending to promote the integration of permafrost creep rates (rock glacier kinematics) as a new parameter associated with the ECV Permafrost within the GCOS [88], characterizing the evolution of mountain permafrost at the global scale. In this context, satellite SAR data can complement in situ collections of rock glacier kinematics and expand, with a degree of independence, in situ networks.

Author Contributions

T.S., R.D., and A.K. designed the experiments; T.S., R.C., and N.J. processed the satellite SAR images; A.K. processed the aerial optical images; C.B. and R.D. contributed to the discussion and validation in the Western Swiss Alps; N.J. and E.M. contributed to the discussion in Qeqertarsuaq; X.B. and L.S. contributed to the discussion in the Tapado/Agua Negra Region; T.S. led the writing of the paper; all authors analyzed the results and contributed to the writing of the paper. All authors have read and agreed to the published version of the manuscript.

Funding

This research was funded by ESA grant numbers 4000116196/15/I-NB and 4000123681/18/I-NB. A.K. acknowledges in addition support from the ESA EarthExplorer10 Mission Advisory Group (grant number 4000127656/19/NL/FF/gp).

Acknowledgments

JERS SAR data are courtesy of J-2RI-001, copyright JAXA. TERRASAR-X data are courtesy of LAN041, LAN1145, LAN2548, and GEO3647, copyright DLR. Cosmo-SkyMED data are courtesy of Id 444, copyright ASI. Sentinel-1 images are available from Copernicus. TanDEM-X is provided by the German Aerospace Center (DLR), courtesy of DEM_GEOL1365. SwissAlti3D, Swissimages & Pixel Maps 25 are copyright 2018 of Swisstopo (5701367467/000010). GNSS data courtesy of the Alpine Cryosphere and Geomorphology group at the University of Fribourg (https://www3.unifr.ch/geo/geomorphology).

Conflicts of Interest

The authors declare no conflict of interest.

References

  1. Haeberli, W.; Noetzli, J.; Arenson, L.; Delaloye, R.; Gärtner-Roer, I.; Gruber, S.; Isaksen, K.; Kneisel, C.; Krautblatter, M.; Phillips, M. Mountain permafrost: Development and challenges of a young research field. J. Glac. 2010, 56, 1043–1058. [Google Scholar] [CrossRef] [Green Version]
  2. Obu, J.; Westermann, S.; Bartsch, A.; Berdnikov, N.; Christiansen, H.; Dashtseren, A.; Delaloye, R.; Elberling, B.; Etzelmüller, B.; Kholodov, A.; et al. Northern Hemisphere permafrost map based on TTOP modelling for 2000–2016 at 1 km2 scale. Earth Sci. Rev. 2019, 193, 299–316. [Google Scholar] [CrossRef]
  3. Delaloye, R.; Lambiel, C.; Gärtner-Roer, I. Overview of rock glacier kinematics research in the Swiss Alps: Seasonal rhythm, interannual variations and trends over several decades. Geogr. Helv. 2010, 65, 135–145. [Google Scholar] [CrossRef]
  4. Haeberli, W.; Hallet, B.; Arenson, L.; Elconin, R.; Humlum, O.; Kääb, A.; Kaufmann, V.; Ladanyi, B.; Matsuoka, N.; Springman, S.; et al. Permafrost Creep and Rock Glacier Dynamics. Permafr. Periglac. Process. 2006, 17, 189–214. [Google Scholar] [CrossRef]
  5. Kääb, A. Remote sensing of permafrost-related problems and hazards. Permafr. Periglac. Process. 2008, 19, 107–136. [Google Scholar] [CrossRef]
  6. Hock, R.; Rasul, G.; Adler, C.; Cáceres, B.; Gruber, S.; Hirabayashi, Y.; Jackson, M.; Kääb, A.; Kang, S.; Kutuzov, S.; et al. High Mountain Areas. In IPCC Special Report on Ocean and the Cryosphere in a Changing Climate (SROCC); IPCC: Geneva, Switzerland, 2019. [Google Scholar]
  7. Azócar, G.F.; Brenning, A. Hydrological and geomorphological significance of rock glaciers in the dry Andes, Chile (27°–33°S). Permafr. Periglac. Process. 2010, 21, 42–53. [Google Scholar] [CrossRef]
  8. Anderson, R.S.; Anderson, L.S.; Armstrong, W.H.; Rossi, M.W.; Crump, S.E. Glaciation of alpine valleys: The glacier—Debris-covered glacier—Rock glacier continuum. Geomorphology 2018, 311, 127–142. [Google Scholar] [CrossRef]
  9. Jones, D.B.; Harrison, S.; Anderson, K.; Whalley, W.B. Rock glaciers and mountain hydrology: A review. Earth Sci. Rev. 2019, 193, 66–90. [Google Scholar] [CrossRef]
  10. Humlum, O. Origin of Rock Glaciers: Observations from Mellemfjord, Disko Island, Central West Greenland. Permafr. Periglac. Process. 1996, 7, 361–380. [Google Scholar] [CrossRef]
  11. Degenhardt, J.J., Jr. Development of tongue-shaped and multilobate rock glaciers in alpine environments—Interpretations from ground penetrating radar surveys. Geomorphology 2009, 109, 94–107. [Google Scholar] [CrossRef]
  12. Humlum, O. Rock glacier types on Disko, central West Greenland. Geogr. Tidsskr. Dan. J. Geogr. 1982, 82, 59–66. [Google Scholar] [CrossRef]
  13. Martin, H.E.; Whalley, W.B. Rock glaciers part 1: Rock glacier morphology: Classification and distribution. Prog. Phys. Geogr. Earth Environ. 1987, 11, 260–282. [Google Scholar] [CrossRef]
  14. Delaloye, R.; Staub, B. Seasonal variations of rock glacier creep: Time series observations from the Western Swiss Alps. In Proceedings of the International Conference on Book of Abstracts, Potsdam, Germany, 20–24 June 2016. [Google Scholar]
  15. Kaufmann, V.; Kellerer-Pirklbauer, A. Active Rock Glaciers in a Changing Environment. Geomorphometric Quantification and Cartographic Presentation of Rock Glacier Surface Change with Examples from the Hohe Tauern Range, Austria. In Mountain Cartography. 16 Years ICA Commission on Mountain Cartography (1999–2015) Wiener Schriften zur Geographie und Kartographie, 21; Institut für Geographie und Regionalforschung, Universität Wien: Wien, Austria, 2015; pp. 179–190. ISBN 978-3-900830-86-1. [Google Scholar]
  16. Staub, B.; Lambiel, C.; Delaloye, R. Rock glacier creep as a thermally-driven phenomenon: A decade of inter-annual observations from the Swiss Alps. In Proceedings of the International Conference on Permafrost—Book of Abstracts, Potsdam, Germany, 20–24 June 2016. [Google Scholar]
  17. Eriksen, H.; Rouyet, L.; Lauknes, T.R.; Berthling, I.; Isaksen, K.; Hindberg, H.; Larsen, Y.; Corner, G. Recent Acceleration of a Rock Glacier Complex, Ádjet, Norway, Documented by 62 Years of Remote Sensing Observations. Geophys. Res. Lett. 2018. [Google Scholar] [CrossRef] [Green Version]
  18. PERMOS. Permafrost in Switzerland 2010/2011 to 2013/2014; Noetzli, J., Luethi, R., Staub, B., Eds.; Glaciological Report (Permafrost) No. 12–15; Cryospheric Commission of the Swiss Academy of Sciences: Bern, Switzerland, 2016. [Google Scholar]
  19. Delaloye, R.; Perruchoud, E.; Avian, M.; Kaufmann, V.; Bodin, X.; Hausmann, H.; Ikeda, A.; Kääb, A.; Kellerer-Pirklbauer, A.; Krainer, K.; et al. Recent interannual variations of rock glacier creep in the European Alps. In Proceedings of the 9th International Conference on Permafrost, Fairbanks, AK, USA, 29 June–3 July 2008. [Google Scholar]
  20. Kellerer-Pirklbauer, A.; Delaloye, R.; Lambiel, C.; Gärtner-Roer, I.; Kaufmann, V.; Scapozza, C.; Krainer, K.; Staub, B.; Thibert, E.; Bodin, X.; et al. Interannual variability of rock glacier flow velocities in the European Alps. In Proceedings of the 5th European Conference on Permafrost (EUCOP5-2018), Chamonix, France, 23 June–1 July 2018. [Google Scholar]
  21. Ikeda, A.; Matsuoka, N.; Kääb, A. Fast deformation of perennially frozen debris in a warm rock glacier in the Swiss Alps: An effect of liquid water. J. Geophys. Res. 2008, 113, F01021. [Google Scholar] [CrossRef] [Green Version]
  22. Cicoira, A.; Beutel, J.; Faillettaz, J.; Gärtner-Roer, I.; Vieli, A. Resolving the influence of temperature forcing through heat conduction on rock glacier dynamics: A numerical modelling approach. Cryosphere 2019, 13, 927–942. [Google Scholar] [CrossRef] [Green Version]
  23. Kääb, A.; Frauenfelder, R.; Roer, I. On the response of rockglacier creep to surface temperature increases. Glob. Planet. Chang. 2007, 56, 172–187. [Google Scholar] [CrossRef]
  24. Rignot, E.; Hallet, B.; Fountain, A. Rock glacier surface motion in Beacon Valley, Antarctica, from synthetic-aperture radar interferometry. Geophys. Res. Lett. 2002. [Google Scholar] [CrossRef] [Green Version]
  25. Kenyi, L.W.; Kaufmann, V. Estimation of rock glacier surface deformation using SAR interferometry data. IEEE Trans. Geosci. Remote Sens. 2003, 41, 1512–1515. [Google Scholar] [CrossRef]
  26. Strozzi, T.; Kääb, A.; Frauenfelder, R. Detecting and quantifying mountain permafrost creep from in situ inventory, space-borne radar interferometry and airborne digital photogrammetry. Int. J. Rem. Sens. 2004, 25, 2919–2931. [Google Scholar] [CrossRef]
  27. Liu, L.; Millar, C.I.; Westfall, R.D.; Zebker, H.A. Surface motion of active rock glaciers in the Sierra Nevada, California, USA: Inventory and a case study using InSAR. Cryosphere 2013, 7, 1109. [Google Scholar] [CrossRef] [Green Version]
  28. Lilleøren, K.; Etzelmüller, B.; Gärtner-Roer, I.; Kääb, A.; Westermann, S.; Gudmundsson, A. The Distribution, Thermal Characteristics and Dynamics of Permafrost in Trollaskagi, Northern Iceland, as Inferred from the Distribution of Rock Glaciers and Ice-Cored Moraines. Permafr. Periglac. Process. 2013, 24, 322–335. [Google Scholar] [CrossRef]
  29. Barboux, C.; Delaloye, R.; Lambiel, C. Inventorying slope movements in an Alpine environment using DinSAR. Earth Surf. Process. Landf. 2014, 39, 2087–2099. [Google Scholar] [CrossRef] [Green Version]
  30. Rick, B.; Delaloye, R.; Barboux, C.; Strozzi, T. Detection and inventorying of slope movements in the Brooks Range, Alaska using DInSAR: A test study. In Proceedings of the GEOQuébec 2015: 68th Canadian Geotechnical Conference and 7th Canadian Permafrost Conference, Quebec City Convention Centre, Québec, QC, Canada, 20–23 September 2015. [Google Scholar]
  31. Necsoiu, M.; Onaca, A.; Wigginton, S.; Urdea, P. Rock glacier dynamics in Southern Carpathian Mountains from high-resolution optical and multi-temporal SAR satellite imagery. Remote Sens. Environ. 2016, 177, 21–36. [Google Scholar] [CrossRef] [Green Version]
  32. Wang, X.; Liu, L.; Zhao, L.; Wu, T.; Li, Z.; Liu, G. Mapping and inventorying active rock glaciers in the northern Tien Shan of China using satellite SAR interferometry. Cryosphere 2017, 11, 997–1014. [Google Scholar] [CrossRef] [Green Version]
  33. Villarroel, C.D.; Tamburini Beliveau, G.; Forte, A.P.; Monserrat, O.; Morvillo, M. DInSAR for a Regional Inventory of Active Rock Glaciers in the Dry Andes Mountains of Argentina and Chile with Sentinel-1 Data. Remote Sens. 2018, 10, 1588. [Google Scholar] [CrossRef] [Green Version]
  34. Torres, R.; Snoeij, P.; Geudtner, D.; Bibby, D.; Davidson, M.; Attema, E.; Potin, P.; Rommen, B.; Floury, N.; Brown, M.; et al. GMES Sentinel-1 mission. Remote Sens. Environ. 2012, 120, 9–24. [Google Scholar] [CrossRef]
  35. Strozzi, T.; Murray, T.; Wegmüller, U.; Werner, C. Glacier Motion Estimation Using SAR Offset-Tracking Procedures. IEEE Trans. Geosci. Remote Sens. 2002, 40, 2384–2391. [Google Scholar] [CrossRef] [Green Version]
  36. Paul, P.; Bolch, T.; Briggs, K.; Kääb, A.; McMillan, M.; McNabb, R.; Nagler, T.; Nuth, C.; Rastner, P.; Strozzi, T.; et al. Error sources and guidelines for quality assessment of glacier area, elevation change, and velocity products derived from satellite data. Remote Sens. Environ. 2017, 203, 256–275. [Google Scholar] [CrossRef] [Green Version]
  37. Barboux, C.; Strozzi, T.; Delaloye, R.; Wegmüller, U.; Collet, C. Mapping slope movements in Alpine environments using TerraSAR-X interferometric methods. J. Photogramm. Remote Sens. 2015, 109, 178–192. [Google Scholar] [CrossRef] [Green Version]
  38. Delaloye, R.; Morand, S. Du Val Ferret au Grand-Combin (Alpes Valaisannes): Inventaire des glaciers rocheux et analyse spatiale du pergélisol à l’aide d’un système d’information géographique (IDRISI). Master’s Thesis, University of Fribourg, Fribourg, Switzerland, 1997. [Google Scholar]
  39. Lambiel, C.; Reynard, E. Cartographie de la distribution du pergélisol et datation des glaciers rocheux dans la région du Mont Gelé (Valais). In Entwicklungstendenzen und Zukunftsperspektiven in der Geomorphologie; Physische Geographie: 91–103; Universität Zürich, Geographisches Institut: Zürich, Switzerland, 2003. [Google Scholar]
  40. Delaloye, R.; Strozzi, T.; Lambiel, C.; Barboux, C.; Mari, S.; Stocker, A.; Techel, F.; Raetzo, H. The contribution of InSAR data to the early detection of potentially hazardous active rock glaciers in mountain areas. In Proceedings of the ESA Living Planet Symposium 2010, Bergen, Norway, 28 June–2 July 2010. [Google Scholar]
  41. Marcer, M.; Serrano, C.; Brenning, A.; Bodin, X.; Goetz, J.; Schoeneich, P. Evaluating the destabilization susceptibility of active rock glaciers in the French Alps. Cryosphere 2019, 13, 141–155. [Google Scholar] [CrossRef] [Green Version]
  42. Kummert, M.; Delaloye, R. Mapping and quantifying sediment transfer between the front of rapidly moving rock glaciers and torrential gullies. Geomorphology 2018, 309, 60–76. [Google Scholar] [CrossRef]
  43. Delaloye, R.; Lambiel, C. Suivis par GPS et webcam de glaciers rocheux à mouvement rapide. In Monitoring En Milieux Naturels—Retours D’expériences En Terrains Difficiles; Collection EDYTEM 19, Presses universitaires Savoie Mont Blanc: Le Bourget du Lac, France, 2017; pp. 37–46. [Google Scholar]
  44. Wirz, V.; Beutel, J.; Gruber, S.; Gubler, S.; Purves, R.S. Estimating velocity from noisy GPS data for investigating the temporal variability of slope movements. Nat. Hazards Earth Syst. Sci. 2014, 14, 2503–2520. [Google Scholar] [CrossRef] [Green Version]
  45. Papke, J.; Strozzi, T.; Tate, N. Mapping Land Surface Displacements in the Swiss Alps with Radar Interferometry. In Earth Observation for Land and Emergency Monitoring; Balzter, H., Ed.; John Wiley & Sons, Ltd: Chichester, UK, 2017. [Google Scholar] [CrossRef]
  46. Yde, J.C.; Knudsen, N.T. 20th-century glacier fluctuations on Disko Island (Qeqertarsuaq), Greenland. Ann. Glaciol. 2007, 46, 209–214. [Google Scholar] [CrossRef] [Green Version]
  47. Porter, C.; Morin, P.; Howat, I.; Noh, M.-J.; Bates, B.; Peterman, K.; Keesey, S.; Schlenk, M.; Gardiner, J.; Tomko, K.; et al. ArcticDEM, Harvard Dataverse, V1 2018. Available online: https://doi.org/10.7910/DVN/OHHUKH (accessed on 20 November 2019).
  48. Hollesen, J.; Buchwal, A.; Rachlewicz, G.; Hansen, B.U.; Hansen, M.O.; Stecher, O.; Elberling, B. Winter warming as an important co-driver for Betula nana growth in western Greenland during the past century. Glob. Chang. Biol. 2015, 21, 2410–2423. [Google Scholar] [CrossRef] [Green Version]
  49. Geological Map of Greenland 1: 500,000; Søndre Strømfjord (Nûgssuaq) (Sheet 3): 55.67 (Grønlands geologi og palæontologi i alm.); Geological Survey of Denmark and Greenland: København, Denmark, 1997.
  50. Pourrier, J.; Jourde, H.; Kinnard, C.; Gascoin, S.; Monnier, S. Glacier meltwater flow paths and storage in a geomorphologically complex glacial foreland: The case of the Tapado glacier, dry Andes of Chile (30°S). J. Hydrol. 2014, 519, 1068–1083. [Google Scholar] [CrossRef]
  51. Azócar, G.F.; Brenning, A.; Bodin, X. Permafrost distribution modelling in the semi-arid Chilean Andes. Cryosphere 2017, 11, 877–890. [Google Scholar] [CrossRef] [Green Version]
  52. Falvey, M.; Garreaud, R.D. Regional cooling in a warming world: Recent temperature trends in the southeast Pacific and along the west coast of subtropical South America (1979–2006). J. Geophys. Res. 2009, 114. [Google Scholar] [CrossRef]
  53. Schrott, L. The hydrological significance of high mountain permafrost and its relation to solar radiation. A case study in the high Andes of San Juan, Argentina. Bamberger Geographische Schriften, Bd. 1998, 15, 71–84. [Google Scholar]
  54. Monnier, S.; Kinnard, C. Reconsidering the glacier to rock glacier transformation problem: New insights from the central Andes of Chile. Geomorphology 2015, 238. [Google Scholar] [CrossRef]
  55. Schaffer, N.; MacDonell, S.; Réveillet, M.; Yáñez, E.; Valois, R. Rock glaciers as a water resource in a changing climate in the semiarid Chilean Andes. Reg. Environ. Chang. 2019. [Google Scholar] [CrossRef]
  56. Arenson, L.; Matthias, J. The significance of rock glaciers in the dry Andes—A discussion of Azócar and Brenning (2010) and Brenning and Azócar (2010). Permafr. Periglac. Process. 2010, 21, 282–285. [Google Scholar] [CrossRef]
  57. Brenning, A. The Impact of Mining on Rock Glaciers. In Darkening Peaks: Glacier Retreat, Science, and Society; Orlove, B.S., Wiegandt, E., Luckman, B., Eds.; University of California Press: Berkeley, CA, USA, 2008; Chapter 14; pp. 196–205. [Google Scholar]
  58. IANIGLA. Inventario Nacional de Glaciares Y Ambiente Periglacial: Fundamentos Y Cronograma de Ejecución; IANIGLA: Mendoza, Argentina, 2010. [Google Scholar]
  59. UGP-UC. Dinámica de Glaciares Rocosos En El Chile Semiárido. Unidad de glaciología y nieves; DGA/MOP; UGP-UC: Santiago, Chile, 2011. [Google Scholar]
  60. Trombotto, D.; Borzotta, E. Indicators of present global warming through changes in active layer-thickness, estimation of thermal diffusivity and geomorphological observations in the Morenas Coloradas rockglacier, Central Andes of Mendoza, Argentina. Cold Reg. Sci. Technol. 2009, 55, 321–330. [Google Scholar] [CrossRef]
  61. Bodin, X.; Krysiecki, J.-M.; Iribarren Anacona, P. Recent collapse of rock glaciers: Two study cases in the Alps and in the Andes. In Proceedings of the 12th Congress INTERPRAEVENT, Grenoble, France, 23–26 April 2012; pp. 2–3. [Google Scholar]
  62. CEAZA. Caracterización Y Monitoreo De Glaciares Rocosos En La Cuenca Del Río Elqui, Y Balance De Masa Del Glaciar Tapado; MOP-DGA: Santiago, Chile, 2012. [Google Scholar]
  63. Vivero, S.; MacDonell, S.; Bodin, X.; Robson, B.; Schaffer, N.; Lambiel, C. Debris-covered glacier and rock glacier kinematics in the Chilean Andes (30°S), documented by 64 years of remote sensing and in situ observations. In Proceedings of the 1st Southern Hemisphere Conference on Permafrost 2019, Queenstown, New Zealand, 4–14 December 2019. [Google Scholar]
  64. Halla, C.; Blöthe, J.; Tapia Baldis, C.; Trombotto, D.; Hilbich, C.; Hauck, C.; Schrott, L. Ice content and interannual water storage changes of an active rock glacier in the dry Andes of Argentina. Cryosphere. (submitted).
  65. Bodin, X.; Echelard, T.; Lacroix, P.; Strozzi, T. Regional evaluation of rock glacier activity in the semi-arid Andes using optical and radar satellite imagery. In Proceedings of the 5th European Conference on Permafrost 2018, Book of Abstract, Laboratoire EDYTEM, Chamonix, France, 23 June–1 July 2018; pp. 386–387. [Google Scholar]
  66. Bamler, R.; Hartl, P. Synthetic aperture radar interferometry. Inverse Probl. 1998, 14, R1–R54. [Google Scholar] [CrossRef]
  67. Rosen, P.; Hensley, S.; Joughin, I.; Li, F.; Madsen, S.; Rodriguez, E.; Goldstein, R. Synthetic aperture radar interferometry. Proc. IEEE 2000, 88, 333–382. [Google Scholar] [CrossRef]
  68. Strozzi, T.; Delaloye, R.; Kääb, A.; Ambrosi, C.; Perruchoud, E.; Wegmüller, U. Combined observations of rock mass movements using satellite SAR inteferometry, differential GPS, airborne digital photogrammetry, and airborne photography interpretation. J. Geophys. Res. 2010, 115, F01014. [Google Scholar] [CrossRef] [Green Version]
  69. De Zan, F.; Guarnieri, A. TOPSAR: Terrain Observation by Progressive Scans. IEEE Trans. Geosci. Remote Sens. 2006, 44, 2352–2360. [Google Scholar] [CrossRef]
  70. Nemoto, Y.; Nishino, H.; Ono, M.; Mizutamari, H.; Nishikawa, K.; Tanaka, K. Japanese earth resources satellite-1 synthetic aperture radar. Proc. IEEE 1991, 79, 800–809. [Google Scholar] [CrossRef]
  71. Pitz, W.; Miller, D. The TerraSAR-X satellite. IEEE Trans. Geosci. Remote Sens. 2010, 48, 615–622. [Google Scholar] [CrossRef]
  72. Werner, C.; Wegmüller, U.; Strozzi, T.; Wiesmann, A. Gamma SAR and interferometric processing software. In Proceedings of the ERS-ENVISAT Symposium, Gothenburg, Sweden, 16–20 October 2000. [Google Scholar]
  73. Wessel, B. TanDEM-X Ground Segment—DEM Products Specification Document, EOC, DLR, Oberpfaffenhofen, Germany, Public Document TD-GS-PS-0021, Issue 3.1. 2016. Available online: https://tandemx-science.dlr.de (accessed on 5 July 2018).
  74. Wegmüller, U.; Werner, C.; Strozzi, T.; Wiesmann, A.; Frey, O.; Santoro, M. Sentinel-1 Support in the GAMMA Software. Procedia Comput. Sci. 2016, 100, 1305–1312. [Google Scholar] [CrossRef] [Green Version]
  75. Strozzi, T.; Farina, P.; Corsini, A.; Ambrosi, C.; Thüring, M.; Zilger, J.; Wiesmann, A.; Wegmüller, U.; Werner, C. Survey and monitoring of landslide displacements by means of L-band satellite SAR interferometry. Landslides 2005, 2, 193–201. [Google Scholar] [CrossRef]
  76. Gray, L.; Mattar, K.; Vachon, P. InSAR Results from the RADARSAT Antarctic Mapping Mission: Estimation of Glacier Motion Using A Simple Registration Procedure. IEEE IGARSS’98 Proceedings; IEEE: Seattle, WA, USA, 1998. [Google Scholar]
  77. Paul, P.; Bolch, T.; Kääb, A.; Nagler, T.; Nuth, C.; Scharrer, K.; Shepherd, A.; Strozzi, T.; Ticconi, F.; Bhambri, R.; et al. The glaciers climate change initiative: Methods for creating glacier area; elevation change and velocity products. Remote Sens. Environ. 2015, 162, 408–426. [Google Scholar] [CrossRef] [Green Version]
  78. Werner, C.; Wegmüller, U.; Strozzi, T.; Wiesmann, A. Precision estimation of local offsets between SAR SLCs and detected SAR images. In Proceedings of the IGARSS 2005, Seoul, Korea, 25–29 July 2005. [Google Scholar]
  79. Virelli, M.; Coletta, A.; Battagliere, M.L. ASI COSMO-SkyMed: Mission Overview and Data Exploitation. IEEE Geosci. Remote Sens. Mag. 2014, 2, 64–66. [Google Scholar] [CrossRef]
  80. Crosetto, M.; Monserrat, O.; Bremmer, C.; Hanssen, R.; Capes, R.; Marsh, S. Ground motion monitoring using SAR interferometry: Quality assessment. Eur. Geol. 2009, 26, 12–15. [Google Scholar]
  81. Sandwell, D.; Myer, D.; Mellors, R.; Shimada, M.; Brooks, B.; Foster, J. Accuracy and Resolution of ALOS Interferometry: Vector Deformation Maps of the Father’s Day Intrusion at Kilauea. IEEE Trans. Geosci. Remote Sens. 2008, 46, 3524–3534. [Google Scholar] [CrossRef] [Green Version]
  82. Lambiel, C.; Delaloye, R. Contribution of real-time kinematic GPS in the study of creeping mountain permafrost: Examples from the Western Swiss Alps. Permafr. Periglac. Process. 2004, 15, 229–241. [Google Scholar] [CrossRef]
  83. Kääb, A.; Vollmer, M. Surface geometry, thickness changes and flow fields on creeping mountain permafrost: Automatic extraction by digital image analysis. Permafr. Periglac. Process. 2000, 11, 315–326. [Google Scholar] [CrossRef] [Green Version]
  84. Debella-Gilo, M.; Kääb, A. Sub-pixel precision image matching for measuring surface displacements on mass movements using normalized cross-correlation. Remote Sens. Environ. 2010, 115, 130–142. [Google Scholar] [CrossRef] [Green Version]
  85. Global Terrestrial Network for Permafrost (GTN-P). Available online: https://gtnp.arcticportal.org (accessed on 22 May 2019).
  86. Kellerer-Pirklbauer, A.; Kaufmann, V. About the relationship between rock glacier velocity and climate parameters in central Austria. Austrian J. Earth Sci. 2012, 105, 94–112. [Google Scholar]
  87. Sorg, A.; Kääb, A.; Roesch, A.; Bigler, C.; Stoffel, M. Contrasting responses of Central Asian rock glaciers to global warming. Sci. Rep. 2015, 5, 8228. [Google Scholar] [CrossRef] [Green Version]
  88. Delaloye, R.; Barboux, C.; Bodin, X.; Brenning, A.; Hartl, L.; Hu, Y.; Ikeda, A.; Kaufmann, V.; Kellerer-Pirklbauer, A.; Lambiel, C.; et al. Rock glacier inventories and kinematics: A new IPA Action Group. In Proceedings of the 5th European Conference on Permafrost (EUCOP5-2018), Chamonix, France, 23 June–1 July 2018. [Google Scholar]
Figure 1. (a) Distelhorn rock glacier, Mattertal (Switzerland, 7°52′E 46°11′N). Photo, J. Papke (2012); (b) Tsarmine rock glacier, Val d’Arolla (Switzerland, 7°30′E 46°03′N). Photo, S. Morand (2005); (c) Becs-de-Besson rock glacier, Val de Réchy (Switzerland, 7°31′E 46°10′N). Photo, R. Delaloye (2011); (d) Manissuarsuk rock glacier, Qeqertarsuaq (Western Greenland, 52°37′W 69°53′N). Photo, E. Mätzler (2009); (e) Dos Lenguas rock glacier, Andes (Argentina, 69°47′W 30°15′S). Photo, L. Schrott (1991).
Remotesensing 12 00559 g001
Figure 2. (a) Distelhorn rock glacier (Mattertal, Switzerland) with position of the time series of Figure 3 (black dot), image data are from Google, DigitalGlobe; (b) Sentinel-1 interferogram from 12.08.2016 to 24.08.2016, 2π ⇔ 2.8 cm; (c) Sentinel-1 interferogram from 02.08.2018 to 08.08.2018, 2π ⇔ 2.8 cm; (d) Sentinel-1 line-of-sight displacement in cm from 02.08.2018 to 08.08.2018; (e) JERS-1 interferogram from 21.06.1996 to 17.09.1996, 2π ⇔ 11.8 cm; (f) TerraSAR-X interferogram from 04.09.2012 to 15.09.2012, 2π ⇔ 1.6 cm; (g) Displacement in m along the terrain surface from TerraSAR-X offset tracking from 15.09.2012 to 22.09.2014. The black arrow indicates the satellite line-of-sight.
Remotesensing 12 00559 g002
Figure 3. Distelhorn rock glacier (Mattertal, Switzerland). (a) Velocity along the maximum slope direction from JERS-1, TerraSAR-X, and Sentinel-1 InSAR and velocity along the terrain surface from TerraSAR-X offset tracking, for position see Figure 2a; (b) Enlargement from Sentinel-1 InSAR. Grey indicates 12 day time interval and black indicates 6 day time interval.
Remotesensing 12 00559 g003
Figure 4. (a) Tsarmine rock glacier (Val d’Arolla, Switzerland) with positions of the GNSS stations used for offset tracking validation (white dots), of the Cosmo-SkyMed offset tracking time series of Figure 5a (dotted square) and of the Sentinel-1 InSAR time series of Figure 5b (black dot), image data are from Google, DigitalGlobe; (b) Displacement along the terrain surface from Cosmo-SkyMed offset tracking from 27.08.2010 to 14.08.2011; (c) Cosmo-SkyMed interferogram from 15.09.2017 to 24.09.2017, 2π ⇔ 1.6 cm; (d) Sentinel-1 interferogram from 24.09.2017 to 30.09.2017, 2π ⇔ 2.8 cm. The black arrow indicates the satellite line-of-sight.
Remotesensing 12 00559 g004
Figure 5. Tsarmine rock glacier (Val d’Arolla, Switzerland). (a) Velocity along the terrain surface from Cosmo-SkyMed offset tracking; (b) Velocity along the maximum slope direction from Sentinel-1 InSAR. Grey indicates 12 day time interval and black indicates 6 day time interval. For positions see Figure 4a.
Remotesensing 12 00559 g005
Figure 6. (a) Becs-de-Besson rock glacier (Val de Réchy, Switzerland) with positions of the two permanent GNSS stations used for validation (BdB1 and BdB2) and of the Sentinel-1 InSAR time series of Figure 7 (BdB3), image data are from Google, DigitalGlobe; (b) TerraSAR-X interferogram from 01.10.2012 to 12.10.2012, 2π ⇔ 1.6 cm; (c) Sentinel-1 interferogram from 07.09.2018 to 13.09.2018, 2π ⇔ 2.8 cm. The black arrow indicates the satellite line-of-sight.
Remotesensing 12 00559 g006
Figure 7. Becs-de-Besson rock glacier (Val de Réchy, Switzerland). Velocity along the maximum slope direction from Sentinel-1 InSAR. Grey indicates 12 day time interval and black indicates 6 day time interval. For position see BdB3 on Figure 6a.
Remotesensing 12 00559 g007
Figure 8. (a) Manissuarsuk rock glacier (Qeqertarsuaq, Western Greenland) with position of the Sentinel-1 InSAR time series of Figure 9 (black dot), image data are from Google, DigitalGlobe; (b) Sentinel-1 interferogram from 24.01.2019 to 30.01.2019, 2π⇔ 2.8 cm. The white arrow indicates the satellite line-of-sight.
Remotesensing 12 00559 g008
Figure 9. Velocity along the maximum slope direction at the front of Manissuarsuk rock glacier (Qeqertarsuaq, Western Greenland) from Sentinel-1 InSAR. Grey indicates 12 day time interval and black indicates 6 day time interval. For position see Figure 8a.
Remotesensing 12 00559 g009
Figure 10. (a) Dos Lenguas rock glacier (Argentinian Andes) with position of the Sentinel-1 InSAR time series of Figure 11 (black dot), image data are from Google, DigitalGlobe; (b) Sentinel-1 interferogram from 21.04.2017 to 27.04.2017, 2π ⇔ 2.8 cm. The white arrow indicates the satellite line-of-sight.
Remotesensing 12 00559 g010
Figure 11. Velocity along the maximum slope direction at the front of Dos Lenguas rock glacier (Argentinian Andes) from Sentinel-1 InSAR. Light grey indicates 24 days, grey indicates 12 days, and black indicates 6 day time intervals. For position see black circle in Figure 10a.
Remotesensing 12 00559 g011
Figure 12. (a) Three-dimensioanl (3D) GNSS velocities computed with the average daily positions corresponding to the acquisition dates of the Sentinel-1 acquisitions (red diamonds) and velocity along the maximum slope direction from Sentinel-1 InSAR (grey 12 day time interval, black 6 day time interval) at GNSS station BdB2 over Becs-de-Besson rock glacier (Val de Réchy, Switzerland, for position see Figure 6); (b) Scatter plot of GNSS and Sentinel-1 InSAR velocities.
Remotesensing 12 00559 g012
Figure 13. (a) 3D velocities using GNSS campaigns carried out seasonally (blue diamonds), 3D GNSS scaled velocities (factor 0.54) from the permanent station computed with the average daily positions corresponding to the acquisition dates of the Sentinel-1 acquisitions (red triangles) and velocity along the maximum slope direction from Sentinel-1 InSAR (grey 12 day time interval, black 6 day time interval) over the Tsarmine rock glacier (Val d’Arolla, Switzerland, for position see Figure 4a); (b) Scatter plot of the scaled GNSS and Sentinel-1 InSAR velocities.
Remotesensing 12 00559 g013
Figure 14. Distelhorn rock glacier (Mattertal, Switzerland). (a) Sentinel-1 InSAR line-of-sight velocity map from 02.08.2018 to 08.08.2018; (b) Horizontal velocity map from matching of aerial optical images with a spatial resolution of 0.15 m acquired on 03.09.2014 and 21.09.2017; (c) Difference map between aerial photo matching and Sentinel-1 InSAR LOS velocities.
Remotesensing 12 00559 g014
Figure 15. Distelhorn rock glacier (Mattertal, Switzerland). (a) Scatter plot of the horizontal velocities from matching of aerial optical images between 03.09.2014 and 21.09.2017 and of Sentinel-1 InSAR line-of-sight velocities from 02.08.2018 to 08.08.2018; (b) Scatter plot of the aerial photo matching and scaled (factor −1.23) Sentinel-1 InSAR velocities. The lines indicate the 1:1 matching and the −2π and +2π ambiguities.
Remotesensing 12 00559 g015
Figure 16. Distelhorn rock glacier (Mattertal, Switzerland). (a) Horizontal velocity map from TerraSAR-X offset tracking between 11.09.2014 and 06.09.2016; (b) Horizontal velocity map from matching of aerial optical images with a spatial resolution of 0.15 m acquired on 03.09.2014 and 21.09.2017; (c) Difference map between aerial photo matching and TerraSAR-X offset tracking velocities.
Remotesensing 12 00559 g016
Figure 17. Distelhorn rock glacier (Mattertal, Switzerland). Scatter plot of the horizontal velocities from matching of aerial optical images between 03.09.2014 and 21.09.2017 and TerraSAR-X offset tracking between 11.09.2014 and 06.09.2016.
Remotesensing 12 00559 g017
Figure 18. (a) Horizontal velocities from GNSS campaigns carried out seasonally (grey line) and Cosmo-SkyMed offset tracking (black stars) on the central sector of the Tsarmine rock glacier (Val d’Arolla, Switzerland, for position see Figure 4); (b) Scatter plot of GNSS and Cosmo-SkyMed offset tracking horizontal velocities.
Remotesensing 12 00559 g018
Table 1. Overview of sensors, acquisition modes, time periods, and pixel resolution.
Study
Region
Satellite
Sensor
Acquisition ModeNominal Acquisition
Time Interval
Time
Period
Pixel Resolution
(range × azimuth)
Western Swiss AlpsJERS-1Stripmap44 days19968.8 m × 4.5 m
TerraSAR-XStripmap11 days2008–20161.4 m × 2.0 m
Cosmo-SkyMedStripmap16 days2009–20171.0 m × 2.3 m
Sentinel-1TOPS IWS6 days2015–20192.3 m × 13.9 m
QeqertarsuaqSentinel-1TOPS IWS6 days2015–20192.3 m × 13.9 m
Tapado/Agua NegraSentinel-1TOPS IWS12 days2015–20192.3 m × 13.9 m

