Abstract
Targeted energy management and control is becoming an increasing concern in the building sector. Automatic analyses of thermal data, which minimize the subjectivity of the assessment and allow for large-scale inspections, are therefore of high interest. In this study, we propose an approach for a supervised extraction of façade openings (windows and doors) from photogrammetric 3D point clouds attributed to RGB and thermal infrared (TIR) information. The novelty of the proposed approach is in the combination of thermal information with other available characteristics of data for a classification performed directly in 3D space. Images acquired in visible and thermal infrared spectra serve as input data for the camera pose estimation and the reconstruction of 3D scene geometry. To investigate the relevance of different information types to the classification performance, a Random Forest algorithm is applied to various sets of computed features. The best feature combination is then used as an input for a Conditional Random Field that enables us to incorporate contextual information and consider the interaction between the points. The evaluation executed on a per-point level shows that the fusion of all available information types together with context consideration allows us to extract objects with 90% completeness and 95% correctness. A respective assessment executed on a per-object level shows 97% completeness and 88% accuracy.
1. Introduction
Energy efficiency in buildings is a multifaceted topic that has gained great attention in the last decade. Various national regulations have led to the creation of technical standards designed to make energy consumption transparent and optimized. To execute the legislation resolutions, existing buildings require inspections of their energy distribution. The most widely used technique for the performance of energy studies in built-up areas is infrared thermography. The method detects the infrared energy emitted from an object, converts it to temperature, and displays an intensity color-coded image of temperature distribution. Thermal infrared (TIR) images enable us to visualize different thermal faults such as air infiltrations or moisture areas and to detect damages to the building structure; for example, cracks, delamination, or loose tiling. Depending on the final aim of energy auditing, thermal data can be collected in an indoor environment [1,2] or by outdoor measurements including airborne platforms [3] and close-range techniques [4]. A broad review of various infrared thermography applications for building diagnostics is presented in Kylili et al. [5].
Established thermographic building inspection procedures are performed on-site by a human operator. Such interpretation is not only time consuming, but also highly depends on the expertise of the operator. Hence, the current trend in building energy audits has led to an automatic interpretation of TIR data, minimizing subjectivity of the assessment and allowing large-scale inspections. To provide a spatial reference for thermal images and to facilitate their interpretation, thermal measurements are often integrated with other data sources. The complementary geometric information often comes from laser scanning [6,7], photogrammetric spectral imagery [8,9] or existing building models [10]. Meanwhile, sensor solutions are also now available that offer a laser scanner with integrated thermal camera technology (Leica BLK360). It is worthy of note that there are also new, professional plug-on modules in the market of thermal imaging devices to upgrade a smartphone to a low-cost infrared camera (e.g., the FLIR ONE pro).
The georeferenced TIR images enable us to analyze thermal data, to extract corresponding information, and to map them to the 3D space. Considering an understanding of an automatic façade for energy saving, the literature focuses on the automatic detection of thermal leakages, windows, and other structures, which is performed for 2D textures with a reference to the building. In Hoegner and Stilla [11], heat leakages on building façades are detected using a region-growing algorithm applied to a strong image gradient. The outcomes of the work show that the presence of windows and doors in the analyzed image influences the automatic investigation of a façade state and leads to false results. Since glass in thermal data reflects the temperature of the surroundings, the captured windows do not present the real temperature of the façade but relate to the temperature of the sky and neighboring objects. Therefore, an automatic classification of these façade objects and their removal from the input data is of great importance for the reliable accuracy of the following thermal inspection. A procedure for window detection in thermal texture images presented by Iwaszczuk et al. [12] starts with image segmentation using local dynamic thresholds. Masked correlation for corner detection is then applied in order to detect the position and the size of the extracted rectangular bounding box. To detect windows and doors from rectified thermal images, the research described in Sirmacek et al. [13] used L-shaped features and perceptual organization rules. When the detected objects are removed from a wall, heat leakage areas on the investigated façade are marked by applying the region-growing algorithm at local maximum values of the façade surface. In the work by Michaelsen et al. [14], the authors present an attempt at window detection using gestalt grouping. For this purpose, structural knowledge about façade objects, such as their hierarchy, geometry and mutual relations, is coded in a declarative way using two different systems of production rules.
In the literature, the performance assessment of object detection methods that use TIR information is mostly limited to visual evaluation. Numerical statistics for unsupervised window extraction from thermal data are given in Lin et al. [15]. They show 85% correctness and 82% completeness, calculated on a per-object level. Performance metrics are more often reported for façade opening detection from laser scanning point clouds or RGB images. The method presented in Malihi et al. [16], applied to photogrammetric point clouds, achieves 92% correctness and 96% completeness on a per-object level. The automatic window detection in façade images described in Neuhausen et al. [17] reveals a 95% detection rate with a precision of 97%, depending on the complexity of a building being processed. A more precise assessment, performed at a smaller level—point or pixel-based—is usually given during the semantic classification of façades. The pixel-based accuracy of window extraction achieved by Markus et al. [18] is 78%, and Cohen et al. [19] achieved 85%. A deep learning approach for façade parsing, described by Liu et al. [20], achieved 93% accuracy for the class window.
Although a thermal reconstruction of 3D scenes based on sensor fusion has already often been discussed in the literature, the further automatic processing of thermal data is very seldom presented. Moreover, the presented studies of thermal information analyses are performed on TIR textures in 2D space by classical image processing algorithms. Only in the final step are detected objects back-projected to the 3D space using previously provided 3D references. Consequently, the investigation procedures neglect the geometric characteristics of the data and do not exploit the full potential of currently available photogrammetric techniques. On the other hand, the existing algorithms for semantic interpretations of 3D point clouds are mostly dedicated to laser scanning data and focus only on their geometric features without taking into consideration any other possible information. To cover this gap, we present a new approach that brings the investigation of thermal data into the 3D space. The novel part of the research is the combination of thermal information with other available characteristics of a 3D scene for a further thermal analysis executed directly on a 3D point cloud. The goal of this paper is to investigate how spectral and geometric characteristics may support thermal analysis. Furthermore, we aim to evaluate the utility of 3D thermal point clouds for object extraction. Since façade openings, such as windows and doors, impede automatic thermal inspection, the aim of the presented façade classification procedure is their prior detection. The performance of object extraction is compared and evaluated according to the achieved classification accuracy, completeness, and visualization results.
The input data consist of two types of image sequences, acquired in the thermal infrared and visible RGB spectrum. The Structure-from-Motion (SfM) technique is used on both image types to estimate camera orientations and 3D scene geometry without any initial information. The resulting 3D point cloud is attributed using geometric, RGB, and TIR information. The fusion of the different input information sources offers the opportunity to capitalize on the synergies between them and to improve the classification process. Therefore, the executed experiments are designed to investigate different data combinations and their impact on the final results. In order to focus purely on feature influence and label each point independently, we use a context-free supervised algorithm: the Random Forest. The best feature combination is then used in the final part of the study as an input for Conditional Random Fields that incorporate neighboring relations between points and their common interaction. The data preparation was done using the commercial software tools Photoscan (3D point cloud generation) and MeshLab (texture matching). For the classification algorithms, we developed our own software.
The structure of this paper is as follows: we start with a description of the data acquisition and the generation of TIR-attributed 3D point clouds. The next section addresses the methodology for the investigation of the relevance of different information types for the classification performance. This is followed by the explanation of an algorithmic frame applied for the contextual classification of thermal façades. Then, a thorough evaluation of the approach is presented and discussed. The final section summarizes conclusions and gives an outlook on future work.
2. Data Preparation
2.1. Data Acquisition
The test object in our study consists of two ensembles of complex building façades, located in the old part of the city of Dresden (Germany). For each façade ensemble, we acquired two image sequences, using thermal and RGB cameras. The captured façades are approximately 20 m height and 180 m length. Considering the small frame of the thermal camera and the narrow streets in front of the façades that restrict viewing range, the images were taken at regular distance intervals, capturing the bottom, middle and the top part of the 3D scene (cf. Figure 1). Altogether, around 250 thermal and 250 RGB images were acquired. For RGB images, we used a Canon 1200D camera with 20 mm focal length, a pixel size of 4.3 µm, and a sensor size of 5196 pixel × 3464 pixel. The TIR images were captured by an uncooled FLIR a65 thermal camera with 25 mm focal length and a temperature range between −25 °C and +135 °C. The sensor has a spectral response between 7.5 µm and 13 µm and allows for the collection of images with a resolution of 640 pixel × 512 pixel, with a pixel size of 17 µm. The 13 mm wide-angle lens (45° × 37°) of the camera provides a suitable field of view for the application at hand. The high-quality data sets which are currently used for urban object detection and classification provide point clouds with a density of 1000–2000 points per square meter on the ground (e.g., [21]). Such a density corresponds to an average spacing of 2–3 cm. Considering the characteristic of a typical TIR sensor, the object distance should not be smaller than 30–40 m in order to keep similar image resolution in the presented urban scene. For an average 25 m imaging distance in our experiment, the façade pixel spacing is equal to ~2 cm for TIR images and 0.5 cm for RGB images.
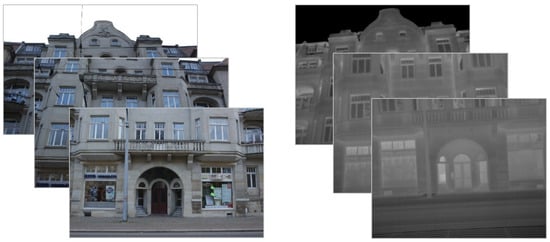
Figure 1.
Samples of RGB (left) and thermal infrared (TIR) (right) images collected from one station.
Since the uncooled thermal camera output depends not only on the object irradiance but also on its time-variant sensor temperature, it is necessary to use radiometric calibration methods to remove the response from the sensor temperature and to accurately determine object temperature. For the radiometric calibration of the first thermal image sequence, we used the commercial software FLIR GEV (version 1.7), which uses a conventional shutter-based method. The second set of thermal images was processed by the algorithms for radiometric calibration presented in Lin et al. (2017) [22], which represent a shutter-less method. It must be noticed that exact kinetic temperatures, which refer to the internal or true temperature, are unknown as long as the material type and the corresponding emissivity of the object are unknown. Emissivity describes a surface condition determined by color, finish, and intrinsic material properties; it is defined by the ratio of how well a surface performs as an emitter of infrared radiation in comparison to a blackbody. Although emissivities are not constant over all wavelengths, it is generally accepted practice to assume them as such, due to the small amount of variation over the different wavelengths for most materials [23]. Moreover, in most cases of thermographic building inspections, absolute temperatures depend on material type, which is not known a prior; however, the differences in the raw measurements are useful as a discriminator in classification. A quantitative temperature evaluation regarding three types of material specific to façades—concrete, glass, and plastic—is presented in our other research, as described in Lin et al. (2019) [24]. Since the influence of emissivity on the temperature value is very small, the emissivity correction can be neglected for the presented application case.
2.2. Thermographic 3D Point Cloud Generation
The reconstruction of 3D geometry using images and Structure-from-Motion techniques ensures the best fit between the generated 3D scene and corresponding textures [25]. Dense image matching methods based on the imagery in a visible domain are already widely used for the generation of 3D point clouds and meshes [26]. In the case of thermal imagery, however, the 3D reconstruction process becomes much more challenging due to the low resolution, low signal-to-noise ratio, and consequently the smaller number of tie points in thermal image pairs. In the case of building façades, additional difficulties are related to repetitive structures that may cause the false matching of point pairs. In such circumstances, the resulting thermal 3D point clouds will usually be much sparser and less accurate than the 3D data extracted from the visible spectrum. The thermographic point cloud generation used for this study is therefore based on the common registration of all information (thermal and spectral point clouds as well as both image sequences). The camera pose estimation is performed by the co-registration of both generated point clouds (spectral and thermal) using homologous points. The estimated camera poses are then used to assign TIR attributes to the 3D dense point clouds reconstructed from spectral images. The thermal value of each 3D point is computed using a multivariate blending function that weights all available pixel data with respect to geometric, topological and colorimetric criteria [27]. The final result of the image processing is a dense 3D point cloud which can simultaneously represent both RGB and thermal-infrared data (Figure 2).
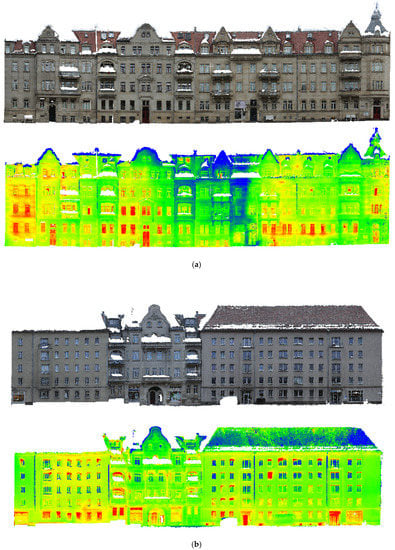
Figure 2.
Façade 1 (a) and façade 2 (b) datasets: a dense 3D point cloud visualized using RGB (top) and thermal infrared (bottom) representation.
3. Classification in 3D Space
While the classification of laser scanning data based on geometric features has already been well addressed in the literature (e.g., [28,29]), experiments executed in the 3D space on SfM point clouds, which also take other geometric features into consideration, are rarely met. Therefore, in the first part of the presented classification study, we investigate the relevance of different information types—thermal, geometric, color, and their combinations—for the object extraction. Finally, we aim at the adaptive smoothing of the results, which avoids wrongly classified single points but at the same time does not cause an artificial over-smoothing and allows us to detect object edges. The feature combination set providing the best classification performance is then used for Conditional Random Field (CRF) object extraction adding context information.
3.1. Data Structure Approximation and Feature Extraction
For many tasks related to understanding 3D scenes, relative differences between point characteristics are more relevant than the values originally measured by a sensor. Hence, in the presented method, we use two types of point descriptors: direct values belonging to a point, and relative values based on differences between neighboring points. Although many classification approaches presented in the literature are based on a single neighborhood recovery, the application of multiple neighborhoods is found to be favorable [30,31]. In the set of descriptors, we use the combination of three spherical neighborhoods starting with a radius of 10 cm (considering the TIR resolution of 2.5 cm), followed by radii of 30 cm, and 50 cm. The extracted neighbors serve as a base to describe the local geometric 3D structures and local differences between the points.
The set of descriptors computed for each point in 3D space is presented in Table 1. For the computation of geometric features, we adapt the method based on eigenanalyses, which is widely applied in the classification literature [32,33]. The spatial coordinates of the neighboring points are used to compute a local 3D structure covariance tensor, whose eigenvalues of together with the eigenvector emin serve as a base for the computation of local geometry features. Since our work focuses on façade classification, we augmented the geometric feature set by the largest difference of depth values (dmax and dmin) extracted within the given spherical neighborhood Np with the radius r.

Table 1.
Set of descriptors computed for each 3D point (the variables are explained in the corresponding section).
The second type of features that are investigated is based on colors. In our work, color features are computed in the HSV color space (the Hue, Saturation, and Value of each 3D point is noted in Table 1 as Hp, Sp, Vp, respectively). Unlike RGB, HSV separates color components from the intensity, giving more robust information. The robustness to lighting changes and the ability to remove shadows means that this color space is often employed in computer vision tasks. Regarding point cloud classification, the advantage of HSV over the RGB domain is, for example, stated in Becker et al. [34]. The set of color descriptors applied in our method is composed of 12 values. Besides each component of the color space (hue, saturation, value), we compute the color span, average, and variance at all levels of the multiple neighborhoods.
Finally, the set of features related to the point temperature is extracted. The set consists of the intensity index measured by a thermal infrared camera and statistical components showing the differences between adjacent objects. The relative values assigned to each point are computed based on its nearest neighbors, extracted at three different scales of the neighborhood. Like color feature extraction, relative TIR features contain the values of the span, average, and variance.
3.2. Context-Free Classification Based on Different Information Types
Given the extracted set of point descriptors, we learn a supervised classifier that predicts the conditional probabilities P(y|x) of different class labels, y. Among the large number of standard classification approaches, we have chosen the Random Forest classifier, which has been shown to provide an accurate classification and runs efficiently for large point clouds [35]. As a classical standard approach, the Random Forest allows the direct evaluation of the influence of the feature descriptors on the classification result. The Random Forest learning method proposed by Breiman [36] is composed of an ensemble of randomly trained decision trees. Each tree predictor is trained on a random subset of the training data, depending on the random vector of features sampled with the same distribution for all trees in the ensemble. Consequently, the resulting set of decision trees can be considered as decorrelated, which improves the generalization and robustness of the classification performance. During the point cloud classification process, each tree in the Random Forest gives a unit vote for the most popular class for each 3D point. The final point label is determined by taking the respective majority vote Nl over the predictions of all decision trees T [37]:
For the presented experiments, we use a Random Forest consisting of 50 fully grown trees. To estimate this value, we used a standard method based on the relation between the number of trees and Out-Of-Bag (OOB) error [34]. With the chosen number of trees, the OOB error becomes stabilized in our experiment, providing an optimal balance between the prediction performance and computation time. The number of differentiating features randomly chosen at each split is set to the square root of their total number (64 features calculated at different scales). The points are split based on the impurity information given by the Gini index.
3.3. Contextual Classification
Contextual information is an important clue in complex data that can improve classification results. Therefore, after the investigation of the relevance of different features for object extraction and by choosing the most optimal setup, we enhance the classification process by adding context explicitly. For this purpose, we apply the Conditional Random Field (CRF), which belongs to the group of undirected graphical models, providing a probabilistic framework for context-based classification. CRF has become a popular technique for class derivation, especially in image processing [38,39,40]; however, its application to 3D point clouds [28,41] has been relatively less reported. In the general formulation of the CRF framework, the underlying graph structure G(n,e) consists of a set of nodes n and a set of edges e. In the presented case, each node ni n corresponds to a 3D point, while each edge eij represents a contextual relation linking a pair of neighboring nodes, ni and nj. The goal of classification is to find the most probable configuration of class labels yi y determined for all points simultaneously, given an observed data point x (input point cloud). Thus, the CRF has to maximize the posterior probability as follows [42]:
In Equation (2), Z(x) is a normalization constant, which turns potentials into probabilities. The terms are called the unary potential. They link the class label of each node ni to the observed data. The terms are called the pairwise potentials. They are responsible for the model of contextual relation. In the presented experiments, the unary and pairwise potentials are weighted equally. The general formulation of CRF allows the application of arbitrary discriminative classifiers with a probabilistic output to model both types of the potentials.
Besides differences in potential modelling, CRF differs in its definition of the graph structure. Three-dimensional points, unlike images, are irregularly distributed in 3D space; thus, there is no direct definition of the neighborhood which allows for the computation of a CRF graph structure. In the presented research, we use the neighborhood information already extracted during feature computation (c.f. Section 3.1). Each 3D point is linked by edges to all its neighbors within the spherical neighborhood with a radius of 10 cm. Since the Random Forest is considered to be one of the best classifiers, we applied it to model both types of potential. The unary potential is already provided by the probabilistic outputs of the best feature combination, executed in the previous step of the research. In order to avoid zero values for unlikely classes, we compute the exponent of the calculated posteriors:
The pairwise potential is provided in many CRF applications by relatively simple models, such as the Potts model and its enhanced variations, favoring identical labels at neighboring nodes. More complex models are based on the joint posterior probability of two node labels given the observed data x. They enable the avoidance of over-smoothing and lead to better classification performance at the cost of a much higher computational effort. In the presented case, a new RF is trained to predict the conditional probabilities of a different class label for each edge eij connecting two neighboring points. For c classes to be discerned during point classification, the classifier has to differentiate between c2 possible configurations of classes. The observed data are represented by an interaction feature vector computed for each edge eij. The vector is usually provided either by concatenating the feature values of two points connected by the edge, and , or by calculating their difference, . Similar feature values of neighboring points often result in the differences being close to zero, thus hindering class differentiation. Therefore, in the presented experiment, the interaction feature vector is provided by concatenating point features of the edge ends. For the computation of the pairwise potential, we propose the use of different sets of features than those for the calculation of the unary potential. Since the edges of the graph structure link points within a 10 cm radius spherical neighborhood, features calculated at larger scales do not give a large differentiation boost to the classification process of locally similar points. Thus, the used feature set contains 48 features resulting from a concatenation of the descriptors belonging directly to the endpoints and their close neighborhood (24 features each, as presented in Table 1). In a similar manner to Equation (3), the RF pairwise potential is defined by
where l and k reflect the label configuration of adjacent nodes.
Given the model for the posterior according to Equation (2) and the parameters of the unary and pairwise potentials according to Equations (3) and (4), respectively, the goal of inference is to determine the label configuration for which P(y|x) becomes a maximum. For the optimization, we use an iterative message passing algorithm that can be applied to CRF with arbitrary formulations of interaction potentials: Loopy Belief Propagation (LBP).
4. Results and Discussion
The experimental part of our research starts with the investigation of the relevance of different information types for the classification performance. We examine the utility of the generated 3D point clouds, combining thermal information with supportive color and geometric characteristics. The most optimal setup is enhanced by the consideration of context, leading to the final classification results. To validate the presented approach in terms of its applicability and performance, the accuracy and the quality of the classification outputs was evaluated. Experiments were conducted applying our procedure to two sets of data—façade 1 and façade 2—which were generated as described in the previous sections and differin the calibration method used to extract their TIR attributes. Both data sets present large and complex building façades collected along 180 m, with 371 façade openings (windows and doors) reflected respectively by ~770,000 point samples.
The classification algorithm was executed on the point clouds, which were down-sampled with a resolution of 3 cm (around 25 times fewer points than the original data sets stemming from RGB imagery). The value is related to the lowest resolution of TIR images on the furthest parts of the façades. The point clouds were provided with reference labelling containing manually marked 3D points of façade openings (windows and doors).
4.1. Investigation of Different Information Types for the Classification Performance
In the experiments, each dataset was split into disjointed training and testing sets through a vertical plane. The resulting point clouds are similar with respect to the number of points and class distribution. Respective data characteristics are collected in Table 2.
Table 2.
Characteristics of the data sets used for the evaluation of the presented method.
Since the number of points belonging to façade openings significantly differs from the number of points of other object classes, using the whole training set for classifier learning might have a detrimental effect on the classification results [43]. Thus, in order to avoid an unbalanced training data set, we sample the same number of training examples for each class (160,286 and 120,008, respectively, for façade 1 and façade 2).
The main objective of the first part of the conducted experiments was to evaluate the utility of different types of information for the classification process. Therefore, the classifier performance was tested against different feature sets, considering the following scenarios:
- Thermal infrared only;
- Thermal infrared and geometric;
- Thermal infrared and colors;
- Thermal infrared, geometric, and colors (i.e., all extracted features).
Once the classifier was trained on the training data using the respective set of features, we predicted the labels for the test data and then compared them to the reference labelling. The quality assessment was executed on a per-point level. To evaluate the performance of our framework, we computed two final evaluation metrics,—completeness (Equation (5)) and correctness (Equation (6))—related to the quality of façade object extraction [44]:
where #TP, #FN, and #FP are the numbers of true-positive, false-negative, and false-positive 3D points, respectively.
The corresponding quality metrics obtained for each scenario are collected in Table 3.
Table 3.
Evaluation metrics of the façade object extraction obtained for different experiment scenarios.
The highest indicator values achieved in the whole experiment were obtained for the fusion of all the available information types (74% completeness and 92% correctness for façade 1, and 85% completeness and 95% correctness for façade 2). The results of both data sets show a very similar distribution of relative improvements in the consecutive experiments. It is important to notice that progress is observed at the same time for the completeness and correctness of the outputs. The statistics also demonstrate that the enhancement of TIR data by color information brings better performance than the TIR fusion with geometric information (with an up to 9% difference in the completeness and 8% in the correctness).
Discrepancies between the final results of the façade 1 and façade 2 processing are easy to capture in a graphical overview of the computed statistics (Figure 3). The correctness values obtained for each set show large differences between each other of up to 20%, which decrease together with the addition of other features supporting thermal infrared information. Such differences between data sets are most likely related to the different method of thermal information extraction during data acquisition. The 3D point cloud of façade 1 was attributed to TIR data calibrated with commercial software, while the second set of thermal images was processed by our own algorithm [22]. The latter workflow of data processing proves itself to be more suitable for the classification purpose, due to the better accuracy of the finally obtained thermal information and its higher consistency within the whole data set (also visible by comparing Figure 2a,b). Despite clear differences in classification completeness, in each scenario, the correctness indicators are largely correlated for both data sets. The statistics show that even though the quality of TIR information has a large influence on the number of detected objects, it does not contribute to false object detection.
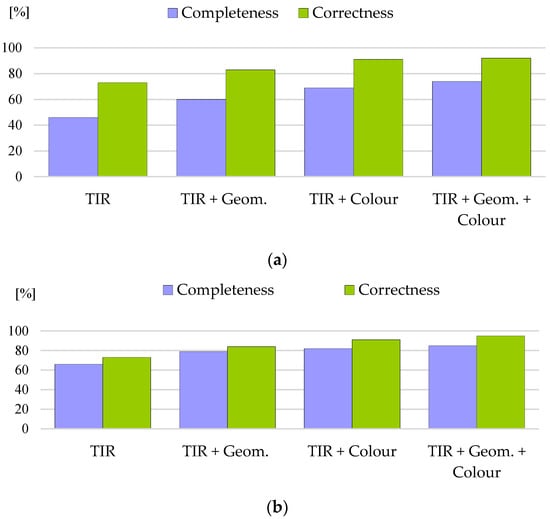
Figure 3.
Results of façade object extraction performed on different combinations of feature sets ((a) Façade 1; (b) Façade 2).
Important feedback of the classification performance achieved in various feature scenarios is given by a visual comparison of the resulting 3D point clouds. Figure 4 illustrates the classification outputs with marked semantic class. It is easy to notice how different methods of TIR data calibration and pre-processing affect the classification results. The differences between the two data sets are especially large when TIR is the only considered feature. Adding a second type of information may often improve the classification performance by the effect of synergy. Supplementing thermal data with geometric features, however, does not bring about a significant improvement in the visualized results. On the other hand, merging thermal infrared data with color only gives a large boost to the classification performance, making the biggest visual difference in the detection results. Still, in this experiment, some portions of points (mostly on the roofs) are falsely recognized as window openings. The fusion of TIR and color information with geometric data enables us to reduce the percentage of such misclassified points and to achieve the best classification results.
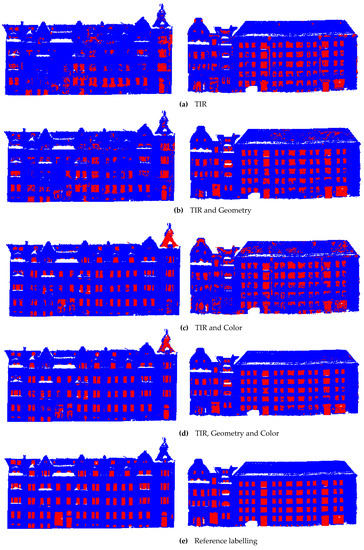
Figure 4.
Results of façade object extraction performed on different combinations of feature sets and corresponding reference labelling (left: façade 1; right: façade 2). Three-dimensional points belonging to windows and doors are marked in red.
4.2. Contextual Classification of TIR-Attributed Point Clouds
In order to enhance our experiments by the direct consideration of context, we integrate a Random Forest classifier into a Conditional Random Field framework. The RF probabilities for the classes calculated in the previous step are plugged into the CRF as unary potentials. For the computation of edges, we use the same method as in the unary potential computation case: disjointed training and testing data sets. The direct input data for the calculation of pairwise potential contained 7,171,967 training edges and 9,854,536 test edges for façade 1 and 4,548,491 and 10,254,142 edges, respectively, for façade 2. The training sets are balanced according to the class with the smallest number of samples by a random selection of the same number of samples for all four classes: 110,829 edges for façade 1 and 122,857 edges for façade 2.
Given the probability values for the unary and pairwise potential, we determine the most optimal label configuration by applying Loopy Belief Propagation. To evaluate the final results of façade opening extraction, the output is compared with the reference labelling. The quality assessment on a per-point level is executed according to Equations (5) and (6) by the examination of every single point and by calculating classification completeness and correctness measures. In order to take a broader view of the algorithm performance, we also execute the evaluation on a per-object level. The assessment is based on the overlap concept described in Rutzinger et al. [44]. In a general context, an object is considered to be a true positive if a certain minimum percentage of its area is covered by objects in the other data set. In our research, similarly to the window detection evaluation presented in [15,16], the detected object is considered to be true positive (TP) if at least 70% of its points are properly classified. If at least 50% of object points are classified incorrectly, the object is considered to be a false negative (FN). Figure 5 presents the visualization of the final results. The statistics measures of the classification performance are collected in Table 4.
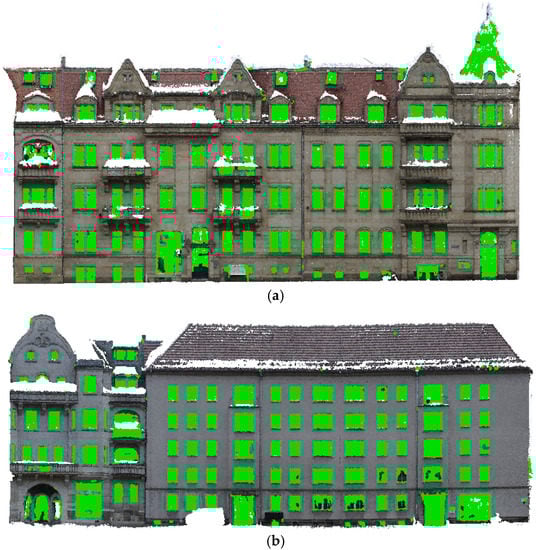
Figure 5.
Final results of contextual classification of façade openings. Detected 3D points belonging to windows and doors are marked in green ((a) Façade 1; (b) Façade 2).
Table 4.
Evaluation metrics of the contextual classification. TP: true positive; FP: false positive; FN: false negative.
In comparison with the best performance indices obtained for RF in the previous experiment, we observe a large improvement in the point-based completeness: from 74% to 82% for façade 1 and from 85% to 90% for façade 2. The consideration of context enables us to extract the full shapes of objects by the proper labelling of missed neighboring points. It is important to notice that the improvement in the classification completeness was not achieved to the significant detriment of the correctness measurement (no changes for façades 2, and one percentage point of performance deterioration for façade 1). The statistical changes are also reflected in the visualization of the final results (Figure 5). We can clearly observe the improvement in the completeness of the shapes of detected objects. Furthermore, the restriction of edge features to local ones during the pairwise potential calculation enables us to detect the sharp edges of the windows, which should be especially important in the case of further post-processing and polygon boundary extraction.
The quality assessment executed on a per-object level revealed much higher completeness values than the values computed per-point (95% vs. 82% for façade 1, and 97% vs. 90% for façade 2). This is due to the fact that, in both data sets, nearly all of the objects were detected; however, with slightly missing points. On the other hand, the object-based correctness compared to the same metric calculated on a per-point level was the same (91% for façade 1) or even lower (88% vs. 95% for façade 2). Such a result indicates that the structures falsely recognized as windows openings are mostly very small. Our achieved values of 90% completeness and 95% correctness, compared against the same metrics reported in the literature (85% and 82% [15], or 92% and 96% [16]), prove the quality of the applied method.
5. Conclusions
We have presented a method for the supervised extraction of façade openings from photogrammetric 3D point clouds attributed to TIR and RGB information. Detected objects are removed from the data, allowing for the reliable accuracy of the following investigation and the monitoring of thermal changes on a building façade. The novelty of the research is the direct combination of thermal information with other available characteristics of data, as well as the classification workflow being performed entirely in 3D space. Unlike thermal analyses processed on 2D textures, the processing of 3D data allows us to benefit from the geometric characteristic of a classified 3D scene. Furthermore, we aimed to investigate how spectral and geometric data may support thermal analysis. The experiments have shown the supremacy of color-based features over geometric characteristics as a complementary information source for thermal data. We also observed that differences in TIR information pre-processing led to significant changes in the classification completeness, while they doid not affect the correctness measurement. The visual comparison of the processing results clearly shows the advantage of feature fusion over classification based on a single information type. The fusion of all available information—i.e., thermal, geometric, and color attributes—allows the recognition of 74% object points with an exactness of 92% for façade 1 and 85% object points with an exactness of 95% for façade 2. Considering the context in our experiments improved the point-based classification accuracy by eight percentage points and five percentage points for façades 1 and 2, respectively. Analyzing the algorithm performance on a per-object level, we notice larger values of the completeness metric than in point-based evaluation together with lower values of correctness. The comparison indicates that falsely detected structures are mostly very small, and that, besides a small portion of missing points, nearly all of the objects were successfully detected.
In the presented study, we focused on the examination of the suitability of TIR and RGB-attributed 3D point clouds for a classification in a 3D space. Therefore, the algorithm classified single 3D points. Windows and doors, however, heavily depend on the size of regions and symmetry considerations, which can be exploited, for example, by shape grammars. In this respect, the presented results could provide a valuable input for further investigation. In the future, we also plan to extend the studies by taking into consideration a larger number of semantic classes and by classifying different urban materials. Since the values displayed in thermal images are dependent on the emissivity of object materials, knowledge about the material type should improve the emissivity calculation and result in a more precise calculation of the surface temperature.
Author Contributions
Conceptualization, M.J.-R. and H.-G.M.; Data acquisition and pre-processing, D.L. and M.J.-R.; Investigation, M.J.-R.; Methodology, M.J.-R.; Resources, D.L.; Supervision, H.-G.M.; Visualization, M.J.-R.; Writing—original draft, M.J.-R. All authors have read and agreed to the published version of the manuscript.
Funding
This research received no external funding.
Acknowledgments
Open Access Funding by the Publication Fund of the TU Dresden.
Conflicts of Interest
The authors declare no conflict of interest.
References
- Lopez-Fernandez, L.; Lagüela, S.; Gonzalez-Aguilera DLorenzo, H. Thermographic and mobile indoor mapping for the computation of energy losses in buildings. Indoor Built Environ. 2016, 26, 771–784. [Google Scholar] [CrossRef]
- Perilli, S.; Sfarra, S.; Ambrosini, D.; Paolettia, D.; Mai, S.; Scozzafava, M.; Yao, Y. Combined experimental and computational approach for defect detection in precious walls built in indoor environments. Int. J. Therm. Sci. 2018, 129, 29–46. [Google Scholar] [CrossRef]
- Bannehr, L.; Schmidt, A.; Piechel, J.; Luhmann, T. Extracting urban parameters of the city of Oldenburg from Hyuperspectral, Thermal, and Airborne Laser Scanning Data. Photogramm. Fernerkund. Geoinf. 2013, 2013, 367–379. [Google Scholar] [CrossRef]
- Garrido ILagüela, S.; Ariasa, P.; Baladoa, J. Thermal-based analysis for the automatic detection and characterization of thermal bridges in buildings. Energy Build. 2018, 158, 1358–1367. [Google Scholar] [CrossRef]
- Kylili, A.; Fokaides, P.A.; Christou, P.; Kalogirou, S.A. Infrared thermography (IRT) applications for building diagnostics: A review. Appl. Energy 2014, 134, 531–549. [Google Scholar] [CrossRef]
- Lagüela López, S.; Cereijo García, J.; Martínez Sánchez, J.; Roca Bernárdez, D.; Lorenzo Cimadevila, H. Thermographic mobile mapping of urban environment for lighting and energy studies. J. Daylighting 2014, 1, 8–15. [Google Scholar] [CrossRef]
- Costanzo, A.; Minasi, M.; Casula, G.; Musacchio, M.; Buongiorno, M.F. Combined Use of Terrestrial Laser Scanning and IR Thermography Applied to a Historical Building. Sensors 2015, 15, 194–213. [Google Scholar] [CrossRef]
- Boyd, G. Zeroing in on energy savings with thermal imaging. Photogramm. Eng. Remote Sens. 2013, 79, 313–316. [Google Scholar]
- Vidas, S.; Moghadam, P.; Bosse, M. 3D thermal mapping of building interiors using an RGB-D and thermal camera. In Proceedings of the IEEE International Conference on Robotics and Automation, Karlsruhe, Germany, 6–10 May 2013. [Google Scholar]
- Iwaszczuk, D.; Stilla, U. Camera pose refinement by matching uncertain 3D building models with thermal infrared image sequences for high quality texture extraction. ISPRS J. Photogramm. Remote Sens. 2017, 132, 33–47. [Google Scholar] [CrossRef]
- Hoegner, L.; Stilla, U. Thermal leakage detection on building Facades using infrared textures generated by mobile mapping. In Proceedings of the Urban Remote Sensing Event 2009 Joint, Shanghai, China, 20–22 May 2009; pp. 1–6. [Google Scholar]
- Iwaszczuk, D.; Hoegner, L.; Schmitt, M.; Stilla, U. Line based matching of uncertain 3d building models with IR image sequences for precise texture extraction. Photogramm. Fernerkund. Geoinf. 2012, 2012, 511–521. [Google Scholar] [CrossRef]
- Sirmacek, B.; Hoegner, L.; Stilla, U. Detection of windows and doors from thermal images by grouping geometrical features. In Proceedings of the Joint Urban Remote Sensing Event (JURSE’11), Munich, Germany, 11–13 April 2011. [Google Scholar]
- Michaelsen, E.; Iwaszczuk, D.; Sirmacek, B.; Hoegner, L.; Stilla, U. Gestalt grouping on faade textures from IR image sequences: Comparing different production systems. Int. Arch. Photogramm. Remote Sens. Spat. Inf. Sci. 2012, 39, 303–308. [Google Scholar] [CrossRef]
- Lin, D.; Dong, Z.; Zhang, X.; Maas, H.-G. Unsupervised Window Extraction from Photogrammetric Point Clouds with Thermal Attributes. ISPRS Ann. Photogramm. Remote Sens. Spat. Inf. Sci. 2019, 4, 45–51. [Google Scholar] [CrossRef]
- Malihi, S.; Valadan Zoej, M.; Hahn, M.; Mokhtarzade, M. Window Detection from UAS-Derived Photogrammetric Point Cloud Employing Density-Based Filtering and Perceptual Organization. Remote Sens. 2018, 10, 1320. [Google Scholar] [CrossRef]
- Neuhausen, M.; König, M. Automatic window detection in facade images. Autom. Constr. 2018, 96, 527–539. [Google Scholar] [CrossRef]
- Markus, M.; Martinovic, A.; van Gool, L. ATLAS: A three-layered approach to facade parsing. Int. J. Comput. Vis. 2016, 118, 22–48. [Google Scholar]
- Cohen, A.; Schwing, A.G.; Pollefeys, M. Efficient structured parsing of facades using dynamic programming. In Proceedings of the IEEE Conference on Computer Vision and Pattern Recognition (CVPR), Columbus, OH, USA, 23–28 June 2014. [Google Scholar]
- Liu, H.; Zhang, J.; Zhu, J.; Hoi, S.C. Deepfacade: A deep learning approach to facade parsing. In Proceedings of the Twenty-Sixth International Joint Conference on Artificial Intelligence, Melbourne, Australia, 19–25 August 2017; pp. 2301–2307. [Google Scholar]
- Roynard, X.; Deschaud, J.-E.; Goulette, F. Paris-lille-3d: A large and high-quality ground truth urban point cloud data set for automatic segmentation and classification. Int. J. Robot. Res. (IJRR) 2017, 37, 545–557. [Google Scholar] [CrossRef]
- Lin, D.; Maas, H.-G.; Westfeld, P.; Budzier, H.; Gerlach, G. An advanced radiometric calibration approach for uncooled thermal cameras. Photogramm. Rec. 2017, 33, 30–48. [Google Scholar] [CrossRef]
- Vollmer, M.; Möllmann, K.P. Infrared Thermal Imaging: Fundamentals, Research and Applications; Wiley: Brandenburg, Germany, 2010; p. 612. [Google Scholar]
- Lin, D.; Jarzabek-Rychard, M.; Tong, X.; Maas, H.-G. Fusion of Thermal imagery with Point Clouds for Building Façade Thermal Attribute Mapping. ISPRS J. Photogramm. Remote Sens. 2019, 151, 162–175. [Google Scholar] [CrossRef]
- Schönberger, J.L.; Frahm, J. Structure-from-Motion Revisited. In Proceedings of the IEEE Conference on Computer Vision and Pattern Recognition (CVPR), Las Vegas, NV, USA, 27–30 June 2016; pp. 4104–4113. [Google Scholar]
- Verdie, Y.; Lafarge, F.; Allie, P. LOD Generation for Urban Scenes. ACM Transactions on Graphics. Assoc. Comput. Mach. 2015, 34, 15. [Google Scholar]
- Callieri, M.; Cignoni, P.; Corsini, M.; Scopigno, R. Masked photo blending: Mapping dense photographic data set on high-resolution sampled 3D models. Comput. Graph. 2008, 32, 464–473. [Google Scholar] [CrossRef]
- Niemeyer, J.; Rottensteiner, F.; Soergel, U. Contextual classification of lidar data and building object detection in urban areas. ISPRS J. Photogramm. Remote Sens. 2014, 87, 152–165. [Google Scholar] [CrossRef]
- Weinmann, M.; Jutzi, B.; Mallet, C.; Weinmann, M. Geometric features and their relvance for 3D point cloud classification. ISPRS Ann. Photogramm. Remote Sens. Spatial Inf. Sci. 2017, 4, 157. [Google Scholar] [CrossRef]
- Brodu, N.; Lague, D. 3D terrestrial lidar data classification of complex natural scenes using a multi-scale dimensionality criterion: Applications in geomorphology. ISPRS J. Photogramm. Remote Sens. 2012, 68, 121–134. [Google Scholar] [CrossRef]
- Hu, H.; Munoz, D.; Bagnell, J.A.; Hebert, M. Efficient 3-D scene analysis from streaming data. In Proceedings of the IEEE International Conference on Robotics and Automation, Karlsruhe, Germany, 17 October 2013; pp. 2297–2304. [Google Scholar]
- Chehata, N.; Guo, L.; Mallet, C. Airborne lidar feature selection for urban classification using random forests. In Proceedings of the International Archives of the Photogrammetry, Remote Sensing and Spatial Information Sciences, Paris, France, 1–2 September 2009; pp. 207–212. [Google Scholar]
- Hackel, T.; Wegner, J.D.; Schindler, K. Fast semantic segmentation of 3d point clouds with strongly varying density. ISPRS Ann. Photogramm. Remote Sens. Spat. Inf. Sci. 2016, 3, 177–184. [Google Scholar] [CrossRef]
- Becker, C.; Häni, N.; Rosinskaya, E.; d’Angelo, E.; Strecha, C. Classification of aerial photogrammetric 3D point clouds. arXiv 2017, arXiv:1705.08374. [Google Scholar]
- Weinmann, M.; Urban, S.; Hinz, S.; Jutzi, B.; Mallet, C. Distinctive 2d and 3d features for automated large-scalescene analysis in urban areas. Comput. Graph. 2015, 49, 47–57. [Google Scholar] [CrossRef]
- Breiman, L. Random forests. Mach. Learn. 2001, 45, 5–32. [Google Scholar] [CrossRef]
- Hastie, T.; Tibshirani, R.; Friedman, J. The Elements of Statistical Learning. Data Mining, Inference, and Prediction, 2nd ed.; Springer: New York, NY, USA, 2016; pp. 587–604. [Google Scholar]
- Wegner, J.D.; Hansch, R.; Thiele, A.; Soergel, U. Building detection from one orthophoto and high-resolution InSAR data using conditional random fields. IEEE J. Sel. Top. Appl. Earth Obs. Remote Sens. 2011, 4, 83–91. [Google Scholar] [CrossRef]
- Hoberg, T.; Rottensteiner, F.; Heipke, C. Context models for CRF-based classification of multitemporal remote sensing data. In Proceedings of the ISPRS Annals of Photogrammetry, Remote Sensing and Spatial Information Sciences, Melbourne, Australia, 25 August–1 September 2012; pp. 128–134. [Google Scholar]
- Yang, M.Y.; Förstner, W. A hierarchical conditional random field model for labeling and classifying images of man-made scenes. In Proceedings of the IEEE International Conference on Computer Vision, Barcelona, Spain, 6–13 November 2011; pp. 196–203. [Google Scholar] [CrossRef]
- Vosselman, G.; Coenen, M.; Rottensteiner, F. Contextual segment-based classification of airborne laser scanner data. ISPRS J. Photogramm. Remote Sens. 2017, 128, 354–371. [Google Scholar] [CrossRef]
- Kumar, S.; Hebert, M. Discriminative random fields. Int. J. Comput. Vis. 2006, 68, 179–201. [Google Scholar] [CrossRef]
- Criminisi, A.; Shotton, J. Decision forests for computer vision and medical image analysis. In Advances in Computer Vision and Patter Recognition; Springer: London, UK, 2013. [Google Scholar]
- Rutzinger, M.; Rottensteiner, F.; Pfeifer, N. A Comparison of Evaluation Techniques for Building Extraction from Airborne Laser Scanning. IEEE J. Sel. Top. Appl. Earth Obs. Remote Sens. 2009, 2, 11–20. [Google Scholar] [CrossRef]
© 2020 by the authors. Licensee MDPI, Basel, Switzerland. This article is an open access article distributed under the terms and conditions of the Creative Commons Attribution (CC BY) license (http://creativecommons.org/licenses/by/4.0/).