Letter

Reversal of Aerosol Properties in Eastern China with Rapid Decline of Anthropogenic Emissions

1
Laboratory of Critical Zone Evolution, School of Geography and Information Engineering, China University of Geosciences, Wuhan 430074, China
2
State Key Laboratory of Atmospheric Boundary Layer Physics and Atmospheric Chemistry, Institute of Atmospheric Physics, Chinese Academy of Sciences, Beijing 100029, China
3
State Key Laboratory of Remote Sensing Science, Institute of Remote Sensing and Digital Earth of Chinese Academy of Sciences, Beijing 100101, China
*
Author to whom correspondence should be addressed.
Remote Sens. 2020, 12(3), 523; https://doi.org/10.3390/rs12030523
Submission received: 15 December 2019 / Revised: 2 February 2020 / Accepted: 3 February 2020 / Published: 6 February 2020

Abstract

:
The clean air actions of the Chinese government since 2013 have led to rapid reduction in anthropogenic emissions during the last five years. In this study, we present a regional-scale insight into the transition of aerosol properties during this special period based on integrated Moderate Resolution Imaging Spectroradiometer (MODIS), Multi-angle Imaging Spectroradiometer (MISR), and ground-based AERONET (AErosol RObotic NETwork) observations. As a response, aerosols in eastern China have exhibited notable reversal in both the amount and optical properties. Regional haze pollution with Aerosol Optical Depth (AOD) > 1.0 in northern China declined from more than ~80 days per year to less than ~30 days. While fine-mode particles exhibited a continuous decrease by ~30-40% during the time period of 2013–2018, the levels of coarse aerosols had no regular variations. MISR fraction AOD of different size modes shows that there has been an obvious overall decline in coarse particles over eastern China, but natural sources such as long-range dust transport make a considerable contribution. The Single Scattering Albedo (SSA) increased steadily from 2001 to 2012 by more than ~0.05. In contrast, aerosol absorption has been getting stronger since 2013, with SSA increasing by ~0.03, due to a much larger reduction in sulfate and nitrate. The drastic transition of aerosol properties has greatly changed aerosol radiative forcing (ARF) in eastern China. The negative ARF at the top (TOA) and bottom (BOA) of the atmosphere decreased by ~30 and ~50 W/m2, respectively, in Beijing during the 2001–2012 period. Although aerosol loading continued to decline after 2013, the magnitudes of TOA and BOA ARF have increased by ~10 and ~30 W/m2, respectively, since 2013, due largely to the enhanced aerosol absorption. Our results suggest that more comprehensive observations are needed to improve understanding of the intense climate and environment effects of dramatic aerosol properties in eastern China.

Graphical Abstract

1. Introduction

Atmospheric aerosols are complex and dynamic mixtures of tiny solid and liquid particles originated from both natural processes and anthropogenic activities. Through intensive and intricate interactions with solar radiation and clouds [1], these small particles play a critical role in the climate system. Moreover, exposure level to the pollution of fine particles has a close and robust correlation with an increase in morbidity and mortality of adverse epidemic diseases [2]. However, the spatial and temporal distribution of aerosol loading and their properties are very heterogeneous due to their diverse emission sources and short lifetime, exerting large uncertainties on quantifying their climate and health effects [3]. Thus, continuous and integrated observations from regional to global scales are essential in understanding the role of aerosols in climate change and air quality [4].
As one of the largest pollution hotspots in the world, the huge anthropogenic emissions in eastern China have led to serious air pollution problems associated with obvious adverse effects [5,6]. The aerosol over China is characterized by heavy loading and intricate properties [7,8], which is further complicated by its interactions with Asian monsoon [9] and meteorological variables [10]. These aerosol particles can modify clouds’ droplet size and lifetime [11], and thereby affects the frequency and intensity of regional precipitation [12]. In the other hand, an aerosol’s radiative effects, depending on its constituents and vertical profiles, can in turn regulate the chemical and physical processes of air pollution [13,14]. Nevertheless, the amount and sources of anthropogenic emissions in eastern China during the past few decades have undergone dramatic changes due to both rapid economic development and changing control measures [5,15,16,17].
In particular, the clean air actions of the Chinese government since 2013 have greatly improved particle pollution in China with large reduction in anthropogenic emissions [17]. There has not only been a substantial decrease (~30–50%) in the concentration of fine particles with a diameter ≤2.5 µm (PM2.5) [18], but also notable changes in particle chemical composition and the involved formation mechanism. For instance, there has been a rapid transition regarding aerosol composition from sulfate-driven to nitrate-driven in Beijing during winter due to a much larger decline in sulfate [19]. By contrast, the surface ozone (O3) level exhibits a remarkable increase trend [20]. It has been found that light extinction of aerosols at high concentrations can strongly inhibit O3 production rate [14,20]. Furthermore, the rapid decline of anthropogenic emissions in China can bring about considerable variability in aerosol optical and microphysical properties [21], which is significant in atmospheric chemical and physical processes. However, how the aerosol properties in eastern China change under such special period is still not clear.
In this study, we provide a comprehensive insight into the response of aerosol optical and microphysical properties to rapid changes of anthropogenic emissions in eastern China since 2013 based on integrated observations from multiple satellites including Moderate Resolution Imaging Spectroradiometer (MODIS) and Multi-angle Imaging Spectroradiometer (MISR), and ground AERONET (AErosol RObotic NETwork). Section 2 introduces the utilized satellite aerosol products and ground measurements. The overall trends of aerosol loading are examined with satellite aerosol products in Section 3.1. Variations of aerosol optical and microphysical properties are analyzed by AERONET inversions in typical regions in Section 3.2. Then, we evaluate the influence of the transition in aerosol properties on radiative forcing in Section 3.3. Section 4 discussed the potential cause of reversals in aerosol properties and related uncertainties. Finally, Section 5 provides a brief summary of the work.

2. Data and Methods

2.1. Satellite Aerosol Products

The MODIS instrument onboard Terra satellite since 2000, and Aqua since 2002, provides near-daily global observations on spectral radiation of the Earth-atmosphere system with 36 channels in 0.4–14 μm and a wide swath of ~2330 km. Although multi-band satellite instruments such as MODIS mainly retrieve one quantitative aerosol parameter of Aerosol Optical Depth (AOD) over land, MODIS AOD has been the most widely used satellite aerosol product due to its advantage in spatial and temporal resolutions. The current Collection (C) 6.1 MODIS aerosol products include Deep Blue (DB) AOD at 10 km, and Dark Target (DT) retrievals at 3 and 10 km. While MODIS DT algorithm is implemented to retrieve aerosols over dense vegetation by the spectral relationship in surface reflectance between visible and shortwave infrared bands [22], DB retrieval is available over all cloud-free and snow/ice-free surfaces by utilizing a pre-calculated spectral surface reflectance database [23]. Considering DT retrievals is usually not available in heavy pollution conditions and bright surfaces in China [24], C6.1 MODIS DB AOD was selected to have a regional-scale view on variations of the aerosol loading in China.
The recent Version (V) 23 MISR products provide aerosol optical and microphysical properties with an increased spatial resolution at 4.4 km and an improved retrieval algorithm [25]. Besides four visible/near-infrared spectral bands (446, 558, 672, and 866 nm), MISR aboard Terra satellite observes the Earth-atmosphere system at nine view angles (0° at nadir and ±26.1°, ±45.6°, ±60.0°, and ±70.5° forward and backward of the satellite track) using nine cameras. With additional multi-angle measurements, MISR retrievals can infer aerosol types with 74 aerosol mixtures defined by particle size, shape, complex refractive index, and scale height [26,27].
Among MISR retrievals of aerosol microphysical properties, MISR particle size has the most robust performance compared with ground observations [28]. By dividing AOD into three size bins of small, medium, and large mode, with specific particle radii <0.35, 0.35-0.7, and >0.7 µm, respectively, MISR fraction AOD can provide a regional map of anthropogenic emission hotspots as well as blowing dust in urban/industrial areas [27]. In particular, the multi-angle measurements of MISR are sensitive to the non-spherical shape of airborne dust in coarse particles [26], which can be used to identify dust events and their sources. However, the narrow swath width of ~380 km limits application of MISR aerosol products due to the low temporal resolution of a nine days cycle. To avoid the influence of low temporal representativity, we take mean values of V23 MISR retrievals in the 2013–2018 period as a whole, and compare these with those in the 2007–2012 and 2001–2006 periods to see the general changes in aerosol properties.

2.2. AERONET Observations and Air Quality Monitoring Network

The AERONET is a ground-based aerosol remote sensing network of Sun photometers established since early 1990s. With standard instrument calibration and data processing, AERONET aims to provide continuous, long-term aerosol optical, microphysical and radiative properties [29]. By measuring direct solar irradiance, AERONET retrieves spectral AOD with very high accuracy (~0.01–0.02) every 5–15 min, which is usually taken as ground truth in the validation of satellite retrievals [21,24]. Moreover, combined with directional sky light measurements, aerosol microphysical parameters, including complex refractive index, volume size distribution and non-spherical fraction, can be inversed [30]. Then, derivative aerosol properties, such as Single Scattering Albedo (SSA), scattering phase function, and depolarization ratio, can be calculated. It should be noted that accurate SSA (uncertainties within ~0.03) or complex refractive index can only be retrieved for AOD440 > 0.5 and solar zenith angle >50° conditions [31]. By contrast, the reliable retrieval of particle volume size distribution can be achieved in most of the size range (0.1 and 7 µm) for nearly all the situations with retrieval errors <10% in the maxima of the size distribution.
The recent V3 AERONET products have been improved to realize automatic inversions [32]. The V3 Level 1.5 AERONET products include automatic cloud screening and quality control, and have additional pre-field and post-filed calibration for Level 2.0 results. To examine temporal changes of aerosol optical and microphysical properties, AERONET inversions in typical regions of China were utilized (Figure 1). Also, spectral flux and aerosol radiative forcing products were examined to evaluate the influence of changes in aerosol properties. Despite numerous AERONET sites currently existing in China, continuous and long-term observation is only available in several sites. The selected AERONET sites are located in the megacity of Beijing and its surrounding rural areas in Xianghe, industrial city of Xuzhou, and rural area in Taihu of the Yangtze River Delta, respectively. The Taihu site is in a small peninsula in the northern part of the Taihu Lake, and there is one city to the north >30 km away. Considering that the Taihu site is mainly surrounded by the lake, we took it as a background site here. The V3 Level 2.0 AERONET product was preferable in this study, and Level 1.5 inversion was used when the Level 2.0 result was not available.
Meanwhile, the Chinese government has established a national air quality monitoring network in major cities since 2013, which measures six primary atmospheric pollutants, including PM2.5, PM10, and their gaseous precursors, nitrogen dioxide (NO2), sulfur dioxide (SO2), carbon monoxide (CO) as well as O3. By 2015, there were more than 1400 national monitoring sites with unified quality-control standards. The Environment Protection Agency (EPA) of China releases real-time hourly concentration of the six air pollutants (http://106.37.208.233:20035/). The map of annual mean concentration of the two key atmospheric pollutants, PM2.5 and O3, from all the national sites was used as an indicator for changes of air quality during 2013–2018. In addition, we selected PM2.5 concentration in six megacities, including Beijing, Shijiazhuang, Xuzhou, Zhengzhou, and Wuhan, to show detailed temporal variations of the particle pollutants (Figure 1).

3. Results and Analysis

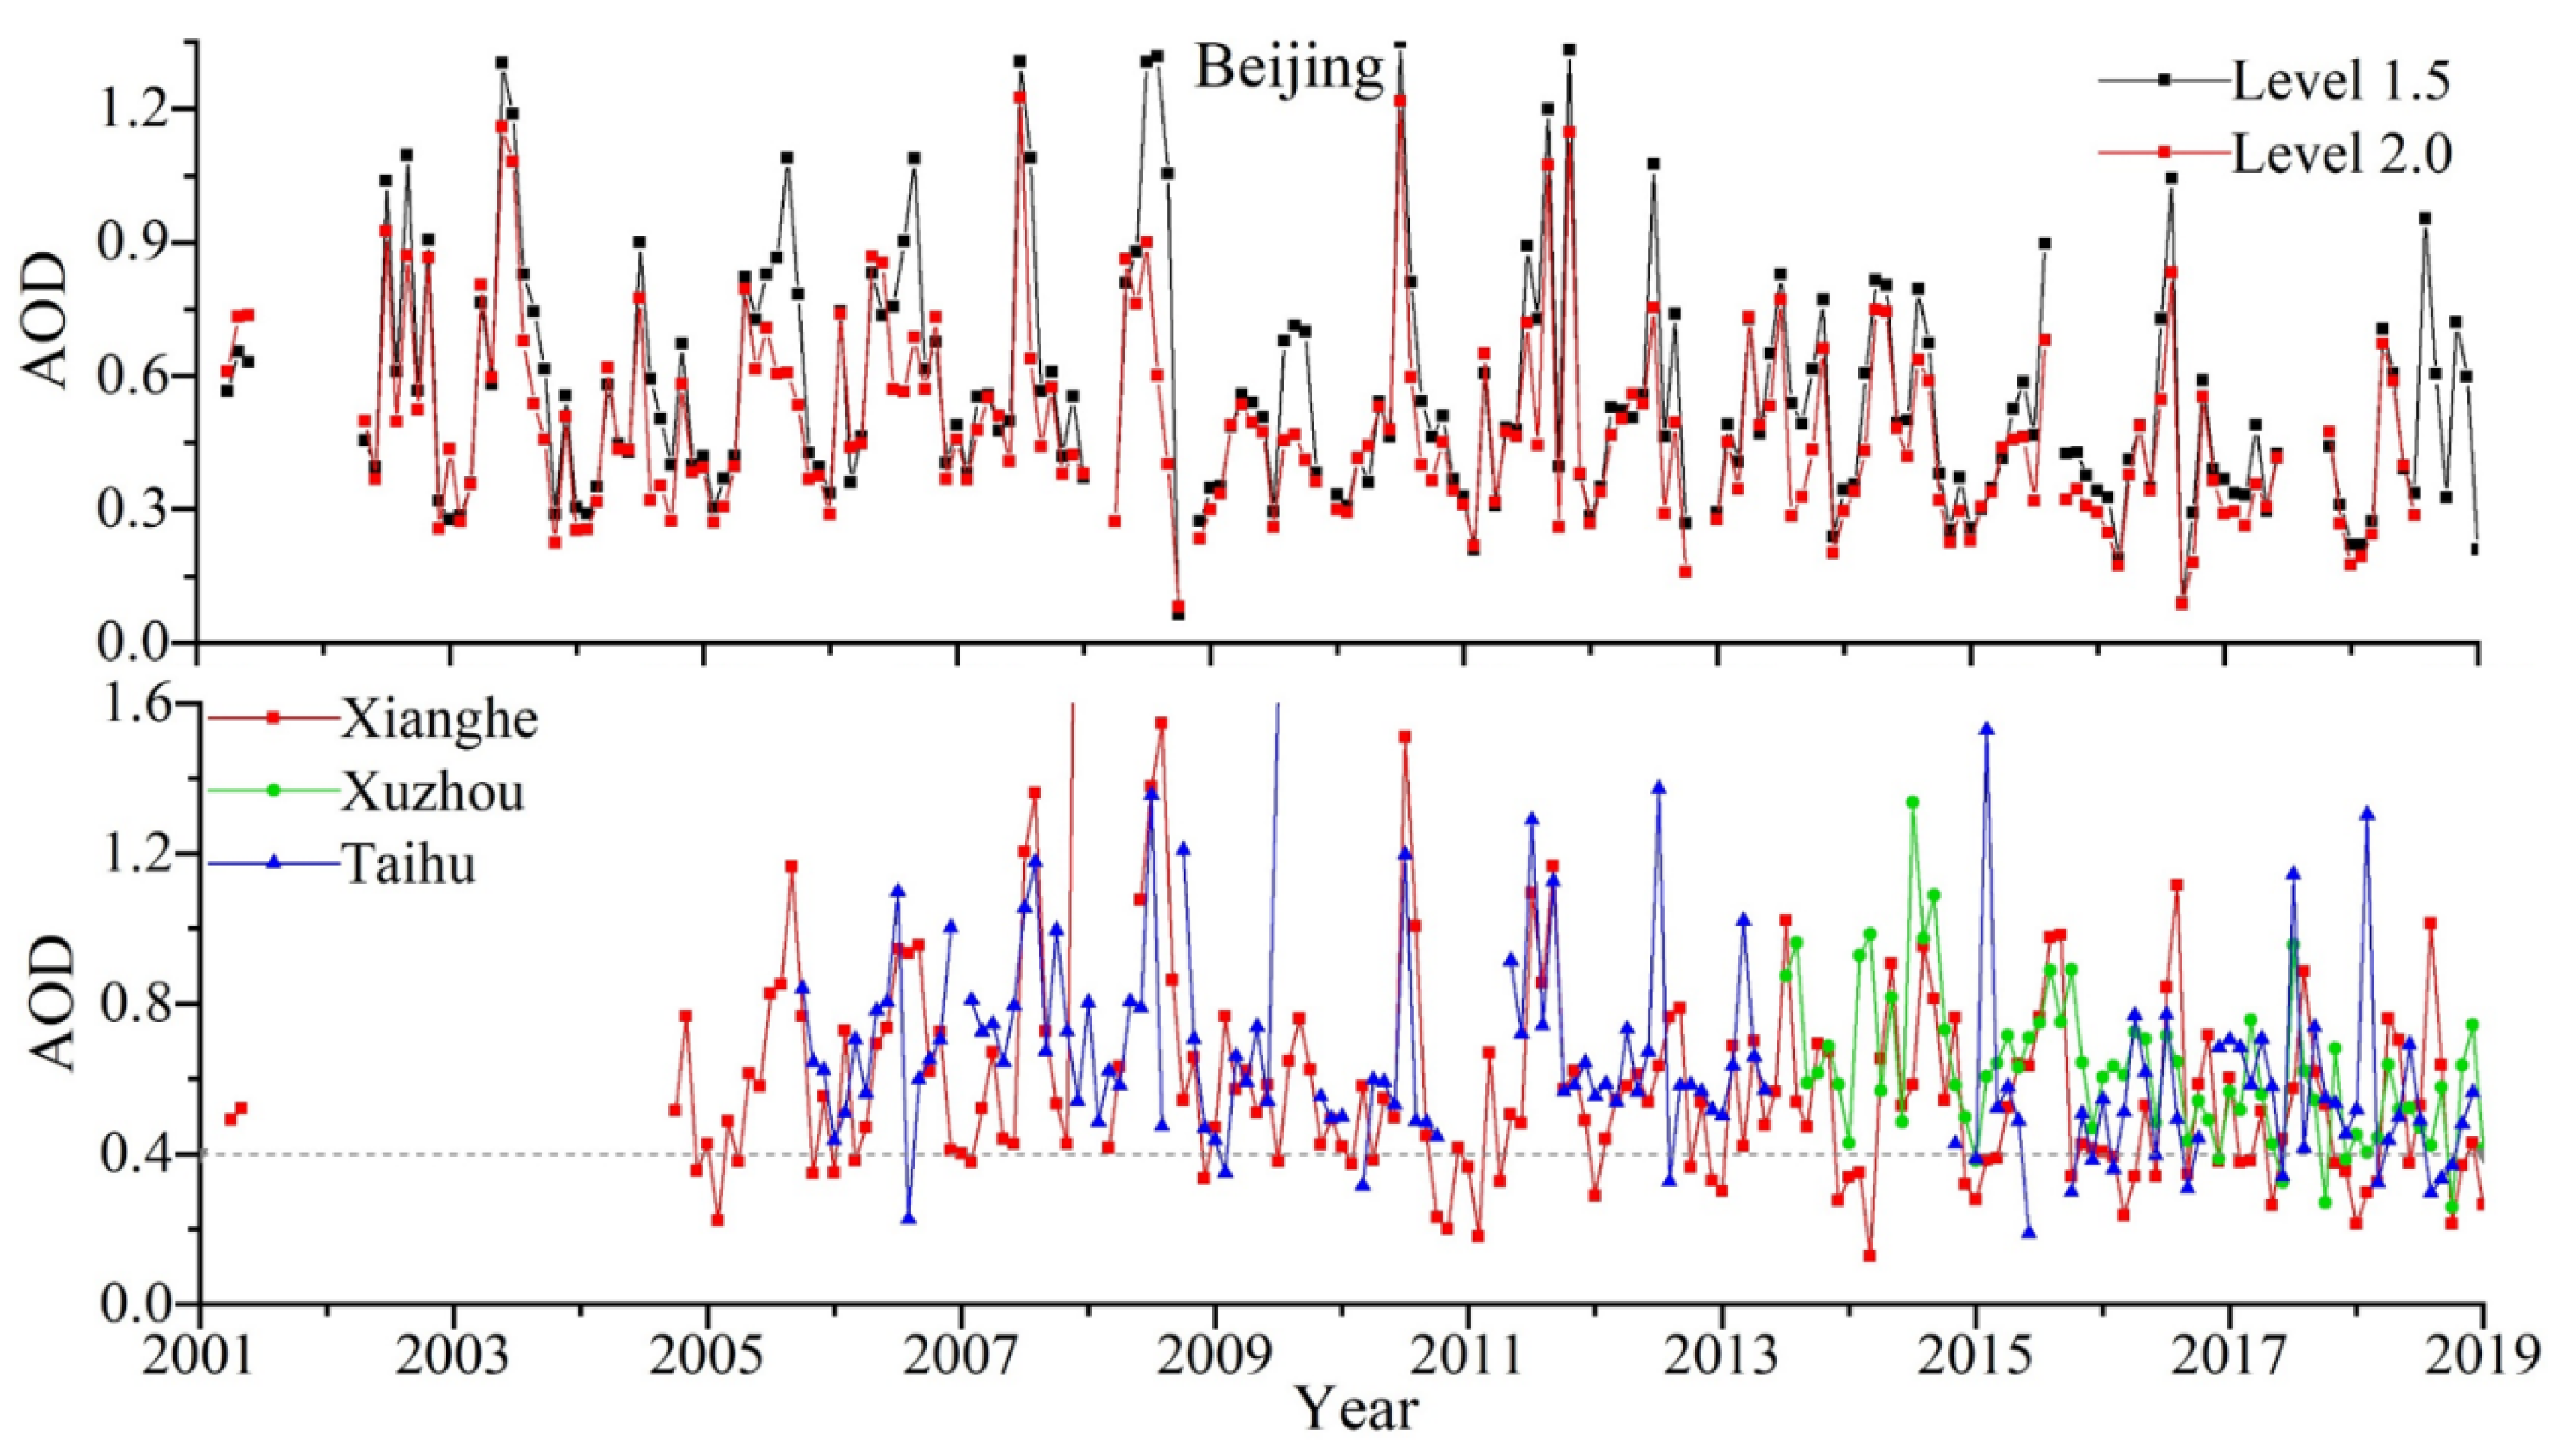
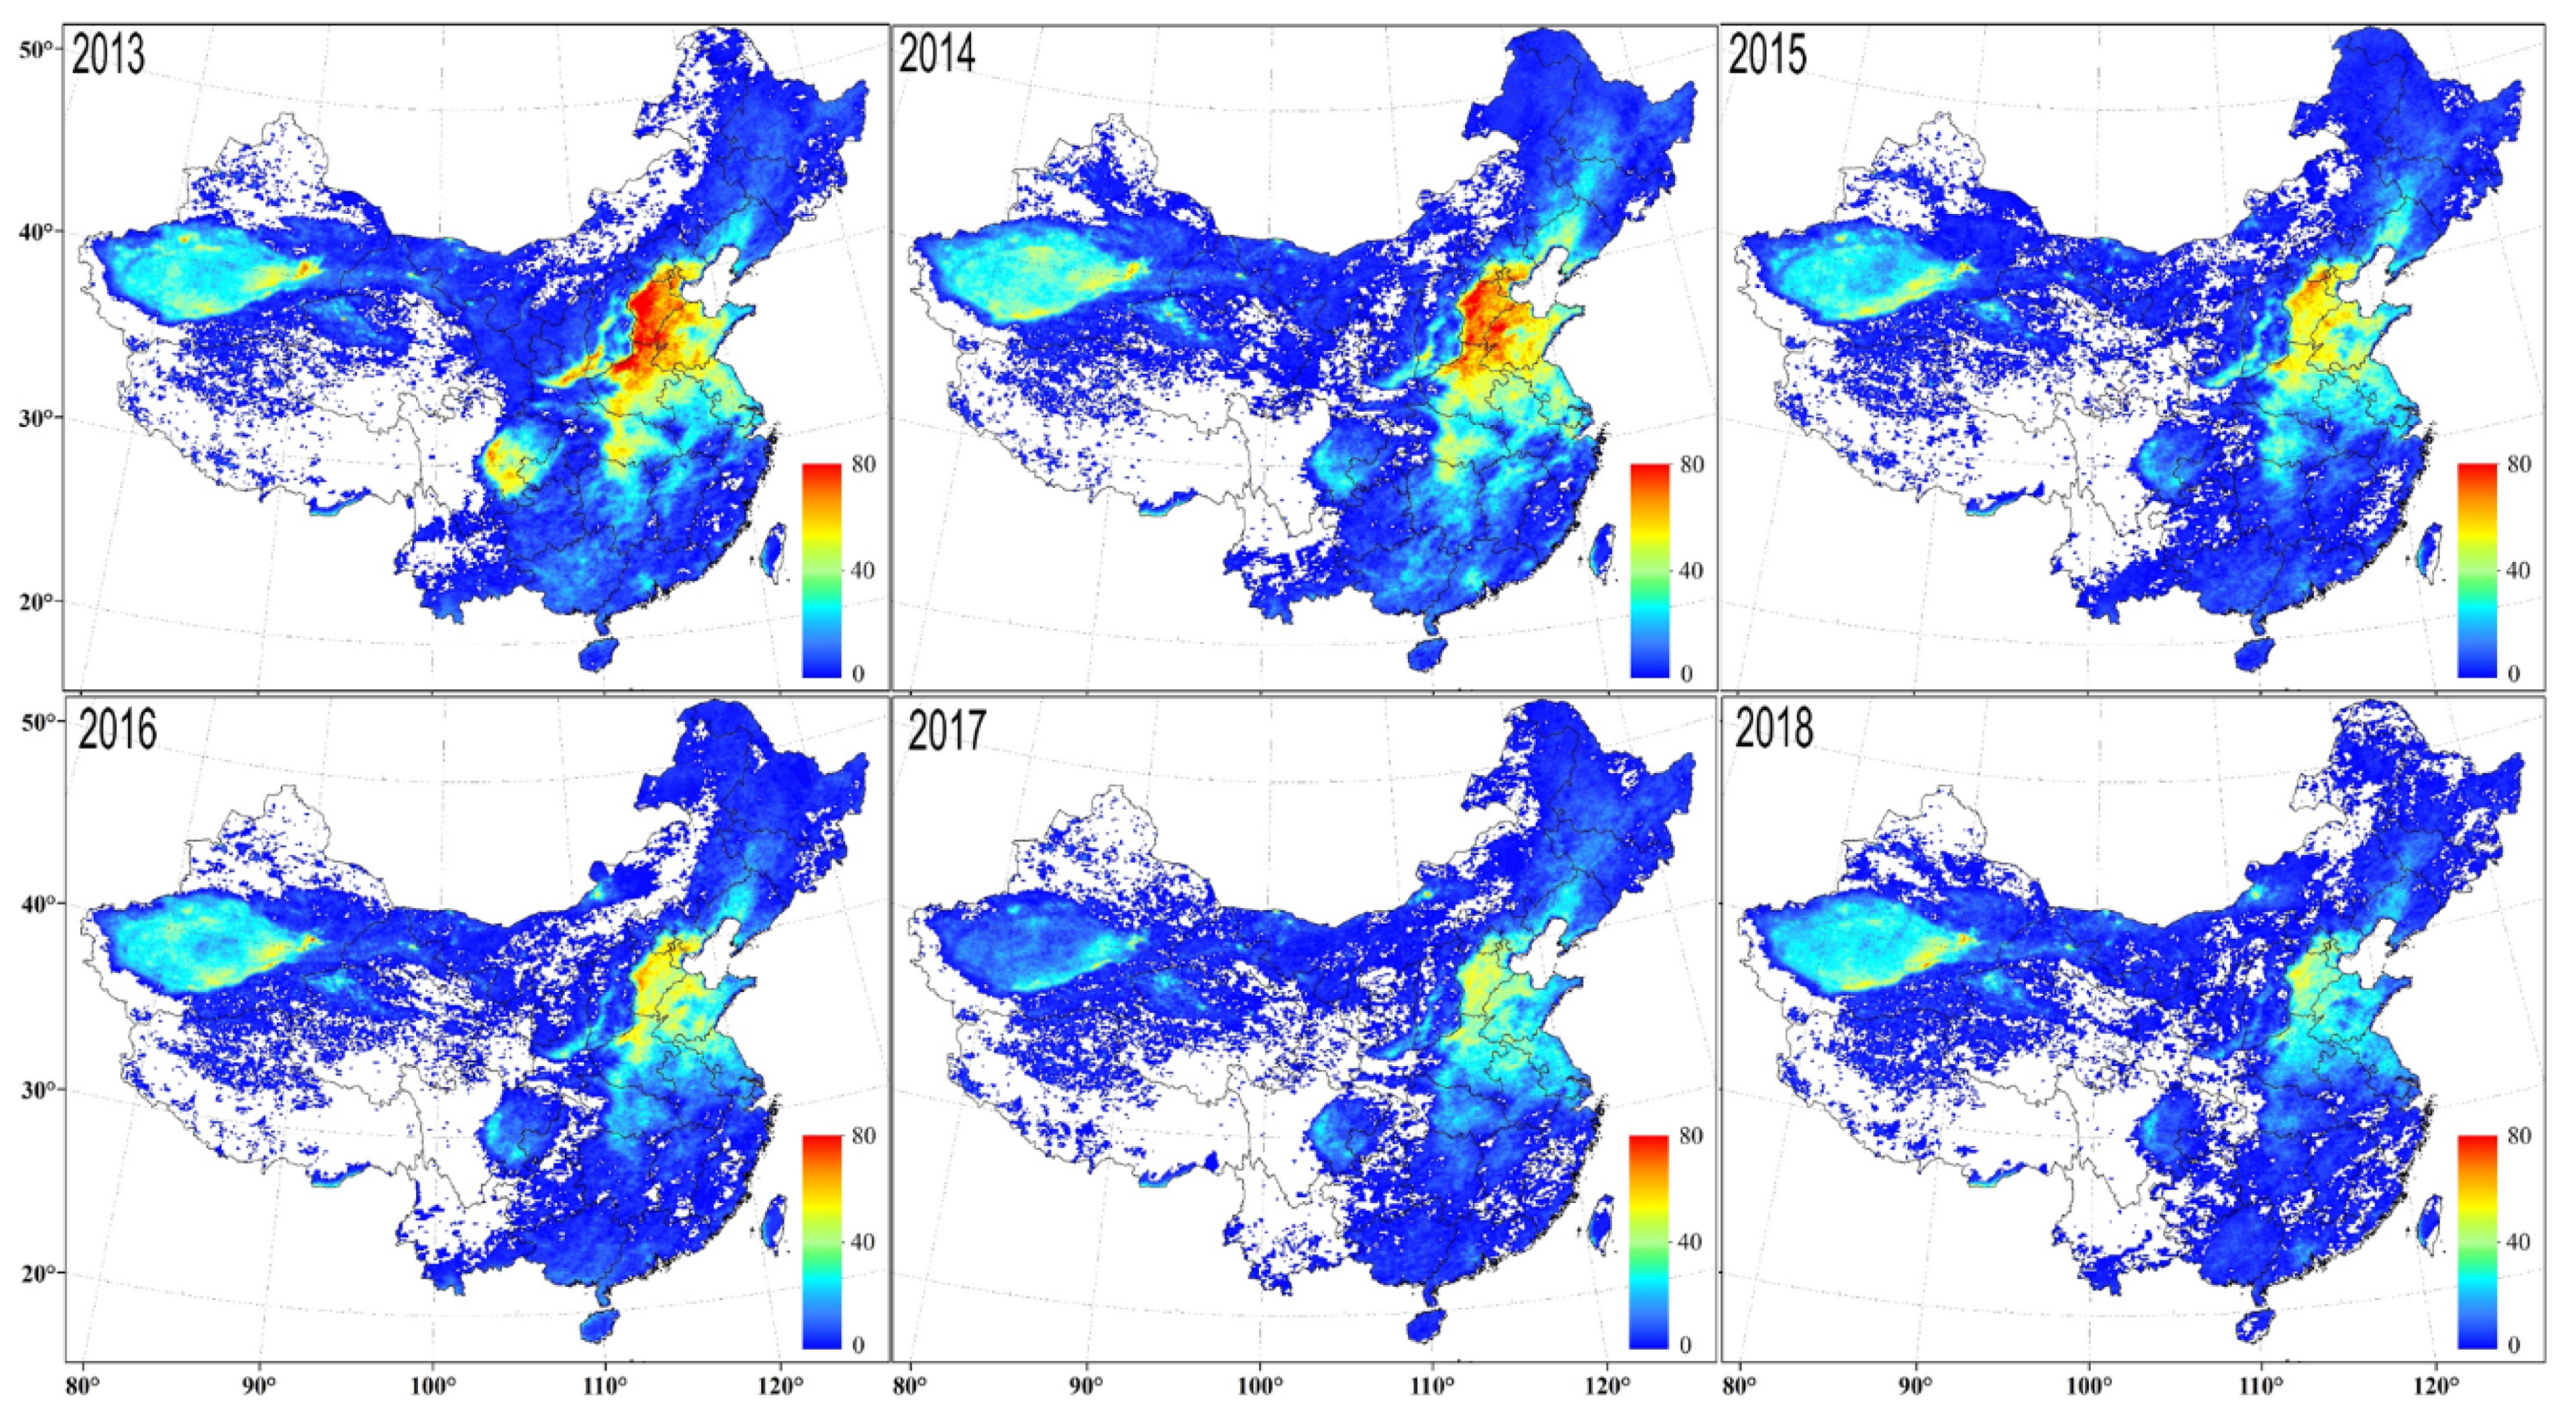
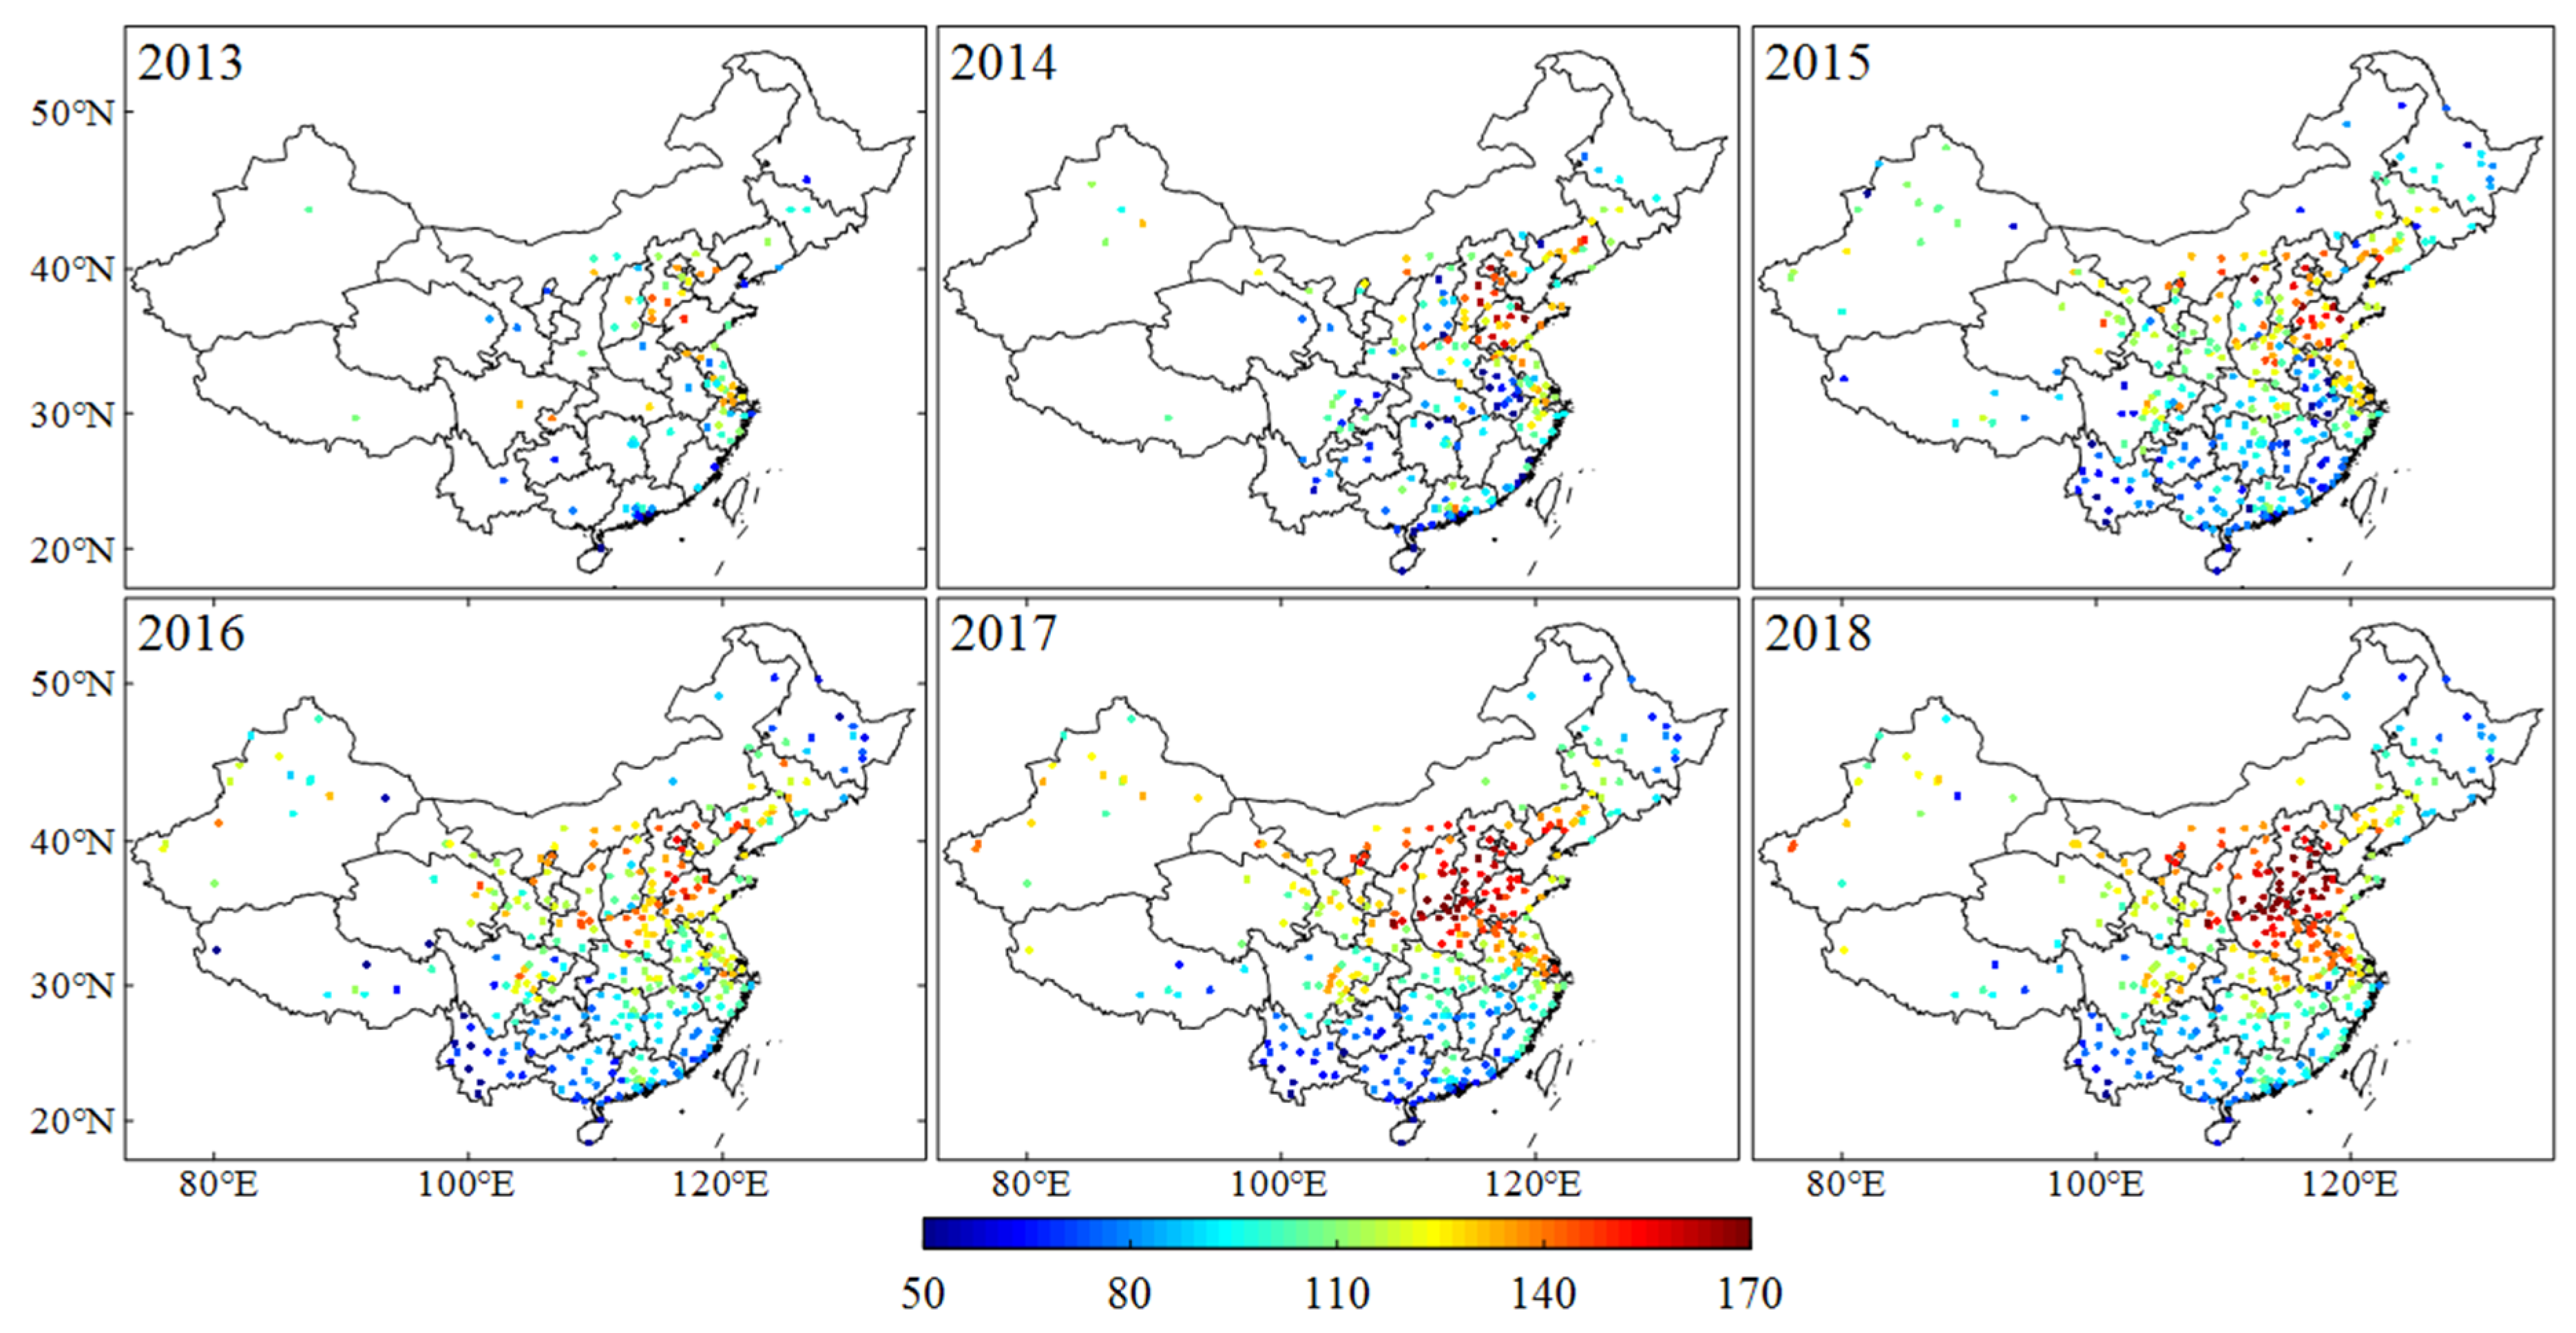
3.1. General Trends of the Aerosol Loading since Emission Reduction in 2013

Figure 2 shows the annual variation of PM2.5 concentration in China during the 2013–2018 period. It can be seen that there was a rapid decline in PM2.5 when the EPA of China began to cut down anthropogenic emissions from 2013. The annual concentration of PM2.5 in 2013 exceeded the standard of good air quality (75 µg/m3) in almost all of the cities in eastern China. Only remote areas such as Tibet (<20 µg/m3), with few anthropogenic emissions, and the Pearl River Delta (<50 µg/m3) which underwent earlier air quality improvement, reached the standard (Wang et al., 2016). The annual mean PM2.5 concentration in the capital of China, Beijing, was 85.1 µg/m3 in 2013 (Table 1), and even exhibited a slight increase in 2014. Moreover, PM2.5 in the industrial city of Shijiazhuang and Zhengzhou was up to 149.3 and 109 µg/m3, respectively, during 2013. By contrast, PM2.5 was obviously lower in Xuzhou (73.8 µg/m3) and Nanjing (77.3 µg/m3), which are not in the center of the PM2.5 hotspot in the North China Plain (NCP). Although variation in PM2.5 is not notable in Figure 2 during 2014, PM2.5 in Shijiazhuang and Zhengzhou declined by more than 20 µg/m3.
During 2015, a remarkable decrease of PM2.5 appeared in central and southern China, but PM2.5 in the NCP remained higher than 75 µg/m3 in most cities (Figure 2). It is worth noting that PM2.5 concentration in nearly all the cities reached the good level, except in the central part of NCP, during 2016. Then, a large decline (~20 µg/m3) occurs in PM2.5 in the NCP, with slight changes in other regions, in 2017 and 2018. The particle pollution in China has been greatly improved from 2013 to 2018, with PM2.5 in almost all the major cities reaching a good level (<75 µg/m3), and even comes up to an excellent level (<35 µg/m3) in many cities of southern China. By 2018, the PM2.5 hotspot was mainly concentrated in the central part of the NCP (~60–70 µg/m3) and cities around deserts in western China (>80 µg/m3). There was an overall ~30–40 µg/m3 decline for PM2.5 in eastern China, indicating the evident effects of clean air actions [17]. It should be stated that PM2.5 in Xuzhou only decreased by less than 10 µg/m3, due largely to a difference in the emission reduction amount. Additionally, the variance in annual PM2.5 is almost at similar levels with the PM2.5 concentration itself, demonstrating that PM2.5 pollution under the unfavorable meteorological conditions in winter is still a challenge [18].
Satellite observation provides a regional insight into spatial-temporal variations of the aerosol loading over eastern China (Figure 3). Consistent with variations of PM2.5, MODIS DB AOD exhibits a large decease in regional scales. During 2013, high-AOD (>0.8) was prevalent over nearly the whole NCP and Sichuan Basin, and aerosol loading in southern China was also at a relatively high level (>0.6). Similar to PM2.5, the spatial coverage of aerosol hotspot (AOD > 0.8) became much smaller in 2014, especially in the Sichuan Basin and southern China. MODIS AOD continued to decline from 2015 to 2016. By contrast, MODIS AOD was at close level (~0.5) in most regions of eastern China in 2017–2018 except some spatial variations over the NCP. Despite a notable decline in PM2.5 concentration over the NCP during 2018, MODIS AOD had little change and even got higher in the NCP. The column AOD was largely influenced by the vertical distribution and hygroscopic growth of aerosols in addition to the amount [33], which has a nonlinear relationship with PM2.5 mass concentration near the surface.
The continuous ground observations in AERONET sites enable a long-term view in the temporal variations of aerosol loading (Figure 4). The AERONET AOD in Beijing during 2001-2018 exhibits dramatic changes, with large monthly fluctuations from ~0.3 in winter to >0.8–1.2 in summer. There is an increasing trend for aerosol loading in Beijing in 2001–2008, and then AOD has had a steady decline since 2010. The sudden decline in aerosol loading in 2009 is related with a temporary economic turndown in China [34]. It is worth noting that the fluctuation of monthly AOD has become much smaller since 2013, but got slightly higher in 2018, which is consistent with MODIS results. Also, the temporal variations of AOD in the Xianghe, Xuhzou, and Taihu sites show similar trends as that in Beijing. Although the Taihu site is located in the background area of the Yangtze River Delta, aerosol loading in Taihu is at similar levels as that in Xianghe and Xuzhou, demonstrating the regional distribution of the AOD hotspots in eastern China.
Compared with aerosol loading, the frequency of regional haze pollution (AOD > 1.0) is more sensitive to changes in the general emission level in eastern China [15]. Figure 5 displays the annual frequency of MODIS AOD >1.0 in 2013–2018. During 2013, frequent haze pollution was prevalent in the NCP, with MODIS AOD >1.0 exceeding 80 days. Also, there are several striking haze hotspots (>50) in the Sichuan Basin and Central China. While the frequent haze pollution in the NCP only exhibited a slight decline in 2014, a notable decease occurred in the Sichuan Basin from ~60–70 to ~20 days. The regional haze pollution reduced by about 20 days in 2015, which can be said to have largely contributed to the obvious decrease of aerosol loading over the NCP (Table 1). The haze hotspot in the NCP got smaller with a continuous decline in 2016–2018, and was only concentrated (~60 days) in the southern part of Beijing by 2018. Overall, the frequency of haze pollution is less than 30 days in most regions of eastern China, with a great decrease for more than one half. The continuous and large decline in regional heavy pollution events in eastern China demonstrates the substantial overall reduction in aerosols and gaseous precursors, which is consistent with changes in the emission inventories [17].

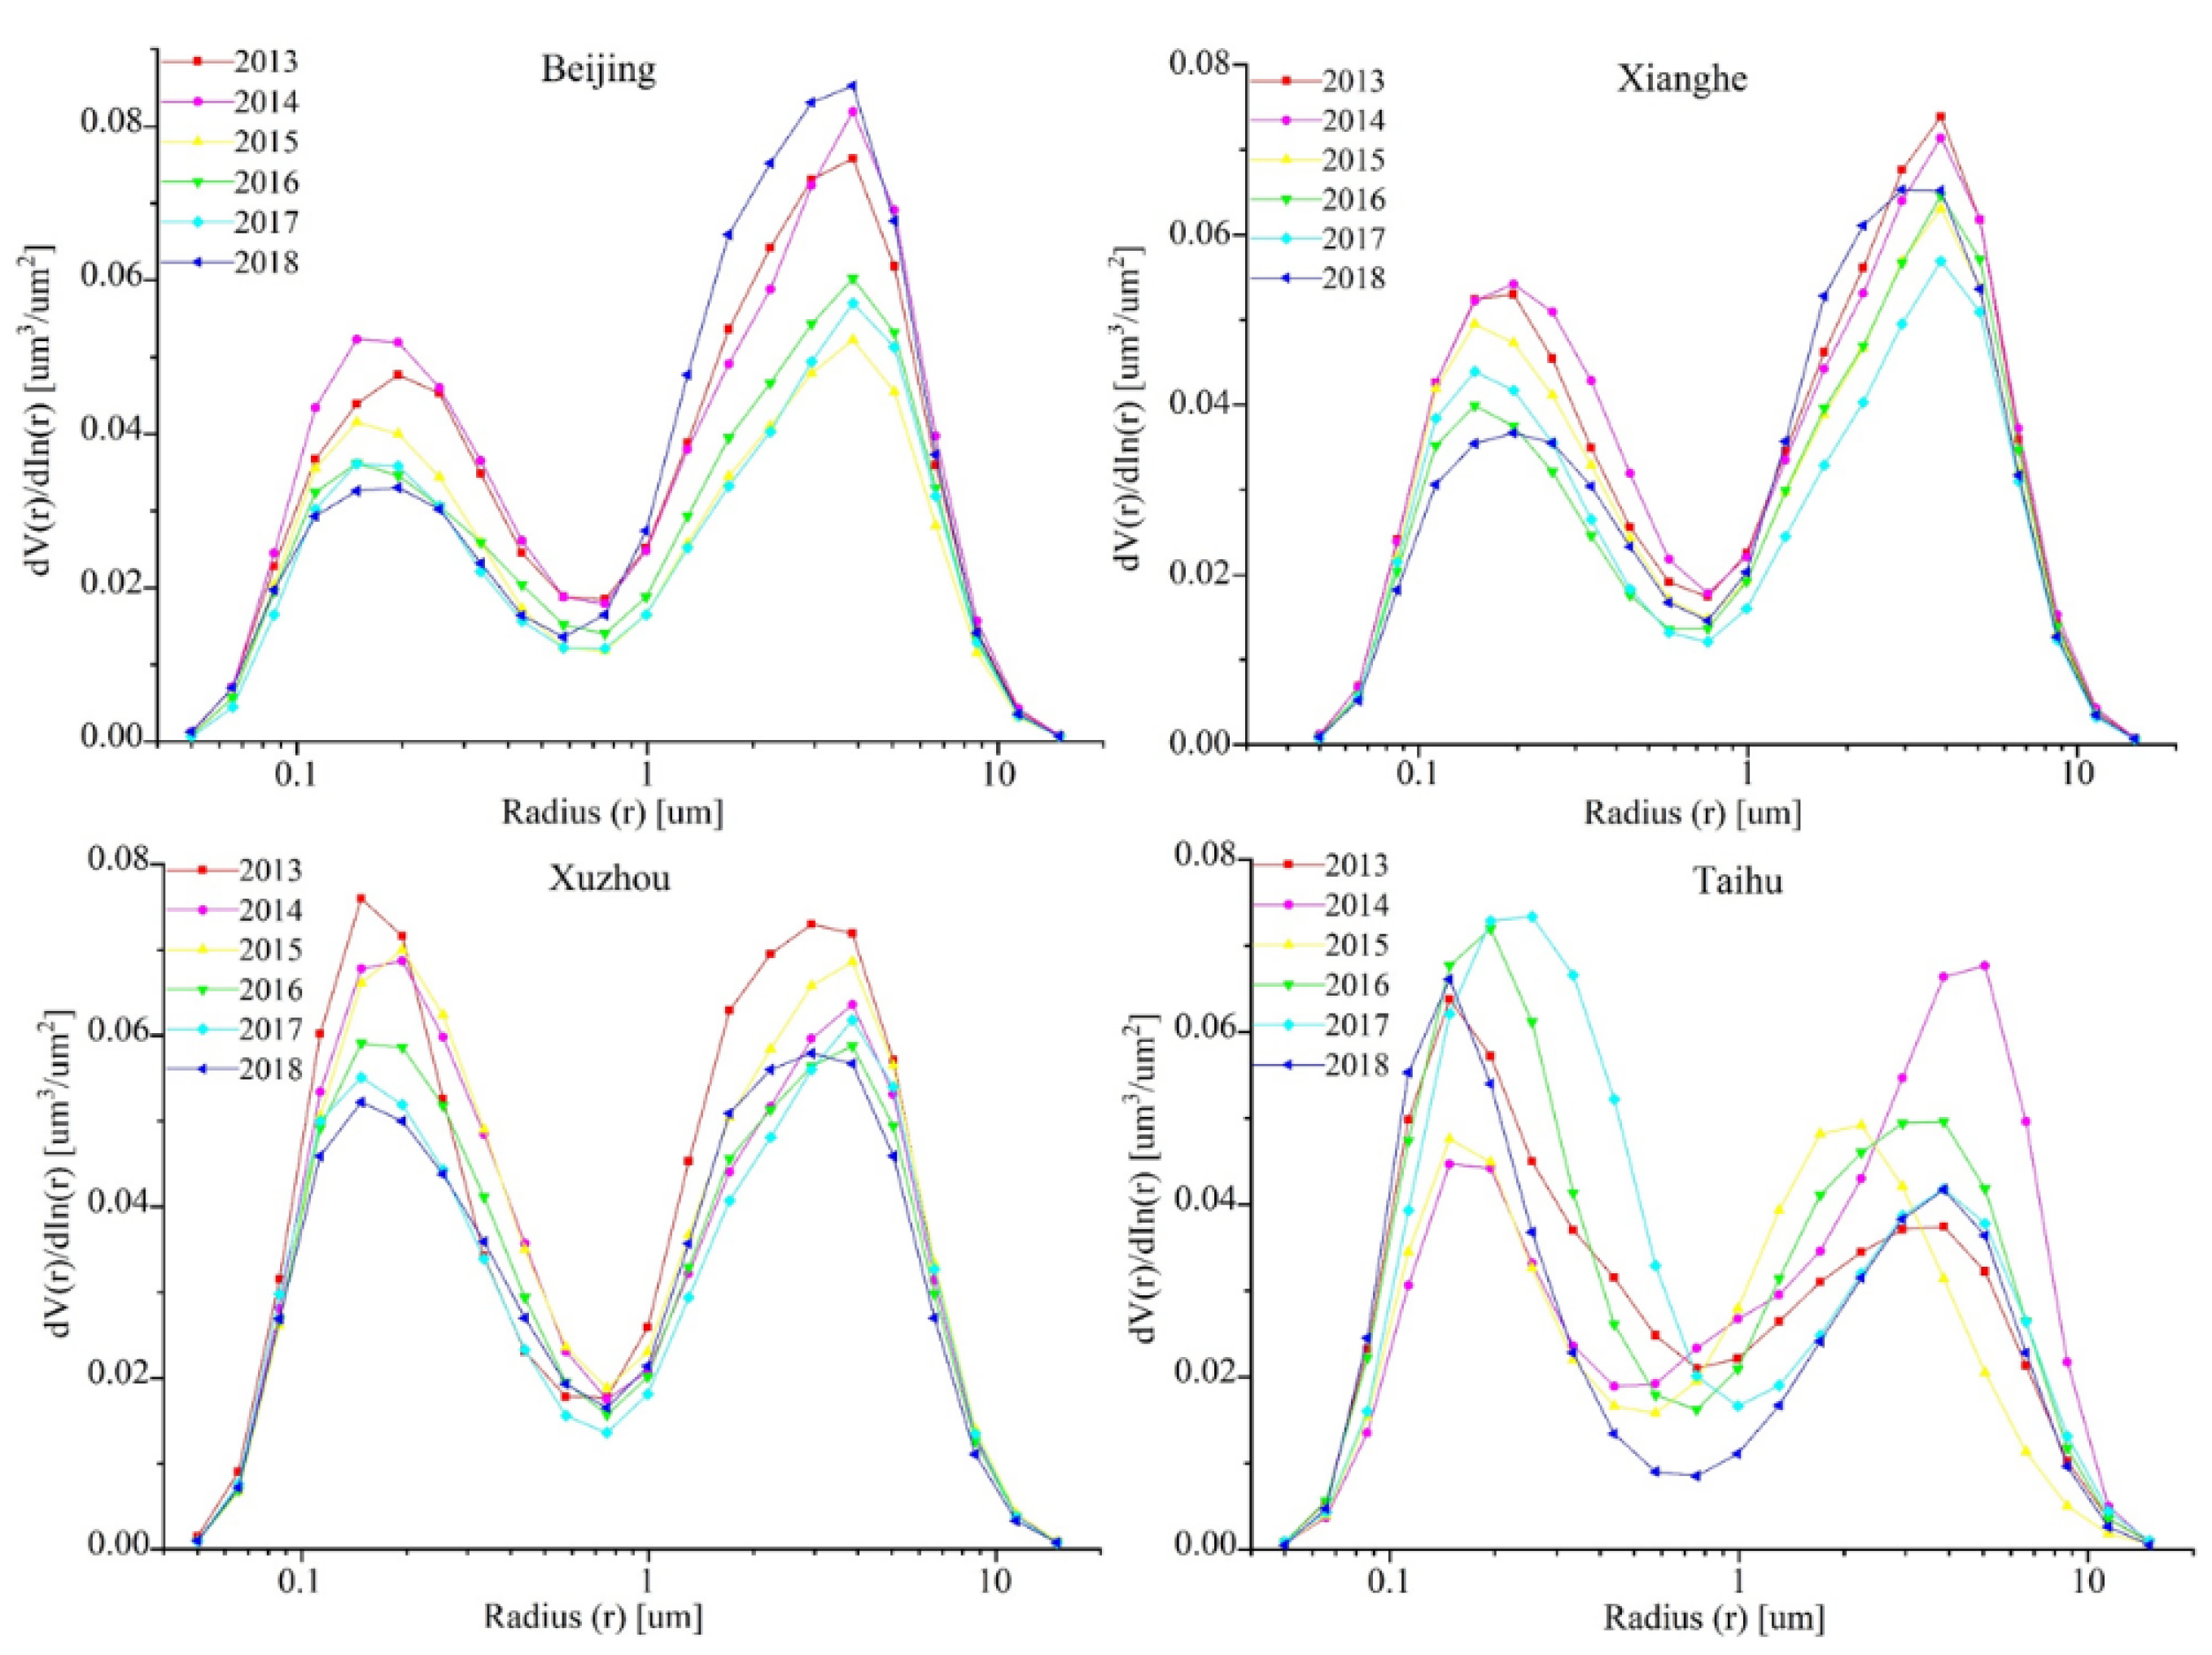
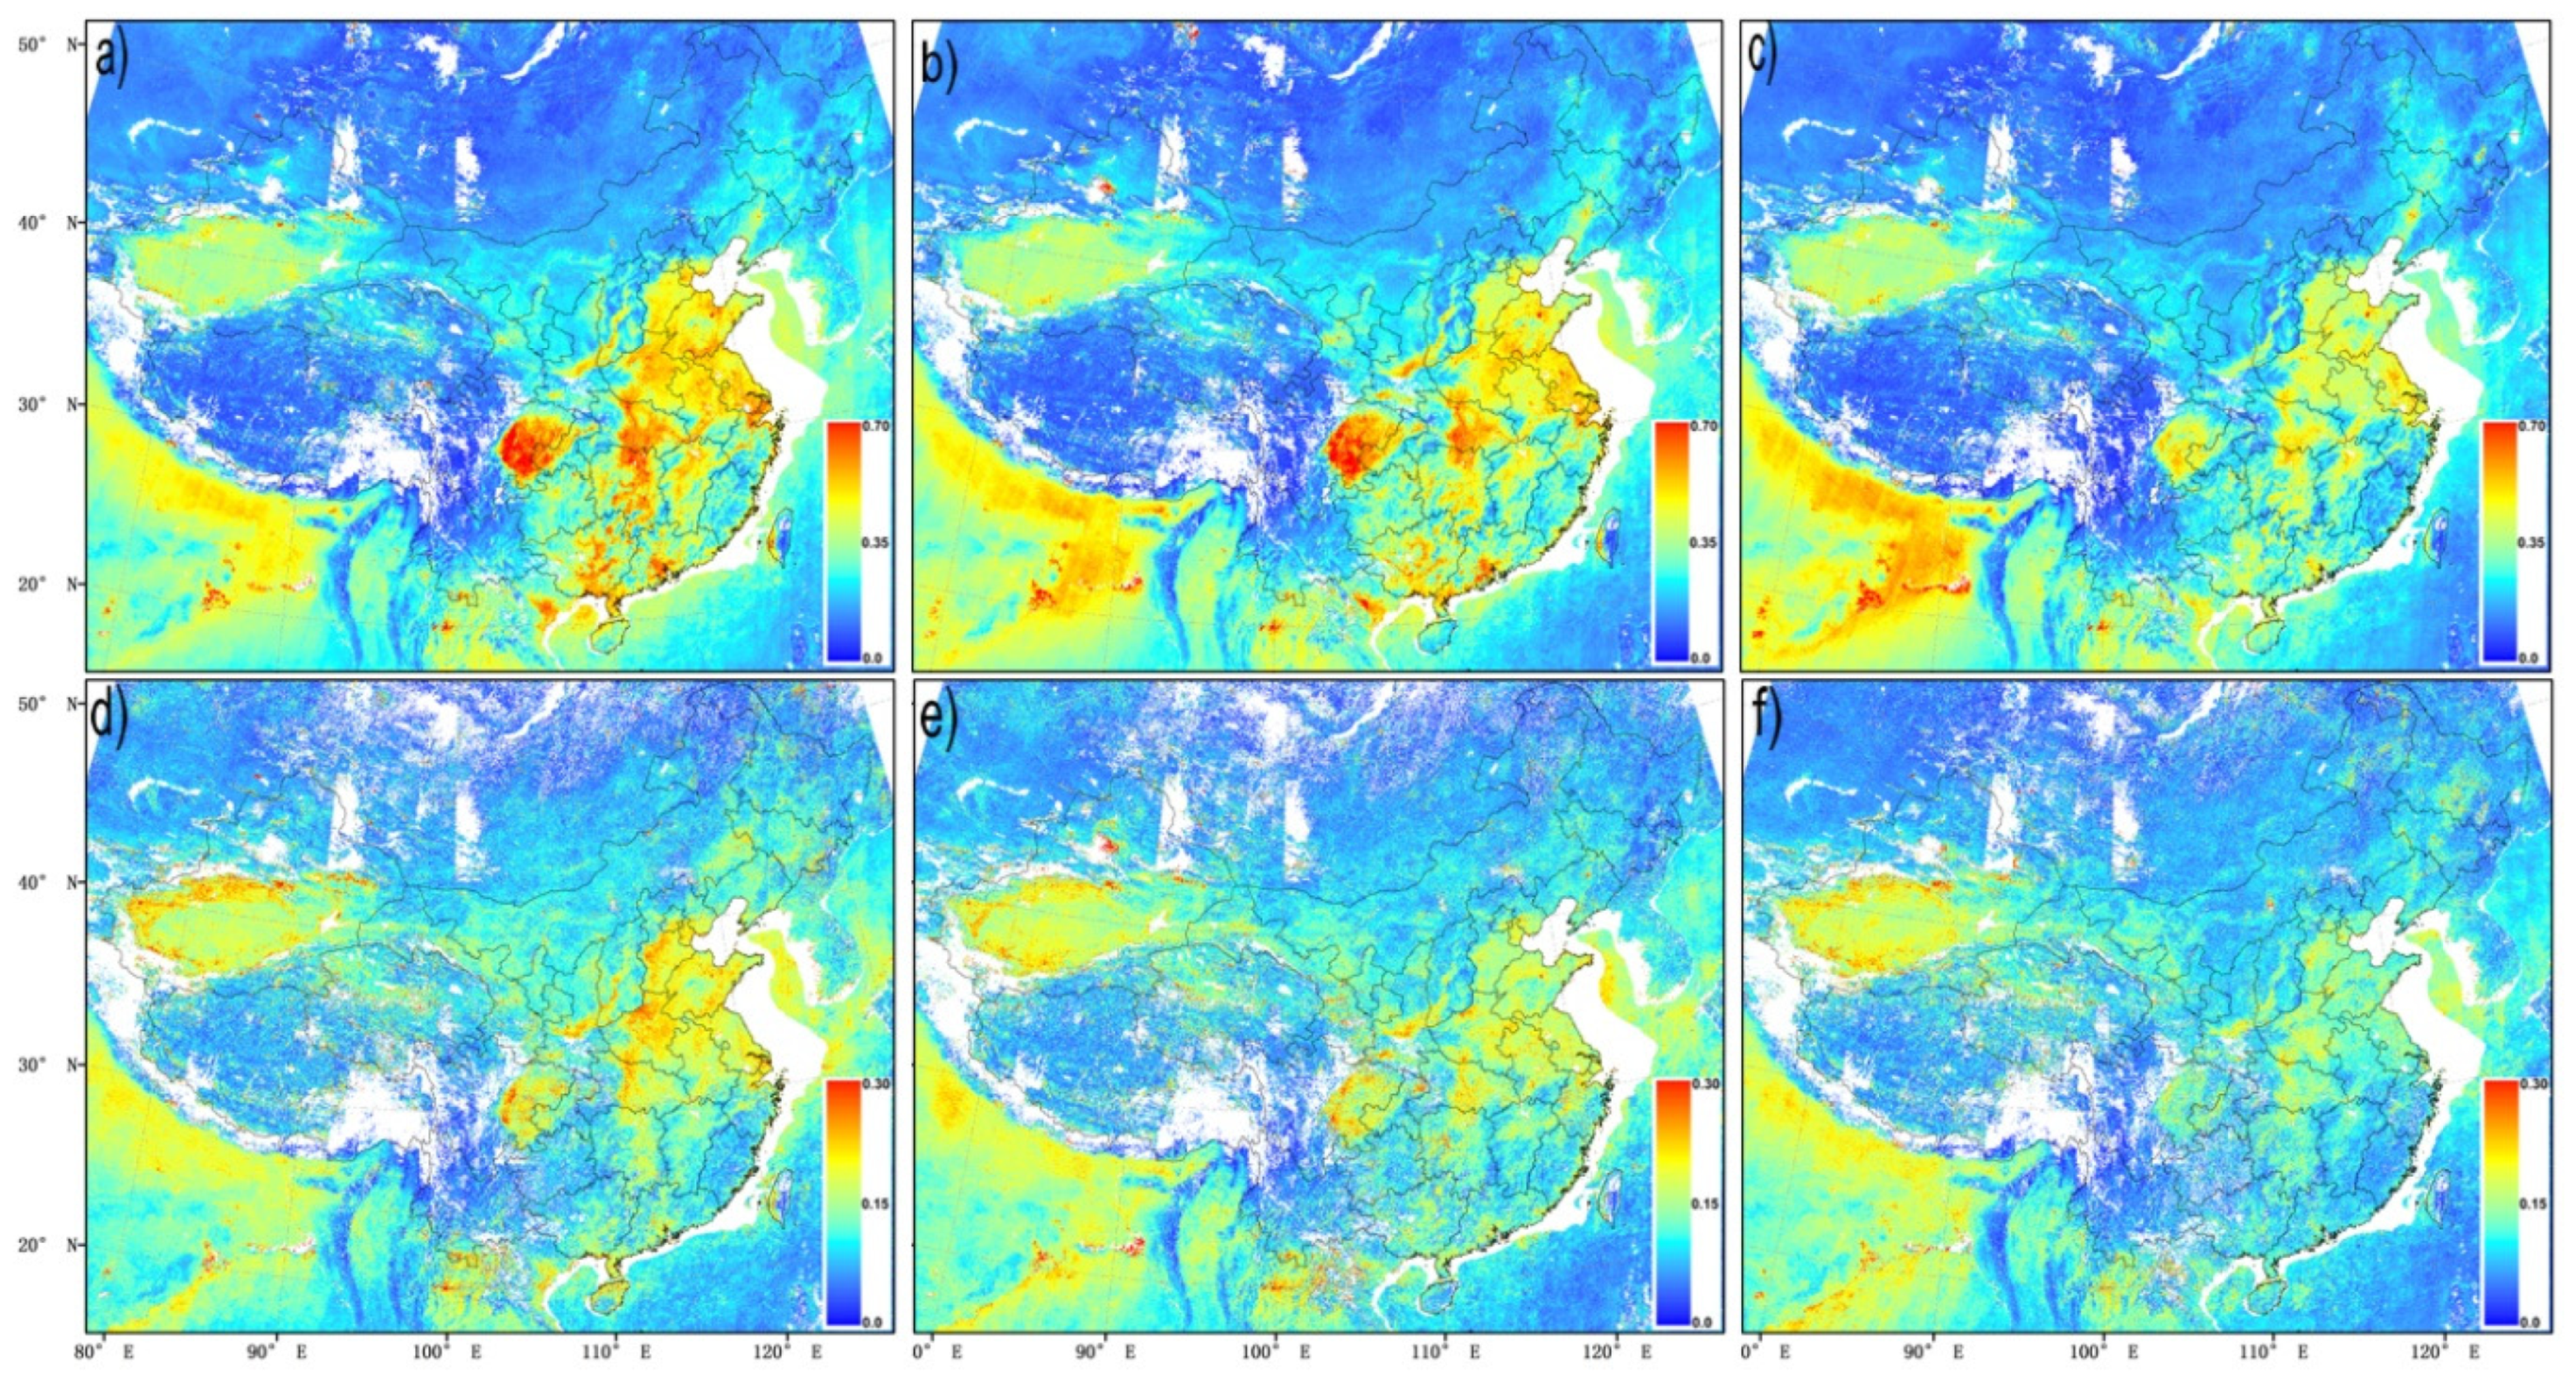
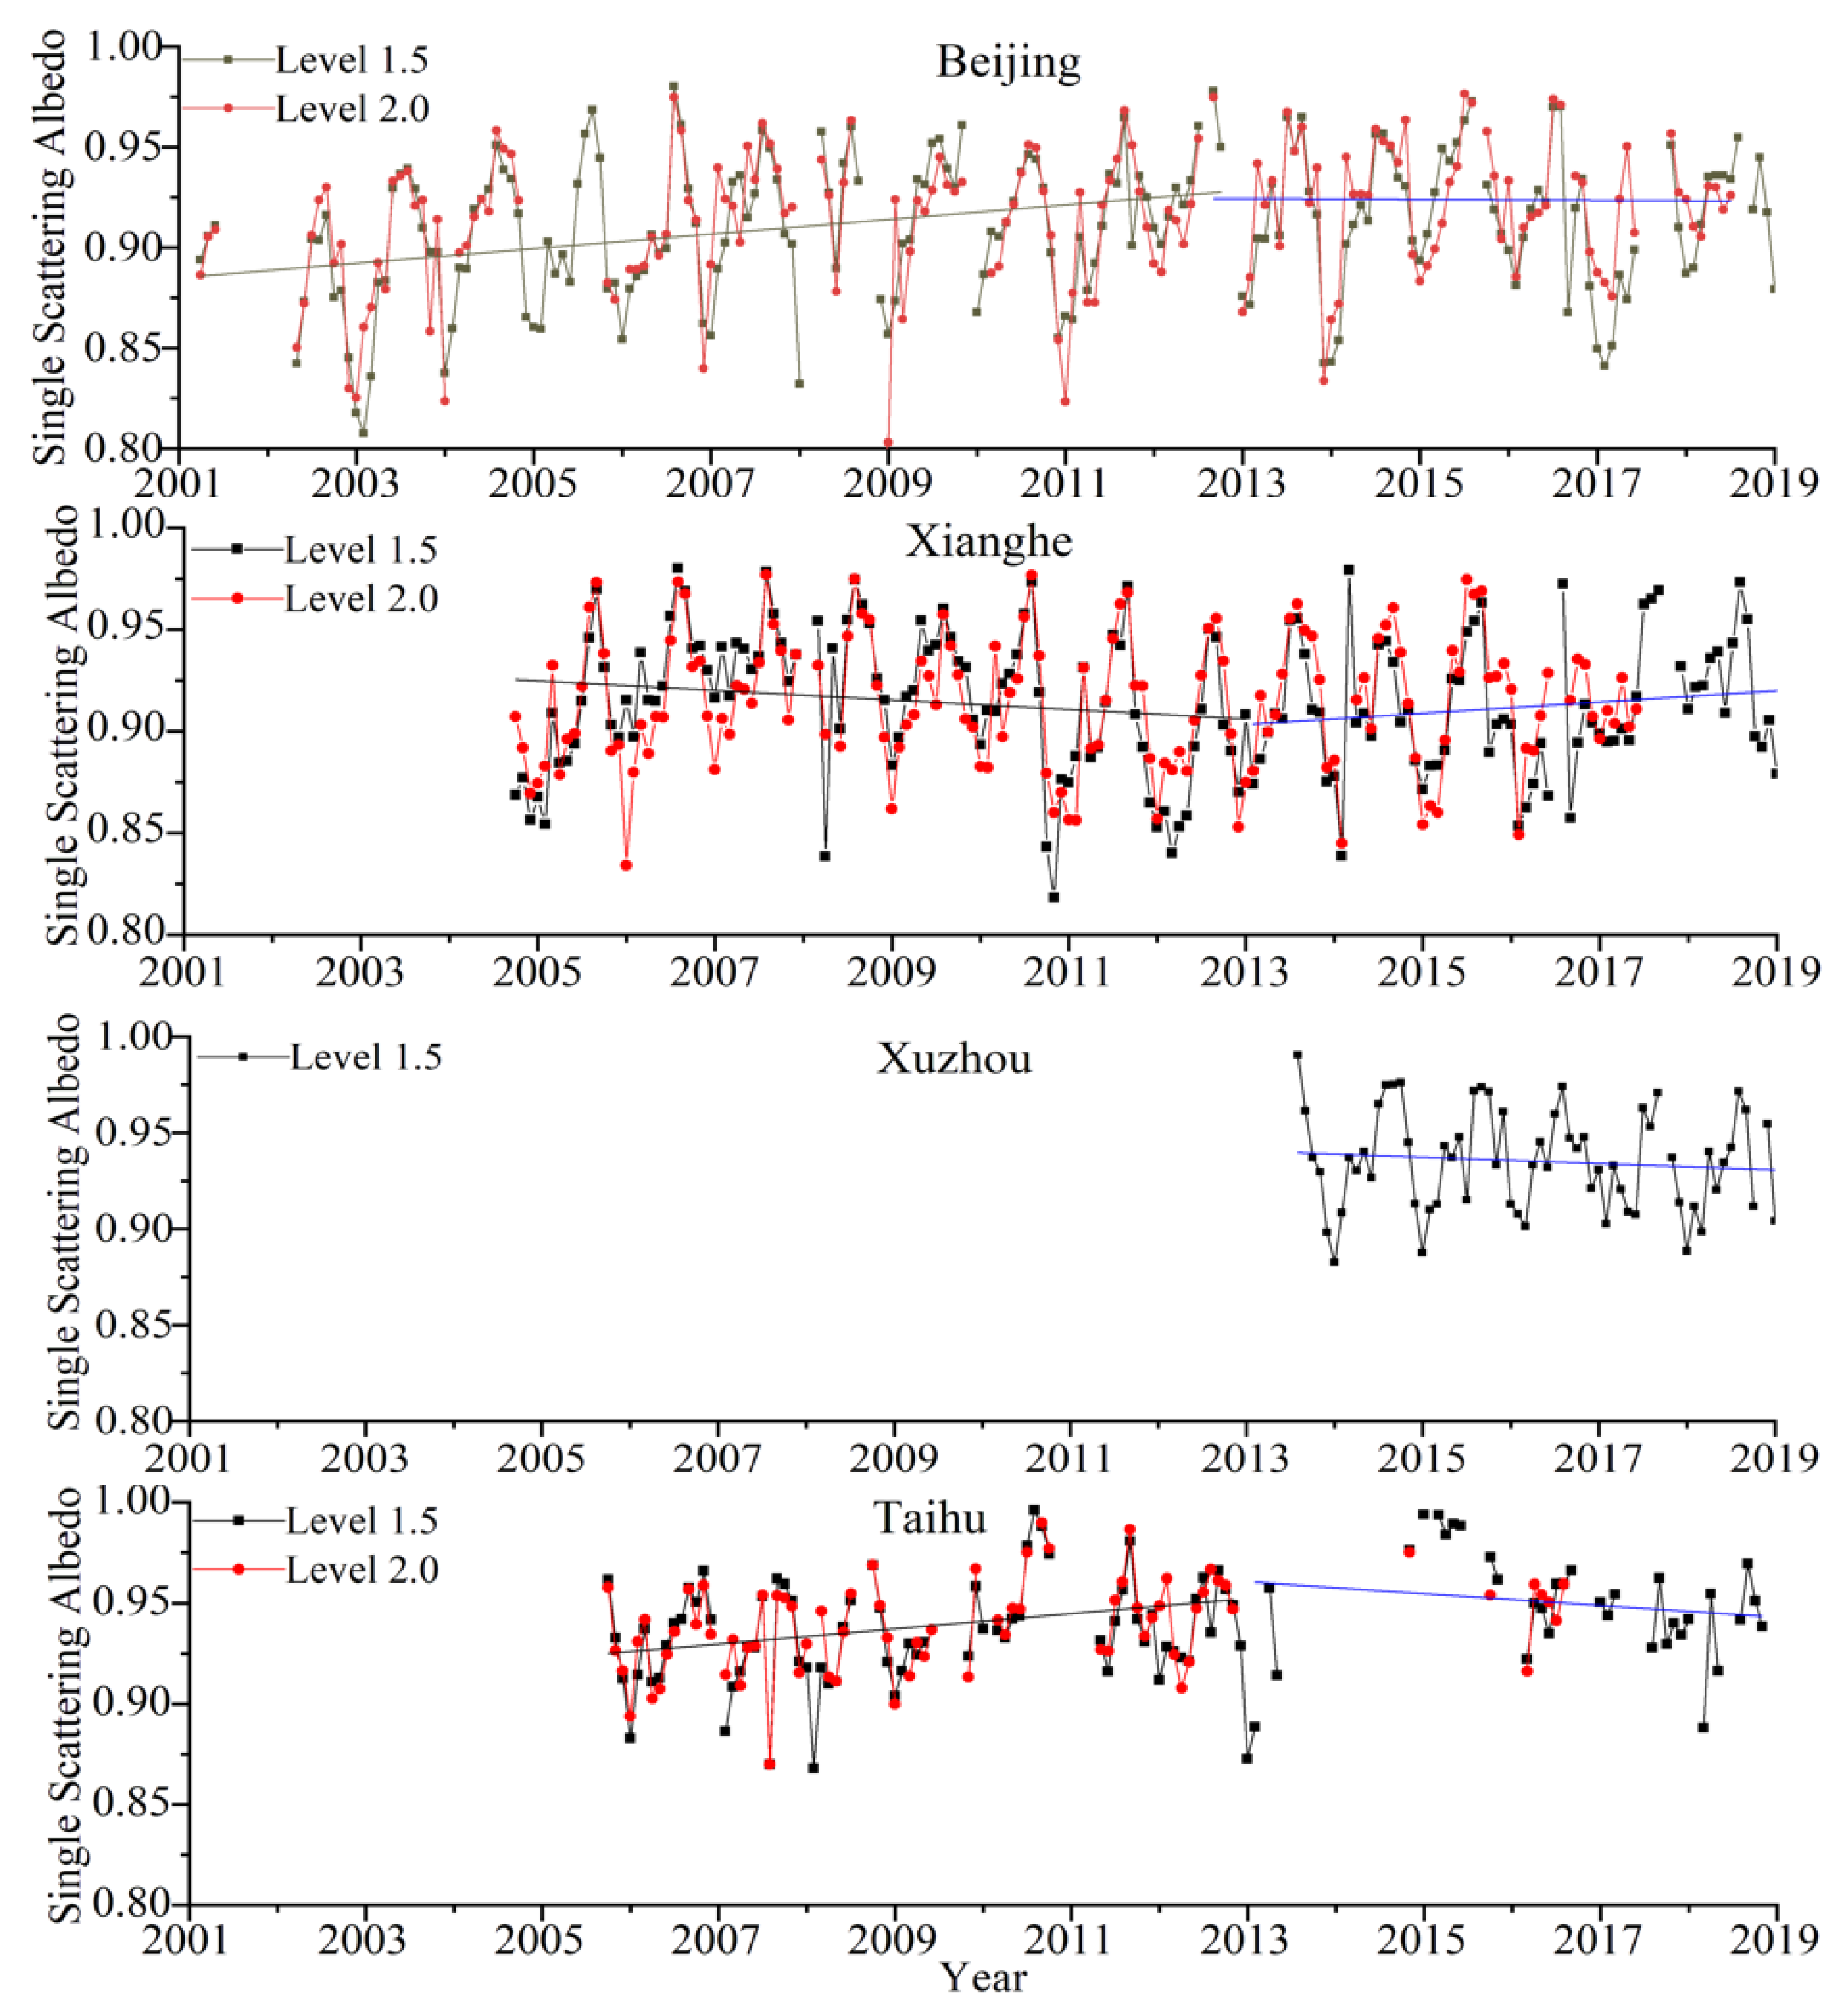
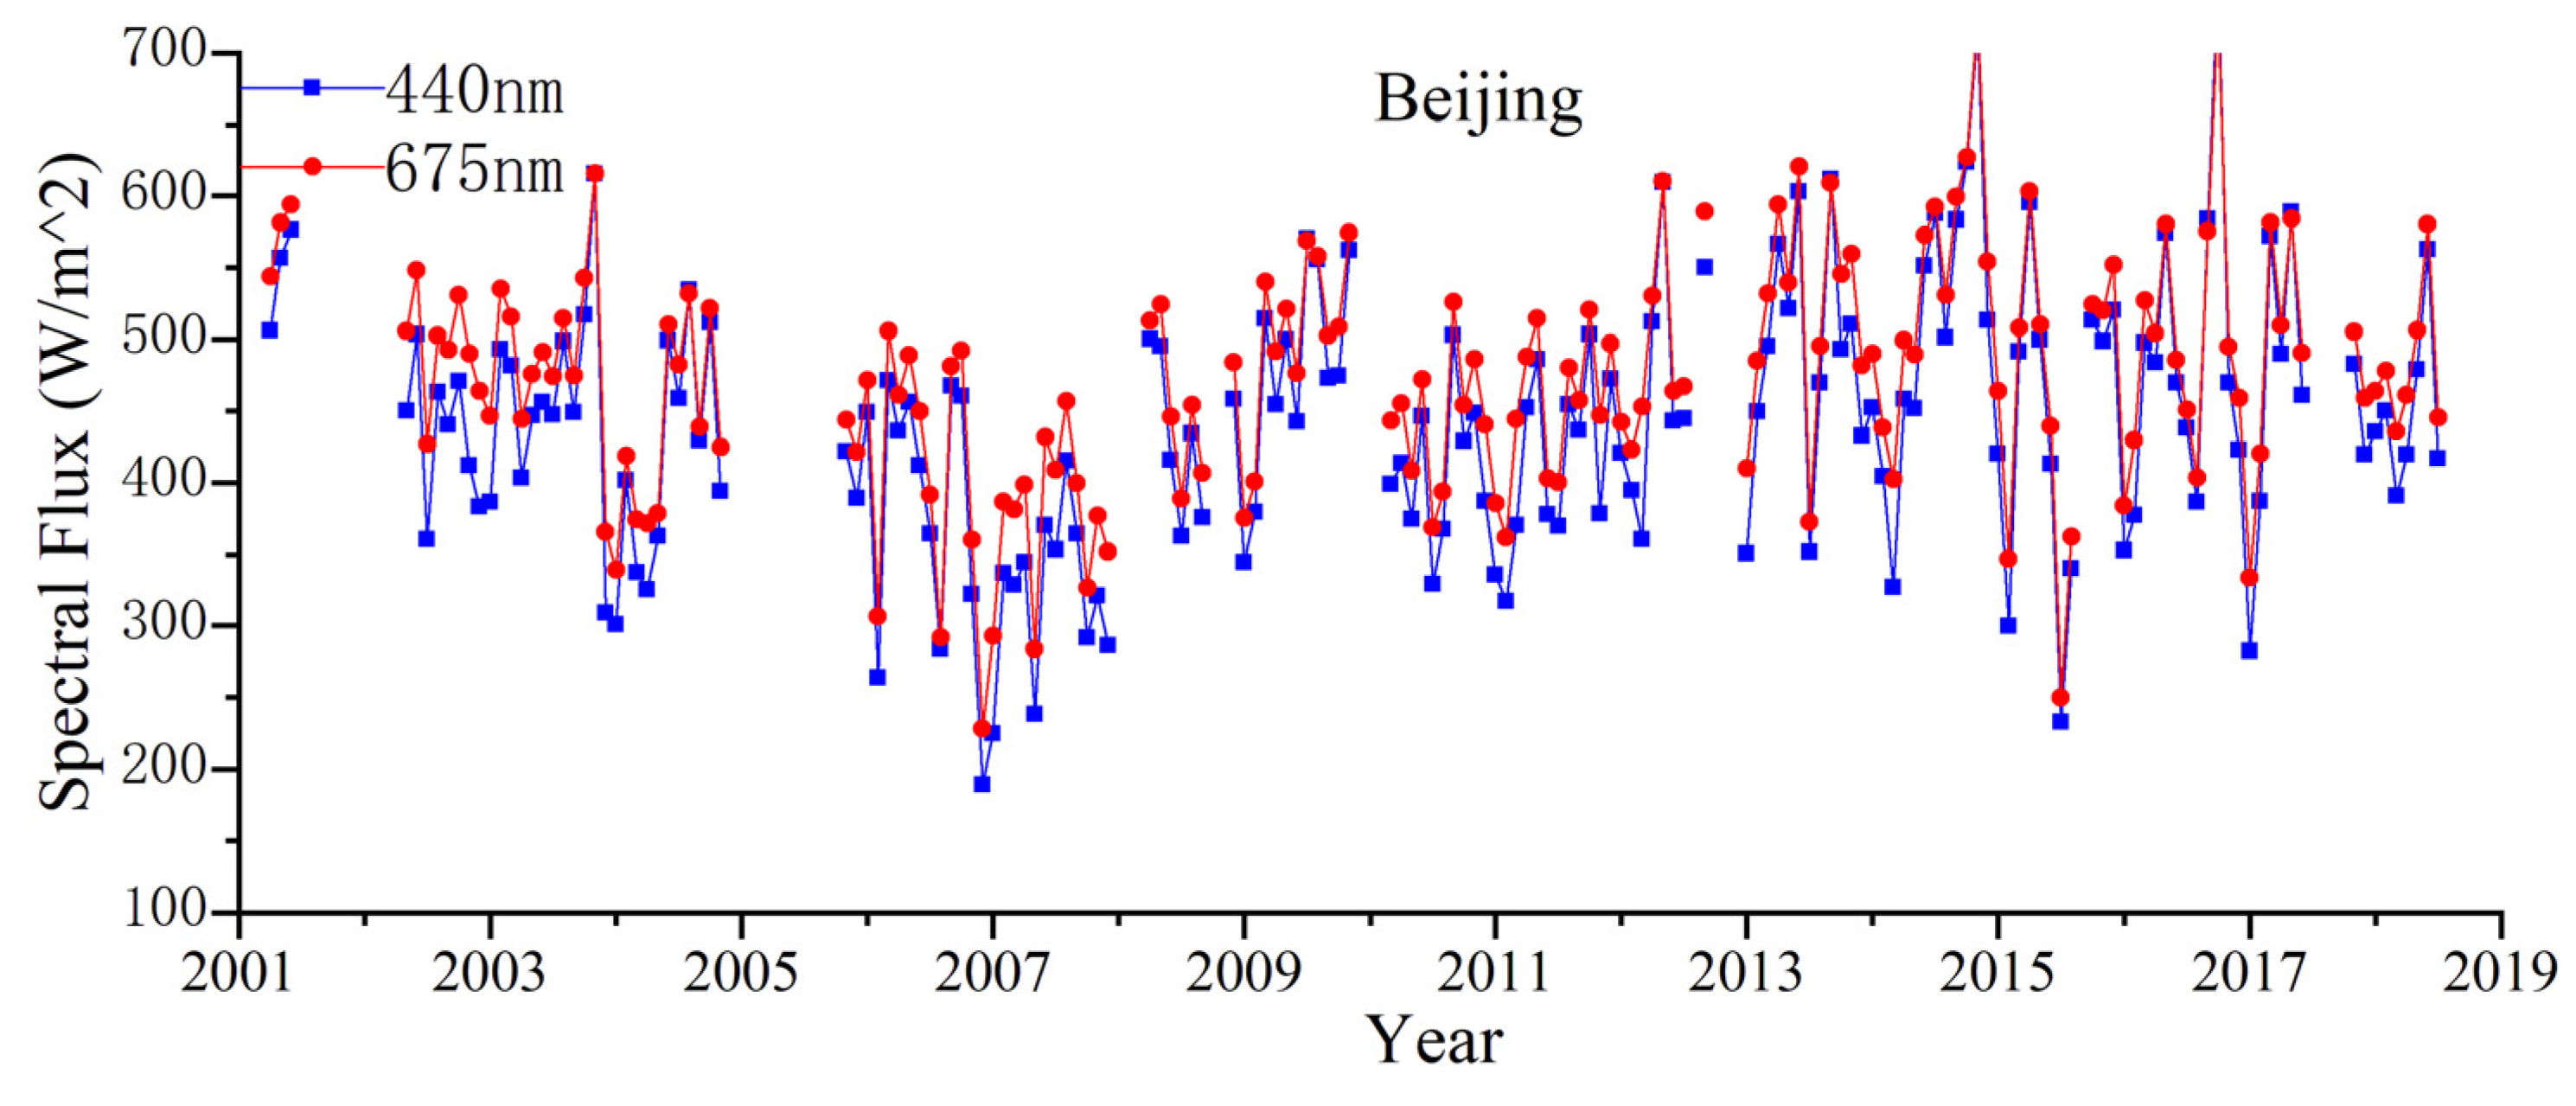
3.2. The Transition of Aerosol Optical and Microphysical Properties

The drastic changes in anthropogenic emissions not only result in a large reduction in aerosol loading in China, but can also exert significant influence on aerosol properties. Figure 6 displays annual variations in the volume size distribution in typical AERONET sites during the 2013–2018 period. The aerosol particles in eastern China have a prevalent bimodal distribution. The fraction of the coarse mode gets lower from north to south, with the influence of dust transport getting weaker [6]. Along with the rapid decline in AOD, the fine-mode aerosols exhibit continuous decrease by ~30–40% in Beijing, Xianghe, and Xuzhou. In contrast, fine particles in the background site of Taihu have distinct temporal variations with regional aerosol loading, which could be driven by regional transport under variable meteorological conditions. Moreover, the fine-mode volume of aerosols in Taihu is at a similar level to those in the NCP, and even gets obviously higher during the years 2016–2018. It can be seen that regional aerosol loading around Taihu remains at a high-level of ~0.6 (Figure 3), and variations in the humid meteorological conditions can have an important contribution. Correspondingly, the median radius of fine-mode aerosols in Taihu gets larger in 2016 and 2017, which is believed to be largely due to hygroscopic growth and ageing agglomeration during the transport process [33].
Despite the large decrease in fine-mode aerosols, there is no clear spatial and temporal trend for the coarse particles in eastern China (Figure 6). Different from fine particles dominated by anthropogenic emissions, coarse particles mainly originate from the long-range transport of airborne dust in deserts and local wind-blown dust from roads and human activities [6]. The annual volume of coarse-mode particles in Beijing is no more than 0.5-0.6 µm3/µm2 in all the radius range during 2015–2017, but increases to 0.7–0.9 in 2013, 2014, and 2018. By comparison, the volume of coarse-mode aerosols in Xianghe and Xuzhou exhibits distinct temporal changes, implying different local sources. While dust transport is regulated by meteorological conditions, the amount of local dust can be influenced by both anthropogenic sources and control policy [17]. In addition, the volume of the coarse particles still accounts for a considerable fraction in the background site of Taihu, indicating the wide distribution of dust aerosols in eastern China.
Considering that the annual AOD of coarse particles can be influenced by both local sources and long-range transport, the MISR total AOD and dust AOD in 2003–2007, 2008–2012, and 2013–2018 were compared to evaluate the overall variations in coarse particles in eastern China (Figure 7). Consistent with MODIS and AERONET observations, there has been large decrease in MISR AOD over eastern China during the last three five-year stages. While aerosol loading over the deserts in western China only shows slight changes, the non-spherical AOD of dust particles has a notable decline over eastern China. Consistent with the emission inventory [17], MISR non-spherical AOD demonstrates that there was an overall decline in coarse particles over eastern China. During 2003–2007, several hotspots of dust AOD (>0.25) were distributed in heavy pollution regions, especially in the NCP. Then, non-spherical AOD in the NCP decreased obviously, and only kept high values over some cities in 2008–2012, indicating that local dust is predominated in these non-spherical particles. The lower non-spherical AOD during 2013–2018 implies that the air quality control measures of China have largely reduced anthropogenic emissions of dust particles. Unlike fine particles dominated by anthropogenic sources, the irregular variations of coarse particles indicate that natural sources such as long-range dust transport provide a significant contribution to coarse particles in eastern China [6,35].
To provide a large-scale view on aerosols of different sizes in eastern China, the small (<0.35 µm), medium (0.35–0.7 µm), and large modes (>0.7 µm) of MISR AOD during the last three five-year stages are presented (Figure 8). MISR small-mode AOD exhibits prevalent high values (>0.3) in the populated regions of eastern China, while it is very low (<0.1) over the deserts of western China. Despite a notable decrease in the total AOD, the small-mode AOD in eastern China still has a high background value (>0.2). By contrast, medium-mode aerosols are mainly concentrated in the Sichuan Basin and central China (>0.15), where moist meteorological conditions can favor the accumulation and hygroscopic growth of fine particles [33]. Along with the rapid decline in anthropogenic emissions, the mean value of medium-mode AOD during 2013–2018 was lower than 0.1 in these hotspots. Since MISR large-mode AOD includes non-spherical retrievals, they have similar variations, but MISR large-mode AOD is obviously lower, which could be due to the average of non-dust days.
Moreover, aerosol absorption in eastern China exhibits a prominent reversal, with dramatic changes in anthropogenic emissions since 2013. Figure 9 shows the temporal variations of SSA in the four AERONET sites. During the early two five-year stages, there was a continuous decrease in the absorption ability of aerosols in eastern China. SSA in the megacity of Beijing increased by more than ~0.05 in 2001–2012. However, SSA in Beijing, Xuzhou, and Taihu began to decline after 2013, demonstrating the enhancement of aerosol absorption with substantial reduction in fine particles. There was an overall 0.03–0.05 decrease in the SSA of these AERONET sites. It should be stated that SSA in the town of Xianghe near Beijing displays different temporal variations. The SSA in Xianghe was at close high values around 0.95 in the summers of 2005–2008, but increased rapidly, from ~0.85 to ~0.93, during winter. After a sudden decline of ~0.03–0.05 in 2009–2010, the SSA in Xianghe rises again since 2011. Besides the overall effects of control measures, changes in local emission sources can also contribute to variations in SSA, such as in Xianghe. The marked reversal in the trends of aerosol absorption proves that the rapid changes in anthropogenic emissions have obviously modified regional aerosol optical properties in eastern China [17].

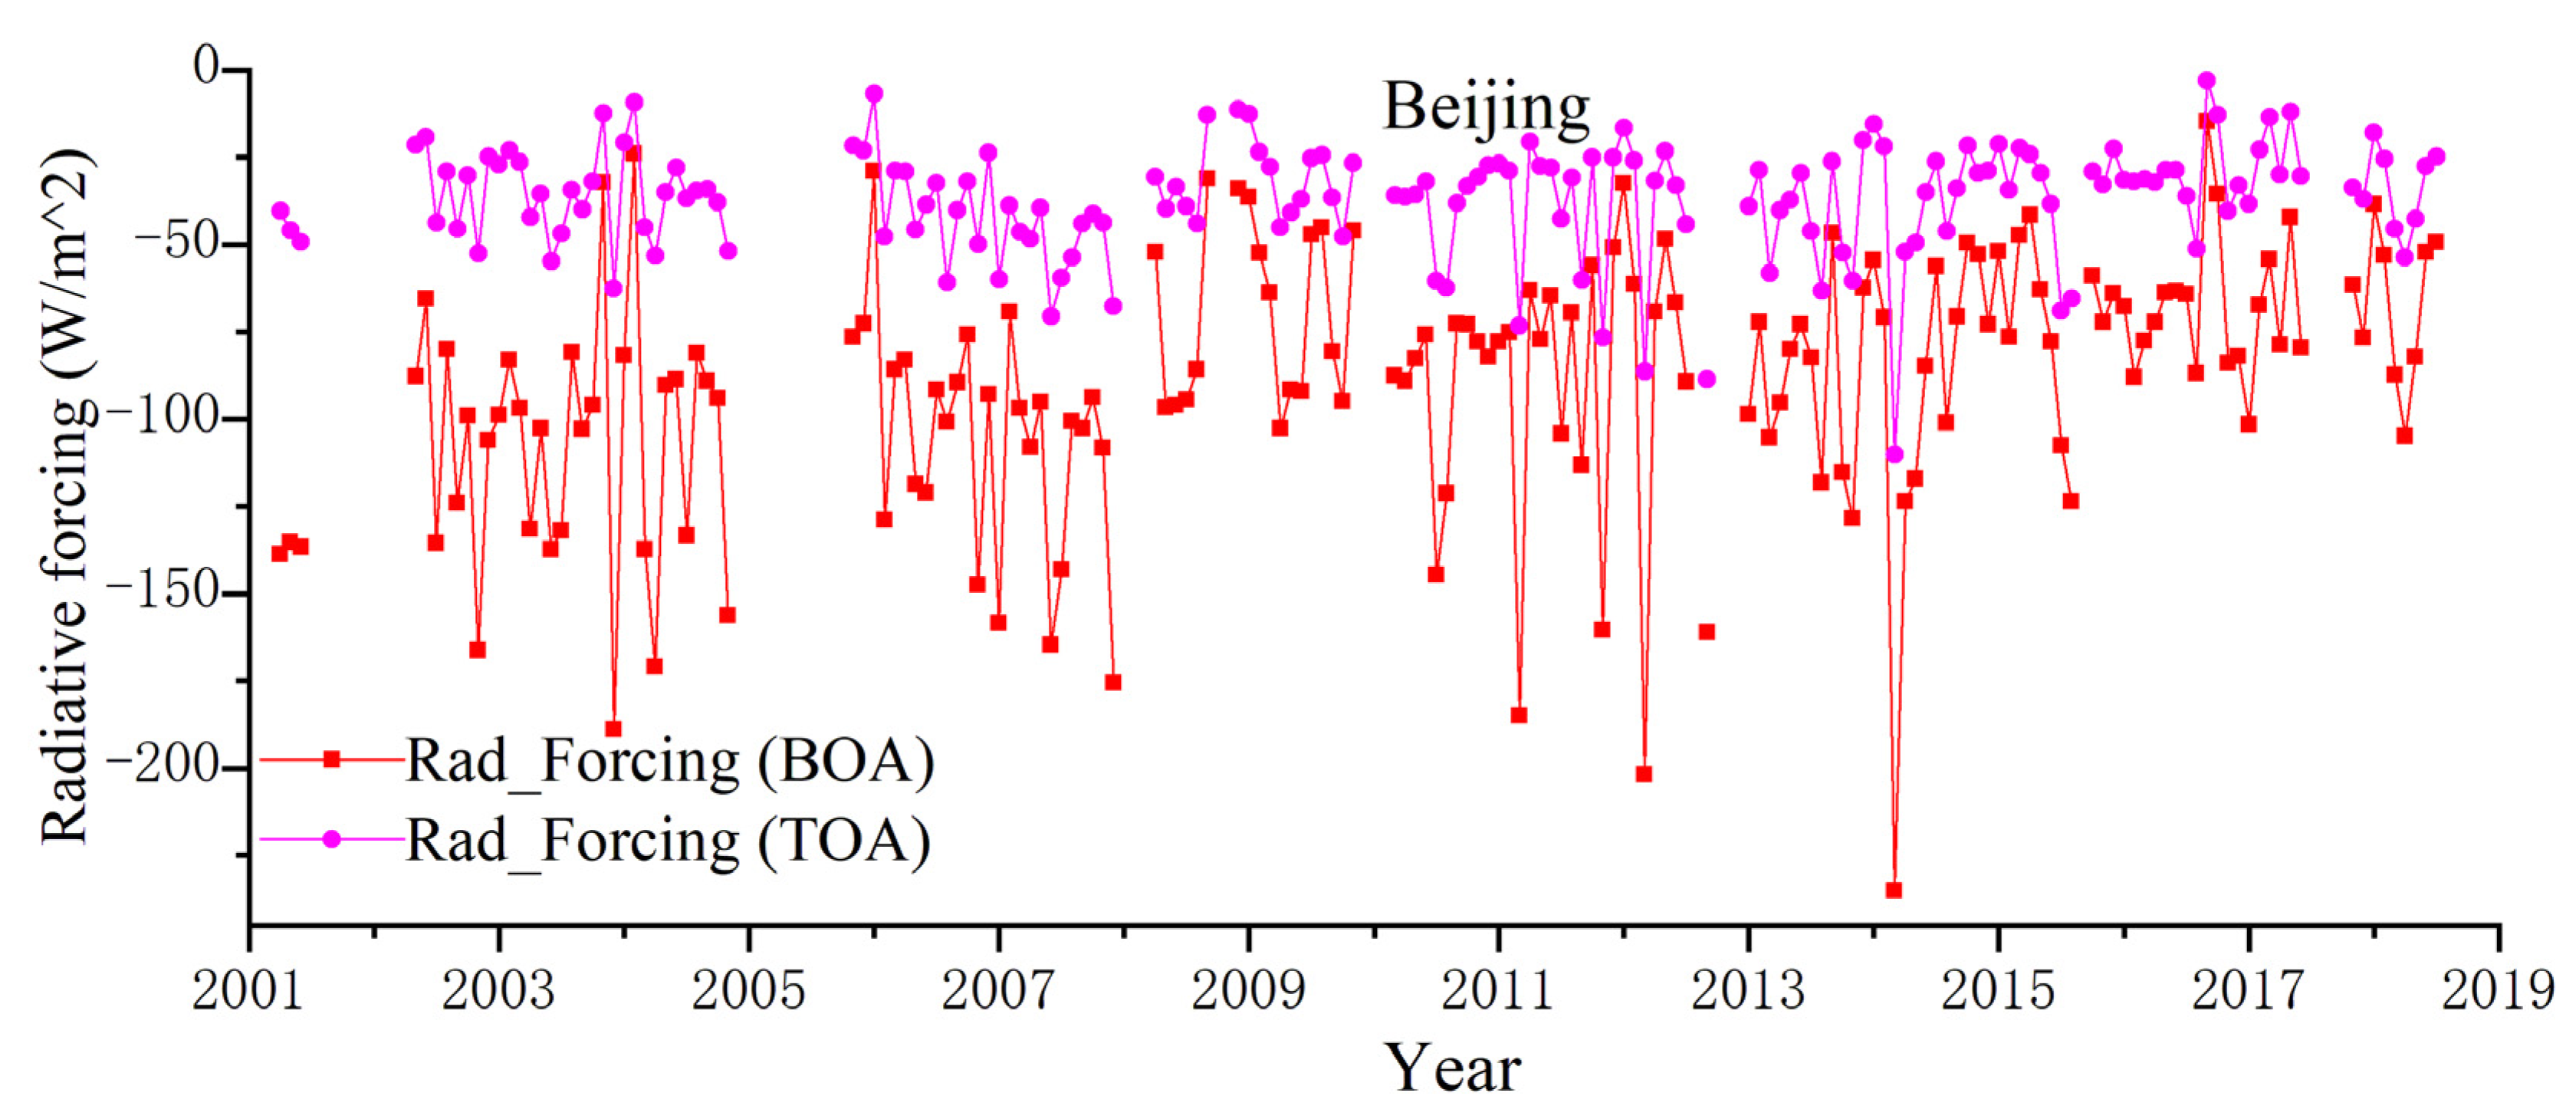
3.3. Influence and Implication of Drastic Changes in Aerosol Properties

Generally, the rapid reduction in anthropogenic emissions in China has led to dramatic changes in aerosol loading and optical properties, which can in turn alter photochemical process and regional climate effects [12,13,14]. Figure 10 shows the long-term trend of downward spectral flux of blue (440 nm) and red (675 nm) band at the bottom of the atmosphere (BOA) in the megacity of Beijing. With the increase in aerosol loading, spectral solar flux reaching the BOA exhibits a large decrease by almost ~100 W/m2 during 2001–2006. Then, surface solar flux in summer increases from ~400 W/m2 in 2007 to ~550–600 W/m2 in 2017. The variations in surface solar flux in Beijing are generally consistent with changes in AERONET AOD, implying that the decrease in aerosol loading has substantially enhanced solar radiation near the surface.
Despite the rapid decline in PM2.5 concentration, regional O3 pollution in summer has been a major air quality problem in eastern China. As shown in Figure 11, the average of daytime maximum 8-h O3 concentration in northern China increased from ~120 µg/m3 in 2013 to ~170 µg/m3 in 2018, indicating prevalent O3 pollution exceeding the O3 standard of 160 µg/m3 in China. It has been found that high-concentration aerosols can reduce O3 production rate by ~25% in Beijing though intense light extinction [14]. As one of the primary gaseous precursors of both PM2.5 and O3, the emission of NOx decreased obviously during the years 2013–2018 [17]. However, the large enhancement of surface solar radiation in eastern China can promote the formation of O3 in summer. Also, model simulations suggest that the reduction of PM can stimulate O3 production by slowing down the aerosol sink of hydroperoxyl radicals [20]. In the other hand, more emission of O3 precursors, VOCs, can make O3 pollution more complicated due to nonlinear VOC/NOx ratios [36]. Therefore, stricter control measurements should be taken accordingly, due to the favorable environment for O3 formation.
The dramatic changes in aerosol amounts and properties led to the rapid transition of aerosol climate effects. Figure 12 displays variations in aerosol radiative forcing (ARF) in Beijing during the period of 2001–2018. As one of the largest aerosol hotspots in the world, the negative ARF at the top of the atmosphere (TOA) in northern China is up to −50–−20 W/m2, which is an order of magnitude higher than the global mean level of −2.40 (± 0.6) W/m2 [37]. The negative TOA ARF steadily decreased in magnitude during 2001-2012 from ~−50 W/m2 to ~−20 W/m2, remaining at a high level. However, reversal began to appear from 2013 onwards, with the amount of TOA ARF increasing to ~−30 W/m2. By contrast, ARF at the bottom of the atmosphere (BOA) has a much larger magnitude, as well as temporal variations. The magnitude of BOA ARF was ~−140–−80 W/m2 during 2001–2007, and then declined continuously to ~−50 W/m2 in 2008–2013. Consistent with the TOA trends, the BOA ARF effect got larger, to ~−80–−50 W/m2 from 2013. Considering notable decrease in aerosol loading, the enhancement of aerosol absorption can be seen as the main driver of increased ARF. Regarding the difference between TOA and BOA ARF, the ARF of the atmosphere was more than 30 W/m2 in 2001–2010, indicating considerable heating effects. Consistent with variations of SSA, ARF of the atmosphere gets smaller as SSA increases, and has become larger since 2013. It is worth noting that there are some extreme BOA and TOA ARF values even lower than −200 and −100 W/m2, respectively. Since monthly ARF can be influenced by clouds, the prevalent haze pollution (AOD > 1.0–3.0) can be predominant in certain cloudy months [5,15]. By changing the amount of solar radiation absorbed in the atmosphere and reaching the Earth’s surface, the large variation of ARF in the regional scale can exert significant influences on atmospheric stability and surface temperature, which in turn can further modify evaporation and cloud formation [8,9,10,11,12,13].

4. Discussion

The combined satellite and ground observations show that the rapid reduction in anthropogenic emissions in eastern China has led to a notable reversal in trends of aerosol properties. The strict control measures implemented by the Chinese government since 2013 have not only greatly improved air quality, but also altered the fraction of different emission sources. As shown in Beijing, the particle pollution has changed from being sulfate-driven to nitrate-driven during winter [18]. Despite the overall reduction in nearly all of the primary anthropogenic emissions, such as SO2, NOx, and black carbon, since 2013, the changes in sulfate and nitrate are much larger than that of black carbon, due to the control measures on SO2 and NOx [17]. Thus, aerosol absorption in eastern China exhibits an increasing trend. By contrast, the much larger increase in sulfate and nitrate than black carbon led to increasing SSA before 2013. Moreover, with the continuous decline in fine particles, coarse particles such as natural dust become more important in PM2.5 and aerosol properties, which can change particle size distribution. In addition, increased emissions such as active VOCs can lead to a higher fraction of secondary organic aerosols in oxidation. Despite similar optical properties in the four AERONET sites, a large spatial difference can exist due to diverse sources in eastern China.
While there have been numerous aerosol remote sensing sites in China [7], few have continuous long-term observations. Despite only four AERONET sites being used, consistent trends of aerosol properties in these sites demonstrate the regional transition of particle pollution under the background of national air quality control measures. Although AERONET aerosol parameters have respective uncertainties [31], their retrieval errors are systematic deviation caused by fixed assumptions rather than random bias [30]. Thus, the relative variation of long-term trends in aerosol properties is reliable and robust [22]. The reversal of trends in aerosol optical properties in the two time periods before and after 2013 is remarkable, exhibiting a consistent response to variations in anthropogenic emissions. Additionally, the low sampling frequency of the monthly mean values in cloudy seasons can lead to some extreme values, but shows no marked impact on long-term trends [15].
Previous studies in China have shown intense interactions between aerosols and the boundary layer [13], aerosols’ indirect effects on clouds [11,12,13,14,15,16,17,18,19,20,21,22], and photochemistry [14,20]. Within the last five years, the frequent haze pollution (AOD > 1.0) in northern China has decreased from more than 80 days/year to less than 30 days, and aerosol properties, including absorption and size distribution, have undergone rapid reversal in variation trends. As shown in Beijing, large changes have occurred in ARF at both the TOA and BOA, which can exert significant influence on atmospheric relative, temperature, stability and cloudiness [1,3,4]. The changing aerosol properties associated with different components directly determine the formation of cloud condensation nuclei (CCN). Comprehensive observations are needed to investigate and quantify the interactions between the rapid transition of aerosol properties and the atmospheric environment and regional climate.

5. Conclusions

The clean air actions of the Chinese government since 2013 have greatly reduced anthropogenic emissions within the last five years, which could lead to considerable changes in aerosol properties, but this is still not clearly understood. In this study, we provide an overview on characteristics of aerosol properties during this special period based on combined MODIS, MISR, and ground AERONET observations. The amount and optical properties of aerosols in eastern China exhibit drastic transition during 2013–2018, with notable reversals compared with those before 2013. Consistent with variations in PM2.5, MODIS AOD decreased from ~0.8 to ~0.5 in the hotspot region of eastern China, and frequency of regional haze pollution declined by more than ~60%. While the volume of fine-mode particles exhibited a continuous decline from 2013, the levels of coarse aerosols have no regular variations. MISR fraction AOD of different size modes shows that there is an overall reduction in coarse particles during 2013–2018, but natural sources make a considerable contribution. Contrary to the increased SSA (>0.05) during 2001–2012, aerosol absorption gets stronger with decreasing SSA (~−0.03) since 2013.
The trends in aerosol properties since 2013 have substantially modified aerosol radiative effects in eastern China. While the magnitude of TOA ARF in Beijing decreased by more than 20 W/m2 during the 2001–2012 period, the negative TOA ARF has increased by ~10 W/m2 since 2013. The BOA ARF exhibited much variation, and declined from ~−100 W/m2 to ~−50 W/m2. Then, BOA ARF shifted to increase by ~30 W/m2 from 2013 onwards. Despite the decreasing AOD since 2013, the enhanced aerosol absorption can be seen as the main driver of the reversal in trends of ARF. Considering the dramatic variations in trends of aerosol properties, the associated interactions between air pollution and regional climate under this complicated background should be further studied.

Author Contributions

Conceptualization: M.T. and L.W.; Methodology, J.T.; Software, Z.W.; Writing—Original Draft Preparation, M.T.; Writing—Review & Editing, L.W.; Supervision, L.C. and L.W.; Funding Acquisition, M.T. and L.C. All authors have read and agreed to the published version of the manuscript.

Funding

This work was supported by the National Key R&D Program of China (Grant No. 2017YFB0502805) and the National Natural Science Foundation of China (Grant No. 41871262 and 41830109).

Acknowledgments

We thank the MODIS Deep Blue and MISR algorithm team (https://portal.nccs.nasa.gov/) for the data used in our work. We acknowledge AERONET site PIs (B.N. Holben, H. Chen, L. Wu, R. Ma, P. Wang, X. Xia, and Z. Li) for providing the aerosol data available.

Conflicts of Interest

The authors declare no conflict of interest.

References

  1. Ramanathan, V.; Crutzen, P.J.; Kiehl, J.T.; Rosenfeld, D. Aerosols, Climate, and the Hydrological Cycle. Science 2001, 294, 2119–2124. [Google Scholar] [CrossRef] [Green Version]
  2. Pope, I.C.; Burnett, R.T.; Thun, M.J.; Calle, E.E.; Krewski, D.; Ito, K.; Thurston, G.D. Lung cancer, cardiopulmonary mortality, and long-term exposure to fine particulate air pollution. JAMA 2002, 287, 1132–1141. [Google Scholar] [CrossRef] [Green Version]
  3. IPCC. Climate Change: The Physical Science Basis. Contribution of Working Group I to the Fifth Assessment Report of the Intergovernmental Panel on Climate Change; Stocker, T.F., Qin, D., Plattner, G.K., Tignor, M.M., Allen, S.K., Boschung, J., Nauels, A., Xia, Y., Bex, V., Midgley, P.M.P.M., et al., Eds.; Cambridge University Press: Cambridge, UK; New York, NY, USA, 2013; 1535p. [Google Scholar]
  4. Kaufman, Y.J.; Tanre, D.; Boucher, O. A satellite view of aerosols in the climate system. Nature 2002, 419, 215–223. [Google Scholar] [CrossRef] [PubMed]
  5. Lu, Z.; Zhang, Q.; Streets, D.G. Sulfur dioxide and primary carbonaceous aerosol emissions in China and India, 1996–2010. Atmos. Chem. Phys. 2011, 11, 9839–9864. [Google Scholar] [CrossRef] [Green Version]
  6. Tao, M.; Chen, L.; Su, L.; Tao, J. Satellite observation of regional haze pollution over the North China Plain. J. Geophys. Res. 2012, 117, D12203. [Google Scholar] [CrossRef]
  7. Che, H.; Xia, X.; Zhao, H.; Dubovik, O.; Holben, B.N.; Goloub, P.; Cuevas-Agulló, E.; Estelles, V.; Wang, Y.; Zhu, J.; et al. Spatial distribution of aerosol microphysical and optical properties and direct radiative effect from the China Aerosol Remote Sensing Network. Atmos. Chem. Phys. 2019, 19, 11843–11864. [Google Scholar] [CrossRef] [Green Version]
  8. Li, Z.; Li, C.; Chen, H.; Tsay, S.C.; Holben, B.; Huang, J.; Li, B.; Maring, H.; Qian, Y.; Shi, G.; et al. East Asian Studies of Tropospheric Aerosols and their Impact on Regional Climate (EAST-AIRC): An overview. J. Geophys. Res. 2011, 116, D00K34. [Google Scholar] [CrossRef] [Green Version]
  9. Li, Z.; Lau, W.M.; Ramanathan, V.; Wu, G.; Ding, Y.; Manoj, M.G.; Liu, J.; Qian, Y.; Li, J.; Zhou, T.; et al. Aerosol and monsoon climate interactions over Asia. Rev Geophys. 2016, 54, 866–929. [Google Scholar] [CrossRef]
  10. Gao, Y.; Zhang, M.; Liu, Z.; Wang, L.; Wang, P.; Xia, X.; Tao, M.; Zhu, L. Modeling the feedback between aerosol and meteorological variables in the atmospheric boundary layer during a severe fog–haze event over the North China Plain. Atmos. Chem. Phys. 2015, 15, 4279–4295. [Google Scholar] [CrossRef] [Green Version]
  11. Xu, X.; Guo, X.; Zhao, T.; An, X.; Zhao, Y.; Quan, J.; Mao, F.; Gao, Y.; Cheng, X.; Zhu, W.; et al. Are precipitation anomalies associated with aerosol variations over eastern China? Atmosp. Chem. Phys. 2017, 17, 8011–8019. [Google Scholar] [CrossRef] [Green Version]
  12. Guo, J.; Su, T.; Li, Z.; Miao, Y.; Li, J.; Liu, H.; Xu, H.; Cribb, M.; Zhai, P. Declining frequency of summertime local-scale precipitation over eastern China from 1970 to 2010 and its potential link to aerosols. Geophys. Res. Lett. 2017, 44, 5700–5708. [Google Scholar] [CrossRef]
  13. Li, Z.; Guo, J.; Ding, A.; Liao, H.; Liu, J.; Sun, Y.; Wang, T.; Xue, H.; Zhang, H.; Zhu, B. Aerosol and boundary-layer interactions and impact on air quality. Natl. Sci. Rev. 2017, 4, 810–833. [Google Scholar] [CrossRef]
  14. Wang, W.; Li, X.; Shao, M.; Hu, M.; Zeng, L.; Wu, Y.; Tan, T. The impact of aerosols on photolysis frequencies and ozone production in Beijing during the 4-year period 2012–2015. Atmos. Chem. Phys. 2019, 19, 9413–9429. [Google Scholar] [CrossRef] [Green Version]
  15. Tao, M.; Chen, L.; Wang, Z.; Wang, J.; Tao, J.; Wang, X. Did the widespread haze pollution over China increase during the last decade? A satellite view from space. Environ. Res. Lett. 2016, 11, 054019. [Google Scholar] [CrossRef]
  16. Filonchyk, M.; Yan, H.; Zhang, Z.; Yang, S.; Li, W.; Li, Y. Combined use of satellite and surface observations to study aerosol optical depth in different regions of China. Sci. Rep. 2019, 9, 6174. [Google Scholar] [CrossRef]
  17. Zheng, B.; Tong, D.; Li, M.; Liu, F.; Hong, C.; Geng, G.; Li, H.; Li, X.; Peng, L.; Qi, J.; et al. Trends in China’s anthropogenic emissions since 2010 as the consequence of clean air actions. Atmos. Chem. Phys. 2018, 18, 14095–14111. [Google Scholar] [CrossRef] [Green Version]
  18. Zhai, S.; Jacob, D.J.; Wang, X.; Shen, L.; Li, K.; Zhang, Y.; Gui, K.; Zhao, T.; Liao, H. Fine particulate matter (PM2.5) trends in China, 2013–2018: Separating contributions from anthropogenic emissions and meteorology. Atmos. Chem. Phys. 2019, 19, 11031–11041. [Google Scholar] [CrossRef] [Green Version]
  19. Li, H.; Cheng, J.; Zhang, Q.; Zheng, B.; Zhang, Y.; Zheng, G.; He, K. Rapid transition in winter aerosol composition in Beijing from 2014 to 2017: Response to clean air actions. Atmos. Chem. Phys. 2019, 19, 11485–11499. [Google Scholar] [CrossRef] [Green Version]
  20. Li, K.; Jacob, D.J.; Liao, H.; Shen, L.; Zhang, Q.; Bates, K.H. Anthropogenic drivers of 2013–2017 trends in summer surface ozone in China. Proc. Natl. Acad. Sci. USA 2019, 116, 422–427. [Google Scholar] [CrossRef] [Green Version]
  21. Tao, M.; Wang, Z.; Tao, J.; Chen, L.; Wang, J.; Hou, C.; Wang, L.; Xu, X.; Zhu, H. How Do Aerosol Properties Affect the Temporal Variation of MODIS AOD Bias in Eastern China? Remote Sens. 2017, 9, 800. [Google Scholar] [CrossRef] [Green Version]
  22. Levy, R.C.; Mattoo, S.; Munchak, L.A.; Remer, L.A.; Sayer, A.M.; Patadia, F.; Hsu, N.C. The Collection 6 MODIS aerosol products over land and ocean. Atmos. Meas. Tech. 2013, 6, 2989–3034. [Google Scholar] [CrossRef] [Green Version]
  23. Hsu, N.C.; Jeong, M.J.; Bettenhausen, C.; Hansell, A.M.; Seftor, C.S.; Huang, J.; Tsay, S.C. Enhanced Deep Blue aerosol retrieval algorithm: the second generation. J. Geohys. Res. 2013, 118, 9296–9315. [Google Scholar] [CrossRef]
  24. Tao, M.; Chen, L.; Wang, Z.; Tao, J.; Che, H.; Wang, X.; Wang, Y. Comparison and evaluation of the MODIS Collection 6 aerosol data in China. J. Geophys. Res. Atmos. 2015, 120, 6992–7005. [Google Scholar] [CrossRef]
  25. Garay, M.J.; Kalashnikova, O.V.; Bull, M.A. Development and assessment of a higher-spatial-resolution (4.4 km) MISR aerosol optical depth product using AERONET-DRAGON data. Atmos. Chem. Phys. 2017, 17. [Google Scholar] [CrossRef] [Green Version]
  26. Kahn, R.A.; Gaitley, B.J.; Garay, M.J.; Diner, D.J.; Eck, T.F.; Smirnov, A.; Holben, B.N. Multiangle Imaging SpectroRadiometer global aerosol product assessment by comparison with the Aerosol Robotic Network. J. Geophys. Res. Atmos. 2010, 115, D23. [Google Scholar] [CrossRef]
  27. Li, S.; Kahn, R.; Chin, M.; Garay, M.J.; Liu, Y. Improving satellite-retrieved aerosol microphysical properties using GOCART data. Atmos. Meas. Tech. 2015, 8, 1157–1171. [Google Scholar] [CrossRef] [Green Version]
  28. Kahn, R.A.; Gaitley, B.J. An analysis of global aerosol type as retrieved by MISR. J. Geohys. Res. 2015, 120, 4248–4281. [Google Scholar] [CrossRef]
  29. Holben, B.N.; Eck, T.F.; Slutsker, I.; Tanre′, D.; Buis, J.P.; Setzer, A.; Vermote, E.; Reagan, J.A.; Kaufman, Y.J.; Nakajima, T.; et al. AERONET—A Federated Instrument Network and Data Archive for Aerosol Characterization. Remote Sens. Environ. 1998, 66, 1–16. [Google Scholar] [CrossRef]
  30. Dubovik, O.; King, M.D. A flexible inversion algorithm for retrieval of aerosol optical properties from Sun and sky radiance measurements. J. Geophys. Res. Atmos. 2000, 105, 20673–20696. [Google Scholar] [CrossRef] [Green Version]
  31. Dubovik, O.; Holben, B.; Eck, T.F.; Smirnov, A.; Kaufman, Y.J.; King, M.D.; Tanré, D.; Slutsker, I. Variability of Absorption and Optical Properties of Key Aerosol Types Observed in Worldwide Locations. J. Atmos. Sci. 2002, 59, 590–608. [Google Scholar] [CrossRef]
  32. Giles, D.M.; Sinyuk, A.; Sorokin, M.G.; Schafer, J.S.; Smirnov, A.; Slutsker, I.; Eck, T.F.; Holben, B.N.; Lewis, J.R.; Campbell, J.R.; et al. Advancements in the Aerosol Robotic Network (AERONET) Version 3 database—Automated near-real-time quality control algorithm with improved cloud screening for Sun photometer aerosol optical depth (AOD) measurements. Atmos. Meas. Tech. 2019, 12, 169–209. [Google Scholar] [CrossRef] [Green Version]
  33. Zhang, L.; Sun, J.Y.; Shen, X.J.; Zhang, Y.M.; Che, H.; Ma, Q.L.; Zhang, Y.W.; Zhang, X.Y.; Ogren, J.A. Observations of relative humidity effects on aerosol light scattering in the Yangtze River Delta of China. Atmos. Chem. Phys. 2015, 15, 8439–8454. [Google Scholar] [CrossRef] [Green Version]
  34. Lin, J.T.; McElroy, M.B. Detection from space of a reduction in anthropogenic emissions of nitrogen oxides during the Chinese economic downturn. Atmos. Chem. Phys. 2011, 11, 8171–8188. [Google Scholar] [CrossRef] [Green Version]
  35. Tao, M.; Chen, L.; Wang, Z.; Ma, P.; Tao, J.; Jia, S. A study of urban pollution and haze clouds over northern China during the dusty season based on satellite and surface observations. Atmos. Environ. 2014, 82, 183–192. [Google Scholar] [CrossRef]
  36. Lu, X.; Zhang, L.; Chen, Y.; Zhou, M.; Zheng, B.; Li, K.; Liu, Y.; Lin, J.; Fu, T.M.; Zhang, Q. Exploring 2016–2017 surface ozone pollution over China: Source contributions and meteorological influences. Atmos. Chem. Phys. 2019, 19, 8339–8361. [Google Scholar] [CrossRef] [Green Version]
  37. Matus, A.V.; L’Ecuyer, T.S.; Henderson, D.S. New Estimates of Aerosol Direct Radiative Effects and Forcing From A-Train Satellite Observations. Geophys. Res. Lett. 2019, 46, 8338–8346. [Google Scholar] [CrossRef]
Figure 1. Multi-angle Imaging Spectroradiometer (MISR) Aerosol Optical Depth (AOD) in 2018 and location of the used AERONET (pentagram) and air quality monitoring (dot) sites.
Remotesensing 12 00523 g001
Figure 2. Annual mean of 24-h PM2.5 over mainland of China in 2013–2018.
Remotesensing 12 00523 g002
Figure 3. Annual mean of MODIS DB AOD over China during 2013–2018.
Remotesensing 12 00523 g003
Figure 4. Temporal variations of monthly AERONET AOD.
Remotesensing 12 00523 g004
Figure 5. Annual frequency of MODIS AOD > 1.0 during 2013–2018.
Remotesensing 12 00523 g005
Figure 6. Annual mean of AERONET volume size distribution during 2013–2018.
Remotesensing 12 00523 g006
Figure 7. (ac) MISR AOD, and (df) nonsphercial AOD in 2003–2007, 2008–2012, and 2013–2018, respectively.
Remotesensing 12 00523 g007
Figure 8. MISR (ac) small-mode, (df) medium-mode, and (gi) large-mode AOD in 2003–2007, 2008–2012, and 2013–2018, respectively.
Remotesensing 12 00523 g008
Figure 9. Temporal variations of monthly variations of AERONET SSA values.
Remotesensing 12 00523 g009
Figure 10. Monthly variations of downward spectral solar flux near surface at 440 and 675 nm in Beijing.
Remotesensing 12 00523 g010
Figure 11. Annual mean of daytime maximum 8-h O3 over the mainland of China during the summers of 2013–2018.
Remotesensing 12 00523 g011
Figure 12. Temporal variations of monthly aerosol radiative forcing in Beijing.
Remotesensing 12 00523 g012
Table 1. Variations in annual mean PM2.5 concentration (µg/m3) and corresponding variance in typical megacities of eastern China.
Site 201320142015201620172018
Beijing 85.1 ± 64.585.3 ± 69.179.1 ± 70.971.1 ± 69.157.0 ± 54.449.5 ± 42.7
Shijiazhuang149.3 ± 110.9125.6 ± 97.486.9 ± 65.594.6 ± 88.481.4 ± 62.669.5 ± 49.5
Xuzhou73.8 ± 43.267.0 ± 43.263.6 ± 37.959.7 ± 40.267.2 ± 42.066.2 ± 47.8
Zhengzhou109.0 ± 72.387.9 ± 50.294.9 ± 59.477.7 ± 68.770.7 ± 53.464.1 ± 49.9
Nanjing77.3 ± 49.573.9 ± 40.556.6 ± 35.847.5 ± 31.440.7 ± 28.943.1 ± 32.6
Wuhan92.2 ± 64.980.7 ± 50.369.2 ± 42.556.2 ± 35.551.9 ± 34.847.9 ± 29.9

