Abstract
Droughts can exert a strong influence on the regional energy balance of the Amazon and Cerrado, as can the replacement of native vegetation by croplands. What remains unclear is how these two forcing factors interact and whether land cover changes fundamentally alter the sensitivity of the energy balance components to drought events. To fill this gap, we used remote sensing data to evaluate the impacts of drought on evapotranspiration (ET), land surface temperature (LST), and albedo on cultivated areas, savannas, and forests. Our results (for seasonal drought) indicate that increases in monthly dryness across Mato Grosso state (southern Amazonia and northern Cerrado) drive greater increases in LST and albedo in croplands than in forests. Furthermore, during the 2007 and 2010 droughts, croplands became hotter (0.1–0.8 °C) than savannas (0.3–0.6 °C) and forests (0.2–0.3 °C). However, forest ET was consistently higher than ET in all other land uses. This finding likely indicates that forests can access deeper soil water during droughts. Overall, our findings suggest that forest remnants can play a fundamental role in the mitigation of the negative impacts of extreme drought events, contributing to a higher ET and lower LST.
1. Introduction
Approximately 20% of Amazon vegetation and 50% of Cerrado have already been converted to other uses [1], largely pastures and croplands [2,3,4,5]. While deforestation rates in both biomes have declined from their peak in the early 2000s [3,6], between 5000 and 9000 km2 are still deforested each year. The state of Mato Grosso has been at the forefront of deforestation, accounting for 40% of all Amazon deforestation from 2000 to 2005 and about 20% to date (1341 km2) [7]. Mato Grosso also accounted for 24% of deforestation in the Cerrado biome from 2014 to 2017 [7]. Such changes in land use are expected to drive important regional climatic changes [8,9] because deforested areas covered by crops and pastures tend to be warmer and evapotranspire less [10,11,12] than areas covered by native forests and savannas. Such deforestation-induced climate changes have the potential to amplify drought effects on vegetation [13].
In recent years, the Amazon–Cerrado ecotone has experienced four severe droughts [13,14,15,16,17]. In 2005 and 2010, precipitation was below the long-term average across 37% and 50% of the Amazon region, respectively, mostly due to increases in sea surface temperatures (SST) in the tropical North Atlantic Ocean [14,15,18]. In 2015, the Amazon and Cerrado experienced another severe drought, but this time related to a strong El Niño event [16,18]. Furthermore, precipitation across the Xingu region (southeast Amazonia) was lower in 2007 than in any other year during the 2000–2010 period [12,19]. While several lines of evidence suggest that drought frequency will increase in the near future [13,20], it is still unclear how drought intensification may influence the regional energy balance across different land uses.
Tropical forests and savannas have several strategies to cope with droughts [6,19]. For example, neotropical trees and shrubs can access large volumes of soil water (e.g., below 15 m deep) via deep root systems that help sustain high photosynthesis and evapotranspiration during dry periods [11,21,22]. However, droughts can have severe consequences for the structure and functioning of tropical vegetation [23]. In a large-scale rainfall exclusion experiment, for instance, tree mortality abruptly increased after deep soil moisture dropped below 50% for two consecutive years [24]. Further, savanna tree leaves tend to senesce or arrest ET during the dry season, although some trees and shrubs can maintain green leaves all year long.
As large areas of the Amazon and Cerrado are converted to pasture and croplands, the region’s capacity to cycle water during dry periods can be greatly diminished [18]. In fact, climatic changes associated with deforestation in the Amazon and Cerrado can exacerbate the effects of regional droughts. Pasture and croplands replacing forests and savannas tend to decrease evapotranspiration and increase sensible heat [12,25,26]. These changes in the energy balance components alter the regional climate, and may partially account for the 18-day lengthening of the dry season observed across the southeast Amazon [27,28,29]. Moreover, large-scale agricultural expansion may actually reduce the capacity of vegetation to withstand droughts, yet few studies have quantified that effect. From this perspective, our objective was to evaluate the impacts of drought on evapotranspiration (ET), land surface temperature (LST), and albedo on cultivated areas, savannas, and forests.
2. Materials and Methods
2.1. Study Area
Our study focuses on the Brazilian state of Mato Grosso (MT), a region that has experienced high rates of deforestation for agricultural expansion during the last three decades [5,6,7]. Spanning an area of 903,358 km², MT encompasses three different biomes: Amazon forest (480,216 km2; 53.6%); Cerrado savanna (354,823 km2; 39.6 %); and Pantanal wetland (60,885 km2; 6.8%) [30]. In 2018, the state was responsible for approximately one-quarter of Brazil’s grain production (59.5 million tons), including 30.5 million tons of soybean and 26.4 million tons of maize [31]. Its climate is divided into distinct dry and wet seasons, with the mean annual precipitation ranging from 1500 to 2000 mm [22,32], and air temperature from 23 to 25 °C [33]. Altitudes in the state vary between 400 and 800 m above sea level.
2.2. Datasets
To investigate how recent droughts affected evapotranspiration, land surface temperature, and albedo in Mato Grosso, we combined data products derived from the Moderate Resolution Imaging Spectroradiometer (MODIS: MOD8, MCD43A3, MOD11A2, MOD16A2), precipitation from the Tropical Rainfall Measuring Mission (TRMM 3B43) [20], and land cover maps of the region [34,35,36,37,38].
Land cover—We used three different time series of land cover maps to determine the principal land covers in Mato Grosso (forest, savanna, and agriculture). First, we extracted the “forest” class based on global forest change maps published by Hansen et al. [35]. This dataset is comprised of yearly forest change maps from 2000 to 2014 at 30-m resolution. They were developed based on images from the Landsat 5 (Thematic Mapper (TM)), Landsat 7 Plus (Enhanced Thematic Mapper (ETM+)), and Landsat 8 (Operational Land Imager (OLI)) satellites [35]. Forest cover was estimated based on percent tree cover (over 5 m in height). Second, we used cropland distribution maps from Spera et al. [38], which used EVI (MOD13Q1) phenology to distinguish single-cropping, double-cropping, and major crop types [39,40] at 250-m resolution. Finally, we extracted the “Cerrado” class from the TerraClass Cerrado dataset [34]. This dataset was created based on 118 scenes collected by Landsat 8-OLI in 2013. To integrate these products, we first standardized the spatial resolution of all three datasets to 250-m resolution. Next, we created the “forest” class based on [35]; “agriculture” by combining crops listed in [38]; and “Cerrado” from TerraClass [34]. Finally, we integrated the three land use classes into one map to conduct the analyses (areas with other land uses were not considered in the analyses).
Land surface temperature (LST)—LST values were derived from the time series (2000–2014) of the MOD11A2 (collection 006) product. With a spatial resolution of 1 km and a temporal resolution of 8 days, the LST data was obtained using the “generalized split-window” algorithm [20].
Evapotranspiration (ET)—ET data were obtained from the time series (2001 to 2014) of the MOD16A2 (collection 005) product. With a spatial resolution of 1 km, the MOD16 product was calculated from the MOD12 (ground cover), MOD15 (fraction of photosynthetically active radiation absorbed, leaf area index), and meteorological data of the GMAO (Global Modeling and Assimilation Office) model [41]. The algorithm used here is based on the Penman–Monteith equation, adapted by [37]. We did not use collection 006 due to the prevalence of missing data (NA) for the study area, compared with collection 005. Although the uncertainty of the ET product derived from MODIS (MOD16) is estimated to be only ~5% for tropical forests [37], there are not many validation sites. Furthermore, a study evaluating the uncertainty associated with the MOD16 ET found that misclassification of land cover maps represented the main source of uncertainty in the ET model [42]. To minimize this issue, we used here only pure pixels for each class of land use (i.e., just pixels that did not experience a transition during the study period).
Albedo—The true surface albedo was estimated from the clear sky and dark sky albedos of the MOD43A3 product (collection 005, 500-m resolution), as described by Schaaf et al. [43]:
where t is the atmospheric optical depth (AOD), S(θ, t) is the fraction of diffuse light, abs is the dark sky albedo, and aws is the clear sky albedo. The S(θ, t) data were obtained from the look-up table available in the documentation for the MOD43 product [21]. Assuming a homogeneous AOD throughout the study area, we obtained the AOD and calculated the true surface albedo at midday.
albedo = [1 − S(θ, t)] αbs + S (θ, t) aw
Drought intensity—We used the maximum climatological water deficit (MCWD) as our metric to represent annual drought intensity between 2000 and 2014 (as described by [44] and [13]). The MCWD index is calculated from the monthly cumulative water deficit (CWD), which is the sum of the negative balance between monthly precipitation and evapotranspiration. We used the TRMM precipitation dataset (3B43, version 7) to estimate rainfall [45] and a fixed ET value of 100 mm to calculate CWD (a metric of dry season intensity), following Aragão et al. [44] and Malhi et al. [13]. The MCWD was defined as the most negative monthly CWD value observed over the annual cycle [44].
2.3. Statistical Analyses
We performed three different analyses to evaluate whether the effects of drought were less pronounced in forest areas than in deforested areas. First, we identified years with droughts above the historical average (extreme drought). Second, we compared the response variables (ET, LST, and albedo) in the year of extreme drought with the four-year mean for the years closest to the extreme drought (two before and two after). Finally, we used covariance analyses to evaluate how the relationship between drought intensity and each response variable (ET, LST, and albedo) varied for the three land cover types (forest, cropland, and pasture).
(I) Identification of Extreme Drought Events
To identify drought years, we calculated the mean MCWD for each pixel in Mato Grosso). We found a significant deviation (p < 0.001) in 2007 and 2010, which we classified as drought years (Figure 1).
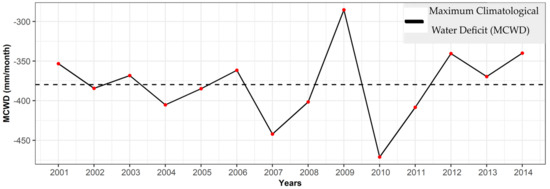
Figure 1.
Variation in the drought index (maximum climatological water deficit (MCWD)) between 2001 and 2014. The dotted line represents the historical mean.
To characterize the spatial distribution of the drought across Mato Grosso, we defined areas with values exceeding 1.50 standard deviations from the mean, whether lower (≤1.49 SD) or higher (≥1.50 SD). The areas ≥1.50 SD in 2007 had a deficit greater than −501.09 mm, whereas those in 2010 had a deficit greater than −499.20 mm.
Using the equation below, we calculated the hydrological deficit associated with each area based on the difference between the historical MCWD mean and the standard deviation of the historical MCWD series multiplied by 1.50:
where Tewd is the threshold of extreme water deficit, MCWDh is the historical mean of the MCWD, and MCWDSD is the standard deviation of the historical mean MCWD.
Tewd = MCWDh − (MCWDSD * 1.50)
(II) Comparing ET, LST, and Albedo in Drought Years with Historical and Biannual Averages
As a second step, we calculated the percent changes in albedo, LST, and ET (in forest, savanna, and cropland) throughout the state and in areas where the drought exceeded 1.50 standard deviations from the mean. To do so, we first determined two historical means for each variable, based on the time series from 2001 to 2014.
In order to control for long-term trends in the data (i.e., increasing or decreasing values), we also created two biannual means based on the means of the pair of years preceding and following each focal year (2007 and 2010). To remove the effects of extreme years on the historical means, we excluded the focal years from these averages. As with MCWD, we calculated all annual means based on the hydrological year (October–September).
To estimate the effect of droughts on the evapotranspiration (ET), land surface temperature (LST), and albedo, we calculated the difference between drought years (2007 and 2010) and non-drought years (2001 and 2014, excluding drought years) for each variable of interest (ET, albedo, and LST). We then extracted these differences (Δe) for pure pixels of each land use, defined as areas that did not change during the study period. In the case of forests, we only included pixels with 100% forest cover. We also summarized Δe for pure pixels in areas where the drought was more or less intense. All calculations were performed using the raster package in R [46].
(III) Seasonal Effect of Drought on ET, LST, and Albedo by Land Use and Cover
To quantify how dry season intensity affects the albedo, land surface temperature (LST), and evapotranspiration (ET), we first extracted the monthly (dry season only) ET, LST, and albedo for each land cover type (forest, savanna, agriculture). Using the raster R package [46], we then calculated monthly averages for each variable of interest, and regressed them against monthly CWD.
3. Results
In Mato Grosso, the dry seasons of 2007 and 2010 were 18.05% (MCWD = 67.6 mm lower) and 26.44% (MCWD = 99.8 mm lower) drier than the historical mean (2001–2014) (Figure 2). While a larger area of the state experienced low MCWD values in 2010, the most negative values of MCWD were recorded in 2007 (minimum of −600.2 mm) in the southeast portion of the state. The southwest endured the most intense drought in both 2007 (−97.3 mm, 28.55%) and 2010 (−116.8 mm, 34.39%). The regions least affected by droughts were the north in 2007 (65.48 mm, 17.65%) and the northeast in 2010 (64.9 mm, 15.87%).
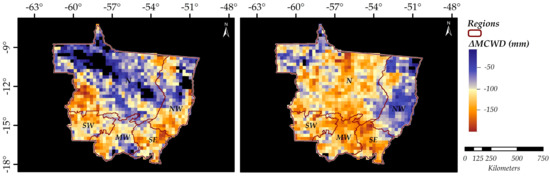
Figure 2.
Increase in the maximum climatological water deficit in 2007 and 2010 for each region of the Brazilian state of Mato Grosso (N = North, NW = Northwest, MW = Midwest, SE = Southeast, SW = Southwest). Data obtained from the Tropical Rainfall Measuring Mission (TRMM) satellite [45]. Each pixel represents the difference between the annual deficit and the historical value between 2001 and 2014 (ΔMCWD).
When we analyzed mean changes in energy balance components across the entire state of Mato Grosso, we found an overall increase in surface temperature and albedo during the droughts of 2007 and 2010. The dry season LST was 0.3 °C (mean = 30.8 °C) higher than the historical mean in 2007 and 0.7 °C (mean = 30.1 °C) higher in 2010 (Figure A1). Albedo also increased during those drought years, but only by 0.01 (mean = 0.143) in 2007 and by 0.04 in 2010 (mean = 0.147) (Figure A2). ET in 2007 and 2010 was slightly lower during drought years (2007: −0.8 mm per month; 2010: −4 mm per month) when considering only the years from 2010 to 2014 in our long-term average (Figure A3 and Figure A4)).
When we controlled for land use changes during the study period (i.e., excluding pixels that changed status), we found that energy balance components in forested areas were more stable across years compared with deforested areas. For example, (annual) mean LST in 2010 increased less in forests (0.3 °C) than in savannas (0.6 °C) or croplands (0.8 °C) (Table A1). However, in 2007 such increases in LST were more similar across land uses. Albedo also increased more in agricultural fields during the droughts of 2007 and 2010 (0.007 and 0.01, respectively), but in forests and savannas, these increases did not differ from zero (p > 0.05). In 2007 and 2010, ET during the 2007 drought decreased by 1.0 mm and 1.2 mm per month in forests and savannas, respectively, compared to the two previous years. In 2010, there was a decrease in ET of 3.97 mm per month in forested areas, 4.10 mm per month in savannas, and 2.85 mm per month in croplands.
A comparison of areas with more (≥1.50 SD) and less (≤1.49 SD) intense MCWD for the entire state of Mato Grosso (across all land use classes) indicated increases in LST and albedo as a function of drought intensity (Figure A5). In 2007, for instance, the areas experiencing more negative MCWD were 0.1 °C warmer (LST) than areas experiencing higher-than-average MCWD (Table A2). There was also an increase in albedo during the droughts of 2007 and 2010 relative to other non-drought years (~0.001) across drier portions of Mato Grosso, especially in 2010 (+0.003). Regions that became drier during the drought of 2007 also evapotranspired less (0.85 mm per month) compared with non-drought regions. However, the inverse pattern was observed in 2010, when ET was 1.69 mm per month higher in regions with low MCWD compared with regions experiencing no droughts.
Comparing the three response variables (ET, LST, and albedo) in areas of higher and lower drought intensity revealed significant differences for albedo and LST, but not ET. In 2007, the LST of forest (0.1 °C), cropland (0.2 °C), and savanna (0.1 °C) regions were higher in areas of more intense drought. In 2010, however, only agricultural areas experienced a difference in temperature (0.1 °C) in areas of higher drought intensity. In 2007 and 2010, the albedo of forest (0.02 and 0.01, respectively) and savanna (0.01 in both years) regions was higher in areas of more intense drought, whereas in croplands a difference was only recorded in 2010 (Δ = 0.03). In the case of ET, in 2007 cerrado (2.39 mm/month) and cropland (2.56 mm/month) showed smaller increases in areas of greater drought intensity. However, the opposite occurred in 2010, where cropland (1.39 mm/month), cerrado (2.39 mm/month), and forest (3.44 mm/month) regions showed the smallest increases in areas of lower drought intensity.
Overall, drought intensity exerted a significant influence on the relationship between monthly dry season intensity (CWD) and the three response variables (ET, LST, and albedo), with the magnitude of changes varying among land uses (Figure 3). For example, we found that a 100-mm increase in dry season intensity was associated with a 3 °C increase in LST for croplands, compared with 2 °C in savannas and 1 °C in forests. The forest ET was also less affected by drought compared with other land uses. For example, for an increase of 100 mm in dry season intensity, ET dropped by 9 mm per month in forests, 12 mm in savannas, and 20 mm in cropland. While the albedo of all three types of land cover was related to drought intensity, it did not significantly increase with a 100 mm increase in water deficit.
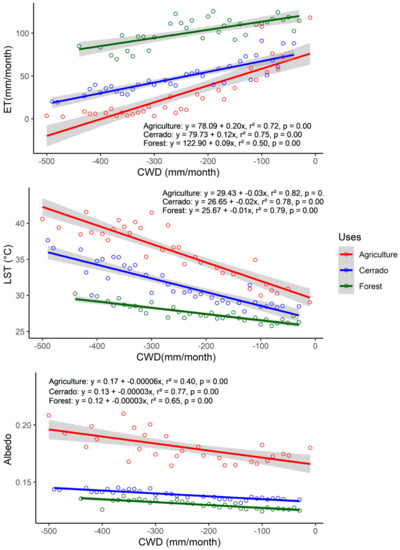
Figure 3.
Effects of drought (cumulative water deficit (CWD)) on evapotranspiration (ET: top), land surface temperature (LST: middle), and albedo (bottom) within the Brazilian state of Mato Grosso. The shaded areas indicate the interquartile interval.
4. Discussion
This study tested the hypothesis that cropland expansion into forest and savanna regions of the southern Amazon amplifies drought-related changes in the regional energy balance components (land surface temperature, evapotranspiration, and albedo). Our main prediction was that deforested areas experience greater increases in LST and albedo during droughts than forested areas, but smaller decreases in ET because forests and savannas have deeper rooting systems. Our results partially support this hypothesis. Savannas and forests remained significantly cooler (as represented by LST) than cropland during the drought of 2010, while maintaining a more constant albedo during drought years. The overall importance of this result is that increased deforestation can amplify the effects of droughts by further increasing land surface temperature and albedo, two important variables regulating the regional climate. However, contrary to our hypothesis, ET in forests and other land uses increased or remained similar to the historical average during the droughts of 2007 and 2010. Although the ET product used here (MOD16) has been tested and validated for tropical forests [37], improved regional estimates of ET would likely enhance our ability to detect ET differences across years and land uses, given that such differences were relatively small.
The modest increases in forest surface temperature during drought years (compared with other land uses) is likely due to the capacity of forests to access deep soil water to meet increased atmospheric demand. By converting more of the incoming solar radiation into water fluxes and maintaining high ET throughout drought years, forests are expected to cool LST compared with croplands. Some studies estimate that Amazon forests convert ~75% of the incoming solar radiation into latent heat [12,47,48]. Crops may also cool the land surface (via evapotranspiration) at the onset of droughts; however, as droughts intensify, there is a tendency for crops to dry out, followed by a rapid increase in surface temperature. Compared with croplands, we also observed less pronounced increases in LST during droughts in savannas. Although savannas have a lower fraction of canopy cover compared with forests, they were more efficient in cooling down the land surface during drought years compared with other land uses. Overall, we observed the greatest differences in LST between forests/savannas and cropland during the dry season in drought years. This result probably relates to croplands having low canopy cover during the driest months (non-growing season) and shallower roots than forests and savannas, both of which limit access to larger volumes of deep soil water [19,23].
Albedo controls much of the energy exchange between the biosphere and the atmosphere [36]. Land uses reflecting a higher proportion of the incoming shortwave radiation have less available energy to power the hydrological cycle. In our study, we expected forests to maintain lower albedo than other land uses, given their year-round dark canopy. However, we observed significant increases in albedo in forested regions, particularly those experiencing high water stress. This suggests that the droughts of 2007 and 2010 were intense enough to trigger reduced photosynthesis, abnormal leaf shedding, or both. A similar pattern was observed for savannas, a vegetation type that is considered drought tolerant. In contrast, we expected cropland (first) to have low canopy cover and high albedo during recent droughts, but observed only minor increases in albedo in these regions during the dry season. One potential explanation for these unexpected results is that albedo in croplands is already extremely high, on average, and droughts have little additional effect. Forests and savannas, on the other hand, have much lower albedo and can experience larger increases during drought years.
Our findings of increased ET during drought years in forested regions are consistent with previous findings that groundwater (accumulated during the preceding rainy season) may be sufficient to sustain ET at levels similar to or even higher than those recorded during the rainy season [23,49,50,51]. The increase in ET observed in cropland during drought years (2007 and 2010) may also be related to management responses (such as shifting the initial planting date) or to the considerable spatial and temporal variation in the crops planted in the state. For example, recent studies in the Cerrado biome suggest that double-cropped areas (i.e., planted with soybeans followed by a short-season maize crop in a single rainy season) may sustain higher ET than native vegetation during most of the rainy season (December–May). ET is even higher when grasses such as Brachiaria are planted during the fallow period [26].
Increases in dry season intensity (represented by CWD) caused ET reductions and LST increases across all land uses. In croplands, the effect of seasonal droughts on ET was even greater, possibly due to reduced leaf cover [23], but also to a likely increase in exposed soil area resulting from early harvests or crop failures. Studies show that during the dry season there is a reduction in net photosynthetic activity as plants engage in various strategies to conserve water, many of which tend to reduce transpiration. As drier/hotter air increases atmospheric water demand (i.e., vapor pressure deficit), plants tend to close their stomata to prevent leaf water potential from falling below levels critical to the stability of the plant water transport system. In some cases, plants drop their leaves to reduce water loss in response.
In general, our results suggest that deforestation for the expansion of croplands amplifies the effects of droughts, given that surface temperature and albedo increased more in croplands than in forests, while ET remained high in forested regions. However, modeling studies that consider feedbacks between changes in the energy balance and climate should be made for more precise assessments. Mato Grosso is Brazil’s principal producer of agricultural commodities, including beef, soybean, maize, and cotton [31]. It also has a prolonged dry season, during which minor changes in the hydrological cycle can have major negative impacts on crop productivity, triggering increases in wildfires or abandonment of short-harvest crops [52]. Given their stabilizing effects on the regional energy balance components (LST and albedo), preserving remaining forests should be a priority in agricultural development strategies. The high evapotranspiration rates and low surface temperatures found in forested environments can provide an important buffer to drought conditions, while contributing to global efforts to mitigate climate change due to greenhouse gas emissions [12,53].
5. Conclusions
Our hypothesis received strong support. We found that the effects of drought on the land surface temperature (LST) and albedo are greater in areas of cropland and savanna in comparison with forested environments in the Brazilian state of Mato Grosso. As droughts increased in intensity (measured by the cumulative water deficit (CWD)), forests maintained relatively stable evapotranspiration compared with savannas and croplands. Croplands showed a greater increase in LST compared with savannas and forests. Albedo also demonstrated a significant relationship with drought in all three land uses.
In 2007 and 2010, cropland areas showed a greater increase in albedo and LST than that observed in savanna and forest areas. While forests showed a smaller increase in ET, they represented approximately half of the evapotranspiration recorded in Mato Grosso. Our results indicated that, in years of extreme drought, the forest contributes to smaller changes in the energy balance components at local and regional scales. In contrast, deforested areas experience larger changes in the energy balance that may act synergistically to intensify droughts. By maintaining higher levels of ET, and lower LST and albedo, natural environments not only help to maintain the hydrological cycle but also to buffer against the effects of droughts.
Author Contributions
All authors contributed substantially to this work: C.C., D.V.S., M.T.C., M.N.M., and P.M.B. conceived of and designed the study. C.C., M.T.C. and D.V.S. conducted the analysis and interpreted the results. All authors contributed to writing this manuscript. All authors have read and agreed to the published version of the manuscript.
Funding
This research was supported by the CNPq (#441463/2017-7, #430149/2018-2), NSF-INFEWS (EAR# 1739724), and CAPES-Brasil via scholarships to the first author (C.C.).
Acknowledgments
We thank the Instituto de Pesquisa Ambiental da Amazônia for support in data analysis and interpretation.
Conflicts of Interest
The authors declare no conflict of interest.
Appendix A

Table A1.
Parameters used to evaluate evapotranspiration (ET), land surface temperature (LST), and albedo (in years of severe drought) in the principal types of land cover (forest, savanna, and cropland) in the Brazilian state of Mato Grosso.
Table A1.
Parameters used to evaluate evapotranspiration (ET), land surface temperature (LST), and albedo (in years of severe drought) in the principal types of land cover (forest, savanna, and cropland) in the Brazilian state of Mato Grosso.
| Land Surface Temperature 2007 | |||||
|---|---|---|---|---|---|
| ∑b | ∑h | ||||
| Uses | xAe | Δe | Teste de Tukey p | Δe | Teste de Tukey p |
| Generally | 30.80 ± 0.8 °C | 0.4 ± 0.6 °C | 0.3 ± 0.6 °C | ||
| Forest | 27.81 ± 0.6 °C | 0.2 ± 0.3 °C | Forest-Cerrado < 0.001 | 0.2 ± 0.3 °C | Forest-Cerrado < 0.001 |
| Cerrado | 31.45 ± 2.2 °C | 0.5 ± 0.6 °C | Forest-Agriculture < 0.001 | 0.3 ± 0.6 °C | Forest-Agriculture < 0.001 |
| Agriculture | 33.85 ± 1.3 °C | 0.3 ±1.0 °C | Cerrado-Agriculture < 0.001 | 0.1 ± 0.8 °C | Cerrado-Agriculture < 0.001 |
| 2010 | |||||
| Generally | 30.10 ± 0.8 °C | 0.4 ± 0.7 °C | 0.7 ± 0.7 °C | ||
| Forest | 27.80 ± 0.7 °C | 0.1 ± 0.4 °C | Forest-Cerrado < 0.001 | 0.3 ± 0.3 °C | Forest-Cerrado < 0.001 |
| Cerrado | 31.43 ± 2.1 °C | 0.4 ± 0.7 °C | Forest-Agriculture < 0.001 | 0.6 ± 0.7 °C | Forest-Agriculture < 0.001 |
| Agriculture | 33.81 ± 1.2 °C | 0.7 ± 0.9 °C | Cerrado-Agriculture < 0.001 | 0.8 ± 0.8 °C | Cerrado-Agriculture < 0.001 |
| Albedo 2007 | |||||
| Generally | 0.143 ± 0.006 | 0.002 ± 0.007 | 0.001 ± 0.007 | ||
| Forest | 0.133 ± 0.003 | 0.000 | Forest-Cerrado ns | 0.000 | Forest-Cerrado ns |
| Cerrado | 0.139 ± 0.012 | 0.002 ± 0.007 | Forest-Agriculture < 0.001 | 0.000 | Forest-Agriculture < 0.001 |
| Agriculture | 0.179 ± 0.007 | 0.009 ± 0.009 | Cerrado-Agriculture < 0.001 | 0.007 ± 0.008 | Cerrado-Agriculture < 0.001 |
| 2010 | |||||
| Generally | 0.147 ± 0.005 | 0.001 ± 0.007 | 0.004 ± 0.006 | ||
| Forest | 0.132 ± 0.003 | 0.001 ± 0.005 | Forest-Cerrado < 0.001 | 0.003 ± 0.004 | Forest-Cerrado < 0.001 |
| Cerrado | 0.139 ± 0.014 | 0.001 ± 0.007 | Forest-Agriculture < 0.001 | 0.002 ± 0.007 | Forest-Agriculture < 0.001 |
| Agriculture | 0.180 ± 0.007 | 0.004 ± 0.010 | Cerrado-Agriculture < 0.001 | 0.010 ± 0.009 | Cerrado-Agriculture < 0.001 |
| Evapotranspiration 2007 | |||||
| Generally | 72.05 ± 19.06 mm | –0.8 ± 6.07 mm | 6.52 ± 5.07 mm | ||
| Forest | 113.33 ± 6.03 mm | –1.0 ± 3.42 mm | Forest-Cerrado < 0.001 | 3.93 ± 3.08 mm | Forest-Cerrado < 0.001 |
| Cerrado | 72.90 ± 23.35 mm | –1.2 ± 6.06 mm | Forest-Agriculture < 0.001 | 6.83 ± 6.06 mm | Forest-Agriculture < 0.001 |
| Agriculture | 51.55 ± 10.51 mm | 4.33 ± 9.52 mm | Cerrado-Agriculture < 0.001 | 9.01 ± 8.06 mm | Cerrado-Agriculture < 0.001 |
| 2010 | |||||
| Generally | 73.80 ± 15.60 mm | –4 ± 5.32 mm | 8.01 ± 7.02 mm | ||
| Forest | 113.47 ± 22.56 mm | –3.97 ± 3.41 mm | Forest-Agriculture < 0.001 | 3.96 ± 4.19 mm | Forest-Agriculture < 0.001 |
| Cerrado | 72.67 ± 21.36 mm | –4.10 ± 5.31 mm | Cerrado-Agriculture < 0.001 | 9.99 ± 8.06 mm | Cerrado-Agriculture < 0.001 |
| Agriculture | 60.56 ± 11.62 mm | –2.85 ± 8.96 mm | Forest-Cerrado < 0.001 | 14.60 ± 8.57 mm | Forest-Cerrado < 0.001 |
∑h = ratios obtained using the historical mean; ∑b = ratios obtained using the biannual mean; Ae = annual mean for 2007 or 2010, Δe = the difference in the LST, ET, or albedo (in 2007 and 2010) in comparison with the historical or biannual means; ns = not significant (p > 0.05).
Table A2.
Parameters used to evaluate the variation in the evapotranspiration (ET), land surface temperature (LST), and albedo between years of extreme drought and normal years in the three principal types of land cover (forest, savanna, and cropland) in the Brazilian state of Mato Grosso.
Table A2.
Parameters used to evaluate the variation in the evapotranspiration (ET), land surface temperature (LST), and albedo between years of extreme drought and normal years in the three principal types of land cover (forest, savanna, and cropland) in the Brazilian state of Mato Grosso.
| Land Surface Temperature 2007 | |||||||
|---|---|---|---|---|---|---|---|
| xAe | Δe | Test t | N | ||||
| Uses | DP ≥ 1.50 | DP ≤ 1.49 | DP ≥ 1.50 | DP ≤ 1.49 | p | DP ≥ 1.50 | DP ≤ 1.49 |
| Generally | 31.29 ± 2.6 °C | 30.28 ± 2.5 °C | 0.4 ± 0.6 °C | 0.3 ± 0.3 °C | <0.001 | 3205 | 3205 |
| Forest | 27.9 ± 0.5 °C | 27.8 ± 0.5 °C | 0.3 ± 0.3 °C | 0.2 ± 0.3 °C | <0.001 | 5914 | 129,982 |
| Cerrado | 31.6 ± 2.3 °C | 31.4 ± 1.9 °C | 0.3 ± 0.6 °C | 0.3 ± 0.6 °C | <0.001 | 141,445 | 313,656 |
| Agriculture | 34.3 ± 0.8 °C | 33.8 ± 0.9 °C | 0.3 ± 0.8 °C | 0.1 ± 0.7 °C | <0.001 | 3205 | 34,576 |
| 2010 | |||||||
| Generally | 30.42 ± 2.6 °C | 29.87 ± 2.6 °C | 0.7 ± 0.7 °C | 0.7 ± 0.7 °C | <0.001 | 233,310 | |
| Forest | 28.0 ± 0.7 °C | 27.8 ± 0.5 °C | 0.3 ± 04 °C | 0.3 ± 0.3 °C | <0.001 | 35,106 | 111,172 |
| Cerrado | 31.5 ± 1.9 °C | 31.6 ± 2.0 °C | 0.7 ± 0.6 °C | 0.7 ± 0.8 °C | <0.001 | 177,554 | 309,650 |
| Agriculture | 33.9± 1.0 °C | 33.7 ± 0.9 °C | 0.6 ± 0.8 °C | 0.7 ± 0.8 °C | <0.001 | 20,650 | 21,203 |
| Albedo 2007 | |||||||
| Generally | 0.143 ± 0.018 | 0.143 ± 0.017 | 0.001 ± 0.007 | 0.001 ± 0.006 | <0.001 | 601,683 | |
| Forest | 0.132 ± 0.002 | 0.133 ± 0.003 | 0.001 ± 0.004 | −0.001 ± 0.004 | <0.001 | 23,540 | 520,359 |
| Cerrado | 0.139 ± 0.012 | 0.140 ± 0.012 | 0.001 ± 0.006 | 0.000 | <0.001 | 565,467 | 1,253,626 |
| Agriculture | 0.179 ± 0.007 | 0.179 ± 0.007 | 0.006 ± 0.008 | 0.007 ± 0.008 | <0.001 | 12,676 | 138,484 |
| 2010 | |||||||
| Generally | 0.147 ± 0.017 | 0.146 ± 0.013 | 0.005 ± 0.008 | 0.002 ± 0.007 | <0.001 | 932,970 | |
| Forest | 0.131 ± 0.003 | 0.133 ± 0.003 | 0.004 ± 0.004 | 0.003 ± 0.004 | <0.001 | 140,289 | 445,091 |
| Cerrado | 0.142 ± 0.012 | 0.140 ± 0.012 | 0.003 ± 0.007 | 0.002 ± 0.007 | <0.001 | 709,736 | 1,236,756 |
| Agriculture | 0.179 ± 0.007 | 0.178 ± 0.006 | 0.012 ± 0.009 | 0.009 ± 0.009 | <0.001 | 82,945 | 84,752 |
| Evapotranspiration 2007 | |||||||
| Generally | 64.88 ± 26.52 mm | 79.23 ± 26.51 mm | 5.33 ± 5,63 mm | 6.48 ± 6.48 mm | <0.001 | 150,685 | |
| Forest | 107.24 ± 6.69 mm | 113.50 ± 7.02 mm | 5.59 ± 3.04 mm | 3.92 ± 3.06 mm | <0.001 | 5908 | 130,762 |
| Cerrado | 72.60 ± 29.49 mm | 73.00 ± 25.02 mm | 5.09 ± 5.64 mm | 7.48 ± 6.15 mm | <0.001 | 141,610 | 177,544 |
| Agriculture | 59.49 ± 8.50 mm | 61.04 ± 6.72 mm | 6.52 ± 7.35 mm | 9.08 ± 7.64 mm | <0.001 | 3167 | 34,601 |
| 2010 | |||||||
| Generally | 70.73 ± 21.31 mm | 76.86 ± 23.77 mm | 9.34 ± 8.43 mm | 7.65 ± 8.65 mm | <0.001 | 223,437 | |
| Forest | 107.73 ± 5.70 mm | 114.54 ± 6.99 mm | 4.95 ± 3.03 mm | 1.51 ± 4.12 mm | <0.001 | 35,167 | 111,936 |
| Cerrado | 72.03 ± 25.31 mm | 71.07 ± 26.28 mm | 11.11 ± 7.56 mm | 9.98 ± 8.06 mm | <0.001 | 167,541 | 309,498 |
| Agriculture | 61.59 ± 6.45 mm | 59.31 ± 6.68 mm | 15.25 ± 8.39 mm | 13.86 ± 8.54 mm | <0.001 | 20,729 | 21,146 |
Ae = mean for 2007 or 2010; Δe = the difference in the LST, ET, and albedo (in 2007 and 2010) in comparison with the historical mean; N = the number of repetitions; ≤1.49 SD = drought less than 1.50 standard deviations of the mean; ≥1.50 SD = drought more than 1.50 standard deviations of the mean; ns = not significant (p > 0.05).
Appendix B

Figure A1.
Histograms of the variation in surface temperature for the principal land covers in the Brazilian state of Mato Grosso during the drought events of 2007 and 2010. The dotted lines (green = forest; blue = savanna; red = cropland) represent the means recorded in each type of land cover. In graphs (I,II), Δe is the difference between the mean for the year of extreme drought (Ae) and the biannual mean (b). In graphs (III,IV), Δe is the difference between the mean for the year of extreme drought (Ae) and the historical mean (b). Graph (V) shows the variation in surface temperature between 2001 and 2014.

Figure A2.
Histograms of the variation in the albedo of the principal land cover types in the Brazilian state of Mato Grosso during the drought events of 2007 and 2010. The dotted lines (green = forest; blue = savanna; red = cropland) represent the means recorded in each type of land cover. In graphs (I,II), Δe is the difference between the mean for the year of extreme drought (Ae) and the biannual mean (b). In graphs (III,IV), Δe is the difference between the mean for the year of extreme drought (Ae) and the historical mean (b). Graph (V) shows the variation in the albedo between 2001 and 2014.

Figure A3.
Histograms of the variation in the evapotranspiration of the principal land cover types in the Brazilian state of Mato Grosso during the drought events of 2007 and 2010. The dotted lines (green = forest; blue = savanna; red = cropland) represent the means recorded in each type of land cover. In graphs (I,II), Δe is the difference between the mean for the year of extreme drought (Ae) and the biannual mean (b). In graphs (III,IV), Δe is the difference between the mean for the year of extreme drought (Ae) and the historical mean (b). Graph (V) shows the variation in the evapotranspiration between 2001 and 2014.

Figure A4.
Land surface temperature (LST) (middle, obtained from the MOD11A2 product), albedo (bottom, obtained from the MOD11A2 product), and evapotranspiration (ET) (top, obtained from the MOD16 product) in the areas where the drought exceeded 1.50 standard deviations of the mean (higher or lower). The areas outside the red polygons are those in which the drought was ≤1.49 SD of the mean.

Figure A5.
Histograms of the increase or reduction in the land surface temperature (top), albedo (middle), and evapotranspiration (bottom), for the areas with extreme conditions (≥1.50 SD or ≤1.49 SD) during the droughts of 2007 and 2010. The dotted lines (red = drought ≥1.50 SD, blue = drought ≤1.49 SD) represent the averages for each area.
References
- INPE-Projeto Prodes: Monitoramento da floresta Amazônica Brasileira por Satélite. 2014. Available online: http://www.obt.inpe.br/OBT/assuntos/programas/amazonia/prodes (accessed on 20 April 2019).
- Beuchle, R.; Grecchi, R.C.; Shimabukuro, Y.E.; Seliger, R.; Eva, H.D.; Sano, E.; Acharda, F. Land cover changes in the Brazilian Cerrado and Caatinga biomes from 1990 to 2010 based on a systematic remote sensing sampling approach. Appl. Geogr. 2015, 58, 116–127. [Google Scholar] [CrossRef]
- Brando, P.M.; Silvério, D.; Maracahipes-Santos, L.; Oliveira-Santos, C.; Levick, S.R.; Coe, M.T.; Trumbore, S. Prolonged tropical forest degradation due to compounding disturbances: Implications for CO2 and H2 O fluxes. Glob. Chang. Biol. 2019, 2019, 1–14. [Google Scholar] [CrossRef]
- Klink, C.A.; Machado, R.B. Conservation of the Brazilian Cerrado. Conserv. Biol. 2005, 19, 707–713. [Google Scholar] [CrossRef]
- Macedo, M.N.; DeFries, R.S.; Morton, D.C.; Stickler, C.M.; Galford, G.L.; Shimabukuro, Y.E. Decoupling of deforestation and soy production in the southern Amazon during the late 2000s. Proc. Natl. Acad. Sci. USA 2012, 109, 1341–1346. [Google Scholar] [CrossRef]
- Nepstad, D.; McGrath, D.; Stickler, C.; Alencar, A.; Azevedo, A.; Swette, B.; Armijo, E. Slowing Amazon deforestation through public policy and interventions in beef and soy supply chains. Science 2014, 344, 1118–1123. [Google Scholar] [CrossRef] [PubMed]
- INPE. TerraBrasilis. Monitoramento Do Cerrado. 2018. Available online: http://www.obt.inpe.br/cerrado/ (accessed on 20 April 2019).
- Foley, J.A.; Asner, G.P.; Costa, M.H.; Coe, M.T.; DeFries, R.; Gibbs, H.K.; Snyder, P. Amazonia revealed: Forest degradation and loss of ecosystem goods and services in the Amazon Basin. Front. Ecol. Environ. 2007, 5, 25–32. [Google Scholar] [CrossRef]
- Spracklen, D.V.; Arnold, S.R.; Taylor, C.M. Observations of increased tropical rainfall preceded by air passage over forests. Nature 2012, 489, 282–285. [Google Scholar] [CrossRef] [PubMed]
- Luyssaert, S.; Jammet, M.; Stoy, P.C.; Estel, S.; Pongratz, J.; Ceschia, E.; Dolman, A.J. Land management and land-cover change have impacts of similar magnitude on surface temperature. Nat. Clim. Chang. 2014, 4, 389–393. [Google Scholar] [CrossRef]
- Nepstad, D.; Lefebvre, P.; Lopes da Silva, U.; Tomasella, J.; Schlesinger, P.; Solorzano, L.; Guerreira Benito, J. Amazon drought and its implications for forest flammability and tree growth: A basin-wide analysis. Glob. Chang. Biol. 2004, 10, 704–717. [Google Scholar] [CrossRef]
- Silvério, D.V.; Brando, P.M.; Macedo, M.N.; Beck, P.S.A.; Bustamante, M.; Coe, M.T. Agricultural expansion dominates climate changes in southeastern Amazonia: The overlooked non-GHG forcing. Environ. Res. Lett. 2015, 10, 104015. [Google Scholar] [CrossRef]
- Malhi, Y.; Roberts, J.T.; Betts, R.A.; Killeen, T.J.; Liq, W.; Nobre, C.A. Climate change, deforestation, and the fate of the Amazon. Science 2008, 319, 169–172. [Google Scholar] [CrossRef] [PubMed]
- Lewis, S.L.; Brando, P.; Phillips, O.L.; Van der Heijden, G.M.F.; Nepstad, D. The 2010 Amazon drought. Science 2011, 331, 554. [Google Scholar] [CrossRef] [PubMed]
- Marengo, J.A.; Nobre, C.A.; Seluchi, M.E.; Cuartas, A.; Alves, L.M.; Mendiondo, E.M.; Sampaio, G. A seca e a crise hídrica de 2014-2015 em São Paulo. Rev. USP 2015, 106, 31–44. [Google Scholar] [CrossRef]
- Muñoz, J.C.J.; Mattar, C.; Barichivich, J.; Santamaría-Artigas, A.; Takahashi, K.; Malhi, Y.; Van Der Schrier, G. Record-breaking warming and extreme drought in the Amazon rainforest during the course of El Niño 2015–2016. Sci. Rep. 2016, 6, 1–7. [Google Scholar] [CrossRef]
- Phillips, O.L.; Aragão, L.E.O.C.; Lewis, S.L.; Fisher, J.B.; Lloyd, J.; López-gonzález, G.; Salamão, R. Drought Sensitivity of the Amazon Rainforest. Science 2009, 323, 1344–1347. [Google Scholar] [CrossRef]
- Zeng, N.; Yoon, J.H.; Marengo, J.A.; Subramaniam, A.; Nobre, C.A.; Mariotti, A.; Neelin, J.D. Causes and impacts of the 2005 Amazon drought. Environ. Res. Lett. 2008, 3, 014002. [Google Scholar] [CrossRef]
- Nepstad, D.C.; de Carvalho, C.R.; Davidson, E.A.; Jipp, P.H.; Lefebvre, P.A.; Negreiros, G.H.; da Silva, E.D.; Stone, T.A.; Trumbore, S.E.; Vieira, S. The role of deep roots in the hydrological and carbon cycles of Amazonian forests and pastures. Nature 1994, 372, 666–669. [Google Scholar] [CrossRef]
- Wan, Z.; Zhang, Y.; Zhang, Q.; Li, Z.-L. Quality assessment and validation of the MODIS global land surface temperature. Int. J. Remote Sens. 2004, 25, 261–274. [Google Scholar] [CrossRef]
- Sampaio, G.; Nobre, C.; Costa, M.H.; Satyamurty, P.; Soares-Filho, B.S.; Cardoso, M. Regional climate change over eastern Amazonia caused by pasture and soybean cropland expansion. Geophys. Res. Lett. 2007, 34, 1–7. [Google Scholar] [CrossRef]
- Shuttleworth, W.J. Evaporation. In Handbook of Hydrology; Maidment, D.R., Ed.; McGRaw Hill: New York, NY, USA, 1993; pp. 1–53. [Google Scholar]
- Vourlitis, G.L.; de Souza Nogueira, J.; de Almeida Lobo, F.; Sendall, K.M.; de Paulo, S.R.; Antunes Dias, C.A.; Pinto, O.B., Jr.; de Andrade, N.L. Energy balance and canopy conductance of a tropical semi-deciduous forest of the southern Amazon Basin. Water Resour. Res. 2008, 44, 1–14. [Google Scholar] [CrossRef]
- Meir, P.; Wood, T.E.; Galbraith, D.R.; Brando, P.M.; Da Costa, A.C.; Rowland, L.; Ferreira, L.V. Threshold responses to soil moisture deficit by trees and soil in tropical rain forests: Insights from field experiments. BioScience 2015, 65, 882–892. [Google Scholar] [CrossRef]
- Bonan, G.B. Forests and climate change: Forcings, feedbacks, and the climate benefits of forests. Science 2008, 320, 1444–1449. [Google Scholar] [CrossRef] [PubMed]
- Spera, S.A.; Galford, G.L.; Coe, M.T.; Macedo, M.N.; Mustard, J.F. Land-use change affects water recycling in Brazil’s last agricultural frontier. Glob. Chang. Biol. 2016, 22, 3405–3413. [Google Scholar] [CrossRef] [PubMed]
- Butt, N.; de Oliveira, P.A.; Costa, M.H. Evidence that deforestation affects the onset of the rainy season in Rondonia, Brazil. J. Geophys. Res. 2011, 116, 1–11. [Google Scholar] [CrossRef]
- Fu, R.; Yin, L.; Li, W.; Arias, P.A.; Dickinson, R.E.; Huang, L.; Chakraborty, S.; Fernandes, K.; Liebmann, B.; Fisher, R.; et al. Increased dry-season length over southern Amazonia in recent decades and its implication for future climate. Proc. Natl. Acad. Sci. USA 2013, 110, 18110–18115. [Google Scholar] [CrossRef]
- Khanna, J.; Medvigy, D.; Fueglistaler, S.; Walko, R. Regional dry-season climate changes due to three decades of Amazonian deforestation. Nat. Clim. Chang. 2017, 7, 200–204. [Google Scholar] [CrossRef]
- IBGE-Banco de dados por Estado. Instituto Brasileiro de Geografia e Estatística. 2017. Available online: https://ww2.ibge.gov.br/estadosat/ (accessed on 22 April 2019).
- CONAB-Companhia de Abastecimento. Acompanhamento da Safra Brasileira de Grãos. 2012. Available online: https://www.conab.gov.br (accessed on 5 April 2019).
- Silva, F.A.M.; Assad, E.D.; Evangelista, B.A. Caracterização climática do Bioma Cerrado. In Cerrado: Ecologia e Flora; Sano, S.M., Almeida, S.P., Ribeiro, J.F., Eds.; Embrapa Cerrados: Brasília, Brazil, 2008; Volume 1, pp. 69–88. [Google Scholar]
- Tarifa, J.R. Mato Grosso: Clima–Análise e Representação Cartográfica; Entrelinhas: Cuiaba, Brazil, 2011; pp. 69–96. [Google Scholar]
- BRASIL, Mapeamento do Uso e Cobertura da Terra do Cerrado–Projeto TerraClass Cerrado 2013. 2015. Available online: http://www.mma.gov.br/images/arquivo/80049/Cerrado/publicacoes/Livro%20EMBRAPA-WEB-1-TerraClass%20Cerrado.pdf (accessed on 21 April 2019).
- Hansen, M.C.; Potapov, P.V.; Moore, R.; Hancher, M.; Turubanova, S.A.; Tyukavina, A.; Thau, D.; Stehman, S.V.; Goetz, S.J.; Loveland, T.R.; et al. High-resolution global maps of 21stcentury forest cover change. Science 2013, 342, 850–853. [Google Scholar] [CrossRef]
- Kalnay, E.; Kanamitsu, M.; Kistler, R.; Collins, W.; Deaven, D.; Gandin, L.; Zhu, Y. The NCEP/NCAR 40-year reanalysis project. Bull. Am. Meteorol. Soc. 1996, 77, 437–471. [Google Scholar] [CrossRef]
- Mu, Q.; Zhao, M.; Running, S.W. Improvements to a MODIS global terrestrial evapotranspiration algorithm. Remote Sens. Environ. 2011, 115, 1781–1800. [Google Scholar] [CrossRef]
- Spera, S.A.; Cohn, A.S.; VanWey, L.K.; Mustard, J.F.; Rudorff, B.F.; Risso, J.; Adami, M. Recent cropping frequency, expansion, and abandonment in Mato Grosso, Brazil had selective land characteristics. Environ. Res. Lett. 2014, 9, 064010. [Google Scholar] [CrossRef]
- Arvor, D.; Jonathan, M.; Meirelles, M.S.P.; Dubreuil, V.; Durieux, L. Classification of MODIS EVI time series for crop mapping in the state of Mato Grosso, Brazil. Int. J. Remote Sens. 2011, 32, 7847–7871. [Google Scholar] [CrossRef]
- Galford, G.L.; Mustard, J.F.; Melillo, J.; Gendrin, A.; Cerri, C.C.; Cerri, C.E. Wavelet analysis of MODIS time series to detect expansion and intensification of row-crop agriculture in Brazil. Remote Sens. Environ. 2008, 112, 576–587. [Google Scholar] [CrossRef]
- Nishida, K.; Nemani, R.R.; Running, S.W.; Glassy, J.M. An operational remote sensing algorithm for land surface evaporation. J. Geophys. Res. 2003, 108, 1–14. [Google Scholar] [CrossRef]
- Ruhoff, A.L.; Paz, A.R.; Aragao, L.E.O.C.; Mu, Q.; Malhi, Y.; Collischonn, W.; Running, S.W. Assessment of the MODIS global evapotranspiration algorithm using eddy covariance measurements and hydrological modelling in the Rio Grande basin. Hydrol. Sci. J. 2013, 58, 1658–1676. [Google Scholar] [CrossRef]
- Schaaf, C.B.; Gao, F.; Strahler, A.H.; Lucht, W.; Li, X.; Tsang, T.; Strugnell, N.C.; Zhang, X.; Jin, Y.; Muller, J.P.; et al. First operational BRDF, albedo nadir reflectance products from MODIS. Remote Sens. Environ. 2002, 83, 135–148. [Google Scholar] [CrossRef]
- Aragão, L.E.O.C.; Malhi, Y.; Roman-Cuesta, R.M.; Saatchi, S.; Anderson, L.O.; Shimabukuro, Y.E. Spatial patterns and fire response of recent Amazonian droughts. Geophys. Res. Lett. 2007, 34, 1–5. [Google Scholar] [CrossRef]
- Huffman, G.J.; Bolvin, D.T.; Nelkin, E.J.; Wolff, D.B.; Adler, R.F.; Gu, G.; Hong, Y.; Bowman, K.P.; Stocker, E.F. The TRMM Multisatellite Precipitation Analysis (TMPA): Quasi-Global, Multiyear, Combined-Sensor Precipitation Estimates at Fine Scales. J. Hydrometeorol. 2007, 8, 38–55. [Google Scholar] [CrossRef]
- Hijmans, R.J.; van Etten, J.; Etten, J.; van Mattiuzzi, M.; Sumner, M.; Greenberg, J.A.; Lamigueiro, O.P.; Andrew, B.; Racine, E.B.; Shortridge, A. Raster: Geographic Analysis and Modeling with Raster Data. R Package Version 2.2-31. 2014. Available online: https://cran.r-project.org/package=raster (accessed on 3 November 2019).
- Bonan, G.B.; Defries, R.S.; Coe, M.T.; Ojima, D.; Van Der Meer, F.D. Land use and climate. In Land Change Science, 1st ed.; Gutman, G., Janetos, A.C., Justice, C.O., Moran, E.F., Mustard, J.F., Rindfuss, R.R., Eds.; Kluwer Academic Publishers: London, UK, 2004; pp. 301–314. [Google Scholar]
- Omran, E.S.E. Detection of land-use and surface temperature change at different resolutions. J. Geogr. Inf. Syst. 2012, 4, 189–203. [Google Scholar] [CrossRef]
- Malhi, Y.; Pegoraro, E.; Nobre, A.D.; Pereira, M.G.P.; Grace, J.; Culf, A.D.; Clement, B. Energy and water dynamics of a central Amazonian rain forest. J. Geophys. Res. 2002, 107, 8061. [Google Scholar] [CrossRef]
- Randow, C.; von Manzi, A.O.; Kruijt, B.; Oliveira, P.J.; de Zanchi, F.B.; Silva, R.L.; Kabat, P. Comparative measurements and seasonal variations in energy and carbon exchange over forest and pasture in South West Amazonia. Theor. Appl. Climatol. 2004, 78, 5–26. [Google Scholar] [CrossRef]
- Zelazowski, P.; Malhi, Y.; Huntingford, C.; Sitch, S.; Fisher, J.B. Changes in the potential distributions of humid tropical forests on a warmer planet. Philos. Trans. R. Soc. Lond. Biol. Sci. 2011, 369, 137–160. [Google Scholar] [CrossRef] [PubMed]
- Duffy, P.B.; Brando, P.; Asner, G.P.; Field, C.B. Projections of future meteorological drought and wet periods in the Amazon. Proc. Natl. Acad. Sci. USA 2015, 112, 13172–13177. [Google Scholar] [CrossRef] [PubMed]
- Coe, M.T.; Brando, P.M.; Deegan, L.A.; Macedo, M.N.; Neill, C.; Silverio, D.V. The forests of the Amazon and Cerrado moderate regional climate and are the key to the future. Trop. Conserv. Sci. 2017, 10, 1–6. [Google Scholar] [CrossRef]
© 2020 by the authors. Licensee MDPI, Basel, Switzerland. This article is an open access article distributed under the terms and conditions of the Creative Commons Attribution (CC BY) license (http://creativecommons.org/licenses/by/4.0/).