Article

Identification of Dominant Factors Affecting Soil Erosion and Water Yield within Ecological Red Line Areas

1
Key Laboratory of Land Surface Pattern and Simulation, Institute of Geographic Sciences and Natural Resources Research, Chinese Academy of Sciences, Beijing 100101, China
2
College of Resources and Environment, University of Chinese Academy of Sciences, Beijing 100049, China
3
College of Urban and Environmental Sciences, Peking University, Beijing 100871, China
*
Author to whom correspondence should be addressed.
Remote Sens. 2020, 12(3), 399; https://doi.org/10.3390/rs12030399
Submission received: 6 December 2019 / Revised: 16 January 2020 / Accepted: 22 January 2020 / Published: 26 January 2020
(This article belongs to the Special Issue Ecosystem Services with Remote Sensing)

Abstract

:
Soil conservation and water retention are important metrics for designating key ecological functional areas and ecological red line (ERL) areas. However, research on the quantitative identification of dominant environmental factors in different ecological red line areas remains relatively inadequate, which is unfavorable for the zone-based management of ecological functional areas. This paper presents a case study of Beijing’s ERL areas. In order to objectively reflect the ecological characteristics of ERL areas in Beijing, which is mainly dominated by mountainous areas, the application of remote sensing data at a high resolution is important for the improvement of model calculation and spatial heterogeneity. Based on multi-source remote sensing data, meteorological and soil observations as well as soil erosion and water yield were calculated using the revised universal soil loss equation (RUSLE) and integrated valuation of ecosystem services and tradeoffs (InVEST) model. Combining the influencing factors, including slope, precipitation, land use type, vegetation coverage, geomorphological type, and elevation, a quantitative attribution analysis was performed on soil erosion and water yield in Beijing’s ERL areas using the geographical detector. The power of each influencing factor and their interaction factors in explaining the spatial distribution of soil erosion or water yield varied significantly among different ERL areas. Vegetation coverage was the dominant factor affecting soil erosion in Beijing’s ERL areas, explaining greater than 30% of its spatial heterogeneity. Land use type could explain the spatial heterogeneity of water yield more than 60%. In addition, the combination of vegetation coverage and slope was found to significantly enhance the spatial distribution of soil erosion (>55% in various ERL areas). The superposition of land use type and slope explained greater than 70% of the spatial distribution for water yield in ERL areas. The geographical detector results indicated that the high soil erosion risk areas and high water yield areas varied significantly among different ERL areas. Thus, in efforts to enhance ERL protection, focus should be placed on the spatial heterogeneity of soil erosion and water yield in different ERL areas.

Graphical Abstract

1. Introduction

Ecosystem services refer to products and benefits obtained by humans from the ecosystem, and constitute the basis for maintaining human survival and development [1,2]. In recent years, research on ecosystem services has achieved marked progress, primarily in fields such as ecosystem service evaluation, trade-off and interaction mechanisms, ecological security patterns and payments for ecosystem services [3,4,5,6]. Research on ecosystem services has been conducted in a wide variety of areas, including ecologically vulnerable areas such as the Tibetan Plateau, the Loess Plateau, and Karst areas [7,8,9], and various ecosystems, including wetlands [10], forests [11], and grasslands [12]. Additionally, research also focuses on animal and plant species protection areas, including nature reserves [13] and national parks [14]. Soil erosion and water yield are important indicators for measuring ecosystem services. Research on soil erosion and water yield has mainly focused on spatio-temporal patterns using models and the identification of impact factors through correlation analysis [15,16,17,18,19,20]. However, studies aimed at the quantitative identification of dominant factors and interaction factors, and indicating high soil erosion risk areas and high water yield areas remain rare.
Currently, scientifically understanding the importance of ecosystems in areas of high ecological functional levels and evaluating the impact of environmental factors on ecosystem services will help to identify the leading ecological environment problems and foster ecological civilization construction [21]. China is currently implementing an ecological red line system with an aim to prohibit any industrialization and urbanization activity through strict management measures, and it is pushing to protect and restore ecological functions in vulnerable ecological areas to ensure safety in people’s living environments [22]. The delineation of the ecological red line constitutes spatial boundaries and management limits that must be strictly protected to safeguard national ecological security and to clarify key national or regional ecological security areas. Analyzing possible ecological problems in these areas can provide a scientific basis for industrial distribution, environmental protection, and prevent environmental degradation caused by human activities [23]. In Nationwide Major Function Oriented Zoning, published by China in 2011, 25 national key ecological functional areas were designated. Later, Opinions of the State Council of China on Strengthening Major Environmental Protection Work stated that ecological red line would be designated in China’s key ecological functional areas, terrestrial and marine vulnerable ecological areas. The Guide for Designating Ecological Red Line, which was published by the Ministry of Ecology and Environment of China in 2017, provided instructions for designating a national ecological red line. China has designated more than a quarter of its territory, exceeding 2.4 million km2 in total, within ecological red line areas. Now, the ecological red line has become a national policy and regional framework for ecological protection and development. Although some studies have been conducted from an ecosystem service perspective to designate, monitor, and analyze ERL areas at various scales [24,25], research on the identification of dominant factors affecting metrics of great ecological significance, such as soil erosion and water yield, particularly the quantitative identification of various environmental influencing factor interactions, remains inadequate. This is unfavorable for the implementation of ecological red line protection work, improvement, and enhancement of ecological functions noted in Several Opinions on Designating and Strictly Maintaining Ecological Red Line.
The available research primarily focuses on the overall evolution of the characteristics in key ecological functional areas and ERL areas [23,26,27,28]. For example, Zhai [23] analyzed the changes of soil and water conservation and biodiversity threat level in Hainan Island of China. In comparison, there is little research aimed at the quantitative identification of dominant factors affecting soil erosion and water yield within and across ERL areas. Multisource remote sensing data are advantageous due to their heterogeneity, dynamics, and high accuracy, and they have become core basic data for evaluating regional scale ecosystem services and analyzing the underlying mechanisms of ecosystem services. With the development of remote sensing technology, high resolution remote sensing data can meticulously reflect the situation of the land surface. Combined with RUSLE and InVEST model, it can accurately simulate soil erosion and water yield in ecological red line areas. In this study, soil erosion and water yield in Beijing’s ERL areas were simulated using RUSLE and InVEST model based on multi-source remote sensing data as well as meteorological and soil observations. Additionally, the geographical detector was employed for the quantitative attribution of environmental factors affecting key ecosystem services in the soil conservation and water retention ERL areas. The dominant factors affecting soil erosion and water yield were identified by the geographical detector with the goal of providing scientific support for ecological protection and management work in ERL areas.

2. Materials and Methods
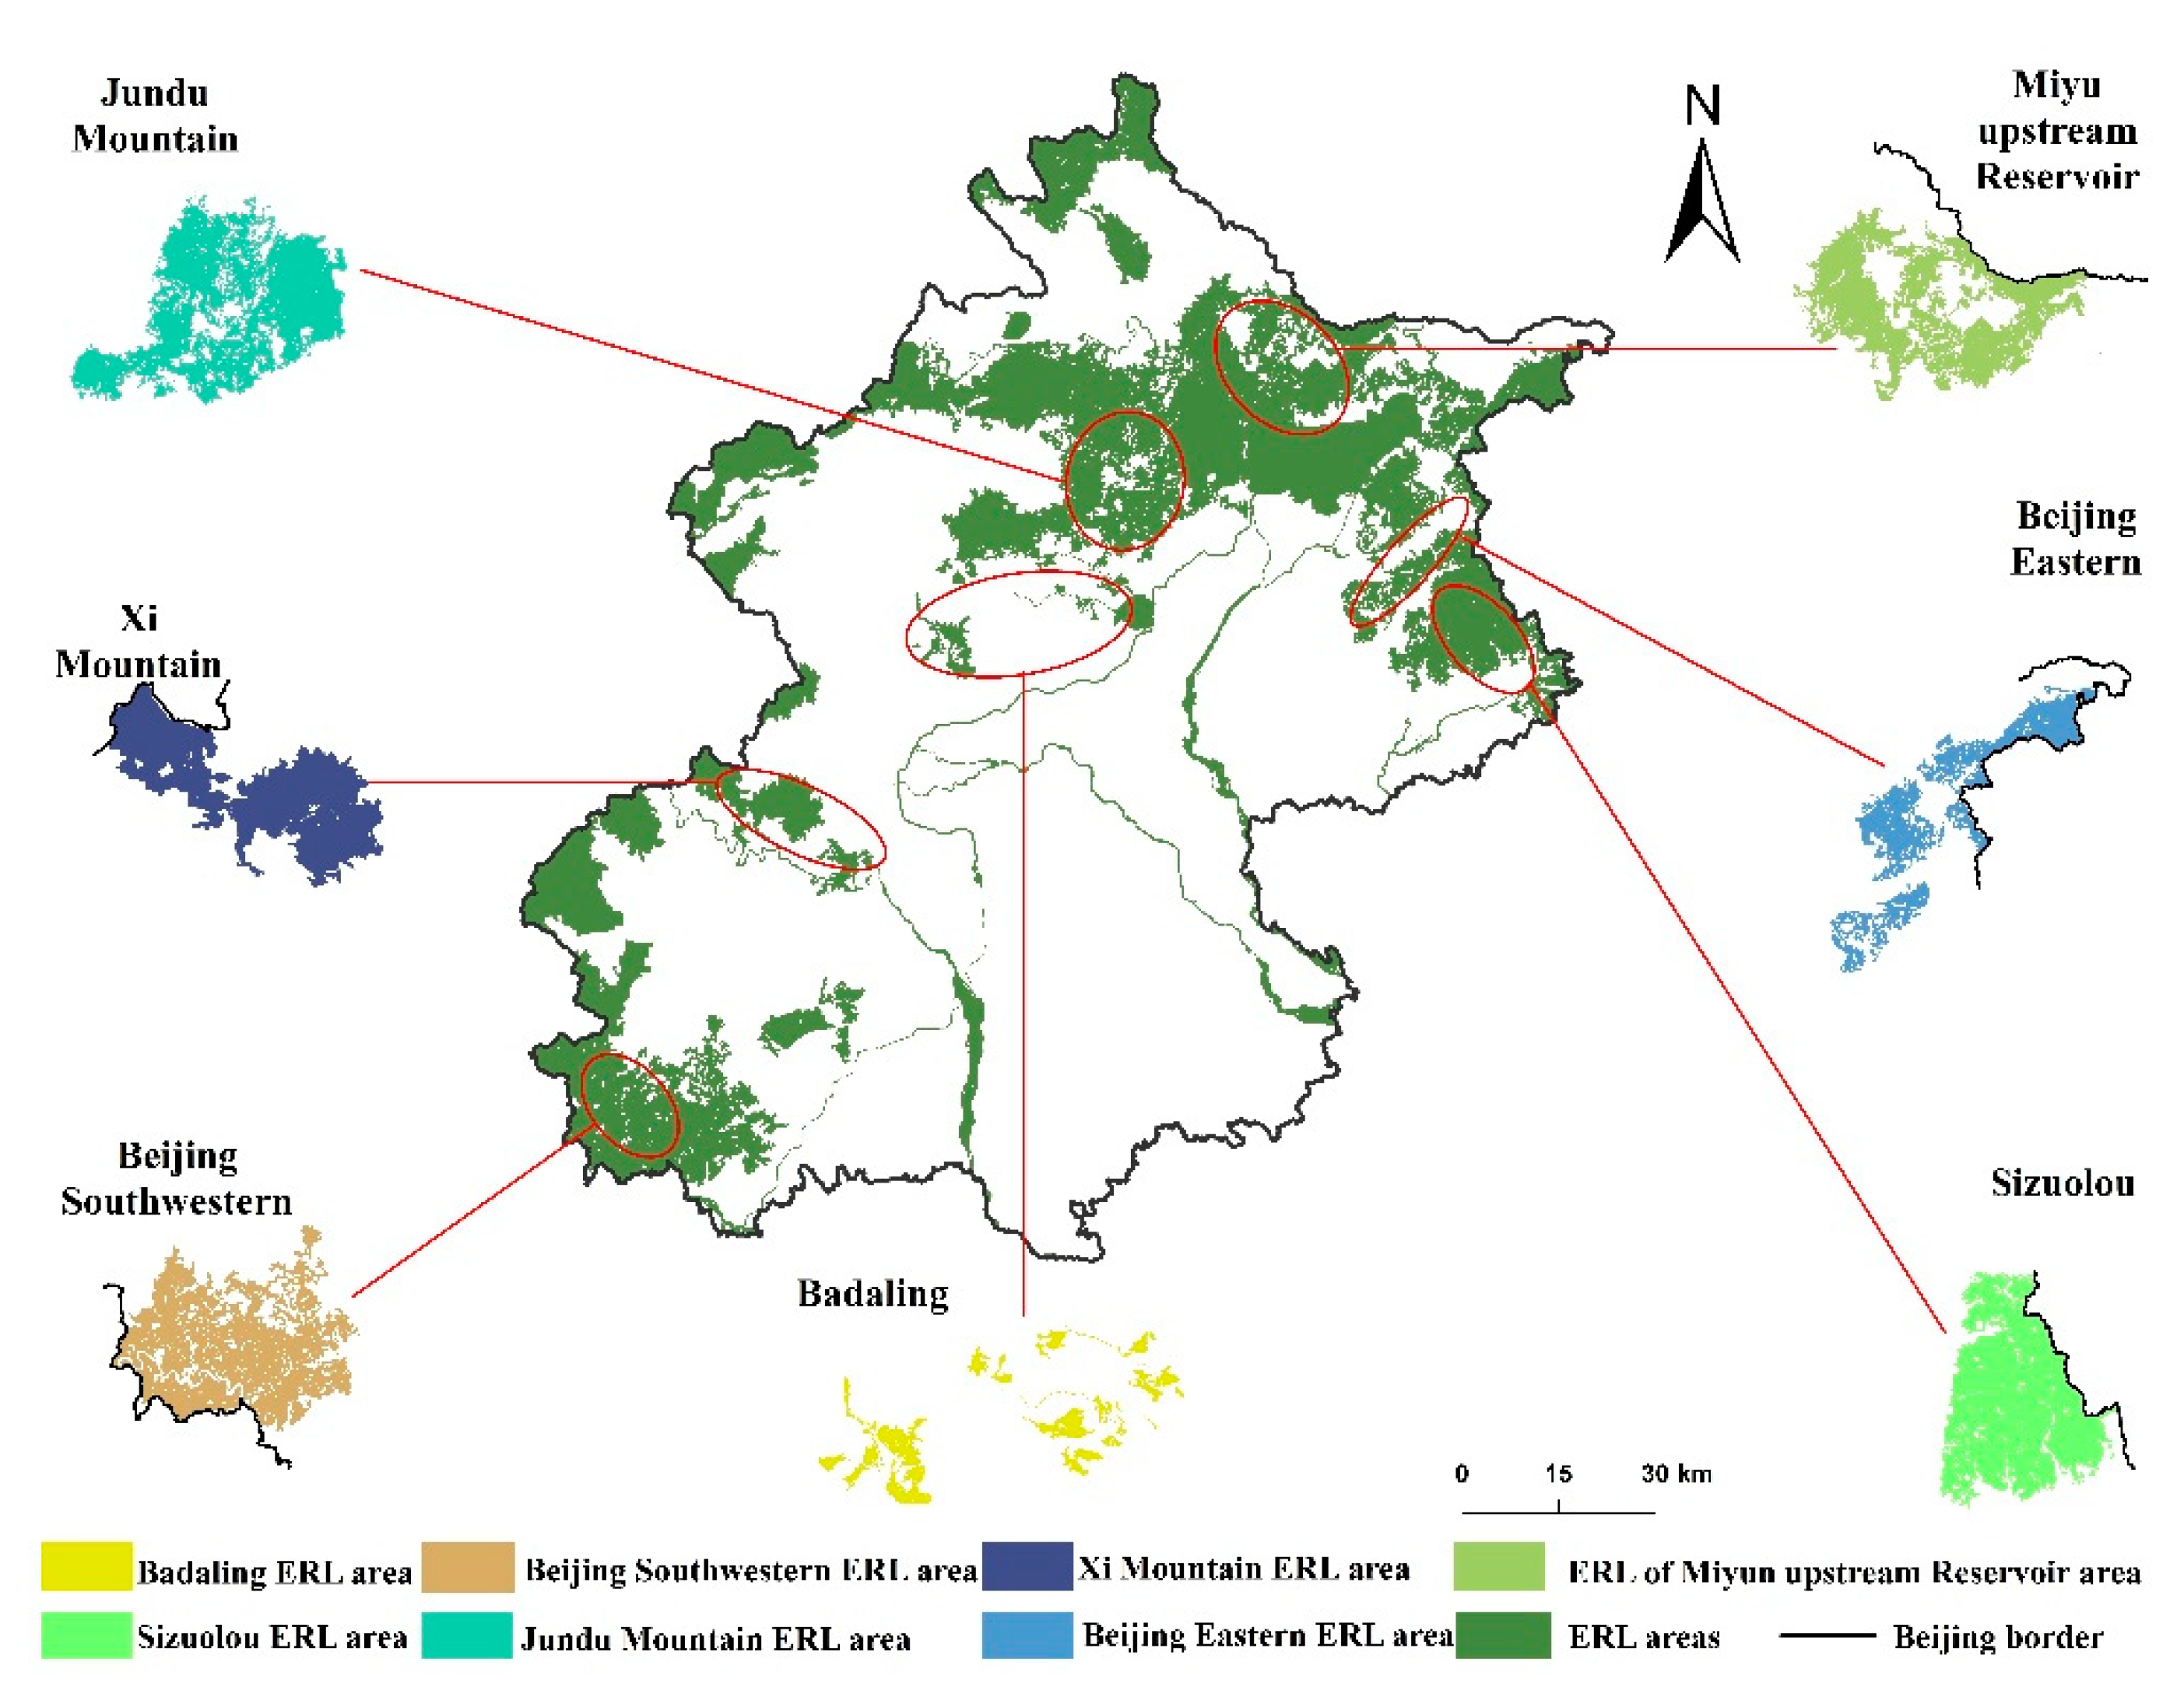
2.1. Study Area

Beijing’s ERL areas are distributed predominantly in the western and northern mountainous areas and encompass a total area of 4290 km2, representing 26.1% of Beijing’s total area. Based on their dominant ecological function, Beijing’s ERL areas are categorized into four types, specifically: soil conservation ERL areas (primarily distributed in the Xi Mountain area in the west); water retention ERL areas (primarily distributed in the Jundu Mountain area in the north, namely Miyun Reservoir, Huairou Reservoir and the upstream of Guanting Reservoir); biodiversity maintenance ERL areas (primarily distributed in the Baihua and Dongling Mountain in the west, the Song, Yudu and Haituo Mountain in the northwest, and the Labagoumen area in the north); important river and wetland ERL areas distributed in important rivers, lakes and wetlands, including the primary rivers (Yongding, Chaobai, Beiyun, Daqing and Jiyun River), three reservoirs (Miyun, Huairou and Gongting Reservoirs) and one channel (Beijing-Miyun Diversion Channel). The Beijing ERL areas map was obtained by Beijing Municipal Ecological Environment Bureau (sthjj.beijing.gov.cn), and obtained Figure 1 by digitization. In this study, Beijing’s ERL areas, with soil conservation and water retention being the dominant functions, were selected for dominant factors affecting soil erosion and water yield (Supplementary: Table S1).

2.2. Data Sources

Remote sensing data include digital elevation model (DEM) data, land use data, normalized difference vegetation index (NDVI) data, and geomorphological type data (Supplementary Figure S1). DEM, NDVI, and land use data were all used for model calculation. NDVI data for the study area were obtained using the following method. Landsat 8 OLI images of 24 scenes were selected as the data source. These remote sensing images were preprocessed (radiometric calibration, atmospheric correction and orthorectification). Then, NDVI was calculated by a linear combination of reflectance values in the near-infrared and red band. Finally, NDVI data were obtained after such postprocessing treatments (outlier processing, data mosaicking, target area cropping, projection transformation). In addition, taking the GF-1 images as the main data source, images have been preprocessed (projection transformation, geometric correction, image fusion) to improve the applicability of remote sensing data and the ability to identify ground objects. Then, according to the object-oriented classification method, land use type data were extracted through the processes (image segmentation, attribute calculation, feature selection, object classification). The interpretation data were verified based on the sample data collected on the land surface. As a result, the accuracy of the interpretation results was recognized by the Beijing Municipal Bureau of Ecology and Environment with the resolution of 15 m. Daily meteorological data from 35 meteorological stations in Beijing and its surrounding areas were acquired (Supplementary Figure S2). Precipitation data were interpolated using professional interpolation software of ANUSPLIN (Supplementary Figure S3). For ANUSPLINE software, the SPLINE command was first executed to generate a list file, residual file, optimal parameter file, surface coefficient file, and covariate error information. Then LAPGRD command was used to generate the surface coefficient file and covariate error information, thereby obtaining the precipitation interpolation file and the standard error surface file. Mechanical composition data for soil were extracted from the China Soil Database (Version 1.1) of the Harmonized World Soil Database (HWSD) which were used to model calculation. Watershed distribution and soil depth data were also used to model calculation. In addition to the above data, we used geomorphological type data for the quantitative attribution of environmental factors. The data requirements and description are shown in Table 1.

2.3. Method

2.3.1. RUSLE Model

The RUSLE model [29] is a simulation model developed by the United States Department of Agriculture for predicting annual average soil erosion, one of the most widely used soil erosion prediction models in the world. The RUSLE model is expressed as follows:
A = R × K × L S × C × P
where A is annual soil erosion rate ( t   ha 1 yr 1 ) , R is precipitation erosivity factor ( M J   mm   ha 1 h 1 yr 1 ) , K is erodibility factor ( t   ha   h   MJ 1 mm 1 ha 1 ) , LS is slope length and steepness factor, C is vegetation cover land management factor, and P is the conservation and supporting factor.
The soil erodibility factor quantitatively describes the extent of soil erodibility. In this study, the soil erodibility factor was calculated using the erosion productivity impact proposed by Williams et al. [30].
K = { 0.2 + 0.3 e [ 0.0256 W d ( 1 W i / 100 ) ] } × ( W i W i + W t ) 0.3 × [ 1 0.25 W c W c + e ( 3.72 2.95 W c ) ] × [ 1 0.7 W n W n + e ( 5.51 + 22.9 W n ) ]
W n = 1 W d 100
where Wd is sand fraction (%), Wi is silt fraction (%), Wt is clay fraction (%), and Wc refers to the content of soil organic carbon (%).
The precipitation erosivity factor describes the extent of potential precipitation impact on soil erosion. In this study, the precipitation erosivity factor was calculated using Arnoldus [31] modified version of the precipitation erosivity equation proposed by Wischmeier.
R = i = 1 12 ( 1.735 × 10 1.5 × log P i 2 P 0.8188 )
where Pi and P represent monthly mean and annual average precipitation, respectively, and i represents the month, with the values of 1, 2, ..., 12.
The slope length and steepness factor affects soil erosion mainly in two areas, namely, slope length (L) and slope (S). In this study, the LS factor was calculated based on 9-m DEM data downloaded from Google Earth, using Zhang’s [32] modified version of the method proposed by McCool [33,34] for calculating the LS factor as follows:
L S = ( λ 22.13 ) α
α = ( β β + 1 )
β = sin θ 3 × ( sin θ ) 0.8 + 0.56
S = { 10.8 × sin θ + 0.03 ( θ < 9 % , λ > 4.6 m ) 16.8 × sin θ 0.5 ( θ 9 % , λ > 4.6 m ) 3 × ( sin θ ) 0.8 + 0.56 ( λ 4.6 m )
where λ is the slope length, α is the variable length-slope exponent, β is the coefficient of variation with slope gradient, and θ is the slope.
Vegetation is the most sensitive factor affecting soil erosion [35]. Vegetation coverage has a relatively strong inhibiting effect on soil erosion. Thus, vegetation coverage is strongly correlated with the vegetation cover land management (C) value. In this study, C value was calculated based on 30 m NDVI data using the method proposed by Cai [36] which has been used in Hebei Province, North China plain, and Chaobai River Basin in Beijing, China [37,38,39].
C = { 1 f = 0 0.6508 0.3436 lg f 0 < f 78.3 % 0 f > 78.3 %
f = N D V I N D V I min N D V I max N D V I min
where f is the vegetation coverage (%), C is the vegetation cover and management factor, NDVI is the normalized vegetation index, and NDVImax and NDVImin are the maximum and minimum values of the normalized vegetation index.
Different soil and water conservation measures have different value of conservation and supporting factor (P), P є [0, 1]. In this case, 0 means no erosion, and 1 means no water and soil conservation measures. There is no unified calculation method and standard for the P value. In this study, P value was assigned to each land use type based on the study by Xu [39] which is suitable in North China plain. Table 2 summarizes the assigned p values.

2.3.2. InVEST Model

The widely used InVEST model can comprehensively and dynamically evaluate ecosystem service functions on multiple scales [40]. Based on the Budyko coupled water–energy balance assumption [41], the water-yield module uses annual average precipitation data to calculate the water yield. Based on such factors of the study area as climate, soil depth, and land use type, water yield was calculated by subtracting the actual evapotranspiration from the precipitation in a specific grid cell as follows:
Y ( x ) = ( 1 A E T ( x ) P ( x ) ) P ( x )
where AET(x) and P(x) are the actual annual evapotranspiration and actual precipitation in the grid cell x, respectively. AET(x)/P(x) was calculated using the Budyko coupled water–energy balance assumption equation as follows:
A E T ( x ) P ( x ) = 1 + P E T ( x ) P ( x ) [ 1 + ( P E T ( x ) P ( x ) ) ω ] 1 / ω
where A E T ( x ) / P ( x ) is the Budyko dryness index, which is defined as the ratio of potential evapotranspiration PET(x) to precipitation P(x), and PET(x) is the annual potential evapotranspiration (unit: mm) in each grid cell x, which is calculated using the standard Penman–Monteith equation.
P E T ( x ) = K c ( l x ) E T 0 ( x )
ω ( x ) = Z A W C ( x ) P ( x ) + 1.25
where ET0(x) is the reference evapotranspiration in pixel x, Kc(lx) is the plant evapotranspiration coefficient associated on pixel x, which is largely determined by vegetative characteristic, while Z is a seasonality parameter that represents seasonal precipitation distribution and other hydrogeological characteristics. AWC(x) is the plant-available water content.

2.3.3. Geographical Detector

Geographical detector is a statistical method for studying spatial heterogeneity and determining relevant influencing factors, and is currently extensively used in such fields as the natural [42], social [43] and environmental science [44] and human health [45]. The basic principle of geographical detector is that if the sum of variances in the subareas of an area is smaller than the total variance of the area, then there is spatial heterogeneity in the area, which may be measured using the q-statistic [46]. Geographical detector is capable of objectively reflecting the extents of impact for natural geographic elements on geographic phenomena. This method can reveal the driving forces behind soil erosion and water yield by detecting spatially heterogeneity in geographic phenomena. Geographical detector includes the factor detector, interaction detector, ecological detector and risk detector.
The factor detector detects the extent to which X (environmental factors) explains the spatial heterogeneity of Y (soil erosion or water yield), namely explanatory power, measured by q value:
q = 1 h = 1 L N h σ h 2 N σ 2 = 1 S S W S S T
S S W = h = 1 L N h σ h 2 , S S T = N σ 2
where h = 1, …, L is the stratification (i.e., classification or zoning) of the variable Y or factor X, Nh and N are the numbers of units in the layer h and the entire area, respectively; σ h 2 and σ 2 are the variances of the layer h and the entire area, respectively; SSW and SST are the sum of the intralayer variances and the total variance of the entire area; and q є [0, 1]. The higher the q value, the higher explanatory power of the influencing factor for the spatial heterogeneity of soil erosion and water yield. Additionally, the dominant factors affecting soil erosion and water yield are identified based on the q value.
The interaction detector is a unique advantage of geographical detector, capable of identifying the interactions of various factors. Whether two factors interact with one another and, if so, the intensity and direction of their interaction and whether their interaction is linear or nonlinear, can be determined by calculating and comparing the q value of each factor and the q value of the superposition in two factors [46]. The superposition of two factors is not only limited to a multiplication relation, but also includes other relations (Table 3). The interaction detector can detect the interaction of two factors if it exists.
The ecological detector determines whether there is a significant difference in the impact of various factors on spatial distribution of soil erosion and water yield and is measured using the F statistic. The risk detector is used to determine high soil erosion risk and high water yield areas. The risk factor compares differences in layer 1 and layer 2 (soil erosion and water yield) of environmental factors to determine whether the impact of an influencing factor in each subarea significantly differs when the study area is stratified by a potential risk environmental factor and examines significance using t statistic [47]. The environmental factor using t statistic compares differences in Y d 1 ¯ , Y d 2 ¯ and Y d 3 ¯ of factor D to check whether the soil erosion and water yield in each subarea is statistically different when ERL areas are stratified by factor D (environmental factors). It is assumed that soil erosion and water yield occur independently and identically over space. The greater the difference in significance, the higher the t statistic, the higher soil erosion risk and higher water yield areas.
t y ¯ h = 1 y ¯ h = 2 = Y ¯ h = 1 Y ¯ h = 2 [ V a r ( Y ¯ h = 1 ) n h = 1 + V a r ( Y ¯ h = 2 ) n h = 2 ] 1 2
where Y h ¯ represents the mean value of attributes in sub-area h, such as soil erosion or water yield, nh represents the number of samples in sub-area h, and Var represents variance. This statistic is distributed approximately as t statistic with a number of degrees of freedom (df) equal to:
d f = V a r ( Y ¯ h = 1 ) n h = 1 + V a r ( Y ¯ h = 2 ) n h = 2 1 n h = 1 1 [ V a r ( Y ¯ h = 1 ) n h = 1 ] 2 + 1 n h = 2 1 [ V a r ( Y ¯ h = 2 ) n h = 2 ] 2
The null hypothesis is H0: Y h = 1 ¯ = Y h = 2 ¯ . If H0 is rejected under a significant level α (usually 5%), it indicates that there is a significant difference between the soil erosion and water yield of subareas.

3. Results

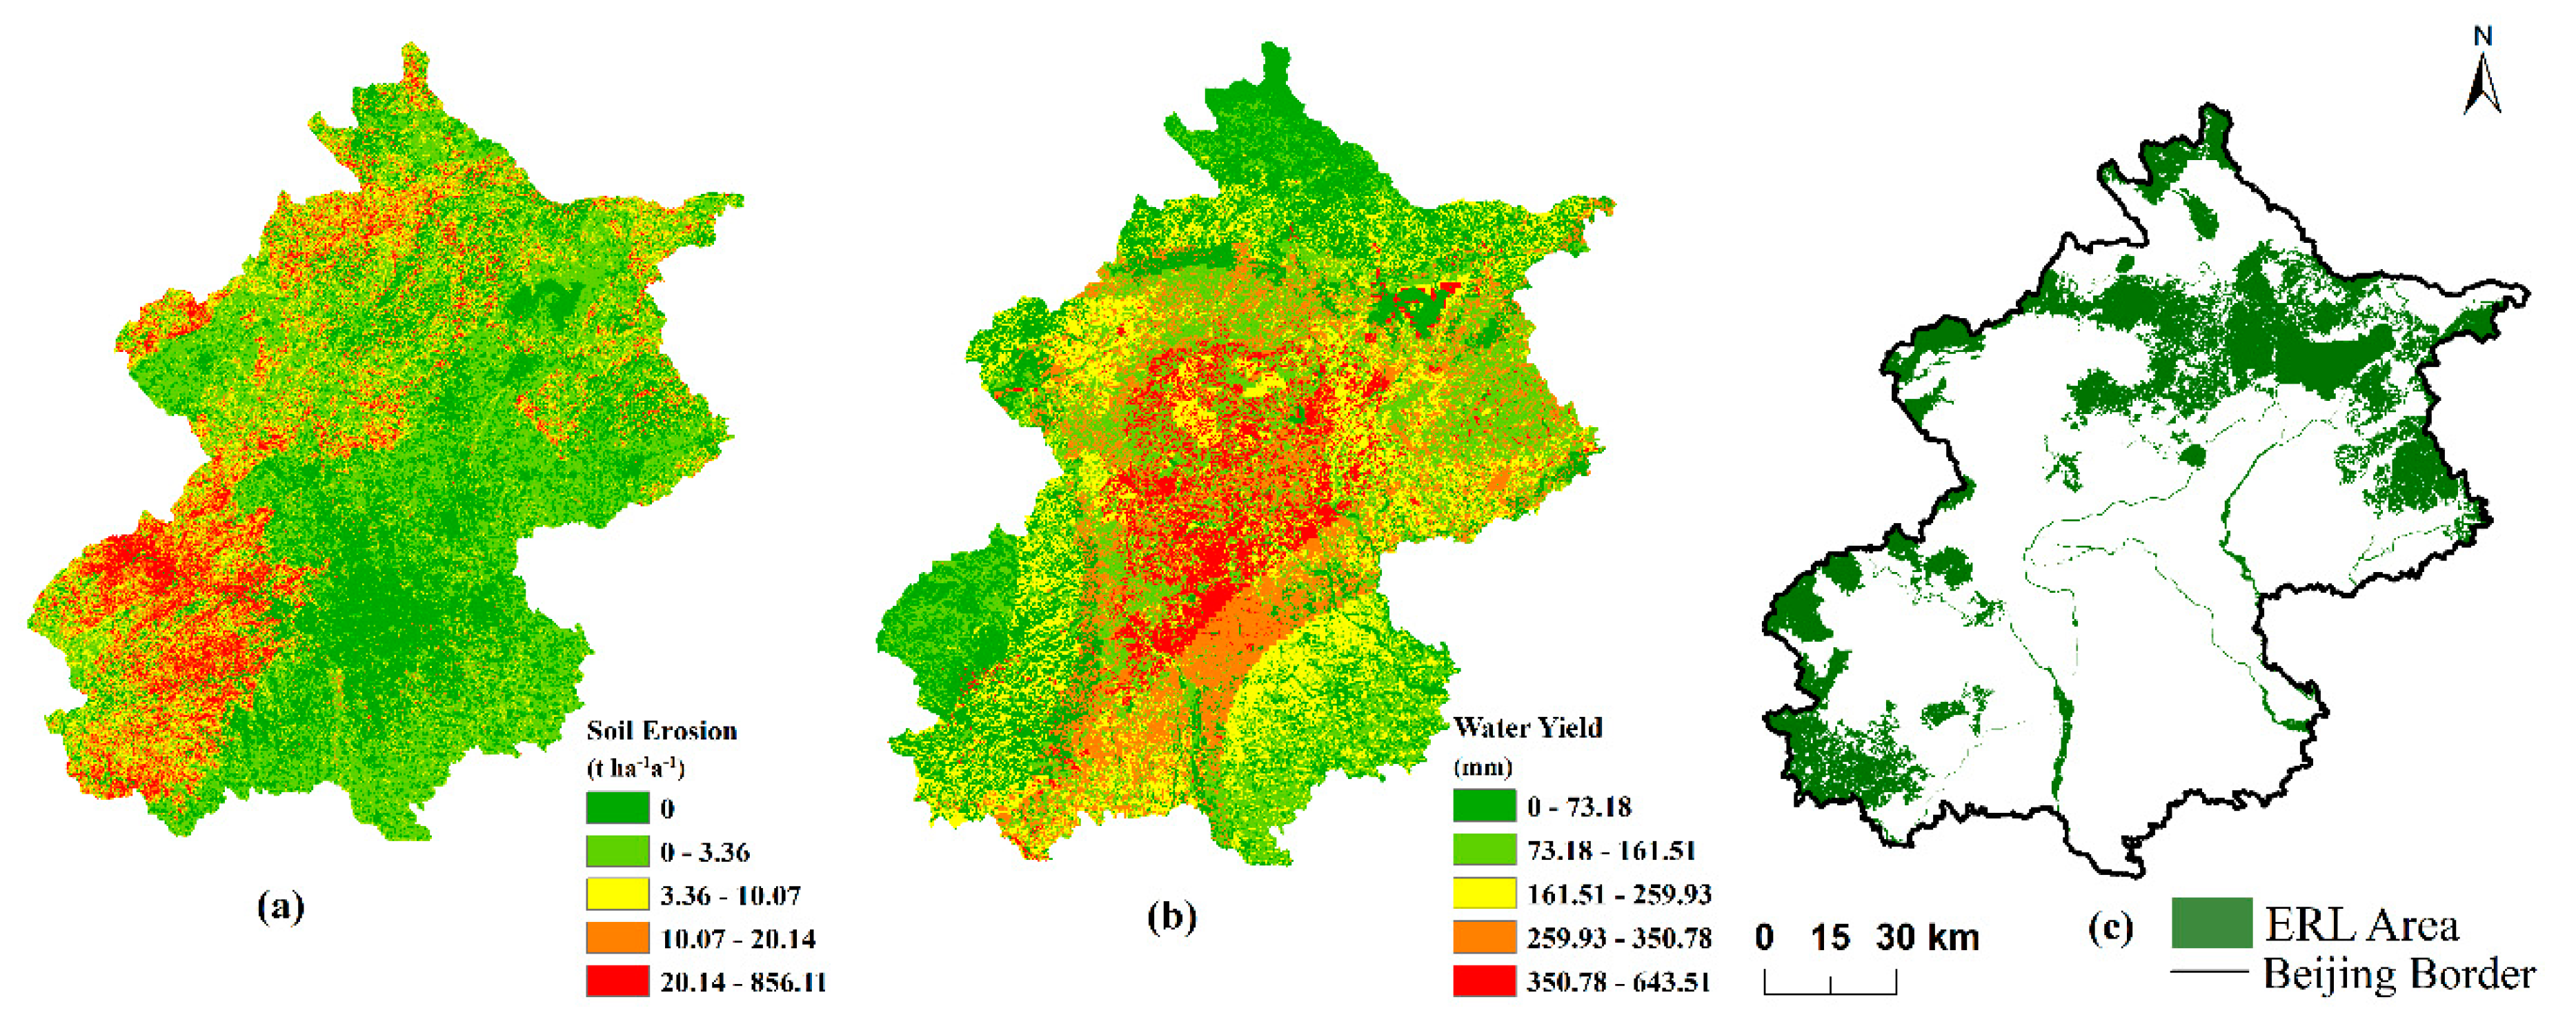
3.1. Simulation and Pattern Analysis of Soil Erosion and Water Yield in Beijing and ERL Areas

Based on the RUSLE model, Beijing’s average soil erosion in 2015 was 5.46 t·ha−1 a−1, which is consistent with the average soil erosion range of 1.53–8.18 t ha−1 a−1 in the mountainous areas of Beijing obtained through simulation by Zhou [48]. Soil erosion in Beijing was determined to exhibit spatial heterogeneity with relatively severe soil erosion of the Xi Mountain area in the west. This outcome agrees with the spatial distribution of soil erosion in Beijing calculated by Lu [49] based on Geographic Information System (GIS). Based on the RUSLE model, the range of soil erosion calculated for Beijing’s ERL areas was 0–571.74 t·ha−1 a−1, with an average soil erosion of 7.72 t·ha−1 a−1. Evidently, the average soil erosion was higher in the ERL areas than Beijing. The high value area of soil erosion included not only the soil conservation ERL areas, but also other dominant functional ERL areas. Based on the InVEST model, Beijing’s total annual water yield in 2015 was calculated to be approximately 2.761 billion m3, which is close to the total amount of Beijing’s water resources in 2015 (2.676 billion m3), as reported in the 2015 Beijing Water Resources Bulletin. Additionally, the water yield of the Beiyun, Chaobai, Daqing, Jiyun, and Yongding Rivers in Beijing were also simulated. The simulated value of water yield was approximately equivalent to the statistic reported in the 2015 Beijing Water Resources Bulletin, and the simulated trends were the same as those reported in the Beijing Water Resources Bulletin. Based on the InVEST model, the water yield of Beijing’s ERL areas in 2015 were calculated to be in the range of 0–639.94 mm. Soil erosion and water yield in Beijing and its ERL areas exhibited high spatial heterogeneity (Figure 2). Soil erosion in Beijing was primarily distributed in the mountainous areas, with low values in the plain. High water yield areas in Beijing were primarily distributed in the Beiyun River. The water yield of the Beiyun River catchment area was higher than that of other catchment areas. Regarding ERL areas, the Xi ERL area, with a significantly higher average elevation than other ERL areas, had relatively low vegetation coverage. The SW ERL area, with the highest average slope among the ERL areas, had the lowest precipitation and vegetation coverage. The BDL ERL area had the highest precipitation but lower slope and elevation than other ERL areas. The MY ERL area and SZL ERL area had the highest vegetation coverage. The JD ERL area and BE ERL area had relatively high vegetation coverage and precipitation. Soil erosion and water yield differed significantly among ERL areas. Due to the combined action of multiple factors, such as geomorphological type, slope, precipitation and vegetation coverage, the Xi ERL area had the highest soil erosion among the ERL areas, and the BDL ERL area had the highest water yield (Supplementary: Table S2).

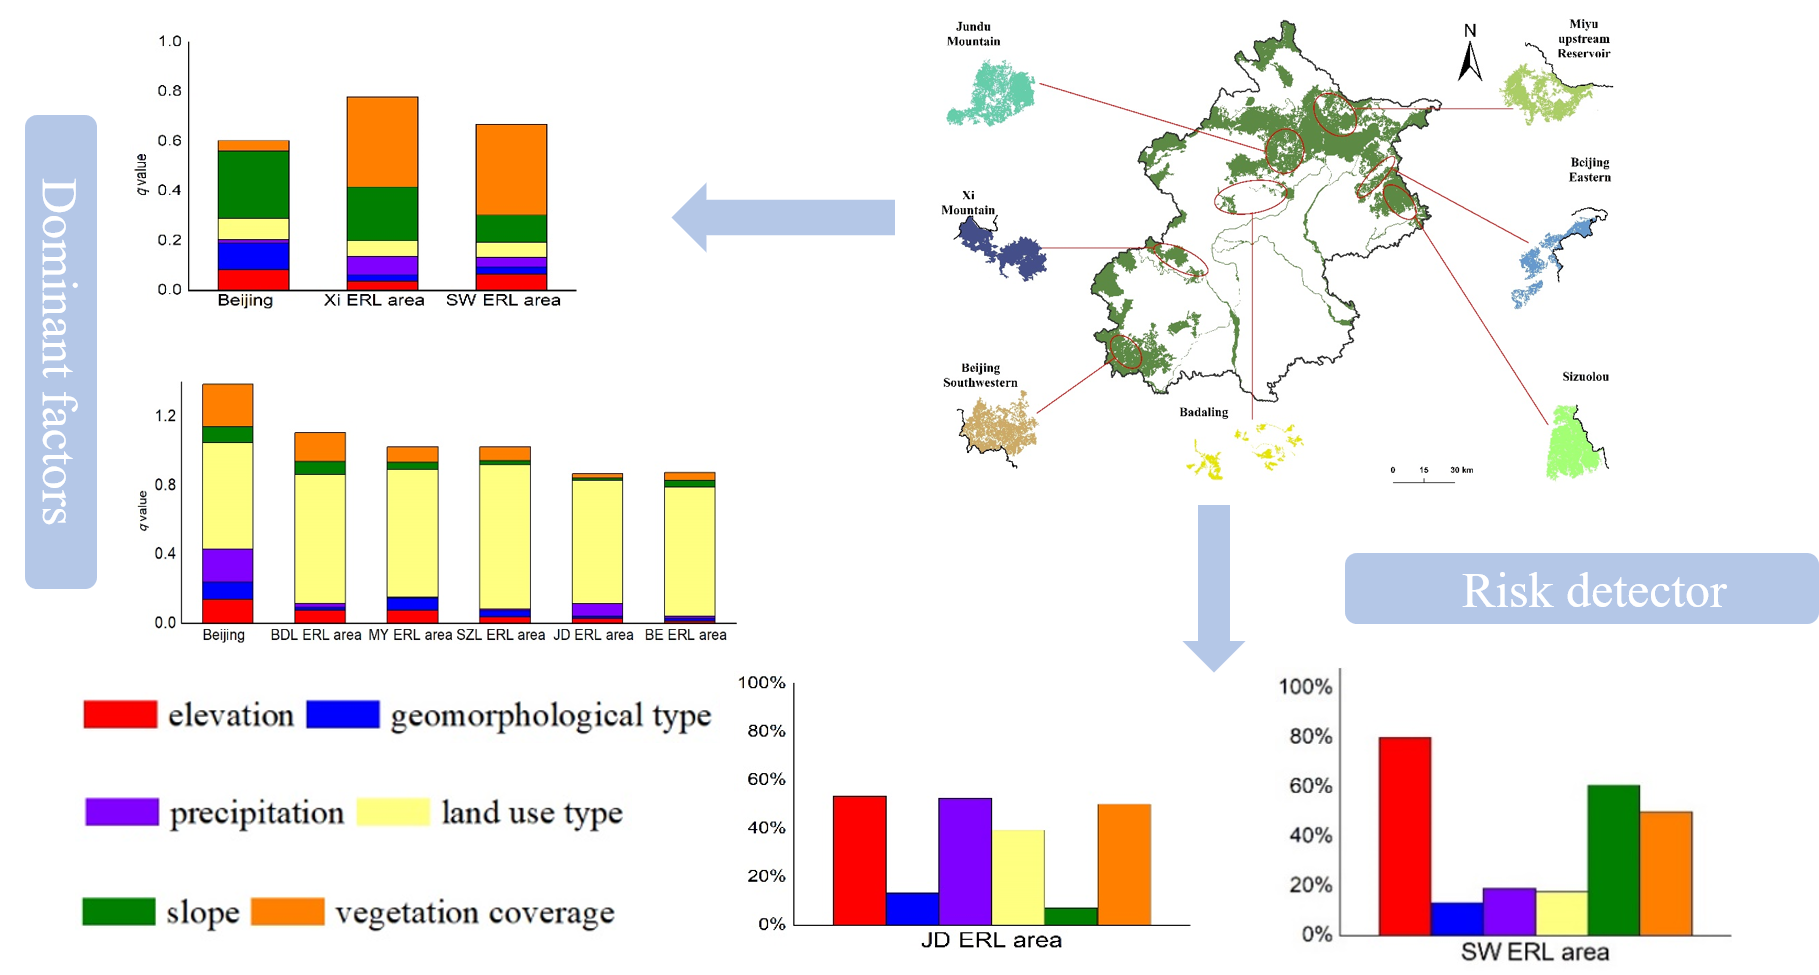
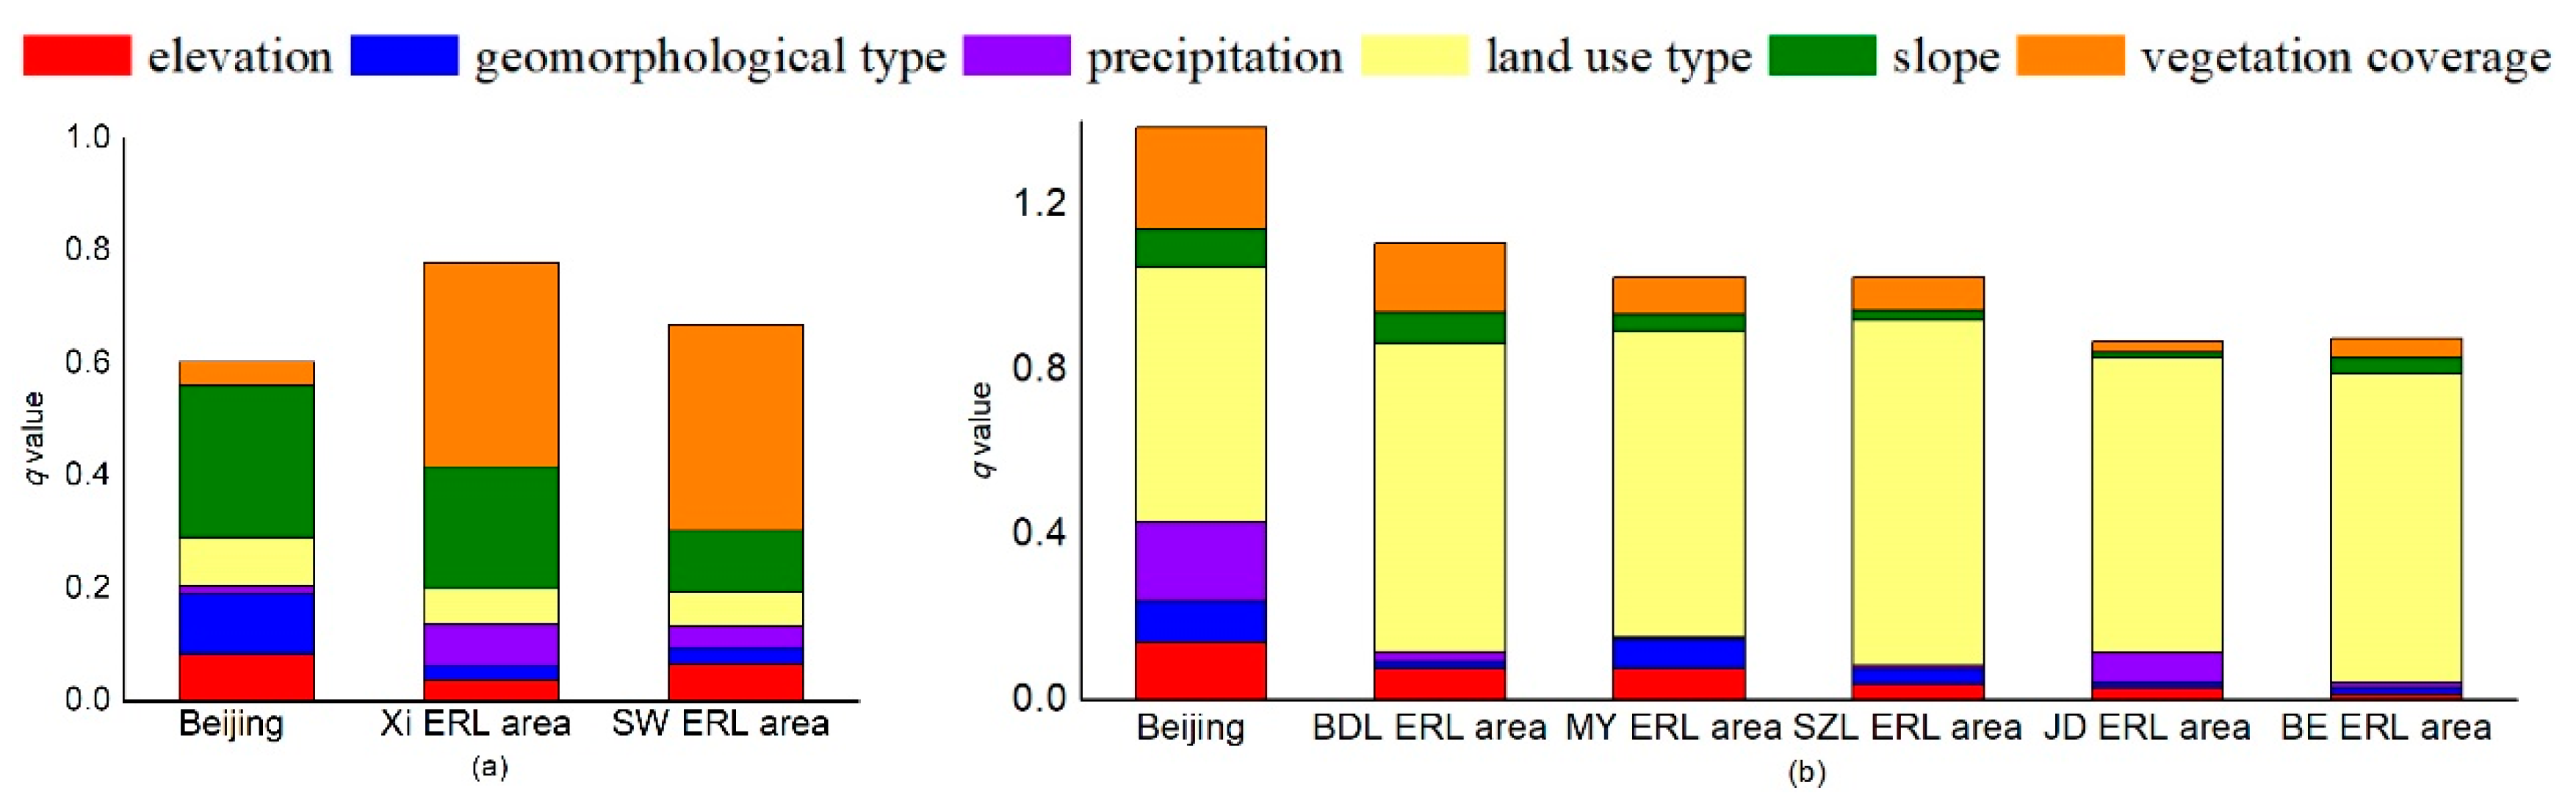
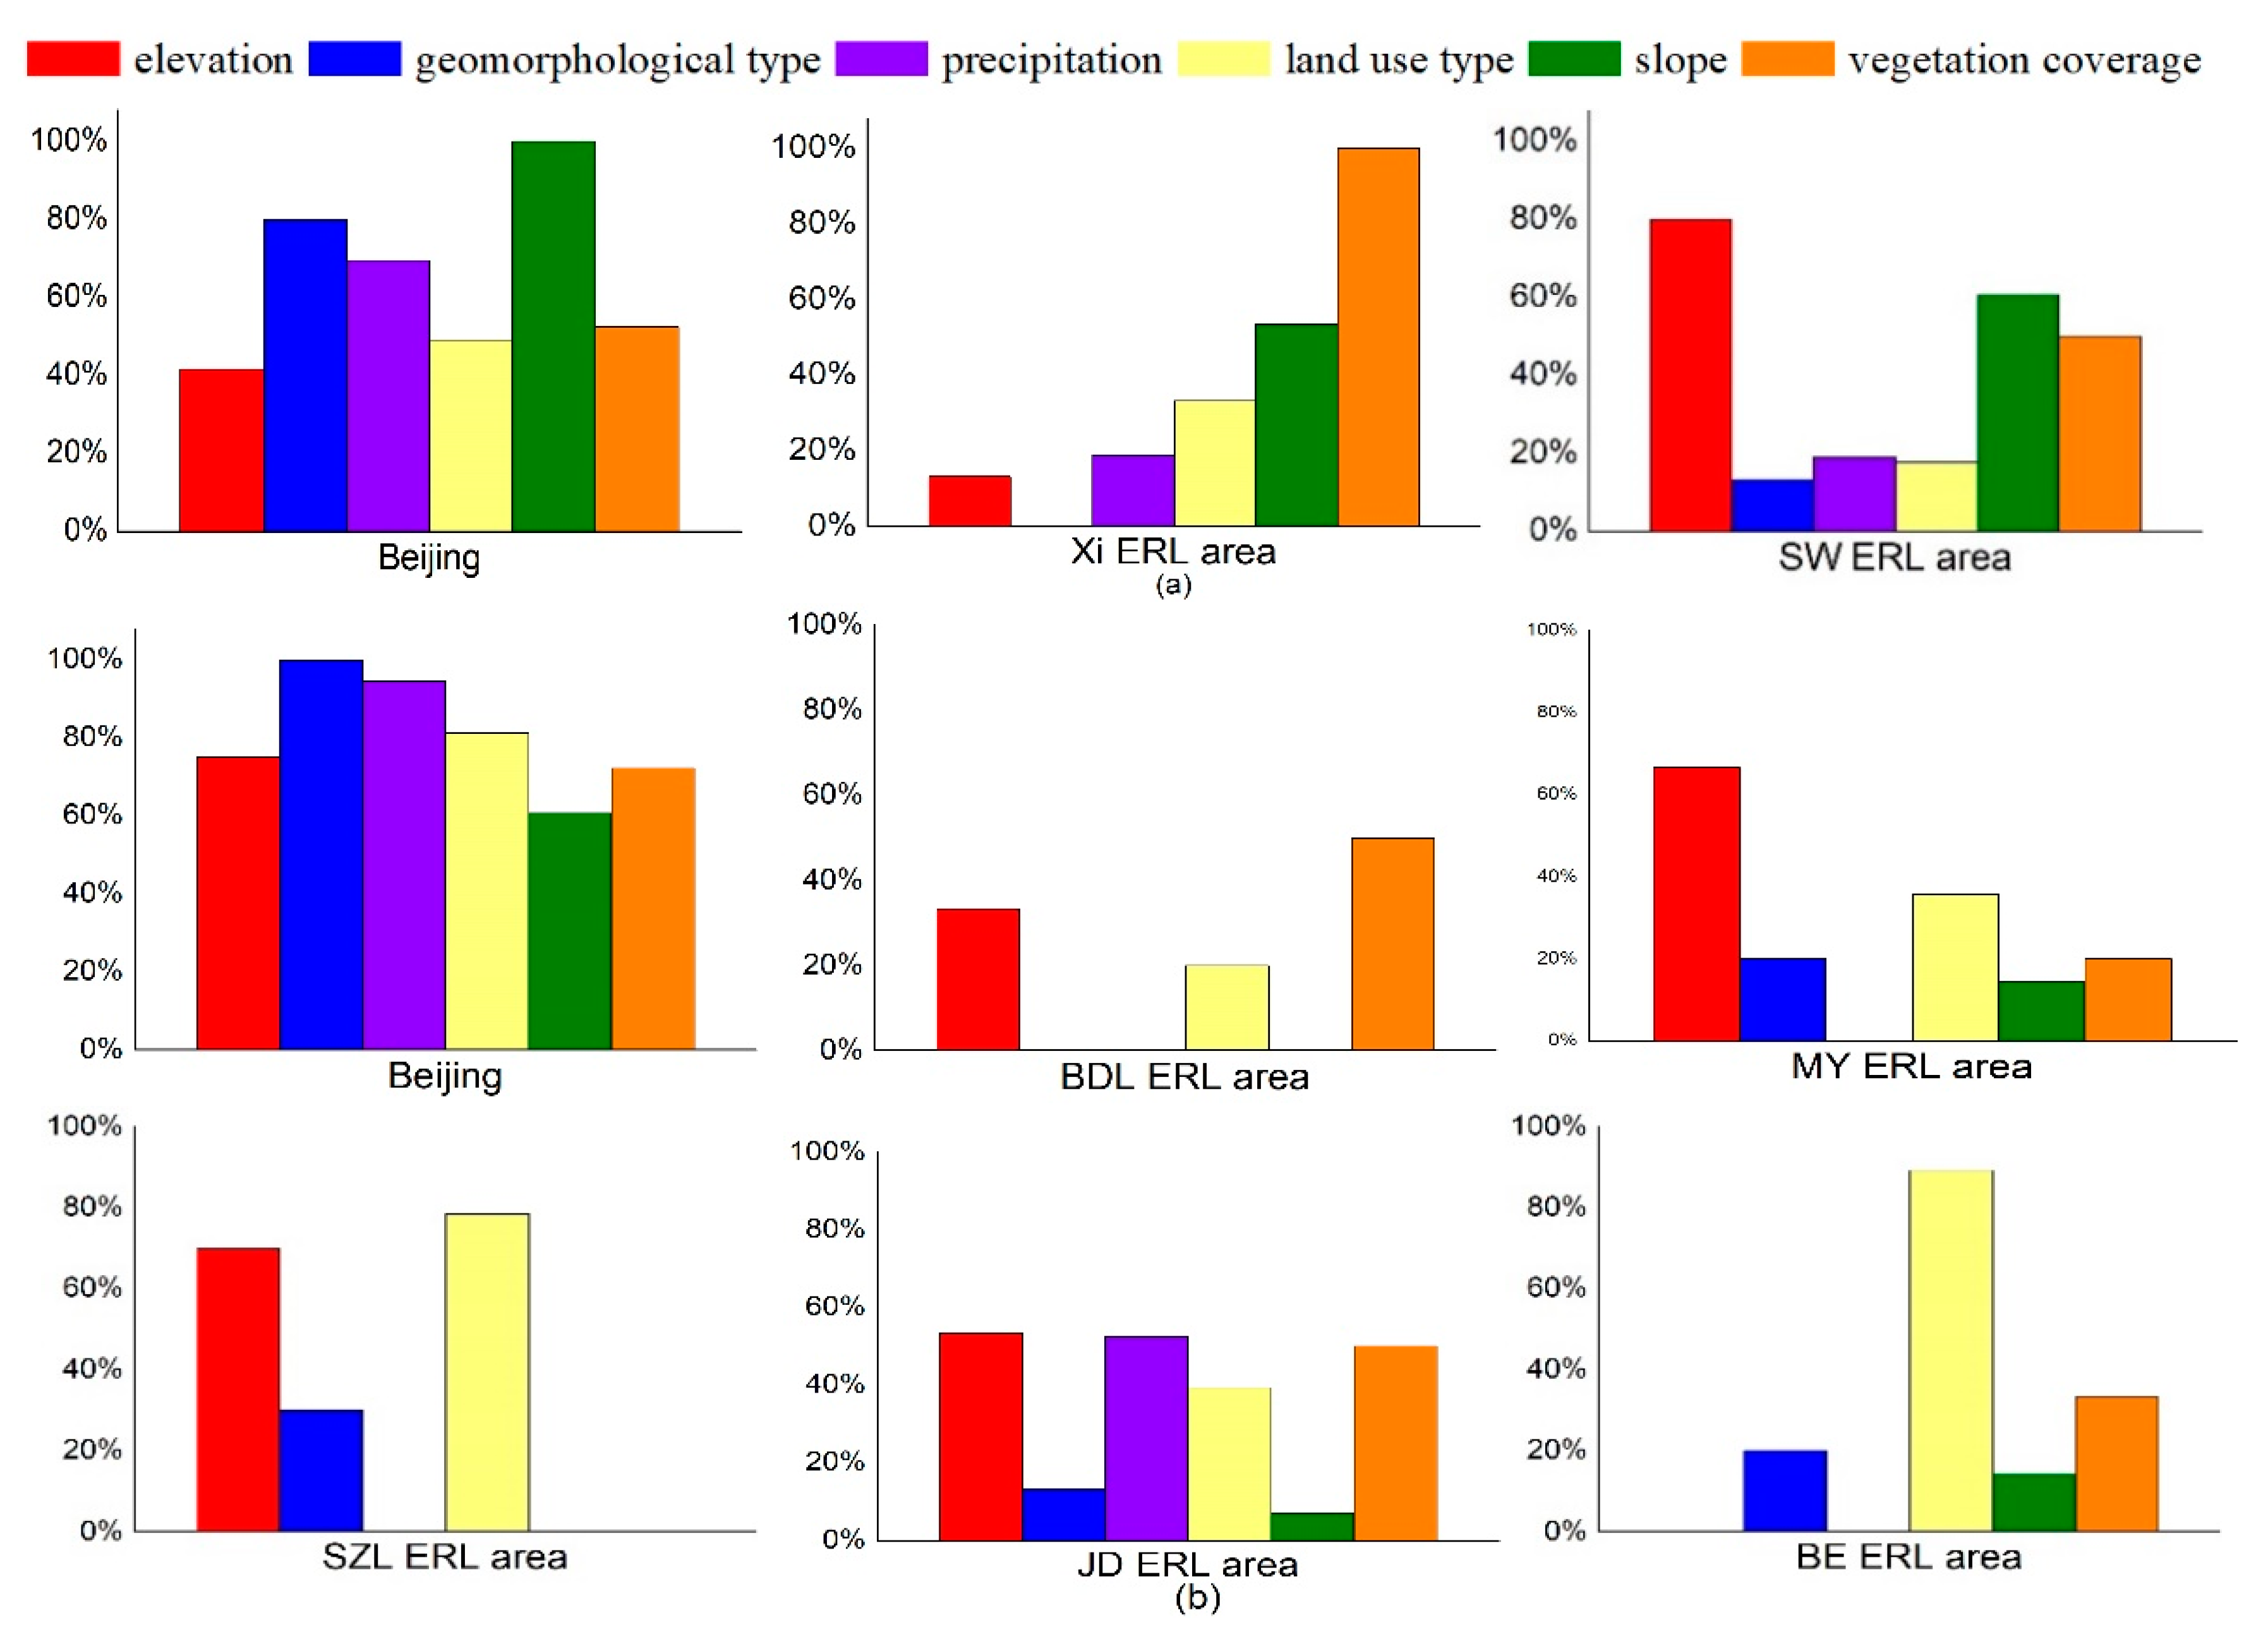
3.2. Quantitative Attribution of Single Factor Affecting Soil Erosion and Water Yield in ERL Areas

The factor detector can determine the dominant factor affecting soil erosion and its explanatory power. The results of the factor detector were shown in Figure 3a, the dominant factor of soil erosion in Beijing was slope, with an explanatory power of 26.96%, and the dominant factor in Beijing ERL areas was vegetation coverage, which explained 36% of the spatial heterogeneity in soil erosion. The relatively significant difference and heterogeneity of slope in Beijing weakened the explanatory power of vegetation coverage for soil erosion. In comparison, as a result of the relatively insignificant difference in slope and the relatively significant difference in vegetation coverage, the latter was found to have a higher explanatory power for soil erosion than the slope in Beijing’s ERL areas. The explanatory power of precipitation for soil erosion in Beijing and its ERL areas was insignificant. The explanatory power of geomorphological type for the spatial distribution of soil erosion differed between the ERL areas. The explanatory power for Beijing was 10.66%, and the explanatory power for the ERL areas was less than 3%. Compared to its ERL areas, there is a richer variety of geomorphological type and more significant heterogeneity in geomorphological type in Beijing. Land use type and elevation were found to have similar explanatory power, which did not exceed 10%. The ecological detector results revealed that the impact of precipitation, vegetation coverage and slope on the spatial distribution of soil erosion in Beijing differed significantly from other factors, and the impact of vegetation coverage on soil erosion in the Xi ERL area and SW ERL area differed significantly from other factors.
The significance of each environmental factor in affecting water yield differed among ERL areas, as shown in Figure 3b. Land use type had the highest explanatory power among environmental factors for water yield, exceeding 60% in each ERL area. Vegetation coverage had the second highest explanatory power for water yield in all areas except the JD ERL area. In the JD ERL area, precipitation was relatively abundant and exhibited high heterogeneity which had a higher explanatory power than vegetation coverage for water yield. Geomorphological type and slope both had low explanatory power for water yield in the ERL areas. The ERL areas have different natural conditions and differ relatively significantly in geomorphological type and elevation. A significant difference about explanatory power was found in elevation and precipitation for water yield in the ERL areas. The impact of land use type, vegetation coverage, elevation and precipitation on the spatial distribution of water yield in Beijing differed significantly from other factors. In comparison, the impact of land use type on the spatial distribution of water yield in the ERL areas differed significantly from other factors.

3.3. Identification of Interactions Factors Affecting Soil Erosion and Water Yield in ERL Areas

The interaction detector was primarily used to determine the explanatory power about the interaction of every two environmental influencing factors for soil erosion. The explanatory power of every two interaction factors for soil erosion in Beijing and its ERL areas was higher than that of the corresponding individual factors. The dominant interaction differed between different ERL areas. Table 4 summarizes the statistics of interactions, including the three with highest explanatory power. In both Beijing and its ERL areas, the interaction of vegetation coverage and slope had the highest explanatory power which was above 55% and was the main controlling factors for soil erosion. The area with high vegetation coverage can effectively reduce soil erosion, and the steep slope is prone to soil erosion. The superposition of vegetation coverage and slope greatly enhanced the interpretation of soil erosion. Each secondary dominant interaction was the superposition of vegetation coverage and another influencing factor. For Beijing, it was the interaction of vegetation coverage and geomorphological type; for the Xi ERL area and SW ERL area, it was the combination of vegetation coverage and precipitation. Beijing has a rich variety of geomorphological types which includes six types: plain, platform, hill, low relief mountain, middle relief mountain and high relief mountain. Environmental factors such as precipitation and slope differed relatively significantly between different geomorphological types. The superposition of vegetation coverage and geomorphological types enhanced the explanatory power for the spatial distribution of soil erosion. Precipitation is one of the primary driving forces for soil erosion and will aggravate soil erosion in the ERL areas. Beijing and its ERL areas were found to differ in the third dominant interaction of influencing factors and their explanatory powers were all more than 30%.
The dominant interactions for water yield with the top three highest explanatory powers were determined which differed among the ERL areas (Table 5). In Beijing and its ERL areas, highest interaction factors were the superposition of land use type and another influencing factor. All of the dominant interactions had an explanatory power exceeding 60%, and there was little difference in explanatory power among the dominant interactions. The combination of land use type and precipitation could explain 81.1% of spatial distribution for water yield in the JD ERL area. Average precipitation was high in Beijing and the JD ERL area, with significant difference in precipitation. The superposition of land use type and precipitation significantly increased the explanatory power for water yield in Beijing and the JD ERL area. BE ERL area has a rich variety of geomorphological types. In this area, the superposition of land use type and geomorphological type enhanced the explanatory power for the spatial distribution of water yield. In the SZL ERL area, there was a relatively significant stratified heterogeneity in slope, and the superposition of slope and land use type explained 85.57% of the spatial distribution on water yield. Land use type and vegetation coverage were the top two dominant factors affecting water yield in the BDL ERL area and their superposition was found to significantly increase the explanatory power for the spatial distribution of water yield. Elevation varies significantly in the MY ERL area, and elevation indirectly affects such factors as precipitation and vegetation coverage. As a result, the superposition of land use type and elevation explained 80.36% of the spatial distribution for water yield in this area.

3.4. Distribution of High Soil Erosion Risk Areas and High Water Yield Areas

The risk detector can be used to judge the most important types or ranges of environmental factors in high soil erosion risk areas and identify high soil erosion risk areas (at a confidence level of 95%). In addition, it can also be used to detect whether there is a significant difference of its spatial distribution according to the impact on the average value of different influencing factor types, and thus the percentage of stratified combinations with significant differences can be counted (Table 6). High soil erosion risk areas were found to differ significantly between different areas. Unused land was found to have suffered the most severe soil erosion. This is because the surface of unused land is heavily exposed and the soil is unprotected by vegetation, and thus prone to erosion. Soil erosion differed between different ERL areas and increased with slope. Areas with slope greater than 35° were at high risk of soil erosion. No significant positive or negative correlation was found between precipitation and the spatial distribution of soil erosion. Furthermore, there was no significant correlation between vegetation coverage and the spatial distribution of soil erosion in Beijing. However, soil erosion in the Xi ERL area and SW ERL area was found to decrease with increasing vegetation coverage. Geomorphological type serves as background where soil erosion occurs. The formation of geomorphological type is complex and affects by a multitude of factors. The geomorphological type in high soil erosion risk areas were found to differ between different ERL areas. In Beijing, high relief mountainous areas at relatively high elevation were at high risk of soil erosion. In the Xi ERL area and SW ERL area, plain and platform at relatively low elevation were at high risk of soil erosion. The percentage of significant differences in each natural influencing factor affecting soil erosion differed relatively significantly between different areas (Figure 4a). The strata difference in vegetation coverage was at maximum (100%) in the Xi ERL area. The strata difference in slope reached 100% in Beijing. The strata difference in elevation was 80% in the SW ERL area. The strata differences in each of land use, precipitation, and geomorphological type reached relatively insignificant.
The risk detector was used to explain the difference in the significance of each influencing factor between areas and identify high water yield areas. High water yield areas differed relatively significantly between different areas (Table 7). In all ERL areas except BDL ERL area, construction land was found to have high water yield. The construction land has a large area of impervious layers which is easy to form surface runoff. However, low coverage grassland had high water yield in the BDL ERL area. With the difference in root depth and coefficient of evapotranspiration, low coverage grassland had significant influence for water yield. Unused land had high water yield in Beijing. Unused land has a low coefficient of evapotranspiration and is weak for soil and water conservation. which has high potential for the formation of runoff. Slope is one of the most important factors reflecting underlying surface properties. A negative correlation was found between water yield and slope in Beijing and MY ERL area. No significant correlation was found between water yield and slope in other ERL areas. No significant positive or negative correlation was found between precipitation, elevation and vegetation coverage and the spatial distribution of water yield. Additionally, the ranges of these three factors resulting in high water yields also differed. The geomorphological type serves as an important background where runoff occurs and is affected by many factors. As a result, high water yield areas in different ERL areas were found to differ in geomorphological type. The impact factors in the different ERL areas had significant combined percentage differences in the amount of water yield (Figure 4b). The strata difference in precipitation differed relatively significantly between different ERL areas and reached 94.44% in Beijing, 52.38% in the JD ERL area, and 0 in all other ERL areas. The strata difference in elevation differed relatively significantly in Beijing and all ERL areas except the BE ERL area. Land use type differed significantly among areas. The strata difference in land use type reached 81.29% in Beijing and over 20% in the ERL areas. The strata difference in geomorphological type reached 100% in Beijing and was relatively insignificant in the ERL areas. The strata differences in slope and vegetation coverage were low.

4. Discussion

Important ecological functional areas are essential for fostering national ecological civilization development, establishing an ecological security pattern, containing the deteriorating trend of ecosystem services and facilitating the harmonious coexistence of humans and nature. Soil erosion and water yield are key metrics for evaluating ecological environments in key ecological functional areas. In this study, Beijing’s ERL areas were found to differ significantly in the spatial distribution and quantitative attribution characteristics of soil erosion and water yield. A quantitative attribution analysis was performed on soil erosion and water yield in Beijing and its ERL areas in 2015–2018 (each of four years) to analyze the impact of climate and land use changes on attribution analysis results (Supplementary Tables S3–S6). The results for these four years were found to be consistent. Vegetation coverage was found to be the dominant factor affecting the spatial distribution of soil erosion in Beijing’s ERL areas, with an explanatory power exceeding 30%. Land use type was the dominant factor affecting the spatial distribution of water yield in Beijing’s ERL areas that the explanatory power exceeded 30%. These results confirmed that this study’s findings were applicable to the ERL areas and could provide the reference for the protection of ERL areas.
Vegetation coverage was found to be the dominant factor affecting the spatial distribution of soil erosion in Beijing’s soil conservation ERL areas. Interception by vegetation canopies can effectively reduce raindrop energy and increase rainwater infiltration. Plant roots can enhance soil’s resistance to erosion. Therefore, vegetation coverage is a sensitive factor affecting soil erosion [50]. In terms of the water yield in Beijing’s ERL areas, land use type was found to be the dominant factor, having the highest explanatory power among the factors. Land use changes underlying surface conditions and affects precipitation interception, infiltration and runoff processes. Different land use types differ relatively significantly in hydrological effects [51]. Elevation and precipitation were found to differ relatively significantly in the explanatory power for water field in the ERL areas. This difference may be due to significant differences among ERL areas in geomorphological type and climatic factors.
The interaction detection results indicated that vegetation coverage and slope had a combined explanatory power over 55% for soil erosion, suggesting that steep slope with relatively low vegetation coverage is extremely prone to soil erosion. Zhang [52] noted that soil erosion was primarily distributed on steep slope in the Xi Mountain area of Beijing and found aggravated soil erosion in areas with large slope and relatively low vegetation coverage. This finding agreed with the finding of this study that the superposition of vegetation coverage and slope will enhance the controlling effect on soil erosion. High soil erosion risk areas and the critical value of each influencing factor differed between Beijing’s ERL areas. Unused land was found to be associated with a high risk of soil erosion. Transforming unused land by implementing such projects as afforestation and greening the barren hill can effectively curb soil erosion. Forest and grassland were found to have a low risk of soil erosion in the Xi ERL area and SW ERL area, respectively. The interaction detector was used to detect the interactions of factors affecting water yield. The results indicated that the most significant interactions for water yield were superposition of land use type and another influencing factor. Owing to their relatively significant difference in natural conditions such as geomorphological type and climate, the factor superposed with land use type varied between different ERL areas. For example, Wu [53] pointed out that climate and land use changes were the primary causes of change in the water yield of Guanting Reservoir in Beijing. Similar conclusions were derived from this study. The combination of land use type and precipitation in the JD ERL area was found to enhance the controlling effect on water yield and have an explanatory power as high as 81.1% for water yield.
ERL is the base of regional ecological security in China. Monitoring, evaluation and attribution analysis of dominant ecosystem services in ERL areas will effectively help maintain and improve ecological functions and facilitate sustainable social economic development. In this study, the RUSLE and InVEST models were employed to simulate Beijing’s ERL areas and calculate soil erosion in Beijing’s soil conservation ERL areas and water yield in Beijing’s water retention ERL areas. Additionally, geographical detector was used to examine the dominant factors affecting the spatial distribution of soil erosion and water yield in Beijing’s ERL areas and their interactions. Moreover, a quantitative attribution analysis was performed on soil erosion and water yield. The results can provide the reference for accurately managing ERL areas. The LS, C, and P factors in the RUSLE model were calculated using 9-m DEM data, 30-m NDVI data and 15-m land use data, respectively, which significantly improved simulation accuracy. However, the P factor more suitable for Beijing which relies on field investigation and observation of experimental station should be further explored in the future work. Ecosystem services are inseparable from human activity. Human disturbances such as the construction of terraced fields, slope farmland, and fish-scale pit have a relatively significant impact on soil erosion. In future investigations, focus should be directed to the impact of human factors on soil and water conservation and the correction of the related models based on human influencing factors. Additionally, it is also necessary to quantitatively study different ecosystem services in ERL areas and to identify the dominant influencing factors for their trade-off or synergy interactions. These efforts will help to ensure environmental quality and ecosystem integrity and stability in ERL areas.

5. Conclusions

In this study, ERL areas in Beijing are mainly located in deep and shallow mountains, which have strong spatial heterogeneity because of the complicated terrain. Compared with the ecological environment of the plain, mountainous areas remain more complex because the vertical zonality of the ecological environment. Using high resolution remote sensing data is important for reflecting the spatial heterogeneity. The RUSLE and InVEST models were employed to calculate soil erosion and water yield in Beijing and its ERL areas. Additionally, geographical detector was used to examine the dominant factors affecting the spatial distribution of soil erosion and water yield in Beijing’s ERL areas and their interactions, and to identify high soil erosion risk and high water yield areas. The following conclusions were drawn and were expected to provide the reference for controlling and managing key ecological functional areas.
Factors were found to affect soil erosion and water yield in Beijing and its ERL areas to vary extents. Due to its significant difference in Beijing, slope had an explanatory power of 26.96% for the spatial distribution of soil erosion in Beijing. In the soil conservation ERL areas, primarily at relatively high elevation and with relatively steep slope, vegetation coverage had an explanatory power exceeding 36% for soil erosion which the reason may be canopy interception reducing erosion dynamic and root distribution which can consolidate of soil and prevent soil erosion. Land use type had the highest explanatory power for water yield which was exceeding 60% in Beijing, as well as the water conservation ERL areas.
Relative to the explanatory power of individual factors, the interaction of any two impact factors was found to increase the explanatory ability for soil erosion and water yield. The dominant interactions for soil erosion and water yield differed between different ERL areas. The superposition of vegetation coverage and slope was found to significantly enhance the explanatory power for soil erosion, explaining more than 50% of its spatial distribution. This suggested that implementation of such programs as “Grain for Green” and “Natural Forest Protection Program” could effectively prevent and control soil erosion. In terms of water yield, the superposition of land use type and another influencing factor was found to slightly enhance the explanatory power. The explanatory power of this superposition differed between areas due to area differences in natural geographical background which were above 70% in all ERL areas.
In the control and management of ERL areas, it is necessary to comprehensively consider the natural geographical backgrounds in different ERL areas. In this study, based on the spatial distribution characteristics of soil erosion and water yield, as well as the identified dominant factors, high soil erosion risk areas in different soil conservation ERL areas and high water yield areas in different water retention ERL areas were identified. The following areas were identified as key control and management areas: slopes greater than 35°, areas at elevations below than 450 m in the soil conservation ERLs of Beijing. The key areas for different water retention ERLs are slightly different: slopes of 0–10°, areas at elevations below 250 m in the MY ERL area and BE ERL area, slopes greater than 30°, elevations below than 450 m in the BDL ERL area, SZL ERL area, and JD ERL area.

Supplementary Materials

The following are available online at https://www.mdpi.com/2072-4292/12/3/399/s1, Figure S1. The spatial distribution of meteorological stations and precipitation in Beijing of 2015; Figure S2. Geomorphological types of Beijing; Figure S3. Spatial distribution of monthly precipitation in ERL areas; Table S1: Beijing’s ERL areas; Table S2: Statistics of soil erosion, water yield and environmental factors in Beijing and ERL areas; Table S3: Statistics of q value about factors affecting soil erosion in soil conservation ERL areas; Tables S4–S6. Statistics of q value about factors affecting water yield in water retention ERL areas of 2016, 2017 and 2018.

Author Contributions

Conceptualization, J.G., Y.J.; Methodology, J.G., Y.J.; Formal analysis, J.G., Y.J. Writing—original draft: J.G., Y.J., H.W., L.Z.; Writing—review and editing: J.G. All authors have read and agreed to the published version of the manuscript.

Funding

This research was funded Natural Science Foundation of China (No. 41671098), Strategic Priority Research Program of the Chinese Academy of Sciences (No. XDA20020202), Beijing Environmental Quality Monitoring Project (2018)—Ecological Assessment and Ecological Red Line Protection Remote Sensing Monitoring (No. Y88M1800AL).

Acknowledgments

The authors would like to thank the Beijing Municipal Ecological Environment Bureau for providing Beijing LUCC data and the National Meteorological Information Center for providing meteorological data. We also thank the journal editor and the anonymous reviewers for their useful comments and great efforts on this paper.

Conflicts of Interest

The authors declare no conflict of interest.

References

  1. Fu, B.; Wang, S.; Su, C.; Forsius, M. Linking ecosystem processes and ecosystem services. Curr. Opin. Environ. Sustain. 2013, 5, 4–10. [Google Scholar] [CrossRef]
  2. Costanza, R.; d’Arge, R.; de Groot, R.; Farber, S.; Grasso, M.; Hannon, B.; Limburg, K.; Naeem, S.; O’Neill, R.V.; Paruelo, J.; et al. The value of the world’s ecosystem services and natural capital. Nature 1997, 387, 253–260. [Google Scholar] [CrossRef]
  3. Zheng, Z.M.; Fu, B.J.; Hu, H.T.; Sun, G. A method to identify the variable ecosystem services relationship across time: A case study on Yanhe Basin. China. Landsc. Ecol. 2014, 29, 1689–1696. [Google Scholar] [CrossRef] [Green Version]
  4. Bagstad, K.J.; Semmens, D.J.; Waage, S.; Winthrop, R. A comparative assessment of decision-support tools for ecosystem services quantification and valuation. Ecosyst. Serv. 2013, 5, E27–E39. [Google Scholar] [CrossRef]
  5. Kosoy, N.; Corbera, E. Payments for ecosystem services as commodity fetishism. Ecol. Econ. 2010, 69, 1228–1236. [Google Scholar] [CrossRef]
  6. Peng, J.; Pan, Y.J.; Liu, Y.X.; Zhao, H.J.; Wang, Y.L. Linking ecological degradation risk to identify ecological security patterns in a rapidly urbanizing landscape. Habitat Int. 2018, 71, 110–124. [Google Scholar] [CrossRef]
  7. Zhu, J.; Zhou, Y.; Wang, S.; Wang, L.; Wang, F.; Liu, W.; Guo, B. Multicriteria decision analysis for monitoring ecosystem service function of the Three-River Headwaters region of the Qinghai-Tibet Plateau, China. Environ. Monit. Assess. 2015, 187, 355. [Google Scholar] [CrossRef]
  8. Fu, B.J.; Wang, S.; Liu, Y.; Liu, J.B.; Liang, W.; Miao, C.Y. Hydrogeomorphic Ecosystem Responses to Natural and Anthropogenic Changes in the Loess Plateau of China. Ann. Rev. Earth Planet. Sci. 2017, 45, 223–243. [Google Scholar] [CrossRef]
  9. Zhang, M.; Wang, K.; Liu, H.; Zhang, C.; Wang, J.; Yue, Y.; Qi, X. How ecological restoration alters ecosystem services: An analysis of vegetation carbon sequestration in the karst area of northwest Guangxi, China. Environ. Earth Sci. 2015, 74, 5307–5317. [Google Scholar] [CrossRef]
  10. Li, M.; Yang, W.; Sun, T. Effects of Freshwater Releases on the Delivery of Ecosystem Services in Coastal Wetlands of the Yellow River Delta Using an Improved Input-State-Output Approach. Wetlands 2015, 36, 103–112. [Google Scholar] [CrossRef]
  11. Gutsch, M.; Lasch-Born, P.; Kollas, C.; Suckow, F.; Reyer, C.P.O. Balancing trade-offs between ecosystem services in Germany’s forests under climate change. Environ. Res. Lett. 2018, 13, 12. [Google Scholar] [CrossRef]
  12. Egoh, B.N.; Reyers, B.; Rouget, M.; Richardson, D.M. Identifying priority areas for ecosystem service management in South African grasslands. J. Environ. Manag. 2011, 92, 1642–1650. [Google Scholar] [CrossRef] [Green Version]
  13. Yu, D.; Han, S. Ecosystem service status and changes of degraded natural reserves—A study from the Changbai Mountain Natural Reserve, China. Ecosyst. Serv. 2016, 20, 56–65. [Google Scholar] [CrossRef]
  14. Li, T.; Gao, X. Ecosystem Services Valuation of Lakeside Wetland Park beside Chaohu Lake in China. Water 2016, 8, 301. [Google Scholar] [CrossRef]
  15. Abeysingha, N.S.; Singh, M.; Sehgal, V.K.; Khanna, M.; Pathak, H.; Jayakody, P.; Srinivasan, R. Assessment of water yield and evapotranspiration over 1985 to 2010 in the Gomti River basin in India using the SWAT model. Curr. Sci. 2015, 108, 2202–2212. [Google Scholar]
  16. Yao, Y.; Cai, T.; Ju, C.; He, C. Effect of reforestation on annual water yield in a large watershed in northeast China. J. For. Res. 2015, 26, 697–702. [Google Scholar] [CrossRef]
  17. Schmidt, S.; Alewell, C.; Meusburger, K. Mapping spatio-temporal dynamics of the cover and management factor (C-factor) for grasslands in Switzerland. Remote Sens. Environ. 2018, 211, 89–104. [Google Scholar] [CrossRef]
  18. Perovic, V.; Jaksic, D.; Jaramaz, D.; Kokovic, N.; Cakmak, D.; Mitrovic, M.; Pavlovic, P. Spatio-temporal analysis of land use/land cover change and its effects on soil erosion (Case study in the Oplenac wine-producing area, Serbia). Environ. Monit. Assess. 2018, 190, 675. [Google Scholar] [CrossRef]
  19. Gao, J.; Wang, H. Temporal analysis on quantitative attribution of karst soil erosion: A case study of a peak-cluster depression basin in Southwest China. Catena 2019, 172, 369–377. [Google Scholar] [CrossRef]
  20. Zhang, L.; Cheng, L.; Chiew, F.; Fu, B. Understanding the impacts of climate and landuse change on water yield. Curr. Opin. Environ. Sustain. 2018, 33, 167–174. [Google Scholar] [CrossRef]
  21. Ouyang, Z.; Zheng, H.; Xiao, Y.; Polasky, S.; Liu, J.; Xu, W.; Wang, Q.; Zhang, L.; Xiao, Y.; Rao, E.M.; et al. Improvements in ecosystem services from investments in natural capital. Science 2016, 352, 1455–1459. [Google Scholar] [CrossRef]
  22. Gao, J. How China will protect one-quarter of its land. Nature 2019, 569, 457. [Google Scholar] [CrossRef] [Green Version]
  23. Zhai, J.; Hou, P.; Cao, W.; Yang, M.; Cai, M.Y.; Li, J. Ecosystem assessment and protection effectiveness of a tropical rainforest region in Hainan Island, China. J. Geogr. Sci. 2018, 28, 415–428. [Google Scholar] [CrossRef] [Green Version]
  24. Wang, C.S.; Sun, G.Y.; Dang, L.J. Identifying Ecological Red Lines: A Case Study of the Coast in Liaoning Province. Sustainability 2015, 7, 9461–9477. [Google Scholar] [CrossRef] [Green Version]
  25. Wang, C.Y.; Delu, P. Zoning of Hangzhou Bay ecological red line using GIS-based multi-criteria decision analysis. Ocean. Coast. Manag. 2017, 139, 42–50. [Google Scholar] [CrossRef]
  26. Xu, X.; Tan, Y.; Yang, G.; Barnett, J. China’s ambitious ecological red lines. Land Use Policy 2018, 79, 447–451. [Google Scholar] [CrossRef]
  27. Zhang, X.; Wang, Z.; Lin, J. GIS Based Measurement and Regulatory Zoning of Urban Ecological Vulnerability. Sustainability 2015, 7, 9924. [Google Scholar] [CrossRef] [Green Version]
  28. Xu, X.; Yang, G.; Tan, Y. Identifying ecological red lines in China’s Yangtze River Economic Belt: A regional approach. Ecol. Indic. 2019, 96, 635–646. [Google Scholar] [CrossRef]
  29. Renard, K.G.; Foster, G.R.; Weesies, G.A.; Mccool, D.K.; Yoder, D.C. Predicting Soil Erosion by Water: A Guide to Conservation Planning with the Revised Universal Soil Loss Equation (RUSLE); Agricultural Handbook: No. 703; United States. Dept. of Agriculture: Washington, DC, USA, 1997.
  30. Williams, J.R.; Jones, C.A.; Kiniry, J.R.; Spanel, D.A. The EPIC crop growth-model. Trans. ASAE 1989, 32, 497–511. [Google Scholar] [CrossRef]
  31. Arnoldus, H.M.J.; Boodt, M.D.; Gabriels, D. An approximation of the rainfall factor in the Universal Soil Loss Equation. In Assessment of Erosion; John Wiley and Sons Ltd.: Chichester, UK, 1980; pp. 127–132. [Google Scholar]
  32. Zhang, H.; Yang, Q.; Li, R.; Liu, Q.; Moore, D.; He, P.; Ritsema, C.J.; Geissen, V. Extension of a GIS procedure for calculating the RUSLE equation LS factor. Comput. Geosci. 2013, 52, 177–188. [Google Scholar] [CrossRef]
  33. McCool, D.K.; Brown, L.C.; Foster, G.R.; Mutchler, C.K.; Meyer, L.D. Revised slope steepness factor for the universal soil loss equation. Trans. ASAE 1987, 30, 1387–1396. [Google Scholar] [CrossRef]
  34. McCool, D.K.; Foster, G.R.; Mutchler, C.K.; Meyer, L.D. Revised slope length factor for the universal soil loss equation. Trans. ASAE 1989, 32, 1571–1576. [Google Scholar] [CrossRef]
  35. Sun, W.; Shao, Q.; Liu, J.; Zhai, J. Assessing the effects of land use and topography on soil erosion on the Loess Plateau in China. Catena 2014, 121, 151–163. [Google Scholar] [CrossRef]
  36. Cai, C.; DING, S.; SHI, Z.; Huang, L.; Zhang, G. Study of Applying USLE and Geographical Information System IDRISI to Predict Soil Erosion in Small Watershed. J. Soil Water Conserv. 2000, 14, 19–24. (In Chinese) [Google Scholar] [CrossRef]
  37. Feng, J.; Shi, M.; Jiang, Q.O. Influence of land use /cover change on soil erosion in Chaobai River Basin. Sci. Soil Water Conserv. 2019, 17, 121–132. (In Chinese) [Google Scholar] [CrossRef]
  38. Xu, Y.; Tang, H.; Wang, B.; Chen, J. Effects of landscape patterns on soil erosion processes in a mountain-basin system in the North China. Nat. Hazards 2017, 87, 1567–1585. [Google Scholar] [CrossRef]
  39. Xu, Y.; Yao, Z.; Zhao, D. Estimating Soil Erosion in North China Plain Based on RS/GIS and RUSLE. Bull. Soil Water Conserv. 2012, 32, 214–217. (In Chinese) [Google Scholar] [CrossRef]
  40. Nelson, E.; Mendoza, G.; Regetz, J.; Polasky, S.; Tallis, H.; Cameron, D.R.; Chan, K.M.A.; Daily, G.C.; Goldstein, J.; Kareiva, P.M.; et al. Modeling multiple ecosystem services, biodiversity conservation, commodity production, and tradeoffs at landscape scales. Front. Ecol. Environ. 2009, 7, 4–11. [Google Scholar] [CrossRef]
  41. Zhang, L.; Dawes, W.R.; Walker, G.R. Response of mean annual evapotranspiration to vegetation changes at catchment scale. Water Resour. Res. 2001, 37, 701–708. [Google Scholar] [CrossRef]
  42. Xu, Q.; Dong, Y.; Wang, Y.; Yang, R.; Xu, C. Determinants and identification of the northern boundary of China’s tropical zone. J. Geogr. Sci. 2018, 28, 31–45. [Google Scholar] [CrossRef] [Green Version]
  43. Xu, X.; Zhao, Y.; Zhang, X.; Xia, S. Identifying the Impacts of Social, Economic, and Environmental Factors on Population Aging in the Yangtze River Delta Using the Geographical Detector Technique. Sustainability 2018, 10, 1528. [Google Scholar] [CrossRef] [Green Version]
  44. Chen, G.; Luo, J.; Zhang, C.; Jiang, L.; Tian, L.; Chen, G. Characteristics and Influencing Factors of Spatial Differentiation of Urban Black and Odorous Waters in China. Sustainability 2018, 10, 4747. [Google Scholar] [CrossRef] [Green Version]
  45. Fei, X.; Lou, Z.; Christakos, G.; Ren, Z.; Liu, Q.; Lv, X. The association between heavy metal soil pollution and stomach cancer: A case study in Hangzhou City, China. Environ. Geochem. Health 2018, 40, 2481–2490. [Google Scholar] [CrossRef] [PubMed]
  46. Wang, J.; Xu, C. Geodetector: Principle and prospective. Acta Geographica Sinica 2017, 72, 116–134. (In Chinese) [Google Scholar] [CrossRef]
  47. Hu, Y.; Wang, J.; Li, X.; Ren, D.; Zhu, J. Geographical Detector-Based Risk Assessment of the Under-Five Mortality in the 2008 Wenchuan Earthquake, China. PLoS ONE 2011, 6. [Google Scholar] [CrossRef] [Green Version]
  48. Zhou, B.; Yu, X.; Chen, L.; Zhang, Z.; Lu, X.; Fan, M. Soil Erosion Simulation in Mountain Areas of Beijing Based on InVEST Model. Res. Soil Water Conserv. 2010, 17, 9–13. (In Chinese) [Google Scholar]
  49. Lu, B.; Liu, H.; Zhang, B.; Yuan, A.; Duan, S. Calculation on soil erosion in Beijing City based on GIS. Sci. Soil Water Conserv. 2011, 9, 24–27. (In Chinese) [Google Scholar] [CrossRef]
  50. Zhou, Z.C.; Shangguan, Z.P. Effect of ryegrasses on soil runoff and sediment control. Pedosphere 2008, 18, 131–136. [Google Scholar] [CrossRef]
  51. Lang, Y.Q.; Song, W.; Zhang, Y. Responses of the water-yield ecosystem service to climate and land use change in Sancha River Basin, China. Phys. Chem. Earth 2017, 101, 102–111. [Google Scholar] [CrossRef]
  52. Zhang, H.; Zhao, W. Monitoring and Evaluation of Soil Erosion in Western Mountain of Beijing Based on RS and GIS. J. Cap. Norm. Univ. (Nat. Sci. Ed.) 2009, 30, 83–87. (In Chinese) [Google Scholar] [CrossRef]
  53. Wu, R.; Liu, G.; Wen, Y. Spatiotemporal Variations of Water Yield and Water Quality Purification Service Functions in Guanting Reservoir Basin based on InVEST Model. Res. Environ. Sci. 2017, 30, 406–414. [Google Scholar]
Figure 1. The spatial distribution of Beijing and ERL areas.
Remotesensing 12 00399 g001
Figure 2. Distribution of soil erosion (a), water yield (b) in Beijing and Beijing ERL areas(c).
Remotesensing 12 00399 g002
Figure 3. Statistics of q value affecting soil erosion (a) and water yield (b) in Beijing and ERL areas.
Remotesensing 12 00399 g003
Figure 4. The percentage of stratification combinations with significant difference in each influencing factor affecting soil erosion (a) and water yield (b).
Remotesensing 12 00399 g004
Table 1. Data requirements and description.
DataSourcesResolution
DEMGoogle Earth9 m
WatershedBeijing Municipal Ecological Environment Bureau
Geomorphological TypeResource and Environment Data Cloud Platform (http://www.resdc.cn)1:1,000,000
Landsat 8 OLI images (2015, 2018)USGS (https://glovis.usgs.gov/)30 m
GF-1 images (2015, 2018)China Centre for Resources Satellite Data and Application (http://www.cresda.com/CN/)8 m
Meteorological (2015, 2018)National Meteorological Information Center of China (http://data.cma.cn/)Monthly
Mechanical CompositionCold and Arid Regions Sciences Data Center at Lanzhou (http://westdc.westgis.ac.cn/)1 km
Soil DepthSoil Data Center, National Science & Technology Infrastructure of China (http://soil.geodata.cn)1 km
Table 2. p value of different land use types in Beijing.
Land Use TypePaddy FieldDry LandGarden PlotGrasslandForestWaste GrasslandWaterConstruction LandBare Land
p Value0.350.60.8111001
Table 3. Types of interaction between two covariates.
DescriptionInteraction
q ( X 1 X 2 ) < M i n ( q ( X 1 ) , q ( X 2 ) ) Weaken, nonlinear
M i n ( q ( X 1 ) , q ( X 2 ) ) < q ( X 1 X 2 ) < M a x ( q ( X 1 ) , q ( X 2 ) ) Weaken, single factor nonlinear
q ( X 1 X 2 ) > M a x ( q ( X 1 ) , q ( X 2 ) ) Enhance, double factors
q ( X 1 X 2 ) = q ( X 1 ) + q ( X 2 ) Independent
q ( X 1 X 2 ) > q ( X 1 ) + q ( X 2 ) Enhance, nonlinear
Table 4. The dominant interactions of factors affecting soil erosion in soil conservation ERL areas.
BeijingXi ERL AreaSW ERL Area
Dominant interaction1vegetation coverage ∩ slopevegetation coverage ∩ slopevegetation coverage ∩ slope
q value0.5790.6820.586
Dominant interaction2vegetation coverage ∩ geomorphological typevegetation coverage ∩ precipitationvegetation coverage ∩ precipitation
q value0.3250.4630.440
Dominant interaction3slope ∩ geomorphological typeslope ∩ precipitationvegetation coverage ∩ land use type
q value0.3030.4460.437
Table 5. The dominant interactions of factors affecting water yield in water retention ERL areas.
BeijingBDL ERL Area MY ERL Area SZL ERL Area JD ERL Area BE ERL Area
Dominant interaction1LU ∩ precipitationLU ∩ VCLU ∩ elevationLU ∩ slopeLU ∩ precipitationLU ∩ GT
q value 0.7920.8480.8040.8560.8110.779
Dominant interaction2LU ∩ elevationLU ∩ slopeLU ∩ GTLU ∩ elevationLU ∩ elevationLU ∩ slope
q value0.6540.8340.7910.8550.7390.778
Dominant interaction3LU ∩ GTLU ∩ GTLU ∩ slopeLU ∩ VCLU ∩ slopeLU ∩ elevation
q value0.6340.7880.7700.8510.7350.768
LU: land use type. VC: vegetation coverage. GT: geomorphological type.
Table 6. High soil erosion risk in soil conservation ERL areas.
BeijingXi ERL AreaSW ERL Area
Elevation (m)1783–2007229–4517–229
Geomorphological typeHigh relief mountainPlainPlatform
Precipitation (mm)507–530530–553576–599
Land use typeUnused landUnused landUnused land
Slope (°)>35>35>35
Vegetation coverage0.3–0.40.5–0.60.4–0.5
Table 7. High water yield areas in water retention ERL areas.
BeijingBDL ERL Area MY ERL Area SZL ERL Area JD ERL Area BE ERL Area
Elevation (m)7–229229–4517–229673–895229–4517–229
Geomorphological typePlainPlainHillHillHigh relief mountain Plain
Precipitation (mm)668–691645–668576–599622–645645–668553–576
Land use typeUnused landLow coverage grasslandConstruction landConstruction landConstruction land Construction land
Slope (°)0–5>350–530–35>355–10
Vegetation coverage0.1–0.20.1–0.20.3–0.40.4–0.50.4–0.50.4–0.5

