Surface Subsidence in Urbanized Coastal Areas: PSI Methods Based on Sentinel-1 for Ho Chi Minh City


Abstract
1. Introduction
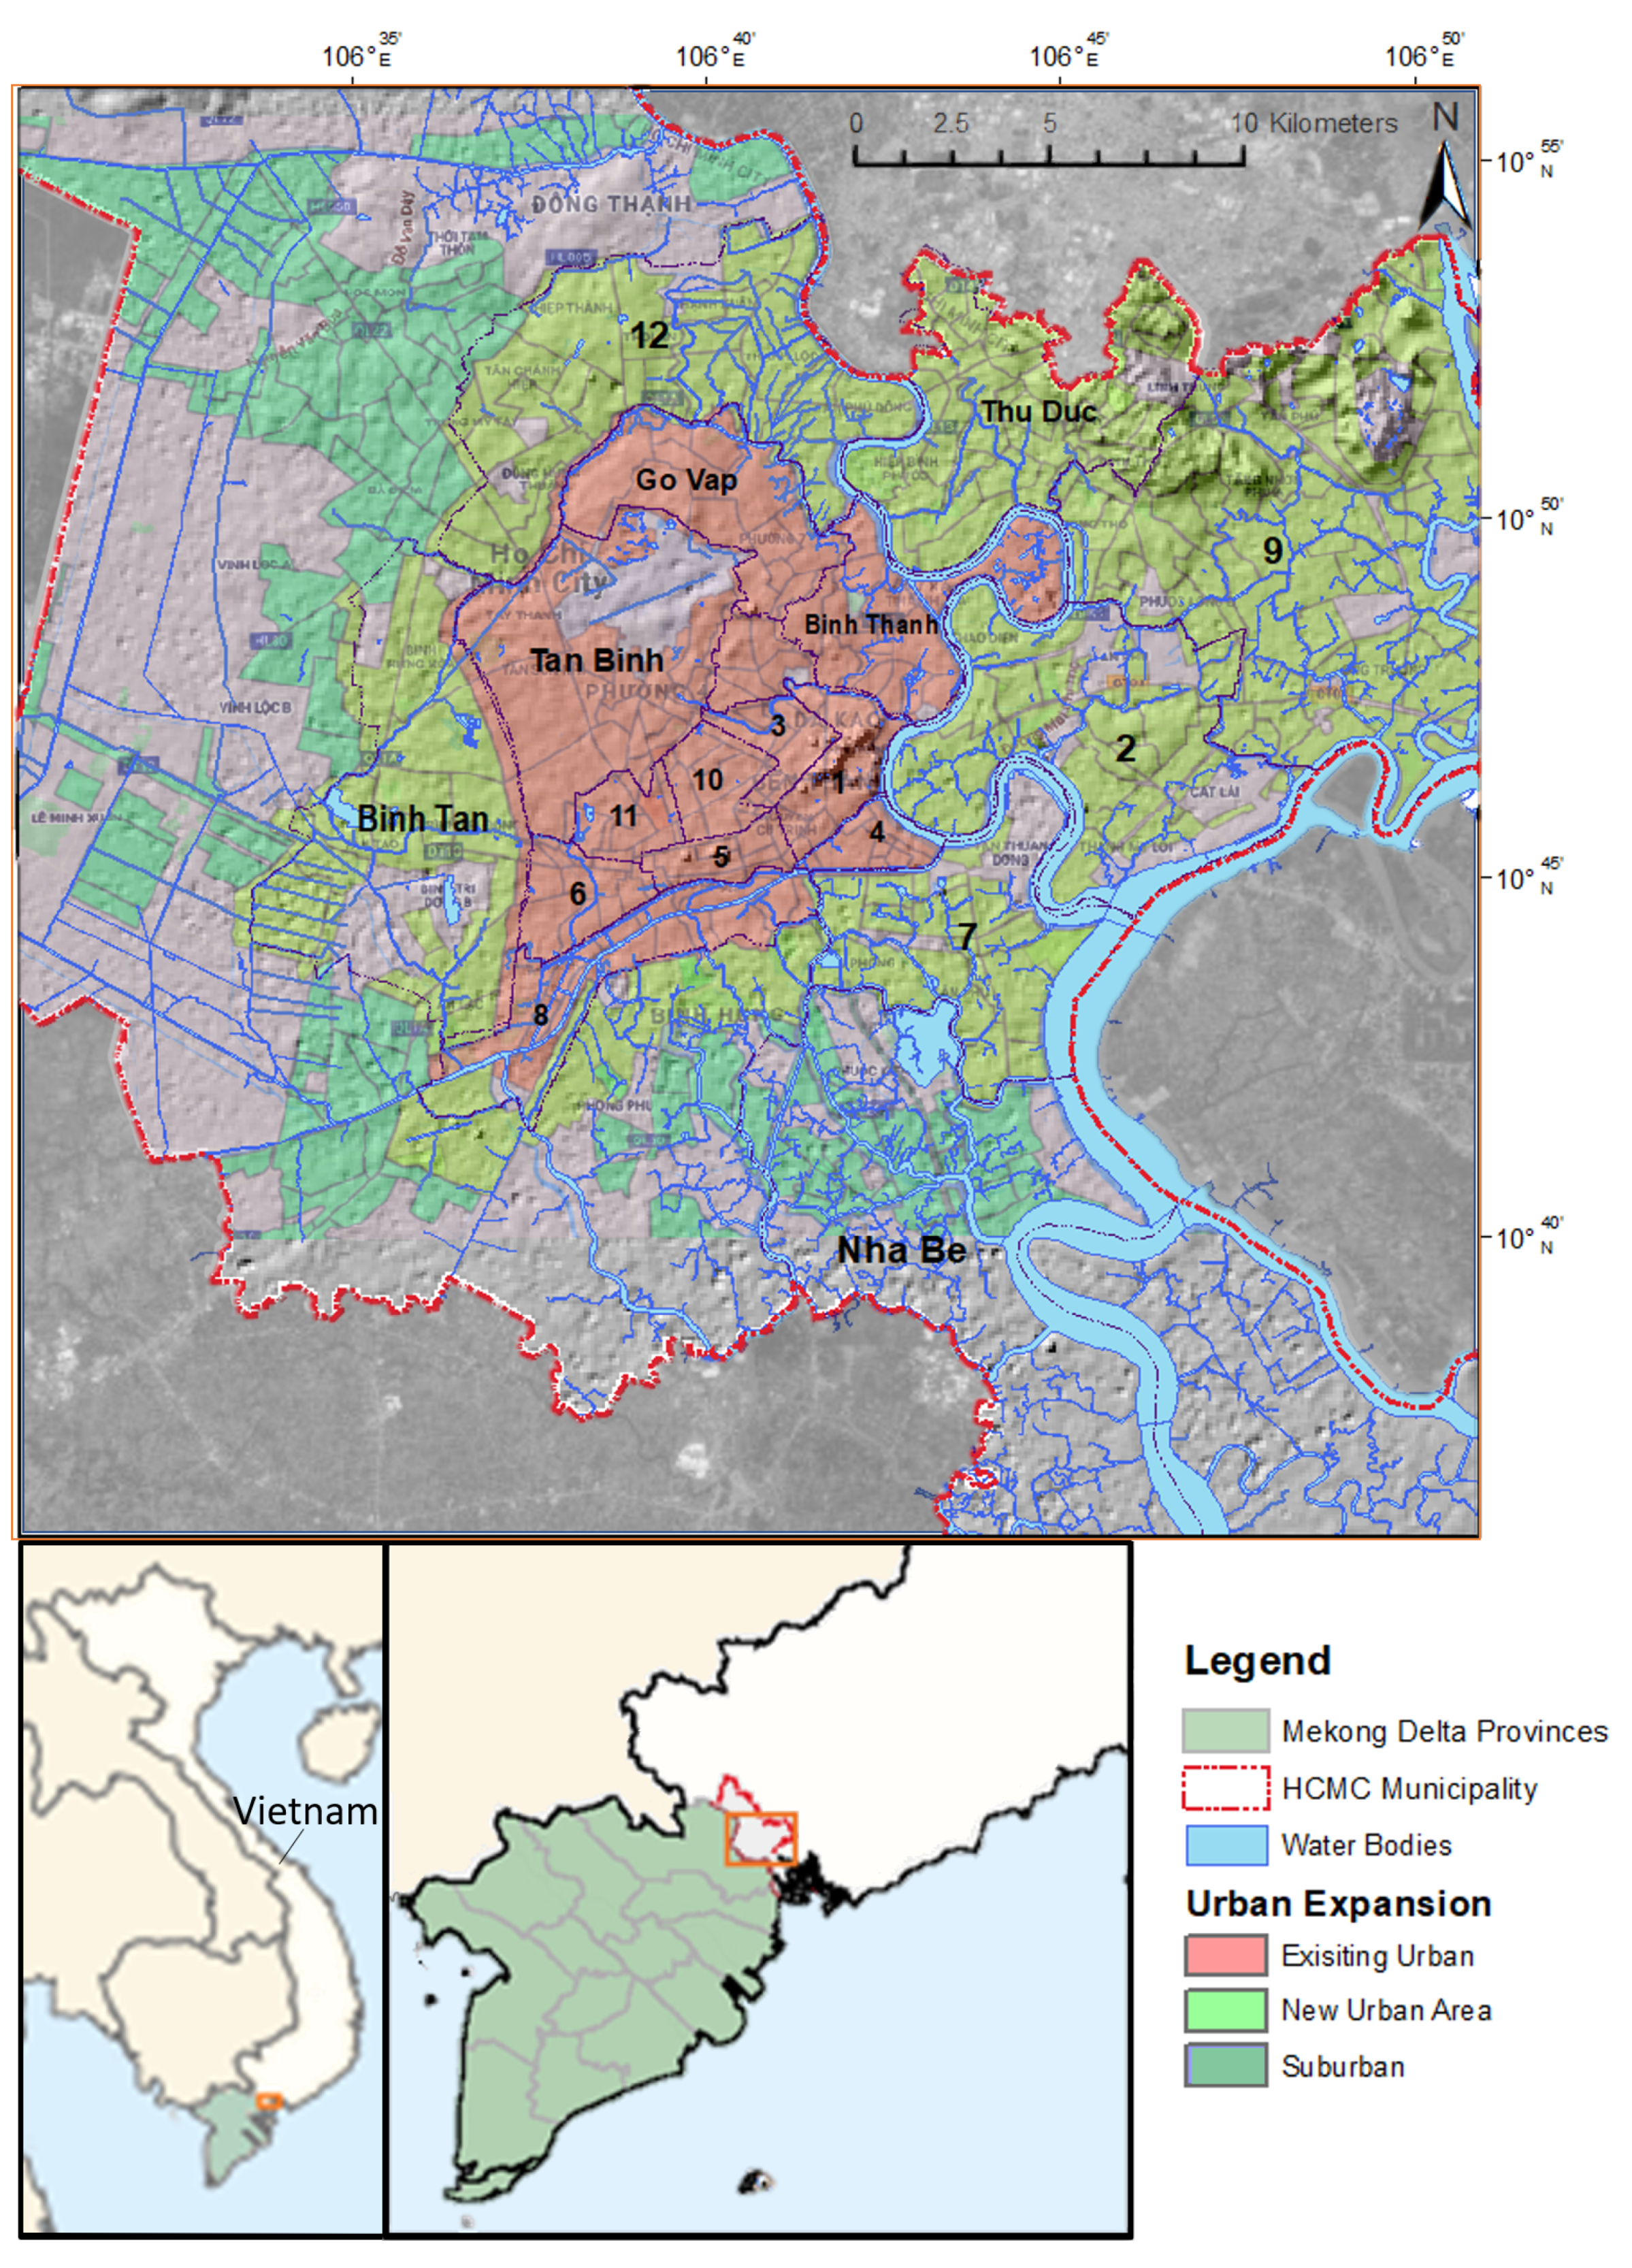
1.1. Study Area
1.2. Previous Studies and Research Objectives
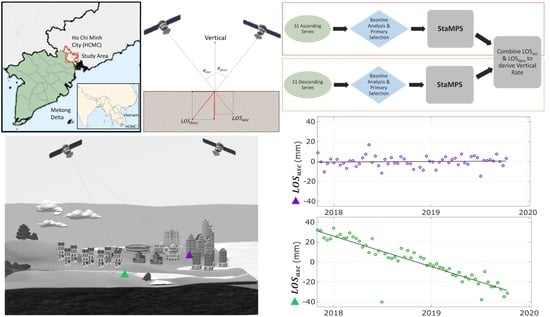
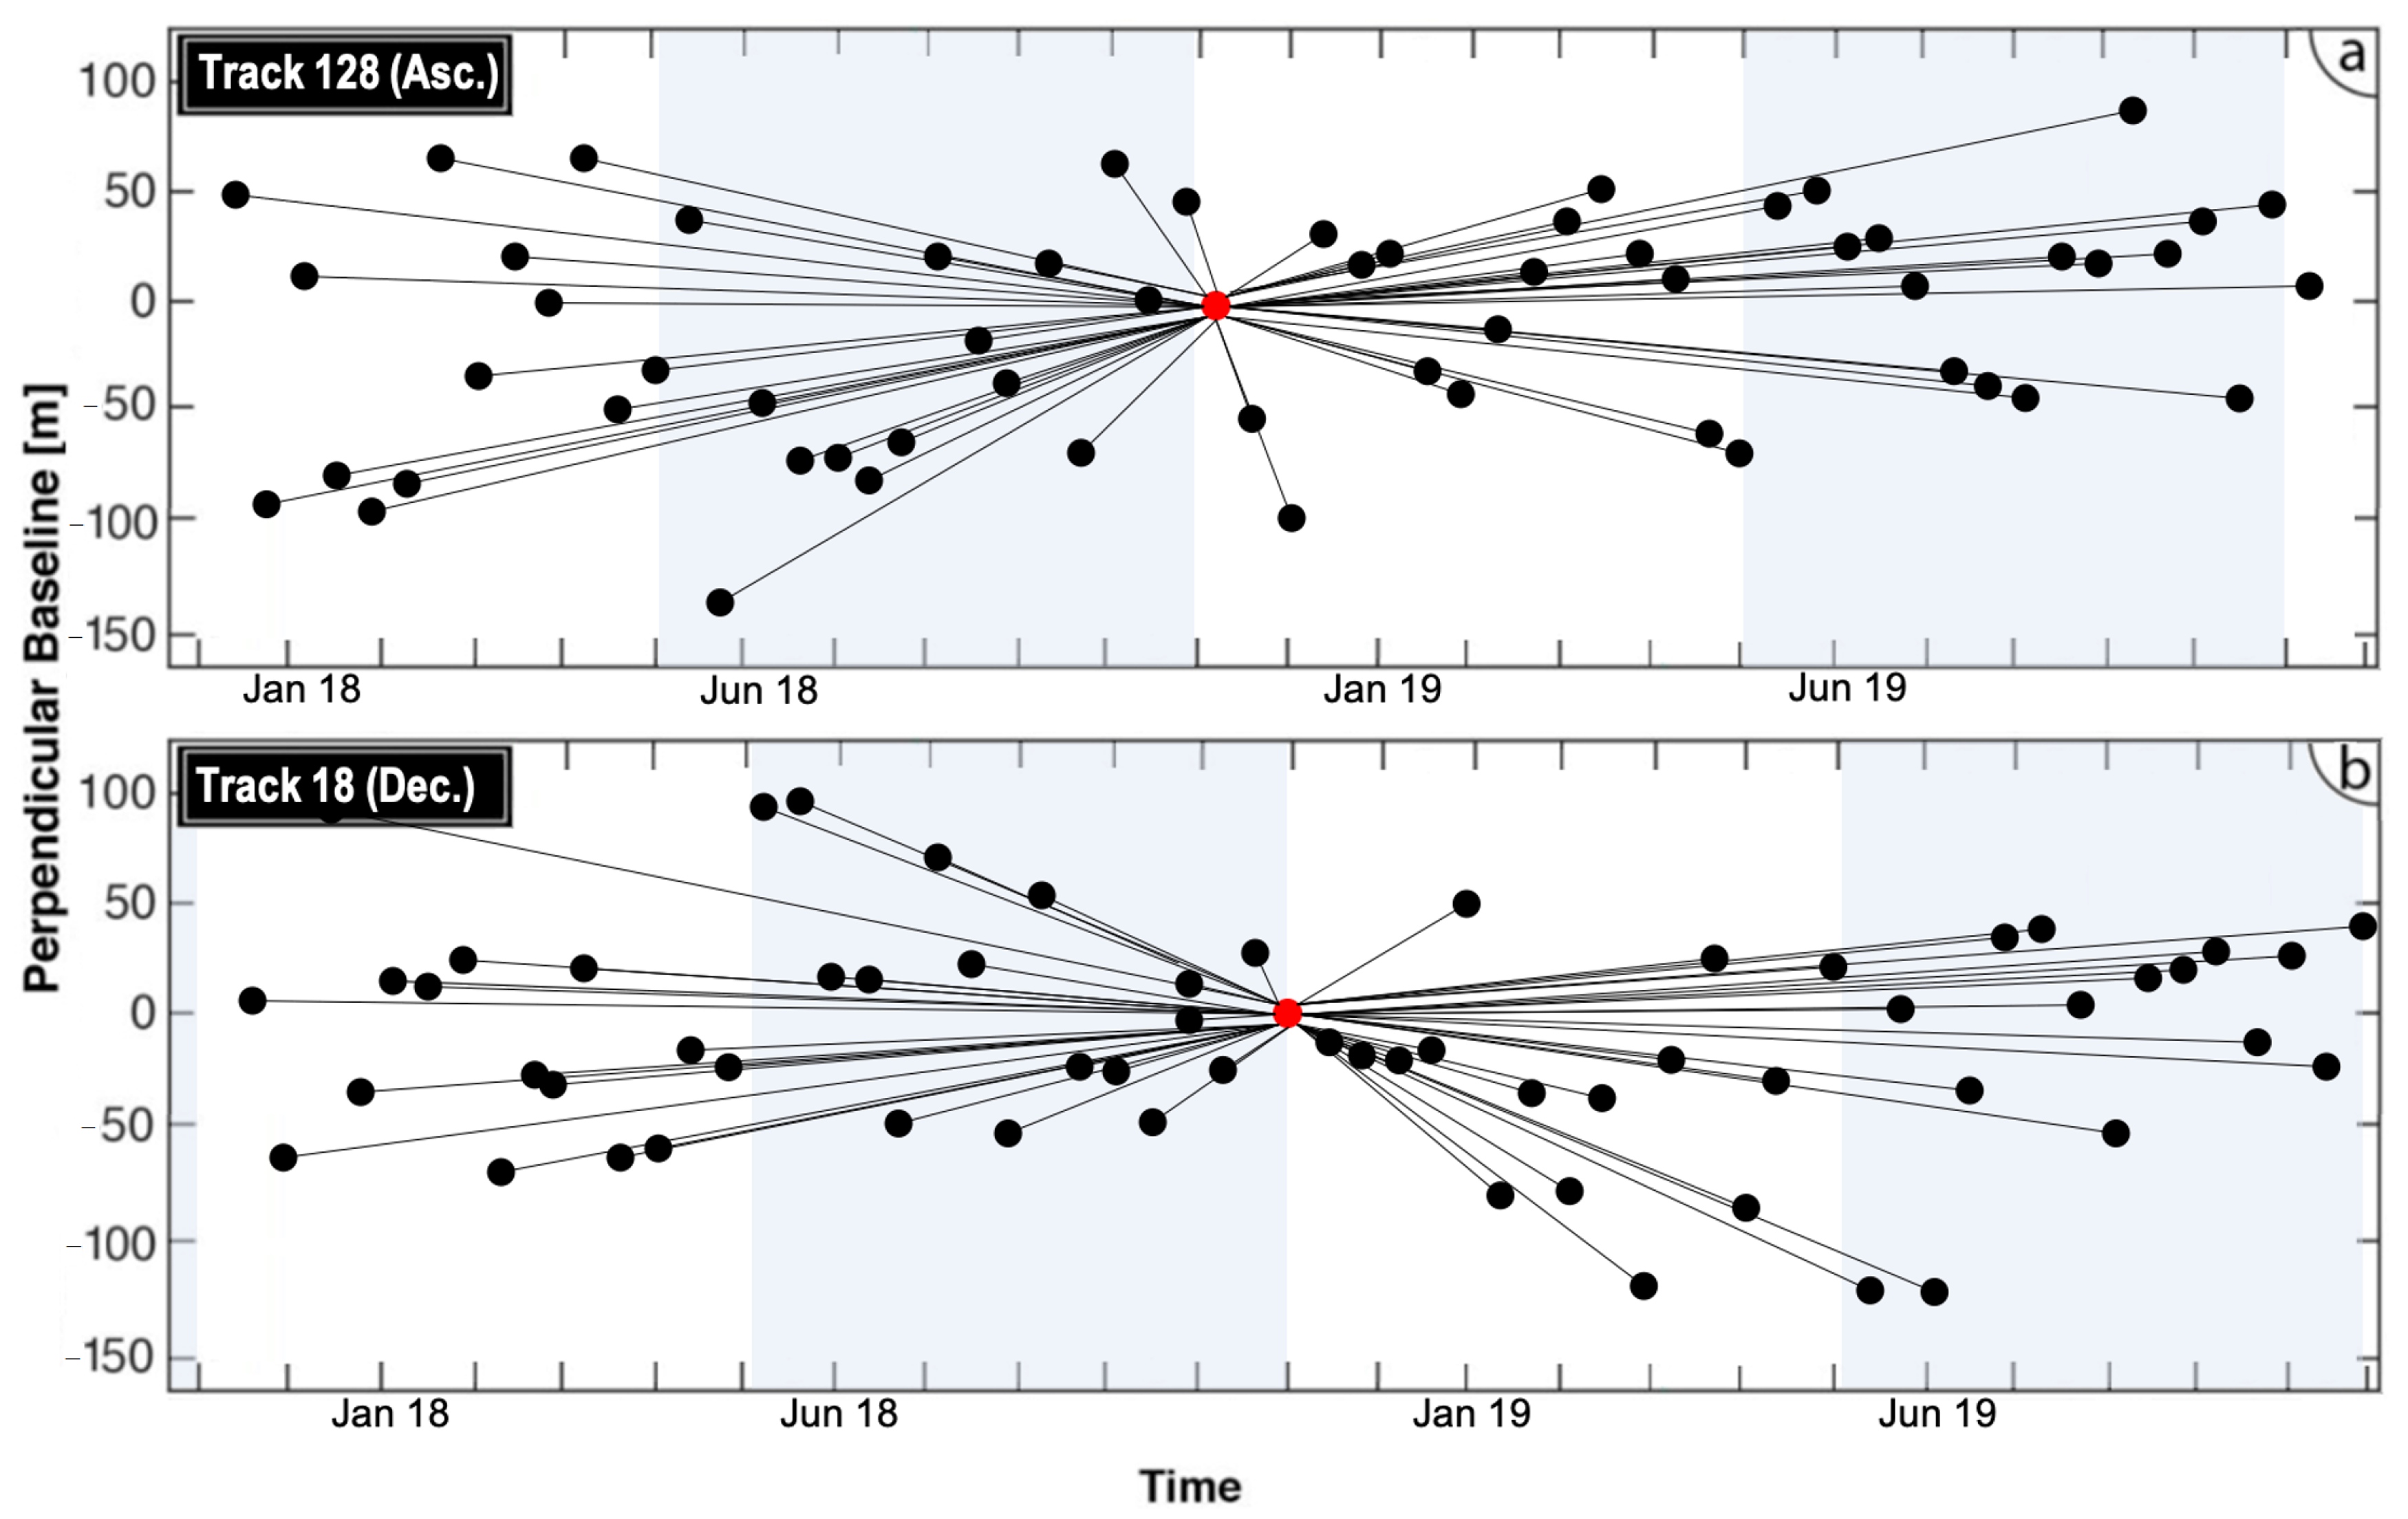
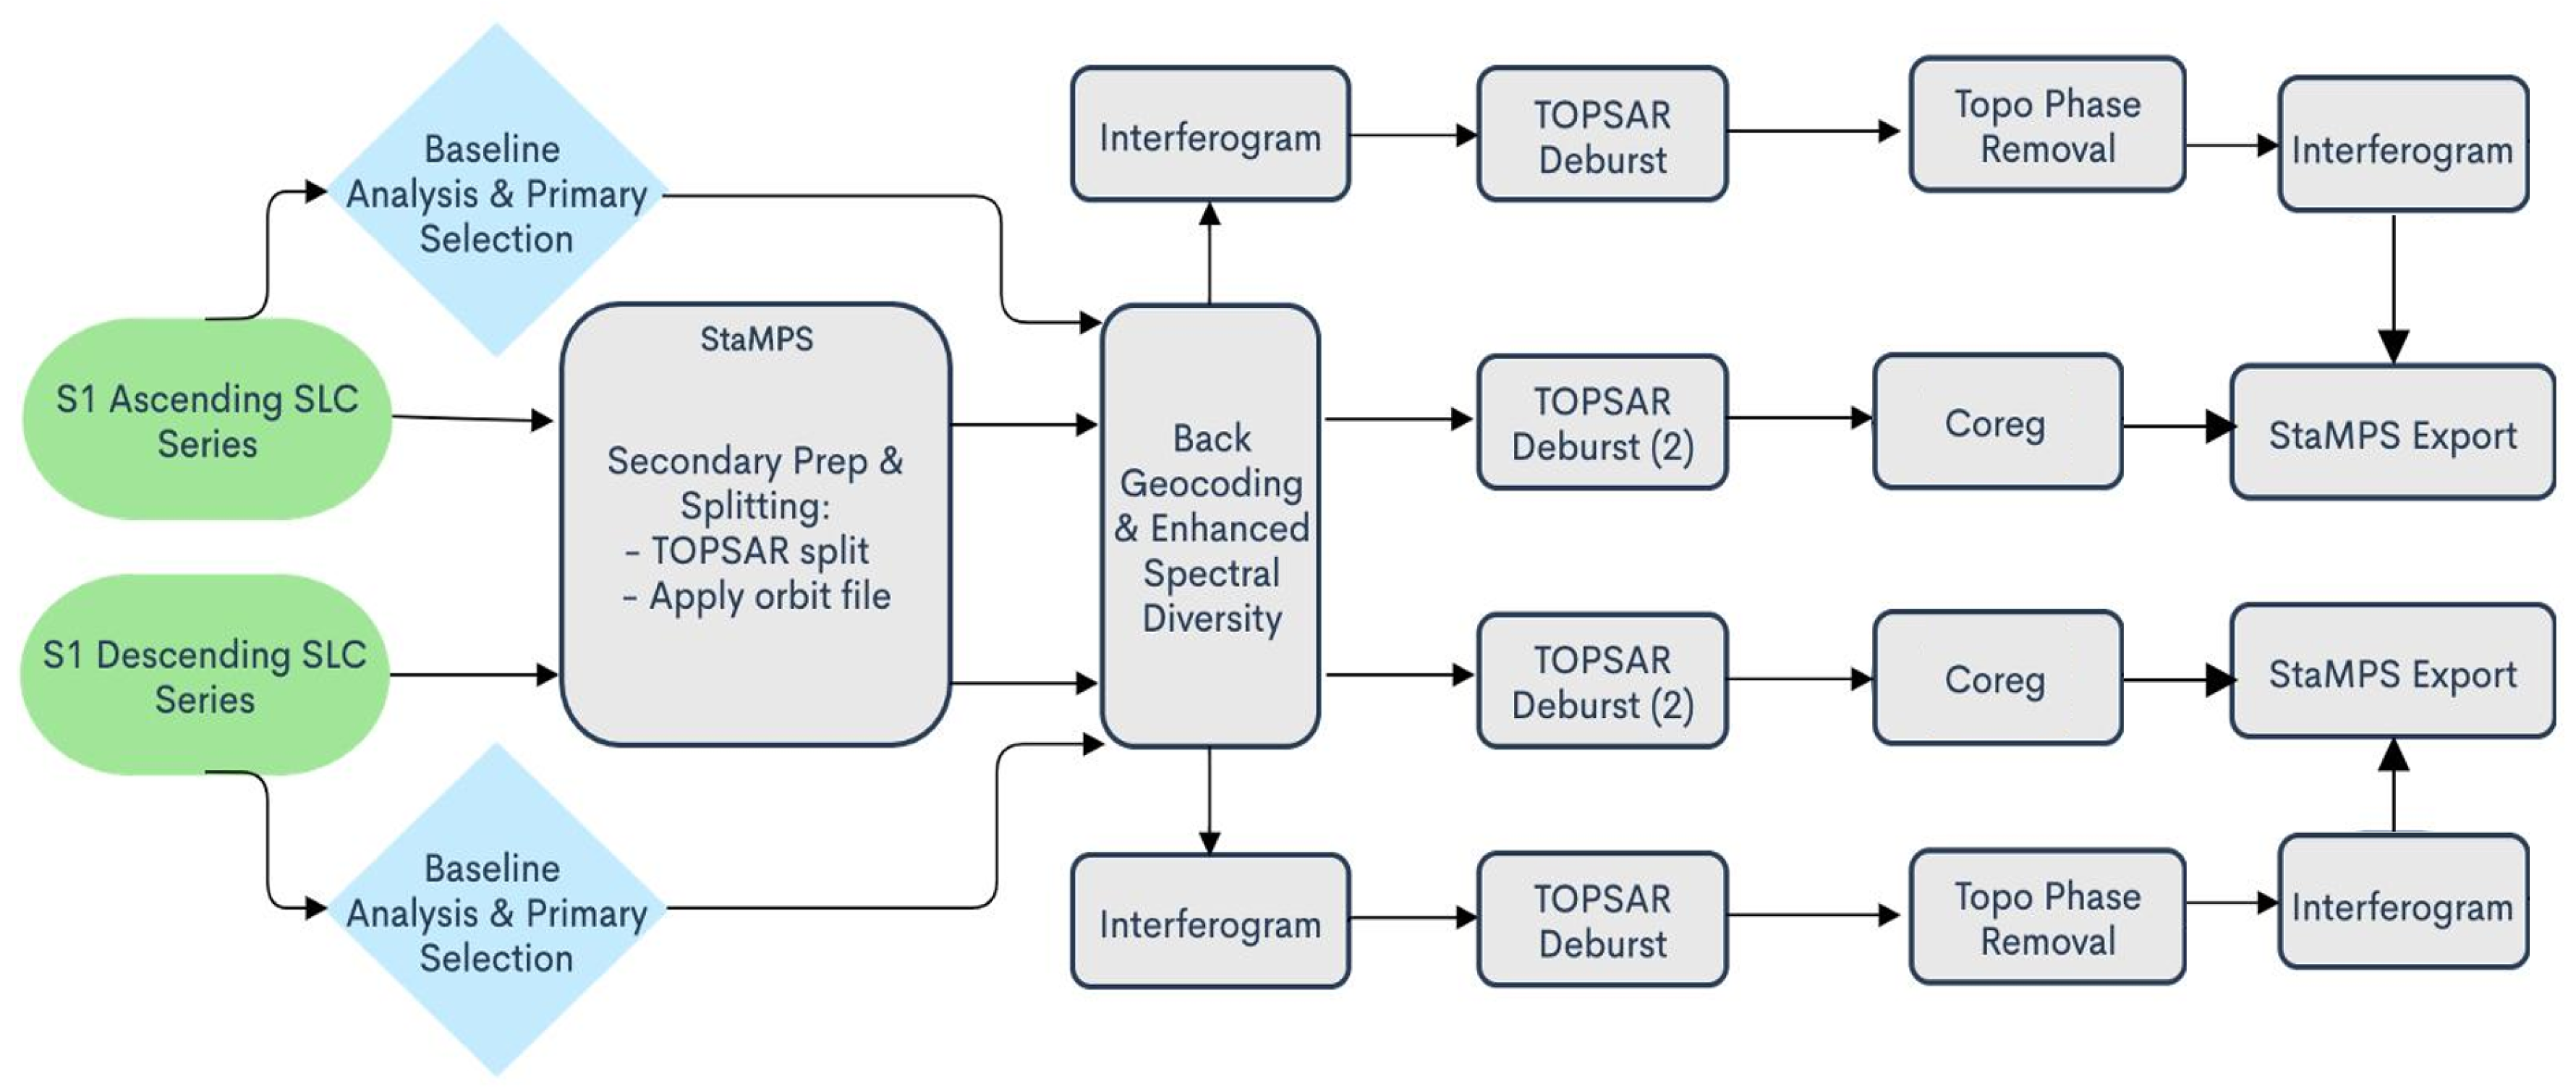
2. Materials and Methods
Post-Processing
3. Results
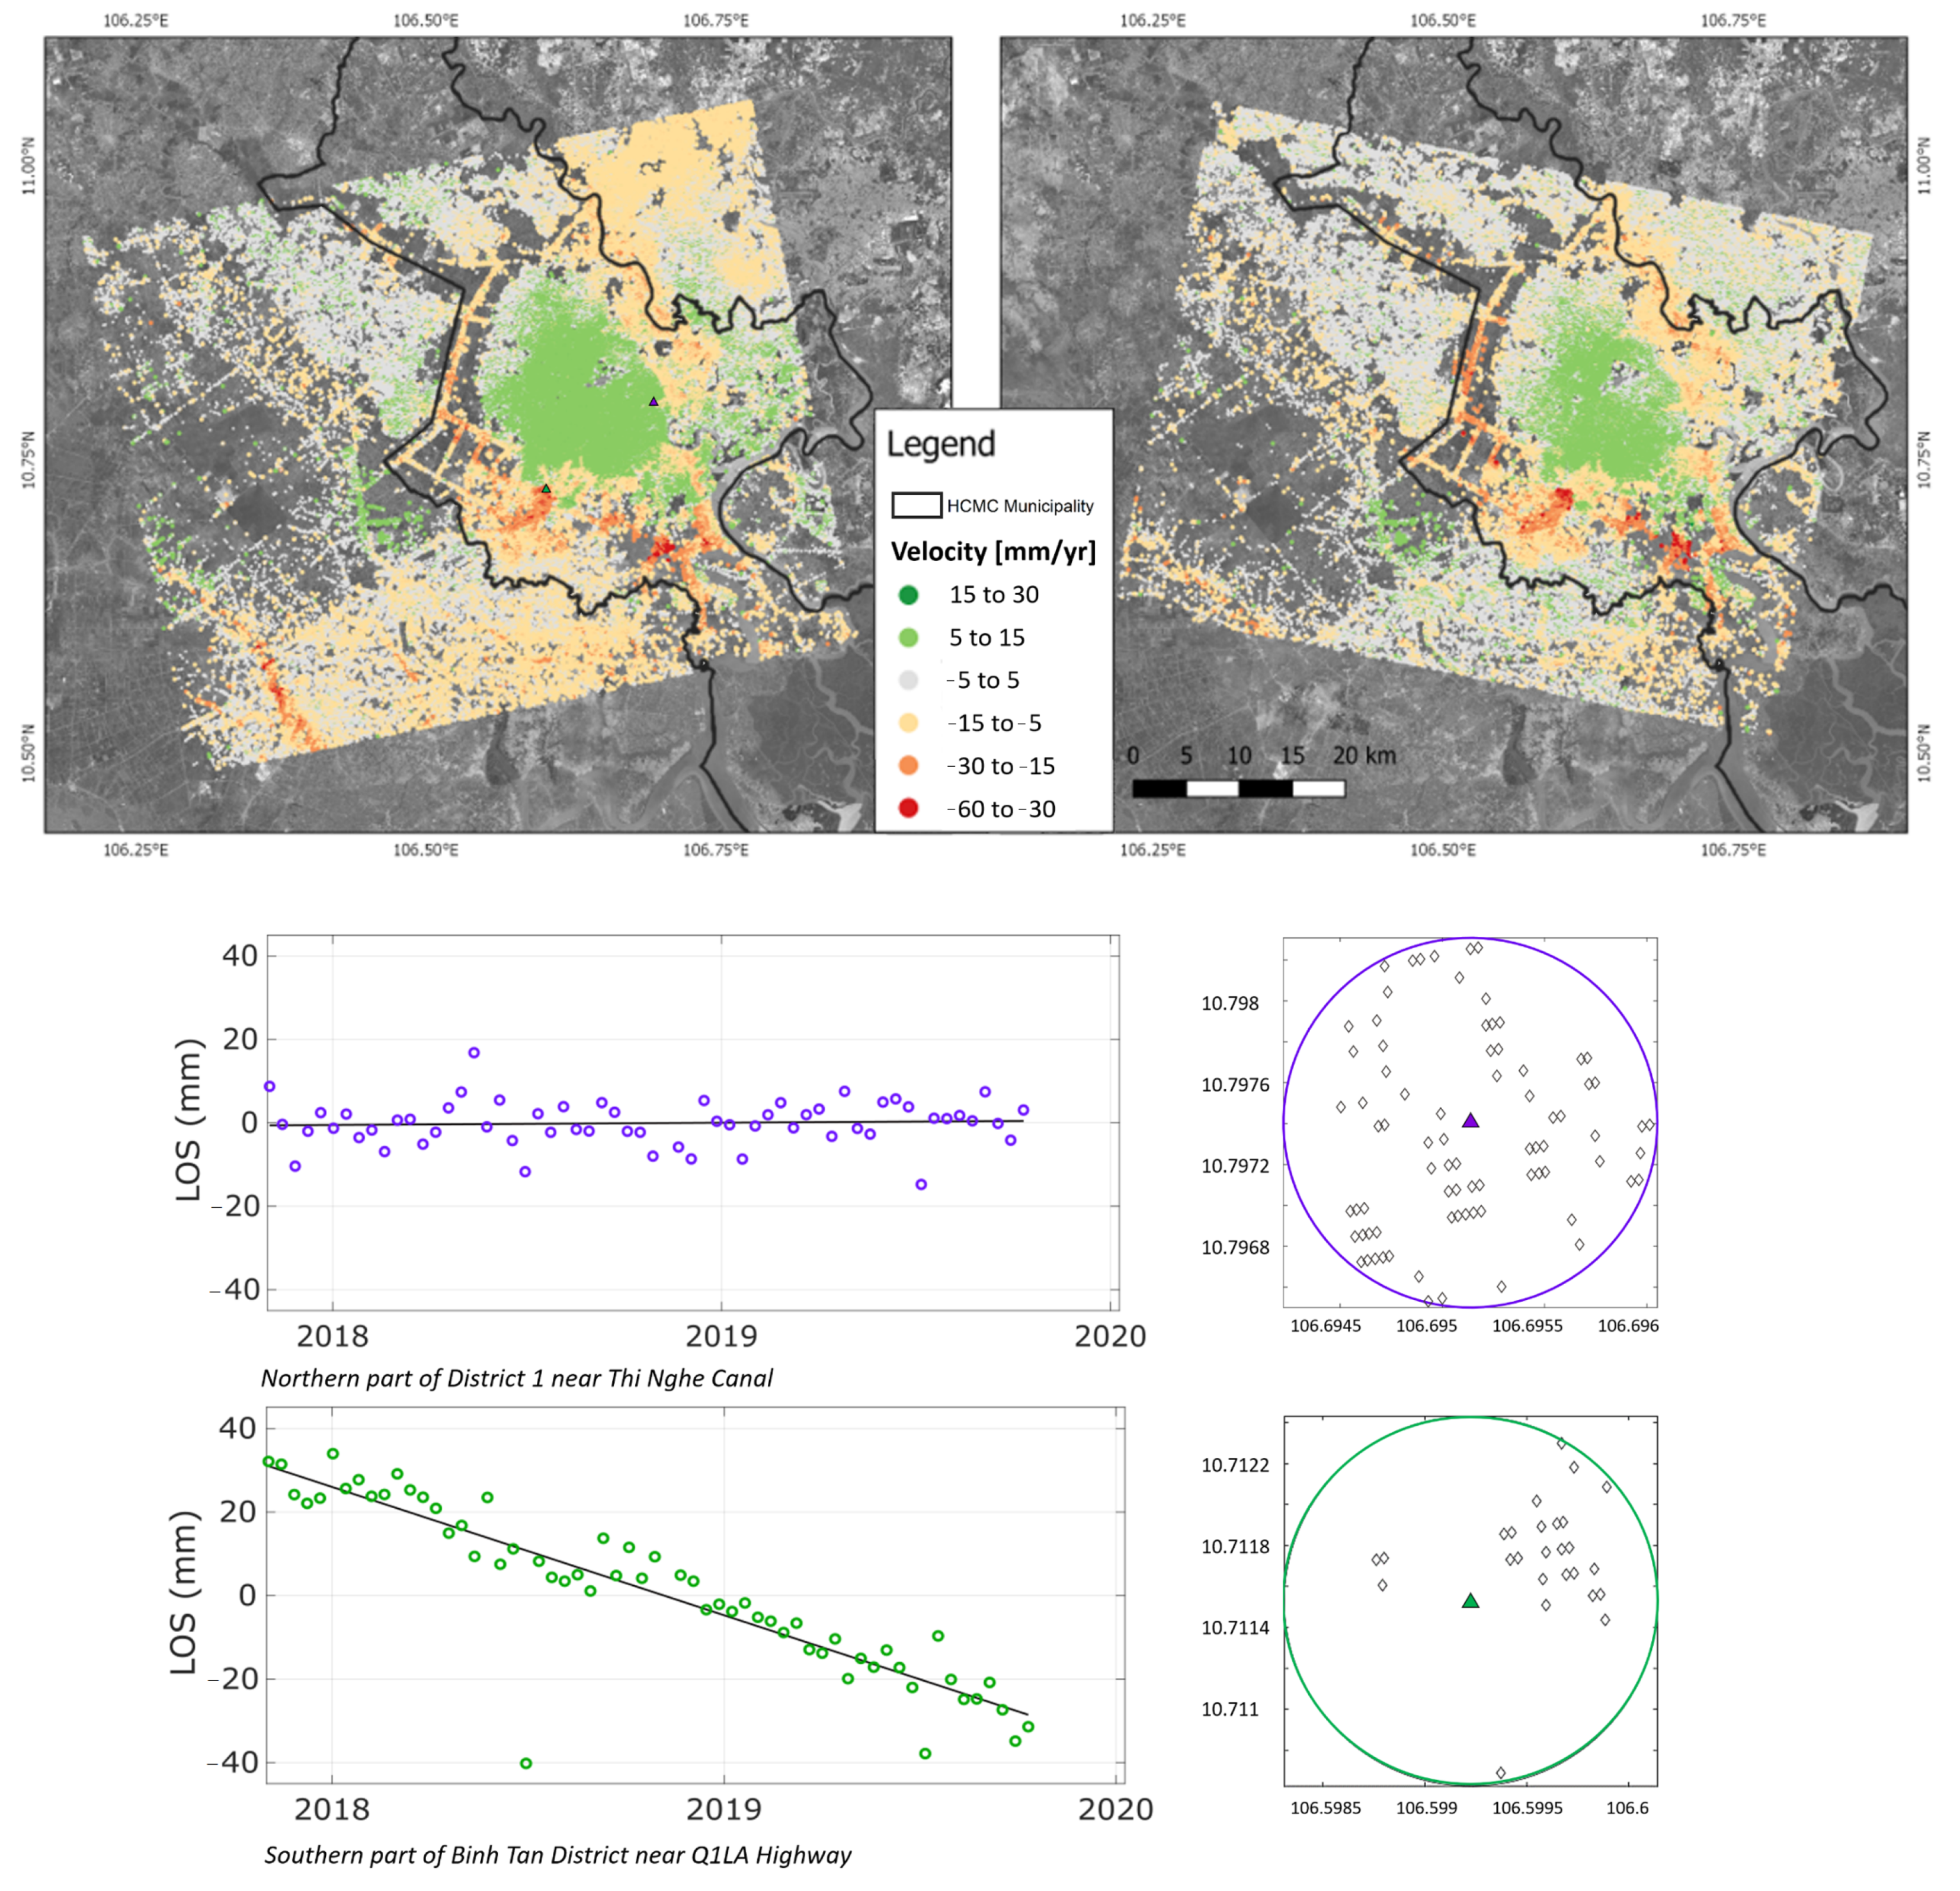
3.1. LOS Deformation Rates
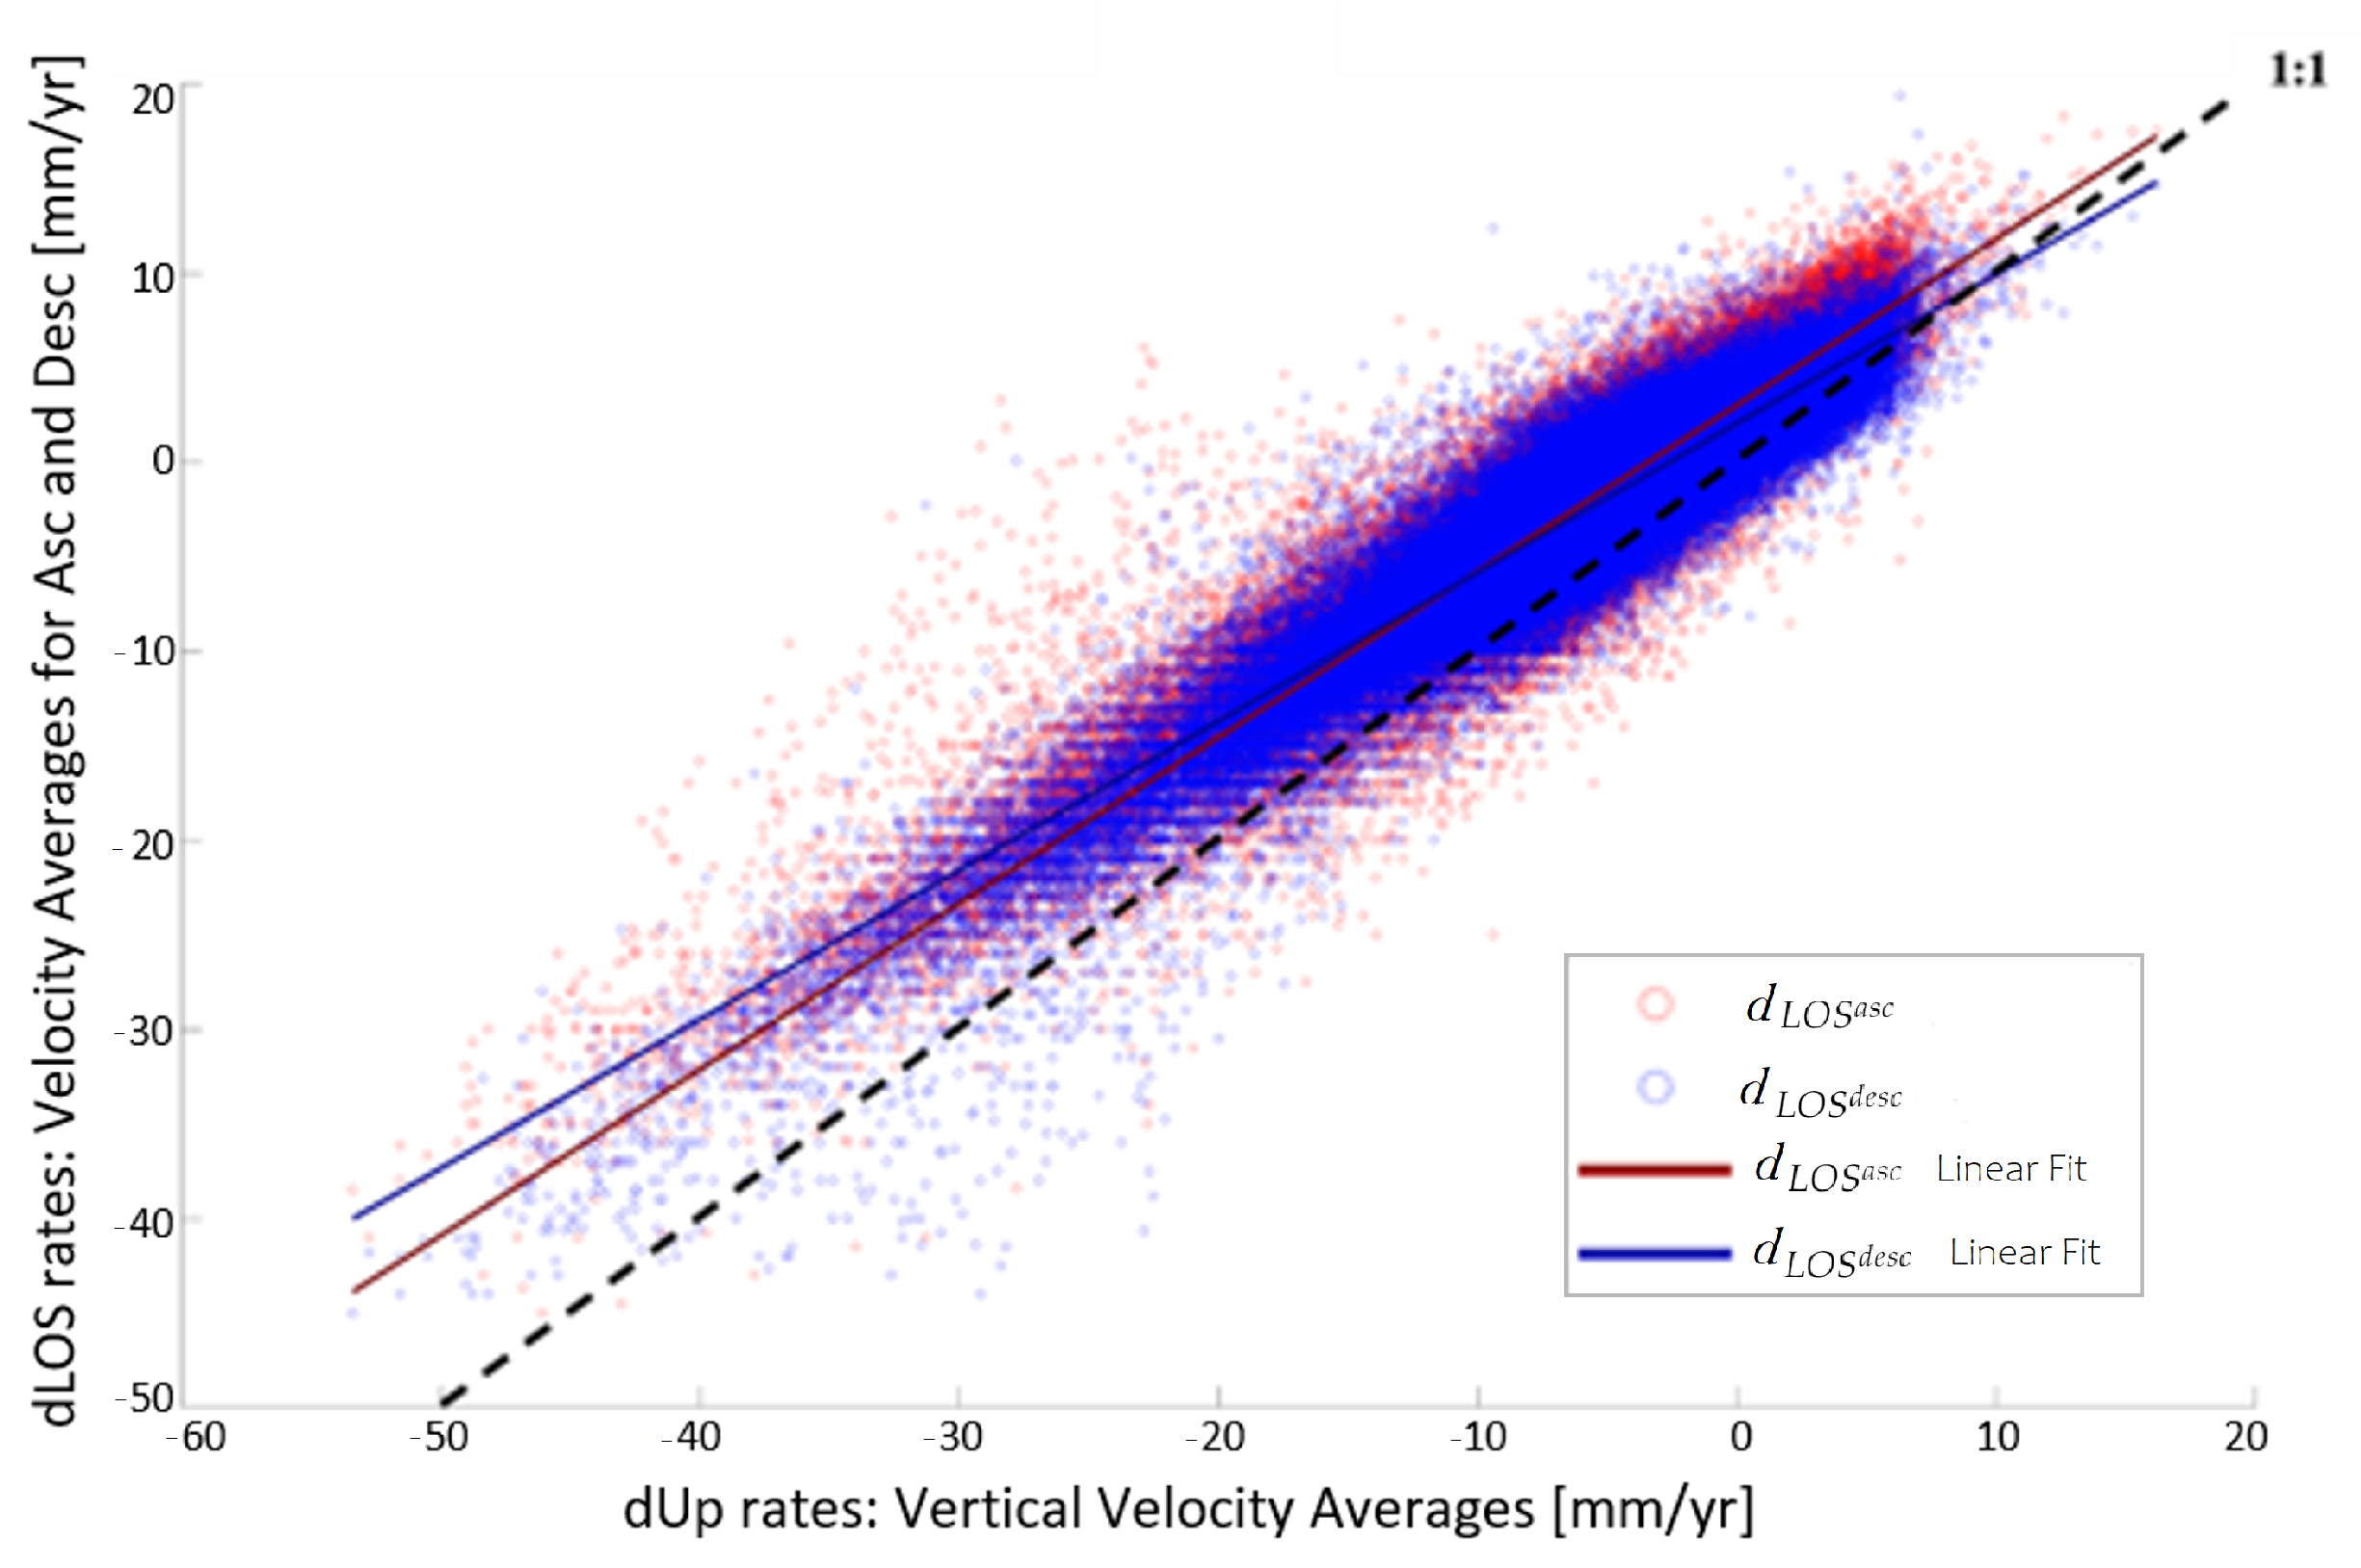
3.2. Vertical Deformation Rates
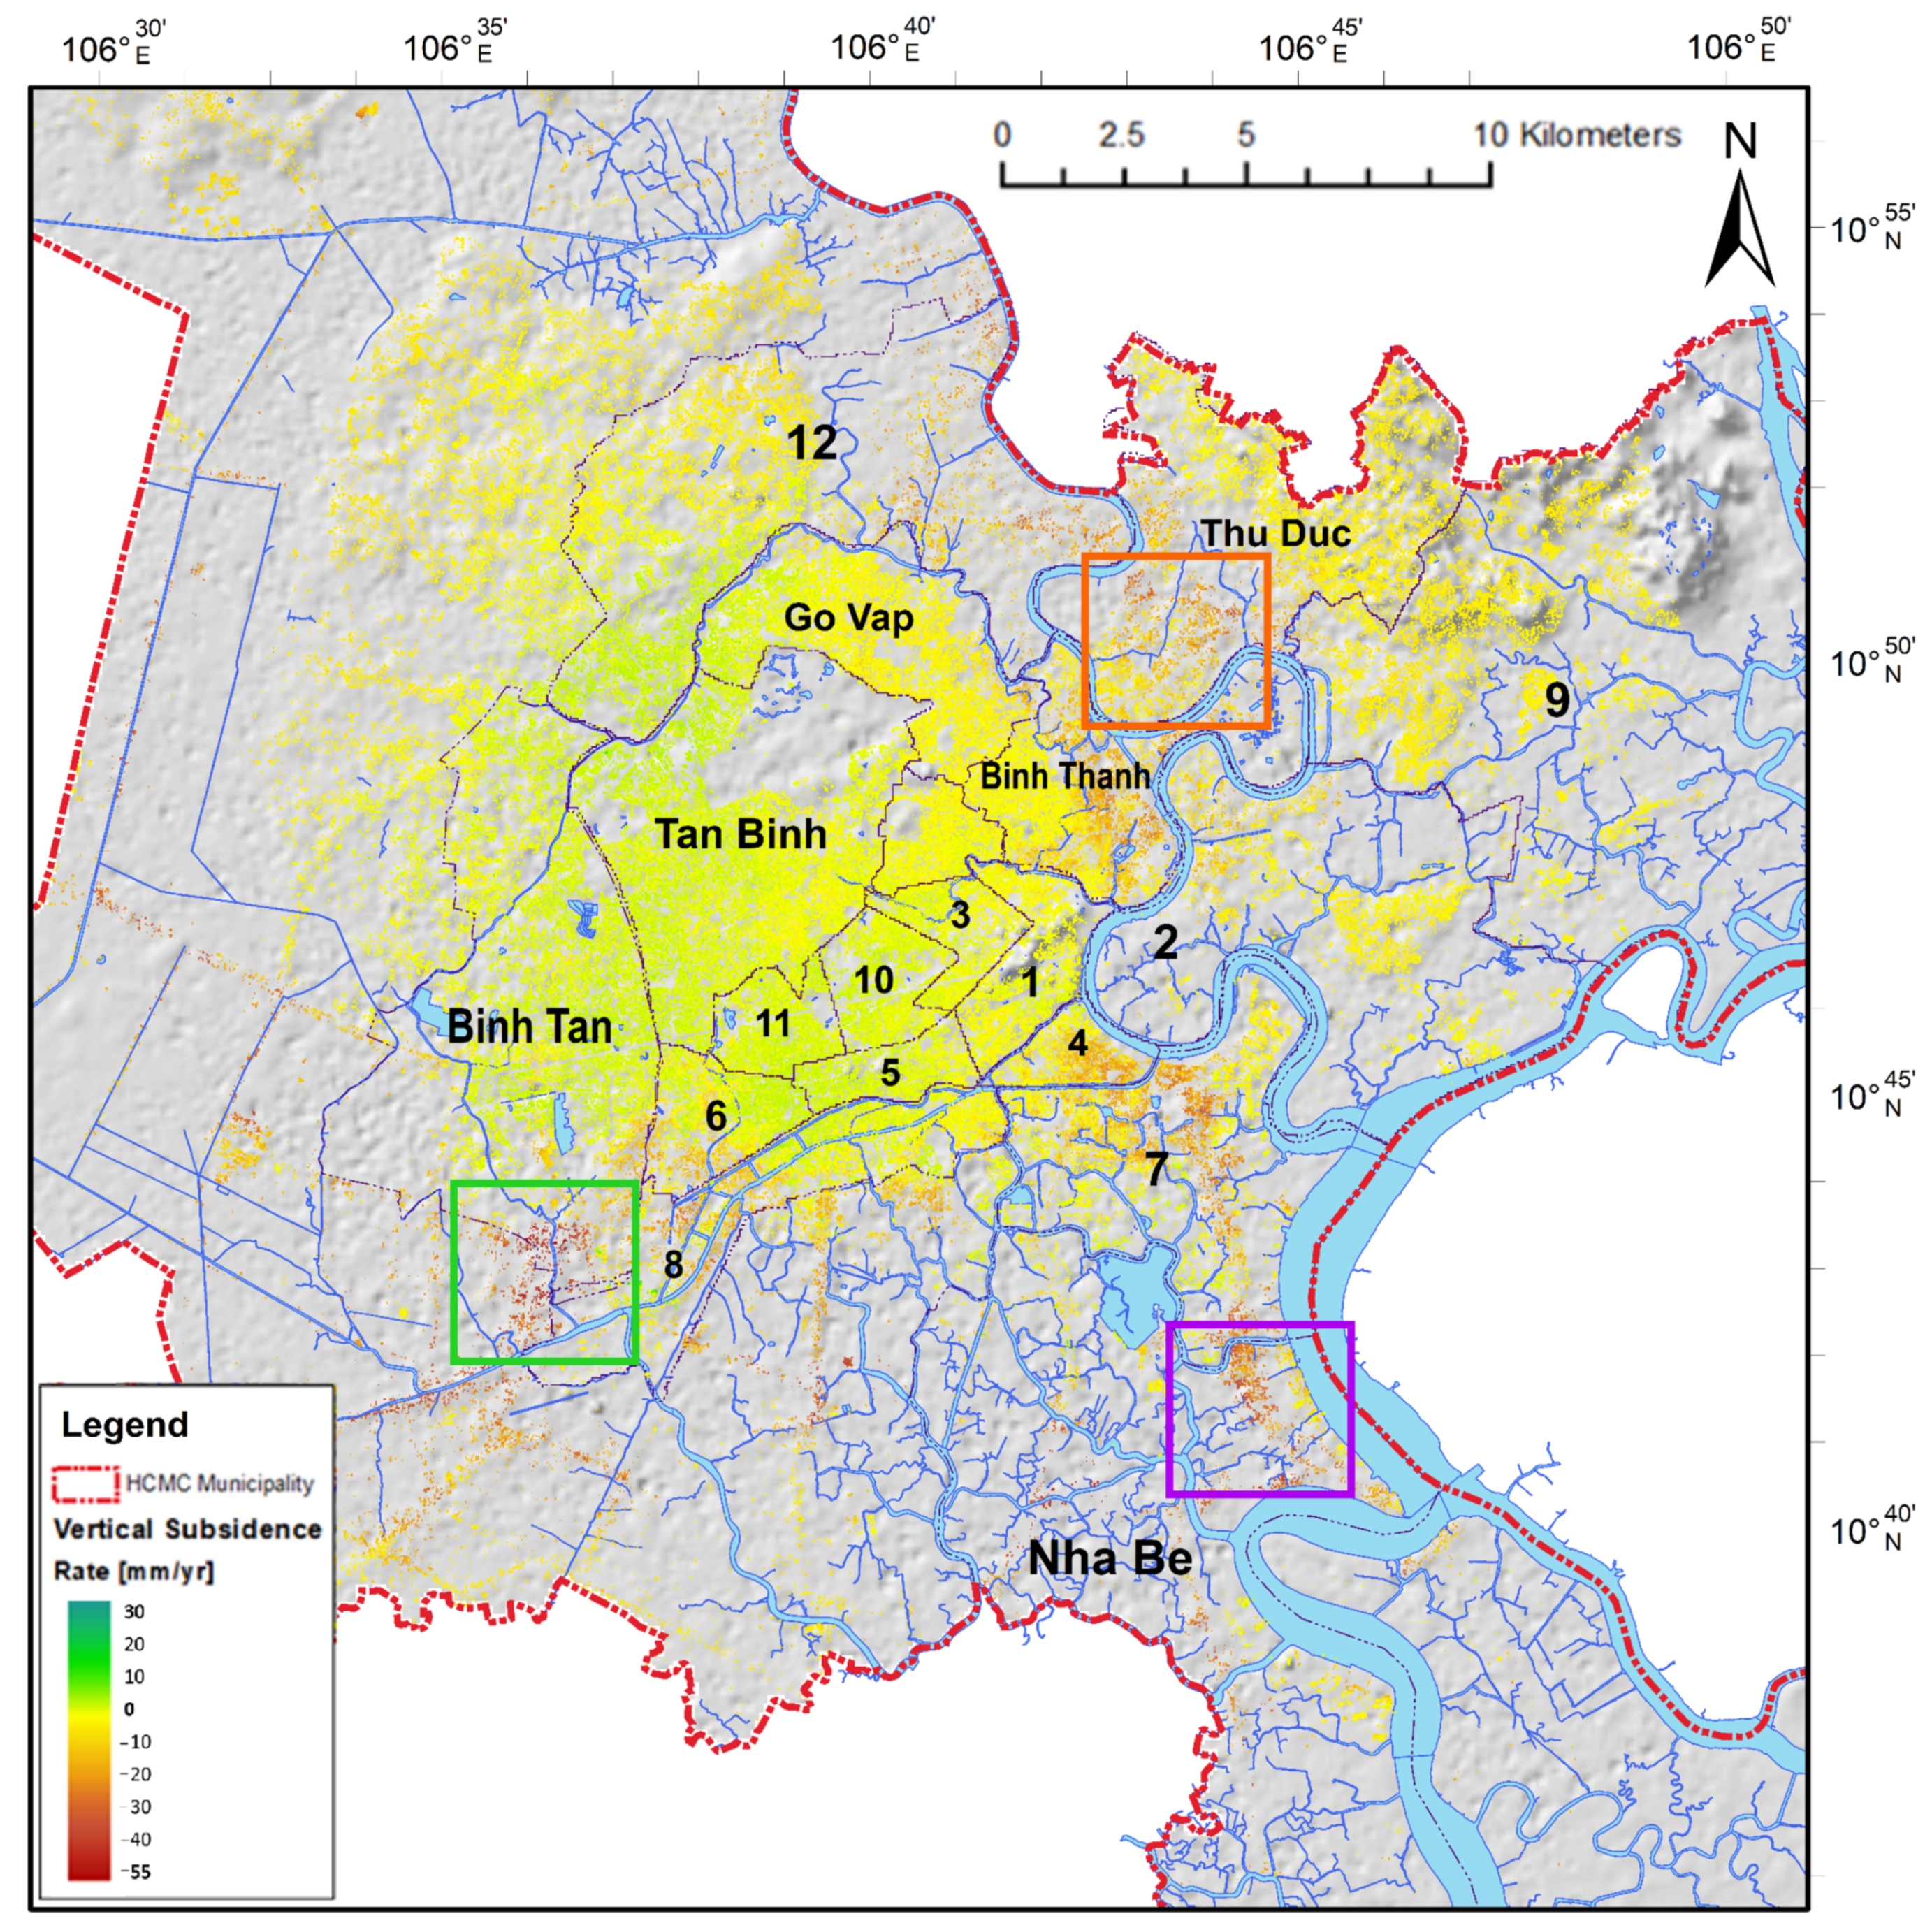
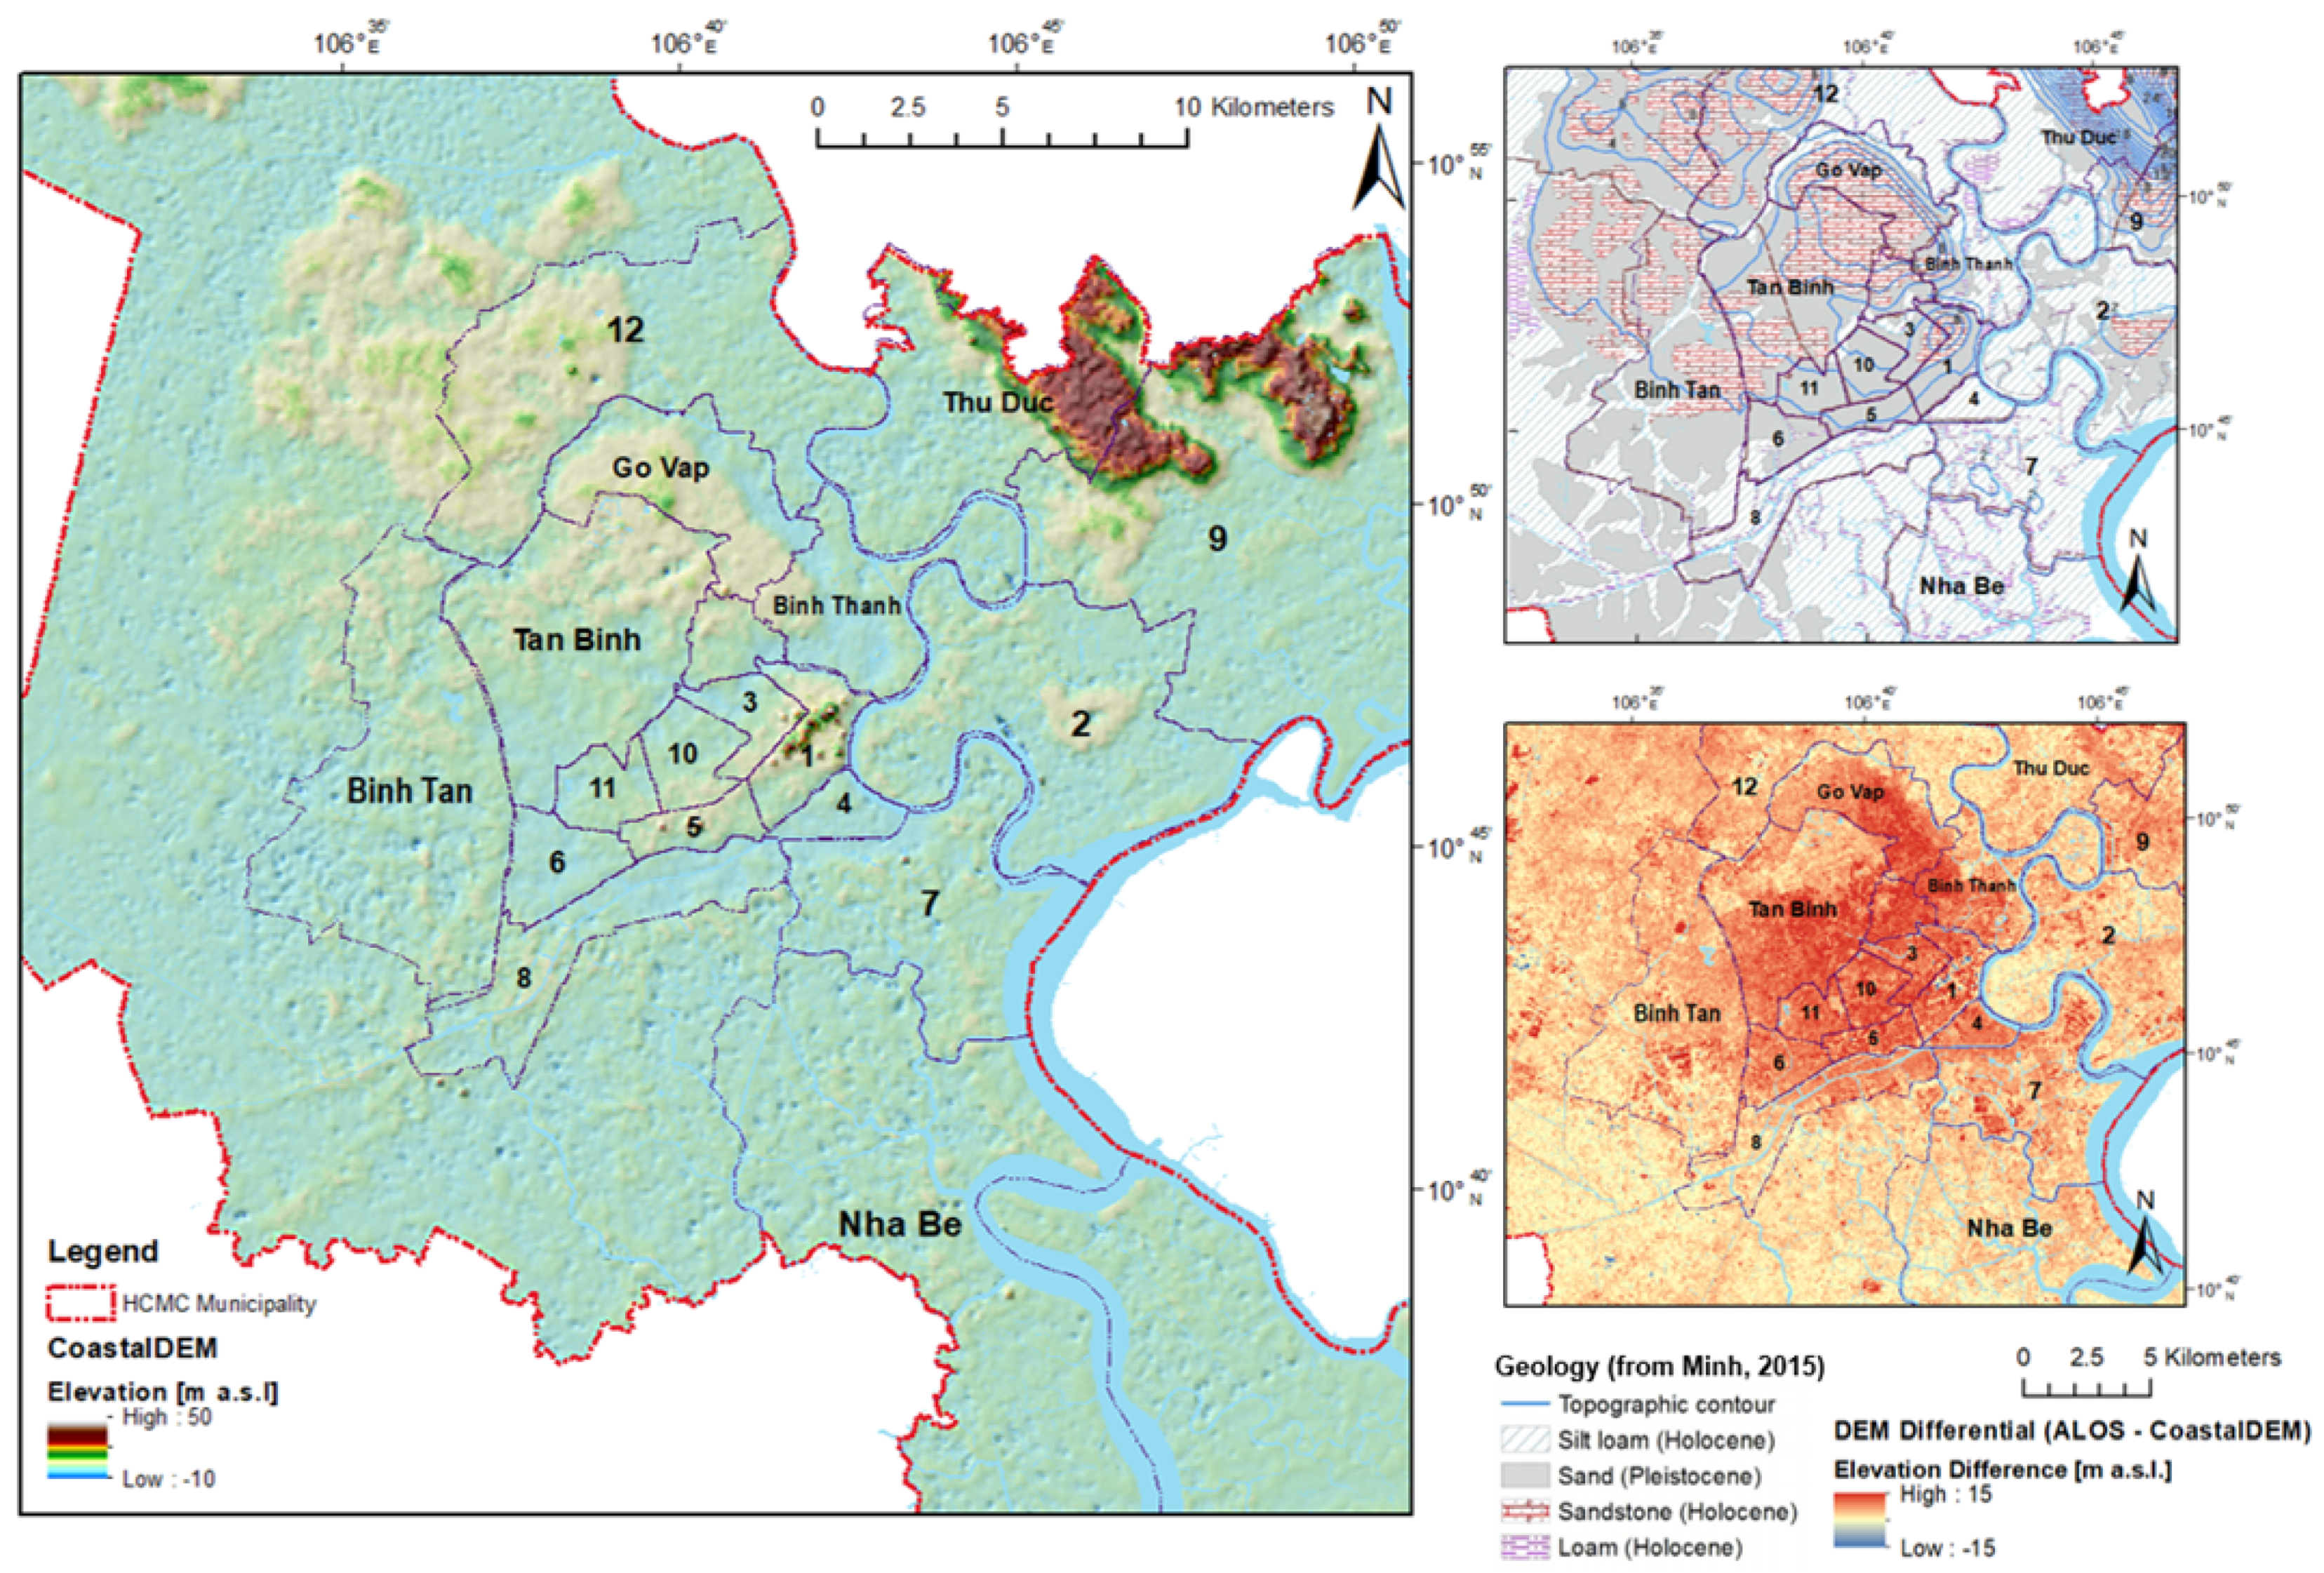
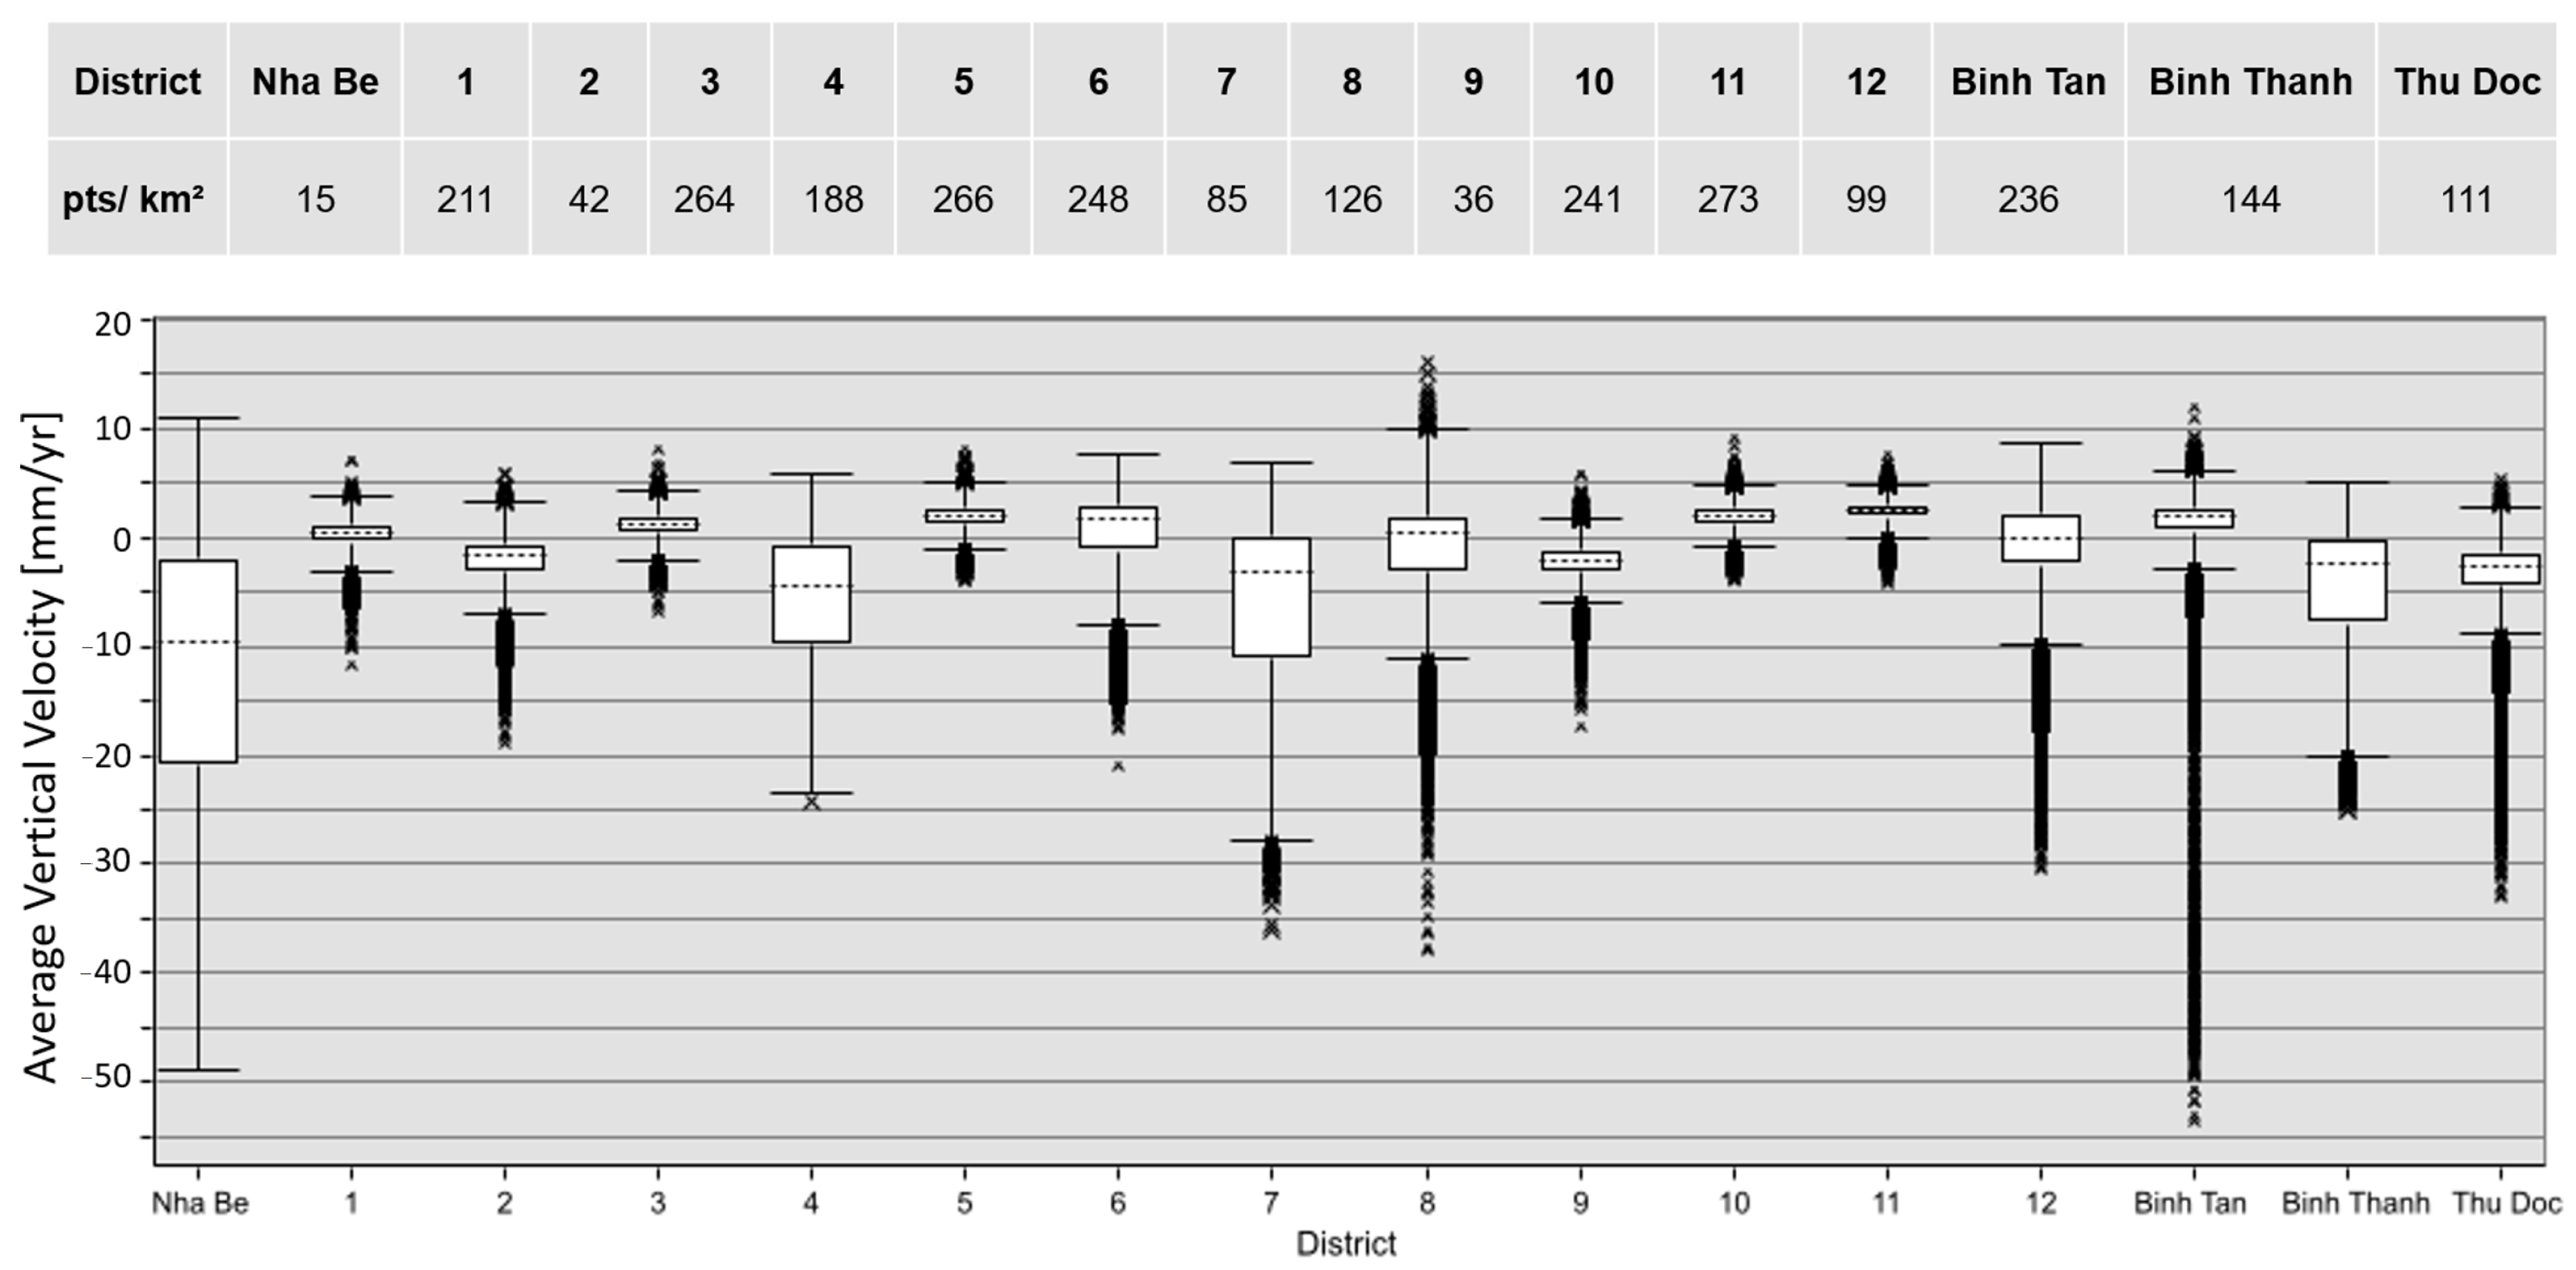
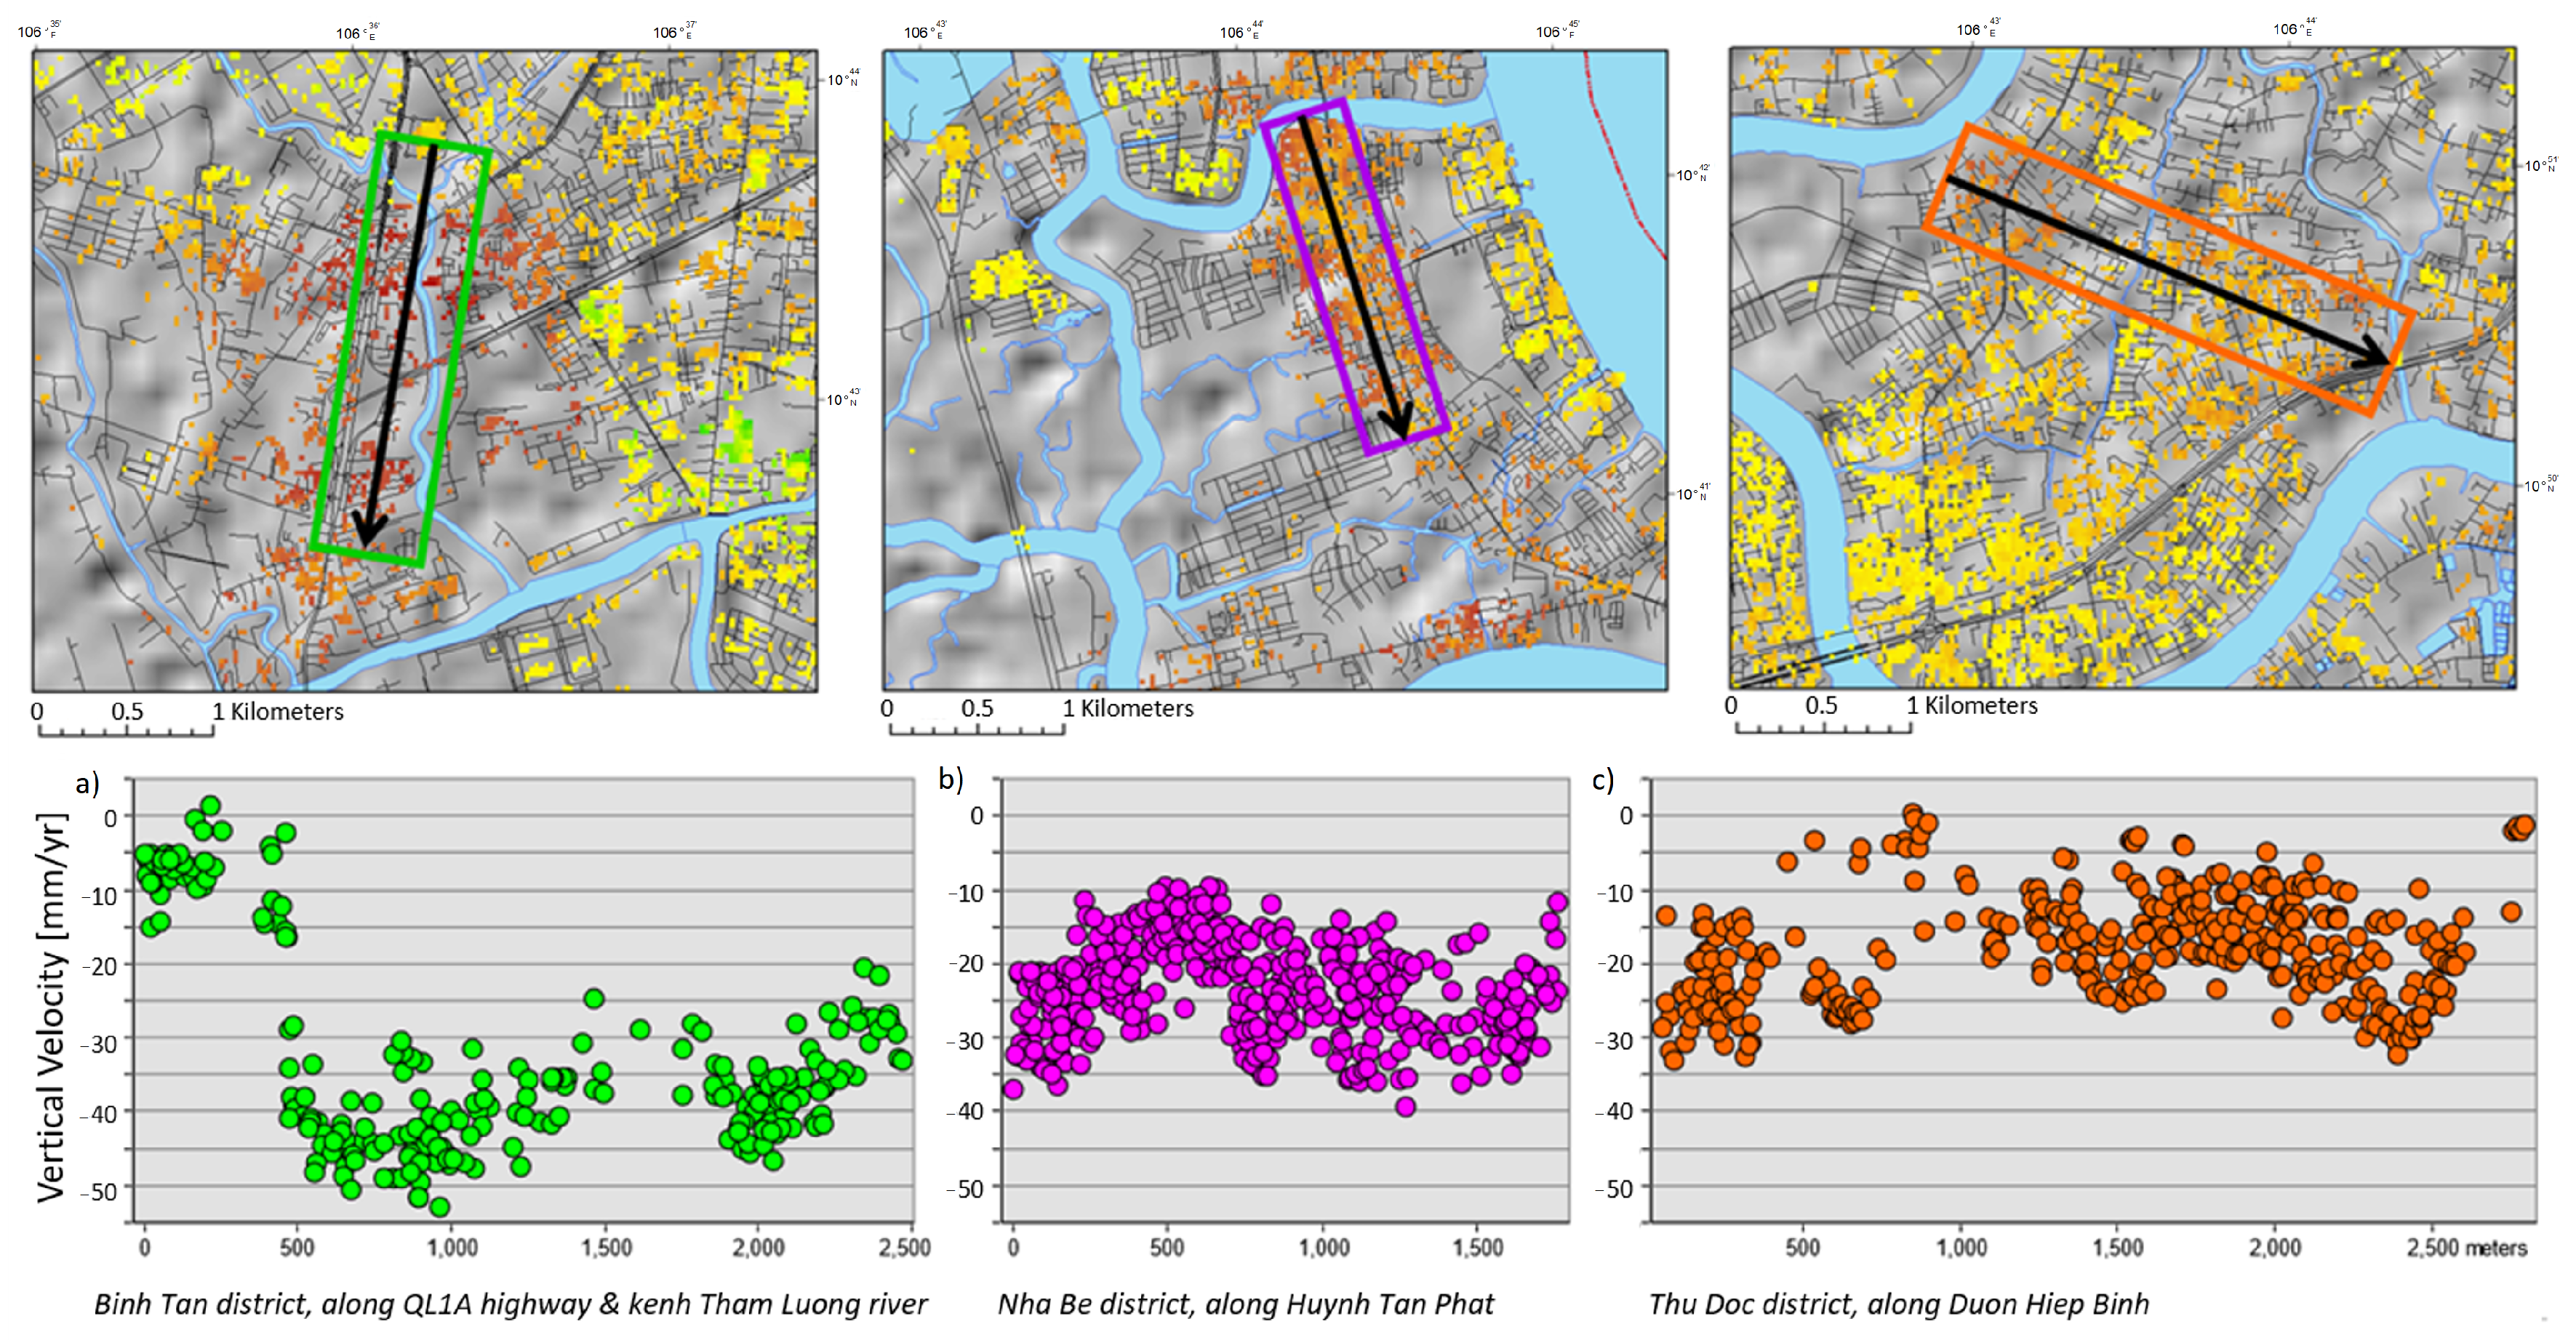
3.3. Key Districts and Infrastructure
4. Discussion
4.1. Findings and Outlook
4.2. Implications and Limitations
5. Conclusions
Supplementary Materials
Author Contributions
Funding
Acknowledgments
Conflicts of Interest
Abbreviations
| ALOS | Advanced Land Observing Satellite |
| AOI | Area of Interest |
| APAC | Asia-Pacific |
| ASF | Alaska Satellite Facility |
| DEM | Digital Elevation Model |
| dGPS | differential Global Positioning System |
| dhald | horizontal displacement |
| dLOS | displacement along Line-of-sight |
| dup | vertical displacement |
| ESA | European Space Agency |
| GPH | Groundwater Piezometric Head |
| HCMC | Ho Chi Minh City |
| InSAR | Interferometric Synthetic Aperture Radar |
| IQR | Interquartile Range |
| LOS | Line-of-Site |
| MoNRE | Ministry of Natural Resources and Environment in Vietnam |
| PSI | Persistent Scatterer Interferometry |
| RMSE | Root Mean Square Error |
| SAR | Synthetic Aperture Radar |
| SLC | Single Look Complex |
| SLR | Sea-Level Rise |
| SRTM | Shuttle Radar Topography Mission |
| StaMPS | Stanford Method for Persistent Scatterers |
| TOPSAR | Terrain Observation with Progressive Scans SAR |
References
- Giosan, L.; Syvitski, J.; Constantinescu, S.; Day, J. Climate change: Protect the world’s deltas. Nature 2014, 516, 31–33. [Google Scholar] [CrossRef]
- Tessler, Z.D.; Vorosmarty, C.J.; Grossberg, M.; Gladkova, I.; Aizenman, H.; Syvitski, J.P.M.; Foufoula-Georgiou, E. Profiling risk and sustainability in coastal deltas of the world. Science 2015, 349, 638–643. [Google Scholar] [CrossRef] [PubMed]
- Hagenlocher, M.; Renaud, F.G.; Haas, S.; Sebesvari, Z. Vulnerability and risk of deltaic social-ecological systems exposed to multiple hazards. Sci. Total. Environ. 2018, 631–632, 71–80. [Google Scholar] [CrossRef] [PubMed]
- Kulp, S.A.; Strauss, B.H. New elevation data triple estimates of global vulnerability to sea-level rise and coastal flooding. Nat. Commun. 2019, 10, 4844. [Google Scholar] [CrossRef] [PubMed]
- Erkens, G.; Bucx, T.; Dam, R.; de Lange, G.; Lambert, J. Sinking coastal cities. Proc. Int. Assoc. Hydrol. Sci. 2015, 372, 189–198. [Google Scholar] [CrossRef]
- Saxena, N.C. Subsidence Management Handbook; Scientific Publishers: Jodhpur, India, 2003. [Google Scholar]
- Bangalore, M.; Smith, A.; Veldkamp, T. Exposure to Floods, Climate Change, and Poverty in Vietnam; Policy Research Working Paper WPS7765; World Bank Group: Washington, DC, USA, 2016. [Google Scholar]
- Duy, P.N.; Chapman, L.; Tight, M.; Thuong, L.V.; Linh, P.N. Urban Resilience to Floods in Coastal Cities: Challenges and Opportunities for Ho Chi Minh City and Other Emerging Cities in Southeast Asia. J. Urban Plan. Dev. 2018, 144, 05017018. [Google Scholar] [CrossRef]
- Santos, S.M.; Cabral, J.J.S.P.; Pontes Filho, I.D.S. Monitoring of soil subsidence in urban and coastal areas due to groundwater overexploitation using GPS. Nat. Hazards 2012, 64, 421–439. [Google Scholar] [CrossRef]
- Kersten, T.; Kobe, M.; Gabriel, G.; Timmen, L.; Schön, S.; Vogel, D. Geodetic monitoring of subrosion-induced subsidence processes in urban areas. J. Appl. Geod. 2017, 11. [Google Scholar] [CrossRef]
- Thoang, T.; Giao, P. Subsurface characterization and prediction of land subsidence for HCM City, Vietnam. Eng. Geol. 2015, 199, 107–124. [Google Scholar] [CrossRef]
- Crosetto, M.; Castillo, M.; Arbiol, R. Urban Subsidence Monitoring Using Radar Interferometry. Photogramm. Eng. Remote Sens. 2003, 69, 775–783. [Google Scholar] [CrossRef]
- Ferretti, A.; Colombo, D.; Fumagalli, A.; Novali, F.; Rucci, A. InSAR data for monitoring land subsidence: Time to think big. Proc. Int. Assoc. Hydrol. Sci. 2015, 372, 331–334. [Google Scholar] [CrossRef]
- Bianchini, S.; Solari, L.; Del Soldato, M.; Raspini, F.; Montalti, R.; Ciampalini, A.; Casagli, N. Ground Subsidence Susceptibility (GSS) Mapping in Grosseto Plain (Tuscany, Italy) Based on Satellite InSAR Data Using Frequency Ratio and Fuzzy Logic. Remote Sens. 2019, 11, 2015. [Google Scholar] [CrossRef]
- Kim, J.S.; Kim, D.J.; Kim, S.W.; Won, J.S.; Moon, W.M. Monitoring of urban land surface subsidence using PSInSAR. Geosci. J. 2007, 11, 59–73. [Google Scholar] [CrossRef]
- Crosetto, M.; Monserrat, O.; Cuevas-González, M.; Devanthéry, N.; Crippa, B. Persistent Scatterer Interferometry: A review. ISPRS J. Photogramm. Remote Sens. 2016, 115, 78–89. [Google Scholar] [CrossRef]
- Le, T.; Chang, C.P.; Nguyen, X.; Yhokha, A. TerraSAR-X Data for High-Precision Land Subsidence Monitoring: A Case Study in the Historical Centre of Hanoi, Vietnam. Remote Sens. 2016, 8, 338. [Google Scholar] [CrossRef]
- Tran, V.A.; Tran, Q.C.; Vast, H.; Nguyen, D.A.; Vast, H.; Ho, T.M.D.; Tran, T.A.; Nguyen, N.H.; Luong, T.T.L. Application of PSInSAR method for determining of land subsidence in Hanoi city by Cosmo-Skymed imagery. In Proceedings of the International Conference on GeoInformatics for Spatial-Infrastructure Development in Earth and Allied Sciences, Hanoi, Vietnam, 12–15 November 2016. [Google Scholar]
- Braun, A.; Hochschild, V.; Pham, G.T.; Nguyen, L.H.K.; Bachofer, F. Linking land subsidence to soil types within Hue city in Central Vietnam. J. Vietnam. Environ. 2020, 12. [Google Scholar] [CrossRef]
- Hoa, P.; Giang, N.; Binh, N.; Hai, L.; Pham, T.D.; Hasanlou, M.; Tien Bui, D. Soil Salinity Mapping Using SAR Sentinel-1 Data and Advanced Machine Learning Algorithms: A Case Study at Ben Tre Province of the Mekong River Delta (Vietnam). Remote Sens. 2019, 11, 128. [Google Scholar] [CrossRef]
- Ho Tong Minh, D.; Van Trung, L.; Toan, T. Mapping Ground Subsidence Phenomena in Ho Chi Minh City through the Radar Interferometry Technique Using ALOS PALSAR Data. Remote Sens. 2015, 7, 8543–8562. [Google Scholar] [CrossRef]
- Erban, L.E.; Gorelick, S.M.; Zebker, H.A. Groundwater extraction, land subsidence, and sea-level rise in the Mekong Delta, Vietnam. Environ. Res. Lett. 2014, 9, 084010. [Google Scholar] [CrossRef]
- General Statistics Office of Vietnam. Statistical Yearbook of Vietnam 2019: Population and Employment. 2019. Available online: https://www.gso.gov.vn/en/data-and-statistics/2020/09/statistical-yearbook-2019/ (accessed on 15 August 2020).
- Tran Ngoc, T.D.; Perset, M.; Strady, E.; Phan, T.S.H.; Vachaud, G.; Quertamp, F.; Gratiot, N. Ho Chi Minh City Growing with Water-Related Challenges; Technical Report; United Nations Educational, Scientific, and Cultural Organization (UNESCO): Paris, France, 2016; ISBN 978-92-3-100161-1. [Google Scholar]
- Sekkei, N. The Study on the Adjustment of the HCMC Master Plan Up to 2025; Technical Report; Urban Planning Institute (UPI): Ho Chi Minh City, Vietnam, 2007. [Google Scholar]
- United Nations Department of Economic and Social Affairs (UN DESA). World Urbanization Prospects: The 2018 Revision; United Nations Publications: New York, NY, USA, 2019. [Google Scholar]
- Angel, S.; Blei, A.; Lamson-Hall, P.; Galarza Sanchez, N.; Civco, D.; Lei, R.; Thom, K. Atlas of Urban Expansion—2016 Edition; Volume 1: Areas and Densitiies; NYU Urban Expansion Program at New York University, UN-Habitat, and the Lincoln Institute of Land Policy: Cambridge, MA, USA, 2016. [Google Scholar]
- The Ho Chi Minh City Department of Planning and Architecture. Ho Chi Minh City Urban Planning Information. 2020. Available online: https://thongtinquyhoach.hochiminhcity.gov.vn/ (accessed on 21 July 2020).
- Blate, G. The Greater Mekong and Climate Change: Biodiversity, Ecosystem Services and Development at Risk; World Wildlife Foundation: Bangkok, Thailand, 2009. [Google Scholar]
- Downes, N.K.; Storch, H.; Schmidt, M.; Nguyen, T.C.V.; Dinh, L.C.; Tran, T.N.; Hoa, L.T. Understanding Ho Chi Minh City’s Urban Structures for Urban Land-Use Monitoring and Risk-Adapted Land-Use Planning. In Sustainable Ho Chi Minh City: Climate Policies for Emerging Mega Cities; Katzschner, A., Waibel, M., Schwede, D., Katzschner, L., Schmidt, M., Storch, H., Eds.; Springer International Publishing: Cham, Switzerland, 2016; pp. 89–116. [Google Scholar] [CrossRef]
- Minderhoud, P.S.J.; Coumou, L.; Erkens, G.; Middelkoop, H.; Stouthamer, E. Mekong delta much lower than previously assumed in sea-level rise impact assessments. Nat. Commun. 2019, 10, 3847. [Google Scholar] [CrossRef]
- Dang, T.N.; Van, D.Q.; Kusaka, H.; Seposo, X.T.; Honda, Y. Green Space and Deaths Attributable to the Urban Heat Island Effect in Ho Chi Minh City. Am. J. Public Health 2018, 108, S137–S143. [Google Scholar] [CrossRef] [PubMed]
- Nearing, M.; Pruski, F.; O’Neal, M. Expected climate change impacts on soil erosion rates: A review. J. Soil Water Conserv. 2004, 59, 43–50. [Google Scholar]
- Ministry of Environment and Natural Resources (MoNRE); World Bank Vietnam; DANIDA. Vietnam Environment Monitor 2006: Water Quality in Viet Nam with a Focus on the Cau, Nhue-Day and Dong Nai River Basins; Technical Report; MoNRE: Hanoi, Vietnam, 2006.
- Erban, L.E.; Gorelick, S.M.; Zebker, H.A.; Fendorf, S. Release of arsenic to deep groundwater in the Mekong Delta, Vietnam, linked to pumping-induced land subsidence. Proc. Natl. Acad. Sci. USA 2013, 110, 13751–13756. [Google Scholar] [CrossRef] [PubMed]
- Minderhoud, P.S.J.; Erkens, G.; Pham, V.H.; Bui, V.T.; Erban, L.; Kooi, H.; Stouthamer, E. Impacts of 25 years of groundwater extraction on subsidence in the Mekong delta, Vietnam. Environ. Res. Lett. 2017, 12, 064006. [Google Scholar] [CrossRef]
- People’s Committee of Ho Chi Minh City. Issuing a Plan for Implementation of the First City’s Meeting Decision on the Phase Depreciation Program 2016–2020; (Translated). 2016. Available online: http://tcvg.hochiminhcity.gov.vn/pages/7ctdp5.aspx (accessed on 25 July 2020).
- People’s Committee of Ho Chi Minh City. Issuing the Plan to Reduce Under-Land Water Disposal and Examination of Under-Land Water Exploitation Plan in Ho Chi Minh City by 2025 (Translated). 2018. Available online: http://tcvg.hochiminhcity.gov.vn/pages/7ctdp6.aspx (accessed on 25 July 2020).
- Zoccarato, C.; Minderhoud, P.S.J.; Teatini, P. The role of sedimentation and natural compaction in a prograding delta: Insights from the mega Mekong delta, Vietnam. Sci. Rep. 2018, 8, 11437. [Google Scholar] [CrossRef]
- Trung, L.V.; Dinh, H.T.M. Monitoring Land Deformation Using Permanent Scatterer INSAR Techniques (case study: Ho Chi Minh City). In Proceedings of the 7th FIG Regional Conference: Spatial Data Serving People-Land Governance and the Environment–Building the Capacity, Hanoi, Vietnam, 19–22 October 2009. [Google Scholar]
- Hu, J.; Li, Z.; Ding, X.; Zhu, J.; Zhang, L.; Sun, Q. Resolving three-dimensional surface displacements from InSAR measurements: A review. Earth-Sci. Rev. 2014, 133, 1–17. [Google Scholar] [CrossRef]
- Fuhrmann, T.; Garthwaite, M.C. Resolving three-dimensional surface motion with InSAR: Constraints from multi-geometry data fusion. Remote Sens. 2019, 11, 241. [Google Scholar] [CrossRef]
- Hooper, A.; Segall, P.; Zebker, H. Persistent scatterer interferometric synthetic aperture radar for crustal deformation analysis, with application to Volcán Alcedo, Galápagos. J. Geophys. Res. 2007, 112, B07407. [Google Scholar] [CrossRef]
- Lempert, R.; Kalra, N.; Peyraud, S.; Mao, Z.; Tan, S.B.; Cira, D.; Lotsch, A. Ensuring Robust Flood Risk Management in Ho Chi Minh City; Policy Research Working Papers; The World Bank: Washington, DC, USA, 2013. [Google Scholar] [CrossRef]
- Vo, P.L. Urbanization and water management in Ho Chi Minh City, Vietnam-issues, challenges and perspectives. GeoJournal 2007, 70, 75–89. [Google Scholar] [CrossRef]
- Copernicus. Sentinel-1 Data 2017 to 2019. Retrieved from ASF DAAC [8 Nov 2019], Processed by ESA. Available online: https://asf.alaska.edu/ (accessed on 14 October 2020).
- Ferretti, A.; Prati, C.; Rocca, F. Nonlinear subsidence rate estimation using permanent scatterers in differential SAR interferometry. IEEE Trans. Geosci. Remote Sens. 2000, 38, 2202–2212. [Google Scholar] [CrossRef]
- Delgado Blasco, J.; Foumelis, M.; Stewart, C.; Hooper, A. Measuring Urban Subsidence in the Rome Metropolitan Area (Italy) with Sentinel-1 SNAP-StaMPS Persistent Scatterer Interferometry. Remote Sens. 2019, 11, 129. [Google Scholar] [CrossRef]
- Prats-Iraola, P.; Scheiber, R.; Marotti, L.; Wollstadt, S.; Reigber, A. TOPS Interferometry with TerraSAR-X. IEEE Trans. Geosci. Remote Sens. 2012, 50, 3179–3188. [Google Scholar] [CrossRef]
- Walter, D.; Busch, W. Influences of DEM quality parameters on the topographic phase correction in DInSAR. In Proceedings of the 2012 IEEE International Geoscience and Remote Sensing Symposium, Munich, Germany, 22–27 July 2012; IEEE: Munich, Germany, 2012; pp. 3927–3930. [Google Scholar] [CrossRef]
- Hooper, A.; Bekaert, D.; Spaans, K.; Arıkan, M. Recent advances in SAR interferometry time series analysis for measuring crustal deformation. Tectonophysics 2012, 514–517, 1–13. [Google Scholar] [CrossRef]
- Chen, C.; Zebker, H. Phase unwrapping for large SAR interferograms: Statistical segmentation and generalized network models. IEEE Trans. Geosci. Remote Sens. 2002, 40, 1709–1719. [Google Scholar] [CrossRef]
- Bekaert, D.; Walters, R.; Wright, T.; Hooper, A.; Parker, D. Statistical comparison of InSAR tropospheric correction techniques. Remote Sens. Environ. 2015, 170, 40–47. [Google Scholar] [CrossRef]
- Yu, C.; Li, Z.; Penna, N.T.; Crippa, P. Generic Atmospheric Correction Model for Interferometric Synthetic Aperture Radar Observations. J. Geophys. Res. Solid Earth 2018, 123, 9202–9222. [Google Scholar] [CrossRef]
- Cuong, T.Q.; Ho Tong Minh, D.; Van Trung, L.; Le Toan, T. Ground subsidence monitoring in Vietnam by multi-temporal InSAR technique. In Proceedings of the 2015 IEEE International Geoscience and Remote Sensing Symposium (IGARSS), Milan, Italy, 26–31 July 2015; IEEE: Milan, Italy, 2015; pp. 3540–3543. [Google Scholar] [CrossRef]
- Tadono, T.; Ishida, H.; Oda, F.; Naito, S.; Minakawa, K.; Iwamoto, H. Precise Global DEM Generation by ALOS PRISM. In Proceedings of the ISPRS Annals of Photogrammetry, Remote Sensing and Spatial Information Sciences, Suzhou, China, 14–16 May 2014; Volume II-4, pp. 71–76. [Google Scholar] [CrossRef]
- Santillan, J.R.; Makinano-Santillan, M. Vertical accuracy assessment of 30-M resolution alos, aster, and srtm global dems over northeastern mindanao, Philippines. In Proceedings of the ISPRS—International Archives of the Photogrammetry, Remote Sensing and Spatial Information Sciences, Prague, Czech Republic, 12–19 July 2016; Volume XLI-B4, pp. 149–156. [Google Scholar] [CrossRef]
- Vernimmen, R.; Hooijer, A.; Pronk, M. New ICESat-2 Satellite LiDAR Data Allow First Global Lowland DTM Suitable for Accurate Coastal Flood Risk Assessment. Remote Sens. 2020, 12, 2827. [Google Scholar] [CrossRef]
- Zhang, Y.; Wu, J.; Xue, Y.; Wang, Z.; Yao, Y.; Yan, X.; Wang, H. Land subsidence and uplift due to long-term groundwater extraction and artificial recharge in Shanghai, China. Hydrogeol. J. 2015, 23, 1851–1866. [Google Scholar] [CrossRef]
- Wang, G.Y.; Zhu, J.Q.; Zhang, D.; Wu, J.Q.; Yu, J.; Gong, X.L.; Gou, F.G. Land subsidence and uplift related to groundwater extraction in Wuxi, China. Q. J. Eng. Geol. Hydrogeol. 2020, 53, 609–619. [Google Scholar] [CrossRef]
- Dang, V.K.; Doubre, C.; Weber, C.; Gourmelen, N.; Masson, F. Recent land subsidence caused by the rapid urban development in the Hanoi region (Vietnam) using ALOS InSAR data. Nat. Hazards Earth Syst. Sci. 2014, 14, 657–674. [Google Scholar] [CrossRef]
- Nguyen, Q.T. The Main Causes of Land Subsidence in Ho Chi Minh City. Procedia Eng. 2016, 142, 334–341. [Google Scholar] [CrossRef]
- Dang, A.T.N.; Kumar, L. Application of remote sensing and GIS-based hydrological modelling for flood risk analysis: A case study of District 8, Ho Chi Minh city, Vietnam. Geomat. Nat. Hazards Risk 2017, 8, 1792–1811. [Google Scholar] [CrossRef]
- Church, J.; Clark, P.; Cazenave, A.; Gregory, J.; Jevrejeva, S.; Levermann, A.; Merrifield, M.; Milne, G.; Nerem, R.; Nunn, P.; et al. Sea Level Change. In Climate Change 2013: The Physical Science Basis; Stocker, T.F., Qin, D., Plattner, G.-K., Tignor, M., Allen, S.K., Boschung, J., Nauels, A., Xia, Y., Bex, V., Midgley, P.M., Eds.; Contribution of Working Group I to the Fifth, Assessment Report of the Intergovernmental Panel on Climate Change; Cambridge University Press: Cambridge, UK, 2013. [Google Scholar]


| Previous Study | Data or Technique | Subsidence Rates |
|---|---|---|
| Nguyen (2016) | – | Avg: 10 mm/yr |
| Minh et al. (2015) | ALOS PSI from 2006 to 2010 | Avg: 10 mm/yr |
| Erban et al. (2014) | ALOS InSAR from 2006 to 2010 | Max: 4 cm/yr in HCMC |
| Trung & Minh (2009) | ERS-1/2 PSI from 1996 to 2002 | Max: 11 mm/yr (No avg. displacement) |
| Sentinel-1 Data | Start Date | End Date | Primary Date |
|---|---|---|---|
| Ascending (×62) | 3 November 2017 | 24 October 201 | 10 October 2018 |
| Descending (×62) | 1 November 2017 | 22 October 2019 | 2 November 2018 |
Publisher’s Note: MDPI stays neutral with regard to jurisdictional claims in published maps and institutional affiliations. |
© 2020 by the authors. Licensee MDPI, Basel, Switzerland. This article is an open access article distributed under the terms and conditions of the Creative Commons Attribution (CC BY) license (http://creativecommons.org/licenses/by/4.0/).
Share and Cite
Duffy, C.E.; Braun, A.; Hochschild, V. Surface Subsidence in Urbanized Coastal Areas: PSI Methods Based on Sentinel-1 for Ho Chi Minh City. Remote Sens. 2020, 12, 4130. https://doi.org/10.3390/rs12244130
Duffy CE, Braun A, Hochschild V. Surface Subsidence in Urbanized Coastal Areas: PSI Methods Based on Sentinel-1 for Ho Chi Minh City. Remote Sensing. 2020; 12(24):4130. https://doi.org/10.3390/rs12244130
Chicago/Turabian StyleDuffy, C. Elizabeth, Andreas Braun, and Volker Hochschild. 2020. "Surface Subsidence in Urbanized Coastal Areas: PSI Methods Based on Sentinel-1 for Ho Chi Minh City" Remote Sensing 12, no. 24: 4130. https://doi.org/10.3390/rs12244130
APA StyleDuffy, C. E., Braun, A., & Hochschild, V. (2020). Surface Subsidence in Urbanized Coastal Areas: PSI Methods Based on Sentinel-1 for Ho Chi Minh City. Remote Sensing, 12(24), 4130. https://doi.org/10.3390/rs12244130