Article

Initial Assessment of the COSMIC-2/FORMOSAT-7 Neutral Atmosphere Data Quality in NESDIS/STAR Using In Situ and Satellite Data

1
Center for Satellite Applications & Research (STAR), NESDIS/NOAA, College Park, MD 20740, USA
2
Global Science & Technology, Inc., 7855 Walker Drive, Suite 200, Greenbelt, MD 20770, USA
3
Cooperative Institute for Satellite Earth System Studies (CISESS), Earth System Science, Interdisciplinary Center, University of Maryland, College Park, MD 20740, USA
4
National Weather Service, National Centers for Environmental Prediction (NCEP), NOAA, 1325 East West Highway, Silver Spring, MD 20910, USA
5
Office of Project, Planning, and Analysis, NOAA, Suite 6200 (6th Floor), 1335 East West Highway, Silver Spring, MD 20910, USA
*
Author to whom correspondence should be addressed.
Remote Sens. 2020, 12(24), 4099; https://doi.org/10.3390/rs12244099
Submission received: 10 October 2020 / Revised: 25 November 2020 / Accepted: 7 December 2020 / Published: 15 December 2020
(This article belongs to the Section Atmospheric Remote Sensing)

Abstract

:
A COSMIC-1/FORMOSAT-3 (Constellation Observing System for Meteorology, Ionosphere, and Climate-1 and Formosa Satellite Mission 3) follow-on mission, COSMIC-2/FORMOSAT-7, had been successfully launched into low-inclination orbits on 25 June 2019. COSMIC-2 has a significantly increased Signal-to-Noise ratio (SNR) compared to other Radio Occultation (RO) missions. This study summarized the initial assessment of COSMIC-2 data quality conducted by the NOAA (National Oceanic and Atmospheric Administration) Center for Satellite Applications and Research (STAR). We use validated data from other RO missions to quantify the stability of COSMIC-2. In addition, we use the Vaisala RS41 radiosonde observations to assess the accuracy and uncertainty of the COSMIC-2 neutral atmospheric profiles. RS41 is currently the most accurate radiosonde observation system. The COSMIC-2 SNR ranges from 200 v/v to about 2800 v/v. To see if the high SNR COSMIC-2 signals lead to better retrieval results, we separate the COSMIC-2–RS41 comparisons into different SNR groups (i.e., 0–500 v/v group, 500–1000 v/v group, 1000–1500 v/v group, 1500–2000 v/v group, and >2000 v/v group). In general, the COSMIC-2 data quality in terms of stability, precision, accuracy, and uncertainty of the accuracy is very compatible with those from COSMIC-1. Results show that the mean COSMIC-2–RS41 water vapor difference from surface to 5 km altitude for each SNR groups are equal to −1.34 g/kg (0–500 v/v), −1.17 g/kg (500–1000 v/v), −1.33 g/kg (1000–1500 v/v), −0.93 g/kg (1500–2000 v/v), and −1.52 g/kg (>2000 v/v). Except for the >2000 v/v group, the high SNR measurements from COSMIC-2 seem to improve the mean water vapor difference for the higher SNR group slightly (especially for the 1500–2000 v/v group) comparing with those from lower SNR groups.

1. Introduction

Since its launch in 2006, the Constellation Observing System for Meteorology, Ionosphere, and Climate (COSMIC) 1 mission and Formosa Satellite Mission 3 (COSMIC-1/FORMOSAT-3, hereafter COSMIC-1) has provided more than 7.0 million (as of the middle of 2019) global neutral atmospheric profiles in the lower stratosphere and troposphere [1]. With a six-satellite constellation in Low-Earth-Orbiting (LEO) satellites, COSMIC-1 occultations are of a uniform temporal coverage globally. Using the Global Positioning System (GPS) radio occultation (RO) technique, COSMIC data are of all-weather capability and high vertical resolution (~200–600 m, [2]). Studies have demonstrated that the high vertical resolution COSMIC-1 neutral atmospheric profiles, which are not very sensitive to clouds and precipitation [3], are very useful for studying atmospheric processes [4,5,6,7]. Almost all global operational numerical weather prediction (NWP) centers showed significant impacts on the global weather forecast when they started to assimilate COSMIC data into their forecast systems ([8,9,10,11,12,13,14,15]). Ref. [16,17] and ref. [1] have summarized the accomplishment of the COSMIC-1 mission for atmospheric studies, NWP, climate, and space weather since 2006.
After passing its planned lifetime, the number of COSMIC-1 neutral atmospheric profiles has decreased to less than 300 per day since the middle of 2019 [1]. To continue providing highly accurate neutral atmospheric profiles for atmospheric researches and NWP, a COSMIC follow-up mission, COSMIC-2/Formosa Satellite Mission 7 (COSMIC-2/FORMSAT-7, COSMIC-2 hereafter), was launched on 25 June 2019. COSMIC-2 is also a-six satellite constellation mission. COSMIC-2 is equipped with the advanced TriG (Global Positioning System—GPS, GALILEO, and GLObal NAvigation Satellite System—GLONASS) GNSS (Global Navigation Satellite System) RO Receiver System (TGRS). TGRS is with beam steering and beamforming capability to improve the gain and signal quality. The secondary payloads are an ion velocity meter and Radio Frequency beacon transmitter, mainly for space weather detection. With a 24-degree inclination orbit at 720 km altitude, COSMIC-2 occultations primarily distribute from 45° N and 45° S. COSMIC-2 has provided at least 4000 high quality atmospheric and ionospheric profiles per day since it launched.
COSMIC-2 is an international and inter-agency RO mission. The NOAA (National Oceanic and Atmospheric Administration) is the lead U.S. agency partnering with the U.S. Air Force (USAF), Taiwan’s National Space Organization (NSPO), and the University Corporation for Atmospheric Research (UCAR) for the COSMIC-2 satellite program. The UCAR COSMIC Data Archive Center (CDAAC) is the COSMIC-2 data processing center (DPC). The National Environmental Satellite, Data, and Information Service (NESDIS) Center for Satellite Applications and Research (STAR) is the COSMIC-2 validation and quality monitoring center in NOAA. STAR also processes COSMIC-2 data independently in a post-processing mode [18,19,20].
UCAR CDAAC has adapted the COSMIC data processing package to convert the COSMIC-2 phase delay into vertical profiles of bending angle, refractivity, temperature, and moisture. This COSMIC processing package has also been used to process not only COSMIC data but also RO data from Challenging Minisatellite Payload, Korea Multi-Purpose Satellite-5 (KOMPSAT-5), and Meteorological Operational Series (i.e., MetOp-A, -B, -C) Receiver for Atmospheric Sounding (GRAS). The inversion procedures include (i) precise orbit determination and clock synchronization to eliminate the effects of the geometric Doppler and relative transmitter–receiver oscillator drift, (ii) the procedure to convert Doppler to bending angle, (iii) the extrapolation of the ionospheric correction into the lower troposphere, necessary because of the influence of the ionosphere on measured phase delay of GPS signals, (iv) the initialization of the Abelian integral transform which converts atmospheric bending angles to profiles of refractivity, (v) variational algorithm to invert the refractivity profiles into the temperature and moisture profiles in the troposphere and lower stratosphere, and (vi) the quality control (QC) algorithm used to distinguish acceptable data from unacceptable data. The general descriptions of the CDAAC inversion procedures, including implementation methodologies, are detailed in [21,22,23]. This inversion package’s maturity has been extensively tested by numerous validation studies (also see [22,23]) using COSMIC data.
Ref. [1] has summarized the potential applications using COSMIC-2 for climate and NWP, and space weather. Before applying COSMIC-2 data for science studies and operational applications, it is critically important to carefully quantify COSMIC-2 data quality. This paper aims to assess (i) COSMIC-2 data characteristics in terms of their penetration, precision, and stability, and (ii) COSMIC-2 data quality in terms of accuracy and uncertainty of the accuracy for COSMIC-2 neutral atmospheric profiles.
This study will use the first few weeks of data to validate COSMIC-2 precision when six COSMIC-2 flight modules were close in time and locations. We will also use consistently processed GPS RO refractivity profiles from different RO missions, including COSMIC, KOMPSAT-5, MetOp-A, -B GRAS, and TerraSAR-X (TSX), to examine the stability of COSMIC-2. We will compare the precision and stability of COSMIC-2 to those of COSMIC.
To demonstrate the COSMIC-2 data quality, we will assess the accuracy of the COSMIC-2 bending angle, refractivity, temperature, and moisture profiles in this study. We will use Vaisala RS41 (fourth generation) radiosonde observation (RAOB) to quantify the quality of COSMIC-2 neutral atmospheric profiles. RS41 was introduced in the fall of 2013 to replace the RS92-SGP radiosondes. With an advanced measurement technology compared to those from RS92, RS41 radiosondes provide the most accurate atmospheric temperature, humidity, and pressure currently available with an improved precision ([24], also see Section 2.4). We will assess the accuracy and uncertainty of the COSMIC-2 temperature in the lower stratosphere, moisture in the troposphere, and refractivity profiles in the stratosphere and troposphere. The causes of errors in the specific inversion step listed above are not the focus of this study.
In this study, we also focus on investigating whether the high Signal-to-Noise ratio (SNR) from COSMIC-2 measurements will reduce retrieval errors. As shown in [1], one of the remaining challenges for using COSMIC (and other RO missions) is to detect and mitigate their negative refractivity biases owing to the super-refraction (SR) in the lower troposphere. Ref. [16] (see Figure 2 in [16]) depicts that the COSMIC-1 refractivity is biased negatively comparing with collocated European Centre for Medium-Range Weather Forecasts (ECMWF) global analysis. To improve the gain and signal quality, COSMIC-2 is with a significantly increased SNR compared to other RO missions. Figure 1 depicts the histograms of the normalized accumulation (in %) of L1 SNR, which is computed from the average SNR values from 60 km to 80 km geometric height range of the L1 signal. Figure 1 shows COSMIC-2 L1 SNR for both GPS and GLONASS. COSMIC-2 SNR ranges from 200 v/v to about 2800 v/v with a mean SNR of 1100 v/v for GLONASS and a mean SNR of 1250 v/v for GPS. The mean SNR for COSMIC is equal to 700 v/v. The mean L1 SNRs for both KOMPSAT-5 and MetOp-A, -B, -C GRAS are also equal to about 700 v/v (not shown). Here the COSMIC data are from the global, and the COSMIC-2 data are within 45° N and 45° S (see Section 2.1). The distribution of the SNR is not dependent on the latitude and longitude. To see whether the high SNR RO signals will lead to better retrieval results, we separate the COSMIC-2 neutral atmosphere retrievals into different SNR groups and quantify their quality for individual SNR groups.
In Section 2, we describe the COSMIC-2 data, data from other RO missions, and RS41 observations. We introduce the comparison approaches in Section 3. We quantify the COSMIC-2 penetration, precision, and stability in Section 4. We quantify the accuracy and uncertainty of COSMIC-2 refractivity, temperature, and water vapor profiles in Section 5. We conclude this paper in Section 6.

2. Data

2.1. COSMIC-2 Data Coverage

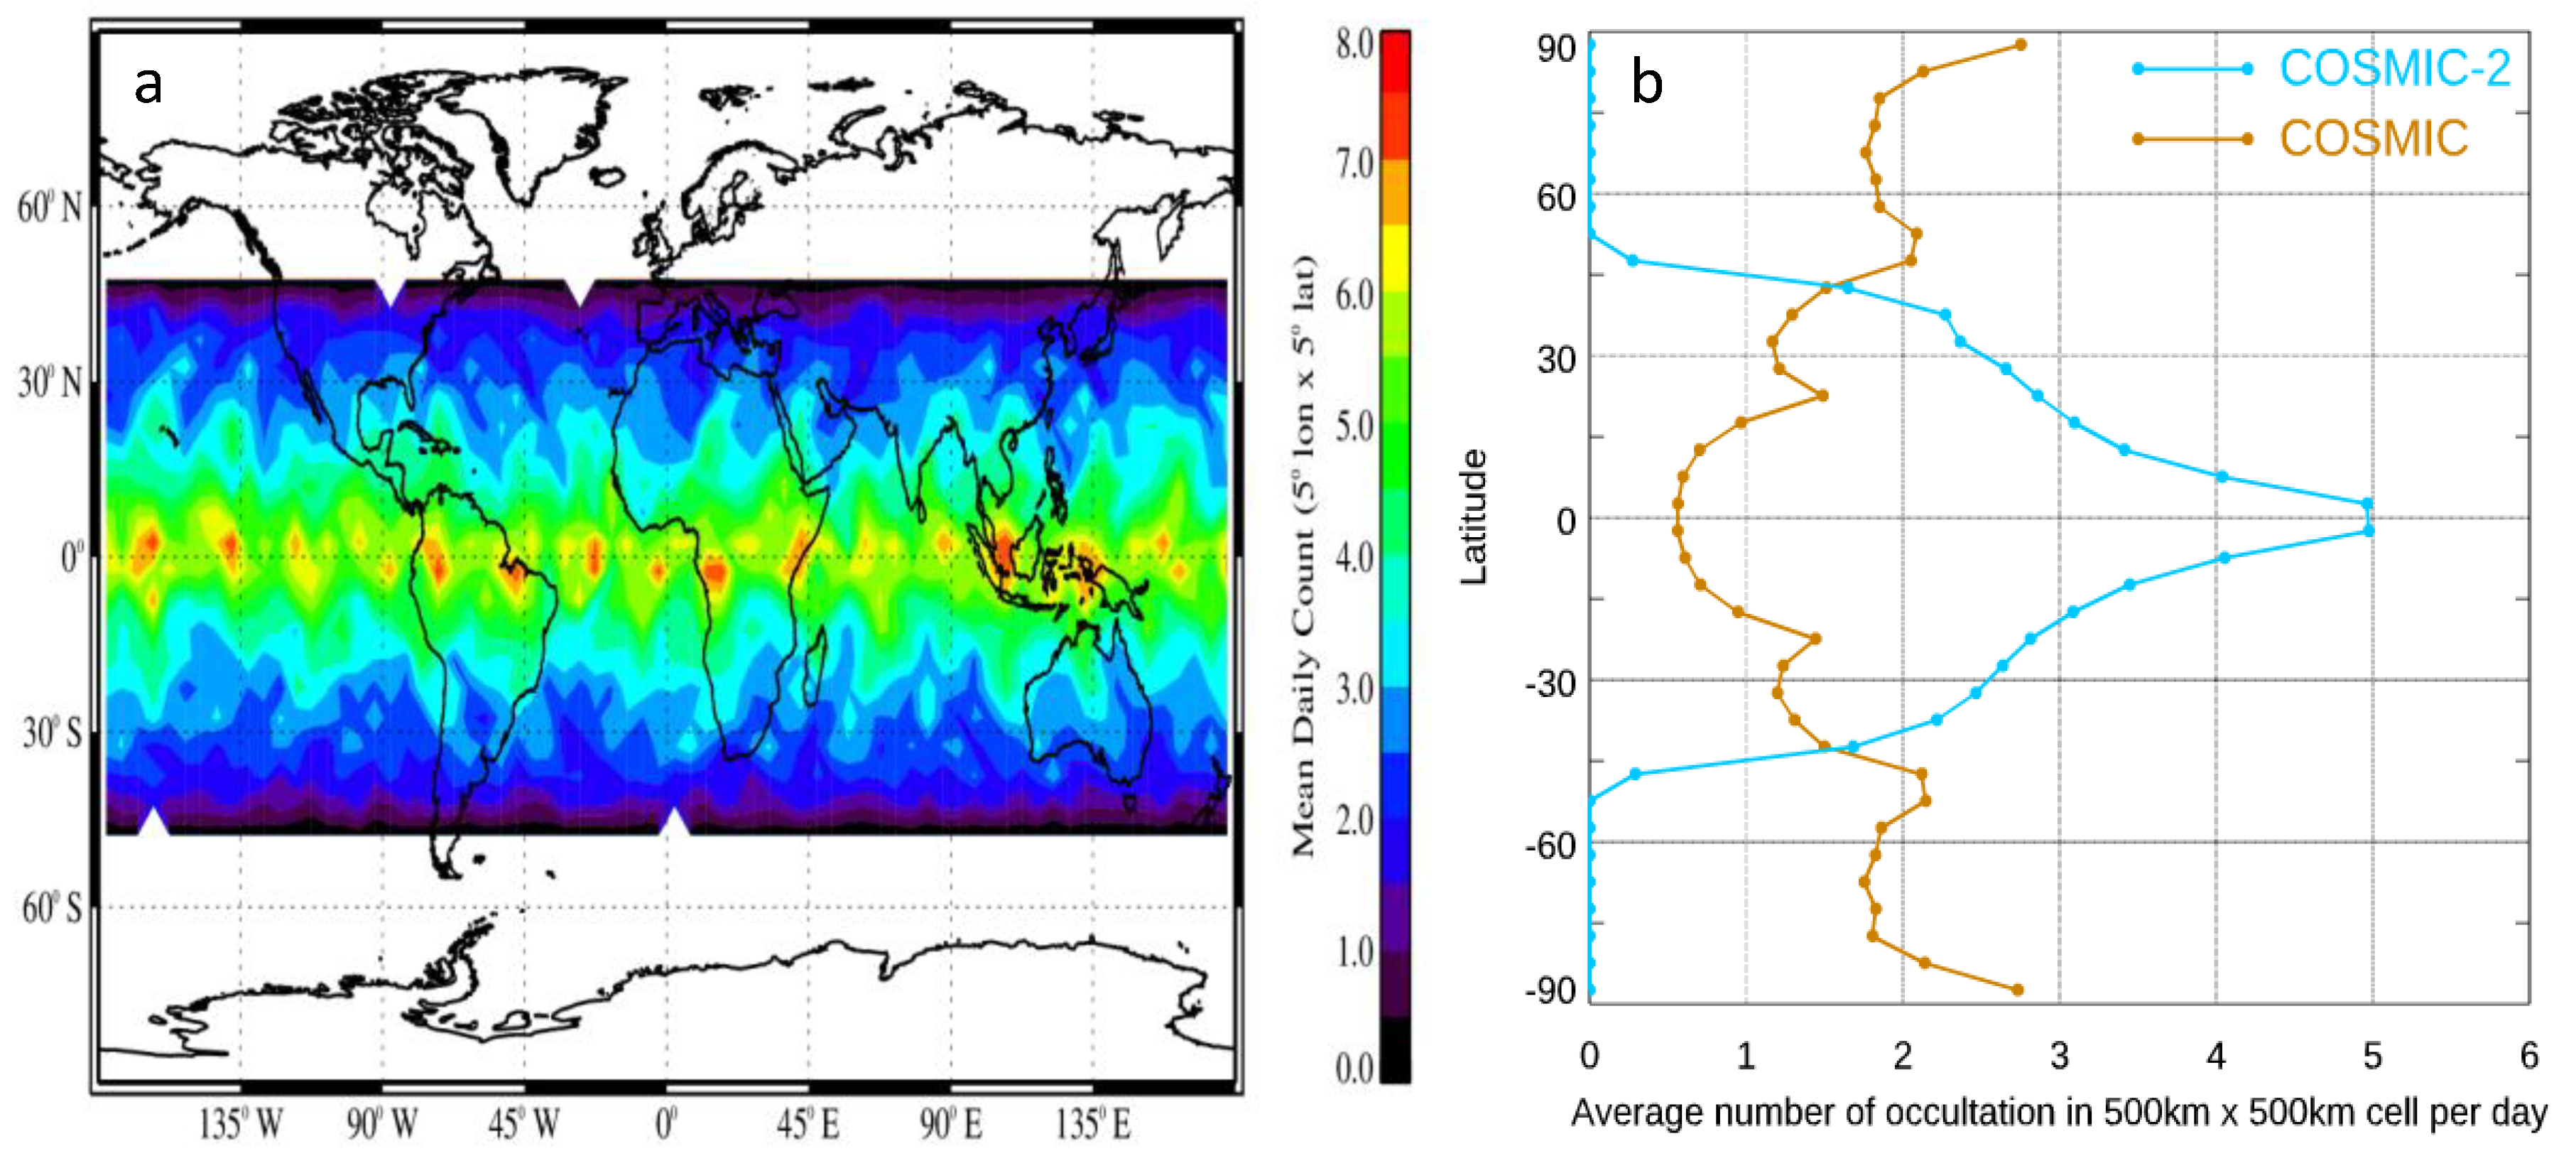
COSMIC-2 occultations mainly distribute from 45° N and 45° S. Figure 2a shows the daily average of each 500 × 500 km2 box of COSMIC-2 occultations using the data for October 2019. The colors represent the average number of occultations per day in each box. Figure 2a shows that most (more than 75%) COSMIC-2 data are within 30° N and 30° S, where it is also the region that contains a uniform local time coverage (not shown).
Figure 2b depicts the daily average of COSMIC-2 and COSMIC density distribution, made by constructing a 500 × 500 km2 box in the same latitude band. The plot shows that COSMIC-2 provides an average of about three to five soundings per day in each 500 × 500 km2 box latitude box in subtropics from 30° N to 30° S. [1] (see Figure 18 in Ref. [1]) shows that COSMIC-1 provides one sounding per day in each 500 × 500 km2 box over the mid-latitudes and about two soundings per day over higher-latitudes. Currently, COSMIC-2 tracks only GPS and GLONASS signals, which results in approximately 4000 occultation profiles on average from June 2019 till August 2020.

2.2. CDAAC COSMIC-2 Neutral Atmospheric Profiles

The CDAAC’s inversion package to invert the fundamental observable (time delay) for a RO occultation event is summarized in http://cdaac-www.cosmic.ucar.edu/cdaac/doc/documents/Sokolovskiy_newroam.pdf. The general descriptions of CDAAC inversion procedures are detailed in [21,22,23]. Table 1 from [22] details methodologies used in each of the CDAAC inversion procedures.
RO refractivity is a function for temperature and pressure in the stratosphere and temperature, moisture, and pressure in the troposphere [25,26], which can be formulated as
N = 77.6 P T + 3.73 × 10 5 e T 2
where P (in hPa) is pressure, T (in K) is temperature, and e (in hPa) is the water vapor pressure [27]. CDAAC used a one-dimensional variational approach (1D var, http://cdaac-www.cosmic.ucar.edu/cdaac/doc/documents/1dvar.pdf) to inverse refractivity to temperature, moisture, and pressure. The European Centre for Medium-Range Weather Forecasts interim (ERA-interim) reanalysis is used as a priori estimates [28]. We will use the 1D-var data products (wetPrf) for our comparisons.
Note that to ensure the 1D var water vapor retrievals are using the information primarily from the refractivity, but from the a priori, CDAAC used a very tight retrieval constraint where the residual refractivity (defined as refractivity computed from the final temperature and moisture minus the observed refractivity) are within the known observation errors. Because CDAAC COSMIC-2 wetPrf is only available before October 2019, we limited our comparisons to the same period in this study. CDAAC also provided another set of COSMIC-2 water vapor retrievals (i.e., wetPrf2, see [29]). Ref. [29] stated that to reduce the refractivity bias impact to the retrievals due to the possible SR condition, the wetPrf2 water vapor profiles may substantially fit the background (for example, the ECMWF) below 2 km. Because wetProf2 retrievals may use more information from the background in the lower troposphere, which is hard to quantify, we do not use wetProf 2 in this study.

2.3. RO Data from COSMIC, KOMPSAT 5, and MetOp-A,-B, -C GRAS, and TerraSAR-X

Using the GPS RO technique, the COSMIC measurements are traceable to the international standard of time, i.e., the SI second [1,22,23]. Ref. [1] has summarized the usefulness of high precision and highly accurate COSMIC data for climate monitoring. Here we used neutral atmospheric variables derived from multiple RO missions, including COSMIC, KOMPSAT-5, and MetOp-A GRAS, and TSX, also processed by CDAAC, to validate the stability of COSMIC-2. The inversion approaches to process COSMIC version 2013.3520, KOMPSAT-5, and MetOp-A,-B GRAS, and TSX data are very similar to the inversion algorithm to process COSMIC-2 data. The descriptions of CDAAC inversion procedures for all these RO missions are also described in [21,22,23].
The data quality of these RO missions (except for COSMIC-2), including precision, stability, and structural uncertainty owing to inversion implementations, has been intensively validated in previous studies (i.e., [30,31,32]). All the RO data, including COSMIC-2 data, are downloaded from UCAR CDAAC (http://cosmic.cosmic.ucar.edu/cdaac/index.html). We used data from multiple RO missions from October 2019 to January 2020 to quantify the stability of COSMIC-2 observations.

2.4. Radiosonde Data

Globally there are 18 types of radiosondes where the uncertainty and accuracy vary with different sensor types ([32], Figure 1). Studies have shown that the quality of radiosonde temperature and moisture sensors change with environmental conditions [33,34,35]. The RAOB temperature measurements are profoundly affected by the solar radiation effect on sensors [32].
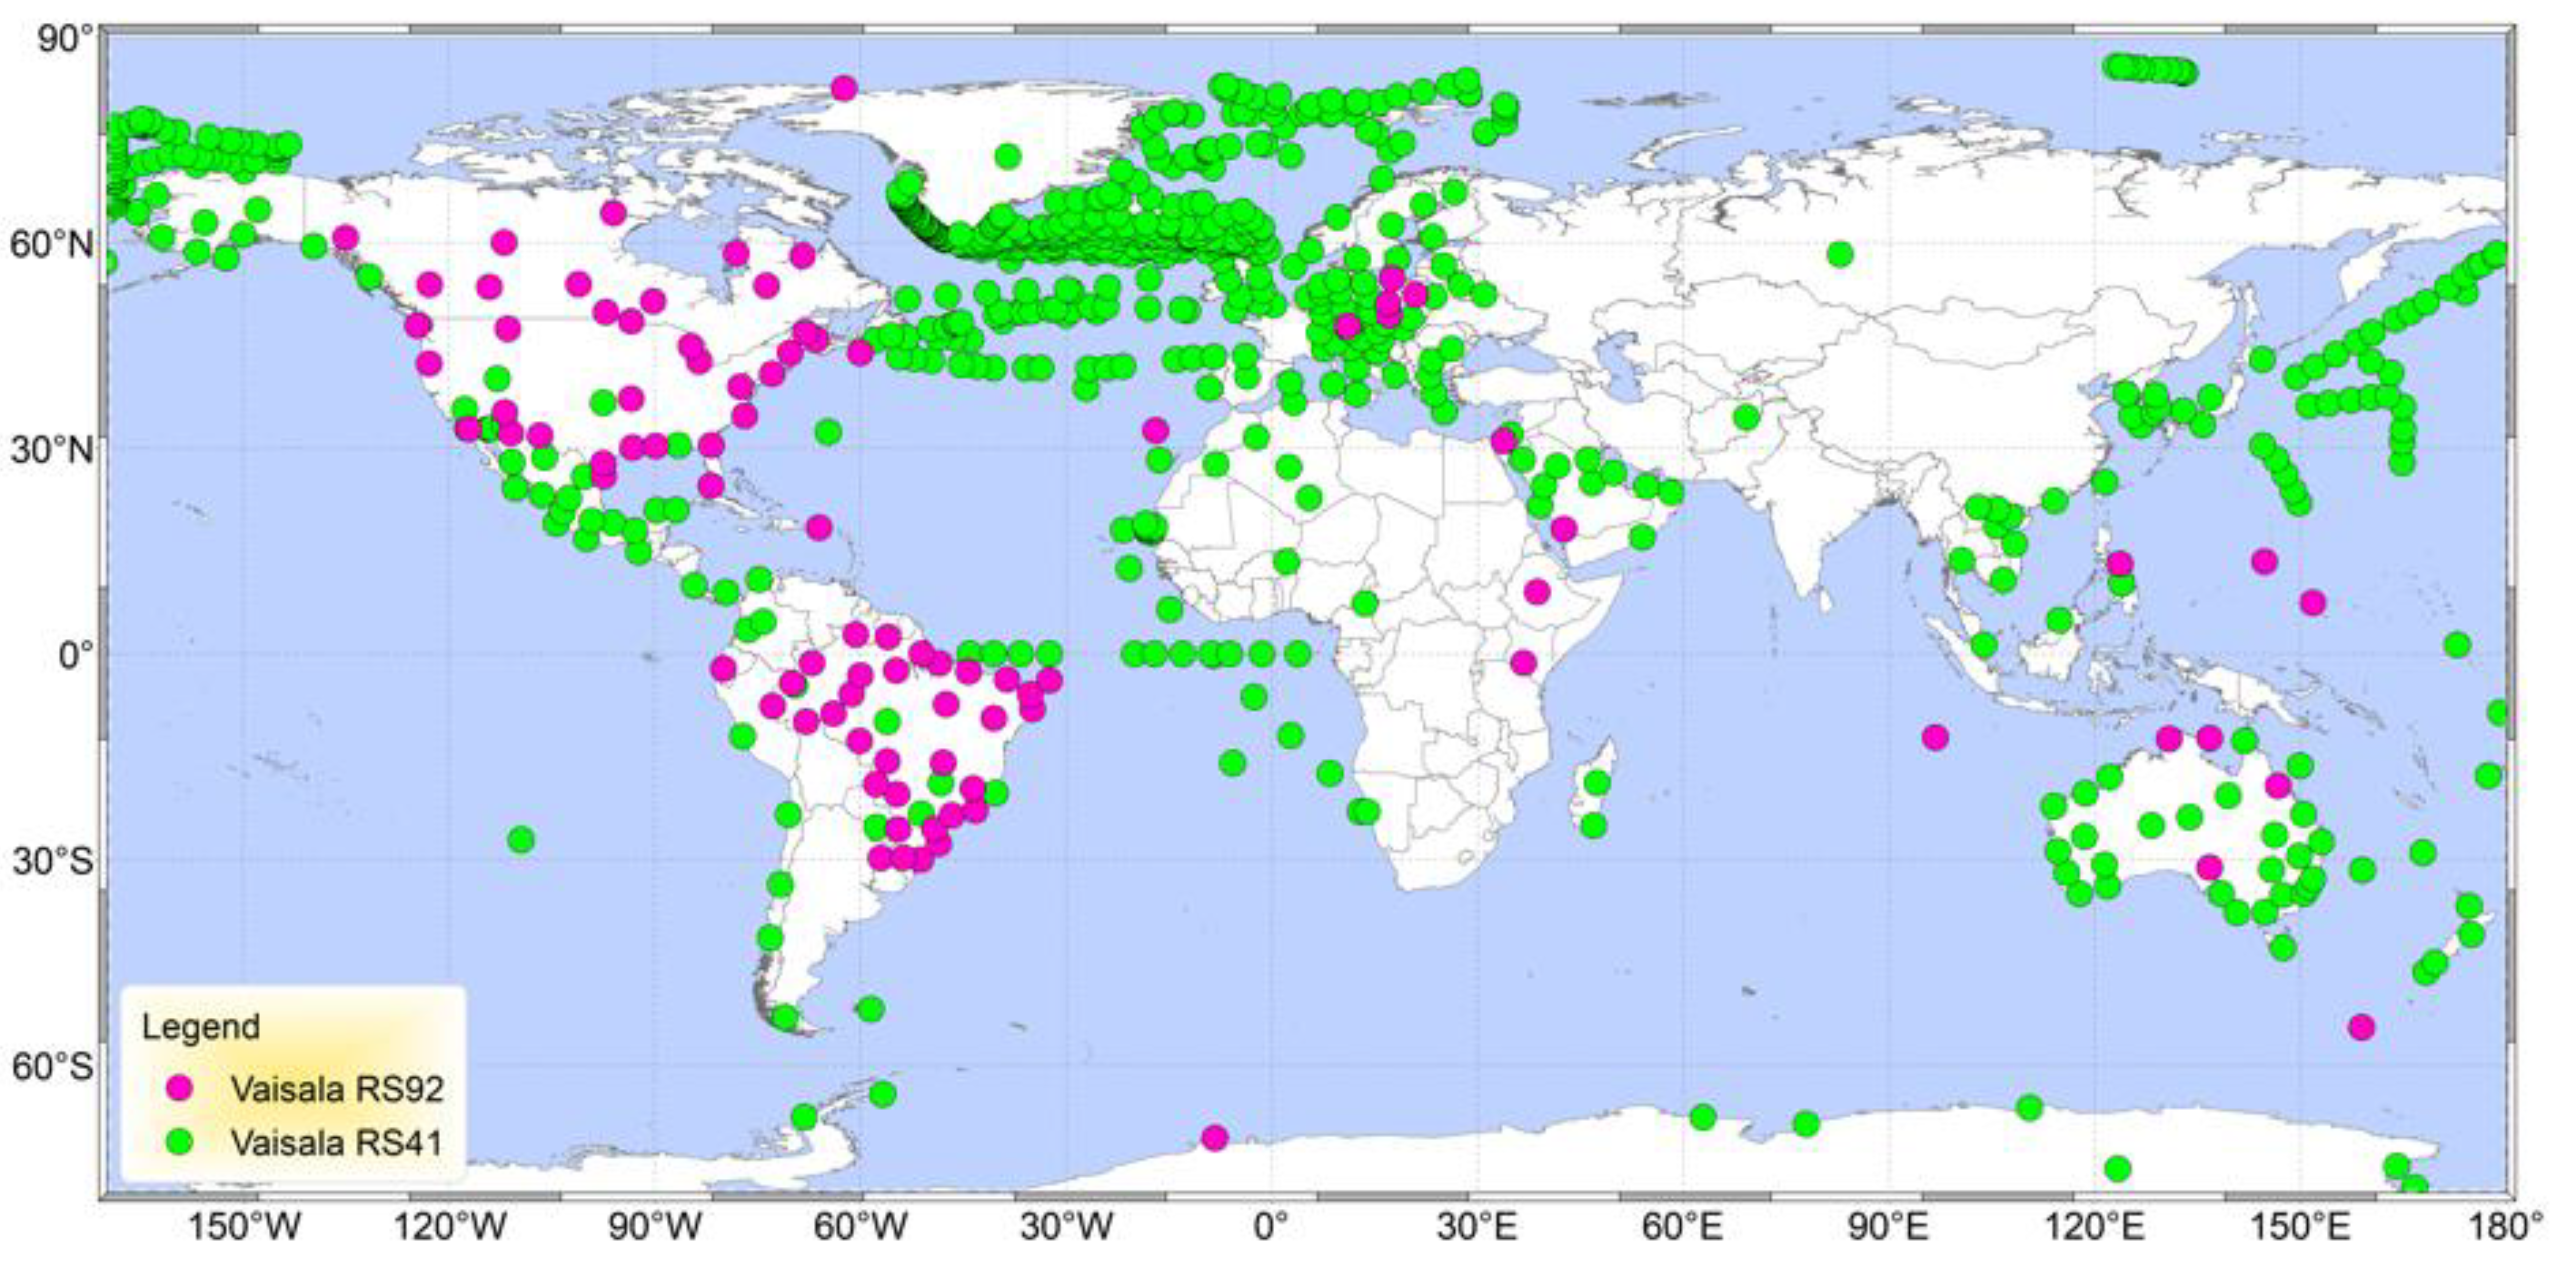
For the past two decades, Vaisala RS92 has provided the backbone temperature and moisture measurements for NWP and satellite validation. A new type of Vaisala radiosonde, RS41, equipped with advanced temperature and humidity sensors, is replacing all RS92. The temperature measurement precision (defined as the uncertainty of accuracy) of RS41 in the lower stratosphere (above 100 hPa) is within 0.15 K, where that for RS92 is within 0.2 K. Below 100 hPa, the precision of RS41 temperature is within 0.3 K, where that of RS92 is within 0.5 K (see Table 2 in [24]). Several inter-comparison campaigns have been undertaken in various atmospheric conditions [35,36]. The mean differences between RS41 and RS92 humidity are within 2% at high latitude and within 1–3% in tropical nights [36]. However, the RS92 has an obvious 0.1 K temperature bias above 100 hPa and humidity biases below 100 hPa at some atmospheric conditions [36]. We downloaded the radiosonde data from the NCAR data archive (http://rda.ucar.edu/datasets/ds351.0). Figure 3 depicts the geophysical locations for RS41 and RS92 data from June 2019 to October 2019. Most of the radiosonde data are collected twice per day.

3. Approaches for Quantifying the Precision, Stability, Accuracy, and Uncertainty of COSMIC-2 Data

Like [32], we first collect all available RS41 measurements within 300 km and 2 h with the locations and time of COSMIC-2 data. The COSMIC-2 geo-location is defined at the tangent point from 4 km to 5 km altitudes. If there is more than one RS41 profile within 2 h and 300 km of one COSMIC-2 profile, the closest RS41 in location is selected. We use the hydrostatic equation to convert the RAOB pressure level to the geometric height. Then we interpolate the COSMIC-2 data to the radiosondes’ geometric height at radiosondes’ mandatory pressure level (i.e., surface, 850, 700, 500, 200, 150, 100, 50, and 20 hPa).
As shown in Figure 1, COSMIC-2 SNR ranges from 200 v/v to 2800 v/v which covers the SNR range for other RO missions (i.e., COSMIC, KOMPSAT-5, etc.). In this study, COSMIC-2 profiles are grouped into five SNR ranges: (i) SNR < 500 v/v (i.e., 0–500 v/v group), (ii) 500 v/v ≤ SNR < 1000 v/v (i.e., 500–1000 v/v group), (iii) 1000 v/v ≤ SNR < 1500 v/v (i.e., 1000–1500 v/v group), (iv) 1500 v/v ≤ SNR < 2000 v/v (i.e., 1500–2000 v/v group), and (v) 2000 v/v ≤ SNR (i.e., >2000 v/v group). The mean COSMIC SNR falls into the 500–1000 v/v group where the mean COSMIC-2 SNR falls into the 1000–1500 v/v group.
The refractivity, temperature, and water vapor differences between COSMIC-2 and the corresponding RS41 pairs in the same pressure level i are computed using the equation
Δ Y ( i , j ) = ( 1 n ) × k = 1 k = n { Y R O ( i , j , k ) Y ( i , j , k ) }
k is the index for all the matched pairs collected at all the R41 stations, and j is the index of COSMIC-2 SNR groups. We computed the RS41 refractivity using Equation (1). We estimate the precision of COSMIC-2 from the co-planar observations collected from the first few weeks since the launch of COSMIC-2, where COSMIC-2 flight modules are close in time and locations. The non-coplanar data among COSMIC-2 and other RO missions within 2 h and 300 km are collected to estimate the stability of COSMIC-2.
Note that most of the data used in this study are collected from June to October 2019 (i.e., for penetration study and precision analysis) except that the RO–RO pairs are collected from October 2019 to January 2020 so that we can quantify the stability for at least four connective months. We limit our comparison for COSMIC-2 wetPro to those from the collocated RS41 data before 31 October 2019 since wetPro data are not available after October 2019.

4. Assessment of COSMIC-2 Penetration, Precision, and Stability

4.1. COSMIC-2 Penetration

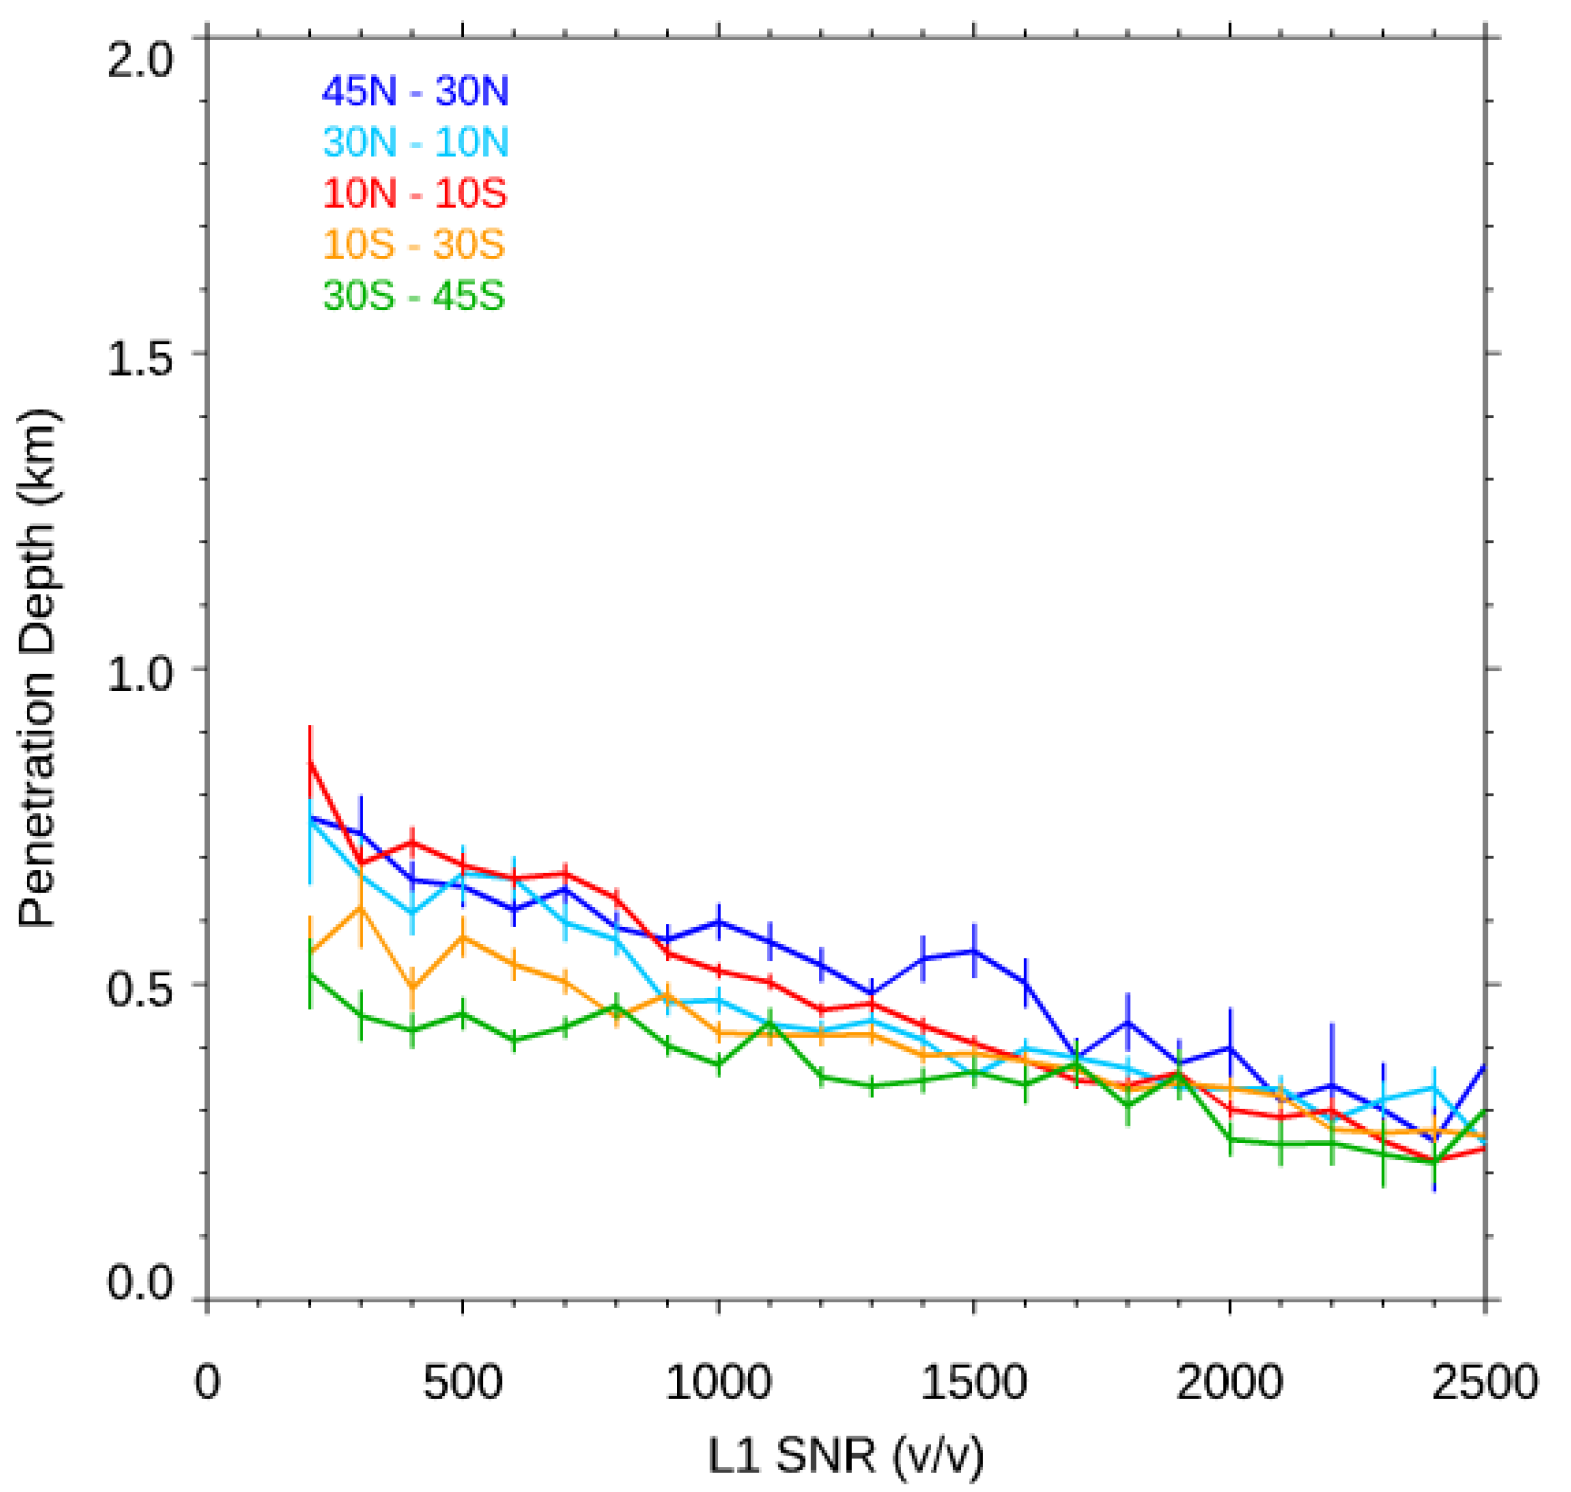
Two steps are performed to define the COSMIC-2 penetration depth. In RO inversion procedures, the retrieval uncertainties at each vertical level are estimated first. The retrieval uncertainties may be large under the conditions of large tracking errors for low SNR signals [37], insufficient tracking depth [38], and under the presence of super-refraction (SR) over oceans [39]. Then, during the inversion procedures, the retrieval stops at a height when significant retrieval uncertainties occur. In this study, the COSMIC-2 penetration depth is defined as the lowest mean sea level height with valid refractivity from UCAR processed atmospheric profiles (atmPrf). Ref. [40] showed that with a better tracking system and higher SNR signals, COSMIC-2 data penetrate lower than other RO missions. We further examine how the penetration depth varies with the atmosphere moisture distribution, which is usually a function of latitude. Figure 4 depicts the COSMIC-2 penetration depth over mid-latitude in North Hemisphere (45° N–30° N and 30° N–10° N), tropical region (10° N–10° S), and mid-latitude Southern Hemisphere (10° S–30° S and 30° S–45° S) over oceans during the period from June to October 2019. The mean penetration height is computed from the average of 100 v/v intervals. We also calculate the standard error of the mean (SEM) and plot it in the vertical line superimposed to the mean. Figure 4 shows that, in general, COSMIC-2 occultations penetrate deeper with higher SNR over oceans. With a higher mean SNR than all other RO missions, more than 85% of COSMIC-2 data penetrate deeper than 1 km altitude. COSMIC-2 occultations penetrate deeper when the atmosphere is drier. The reason that the dark blue line (45° N–30° N) is higher than the red line (the tropical region, 10° N–10° S) is that during this period, the Intertropical Convergence Zone (ITCZ) moves to the Northern mid-latitude region (mid-latitude summer) in September and October, and the Northern mid-latitude region may be moister than that of the other area.
To compare COSMIC-2 penetration with different SNR groups and other RO missions, we also calculate the corresponding penetration heights for 80% accumulated sample number for individual COSMIC-2 SNR groups and those for COSMIC, KOMPSAT5, and MetOp series over the oceans (Table 1). Table 1 shows that with the improved SNR, the COSMIC-2 accumulated penetration depth for the >2000 v/v group is, in general, about 300 m to 900 m deeper than that for the 0–500 v/v group. More than 85% of COSMIC-2 data penetrate deeper than 1 km altitude, where about 80% of COSMIC penetrate deeper than that height [1]. Although MetOp Series also use open-loop tracking, the average penetration depth at 80% accumulated level is about at 3 km altitude (see Table 1). Note that the penetration depth for COSMIC is very close to that of the COSMIC-2 500–1000 v/v group. The mean COSMIC-2 penetration depths for different latitudinal zones are very close to those for the 1000–1500 v/v group.

4.2. COSMIC-2 Precision

Precision is a measure of the repeatability of the measurement when both instruments are viewing the same target. For climate study, the precision is defined as the mean difference of the collocated measurements [41,42]. COSMIC and CHAMP temperature precision is within 0.1 K in the lower stratosphere [16,42].
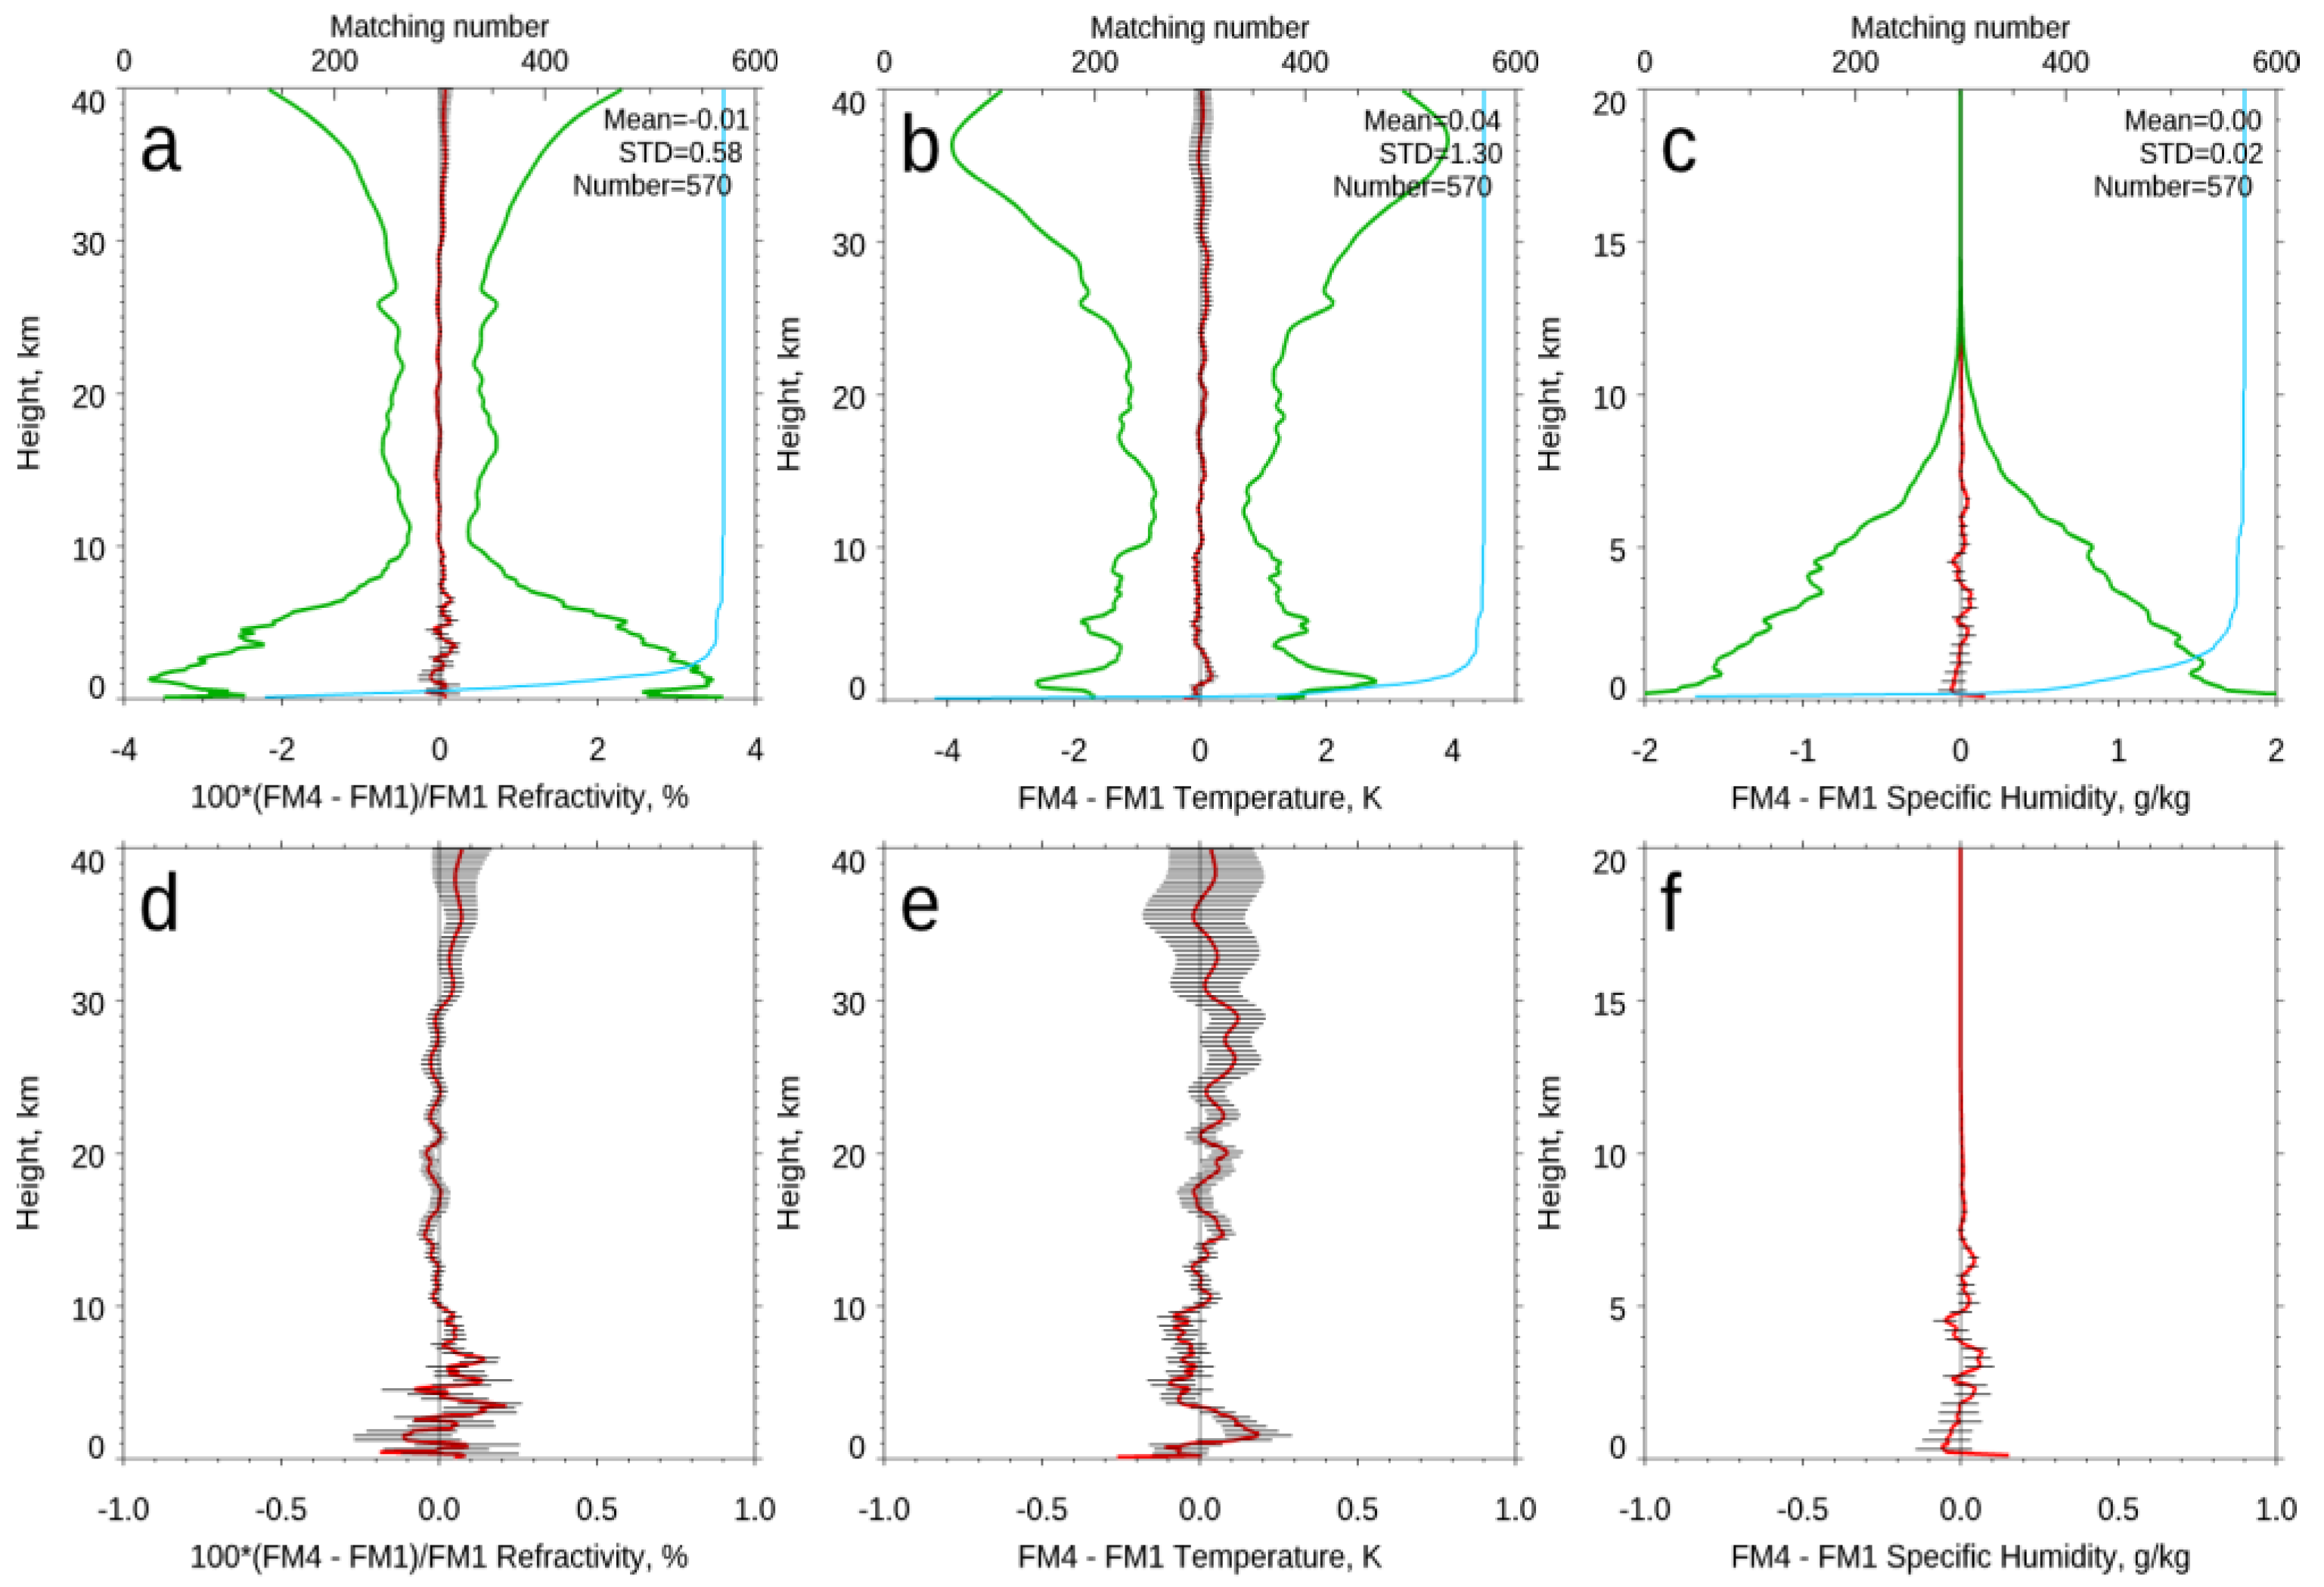
Figure 5a–c shows the mean difference of refractivity, dry temperature, and water vapor mixing ratio collected from DOY 211 through 300 of 2019 from COSMIC-2 Flight Module 4 (FM4) and FM1 receivers where they are within 1200s and a distance separation at the ray tangent point of about 300 km apart. Figure 5a–c show that the mean difference for FM4-FM1 fractional refractivity and dry temperature from surface to 40 km altitude, and for water vapor mixing ratio from the surface to 20 km, is equal to −0.01%, 0.04K, and 0 g/kg, respectively.
Figure 5d–f are the same as Figure 5a–b but on a smaller scale. The SEM at each vertical level is also computed and superimposed on the mean. COSMIC-2 fractional refractivity precision varies from −0.2% to 0.2% below 8 km and is within 0.1% between 8 km and 30 km altitude. The mean precision for COSMIC-2 temperature is within 0.2 K, between 8 km and 35 km. The precision for the COSMIC-2 water vapor mixing ratio is within 0.15 g/kg below 5 km. The variation of standard deviation (Figure 5a–c) may be associated with atmospheric change within 300 km apart, especially in the troposphere (from the surface to 10 km). The residual errors of ionospheric correction mainly cause an increase in the standard deviation above 25 km.
This result gives us confidence in the performance of the COSMIC-2 receiver. The precision for COSMIC-2 for temperature, water vapor, and refractivity are compatible with those from COSMIC, which are similar in magnitude to simulated errors presented by [43]. Note that the compared precision of any combination of COSMIC-2 receiver pairs is very close to that of the FM1-FM4 results (not shown).

4.3. Stability Estimate

With a SI-traceable global positioning system, RO is the only remote sensing technology that can provide long term stable measurements no matter how long it stays in orbit [44,45,46]. In this section, we compared UCAR consistently processed neutral atmospheric profiles from KOMPSAT-5 (launched in 2013), COSMIC (launched in 2006), TSX (launched in 2010), MetOp-A (launched in 2006), and MetOp-B (launched in 2012) to those collocated COSMIC-2 to quantify the stability of COSMIC-2 data.
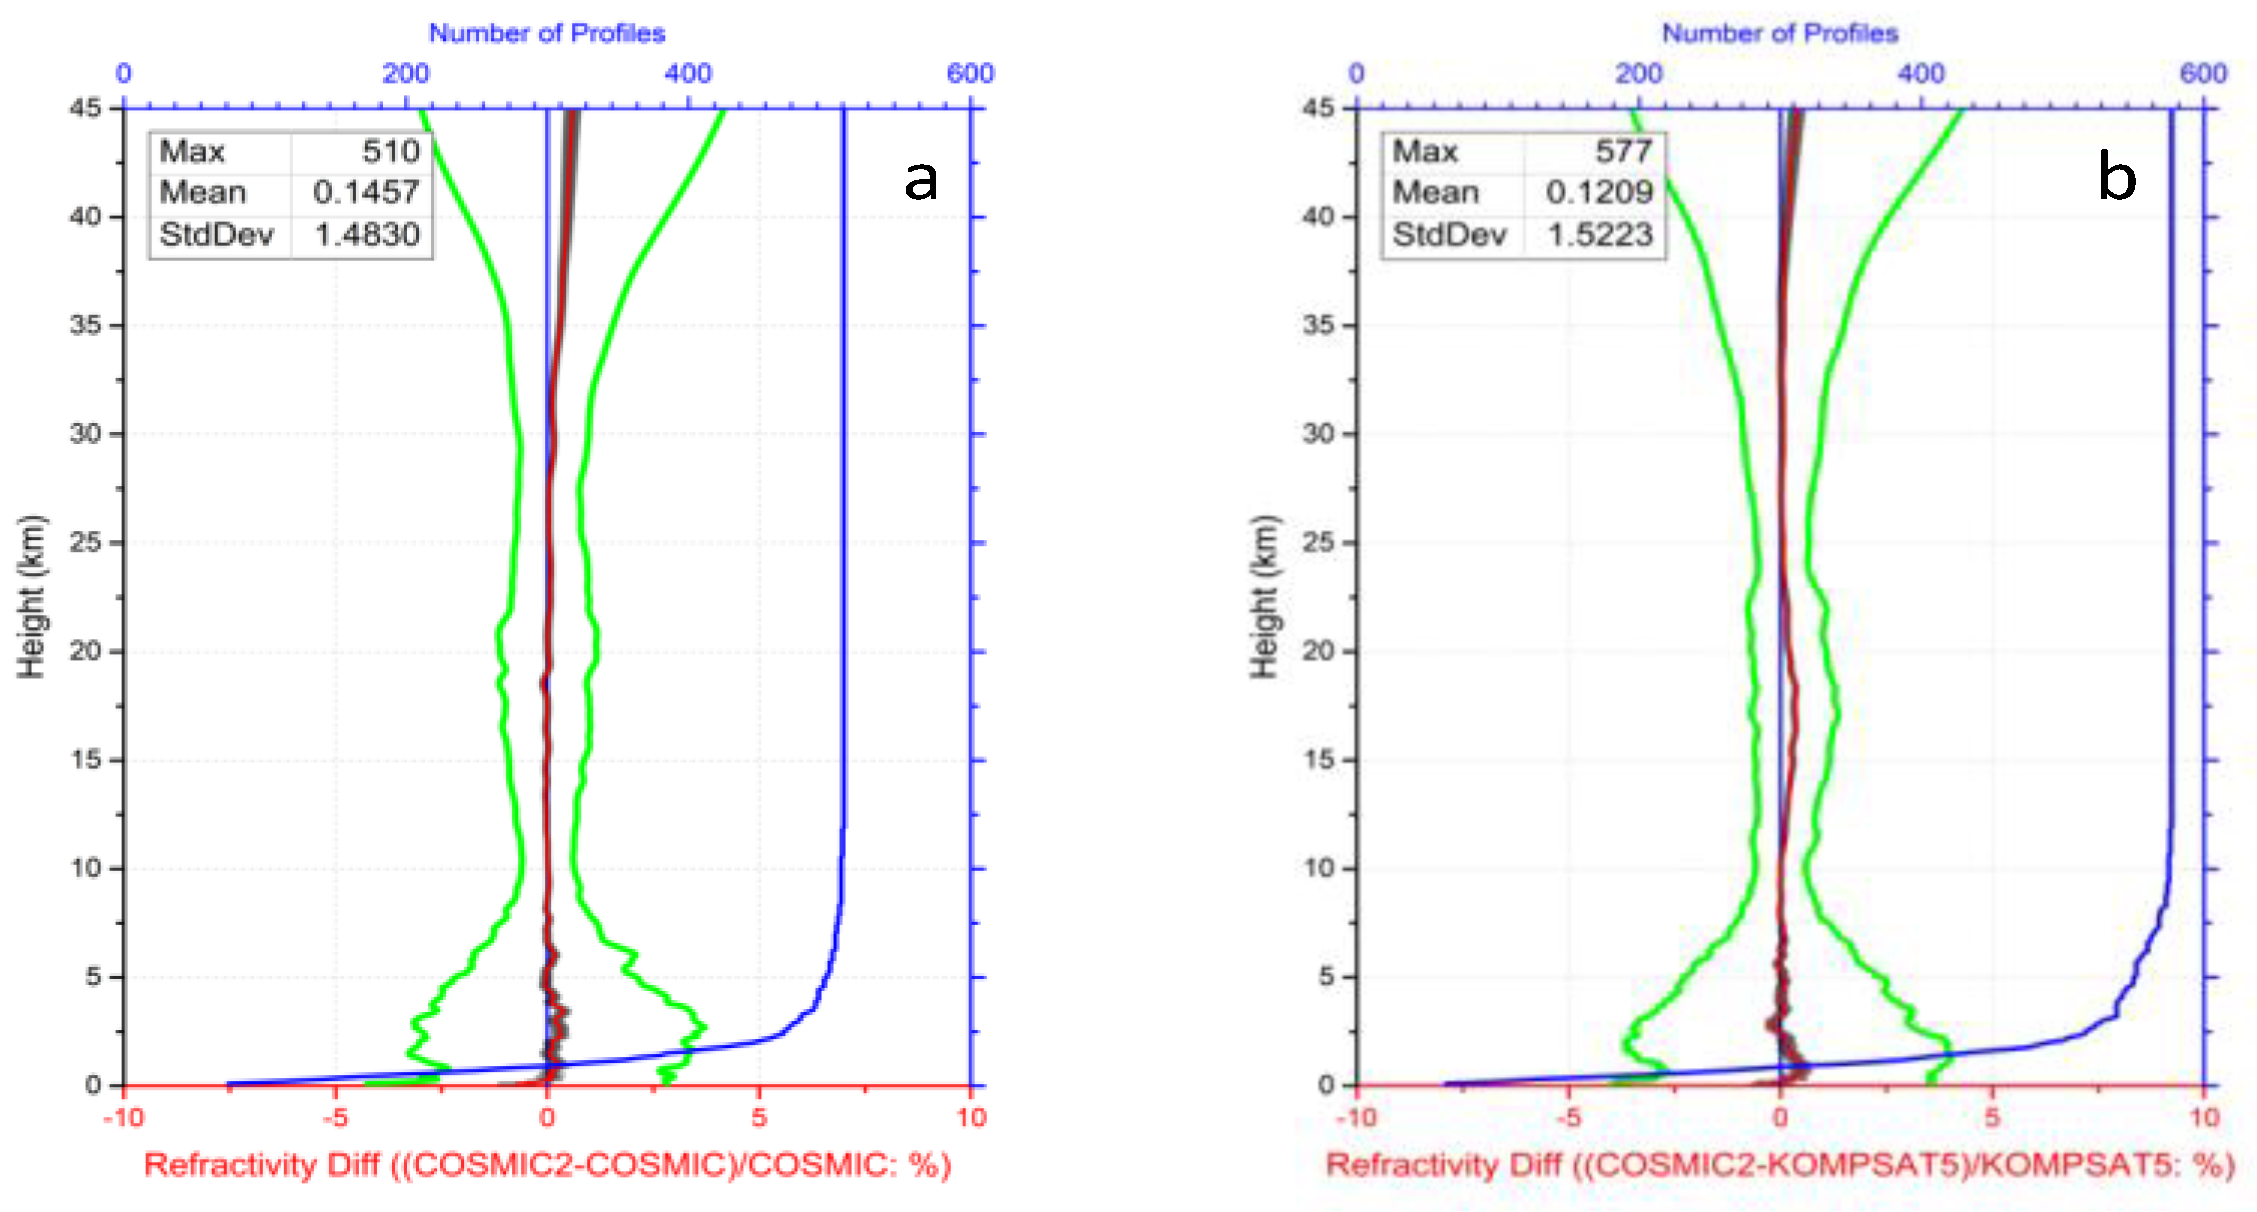
Figure 6a,b show the fractional refractivity comparisons for COSMIC-2–COSMIC pairs for October 2019 and COSMIC-2–KOMPSAT-5 pairs, respectively. Since only one COSMIC receiver (FM#1) is available in October 2019, the number of collocated COSMIC-2 and COSMIC pairs is limited. The RO–RO pairs are collected within 200 km at around 4 km altitude of the tangent point and 1.5 h apart within 45° N to 45° S. In total, we have around 500 collocation pairs in this comparison for COSMIC-2 and COSMIC collocated pairs and about the same number for COSMIC-2 and KOMPSAT-5 pairs. The mean difference is in the red line, and the standard deviation of the mean is in the green line. The SEM is in the horizontal black lines superimposed on the mean difference line. Figure 6a shows that although COSMIC has been in orbit since June 2006, where COSMIC-2 was in orbit for just four months, the mean fractional refractivity differences in the height ranging from 5 km to 35 km are all within the SEM.
The mean fractional refractivity difference between 5 km and 35 km ranges from −0.5% (at 5 km) to 0.4% (at 35 km), and their mean difference is about 0.15% from the surface to 45 km altitude. This result demonstrates that COSMIC data quality does not change after almost 14 years since the launch (stability of the data) and the consistent data quality between COSMIC-2 and COSMIC. Because the ray path for COSMIC and COSMIC-2 pairs may be of significantly different azimuth angles, the standard deviation (std) to the mean fractional refractivity differences is relatively large in the troposphere. The relatively large standard deviation above 30 km and the small difference from 35 km to 45 km (~0.5%) may be owing to RO retrieval uncertainty caused by residual ionospheric signals.
The comparison results between COSMIC-2 and KOMPSAT-5 pairs (Figure 6b) are similar to those from COSMIC-2 and COSMIC collocated pairs. The mean difference is equal to 0.12% from the surface to 40 km, with a std of 1.5%. Note that the small COSMIC-2–KOMPSAT-5 difference between 15 and 20 km altitudes (~0.3%) is mainly due to the COSMIC2 L2P tracking errors. CDAAC has fixed the errors in the latest products (personal communication).
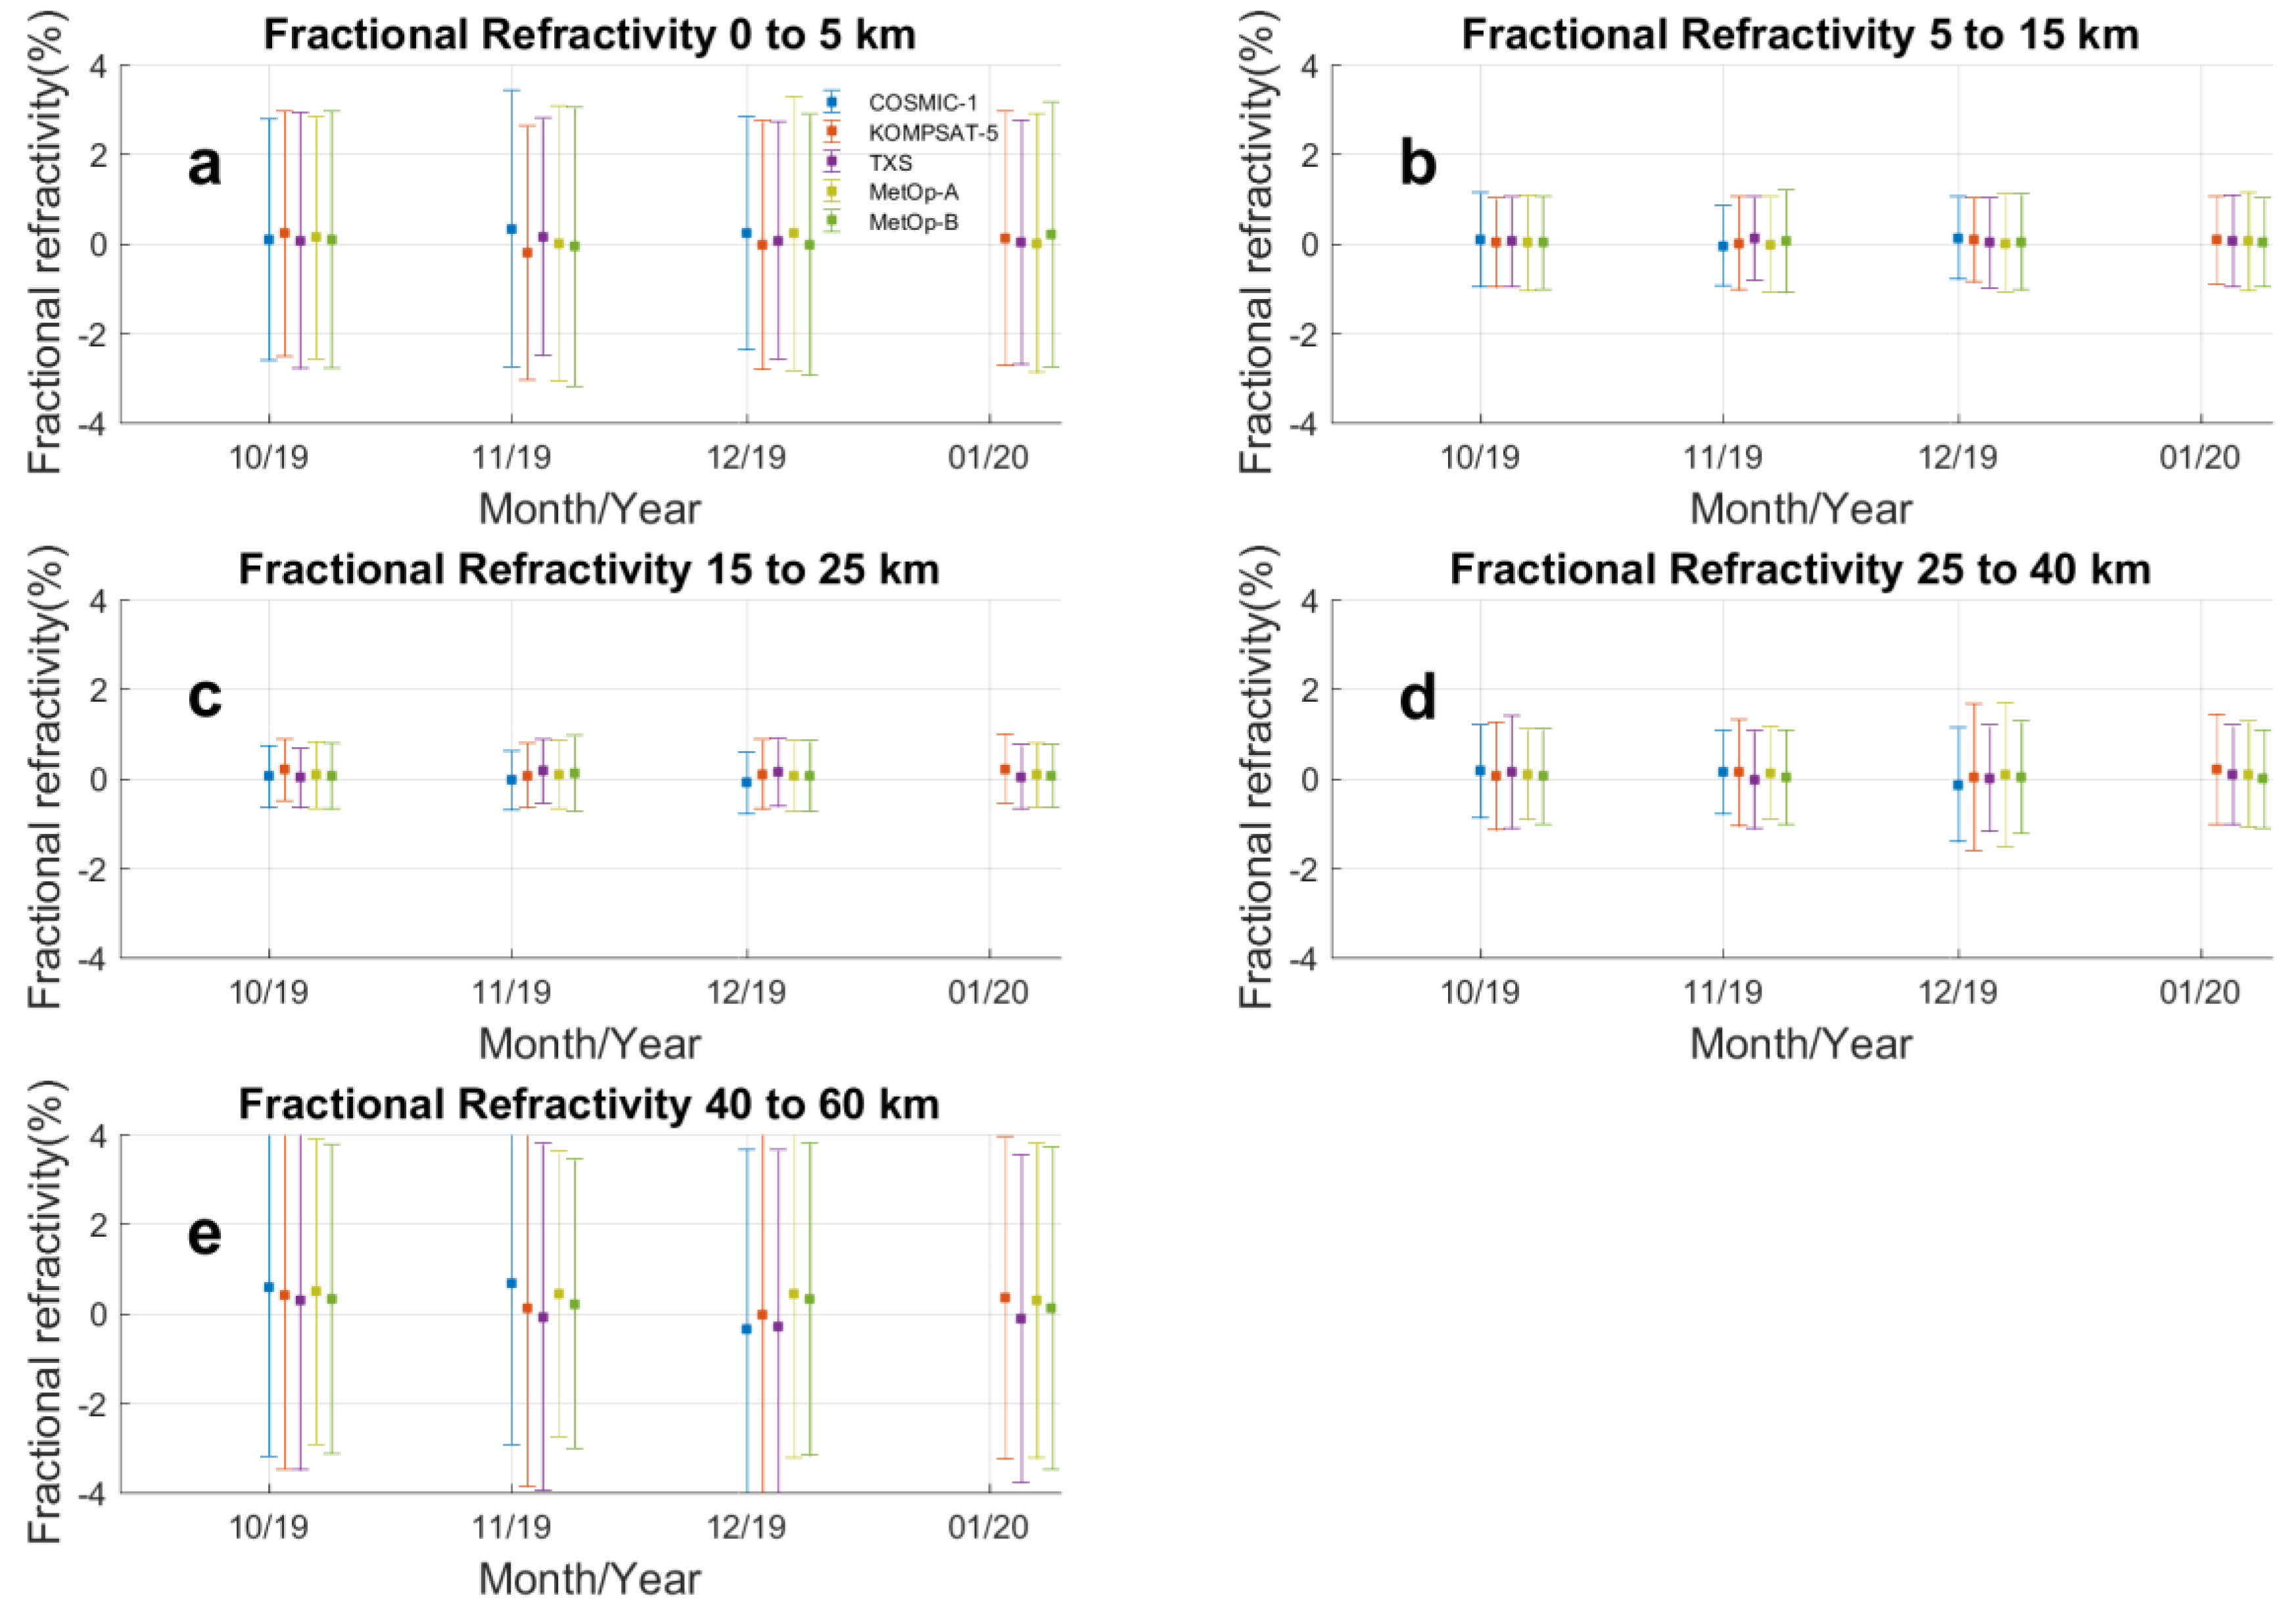
To further examine the stability of COSMIC-2 data since the launch, we compared COSMIC-2 data to all other available RO missions (i.e., COSMIC, KOMPSAT-5, TSX, MetOp-A, and -B GRAS) from October 2019 to January 2020. All the COSMIC-2–RO pairs are within 2 h and 300 km. Figure 7 shows the monthly fractional refractivity at five height regions, respectively. Note that there is no collocated COSMIC data in January 2020 since the number of COSMIC occultations decreases to about 100 at that month. Figure 7 shows that the largest fractional refractivity standard deviation occurs at the 0~5 km (Figure 7a) and 40~60 km (Figure 7e) regions. The mean fractional refractivity values are comparable at different height regions and between satellites. The largest standard deviation occurs at 0~5 km because of the considerable moisture variation. The uncertainty of ionosphere electron density mainly causes considerable refractivity retrieval uncertainty from 40 km to 60 km. Figure 7 demonstrates the stability of COSMIC-2 data with those RO missions over the lower troposphere and in the lower stratosphere below 40 km.

5. Accuracy and Uncertainty of COSMIC-2 Refractivity, Temperature, and Water Vapor Retrievals

In this study, we use RS41 measurements from June to October 2019 as references to quantify the accuracy and uncertainty of refractivity, temperature, and moisture profiles derived from COSMIC-2.

5.1. General Quality of COSMIC-2 Refractivity and Water Vapor Profiles in the Lower Troposphere

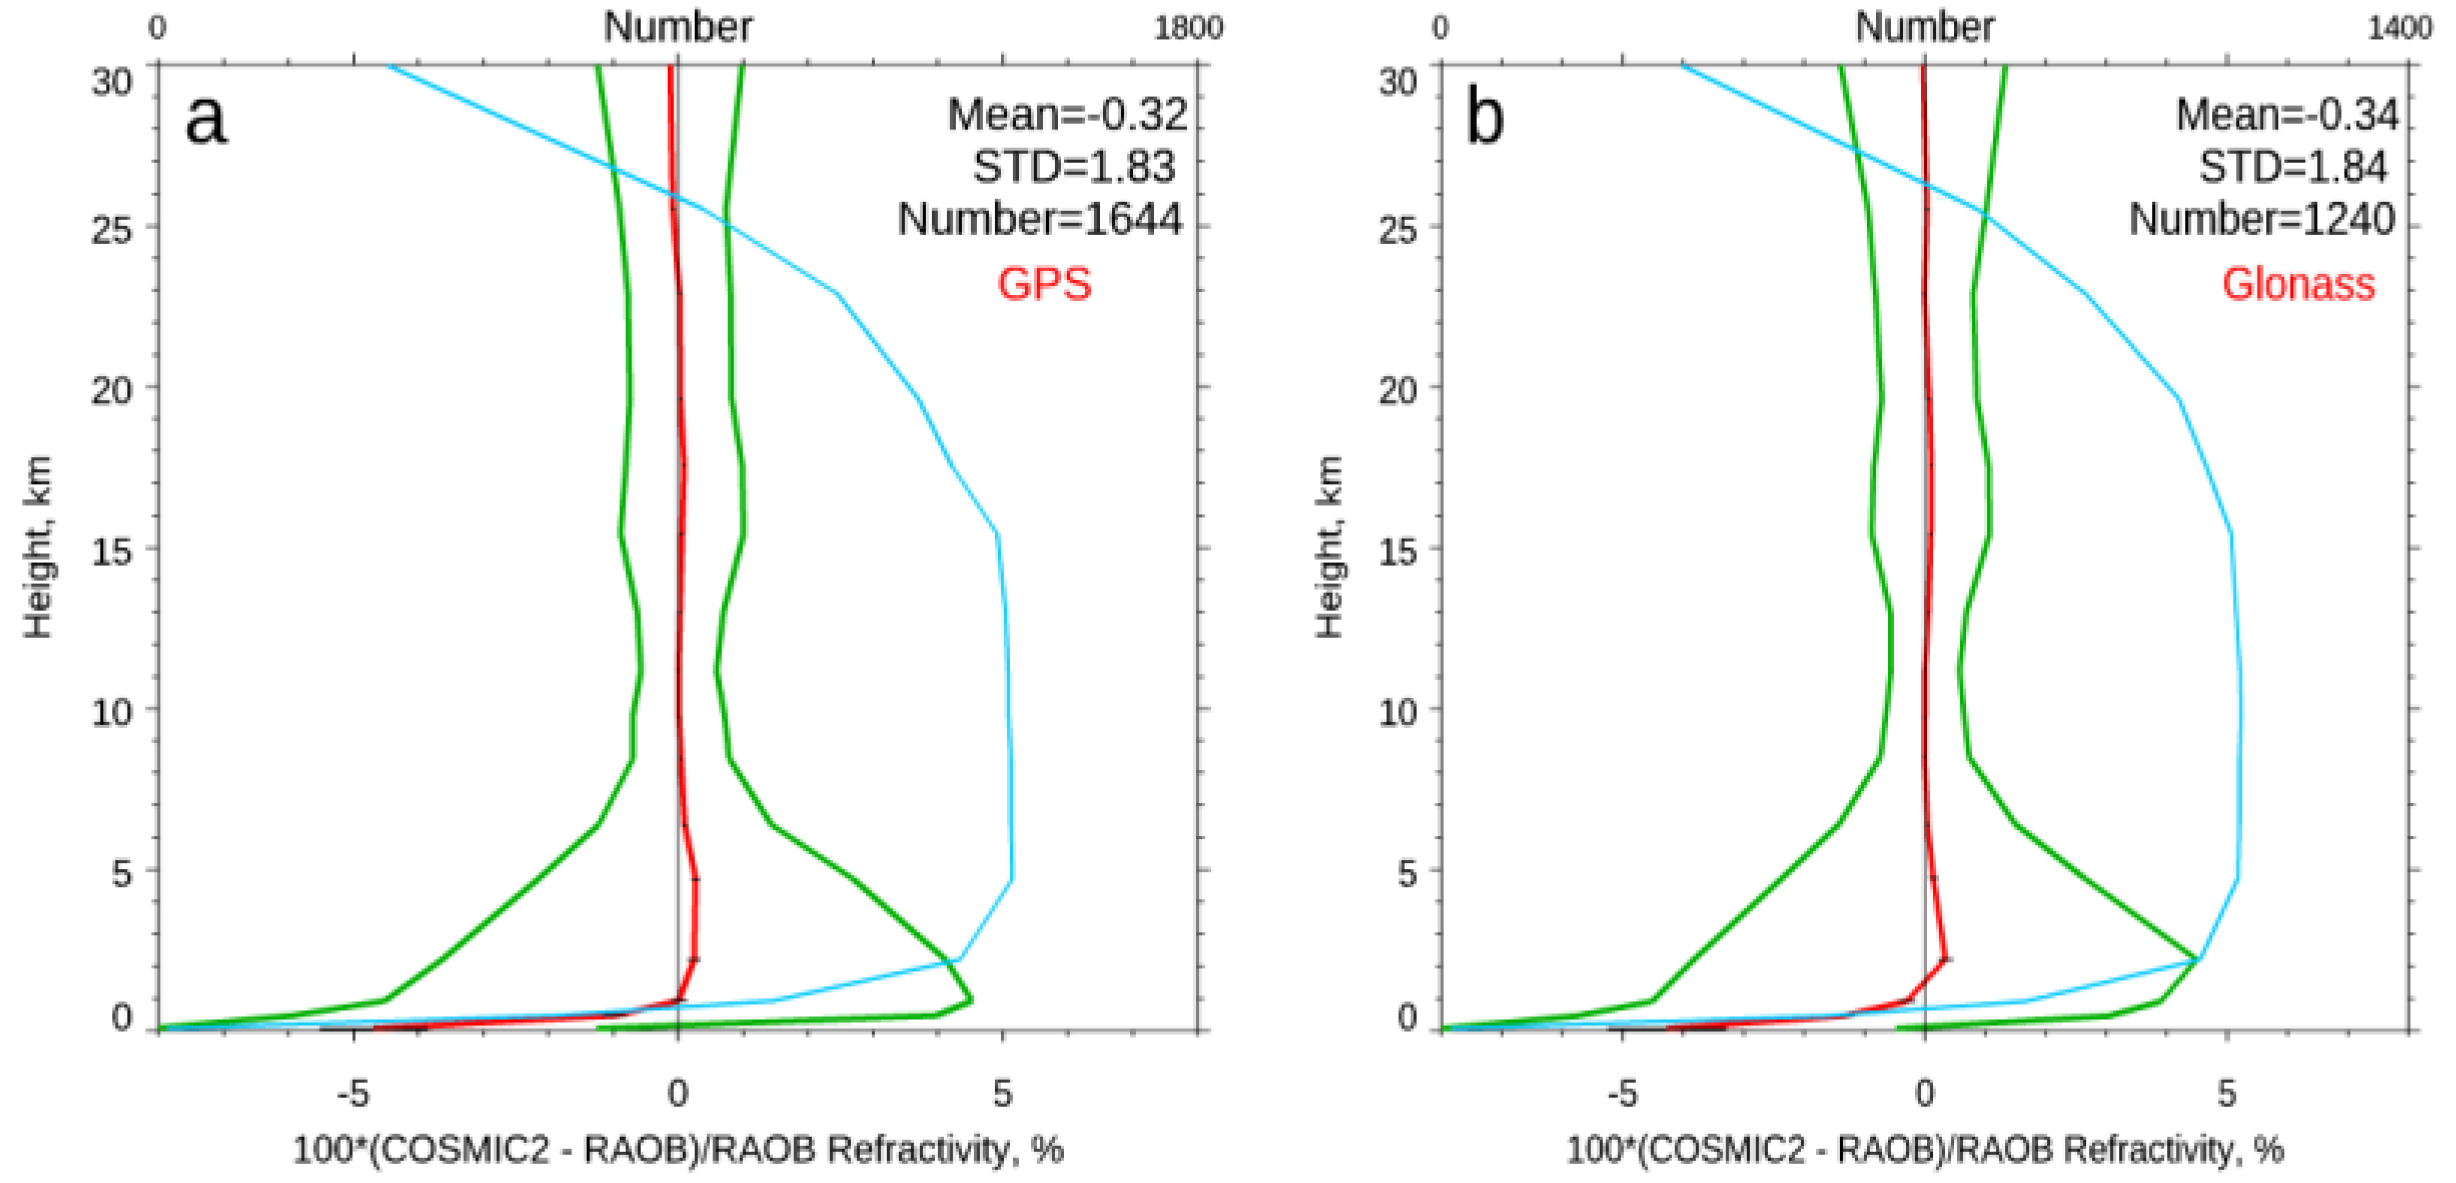
We have more than 3000 COSMIC-2 -RS41 pairs within the matching criteria from June to October 2019. To see how COSMIC-2 data quality varies with different tracking systems (GPS with the mean L1 SNR of 1250 v/v and GLONASS with the mean L1 SNR of 1100 v/v), we separate the comparison results for the COSMIC-2/GPS- RS41 pairs (Figure 8a) and COSMIC-2/GLONASS–RS41 pairs (Figure 8b), respectively. Figure 8 depicts that the mean difference and uncertainty of the COSMIC-2/GPS-RS41 pairs are very close to those of the COSMIC-2/GLONASS–RS41 pairs. The mean difference for the former from the surface to 30 km altitude is equal to −0.32% with a std of 1.83%, where those for the latter are −0.34% with a std of 1.84%. These results are also very compatible with those from the COSMIC-RS92 refractivity comparison [46]. COSMIC refractivity is also biased lower in the lower troposphere compared to those from RS92.
The negative refractivity biases relative to those of RS41 are from bending angle biases owing to considerable tracking uncertainty from COSMIC-2, mostly below the SR. Similar comparisons from for COSMIC2 (GPS)–ERA5 bending angle and COSMIC2 (GLONASS)–ERA5 bending angle, which covers both lands and oceans, also show that COSMIC-2 data quality does not change much when receiving signals emitted either from GPS or GLONASS [47]. Hereafter, we will not further separate the COSMIC-2 data with different emitters.
The TGRS includes a high-gain beamforming RO antenna, which can achieve the highest SNR of RO measurements to date (>2500 v/v in a 1 Hz band). On 16 August 2019 (day of year-DOY 228), all measurements were collected with beamforming on mode. Before that, beamforming tests were conducted on 28–29 June (DOY 209–210) and 1–8 August (DOY 213–219). The default configuration was in beamforming off mode before August 16 except for the beamforming on period. This allows us to test how the high SNR RO measurements would affect the retrieval uncertainty.
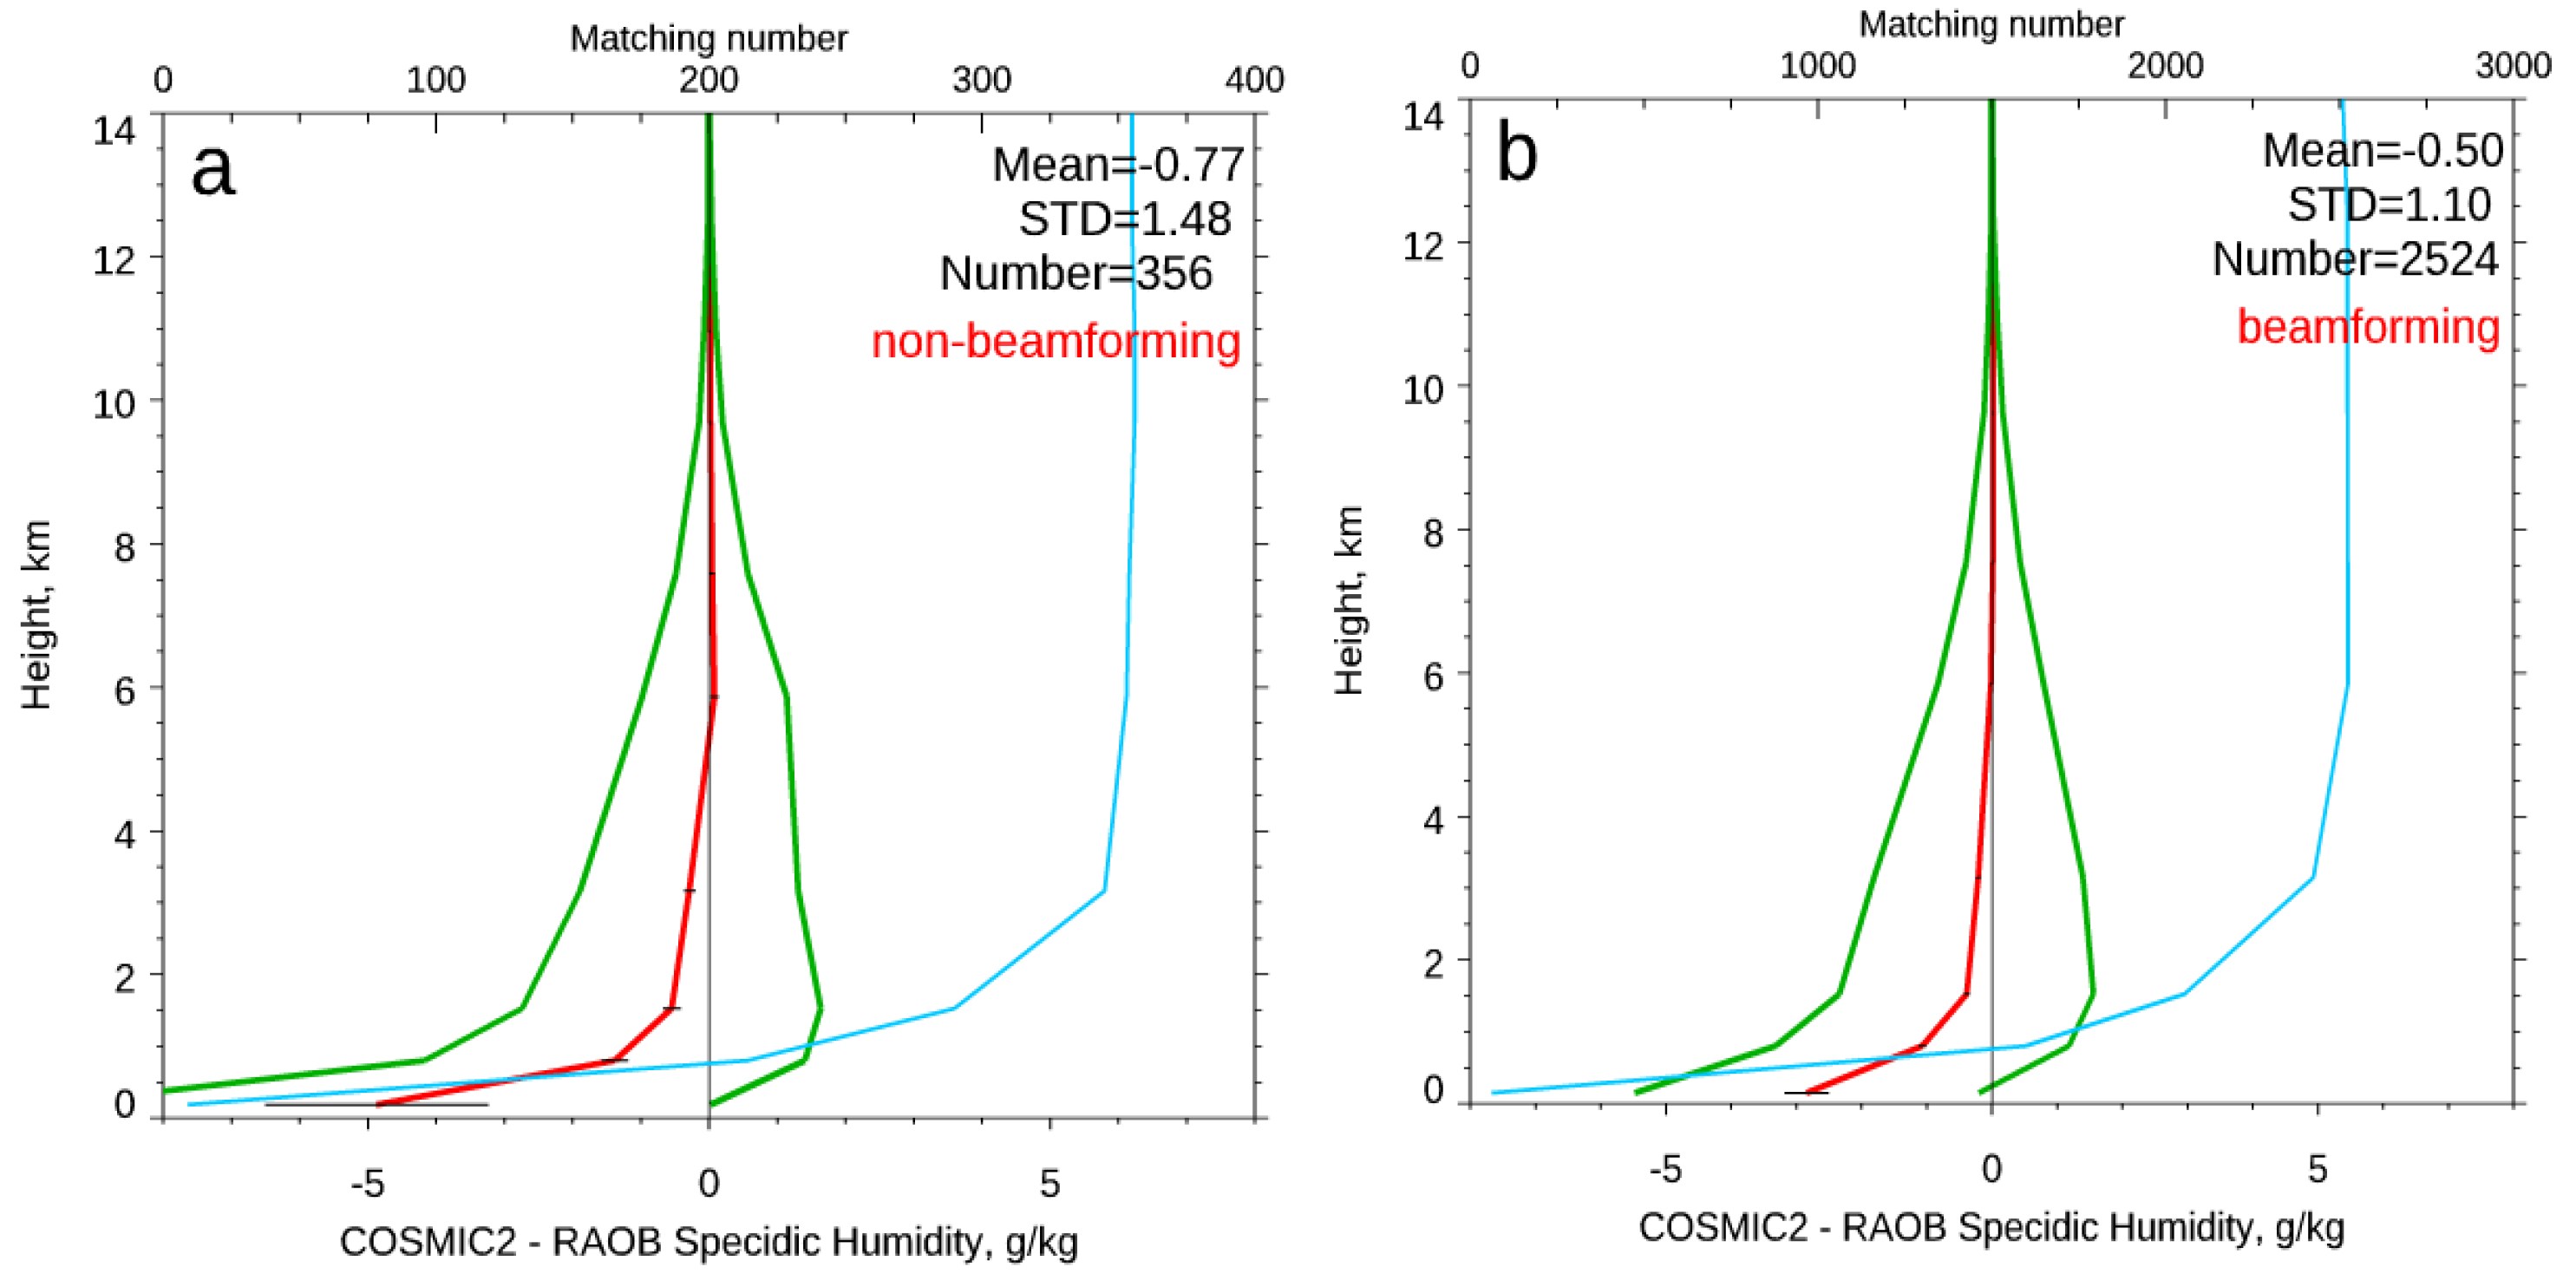
Here we separate the RS41 and COSMIC-2 pairs with beamforming and non-beamforming period. Figure 9 depicts that the beamforming COSMIC-2 water vapor profiles (Figure 9b) are slightly better than those from non-beamforming profiles (Figure 9a).

5.2. Accuracy and Uncertainty of COSMIC-2 Temperature in the Lower Stratosphere

The upper troposphere and lower stratosphere (UT/LS) is a critical region for understanding the radiative balance and climate processes. Studies have demonstrated that COSMIC temperature profiles in the lower stratosphere are very accurate (+/− 0.1K comparing with RS92 [46]) and stable (with a structural uncertainty of +/− 0.3 K in the trend [31]).
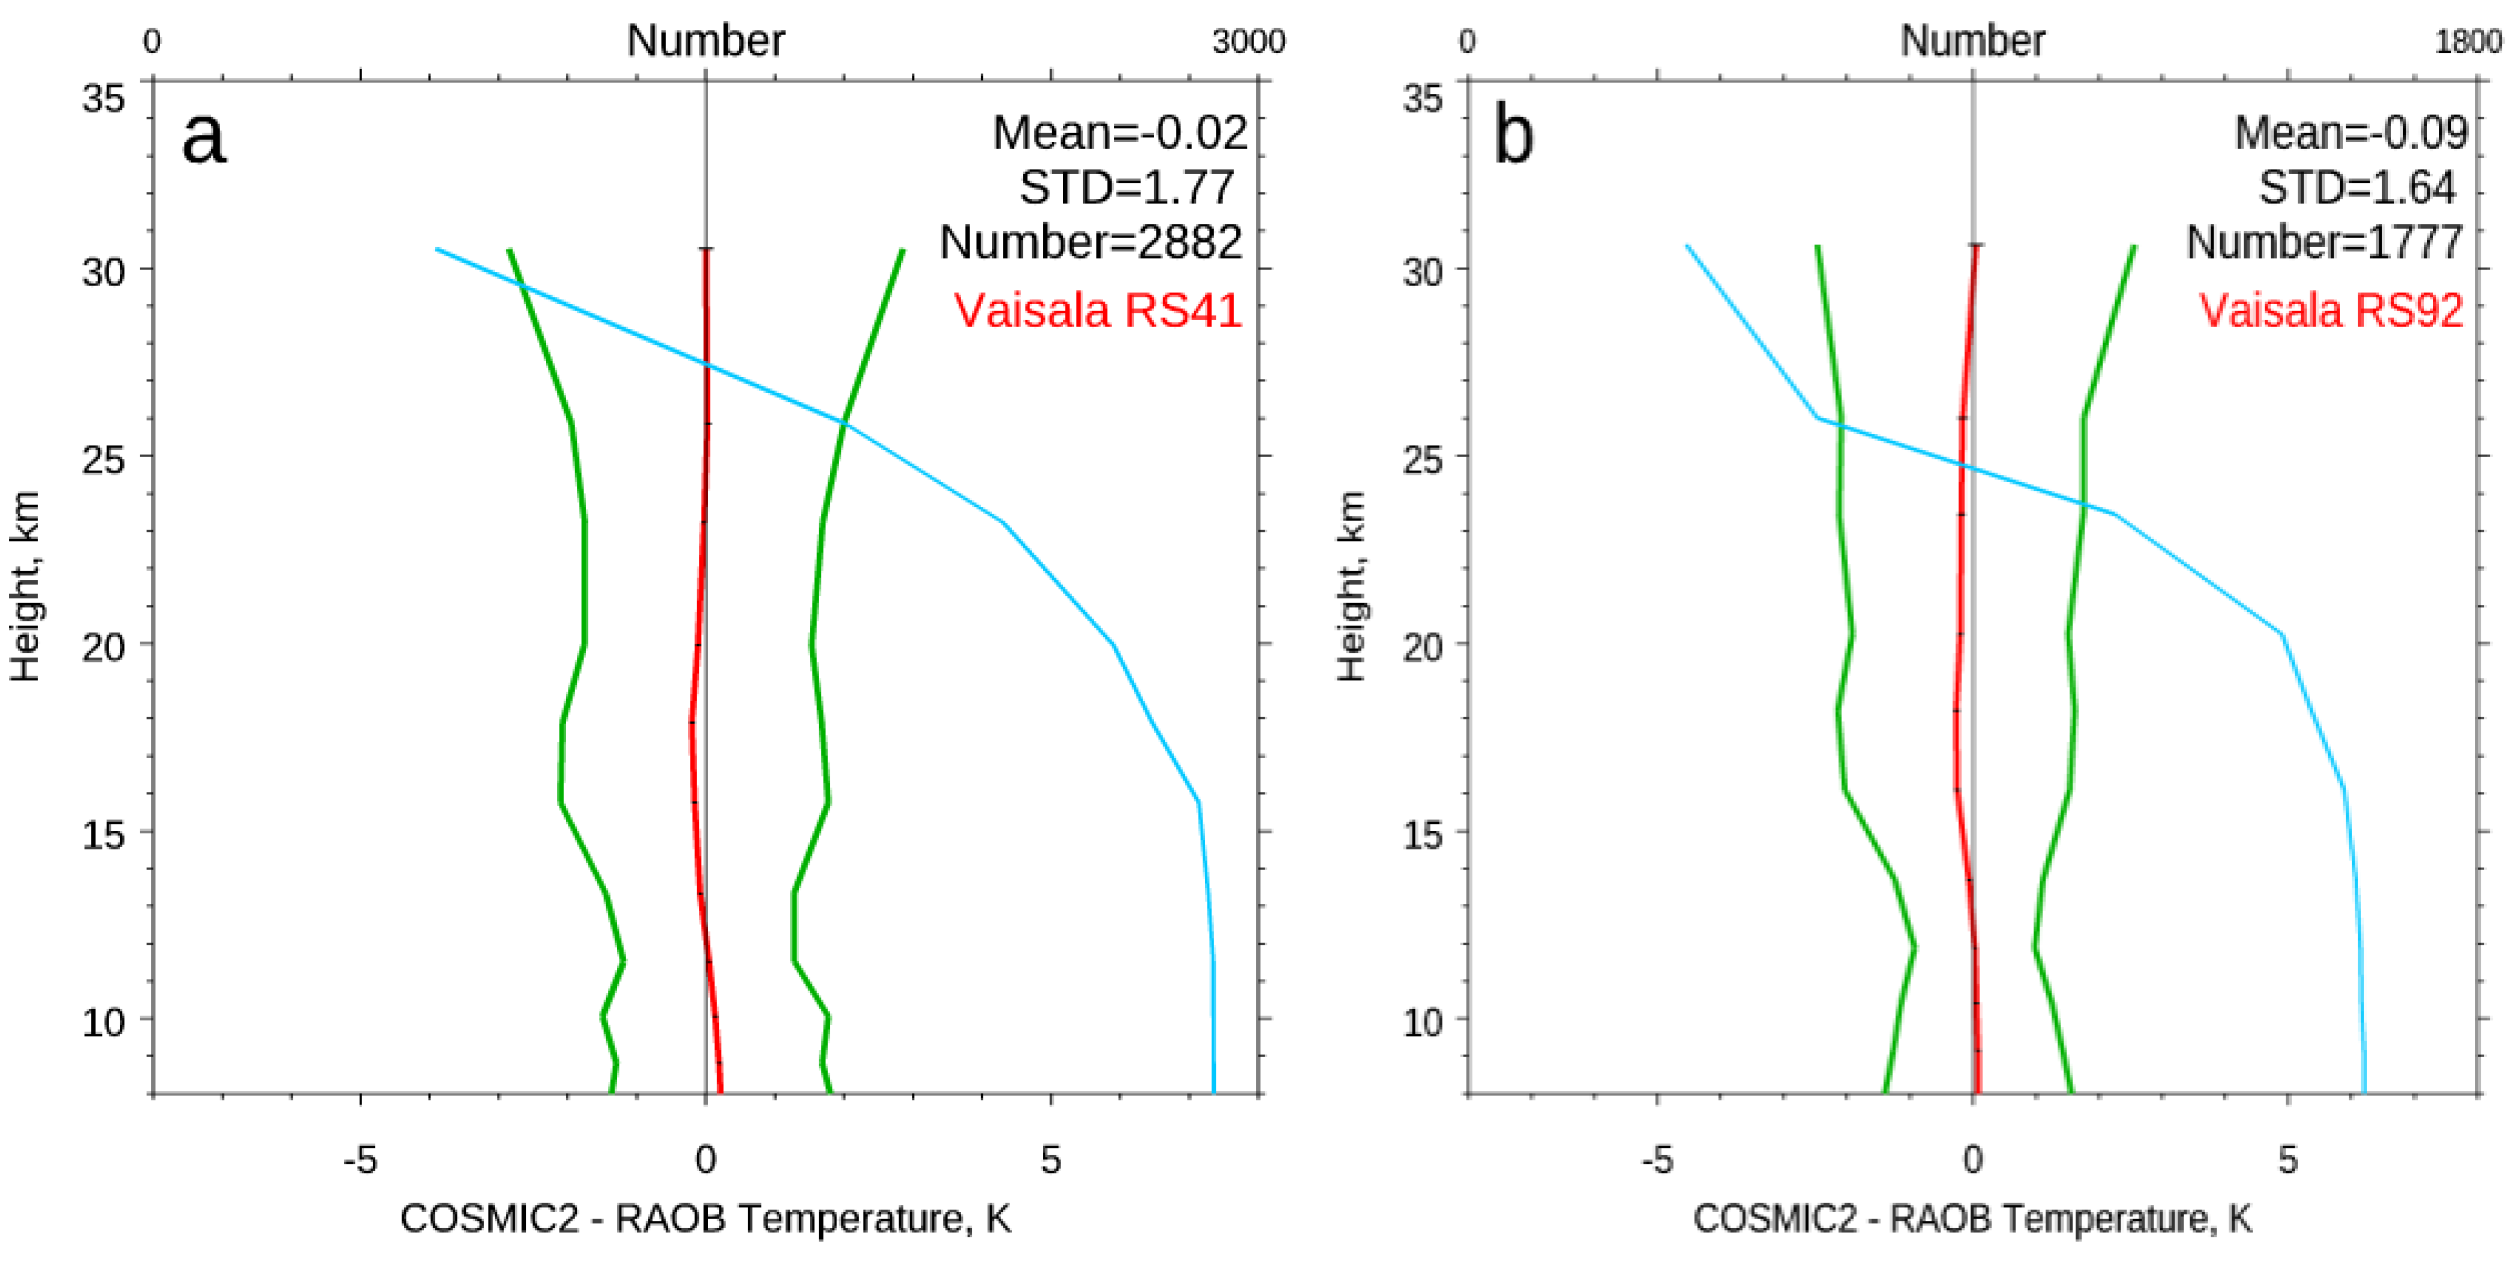
To further quantify the temperature uncertainty of COSMIC-2 in the lower stratosphere, we compare COSMIC-2–RS41 and COSMIC-2–RS92 pairs in Figure 10a,b, respectively. Figure 10 depicts that the mean bias between COSMIC-2 and RS92 temperature from 8 km to 32 km is equal to −0.09 K with a std of 1.64 K, where the mean COSMIC-2 and RS41 temperature difference in the same height range is equal to −0.02 K with a std of 1.77 K. The RS92 and COSMIC-2 have a close to 0.1 K negative temperature difference between 18 km and 25 km altitude. Note that RS92 also has a close to 0.1 K warm bias compared to R41 [36]. This warm bias may be owing to incomplete radiative warming correction for RS92.
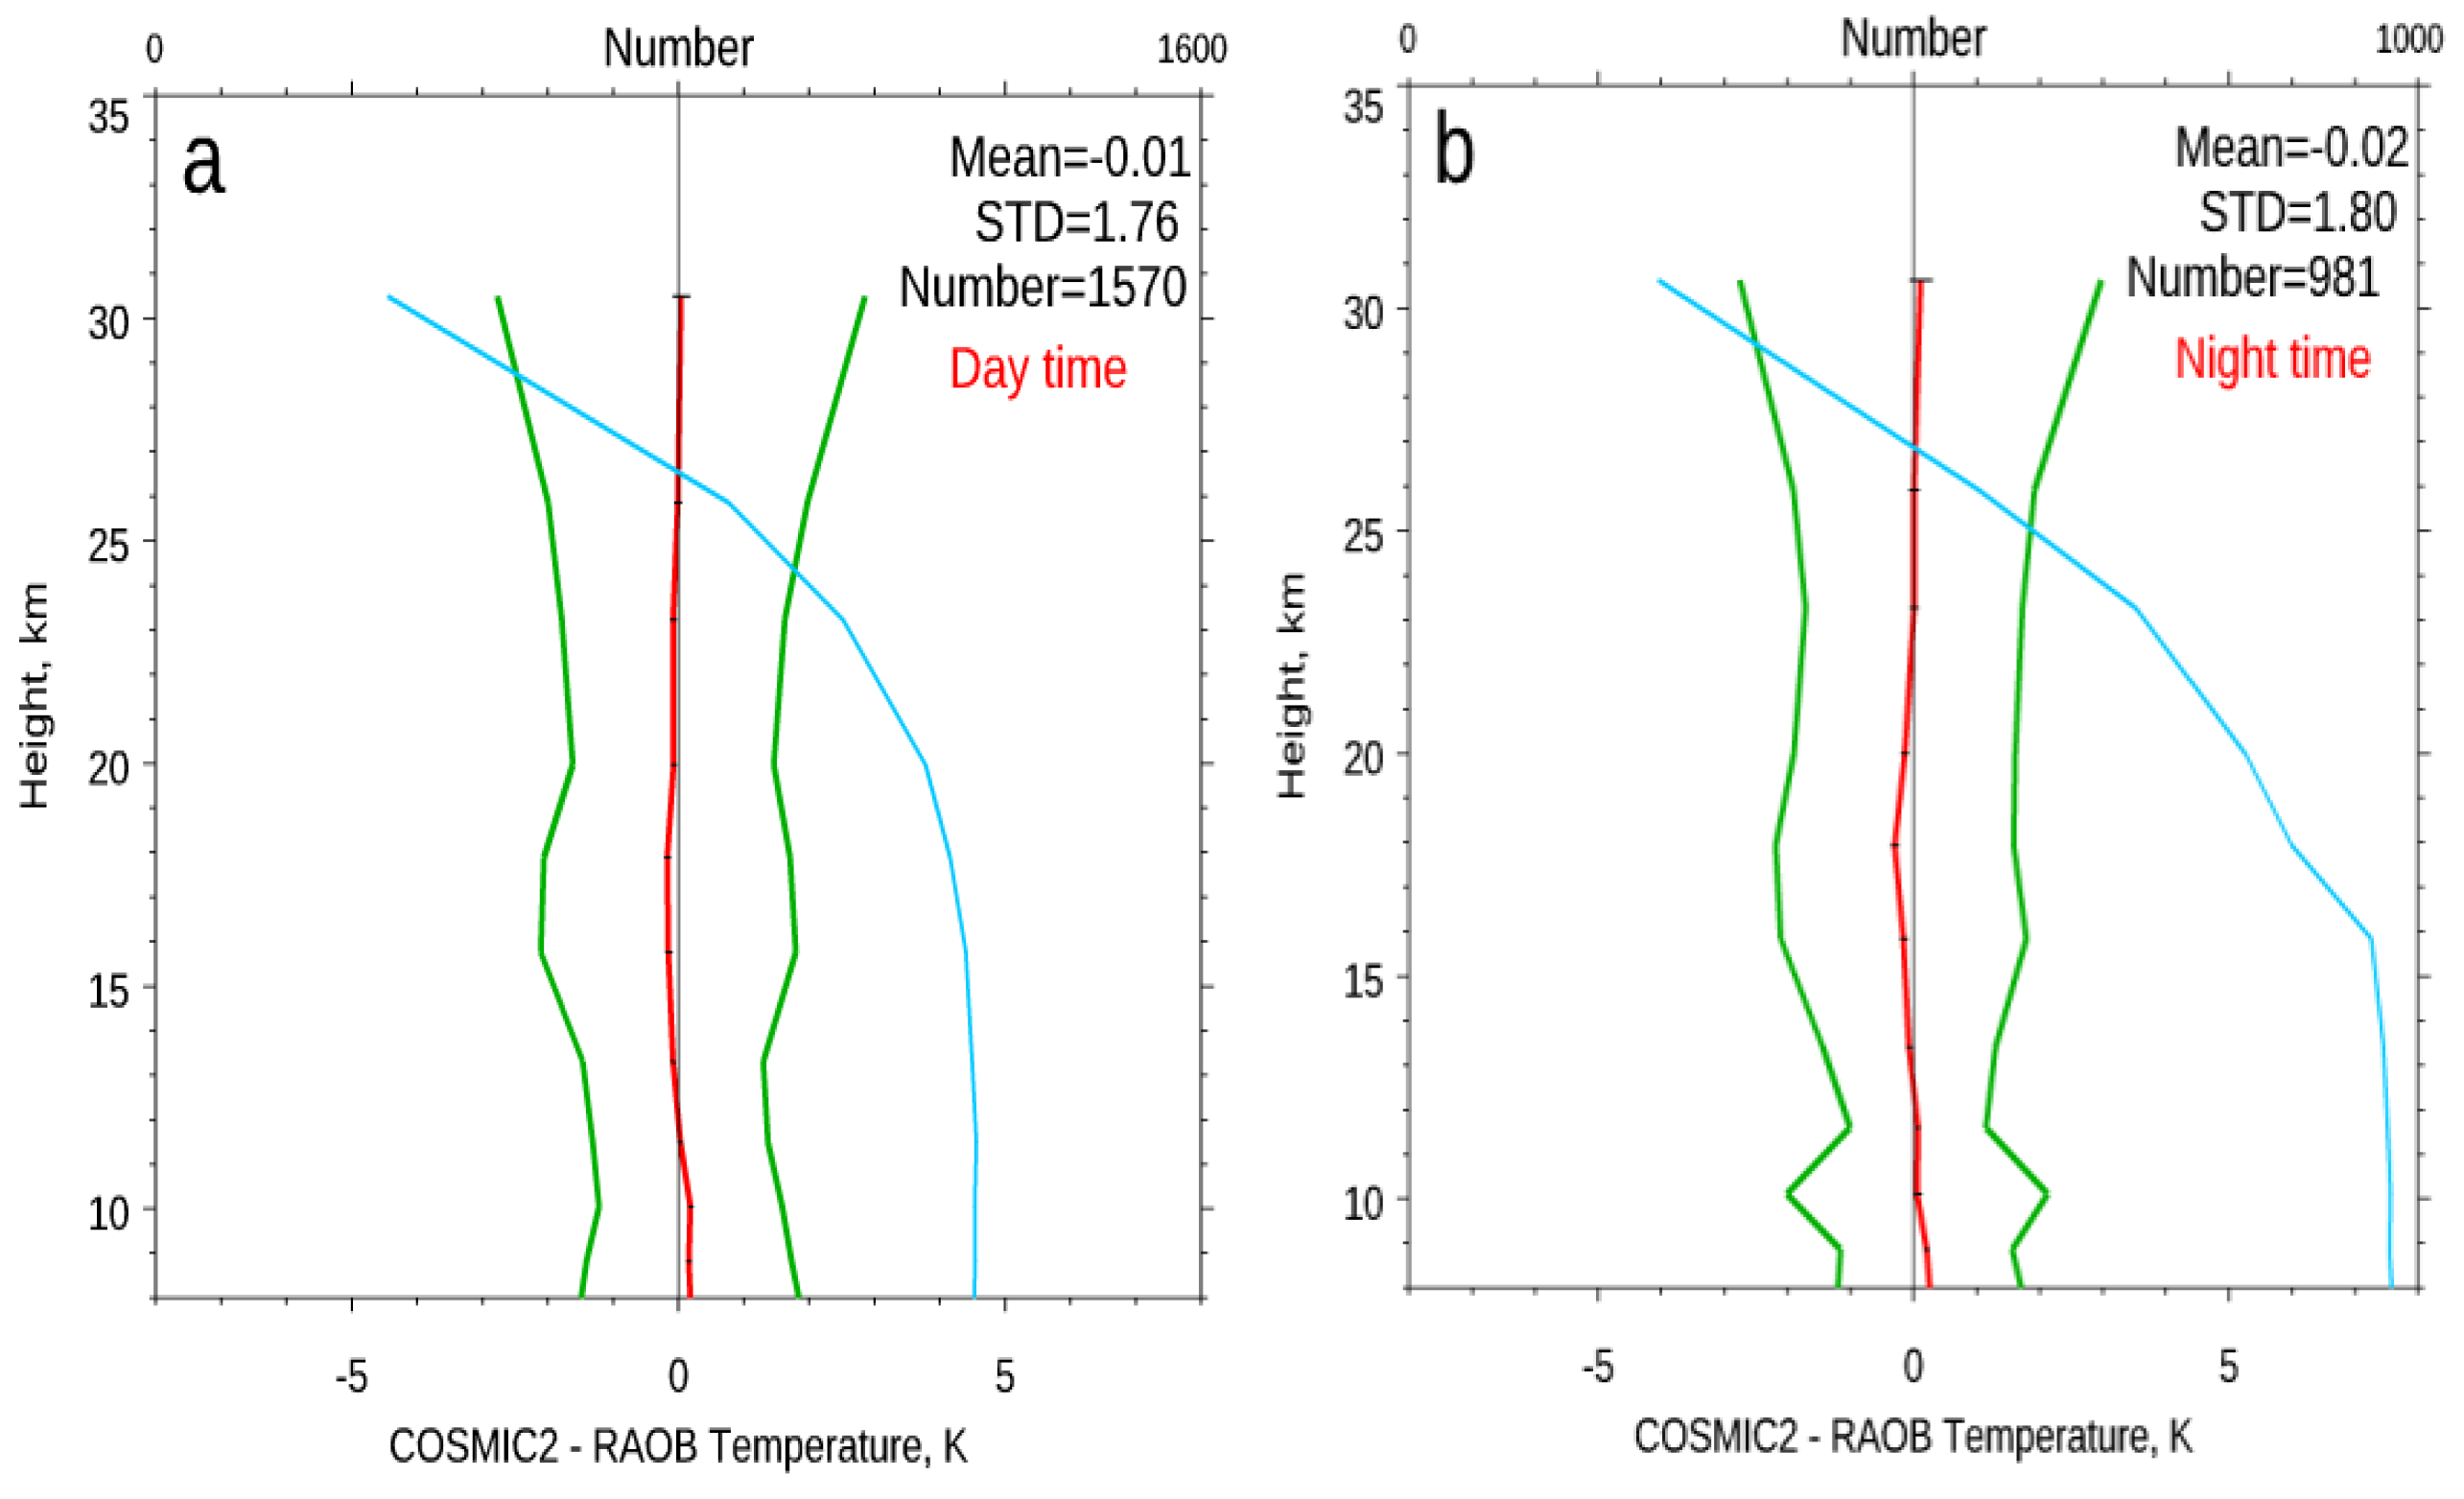
Ref. [32] also indicated that owing to residual solar zenith angle radiative correction that the radiosonde sensor usually has warm biases during the day time. To further examine whether there exists a day and night difference between COSMIC-2 and RS41, we also divide Figure 10a into day time (SZA for each of the RS41 less than 80 degrees, see Figure 11a) and nighttime (SZA larger than 80 degrees, Figure 11b). Figure 11 shows that the mean difference between COSMIC-2 and RS41 is close to zero for both day and night. This result gives us confidence in the quality of temperature measurement for both RS41 and COSMIC-2 in the low stratosphere.
Moreover, these results are very compatible with those from COSMIC. Comparing COSMIC temperature profiles from 200 hPa to 10 hPa to those from Vaisala-RS92 in 2007 with more than 10,000 COSMIC and Vaisala-RS92 pairs, ref. [46] confirmed that their mean bias in this height range was equal to −0.01 K with a standard deviation of 2.09 K.

5.3. Accuracy and Uncertainty of COSMIC-2 Refractivity in the Troposphere

Ref. [48] stated that although RO signals with better SNR may penetrate to the deeper troposphere, it does not guarantee an improved bending angle and refractivity profiles after the inversion. Studies ([1,49]) demonstrated that RO derived water vapor results are highly accurate. The water vapor retrieval results may be weakly dependent on the a priori [1,29]. To examine how exactly COSMIC-2 refractivity biases would be improved when better SNR data are used in the inversion package, we compared the COSMIC-2 retrievals under different atmospheric conditions (dry and moisture troposphere in different latitudes) in this section.
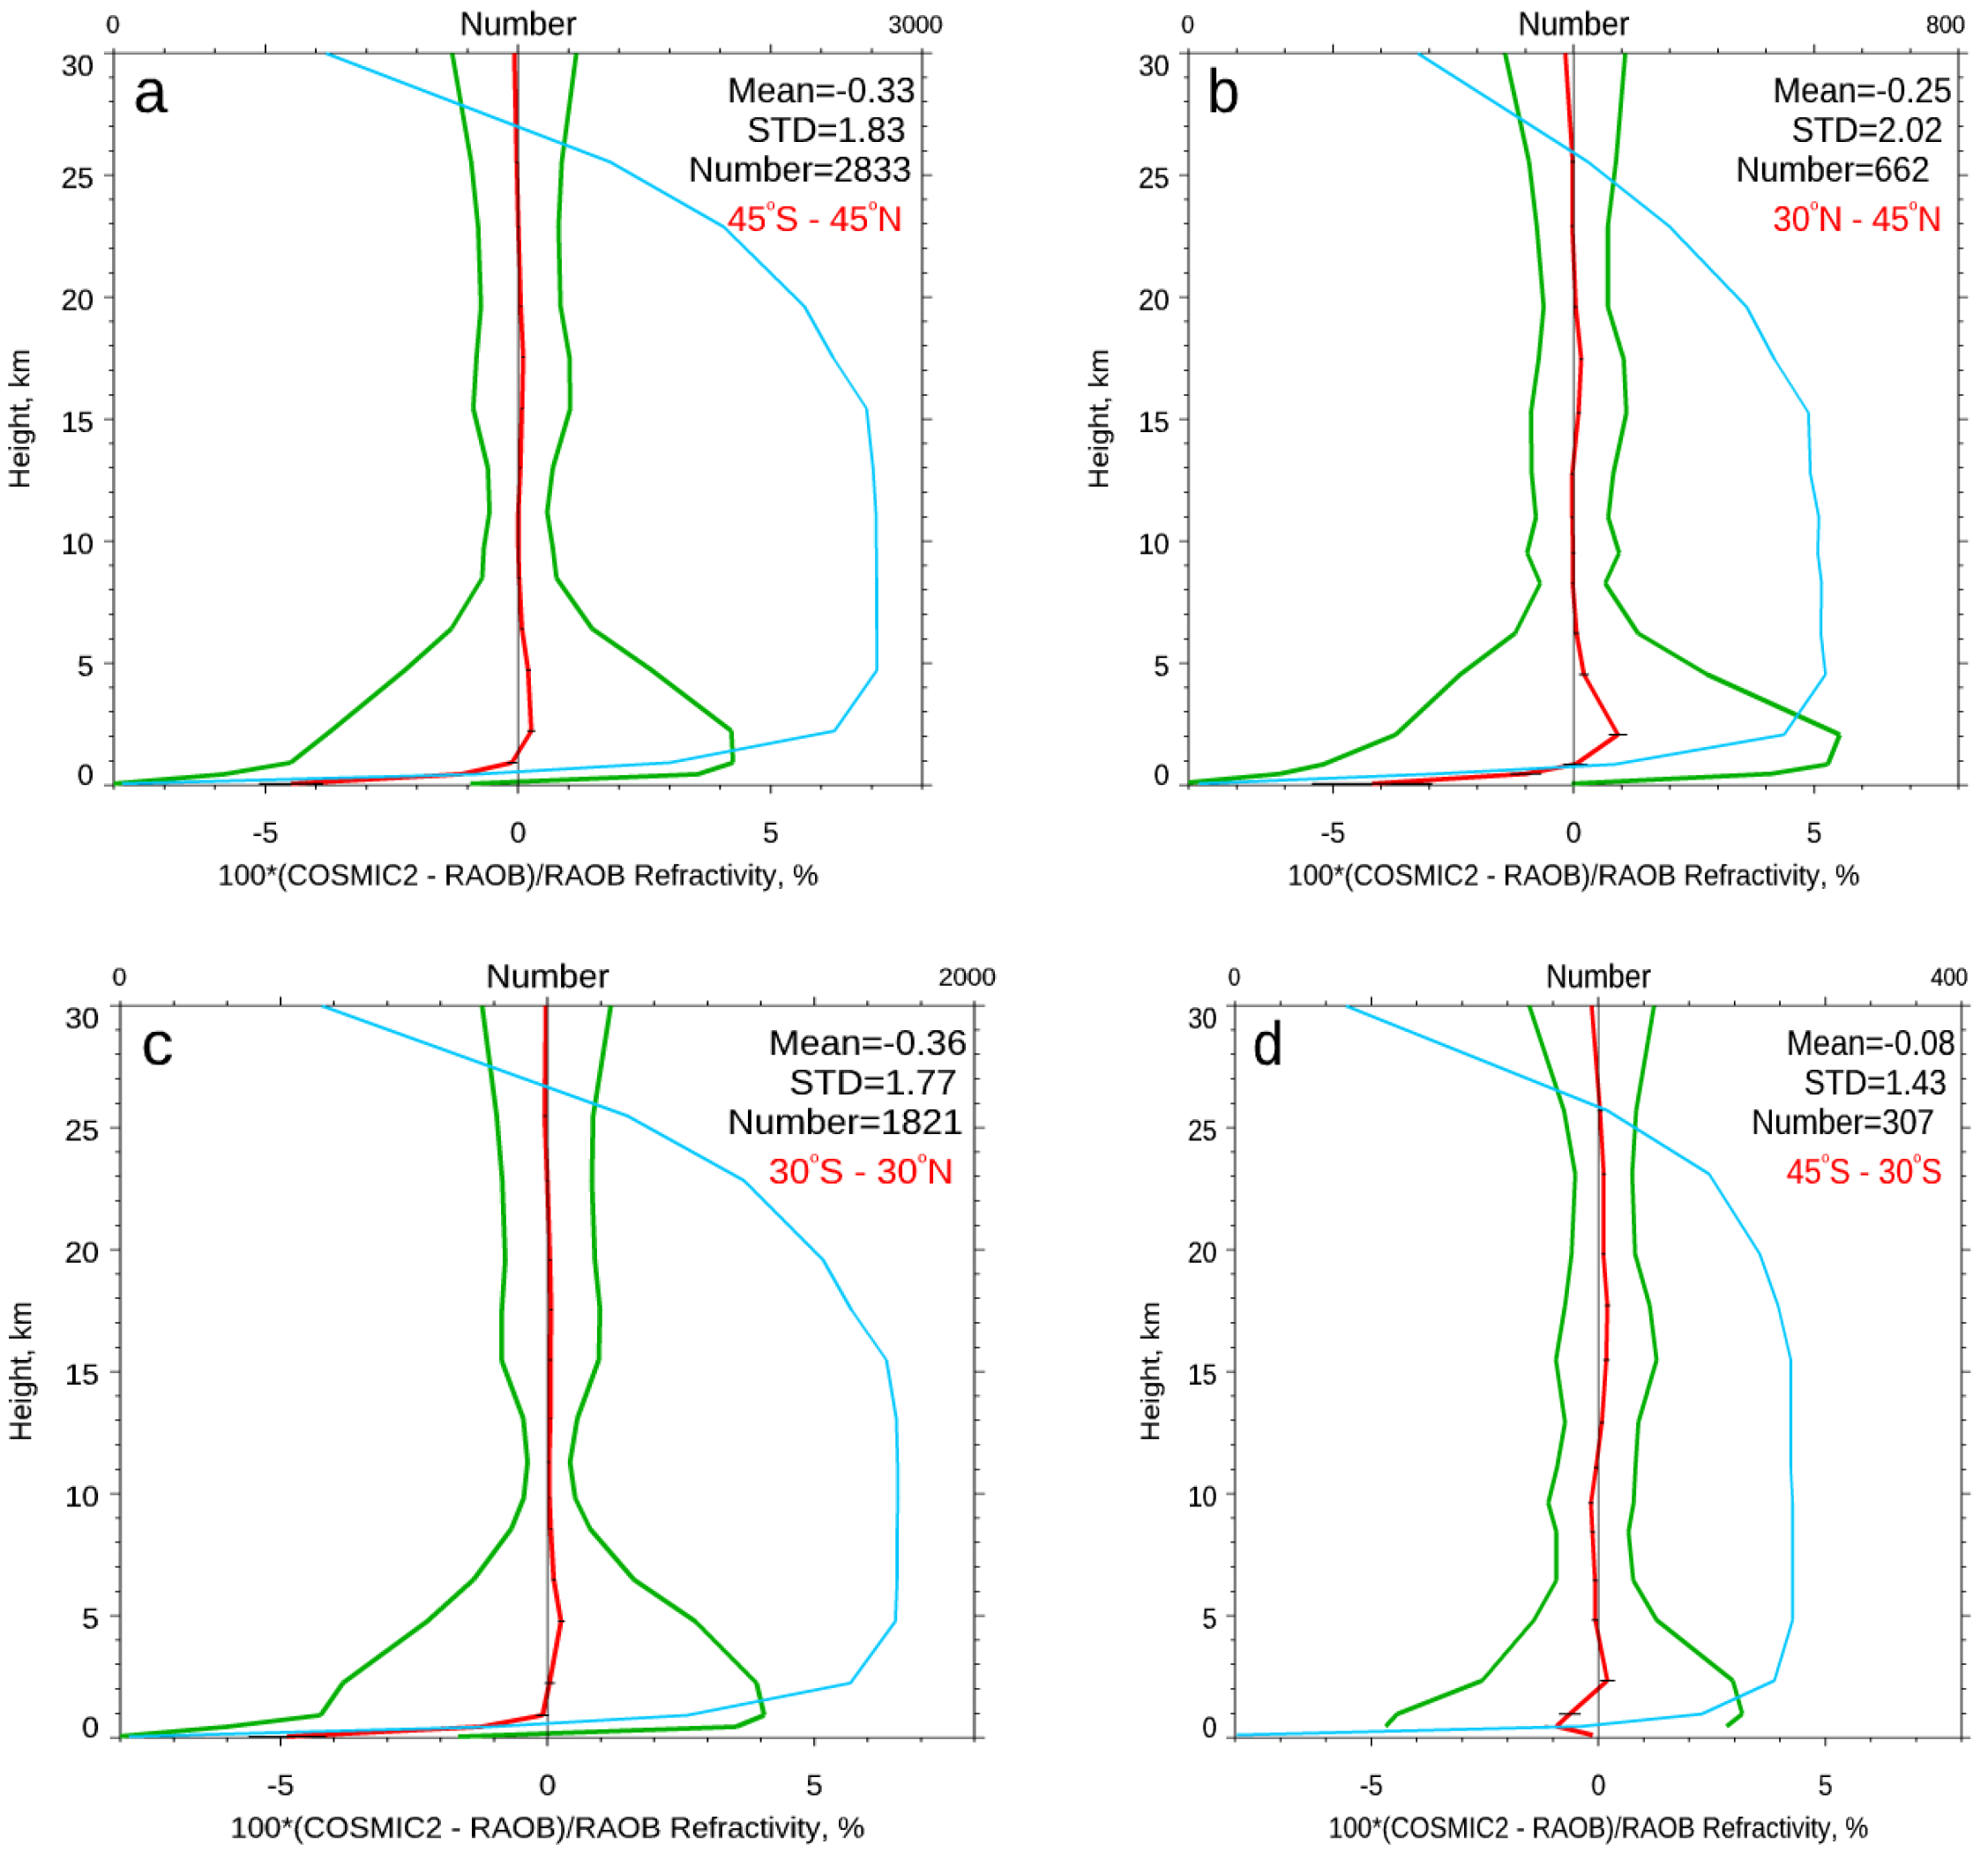
Figure 12a–d depict the COSMIC-2–RS41 refractivity mean differences and standard deviation from June to October 2019 over global (45° N to 45° S), mid-latitude North Hemisphere (45° N to 20° N), tropical region (20° N–20° S), and mid-latitude South Hemisphere (20° S to 45° S).
In general, the COSMIC-2–RS41 fractional refractivity differences vary in different latitudinal zones (see Table 2). The COSMIC-2–RS41 mean fractional refractivity difference from 45° N to 45° S is equal to −4% near the surface to about 0.3% at 5 km altitude. The std below 2 km is equal to about 4% to 5%. Note that the refractivity uncertainty also depends on moisture variation [1]. The mean difference values in Figure 12a–d are computed from the surface to 30 km altitude. The relatively larger mean difference at 3 km altitude occurred over 30° N–45° N, where the mean difference is equal to 1% at 3 km altitude then decreased to −4% at the surface. Over Tropics (30° N–30° S), the mean difference is equal to 0.1% at 3 km, then also reduces to close to −5% at the surface. As demonstrated in Figure 2, most all of the COSMIC-2–RS41 pairs occur over the 30° N–30° S latitudinal zone since more than 70% of COSMIC-2 occur over that region. The sample numbers shown in Figure 12 are the sample number at the 10 km altitude.
The more substantial mean difference in the tropical regions below 2 km altitude may be owing to a considerable tracking uncertainty from COSMIC-2, mostly below the SR. The mean difference between COSMIC-2 and RS41 is smaller over higher latitudes (mid-latitudes for both North and South Hemispheres). The water vapor variation and amount over those regions are lower than those from Tropics. We also compared the COSMIC-RS41 refractivity data collected from June to October from 2010 to 2020 over the same latitudinal zones. The COSMIC-RS41 mean refractivity difference and uncertainty over 30° N–30° S near the surface is about −4% with a std of 5% (not shown). The results show that the COSMIC-2 mean refractivity biases and uncertainty (in terms of std) are very compatible with those of COSMIC. These results are similar to those for COSMIC-1–ECMWF comparisons shown in [16] (Figure 2).

5.4. Accuracy and Uncertainty of COSMIC-2 Refractivity and Water Vapor Retrievals for Different SNR Groups

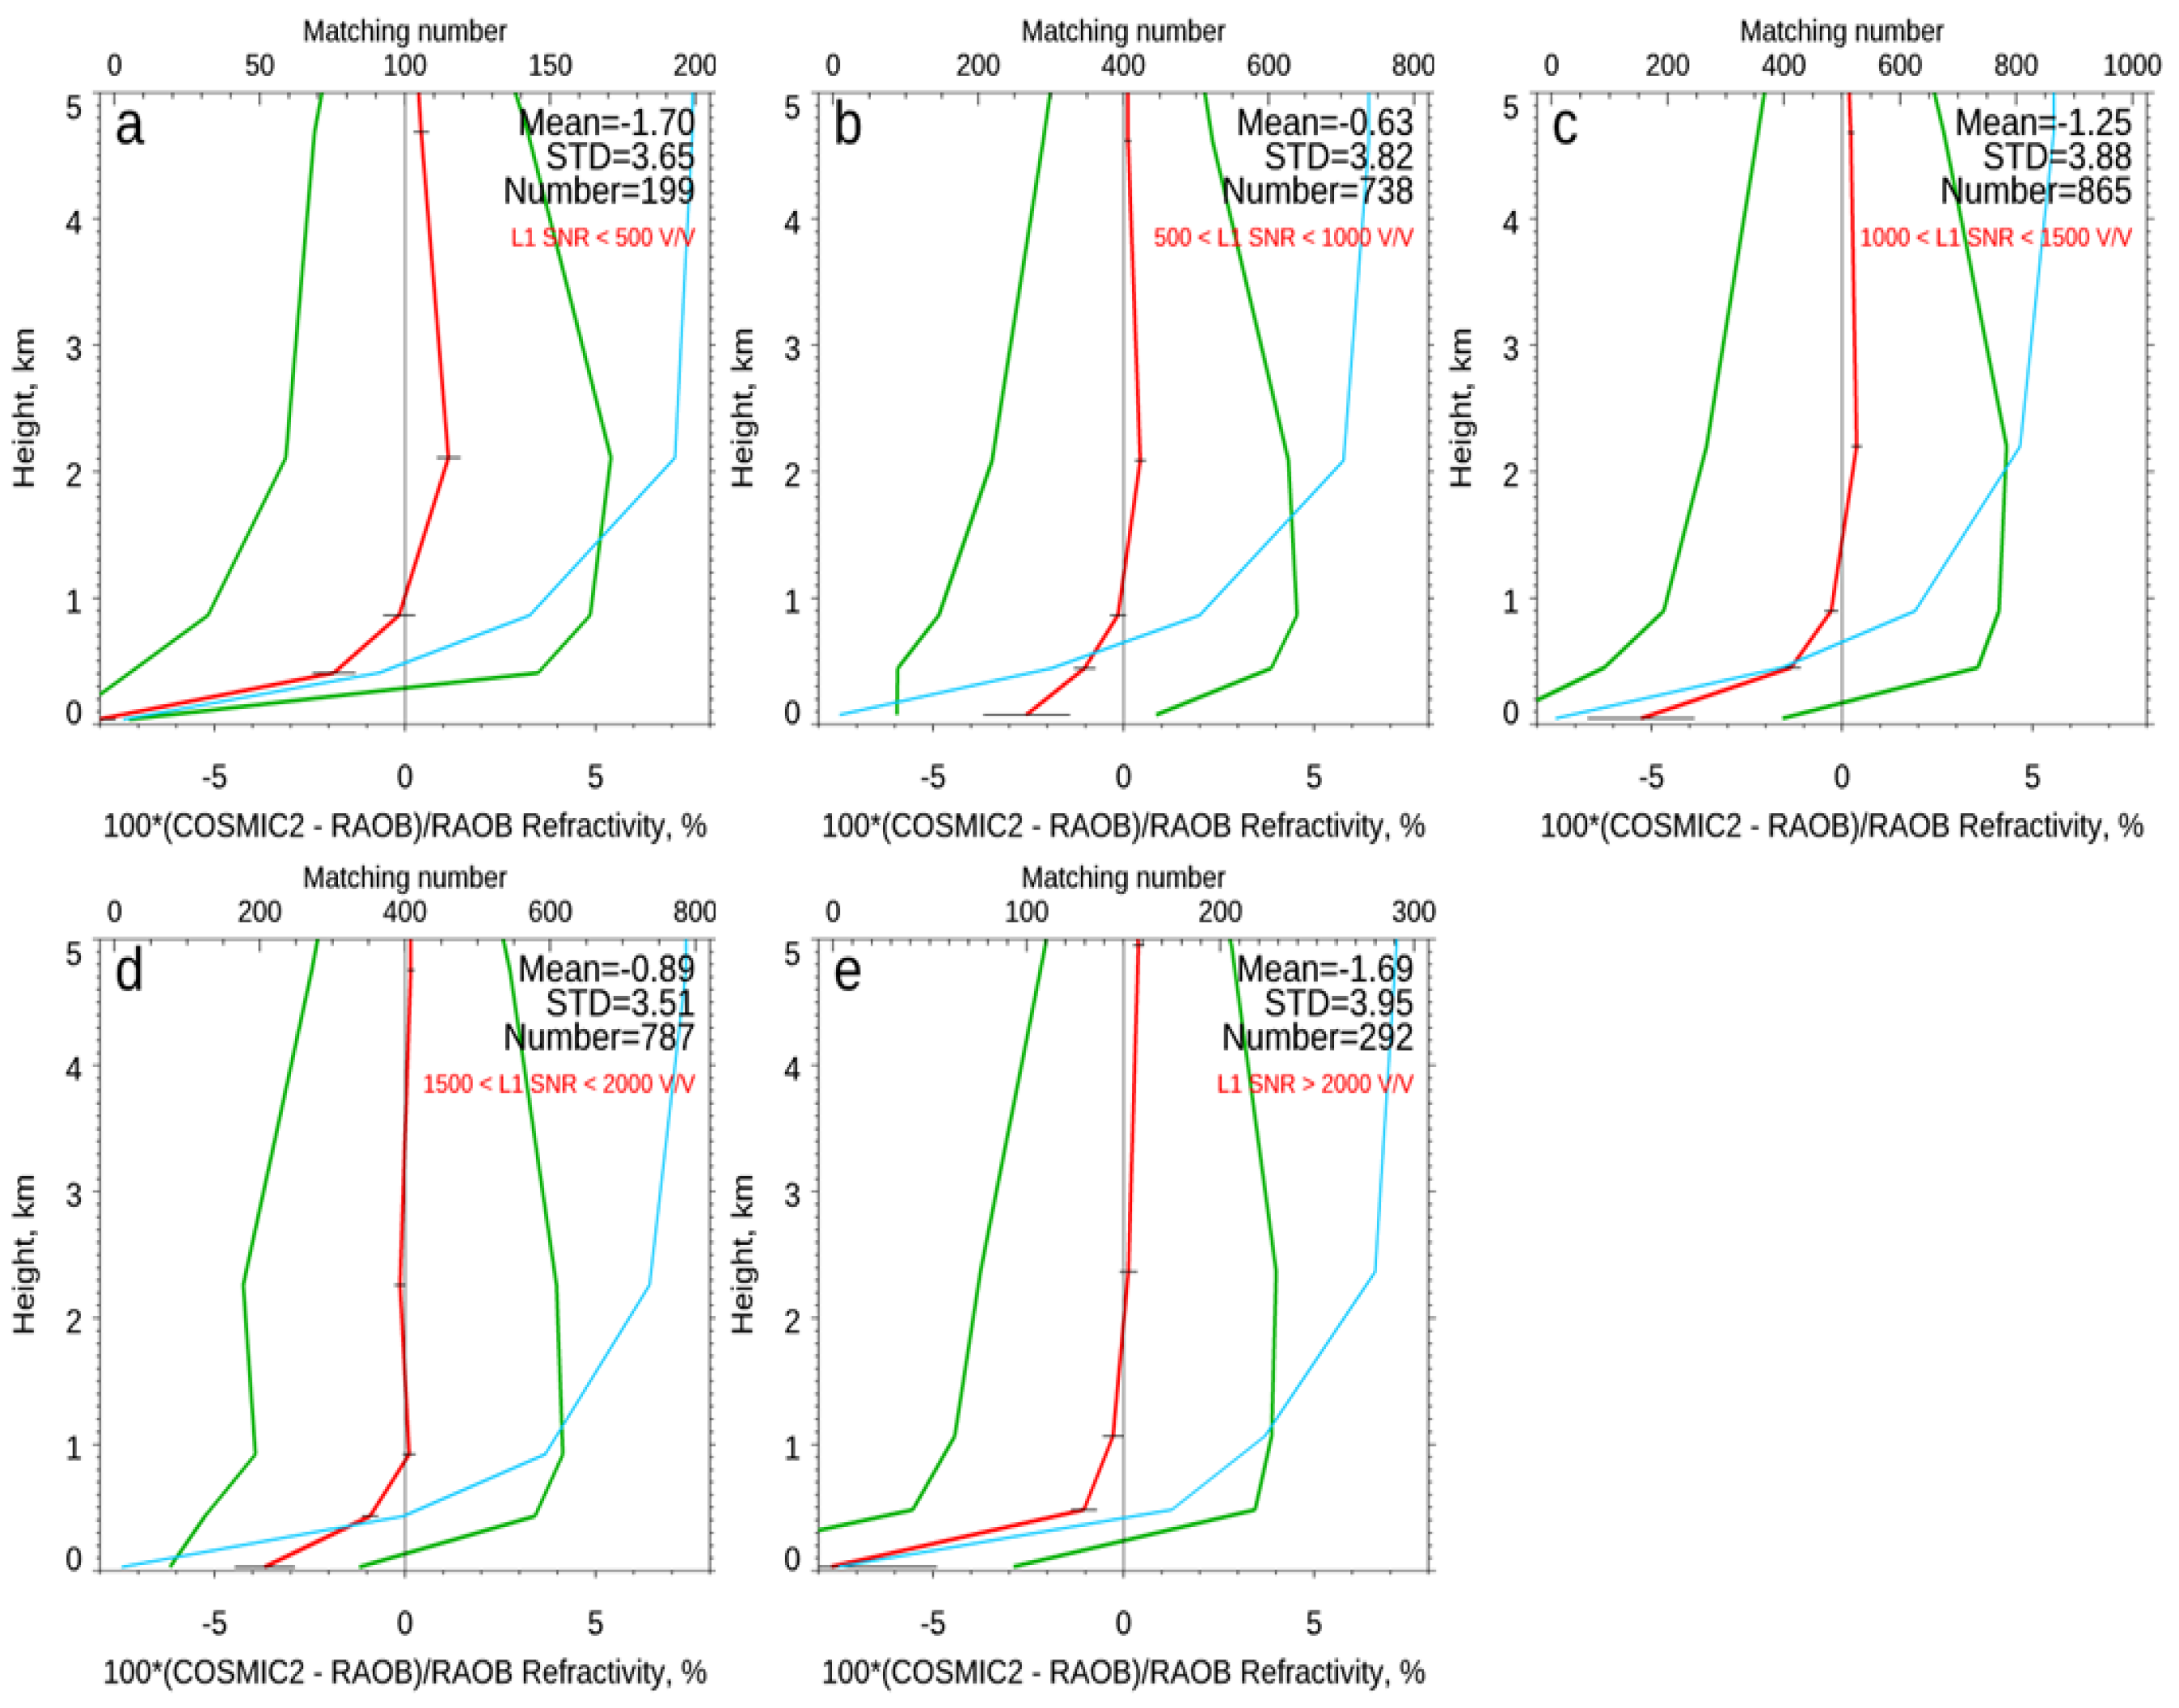
We further compare the COSMIC-2–RS41 fractional refractivity difference from surface to 5 km altitude in each SNR group in Figure 13. Figure 13 depicts that the mean fractional refractivity difference for COSMIC-2 and RS41 is slightly larger for the 0–500 v/v group compared to other groups. Except for the >2000 v/v group, the high SNR measurements from COSMIC-2 seem to improve the mean fractional refractivity difference for the higher SNR group slightly from the 2 km to 5 km altitude. The mean fractional refractivity difference from surface to 5 km altitude for these five groups are equal to −1.7%, −0.63%, −1.25%, −0.89%, and −1.69%, respectively (Table 3). Note that most of the COSMIC-2 occultations are within 500–2000 v/v (with a mean of 1250 v/v, see Figure 13c). The mean difference and the std for the 500–1000 v/v group (similar to those for COSMIC and KOMPSAT-5. Figure 13b) are equal to −0.63% with a 3.82% std, which is slightly smaller than that of the 1000–1500 v/v group (Figure 13c).
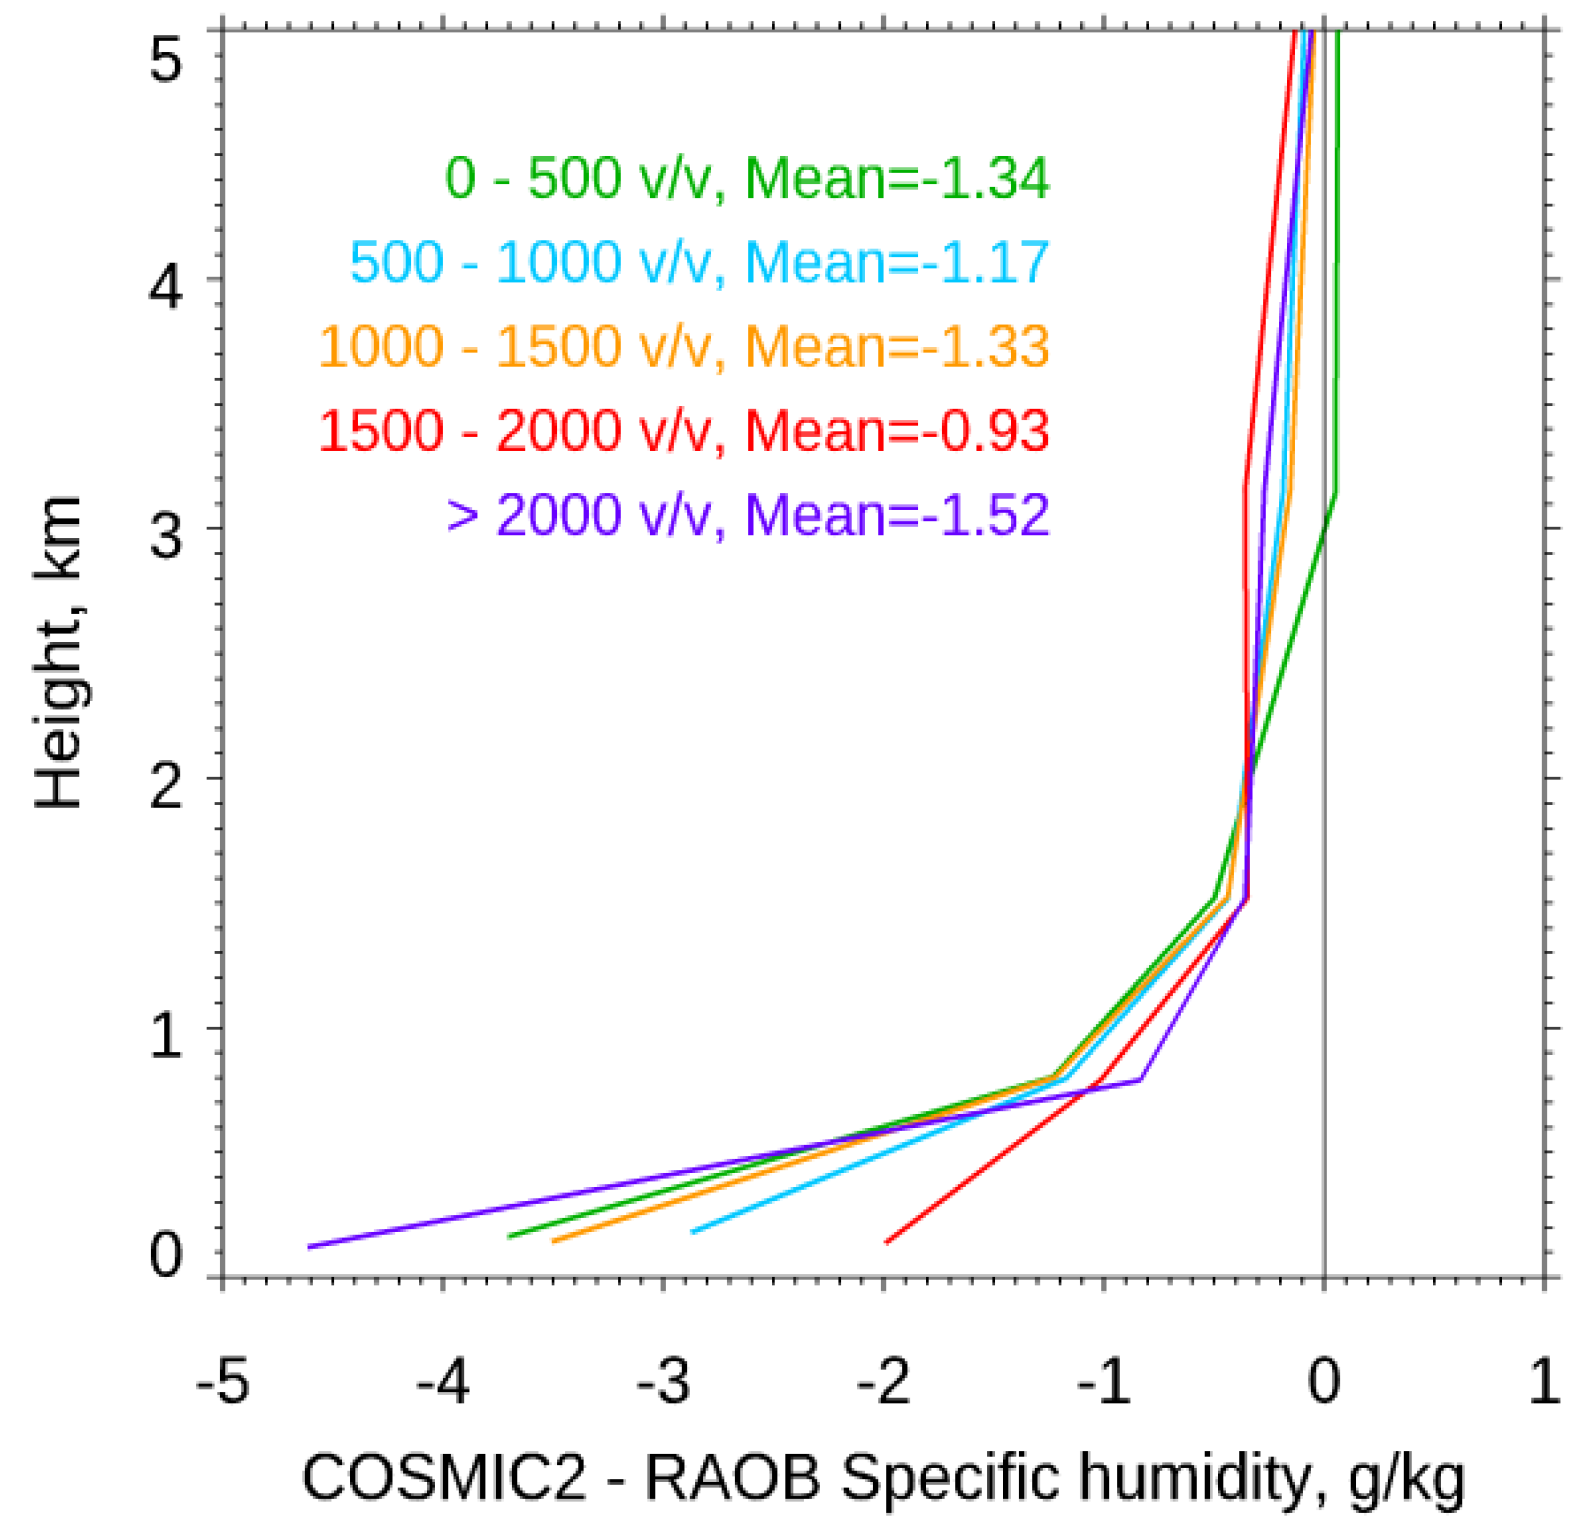
Figure 14 depicts the mean water vapor comparison results for different SNR groups. Results show that the mean water vapor difference in the lower troposphere is slighter larger for the 0–500 v/v group than those from other groups, except for the >2000 v/v group. The results show that the COSMIC-2 water vapor for the 1000–1500 v/v group is slightly drier than that from the 500–1000 v/v group from the surface to 4 km altitude. The mean COSMIC-2–RS41 water vapor difference from surface to 5 km altitude for each SNR groups (also see Table 4) are equal to −1.34 g/kg (0–500 v/v), −1.17 g/kg (500–1000 v/v), −1.33 g/kg (1000–1500 v/v), −0.93 g/kg (1500–2000 v/v), and −1.52 g/kg (>2000 v/v). Except for the >2000 v/v group, the high SNR measurements from COSMIC-2 seem to improve the mean water vapor difference for higher SNR groups slightly (especially for the 1500–2000 v/v group) comparing with those from lower SNR groups.

6. Conclusions, Discussions, and Potential Applications

Ref. [1] has summarized the potential applications using COSMIC-2 for climate and NWP, and space weather. Before applying COSMIC-2 data for science studies and operational applications, it is critically important to quantify COSMIC -2 data quality carefully. This study uses the currently most accurate radiosonde observations obtained from Vaisala RS41 to assess the quality of neutral atmospheric profiles derived from COSMIC-2 signals. In general, the COSMIC-2 data quality in terms of stability, precision, accuracy, and uncertainty of the accuracy is very compatible with those from COSMIC-1. The conclusions we reach are as follows:
1. Spatial and temporal coverage. COSMIC-2 has a different spatial coverage compared with that of COSMIC and other RO missions. COSMIC-2 is a six-satellite constellation mission. With a 24-degree inclination at 720 km latitude, COSMIC-2 occultations are distributed within the region from 45° N and 45° S. The uniform temporal coverage occurs mainly over 30° N and 30° S. COSMIC-2 provides an average of about three to five soundings per day in each 500 × 500 km2 box in subtropics from 35° N to 35° S.
2. Penetration. CDAAC inversion procedures determine the COSMIC-2 penetration depth (i.e., the cut off height). The penetration height may vary when different inversion algorithms are applied. The mean L1 COSMIC-2 SNR is equal to 1200 v/v, where that for both COSMIC and KOMPSAT-5 is about 700 v/v. With a higher mean SNR than all other RO missions (i.e., COSMIC, KOMPSAT-5, MetOp-A, -B, and C, etc.), more than 85% of COSMIC-2 data penetrate deeper than 1 km altitude, where about 80% of COSMIC data penetrate deeper than that height. The penetration height for COSMIC-2 (and other RO missions) is deeper over drier regions (usually in mid-latitude winter) than that over the tropical region (and mid-latitude summer).
3. Precision. Using co-planar measurements in the early phase of the COSMIC-2 mission while two COSMIC-2 flight modules are within 1200s and a distance separation at the ray tangent point of about 300 km apart, we can quantify the precision of COSMIC-2 temperature, water vapor, and refractivity profiles. COSMIC-2 fractional refractivity precision varies from −0.2% to 0.2% below 8 km and is within +/− 0.1% between 8 km and 30 km altitude. The mean precision for COSMIC-2 temperature is within 0.2 K, between 8 km and 35 km. The precision for the COSMIC-2 water vapor mixing ratio is within 0.15 g/kg below 5 km. COSMIC’s precision is within less than 0.05 K for temperature and 0.35 g/kg for water vapor from the surface to 30 km, respectively. The reason that COSMIC-2′s precision is slightly larger than those of COSMIC may be partly owing to the paired COSMIC-2 data are collected with larger time-spatial criteria (1200 s and 300 km apart) than those of COSMIC pairs for two receivers (within 5 s and 10 km apart [42]).
4. Stability. With the SI-traceable time delay measurements, the RO neutral atmospheric profiles derived from time delay and carrier phase measurements are also very stable [42]. The comparison of COSMIC and COSMIC-2 shows that their mean fractional refractivity differences between 5 km and 35 km range from −0.5% (at 5 km) to 0.4% (at 35 km). This is very consistent with the comparison results for the collocated COSMIC-2–KOMPSAT-5 pairs. This result demonstrates the consistent data quality between COSMIC-2 and COSMIC (and KOMPSAT-5). COSMIC-2 data are consistent with other RO missions, mainly over both the troposphere and the lower stratosphere below 40 km.
5. Tracking uncertainty from receivers. Although L1 SNR for COSMIC-2 varies with different satellite systems (GPS with the mean L1 SNR of 1250 v/v and GLONASS with the mean L1 SNR of 1100 v/v), we did not find significant quality change for COSMIC-2/GPS and COSMIC-2/GLONASS retrievals. The mean difference and uncertainty of the COSMIC-2/GPS–RS41 pairs are very close to those of the COSMIC-2/GLONASS–RS41 collocated pairs. However, we find that the COSMIC-2 retrievals under the beamforming period are slightly less biased and uncertain than those of the non-beamforming period.
6. The accuracy of COSMIC-2 temperature in the lower stratosphere. Studies have demonstrated that COSMIC-2 temperature profiles in the lower stratosphere are very accurate. The mean COSMIC-2 and RS41 temperature difference from 8 km to 30 km altitude range is equal to −0.04 K with a std of 1.34 K. In this study, we also compare COSMIC-2 and RS41 collocated pairs during the day and night. The mean COSMIC-2–RS41 temperature differences in the lower stratosphere is equal to zero for both the day time and the night time. This result gives us confidence in the quality of temperature measurement for both RS41 and COSMIC-2 in the low stratosphere. The mean difference and uncertainty of COSMIC-2 temperature are very compatible with those from COSMIC. Ref. [46] confirmed that for the COSMIC-RS92 pairs, the mean bias and the deviation in this height range were equal to −0.01 K and 2.09 K, respectively.
7. COSMIC-2 refractivity and water vapor retrievals for different SNR groups in the troposphere. In general, the COSMIC-2–RS41 refractivity differences vary in different latitudinal zones. The mean fractional refractivity difference from 45° N to 45° S near the surface is equal to −4% with a std of 5%. The more substantial mean difference in the tropical regions below 2 km altitudes may be owing to a more considerable tracking uncertainty from COSMIC-2, mostly below SR. Comparison results show that the mean fractional refractivity difference for COSMIC-2 minus those from RS41 is slightly larger for the 0–500 v/v group compared to other groups. Except for the > 2000 v/v group, the high SNR measurements from COSMIC-2 measurements seem to improve the mean water vapor difference for the higher SNR group slightly (especially for the 1500–2000 v/v group) comparing with those from lower SNR groups. The COSMIC-2 and RS41 comparison pairs are mainly collected either over lands or islands. We will compare the COSMIC-2 water vapor and refractivity comparisons over oceans, where the larger horizontal water vapor variation will be more significant than those over lands. That will be for a future study.
Ref. [42] has demonstrated that because COSMIC data are of exceptionally high precision and accuracy and have no significant mission-dependent biases above 5 km, they are very suitable for climate monitoring. With similar precision and stability, COSMIC-2 shall also be used as an anchor reference to calibrate other satellite data (see [42]) and in situ RAOB data (see [32,34]). With a deeper penetration, high density, and similar accuracy with those from COSMIC, COSMIC-2 data in the tropical lower troposphere are extremely useful for studying hydrological processes over the tropics (see COSMIC applications in [50,51,52,53,54,55,56,57,58,59,60,61]), and global and regional planetary boundary layer (PBL) structures (see [62]).
Note that the first official release (provisional release) of the COSMIC-2 data product covered the period before February 2020. Validated COSMIC-2 data became available on a real-time operational basis to international NWP centers via the Global Telecommunication System (GTS) on 16 March 2020. Because the phase delay of COSMIC-2 data can be traced to the SI time unit, the quality of COSMIC-2 neutral atmospheric profiles does not change before or after the data became validated. The initial and operational observations are processed and validated equally. Despite using “provisional” data in this study, this study’s findings shall also apply to all data.
NOAA’s National Weather Service (NWS) began parallel testing of the Global Forecast System (GFS) model with and without COSMIC-2 bending angle profiles assimilated shortly after the validated COSMIC-2 data became available, using code and settings adapted from the preliminary non-real-time GFS data forecast impact assessments. In this case, NWS assimilated more limited pre-validated COSMIC-2 observations by its partners in the Joint Center for Satellite Data Assimilation (JCSDA), including NCEP itself, NESDIS/STAR, NOAA/OAR (Oceanic and Atmospheric Research), UCAR, and the U.S. Air Force and U.S. Navy. Following some adjustments to the data assimilation procedure, the COSMIC-2 data demonstrated improved forecast impact when added to the operational GFS. We started to assimilate COSMIC-2 data operationally on 26 May 2020.
While beneficial, the initial implementation is not yet optimized to exploit the advanced capabilities of COSMIC-2 over other RO sensors and missions. Currently, COSMIC-2 data are still used in the same manner as had been tailored for COSMIC-1. Additional development and testing will be conducted to take advantage of the information that COSMIC-2 provided in the moist lower troposphere to improve forecasts further. Efforts also are being made to develop improved forward operators that will increase the impact of all GNSS RO data, including COSMIC-2.
The NESDIS Center for Satellite Applications and Research (STAR) has become the NOAA GNSS RO operation, data monitoring, and science center (https://ncc.nesdis.noaa.gov/GNSSRO/ICVS/index.php). STAR also develops RO data processing package to convert COSMIC-2 L0 data to excess phase [19] and using a Full Spectrum Inversion (FSI) package to convert excess phase to bending angle and refractivity profiles [18]. STAR also developed its independent 1D-var package to covert COSMIC-2 refractivity to temperature and moisture profiles [20]. We will compare the independently derived STAR COSMIC-2 retrievals to those from the UCAR to quantify the implementation-related uncertainties. That will be for future studies.

Author Contributions

Conceptualization and methodology, S.-p.H.; software, data curation, formal analysis, validation and investigation, X.Z., X.S., B.Z., L.A., S.K., Y.H., and E.L.; writing—original draft preparation, S.-p.H.; writing—review and editing, S.-p.H., J.G.Y., and W.X.-S.; resources and supervision, S.-p.H.; project administration and funding acquisition, S.-p.H., J.G.Y., and W.X.-S. All authors have read and agreed to the published version of the manuscript.

Funding

This study was funded by NOAA NESDIS Office of Projects, Planning, and Analysis.

Acknowledgments

The scientific results and conclusions, as well as any views or opinions expressed herein, are those of the author(s) and do not necessarily reflect those of NOAA or the Department of Commerce.

Conflicts of Interest

The authors declare no conflict of interest.

References

  1. Ho, S.-P.; Anthes, R.A.; Ao, C.O.; Healy, S.; Horanyi, A.; Hunt, D.; Mannucci, A.J.; Pedatella, N.; Randel, W.J.; Simmons, A.; et al. The COSMIC/FORMOSAT-3 Radio Occultation Mission after 12 Years: Accomplishments, Remaining Challenges, and Potential Impacts of COSMIC-2. Bull. Am. Meteorol. Soc. 2020, 101, E1107–E1136. [Google Scholar] [CrossRef] [Green Version]
  2. Zeng, Z.; Sokolovskiy, S.; Schreiner, W.S.; Hunt, D. Representation of Vertical Atmospheric Structures by Radio Occultation Observations in the Upper Troposphere and Lower Stratosphere: Comparison to High-Resolution Radiosonde Profiles. J. Atmos. Ocean. Technol. 2019, 36, 655–670. [Google Scholar] [CrossRef]
  3. Ho, S.-P.; Peng, L.; Mears, C.A.; Anthes, R.A. Comparison of global observations and trends of total precipitable water derived from microwave radiometers and COSMIC radio occultation from 2006 to 2013. Atmos. Chem. Phys. 2018, 18, 259–274. [Google Scholar] [CrossRef] [Green Version]
  4. Alexander, S.P.; Tsuda, T.; Kawatani, Y. COSMIC GPS Observations of Northern Hemisphere winter stratospheric gravity waves and comparisons with an atmospheric general circulation model. Geophys. Res. Lett. 2008, 35. [Google Scholar] [CrossRef]
  5. Alexander, S.P.; Tsuda, T.; Kawatani, Y.; Takahashi, M. Global distribution of atmospheric waves in the equatorial upper troposphere and lower stratosphere: COSMIC observations of wave mean flow interactions. J. Geophys. Res. Atmos. 2008, 113, D24115. [Google Scholar] [CrossRef]
  6. Luna, D.; Alexander, P.; De La Torre, A. Evaluation of uncertainty in gravity wave potential energy calculations through GPS radio occultation measurements. Adv. Space Res. 2013, 52, 879–882. [Google Scholar] [CrossRef]
  7. Nath, D.; Chen, W.; Guharay, A. Climatology of stratospheric gravity waves and their interaction with zonal mean wind over the tropics using GPS RO and ground-based measurements in the two phases of QBO. Theor. Appl. Clim. 2014, 119, 757–769. [Google Scholar] [CrossRef]
  8. Healy, S. Forecast impact experiment with a constellation of GPS radio occultation receivers. Atmos. Sci. Lett. 2008, 9, 111–118. [Google Scholar] [CrossRef]
  9. Healy, S. Surface pressure information retrieved from GPS radio occultation measurements. Q. J. R. Meteorol. Soc. 2013, 139, 2108–2118. [Google Scholar] [CrossRef]
  10. Aparicio, J.M.; Deblonde, G.; Aparicio, J.M. Impact of the Assimilation of CHAMP Refractivity Profiles on Environment Canada Global Forecasts. Mon. Weather Rev. 2008, 136, 257–275. [Google Scholar] [CrossRef]
  11. Poli, P.; Moll, P.; Puech, D.; Rabier, F.; Healy, S.B. Quality Control, Error Analysis, and Impact Assessment of FORMOSAT-3/COSMIC in Numerical Weather Prediction. Terr. Atmos. Ocean. Sci. 2009, 20, 101–113. [Google Scholar] [CrossRef] [Green Version]
  12. Cucurull, L. Improvement in the Use of an Operational Constellation of GPS Radio Occultation Receivers in Weather Forecasting. Weather Forecast. 2010, 25, 749–767. [Google Scholar] [CrossRef]
  13. Rennie, M.P. The impact of GPS radio occultation assimilation at the Met Office. Q. J. R. Meteorol. Soc. 2010, 136, 116–131. [Google Scholar] [CrossRef]
  14. Bonavita, M. On some aspects of the impact of GPSRO observations in global numerical weather prediction. Q. J. R. Meteorol. Soc. 2014, 140, 2546–2562. [Google Scholar] [CrossRef] [Green Version]
  15. Bauer, P.; Radnóti, G.; Healy, S.; Cardinali, C. GNSS Radio Occultation Constellation Observing System Experiments. Mon. Weather. Rev. 2014, 142, 555–572. [Google Scholar] [CrossRef]
  16. Anthes, R.A.; Bernhardt, P.A.; Chen, Y.; Cucurull, L.; Dymond, K.F.; Ector, D.; Healy, S.B.; Ho, S.-P.; Hunt, D.C.; Kuo, Y.; et al. The COSMIC/FORMOSAT-3 Mission: Early Results. Bull. Am. Meteorol. Soc. 2008, 89, 313–334. [Google Scholar] [CrossRef]
  17. Anthes, R.A. Exploring Earth’s atmosphere with radio occultation: Contributions to weather, climate and space weather. Atmos. Meas. Tech. 2011, 4, 1077–1103. [Google Scholar] [CrossRef] [Green Version]
  18. Adhikari, L.; Ho, S.-P. Inverting COSMIC-2 Phase Data to Bending Angle and Refractivity Profiles using the Full Spectrum Inversion Method. Remote Sens. 2020. Submitted. [Google Scholar]
  19. Zhang, B.; Ho, S.-P.; Shao, X. Bending Angle Inversion from Raw Observations of COSMIC-2. Remote Sens. 2020. Submitted. [Google Scholar]
  20. Kireev, S.; Ho, S.-P. COSMIC-2 1D Var inversion algorithm Water Vapor Retrievals in Tropical Moisture troposphere. Remote Sens. 2020. Submitted. [Google Scholar]
  21. Kuo, Y.-H.; Wee, T.-K.; Sokolovskiy, S.; Rocken, C.; Schreiner, W.; Hunt, D.; Anthes, R. Inversion and Error Estimation of GPS Radio Occultation Data. J. Meteorol. Soc. Jpn. 2004, 82, 507–531. [Google Scholar] [CrossRef] [Green Version]
  22. Ho, S.-P.; Kirchengast, G.; Leroy, S.; Wickert, J.; Mannucci, A.J.; Steiner, A.K.; Hunt, D.; Schreiner, W.; Sokolovskiy, S.; Ao, C.; et al. Estimating the uncertainty of using GPS radio occultation data for climate monitoring: Intercomparison of CHAMP refractivity climate records from 2002 to 2006 from different data centers. J. Geophys. Res. 2009, 114, D23107. [Google Scholar] [CrossRef] [Green Version]
  23. Ho, S.-P.; Hunt, D.; Steiner, A.K.; Mannucci, A.J.; Kirchengast, G.; Gleisner, H.; Heise, S.; Von Engeln, A.; Marquardt, C.; Sokolovskiy, S.; et al. Reproducibility of GPS radio occultation data for climate monitoring: Profile-to-profile inter-comparison of CHAMP climate records 2002 to 2008 from six data centers. J. Geophys. Res. 2012, 117, D18111. [Google Scholar] [CrossRef]
  24. Jensen, M.P.; Holdridge, D.J.; Survo, P.; Lehtinen, R.; Baxter, S.; Toto, T.; Johnson, K.L. Comparison of Vaisala radiosondes RS41 and RS92 at the ARM Southern Great Plains site. Atmos. Meas. Tech. 2016, 9, 3115–3129. [Google Scholar] [CrossRef] [Green Version]
  25. Melbourne, W.G.; Davis, E.S.; Duncan, C.B.; Hajj, G.A.; Hardy, K.R.; Kursinski, E.R.; Meehan, T.K.; Young, L.E.; Yunck, T.P. The Application of Spaceborne GPS to Atmospheric Limb Sounding and Global Change Monitoring; NASA Jet Propulsion Laboratory: Pasadena, CA, USA, 1994. Available online: https://ntrs.nasa.gov/archive/nasa/casi.ntrs.nasa.gov/19960008694.pdf (accessed on 17 June 2020).
  26. Yunck, T.P.; Liu, C.-H.; Ware, R. A History of GPS Sounding. Terr. Atmos. Ocean. Sci. 2000, 11, 001. [Google Scholar] [CrossRef] [Green Version]
  27. Smith, E.; Weintraub, S. The constants in the equation for atmospheric refractive index at radio frequencies. J. Res. Natl. Inst. Stand. Technol. 1953, 50, 39. [Google Scholar] [CrossRef]
  28. Neiman, P.J.; Ralph, F.M.; Wick, G.A.; Kuo, Y.-H.; Wee, T.-K.; Ma, Z.; Taylor, G.H.; Dettinger, M.D. Diagnosis of an Intense Atmospheric River Impacting the Pacific Northwest: Storm Summary and Offshore Vertical Structure Observed with COSMIC Satellite Retrievals. Mon. Weather Rev. 2008, 136, 4398–4420. [Google Scholar] [CrossRef] [Green Version]
  29. Wee, T.-K. A variational regularization of Abel transform for GPS radio occultation. Atmos. Meas. Tech. 2018, 11, 1947–1969. [Google Scholar] [CrossRef] [Green Version]
  30. Steiner, A.K.; Hunt, D.; Ho, S.-P.; Kirchengast, G.; Mannucci, A.J.; Scherllin-Pirscher, B.; Gleisner, H.; Von Engeln, A.; Schmidt, T.; Ao, C.; et al. Quantification of structural uncertainty in climate data records from GPS radio occultation. Atmos. Chem. Phys. Discuss. 2013, 13, 1469–1484. [Google Scholar] [CrossRef] [Green Version]
  31. Steiner, A.K.; Ladstädter, F.; Ao, C.O.; Gleisner, H.; Ho, S.-P.; Hunt, D.; Schmidt, T.; Foelsche, U.; Kirchengast, G.; Kuo, Y.-H.; et al. Consistency and structural uncertainty of multi-mission GPS radio occultation records. Atmos. Meas. Tech. 2020, 13, 2547–2575. [Google Scholar] [CrossRef]
  32. Ho, S.-P.; Peng, L.; Vömel, H. Characterization of the long-term radiosonde temperature biases in the upper troposphere and lower stratosphere using COSMIC and MetOp-A/GRAS data from 2006 to 2014. Atmos. Chem. Phys. Discuss. 2017, 17, 4493–4511. [Google Scholar] [CrossRef] [Green Version]
  33. Luers, J.K.; Eskridge, R.E. Use of Radiosonde Temperature Data in Climate Studies. J. Clim. 1998, 11, 1002–1019. [Google Scholar] [CrossRef]
  34. He, W.; Ho, S.-P.; Chen, H.; Zhou, X.; Hunt, D.; Kuo, Y.-H. Assessment of radiosonde temperature measurements in the upper troposphere and lower stratosphere using COSMIC radio occultation data. Geophys. Res. Lett. 2009, 36. [Google Scholar] [CrossRef] [Green Version]
  35. Motl, M. Vaisala RS41 trial in the Czech Republic. Vaisala News 2014, 192, 14–17. [Google Scholar]
  36. Jauhiainen, H.; Survo, P.; Lehtinen, R.; Lentonen, J. Radiosonde RS41 and RS92 key differences and comparison test results in different locations and climates. In Proceedings of the TECO-2014, WMO Technical Conference on Meteorological and Environmental Instruments and Methods of Observations, Saint Petersberg, Russia, 7–9 July 2014. [Google Scholar]
  37. Ao, C.O.; Meehan, T.; Hajj, G.A.; Mannucci, A.J.; Beyerle, G. Lower troposphere refractivity bias in GPS occultation retrievals. J. Geophys. Res. 2003, 108, 4577. [Google Scholar] [CrossRef] [Green Version]
  38. Sokolovskiy, S.V. Effect of super-refraction on inversions of radio occultation signals in the lower troposphere. Radio Sci. 2003, 38. [Google Scholar] [CrossRef] [Green Version]
  39. Xie, F.; Syndergaard, S.; Kursinski, E.R.; Herman, B.M. An Approach for Retrieving Marine Boundary Layer Refractivity from GPS Occultation Data in the Presence of Superrefraction. J. Atmos. Ocean. Technol. 2006, 23, 1629–1644. [Google Scholar] [CrossRef]
  40. Schreiner, W.S.; Weiss, J.; Anthes, R.; Braun, J.; Chu, V.; Fong, J.; Hunt, D.; Kuo, Y.; Meehan, T.; Serafino, W.; et al. COSMIC-2 Radio Occultation Constellation: First Results. Geophys. Res. Lett. 2020, 47, e2019GL086841. [Google Scholar] [CrossRef]
  41. Hajj, G.A.; Ao, C.O.; Iijima, B.A.; Kuang, D.; Kursinski, E.R.; Mannucci, A.J.; Meehan, T.; Romans, L.J.; Juárez, M.D.L.T.; Yunck, T.P. CHAMP and SAC-C atmospheric occultation results and intercomparisons. J. Geophys. Res. 2004, 109. [Google Scholar] [CrossRef]
  42. Ho, S.-P.; Goldberg, M.; Kuo, Y.-H.; Zou, C.-Z.; Shiau, W. Calibration of Temperature in the Lower Stratosphere from Microwave Measurements Using COSMIC Radio Occultation Data: Preliminary Results. Terr. Atmos. Ocean. Sci. 2009, 20, 87. [Google Scholar] [CrossRef] [Green Version]
  43. Kursinski, E.R.; Hajj, G.A.; Schofield, J.T.; Linfield, R.P.; Hardy, K.R. Observing Earth’s atmosphere with radio occultation measurements using the Global Positioning System. J. Geophys. Res. Space Phys. 1997, 102, 23429–23465. [Google Scholar] [CrossRef]
  44. Goody, R.; Anderson, J.; North, G. Testing Climate Models: An Approach. Bull. Am. Meteorol. Soc. 1998, 79, 2541–2549. [Google Scholar] [CrossRef] [Green Version]
  45. Ohring, G. Achieving Satellite Instrument Calibration for Climate Change (ASIC3); Workshop Rep.; NOAA: Camp Springs, MD, USA, 2007; 144p. Available online: www.star.nesdis.noaa.gov/star/documents/ASIC3-071218-webversfinal.pdf (accessed on 1 June 2020).
  46. Ho, S.-P.; Kuo, Y.-H.; Schreiner, W.; Zhou, X. Using SI-traceable global positioning system radio occultation measurements for climate monitoring [in “State of the Climate in 2009”]. Bull. Amer. Meteor. Soc. 2010, 91, S36–S37. [Google Scholar] [CrossRef]
  47. Sokolovskiy, S.; Schreiner, W.; Weiss, J.; Zeng, Z.; Hunt, D.; Braun, J. Initial Assessment of COSMIC-2 Data in the Lower Troposphere (LT) Joint 6th ROM SAF Data User Workshop and 7th IROWG Workshop; Konventum: Elsinore, Denmark, 2019. [Google Scholar]
  48. Gorbunov, M. The influence of the signal-to-noise ratio upon radio occultation inversion quality. Atmos. Meas. Tech. 2020. [Google Scholar] [CrossRef] [Green Version]
  49. Ho, S.-P.; Zhou, X.; Kuo, Y.-H.; Hunt, D.; Wang, J. Global Evaluation of Radiosonde Water Vapor Systematic Biases using GPS Radio Occultation from COSMIC and ECMWF Analysis. Remote Sens. 2010, 2, 1320–1330. [Google Scholar] [CrossRef] [Green Version]
  50. Ho, S.-P.; Yue, X.; Zeng, Z.; Ao, C.O.; Huang, C.-Y.; Kursinski, E.R.; Kuo, Y.-H. Applications of COSMIC Radio Occultation Data from the Troposphere to Ionosphere and Potential Impacts of COSMIC-2 Data. Bull. Am. Meteorol. Soc. 2014, 95. [Google Scholar] [CrossRef]
  51. Huang, C.-Y.; Teng, W.-H.; Ho, S.-P.; Kuo, Y.-H. Global variation of COSMIC precipitable water over land: Comparisons with ground-based GPS measurements and NCEP reanalyses. Geophys. Res. Lett. 2013, 40, 5327–5331. [Google Scholar] [CrossRef]
  52. Teng, W.-H.; Huang, C.-Y.; Ho, S.-P.; Kuo, Y.-H.; Zhou, X.-J. Characteristics of global precipitable water in ENSO events revealed by COSMIC measurements. J. Geophys. Res. Atmos. 2013, 118, 8411–8425. [Google Scholar] [CrossRef]
  53. Biondi, R.; Ho, S.-P.; Randel, W.; Syndergaard, S.; Neubert, T. Tropical cyclone cloud-top height and vertical temperature structure detection using GPS radio occultation measurements. J. Geophys. Res. Atmos. 2013, 118, 5247–5259. [Google Scholar] [CrossRef]
  54. Pirscher, B.; Deser, C.; Ho, S.; Chou, C.; Randel, W.; Kuo, Y. The vertical and spatial structure of ENSO in the upper troposphere and lower stratosphere from GPS radio occultation measurements. Geophys. Res. Lett. 2012, 39. [Google Scholar] [CrossRef] [Green Version]
  55. Zeng, Z.; Ho, S.-P.; Sokolovskiy, S.V.; Kuo, Y.-H. Structural evolution of the Madden-Julian Oscillation from COSMIC radio occultation data. J. Geophys. Res. 2012, 117, D22108. [Google Scholar] [CrossRef]
  56. Rieckh, T.; Anthes, R.; Randel, W.; Ho, S.-P.; Foelsche, U. Tropospheric dry layers in the tropical western Pacific: Comparisons of GPS radio occultation with multiple data sets. Atmos. Meas. Tech. 2017, 10, 1093–1110. [Google Scholar] [CrossRef] [Green Version]
  57. Schröder, M.; Lockhoff, M.; Shi, L.; August, T.; Bennartz, R.; Brogniez, H.; Calbet, X.; Fell, F.; Forsythe, J.; Gambacorta, A.; et al. The GEWEX Water Vapor Assessment: Overview and Introduction to Results and Recommendations. Remote Sens. 2019, 11, 251. [Google Scholar] [CrossRef] [Green Version]
  58. Biondi, R.; Randel, W.J.; Ho, S.-P.; Neubert, T.; Syndergaard, S. Thermal structure of intense convective clouds derived from GPS radio occultations. Atmos. Chem. Phys. 2012, 12, 5309–5318. [Google Scholar] [CrossRef] [Green Version]
  59. Xue, Y.H.; Li, J.; Menzel, P.; Borbas, E.; Ho, S.P.; Li, Z. Impact of Sampling Biases on the Global Trend of Total Precipitable Water Derived from the Latest 10-Year Data of COSMIC, SSMIS and HIRS Observations. J. Geophys. Res. Atmos. 2018, 124, 6966–6981. [Google Scholar]
  60. Mears, C.; Ho, S.-P.; Wang, J.; Peng, L. Total Column Water Vapor, [In “States of the Climate in 2017“]. Bul. Amer. Meteor. Sci. 2018, 99, S26–S27. [Google Scholar] [CrossRef]
  61. Mears, C.; Ho, S.-P.; Bock, O.; Zhou, X.; Nicolas, J. Total Column Water Vapor, [In “States of the Climate in 2018“]. Bul. Amer. Meteor. Sci. 2019, 100, S27–S28. [Google Scholar] [CrossRef] [Green Version]
  62. Ho, S.-P.; Peng, L.; Anthes, R.A.; Kuo, Y.-H.; Lin, H.-C. Marine Boundary Layer Heights and Their Longitudinal, Diurnal, and Interseasonal Variability in the Southeastern Pacific Using COSMIC, CALIOP, and Radiosonde Data. J. Clim. 2015, 28, 2856–2872. [Google Scholar] [CrossRef] [Green Version]
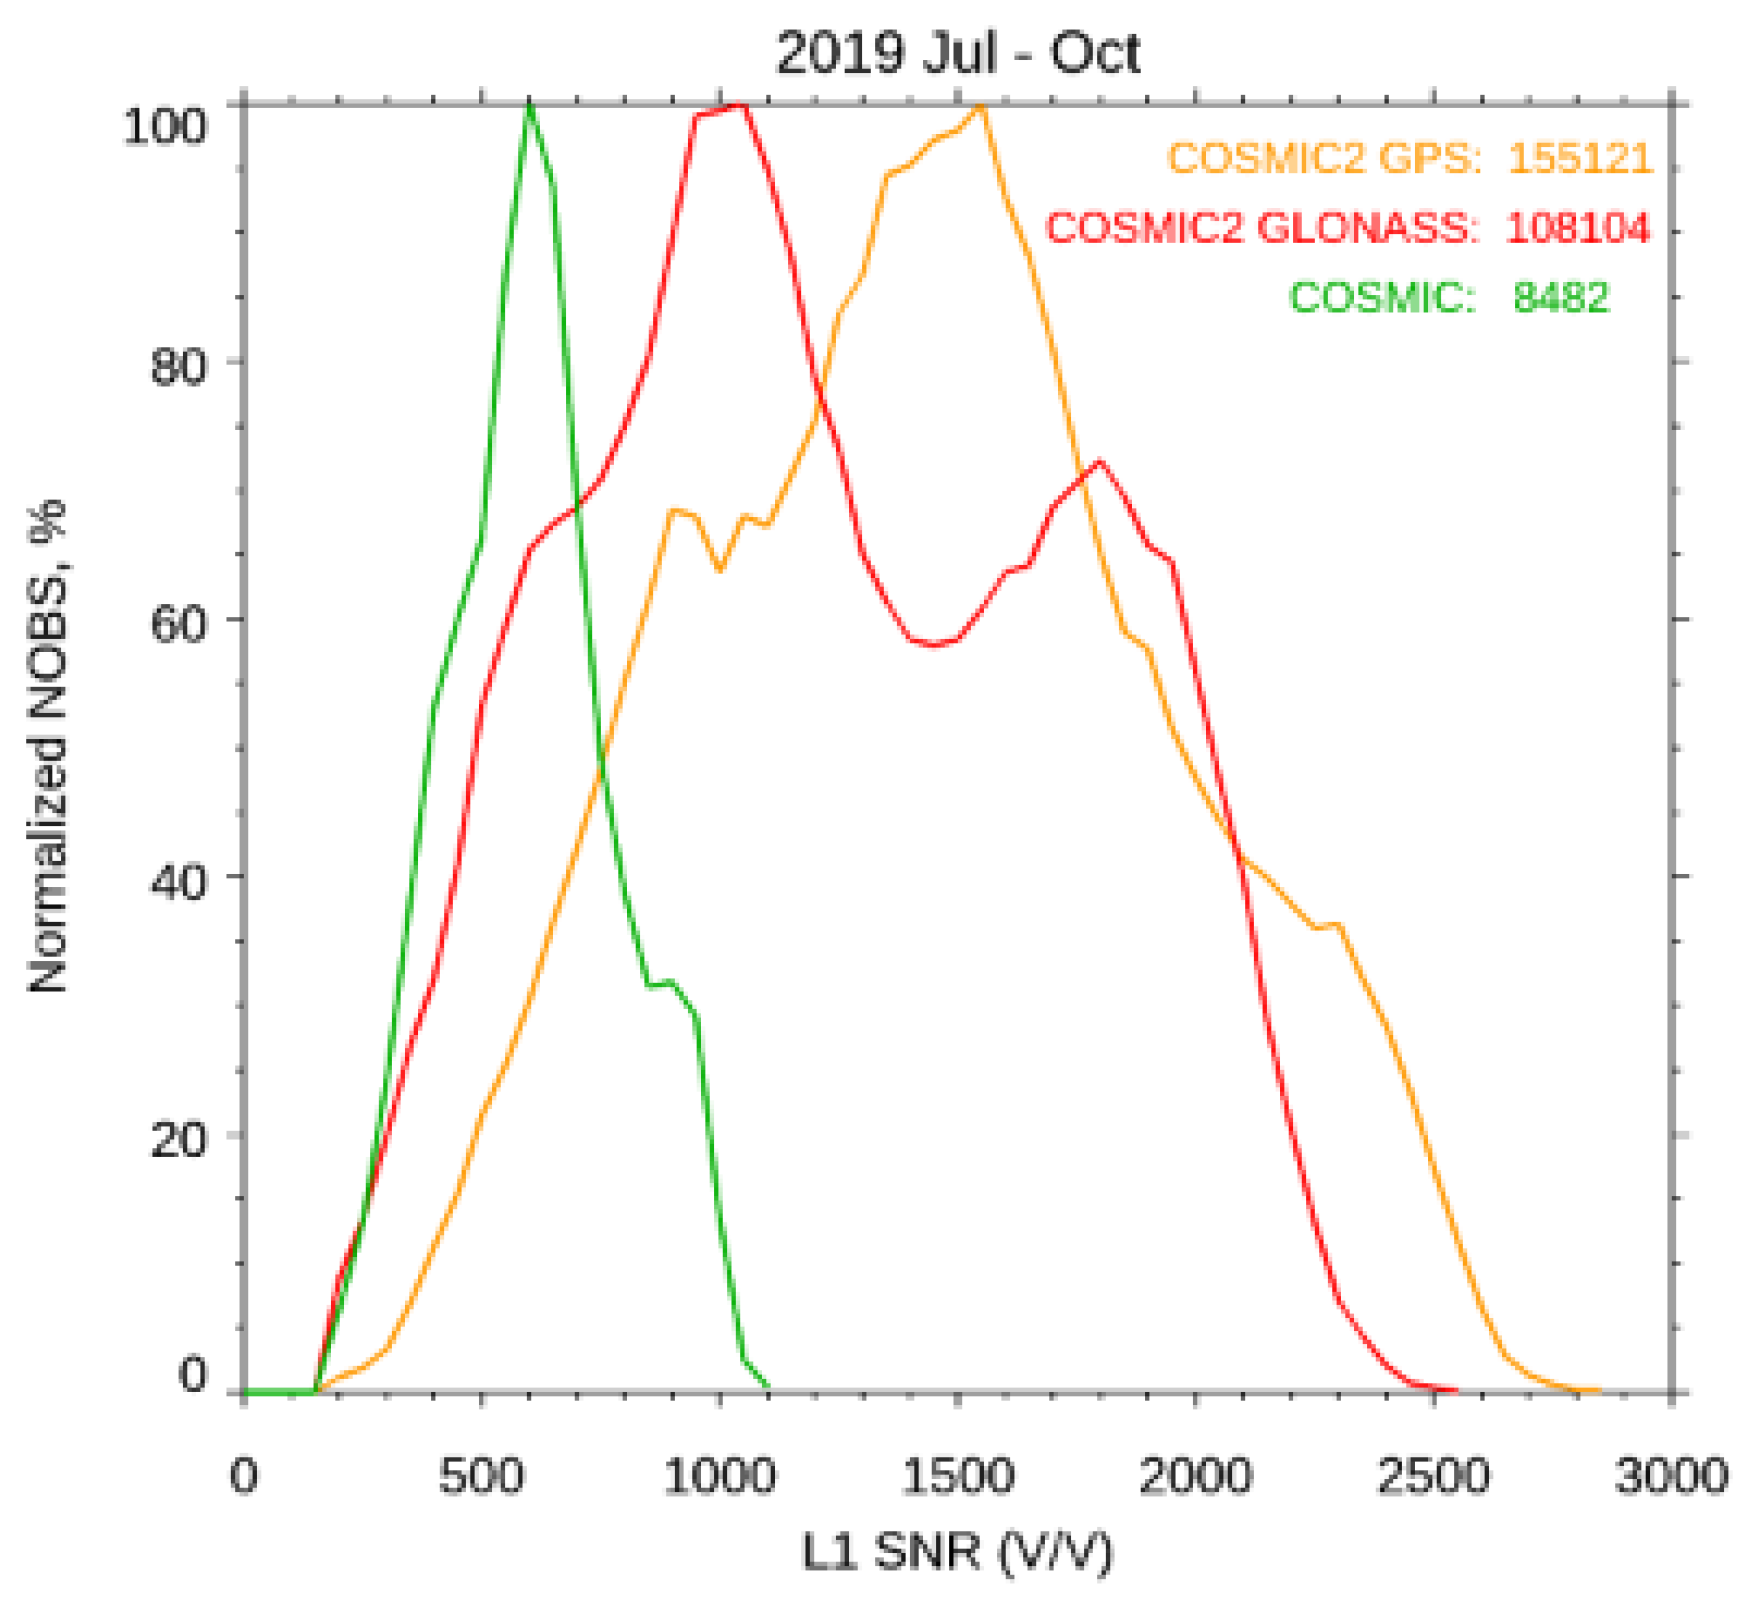
Figure 1. The histograms of the normalized accumulation (in %) L1 SNR for COSMIC (in green line), COSMIC-2 with GPS emitter (in orange line), and COSMIC-2 with GLONASS emitter (in red). The SNR is computed from the average SNR values from 60 km to 80 km geometric height range of the L1 signal. We normalized the lines to the maximum of the sample number of the SNR bin. The mean L1 SNR for COSMIC is equal to 700 v/v, where that for COSMIC-2/GLONASS samples and COSMIC-2/GPS samples are equal to 1100 v/v and 1250 v/v, respectively. All the data are collected from June to October 2019.
Remotesensing 12 04099 g001
Figure 2. (a) The average of COSMIC-2 occultations in 500 × 500 km2 box per day during October 2019. (b) The daily average of the COSMIC-2 (in blues line) and COSMIC (in red line) density distribution was constructed by 500 × 500 km2 cells in the same latitude band. COSMIC data are from October 2009.
Remotesensing 12 04099 g002
Figure 3. The geophysical locations for RS41 data from June to October 2019.
Remotesensing 12 04099 g003
Figure 4. The COSMIC-2 penetration depth over mid-latitude in North Hemisphere (45° N–30° N and 30° N–10° N) and tropical region (10° N–10° S), and mid-latitude Southern Hemisphere (10° S–30° S and 30° S–45° S) over oceans. We also compute the SEM, which is in a vertical line superimposed to the mean.
Remotesensing 12 04099 g004
Figure 5. The mean difference (in red line) and Median Absolute Deviation (MAD) (in green line) of (a) refractivity, (b) dry temperature, and (c) water vapor mixing ratio collected from DOY 211 through 300 of 2019 from COSMIC-2 FM4 and FM1 receivers. The mean difference (precision) for (d) refractivity, (e) dry temperature, and (f) water vapor mixing ratio for the same data pairs but on a smaller x-axis scale (the range of x-axis is from −1 unit to 1 unit) compared to those for (a)–(c), respectively.
Remotesensing 12 04099 g005
Figure 6. The fractional refractivity comparisons for (a) COSMIC-2–COSMIC pairs for October 2019 and (b) COSMIC-2–KOMPSAT-5 pairs. The mean differences are in the red line, and the standard deviations of the mean difference are in the green line. The sample numbers are in the blue line. The SEM is in the horizontal black lines superimposed on the mean.
Remotesensing 12 04099 g006
Figure 7. Monthly plots for fractional refractivity differences between COSMIC-2 and other RO missions (a) from the surface to 5 km altitude, (b) from 5 km to 15 km altitude, (c) from 15 km to 25 km altitude, (d) from 25 km to 40 km altitude, and (e) from 40 km to 60 km altitude from October 2019 to January 2020.
Remotesensing 12 04099 g007
Figure 8. The fractional refractivity comparisons for (a) the COSMIC-2/GPS-RS41 pairs, and (b) COSMIC-2/GLONASS–RS41 pairs. The mean differences are in the red line, and the standard deviations of the mean difference are in the green line. The sample numbers are in the blue line. The standard errors of the means are in the horizontal black lines superimposed on the mean line. The mean and std values are computed from surface to 30 km altitude.
Remotesensing 12 04099 g008
Figure 9. Similar to Figure 8 but for COSMIC-2–RS41 water vapor pairs where COSMIC-2 data are from (a) the non-beamforming period and (b) the beamforming period.
Remotesensing 12 04099 g009
Figure 10. The temperature comparisons from 8 km to 32 km altitude for (a) COSMIC-2 and RS41 pairs, and (b) COSMIC-2 and RS92 pairs. The sample numbers are in the blue line, the mean differences are in red line, and the standard deviation values are in green line.
Remotesensing 12 04099 g010
Figure 11. Similar to Figure 10 but for the COSMIC-2–RS41 pairs over (a) day time, and (b) night time.
Remotesensing 12 04099 g011
Figure 12. The COSMIC-2 fractional refractivity mean differences and standard deviation compared to those collocated RS41 profiles from June to October 2019 (a) over global (45° N to 45° S), (b) mid-latitude North Hemisphere (45° N to 20° N), (c) tropical region (20° N–20° S), and (d) mid-latitude South Hemisphere (20° S to 45° S). The mean biases and standard deviation relative to the mean are computed from surface to 30 km altitude. The sample numbers are in the blue line, the mean differences are in red line, and the standard deviation values are in green line.
Remotesensing 12 04099 g012
Figure 13. Similar to Figure 12 but for COSMIC-2 profiles for SNR of (a) 0–500 v/v group, (b) 500–1000 v/v group, (c) 1000–1500 v/v group, (d) 1500–2000 v/v group, and (e) > 2000 v/v group. The SEM is in the horizontal black lines superimposed on the mean. The sample numbers at 5 km altitude are listed in the figures. The sample numbers are in the blue line, the mean differences are in the red line, and the standard deviation values are in the green line.
Remotesensing 12 04099 g013
Figure 14. Similar to Figure 13 but for COSMIC-2 water vapor profiles from the surface to 5 km altitude for different SNR groups.
Remotesensing 12 04099 g014
Table 1. The corresponding penetration heights for 80% of accumulated samples collected from June to October 2019 at the 45° N–30° N and 30° N–10° N, 10° N–10° S, 10° S–30° S, and 30° S–45° S latitude bands for COSMIC-2, COSMIC, KOMPSAT-5, and MetOp -A,/-B, -C GRAS. COSMIC-2 penetration depths are separated into the 0–500 v/v group, 500–1000 v/v group, 1000–1500 v/v group, 1500–2000 v/v group, and >2000 v/v group.
45° N–30° N30° N–10° N10° N–10° S10° S–30° S30° S–45° S
COSMIC-2 0-500 v/v group1.21.21.31.20.8
COSMIC-2 500-1000 v/v group1.10.91.20.90.7
COSMIC-2 1000-1500 v/v group0.90.70.80.70.6
COSMIC-2 1500-2000 v/v group0.80.50.50.50.5
COSMIC-2 > 2000 v/v group0.60.40.30.40.4
COSMIC-21.00.80.80.70.6
COSMIC1.01.11.20.90.7
KOMPSAT-51.01.21.30.90.6
MetOp-A4.64.43.74.02.0
MetOp-B3.13.43.34.41.9
MetOp-C4.64.64.24.41.8
Table 2. The COSMIC-2–RS41 fractional refractivity differences and stds in different latitudinal zones.
Comparison Regions45° N to 45° SNorth Hemisphere (45° N to 20° N)Tropical Region (20° N–20° S)Mid-Latitude South Hemisphere (20° S to 45° S)
Mean Difference (Stds) (%)−0.33(1.83)−0.25 (2.02)−0.36(1.77)−0.08 (1.43)
Sample number at 10 km altitude28336621821307
Table 3. The mean fractional refractivity difference and standard deviation from the surface to 5 km altitude for five SNR groups.
L1 SNR RangeMean Difference for Fractional Refractivity (std) from the Surface to 5 km Altitude (in %)Sample Number at 5 km Altitude
0–500 v/v−1.7(3.65)199
500–1000 v/v−0.63 (3.82)738
1000–1500 v/v−1.25(3.88)865
1500–2000 v/v−0.89(3.51)787
>2000 v/v−1.69(3.95)292
Table 4. The mean COSMIC-2–RS41 difference of the water vapor profiles from the surface to 5 km altitude for five SNR groups.
L1 SNR RangeMean Difference (stds) for Water Vapor from the Surface to 5 km Altitude (g/kg)
0–500 v/v−1.34 (2.51)
500–1000 v/v−1.17 (2.63)
1000–1500 v/v−1.33 (2.65)
1500–2000 v/v−0.93 (2.55)
>2000 v/v−1.52 (2.62)
Publisher’s Note: MDPI stays neutral with regard to jurisdictional claims in published maps and institutional affiliations.