Technical Note

Using Remote Sensing Techniques to Document and Identify the Largest Underwater Object of the Baltic Sea: Case Study of the Only German Aircraft Carrier, Graf Zeppelin

Department of the Navigation and Hydrography, Faculty of Navigation and Weapons, Polish Naval Academy of the Heroes of Westerplatte Śmidowicza Str. 69, 81-127 Gdynia, Poland
Remote Sens. 2020, 12(24), 4076; https://doi.org/10.3390/rs12244076
Submission received: 19 November 2020 / Revised: 8 December 2020 / Accepted: 11 December 2020 / Published: 12 December 2020

Abstract

:
New shipwrecks are usually found during other work at sea. In 2006, the research vessel St. Barbara discovered probably the most massive wreck that lies on the bottom of the Baltic Sea. Its identity was unknown, and the Arctowski was sent to conduct research. In this study, the author describes how an adequately selected research methodology using remote sensing technology can lead to obtaining precious and accurate measurement data. The article proposes an appropriate approach to identifying the most massive underwater object in the Baltic Sea. The results of bathymetric and sonar tests are presented. Unconventional use of scanning sonar, which was undoubtedly not foreseen by the manufacturer, was also proposed. The article also shows how some remote sensing techniques support and complement each other when verifying objects on the bottom. Moreover, this paper addresses the impact of sonar frequency and survey methodology on image resolution and data quality. If imaged under the right conditions, side-scan sonar can deliver records based on which shipwreck identification is possible. The wreck of the aircraft carrier lies at the bottom of the Baltic Sea at a depth of about 90 m. Some difficulties in measurements were caused by the lack of a depressor, the use of a light cable line, or the lack of a standard side-scan sonar winch. However, these limitations did not significantly affect the quality of the recorded data. The research results prove that the proposed methodology for using side-scan sonar (SSS) or scanning sonar is correct, and the obtained measurement data make it possible to identify the detected object at the level of 99%.

1. Introduction

The seabed in many parts of the world is a kind of graveyard for ships and boats. Naval battles, piracy, and catastrophes have left countless shipwrecks over the centuries, and most shipwrecks remain in place. Due to their great depths, most of the world’s seas and oceans are inaccessible to deep-sea explorers, marine archaeologists, hydrographers, and divers. Therefore, scientists are forced to use advanced measurement technologies to perform tests in all conditions. Unmanned measurement platforms and hydroacoustic systems for underwater research are undeniably significant [1].
The effectiveness of acoustic bottom mapping systems has evolved since the 1970s. Their main advantages include non-invasiveness and the ability to survey large bottom areas with relatively high resolution quickly. One-day sonar surveys result in high-resolution acoustic images covering even several thousand square kilometers of the bottom surface [2,3]. The data are applied to identify seabed sediments, bottom structure and morphology, and geological forms and visualize various objects such as cables, pipelines, and sunken vessels.
Various measurement methods and techniques are employed to search for and examine wrecks. Due to the effectiveness of operation, the most popular techniques include multibeam echo sounder (MBES), single beam echo sounder (SBES), side-scan sonar (SSS), and remote underwater vehicles (ROV) [4,5,6]. Due to the progressive development of remote sensing technology, sonars and echo sounders have become not only smaller but also more accessible due to the decrease in unit prices of these devices [7,8,9]. Remote sensing equipment and vehicles have great potential in hydrography, offshore industry, and marine archeology. They are also excellent at mapping shipwrecks or planes at various depths [10]. Their efficiency and testing accuracy significantly depend on the adopted measurement methodology and the so-called good hydrographic practice. The current marine archaeological research [11,12,13] suggests that the side-scan sonar is a useful tool in imaging intact underwater objects such as wrecks of ships standing on an even keel. C. R. Bates et al. [14] noted that side-scan sonar should produce a low grazing angle to obtain good quality sonar data to detect intact shipwrecks. Such a propagating signal geometry will increase the acoustic shadow effect. The positioning of sonar data is most often performed using the “layback and offset” method, which does not guarantee the same accuracy as the ultra-short baseline (USBL) system [15,16,17].
Quinn et al. (2005) claim that the most effective range of side-scan sonar work in high-resolution studies of wrecks is 40 m (for detection) and 10–15 m for site-specific investigations [18]. As for massive wrecks lying at depths over 80 m, such ranges may not provide the desired results in the form of sharp and detailed imaging. Therefore, the question arises of what sonar parameters should be used to provide high-resolution sonograms?
When towing a side-scan sonar in the water, the height of the sonar above the bottom is the fundamental operating parameter in obtaining high-quality data. If the sonar is high above the bottom, the waves and the sea surface affect it. If the sonar is towed too low, there is a risk of hitting the seabed or lying underwater objects. Various positions can be found in the literature about the side-scan sonar towing parameter. The publication [16] states that the side-scan sonar should be towed above the bottom at the height of 8–20% of the given operating range. Kvitek et al. [19] believe that sonar towing height should be between 10% and 40% of the selected working range. It is relatively imprecise information that gives broad discretion to the sonar operator. On the other hand, Penrose et al. [20] believe that the sonar must be above the bottom about 10-20% of the set operating range to obtain the maximum coverage of the bottom. However, Kenny et al. [21] argue that side-scan sonar should be towed from 10 to 20 m above the bottom while stating that the value of 25% of the sonar’s working range should be generally assumed. Yong and Qiang [22] are of the view that the maximum height above the bottom of the towed side-scan sonar should not exceed 15% of the range used, whereas Dondurur [23] takes values from 10–20% of the range as the most optimal. Similar sonar height values are presented in [24].
The search and study of underwater obstacles is a particular type of broadly understood hydrographic survey, the primary purpose of which is, among others, to identify the position of the object (wreck) and determine the minimum depth above it. Newly discovered underwater objects that may pose a threat to both surface and underwater navigation should be reported immediately to the national hydrographic services [25]. In Poland, the role of the state maritime hydrographic service is performed by the Hydrographic Office of the Polish Navy (HOPN). HOPN as a state service and the Polish Navy Hydrographic Service are tasked to conduct hydrographic measurements in Polish sea areas for cartographic purposes and navigation safety. This task is carried out based on hydrographic vessels possessed by the Hydrographic Support Squadron of the Polish Navy (HSSPN).
This study shows that a properly selected research methodology using remote sensing techniques can guarantee to obtain valuable measurement data on a newly discovered wreck with large dimensions. The article presents the course of survey works conducted after detecting the most massive 260 m long wreck in the Baltic Sea. There is also proposed an unconventional use of scanning sonar, which the manufacturer has certainly not foreseen. It is described how some remote sensing techniques support and complement each other when verifying objects on the seabed. Besides, the author presents evidence confirming the shipwreck identity.
The paper is structured as follows. The introduction to the study, purpose, and key publications cited are provided in Section 1. Section 2 details the history of the German aircraft carrier Graf Zeppelin, study area, survey planning, introduces methodology, equipment used, and hydrographic data acquisition stage. Section 3 present the results of the bathymetric and sonar surveys and demonstrates how the wreck identification process was carried out. Section 4 concludes the paper.

2. Materials and Methods

2.1. Study Area

On 11 July 2006, the research vessel “St. Barbara”, which is part of the fleet “Petrobaltic” S.A., went to sea with the task of performing routine bathymetric measurements. The work aimed at determining the shape and depth of the seabed in the “Baltic Beta” mining platform area. The next day, during one of the turns near the Sea Oil Mine, 41.6 nautical miles N of the Rozewie lighthouse, the ship detected an unknown underwater object over a quarter of a kilometer long (Figure 1). Data recorded with the multibeam echo sounder confirmed a new wreck 260 m long, 30 m wide, lying at a depth of about 87 m (Figure 2).
Two weeks after detecting a new, large object, the Polish Navy hydrographic vessel “Arctowski” was tasked with verifying the detected underwater object with significant spatial dimensions. The crew was supposed to perform hydrographic surveys and assess the degree of risk to shipping safety.

2.2. Historical Background

When Hitler was appointed chancellor of the German Reich in January 1933, military operations underwent significant changes, and the Versailles restrictions on the German Army were lifted. After the Supreme Command of the Navy’s emergence, the so-far forbidden shipborne air force started to be dealt with [26]. The construction of the first aircraft carrier was included in the 1935 budget, but it was not until the 1936 budget that the project, given the construction symbol “A”, would begin [27]. On 16 November 1935, the shipyard Deutsche Werke Kiel AG was contracted to build the aircraft carrier “A” and the ship construction received the number “252”. On 8 December 1938, in the presence of Adolf Hitler, the hull of the aircraft carrier, then named “Graf Zeppelin,” was launched.
After the outbreak of World War II, “Graf Zeppelin” was 85–90% completed. Unfortunately, due to the urgent need to build U-boats, the work on the aircraft carrier was increasingly interrupted. In April 1940, the 15 cm anti-aircraft gun was removed and transported to Norway to be incorporated into the coastal defense system. On 19 June 1941, the ship was towed to Szczecin, where it moored at Wały Chrobrego. Germany feared that the Soviet air force could threaten such a large vessel [28]. On 13 May 1942, a decision was made to continue its construction. Some changes were introduced to the equipment and design. Unfortunately, on 30 January 1943, Hitler ordered to cease the construction of all large combat units, which resulted in the suspension of “Graf Zeppelin” construction [29]. The aircraft carrier Graf Zeppelin, completed in over 90%, was towed to Szczecin in April. It was moored in one of the Odra River arms and masked to look like an island from the air [27].
After the end of the war, “Graf Zeppelin” was assigned to the Soviet Union following international agreements [30,31]. Under a resolution adopted by the Soviet government, it was decided to destroy the aircraft carrier using an experiment to test its combat viability. On 14 August 1947, port tugs led the carrier out of Świnoujście and brought it to a separate maritime training ground. Two days later, testing the influence of the waterborne impact of combat agents began [32,33]. Successively fired charges did not cause significant damage. The bombing of the aircraft carrier with Pe-2 planes showed only how weak the P-50 bombs were to cause more severe damage to the ship. On 17 August 1947, the carrier began to drift slowly towards the shallows. Torpedo boats and speeders from Baltiysk were called in to sink “Graf” quickly. The aircraft carrier received two hits with 533 mm torpedoes, and 23 min after the explosion of the second torpedo, “Graf Zeppelin” disappeared from the surface of the sea. The aircraft carrier showed extraordinary vitality. The lack of official information about the experiment results and the site of its sinking caused the dissemination of several versions of the final fate of the only German carrier “Graf Zeppelin”.
In construction and technological terms, the “Graf Zeppelin” was one of the most interesting new types of German warships. The aircraft carrier consisted of 19 watertight compartments and seven decks [27]. The double bottom was 170 m. The ship was designed as an “island type”, which meant the superstructure concentration in a kind of “island” on the starboard side. New materials, “hard wotan” and “soft wotan,” were used for the “Graf Zeppelin” construction. Four sets of steam turbines with reduction gears produced 200,000 hp, which gave a top speed of 34.5 knots. “Graf Zeppelin” had two parallel rudders and four four-blade propellers [32]. The aircraft carrier had two hangars, one above the other, with a total area of over 5450 m2. The flight deck was made of steel and had a total length of 244 m and a width of 30 m. The outer, wooden layer of the deck was placed on top of it. Communication between the hangars and the flight deck was provided by three armored lifts with a lifting capacity of 6.5 T. The elevators had the shape of the 13 × 14 m octagon in the top plan. The weight of the lift was 50 T. It was the only solution of this type in the world [30].

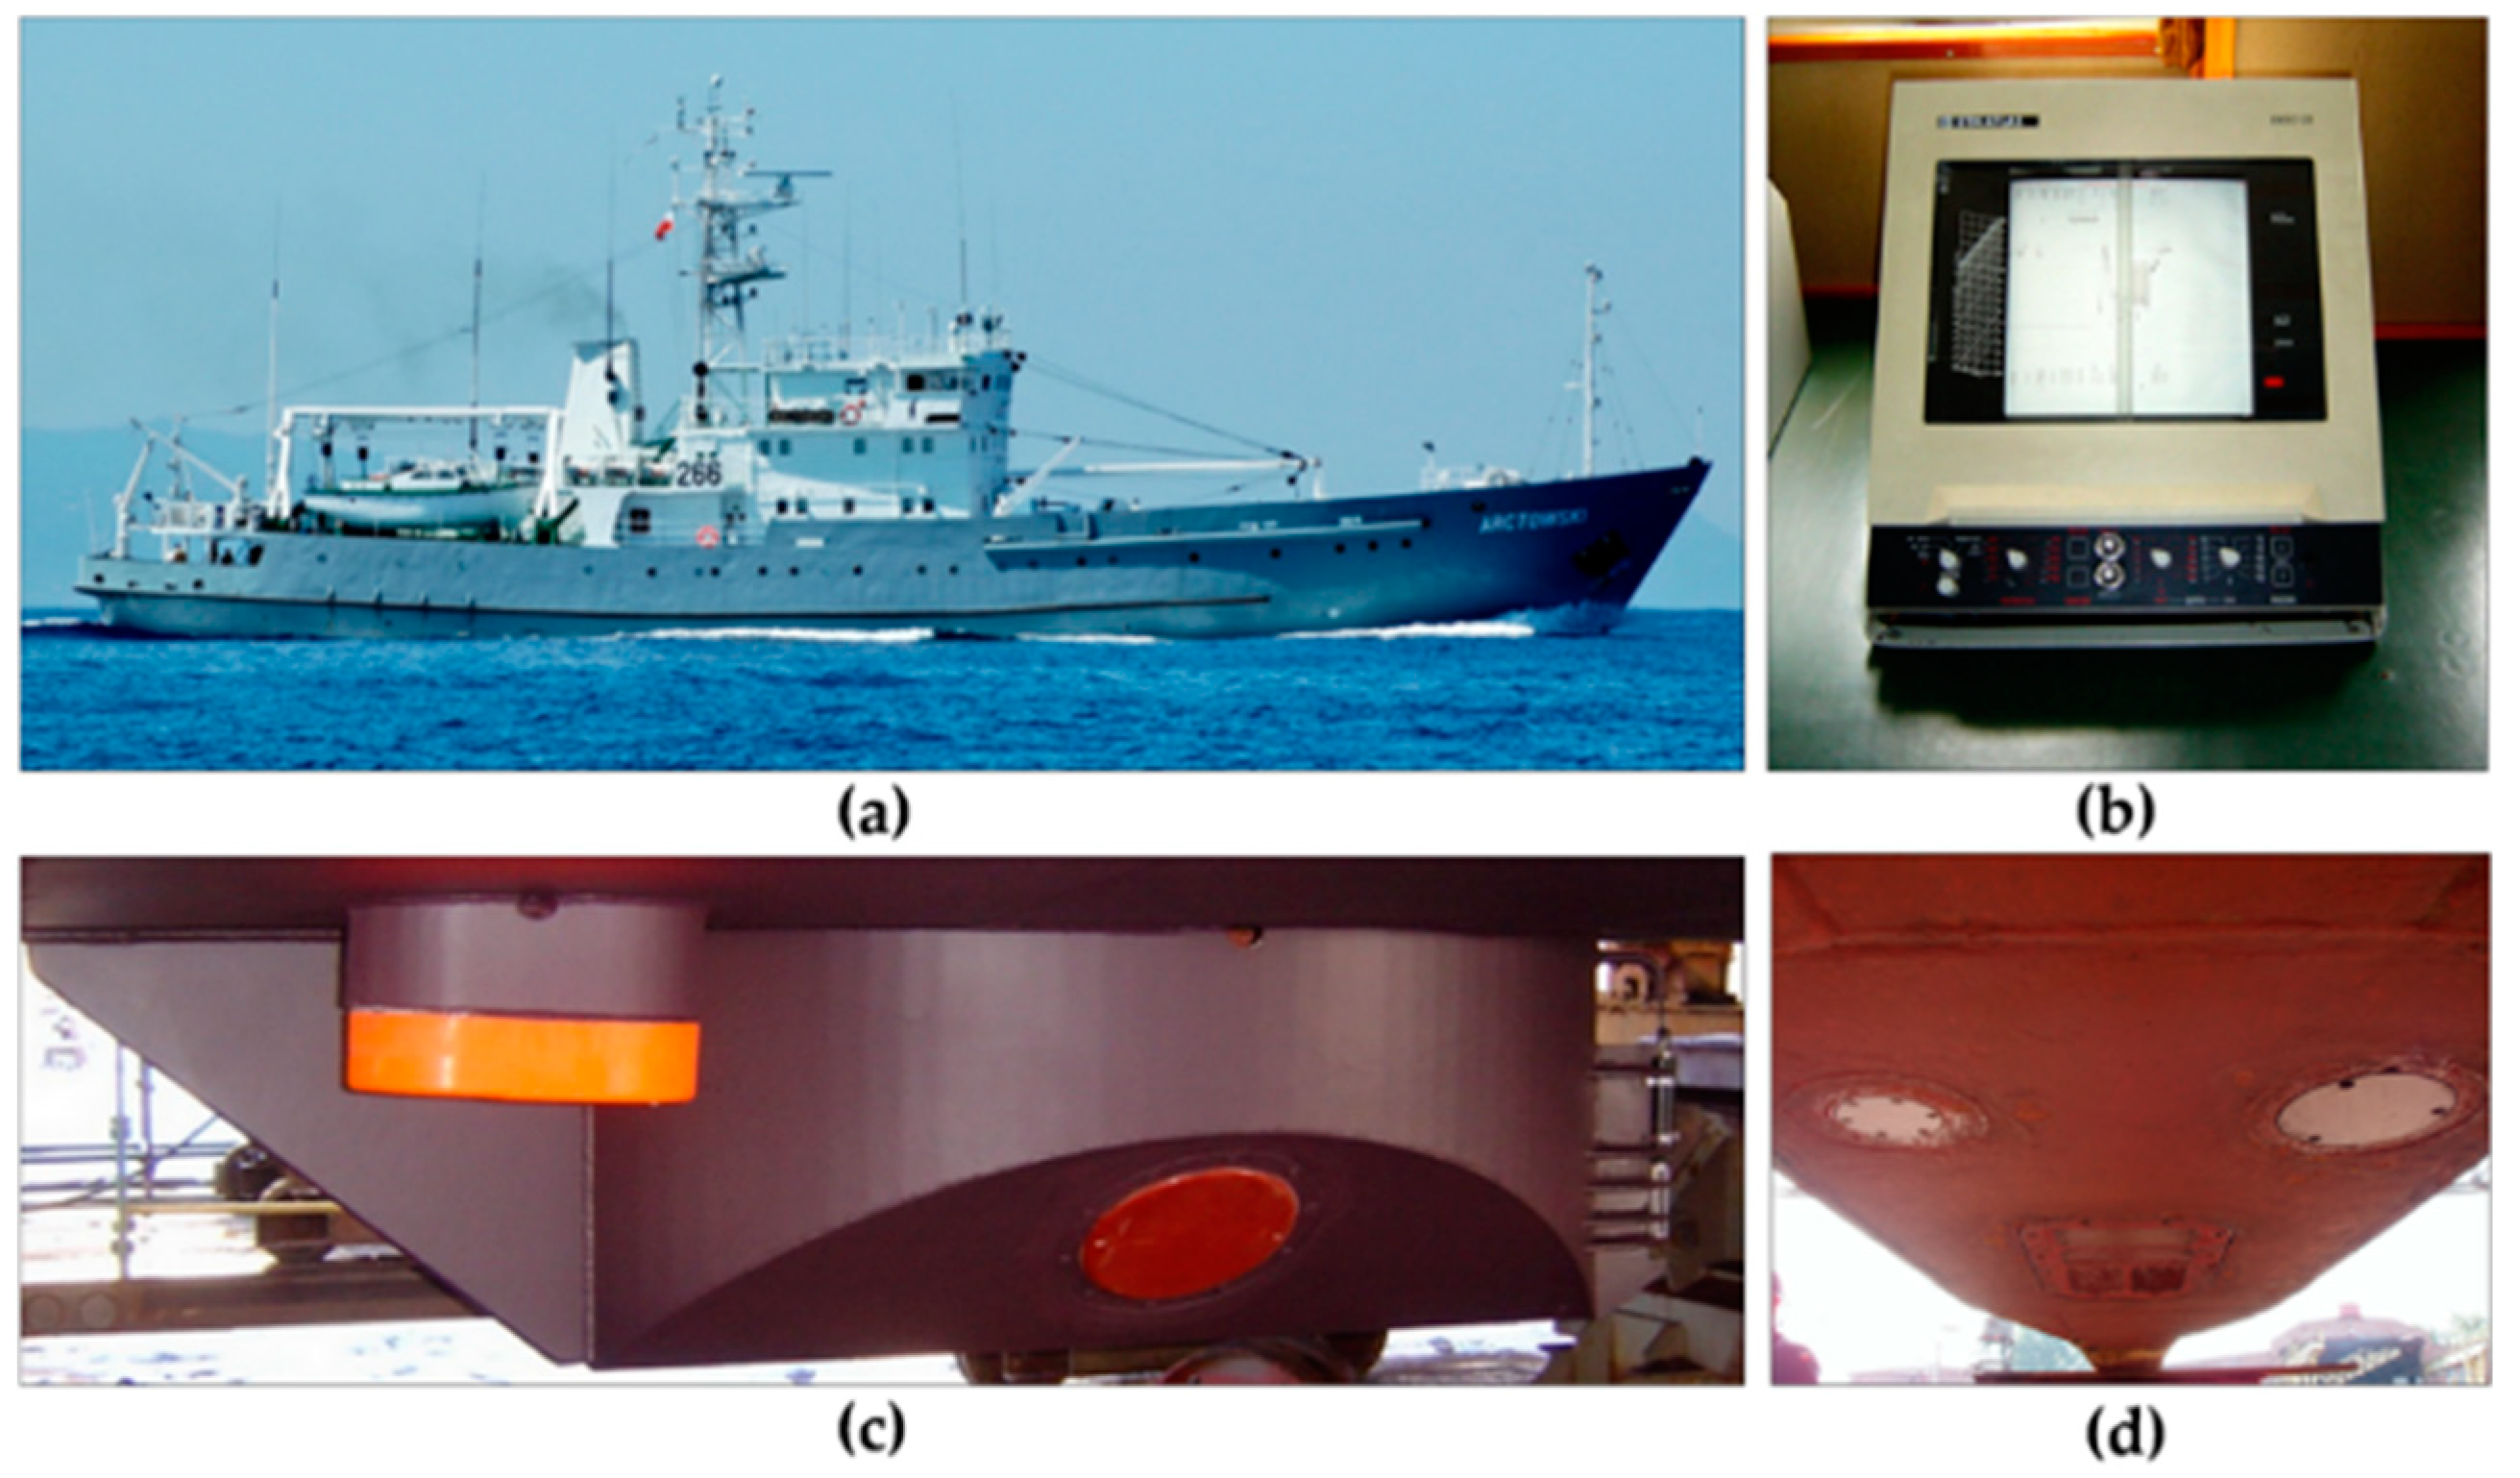
2.3. Survey Planning and Acquisition of Bathymetric Data

Before going to sea, the necessary archival materials, historical photos, drawings, plans, and diagrams of the aircraft carrier were gathered and carefully analyzed before and during the survey. The author has collected some interesting publications from domestic and foreign magazines and books about the fate of the German aircraft carrier Graf Zeppelin. A preliminary analysis of the research object was made, and its history, structure, and necessary technical data were familiarized together with ship hydrographers and HOPN representatives.
The research used full-time hydrographic measuring equipment, i.e., multibeam echo sounder, single beam echo sounder (SBES), side-scan sonar (SSS), towed dual-frequency side-sonar (Towfish), and the entire set of additional devices supporting the process of marine measurements. Besides, a remotely operated vehicle (ROV), which belongs to the equipment of the Polish Naval Academy, was used.
In the first test stage, the conductivity, temperature, depth (CTD) Valeport probe for measuring the sound speed was dropped to obtain the local distribution of the sound speed in the water column. The 1130 × 580 m survey area, covered with a grid of similar basic profiles in the directions of 060–240° and control profiles in the directions of 150–330°, was designated based on the technical task (Figure 3). The project was prepared using the Quality Integrated Navigation System (QINSY; developed by Quality Positioning Service, Zeist, the Netherlands) software. In the case of multibeam sonar, a system of straight, parallel survey lines proves to be the most effective way to cover the bottom with acoustic beams. In areas with unknown seabed morphology, bathymetric measurements are recommended as a priority. Detailed knowledge of the water depth distribution or the shape of the seabed, especially in the vicinity of the detected underwater object, is essential for the safety of navigation, fishing, and archaeological site documentation [34]. A multibeam echo sounder allows a relatively quick wreck location and covers the surrounding bottom with bathymetric measurements.
The research used the Kongsberg Maritime EM 3000D Multibeam Echo Sounder with a system of two sonar heads operating at a frequency of 300 kHz [35]. Two sonar heads are tilted 40 degrees to port and starboard to obtain a more comprehensive swath coverage (Figure 4). The EM 3000D Echo Sounder has 127 simultaneous receive beams for each transducer with a total efficient swath coverage of 160 degrees.
During the passage of the ship along survey lines designed directly above the wreck, bathymetric data were additionally recorded using two Single Beam Echo Sounders Deso-25 (Atlas Elektronik, Bremen, Germany) and EA400 (Kongsberg Simrad, Horten, Norway) (Figure 4). The Deso-25 is a fully adjustable dual-channel precise surveying echo sounder. The 210 kHz transducer (θ = 9°) provides high accuracy for most survey applications, while the 33 kHz transducer (θ = 18°) can sound in deep water and tends to penetrate very soft seabed [36]. The Kongsberg Simrad EA400 is a single frequency echo sounder designed for the hydrographic survey, and it operates with a frequency of 38 kHz. The sonar indicator is a color liquid crystal panel. Unlike the previously described Deso-25, in the EA-400, the echogram is not recorded on paper. Instead, the raw signal from the transducer is written directly to the hard disk of the echosounder steering computer [37].
The wreck examination using a vertical echosounder consisted primarily in the movement of the hydrographic vessel along strictly defined lines with the simultaneous registration of depth values related to precisely defined geographical coordinates. The measurements aimed mainly to record the above-wreck minimum depth to include in the navigational charts. The initial object examination with MBES enabled the determination of points above the wreck with minimum depths, the design of profiles for sonar testing, the development of a methodology for the use of towed sonar and checking the bottom clearance around the underwater object.

2.4. Mapping the Shipwreck-Site with Side-Scan Sonar

After obtaining full information about the minimum depths above the wreck and their places, the next stage of measurements, i.e., sonar examination, was commenced. During the work, high-resolution sonar images of the bottom and the underwater object using side-scan sonar were to be recorded. The research of the “Graf Zeppelin” wreck was carried out using the ACSON-100 Hull-Mounted Side-Scan Sonar operating at 100 kHz and the EdgeTech DF-1000 Side-Scan Sonar (“towfish”) operating simultaneously on two frequencies of 100 and 500 kHz. The DF-1000 Digital Sonar was towed on a Kevlar cable, and the data were recorded in the Coda DA-50 computer acquisition system. The objects were positioned using the layback and offset method. The ship was moving parallel to the long axis of the object, “illuminating” it with the sonar beam from one side to the other. At the beginning of the survey, the sonar range was set to 150 m.
The handbook [25] recommends that the minimum number of passes with a towed side sonar be 4. Two survey lines should run parallel to the long wreck axis, and the next two should be perpendicular to the first pair. What is more, each time, both sides of the wreck should be “illuminated” with a sonar beam. However, many more sonar passes were made to obtain as much sonar data as possible during the Graf Zeppelin examination. The towing speed was between 2 and 4 knots, and it was a threshold value for maintaining the ship’s maneuverability. In the absence of a depressor, the presence of the lightweight cable line, and the lack of a standard sonar winch, the wreck depth (87 m) constituted a kind of challenge. No depressor was used in the examination and taking the lightweight cable into account; it was necessary to estimate the effectiveness of using the newly acquired DF-1000 sonar at greater depths (more than 50 m). For this purpose, a week before the departure for the “Graf Zeppelin” verification, tests were performed at sea using the towed DF-1000 sonar. In this study, there was no depressor available.
Tests were performed at sea at a depth of 64.6 m to estimate the effectiveness of using the new DF-1000 sonar at various depths. The tests were to determine the actual dependence of the depth of immersion of the DF-1000 sonar deployed into the water on a 300 m long lightweight cable as a function of towing speed and length of a loose cable behind the stern. It was crucial to empirically determine the sonar immersion depth parameter for a given towing speed and the cable line length released behind the stern (Figure 5).
The ship was moving along the profile with V = 5 knots, V = 4 knots, V = 3 knots, and V = 2.5 knots. The cable line was loosened every 20 m to the maximum length of Lc = 285 m for each speed. The sonar position results were recorded in a chart. The test lines were designed in the directions of 160–340°. The minimum speed at which the ship was obeying the helm was 2.5 knots. With a constant sea depth Z in the test area, the values of the sonar height above the seabed Fa (Fish altitude were changed to the sonar depth parameter Fd (Fish depth) according to the formula:
F d = Z F a
The obtained results are presented in the form of graphs in Figure 6.
The sea results indicate that the tested sonar will submerge a maximum of 55 m below the sea surface at a minimum speed of 2.5 knots. That means that when the sonar operation range is set to 100 m and the sonar height above the bottom parameter is assumed to be 10% of the selected range, the maximum depth of the water on which sonar surveys can be effectively conducted is 65 m. The GZ wreck was at a depth of 87 m, but, due to its height, the research approach had to be changed regarding wreck’s size.
For a side-scan sonar operation, there are some factors to keep in mind. These include resolution, towing speed, optimum range scale, frequency channel, sonar height, etc. The bathymetry in the survey area is essential. The depth distribution should be known, mostly minimum depths over the wreck. The position of the wreck and its state of preservation are equally significant. It is required to know the answers to the following questions: what is the safe towfish height, how long tow cable is required, and is a depressor necessary to obtain high-resolution sonar images? Some calculation must be done before the survey starts to fulfill the requirements of the sonar examination.
Sonar resolution controlled by the transducer beamwidth, pulse length, and pulse repetition frequency is one of the most critical parameters for side-scan sonar. The data resolution that the side-scan sonar records also depends on data acquisition conditions [38,39]. The values of the longitudinal and transverse resolution of the sonar used were determined to estimate the expected quality of sonar images and the possibility of using these data for identification. The across-track resolution, Ry, is a function of the effective pulse length τ of the acoustic signal, the speed of sound c in the water, and the grazing angle β. This angle is rather unknown and often replaced with 0 or with the value expected for the flat bottom. The across-track resolution is calculated as follows [40]:
R y = c · τ 2 · cos β
where c is sound speed in the water [m/s]; τ is pulse length [s]; and β is grazing angle [°].
The pulse length of the ACSON-100 side-scan sonar is 1.5 and 0.1 ms for the DF-1000 EdgeTech (100 kHz) and 0.01 ms for 500 kHz channel. The speed of sound speed in water was adopted for the calculations, c = 1500 m/s. The calculated values of the across-track resolution are displayed in Table 1 and Table 2.
The along-track resolution Rx is a key factor to take into consideration when estimating the capability to discern the sonogram two features. It is dependent on the sonar horizontal aperture beam angle, the effective range, and the tow-speed of the SSS [41]. Rx is a function of the distance D and the horizontal beamwidth θ h [42]:
R x = D · sin θ h
where D is distance (range) to the target from sonar system [m], θ h is the horizontal beamwidth [°].
The horizontal beamwidth of the DF-1000 side-scan sonar is 1.2° for 100 kHz channel and 0.5° for 500 kHz channel [43]. The horizontal beamwidth of the ACSON-100 side-scan sonar is 1.25°. The calculated values of the across-track resolution are displayed in Table 3 and Table 4.
For the along-track resolution the beam angle is a critical factor. This resolution will also depend on the tow speed and the interval between pulses. It is necessary to ensure it receives five pings to recognize a feature on the SSS image, thereby imaging the small feature of the wreck. Therefore, it is vital to determine the speed over the ground, which must not be exceeded so that an object of a given length receives five pings. The maximum length of the object that will not receive n pulses L m a x is:
L m a x = V · t · ( n 1 ) B w
where V is towing speed [m/s]; t is a pulse interval [s]; n is a number of pulses [in general n = 5]; B w is a beamwidth at a given range [m].
Horizontal beam widths are very small so the width of the beam B w at any range is equal to:
B w = R s · θ h
where θ h is the horizontal beamwidth in radians; R s is a slant range to contact [m].
The pulse interval t is calculated based on the formula:
t = 1 F
where F is a pulse repetition interval designated as:
F = c 2 · R
where R is a recorder range scale [m].
Rearranging Equations (4)–(6), the maximum towing speed of the side-scan sonar can be calculated as follow:
V = ( L + R s · θ h ) · c 2 · R · ( n 1 )
A survey vessel was operating its side-scan in the 100 and 150 m range scale. It was assumed that 1 m long features should be detected and imaged on the sonar trace from the 25 m distance. The sound speed was 1430 m/s at the 50 m depth. The maximum sonar towing speeds as a function of the detection distance for objects of three different lengths, and the 100–150 m operating range are shown in Figure 7 and Figure 8.
It was assumed that the first sonar range of 150 m should be applied. In most cases, the methodology of the survey consisted of performing preliminary measurements to determine the orientation of the wreck lying on the bottom and its basic dimensions and indicating the highest protruding parts of the hull. Then, survey lines were designed parallel to the longer object axis, “illuminating” it on the left and right sides.

2.5. Imaging the Shipwreck with a Scanning Sonar—A New Unconventional Use

A few months after the research was carried out by the hydrographic vessel, divers from the Polish Navy made the first wreck dives from the deck of the rescue ship “Lech.” The author participated in it, and his team was responsible for the hydrographic reconnaissance before the diving operation, checking the bottom clearance, detection, and dimensioning of all objects and dangers that diving pairs of navy divers may encounter. For this purpose, the Kongsberg Simrad Mesotech 1071 sonar head, 150 m of cable, and MS-1000 software for data recording and processing were employed. The main advantage of the mentioned sonar is its high resolution resulting mainly from the high frequency of the 675 kHz acoustic signal, the sonar beam angular width of 0.9 × 30 °, and the minimum pulse length of 25 µs [44].
The MS 1000 Sonar Head can be used in several variants. It can be mounted on a special tripod in a static system and lowered to the bottom from the deck of the measuring unit standing at the anchor or from the harbor quay [45,46]. The sonar can be lowered from the wharf on a special boom to monitor the underwater part of hydrotechnical structures and bridge pillars [47]. Besides, it can be mounted on the ROV. For the tests, an unconventional solution was adopted, consisting of attaching the device to the diving platform grating, lowered from the ship with the bell above the wreck (Figure 9). As the diving platform was lowered, cable lines connecting the sonar with the ship computer were released.
The “Lech” commanding officer dropped four anchors. According to the director of diving work recommendations, having 500 m long anchor lines at their disposal, each rescue vessel changed its wreck position. A diving platform with steel ropes and anchors lowered to the bottom provided a stable working system for the sonar. The sonar head was almost immobile, which translated directly into the quality of the recorded sonograms. The recorded data were “readable” and easy to interpret.

3. Results and Discussion

3.1. Bathymetric Survey Results

As the result of the study undertaken, during the subsequent stages of the survey, the measurement data necessary to develop reporting documentation and attempt to identify such a large object resting at the bottom of the Baltic Sea were collected. Single beam echo sounders recorded echograms showing the depth values above and around the wreck and identified the wreck length (Figure 10 and Figure 11). The echogram in Figure 10a was recorded with a Deso-25 echosounder during the passage of the vessel across the wreck. These data show that the wreck is not standing on the even keel but is leaning to one side. Moving the vessel along the shipwreck and directly above it made it possible to record an echo from the entire hull and at the same time determine the minimum depths above the wreck (Figure 10b). The echograms presented in Figure 11 were recorded with the EA-400 echosounder, the undoubted advantages of which include saving bathymetric and position data on the computer hard disk and the possibility of their repeated playback. Stored echograms and depth sounding profiles can easily be retrieved at any time for display and verification.
The single beam echo sounder measurements results enabled the following conclusions:
(a)
The lying depth of the wreck is Zs = 87.8 m;
(b)
The wreck length is L = 260 m;
(c)
The minimum depth above the wreck Zmin = 60 m;
(d)
The wreck is not on the even keel, it is leaning to one side;
(e)
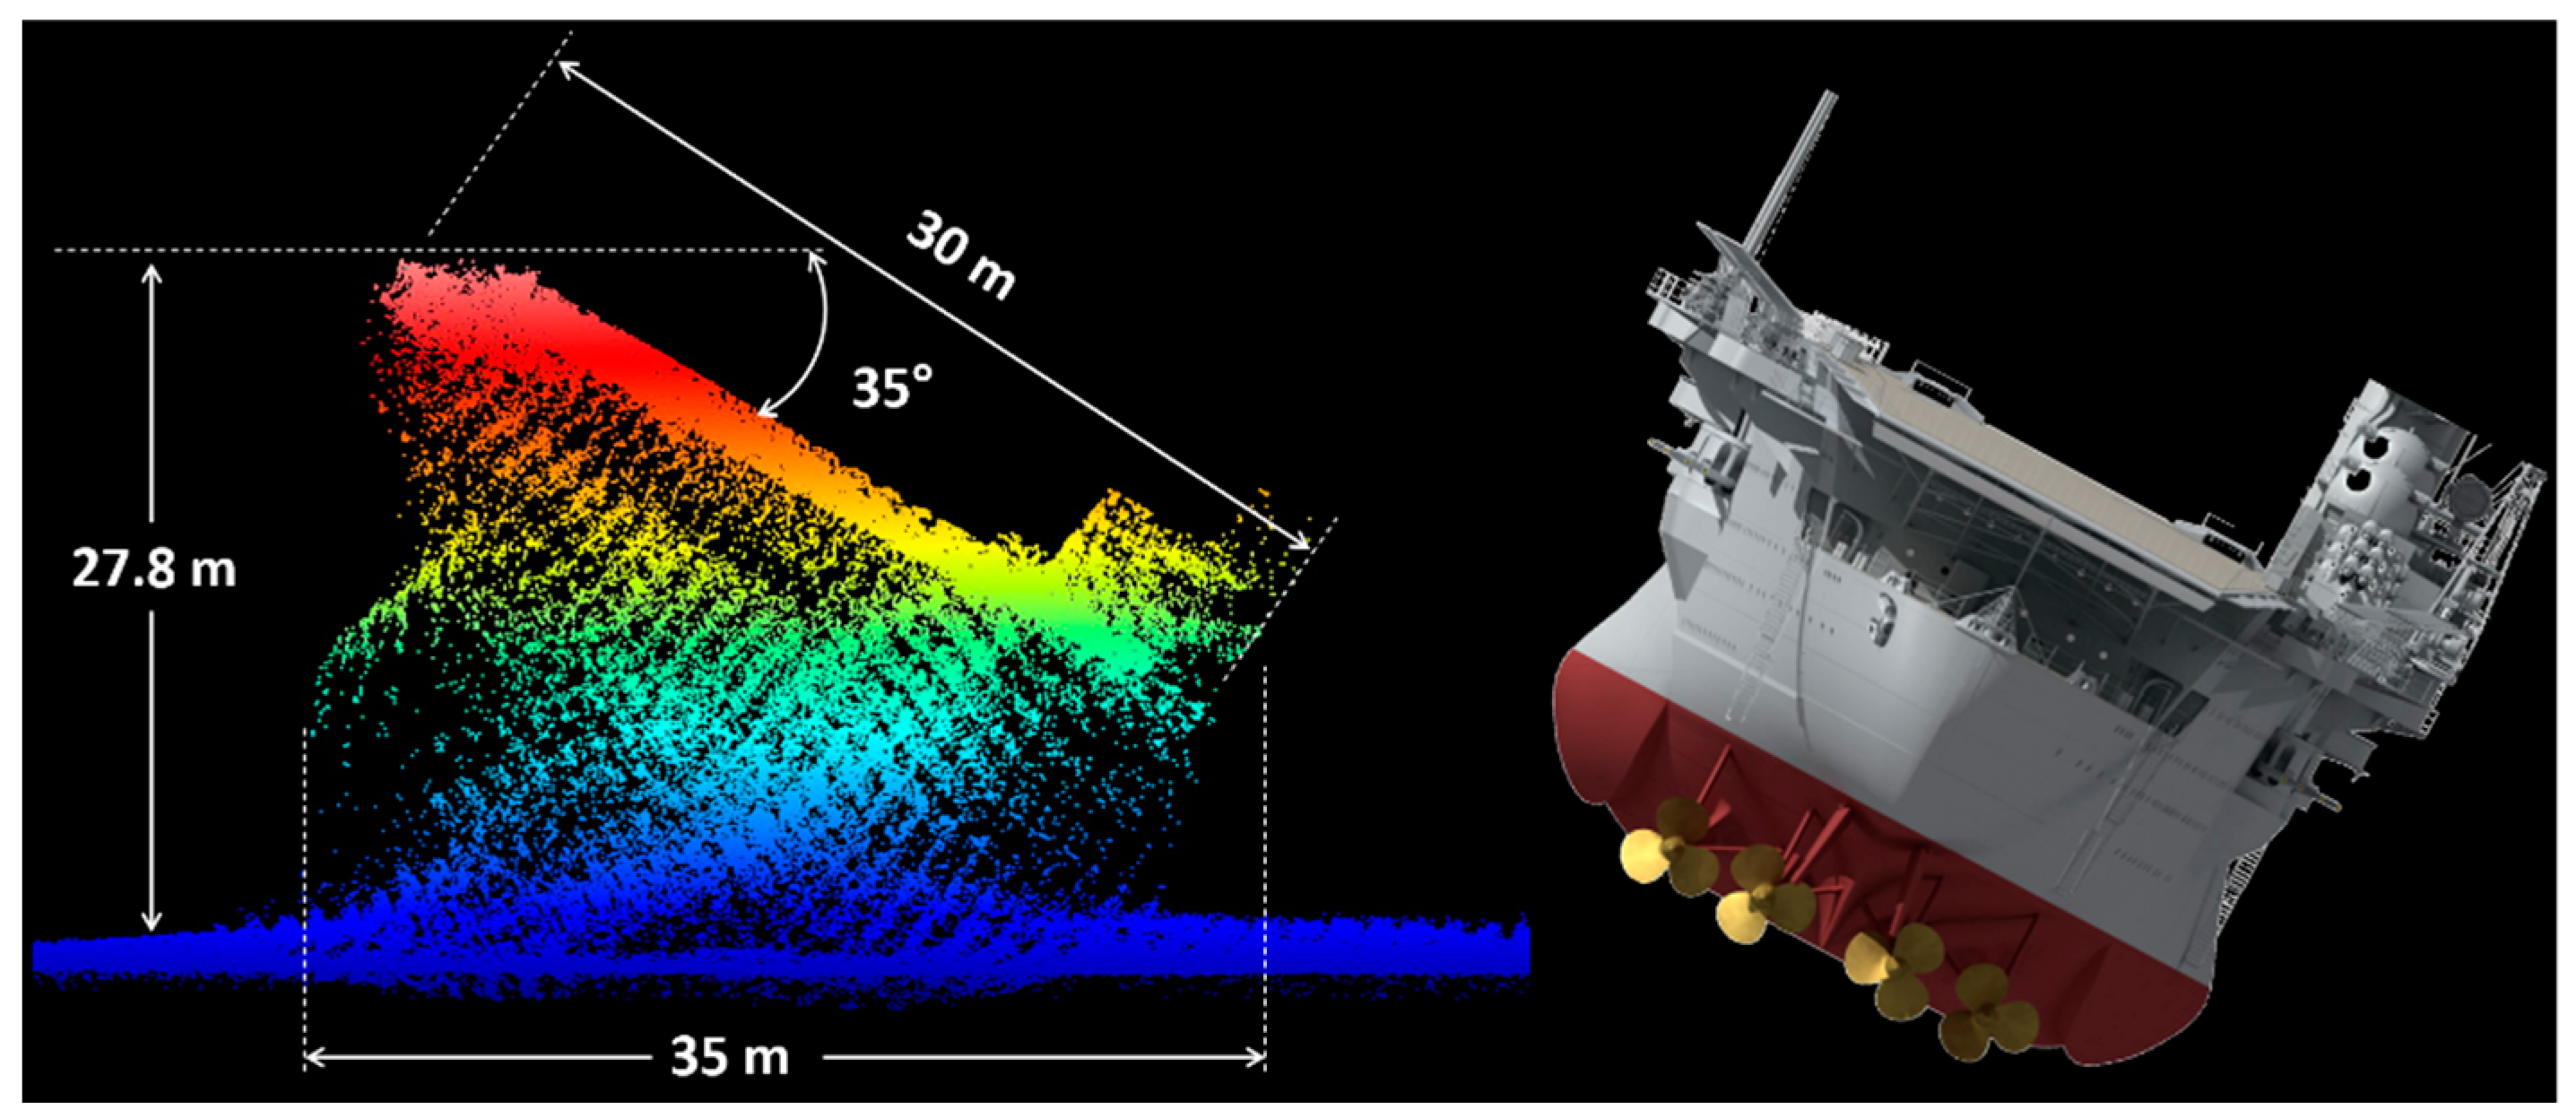
The wreck height is Hs = 27.8 m.
It is worth paying attention to one detail in the echogram (Figure 11b) (red circle with a question mark) that contributed to the author’s error while processing bathymetric data. Initially, the echo recorded at a depth of 47 m was interpreted as a disturbance. It was verified in subsequent phases of marine research that it had not been erroneous data.
The bathymetric survey with the multibeam echosounder system enabled relatively quick wreck location and 100% coverage of the seabed with acoustic beams and, as a result, obtaining a full-depth distribution of the designated sounding reservoir (Figure 12 The advanced 3D area cleaning tool Qloud, fully integrated with QINSY, was employed. Data from the multibeam sonar indicate that the bottom in the aircraft carrier wreckage area is relatively flat, with depths of 87–88 m. The wreck swath view derived from MBES data shows that the object is not standing in the upright position: the lean angle to the starboard side amounts to about 35 degrees (Figure 13).). In the postprocessing stage, some interesting digital terrain wreck models were generated (Figure 14). The analysis of MBES data made it possible to obtain new information and confirm the information obtained in the SBES studies:
(a)
The wreck has a 35-degree heel angle to starboard side;
(b)
Minimum depths Zmin = 58.9 m are in the stern part of the wreck on the port side;
(c)
The wreck lies at 059.3 degrees;
(d)
The wreck width on the aircraft deck is equal to 30 m;
(e)
The fore and aft airlift have dimensions of 13 × 13 m;
(f)
The lying depth of the wreck is Zs = 87.8 m;
(g)
Part of the aircraft carrier superstructure (island) is destroyed, its length is 62 m;
(h)
The wreck height is Hs = 27.8 m;
(i)
The amidship’s opening in the place of the airlift and the engine room is 56 × 13 m.
The research with the multibeam echosounder provided new information about the detected object. Three-dimensional wreck models accurately describe its basic dimensions, illustrating the shape and arrangement on the bottom. These data prove that the wreck hull is fully preserved and tilted to starboard. The bathymetric survey results increasingly reveal structural details of the aircraft carrier, such as the characteristic octagonal openings of the airlifts (Figure 14c), superstructure on the starboard side, visible anti-torpedo bulge (Figure 14a), the propulsion elements, shaft, propeller, and rudder (Figure 14b). It is also worth paying attention to the platforms and sponsons for anti-aircraft guns located on the port and starboard sides of the German aircraft carrier. MBES data analysis also proves that some parts of the ship are significantly damaged, namely, the superstructure or the engine room. It is most likely the result of the bomb explosion and air attacks in August 1947. Quite noteworthy is that the results of MBES measurements indicate a different minimum depth recorded in the aft part of the object, compared to the SBES data. Interestingly, the MBES data do not show the acoustic echo in the bow section at a depth of 47 m, which would confirm the thesis that these were simply measurement errors.

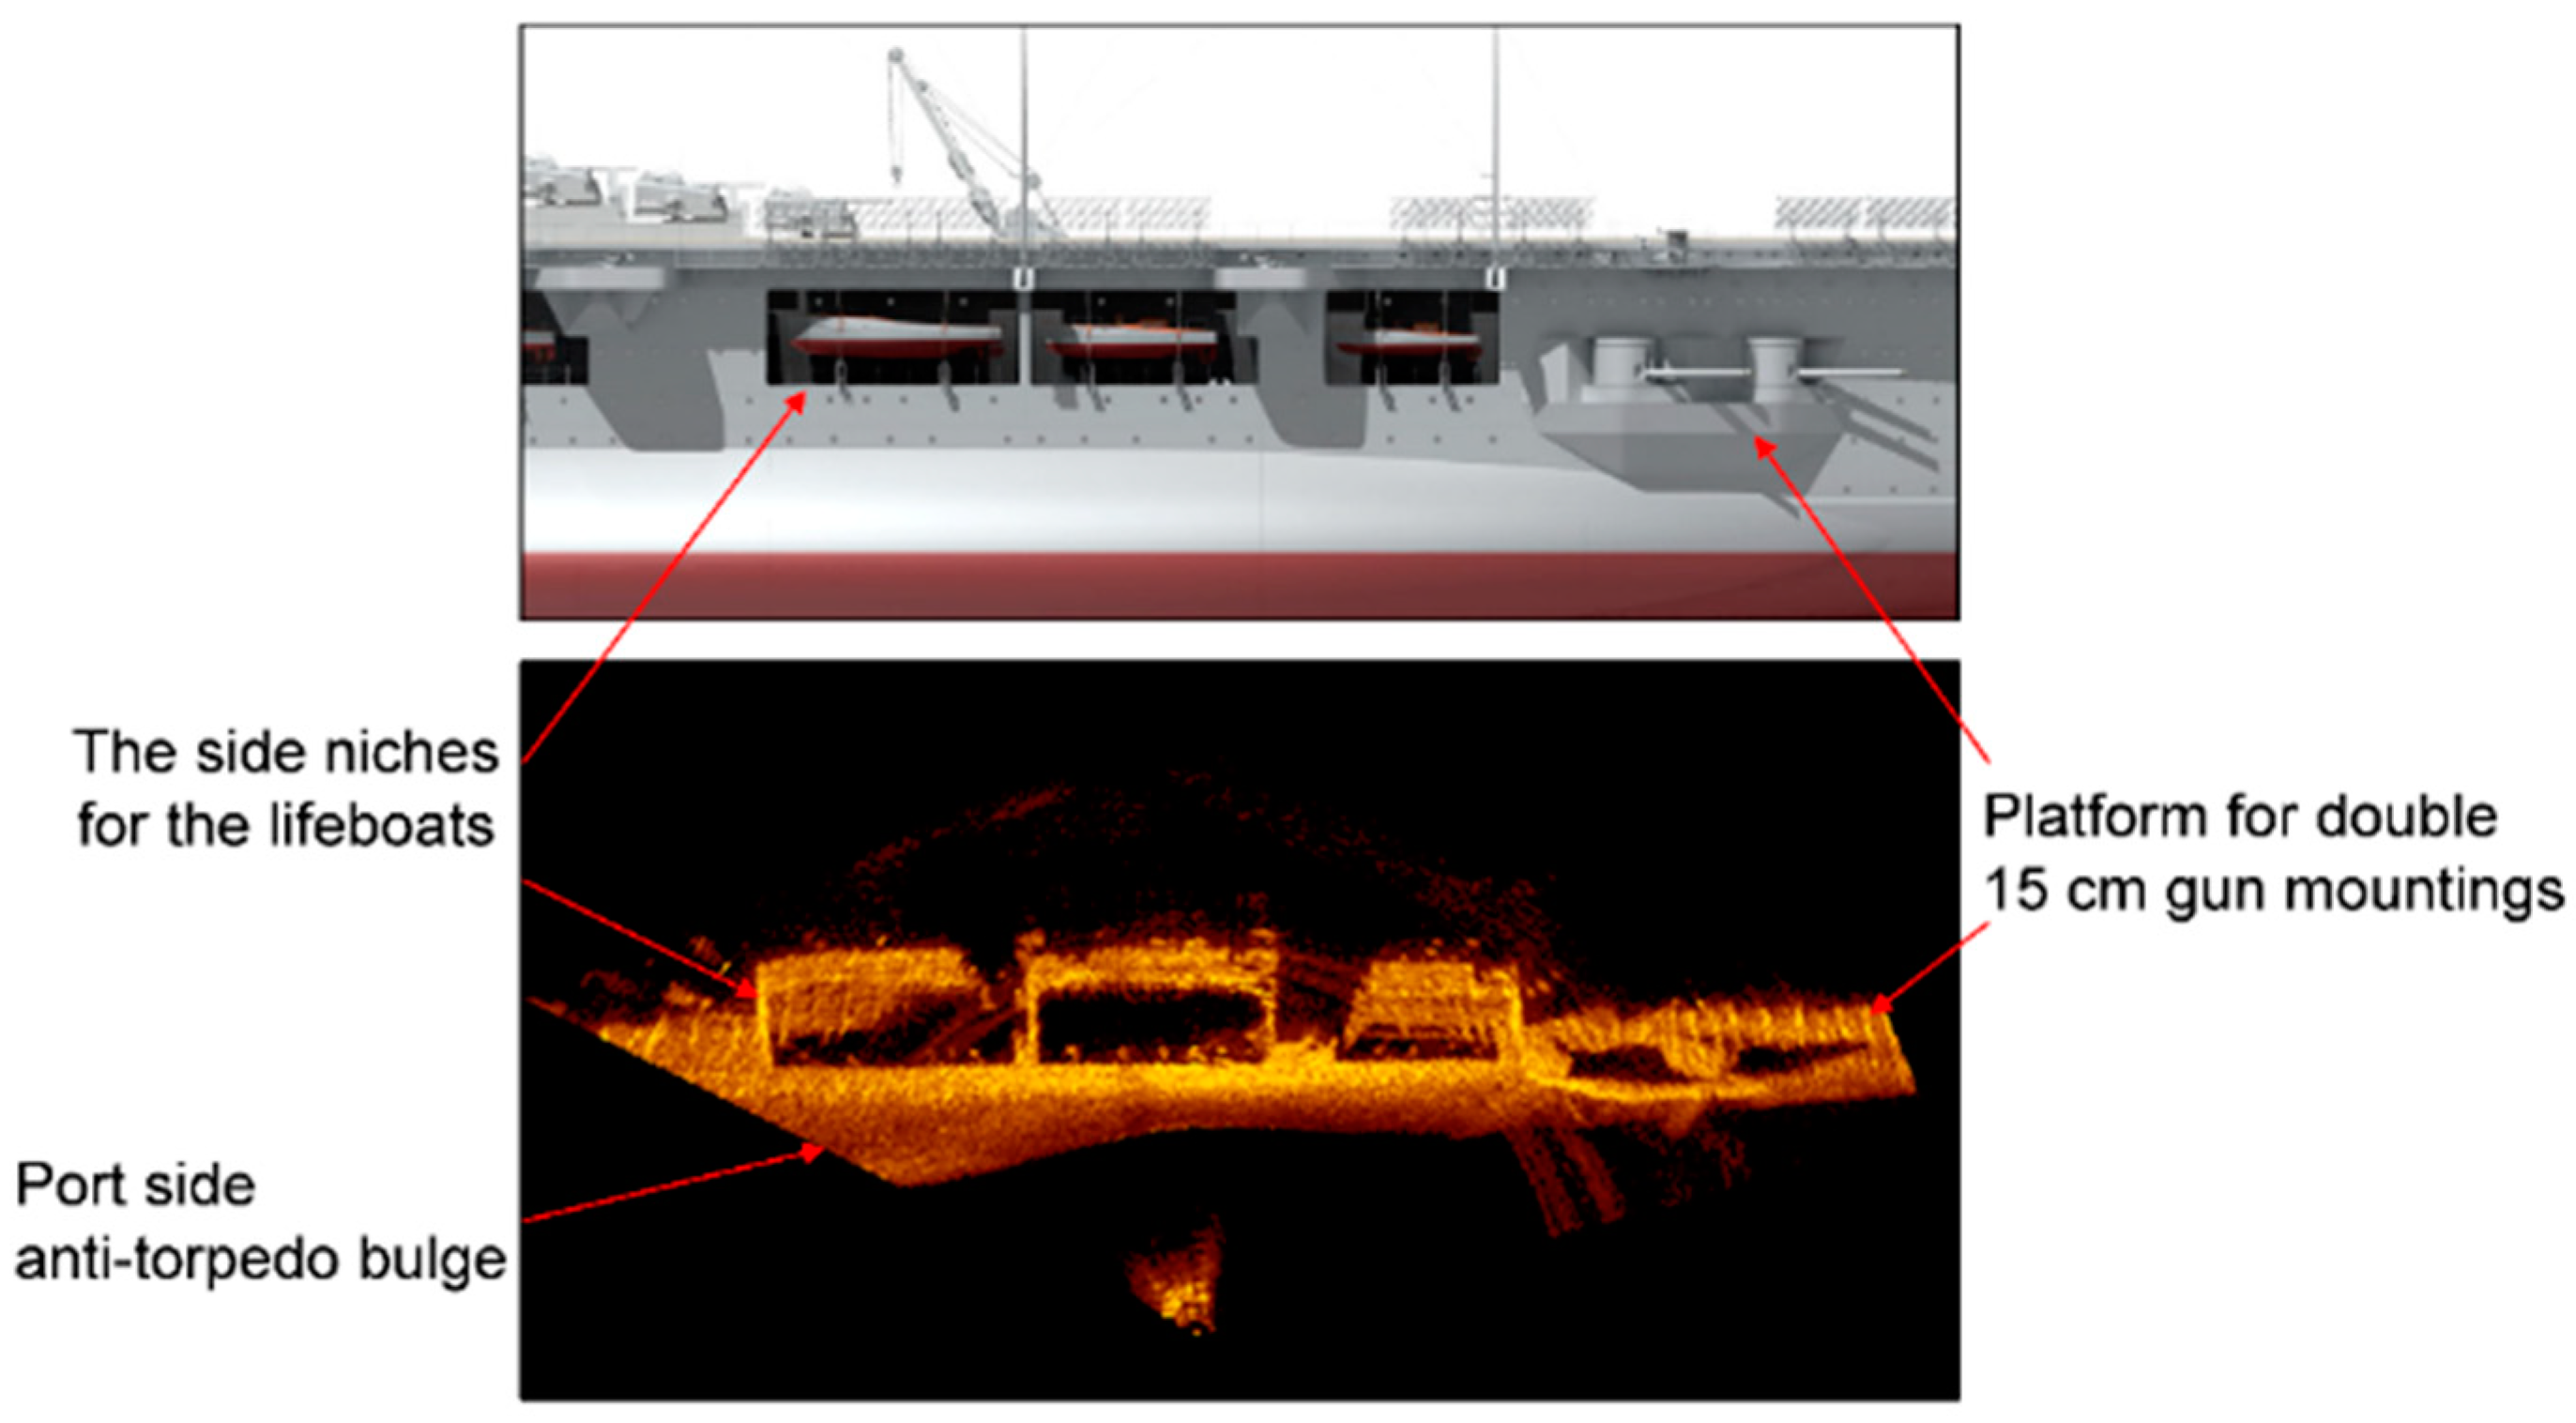
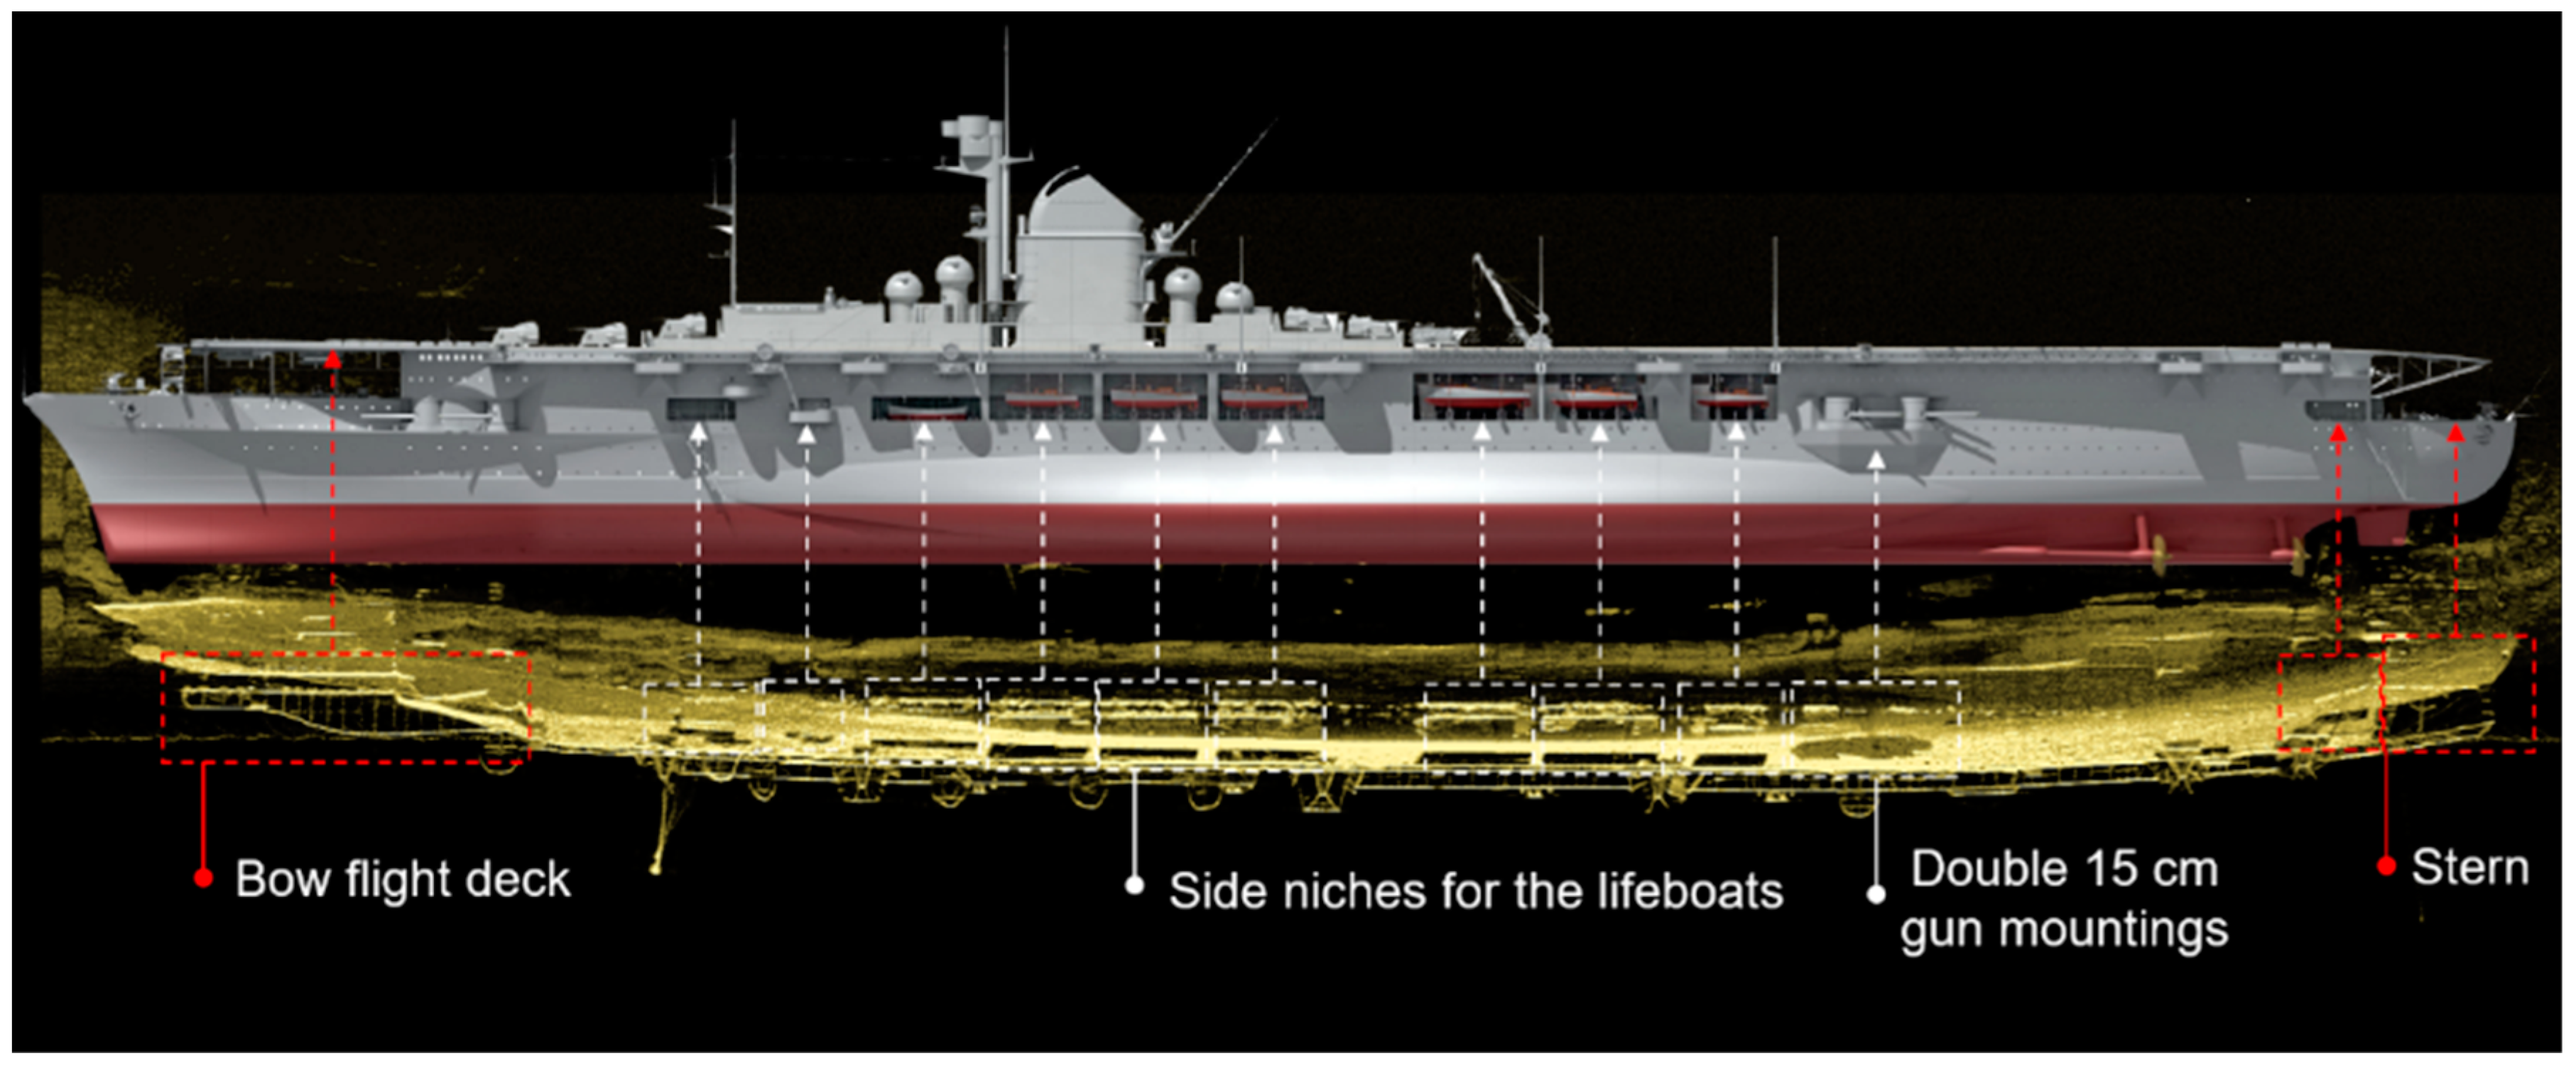
3.2. Sonar Investigation Results

Sonar surveys of the wreck have provided data that can be divided into two categories. The first one refers to the measurement results, which are not entirely satisfactory for the hydrographer. The second category includes the so-called good-quality sonar data. Sometimes surveyors tend to tow sonar too high above the bottom to minimize the risk of possible loss of expensive equipment. Low usefulness sonograms are often recorded by improperly selected operating parameters such as towing speed, operating range, frequency, pulse length, or towing height above the bottom.
The Acson-100 hull-mounted side-scan sonar recorded several sonograms, the resolution of which was predicted to be low (Figure 15). These data contained little detail, and their usefulness in the planned wreck identification process was negligible. The low quality of the obtained sonar images was mainly due to the analog technology, the sonar technical parameters, and the long distance between the transducer and the wreck. Acson-100 sonar data are characterized by low resolution, multiple interferences, and reduced detail.
The side-scan sonar data recorded with DF-1000 EdgeTech were processed using Coda DA-50 software. It allowed the data to be replayed with various gain settings to optimize the quality of the images. Initially, the data were recorded at a range of 150 m, approximately 75 m from the shipwreck, and the sonar height above the seabed of 34–39 m. However, such settings did not guarantee satisfactory test results in the form of sharp, contrasting sonograms with high-level detail (Figure 16). Then, the range scale was reduced to 100 m, and the sonar was towed at a lateral distance of 30–50 m, at heights of 40–50 m. Even though parameters improved the recorded imagery, the level of detail, and legibility of the sonar images were still too low (Figure 17). Nonetheless, the obtained data showing the wreck air deck gave hope for better results.
Finally, it was decided that the sonar had to be towed both lower and closer to the side of the aircraft carrier, which was associated with an increased risk of hitting the wreck hull. Survey lines were designed on both sides of the wreck, but much closer, i.e., 24–28 m from the object. The speed was also reduced to 2.5 knots so that the side-scan sonar could go more in-depth. Such parameters made it possible to obtain the best geometry of the propagating acoustic pulse and, consequently, to record high-resolution images showing many structural details of the port side and wreck flight deck (Figure 18). Apart from many details of the shipwreck, an interesting acoustic reflection on its port side was recorded and displayed on the sonogram (Figure 18a). It is a long, clear echo with a linear character, looking like a mast, pin, or sticking out rod. This echo could have changed the value of the minimum depth above the wreck.
In October 2007, the first dive on the German aircraft carrier’s wreck took place from the deck of the rescue ship “Lech.” The hydrographic protection team was responsible, among others, for checking the cleanliness of the bottom, detecting, and dimensioning underwater obstacles and wreck structural elements, and determining the distance to the wreck. Sonar images of the seabed and hull fragments of the vessel were recorded and then digitally processed in the MS1000 Kongsberg Maritime software. The selected sonograms show numerous underwater obstacles, echoes with the features of ropes, nets, and holes in the wreck deck (Figure 19). The collected sonar documentation supplemented the data intended for the unit identification process.
For a diver performing underwater works, the information about any objects and distances to them and the wreck gives comfort, since they learn the situation on the bottom and see the wreck and surrounding underwater obstacles before descending to a depth of 87 m. Getting familiarized with the diving area before lowering the bell increases the safety of the entire operation.
In one of the positions, the hydrographic support team recorded several sonar images showing the bottom around the object and the wreck elements (Figure 19 and Figure 20). Figure 20 shows a part of the wreck with 12 m long niches on the carrier port side. Lifeboats were to be placed in them. Additionally, the sonar image shows a side structure designed for twin 150 mm main artillery carriages. In the bow section of the wreck, there is an octagonal airlift opening with visible lines and nets going inside (Figure 21). Nearby, on the starboard side, there is a superstructure, which was largely destroyed. The hole in the deck, 1.5–2 m in diameter, is probably a remnant of the trials with Russian weapons in 1947.

3.3. The Identification of a Newly Discovered Shipwreck

In the case of finding or registering a visual image showing an object characteristic for a given vessel (bell, name on the side, other objects identifying the vessel), the identification process is expressed at the level of 100%. However, if we do not have the above “evidence,” we cannot talk about the complete identification of the underwater object. With a well-preserved vessel hull and the necessary bathymetric and sonar data registration, identification can be performed at a high level of probability. The process will depend on various factors, including the quantity and quality of the source materials collected that are used for the comparative analysis. Thus, the degree of preparation of the archival documentation, photos, plans, and drawings of the examined object will play an important role. The documentation of the aircraft carrier “Graf Zeppelin” included in the study by Siegfried Breyer entitled “Graf Zeppelin” published by the publishing house AJ Press from Gdańsk in 2004 was used as the source material for identification.
The collected results of hydrographic tests were subjected to comparative analysis with archival materials, 3D photos of the aircraft carrier, and plans and diagrams of the ship. Such an analysis consisted mainly of determining the geometrical features of the underwater object, comparing them with the actual dimensions, selecting good quality sonar shots of the wreck, and then comparing it with the source materials on the same scale. Figure 22 is one of the results of the sonar identification process of an underwater object. In the effect of comparing the sonogram with the aircraft carrier top view, consistency was obtained as to the basic dimensions of the ship, the location, and dimensions of the superstructure (“islands”), the location of platforms and sponsons on its sides, side niches, anti-torpedo bulges, casemates, and characteristic octagonal airlifts (elevators). The sonogram in Figure 23 and Figure 24 shows the wreck with details of its port side. There are numerous side sponsons in which light anti-aircraft artillery was placed and side niches where lifeboats were to be located. The comparison of sonar data with the plans of a ship shows agreement on the number, shape, and location of the characteristic features of the vessel construction.
The wreck demonstrates several of the challenges that had to be resolved for a successful survey and recording useful quality data that would become the basis in the wreck identification process. The wreck is intact but not standing on even keel; it is banked to starboard. The wreck is massive; its length is 260 m. Part of the wreck is covered with numerous ropes, bent metal sheets, and wires. In many places, there are hooked fishing nets that are dangerous to divers or ROV vehicles. That poses a potential risk of entanglement of submersible vehicles and the loss of towed side sonar on the cable line.
When running survey operations, the best image will be in the center of the swath. The tests carried out with the use of towed sonar prove that the optimal geometry of acoustic signal propagation was obtained for the operating range of 100 m and the sonar towing height equal to 19–20% of the set operation range, at lateral distances from the wreck equal to 24–28 m (Figure 25).
Significantly, the sonar survey team makes every effort to conduct the most efficient investigation possible. Only practice and experience can create a great sonar operator. The most crucial factor to remember is that each sonar operation must be carefully planned and executed to be successful. No depressor was used in the research. The towing speed while overlapping the wreck was between 2.5 and 4 knots, and it was a threshold value for maintaining the ship controllability. The wreck depth (87 m) was a challenge in the absence of a depressor and a short, lightweight cable. Moreover, the towed sonar did not have the typical cable-drum winch. The line arranged in eighths on the deck was handed out using a mooring capstan. Instead of a tilting frame, the crew used a transport davit, which is used daily for reloading food supplies (Figure 26).
Side-scan sonar can be an excellent tool in the process of identifying newly discovered wrecks and underwater objects. Its usefulness and effectiveness will largely depend on the quality of the recorded data related to the resolution parameter. The resolution provides the measure of the detail that it is possible to detect on the sonograph. Precision and accuracy of sonographs depend on various factors and are determined according to SSS performance. The good-practice method of using side-scan sonar can contribute to an optimized wreck-site mapping, investigating, and identifying the large bottom objects such as the wreck of the German aircraft liner Graf Zeppelin.
Finding the shipwrecks can be exciting because these underwater objects are vessels of untold stories that connect humanity to the ocean and maritime past. Discovering the secrets a shipwreck holds may be difficult, but that only fuels our imagination and curiosity to learn more. This article presents an example of a practical methodology for examining a detected object and proposes examples of good hydrographic practice, thanks to which the precious measurement material has been collected. The data obtained constituted the basis for identifying the wreck, which should be considered a success.
As the result of the inspection works performed, numerous fishing nets were identified, especially in the bow and aft parts, in some cases with floats and fishing buoys. Interestingly, the minimum depth parameter above the wreck was verified. One of the sonar records taken while towing the sonar along the port side showed a clear echo indicating the presence of a long line object in the forward part of the wreck. The ROV inspection confirmed the presence of a bundle of fishing nets held in the water by the floats (Figure 27).
When assessing the threat posed by the wreck to shipping, such areas of human activity at sea as fishing (mainly with bottom trawls) or the activity of submarines reserved for the Navy cannot be forgotten. The 260 m wreck is a serious “hook” on which fishermen tear their nets, as confirmed by sonar and video shots showing their tangle on the wreck. The obtained research results, especially sonar ones, include both excellent and low-resolution datasets. That proves that the proposed research methodology and good sea practice contribute to the success of the operation. It is equally essential that the data from an individual stage of the research can be used to plan the next stages using other sensors. The collected datasets will complement each other, which will allow for better analysis and interpretation of the results.
The article shows that remote sensing technology available today has the potential to map new wreck sites, archaeological sites, and marine surveys. The unconventional use of scanning sonar provided a lot of valuable data about the object and has proved that the manufacturers of sonar equipment cannot predict how future users will use it.

4. Conclusions

The Arctowski performed a comprehensive hydrographic survey in 2006, which allowed us to answer the question: is the detected underwater object the wreck of the only German aircraft carrier from World War II? Appropriately selected research methodology made it possible to record accurate bathymetric and sonar data. The optimal selection of measurement parameters, especially regarding the towed SSS side sonar, enabled obtaining exceptionally plastic, clear, and contrasting sonograms with a high level of detail.
The paper also presents a new technique for using a scanning sonar, which was tested on a rescue ship, while performing an investigation of the shipwreck. The results demonstrate that a scanning sonar mounted to a diving platform grating has the potential to provide detailed sonar images of the seabed and shipwreck before the divers went down. Elimination of uncertainties related to the presence of risks will increase the divers’ efficiency and safety. The installation of the MS 1000 scanning sonar on the diving platform and its use to acquire good-quality data of the shipwreck is an unconventional but effective technical solution, which has been successfully tested at sea.
The article also demonstrates how the wreck identification process was carried out, starting with collecting the necessary archival documentation, historical photos, and aircraft carrier shipbuilding plans. After a thorough analysis of the photos and plans, all the structural elements on the port side were identified. Four platforms for 20 mm plot cannons, six sponsons for 37 mm cannons, and platforms with 1.5 m diameter plot lights, and octagonal openings for aircraft elevators and horizontal hatches and openings in the flight deck were identified.
The identification level allows the statement that 99.9% of the examined object is a wreck of the German aircraft carrier “Graf Zeppelin.” Indeed, the vessel name was not read on the side, and no objects were taken that could indicate it, but the compliance of the research material with the archival material, shipbuilding plans, and historical photos fully justifies the above statement. It should be emphasized that the wreck lies at a depth of almost 90 m, which means that it is a complicated object for both divers and hydrographers eager to discover the secrets hidden in “Graf Zeppelin”.

Funding

This research received no external funding.

Acknowledgments

Author would like to thank the crew of the Polish Navy Hydrographic Ship Arctowski, for their dedication, exemplary performance of tasks, and a fantastic atmosphere onboard during the hydrographic investigation of the wreck of Graf Zeppelin. The author wishes to thank Cmdr Adam Olejnik for successful cooperation and support and for providing the movie acquired with ROV.

Conflicts of Interest

The authors declare no conflict of interest.

References

  1. Ødegård, Ø.; Sørensen, A.J.; Hansen, R.E.; Ludvigsen, M. A new method for underwater archaeological surveying using sensors and unmanned platforms. IFAC-PapersOnLine 2016, 49, 486–493. [Google Scholar] [CrossRef]
  2. Allen, Y.C.; Wilson, C.A.; Roberts, H.H.; Supan, J. High resolution mapping and classification of oyster habitats in nearshore Louisiana using sidescan sonar. Estuaries 2005, 28, 435–446. [Google Scholar] [CrossRef]
  3. Yeung, C.; McConnaughey, R.A. Using acoustic backscatter from a sidescan sonar to explain fish and invertebrate distributions: A case study in Bristol Bay, Alaska. ICES J. Mar. Sci. 2008, 65, 242–254. [Google Scholar] [CrossRef] [Green Version]
  4. Grządziel, A. Methodology of performing hydrographic survey of the underwater obstacles. Marit. Rev. 2006, 7–8, 29–46. (In Polish) [Google Scholar]
  5. Czechowska, K.; Feldens, P.; Tuya, F.; Cosme de Esteban, M.; Espino, F.; Haroun, R.; Schönke, M.; Otero-Ferrer, F. Testing Side-Scan Sonar and Multibeam Echosounder to Study Black Coral Gardens: A Case Study from Macaronesia. Remote Sens. 2020, 12, 3244. [Google Scholar] [CrossRef]
  6. Clarke, J.H.; Mayer, L.; Wells, D. Shallow-water imaging multibeam sonars: A new tool for investigating seafloor processes in the coastal zone and on the continental shelf. Mar. Geophys. Res. 1996, 18, 607–629. [Google Scholar] [CrossRef]
  7. Schrottke, K.; Becker, M.; Batholomä, A.; Flemming, B.W.; Hebbeln, D. Fluid mud dynamics in the Weser estuary turbidity zone tracked by high-resolution side-scan sonar and parametric sub-bottom profiler. Geo-Mar. Lett. 2006, 26, 185–198. [Google Scholar] [CrossRef]
  8. Schultz, J.J.; Healy, C.A.; Parker, K.; Lowers, B. Detecting submerged objects: The application of side scan sonar to forensic contexts. Forensic Sci. Int. 2013, 231, 306–316. [Google Scholar] [CrossRef]
  9. Buscombe, D.; Grams, P.E.; Smith, S.M.C. Automated Riverbed Sediment Classification Using Low-Cost Sidescan Sonar. J. Hydraul. Eng. 2016, 142, 06015019-1–06015019-7. [Google Scholar] [CrossRef]
  10. Geraga, M.; Papatheodorou, G.; Ferentinos, G.; Fakiris, E.; Christodoulou, D. The study of an ancient shipwreck using marine remote sensing techniques, in Kefalonia Island (Ionian Sea), Greece. Archaeol. Mariti. Mediterr. 2015, 12, 183–200. [Google Scholar]
  11. Wheeler, A.J. Environmental controls on Shipwreck preservation: The Irish context. J. Archaeol. Sci. 2002, 29, 1149–1159. [Google Scholar] [CrossRef]
  12. Fish, J.P.; Carr, H.A. Sound Underwater Images: A Guide to the Generation and Interpretation of Side Scan Sonar Data; Lower Cape Publishing Co.: Boston, MA, USA, 1990. [Google Scholar]
  13. Beltrame, C.; Gaddi, D. Report on the first research campaign on the Napoleonic brick, Mercure, wrecked off Lignano, Udine, Italy in 1812. Int. J. Naut. Archaeol. 2002, 31, 60–73. [Google Scholar] [CrossRef]
  14. Bates, C.R.; Lawrence, M.; Dean, M.; Robertson, P. Geophysical Methods for Wreck-Site Monitoring: The Rapid Archaeological Site Surveying and Evaluation (RASSE) programme. Int. J. Naut. Archaeol. 2011, 40, 404–416. [Google Scholar] [CrossRef]
  15. Blondel, P. The Handbook of Sidescan Sonar; Springer Science & Business Media: Chichester, UK, 2009. [Google Scholar]
  16. Headquarters, U.S. Army Corps of Engineers. “Hydrographic surveying,” Draft Engineer Manual; EM 1110-2-1003; US Army Corps of Engineers: Washington, DC, USA, 2002; p. 506.
  17. Mazel, C. Side Scan Sonar Training Manual; Klein Associates, Inc.: Salem, NH, USA, 1985. [Google Scholar]
  18. Quinn, R.; Dean, M.; Lawrence, M.; Liscoe, S.; Boland, D. Backscatter responses and resolution considerations in archaeological side-scan sonar surveys: A control experiment. J. Archaeol. Sci. 2005, 32, 1252–1264. [Google Scholar] [CrossRef]
  19. Kvitek, R.; Iampietro, P.; Sandoval, E.; Castleton, M.; Bretz, C.; Manouki, T.; Green, A. Early Implementation of Nearshore Ecosystem Database Project; SIVA Resource Center: Monterey Bay, CA, USA, 1999; 131p. [Google Scholar]
  20. Penrose, J.D.; Siwabessy, P.J.W.; Gavrilov, A.; Parnum, I.; Hamilton, L.J.; Bickers, A.; Brooke, B.; Ryan, D.A.; Kennedy, P. Acoustic Techniques for Seabed Classification; Technical Report 32; Cooperative Research Centre for Coastal Zone Estuary and Waterway Management: Indooroopilly, Australia, 2005. [Google Scholar]
  21. Kenny, A.J.; Todd, B.J.; Cooke, R. Procedural Guideline No. 1–4. The application of sidescan sonar for seabed habitat mapping. In Marine Monitoring Handbook; JNCC: Peterborough, UK, 2001; ISBN 1-86107-5243. [Google Scholar]
  22. Bai, Y.; Bai, Q. Subsea Engineering Handbook, 2nd ed.; Gulf Professional Publishing: Waltham, MA, USA, 2012; ISBN 9780128126226. [Google Scholar] [CrossRef]
  23. Dondurur, D. Acquisition and Processing of Marine Seismic Data; Elsevier: Amsterdam, The Netherlands, 2018; ISBN 9780128114902. [Google Scholar] [CrossRef]
  24. Bennell, J.D. Procedural Guideline No. 1–5 Mosaicking of sidescan sonar images to map seabed features. In Marine Monitoring Handbook; JNCC: Peterborough, UK, 2001; ISBN 1-86107-5243. [Google Scholar]
  25. Manual on Hydrography, 1st ed.; Publication M-13; International Hydrographic Organization: Monaco, 2005; p. 202.
  26. Breyer, S. Graf Zeppelin: The German Aircraft Carrier; Schiffer Pub: West Chester, UK, 1989. [Google Scholar]
  27. Breyer, S. Graf Zeppelin: Encyklopedia Okrętów Wojennych (42); Wyd. AJ-Press: Gdańsk, Poland, 2004. [Google Scholar]
  28. Federowicz, P. Lotniskowiec Graf Zeppelin cz. II. Okręty Wojenne 2002, 54, 36. (In Polish) [Google Scholar]
  29. Dramiński, S. The German Aircraft Carrier Graf Zeppelin; Publisher Kagero: Lublin, Poland, 2016. [Google Scholar]
  30. Burke, S.; Olejnik, A. Freedom of the Seas: The Story of Hitler’s Aircraft Carrier—Graf Zeppelin; Stephen Burke Books: Warrington, UK, 2010; Print. [Google Scholar]
  31. Von der Porten, E.P. The German Navy in World War II; Ballantine Books: New York, NY, USA, 1977. [Google Scholar]
  32. Murawski, M.J. Lotniskowiec Graf Zeppelin i jego samoloty pokładowe. Wojsko Tech. Hist. 2017, 3, 56–70. (In Polish) [Google Scholar]
  33. Jackson, R. Battle of the Baltic: The Wars 1918–1945, 1st ed.; Pen and Sword: Barnsley, UK, 2007; ISBN 10:184415422X. [Google Scholar]
  34. Doneus, M.; Doneus, N.; Briese, C.; Pregesbauer, M.; Mandlburger, G.; Verhoeven, G. Airborne laser bathymetry—Detecting and recording submerged archaeological sites from the air. J. Archaeol. Sci. 2013, 40, 2136–2151. [Google Scholar] [CrossRef]
  35. Pøhner, F. Multibeam sonars for mapping the seabed with the HUGIN UUV. In Proceedings of the 17th Symposium on Hydroacoustics, Jurata, Poland, 23–26 May 2000; Volume 3, pp. 7–13. [Google Scholar]
  36. ATLAS DESO 25. Survey Echosounder. Operating Instructions; STN ATLAS Electronic GmbH Marine Division: Bremen, Germany, 1996; ED 1013 G 012.
  37. Kongsberg, S.A. EA 400 Hydrography Echo Sounder; Instruction Manual: Horten, Norway, 2003. [Google Scholar]
  38. Atallah, L.; Shang, C.; Bates, R. Object detection at different resolution in archaeological side-scan sonar images. Eur. Ocean. 2005, 1, 287–292. [Google Scholar] [CrossRef] [Green Version]
  39. Burguera, A.; Oliver, G. High-Resolution Underwater Mapping Using Side-Scan Sonar. PLoS ONE 2016, 11, e0146396. [Google Scholar] [CrossRef] [Green Version]
  40. Łukaszewicz, D.; Rowiński, L. Experimental evaluation of high frequency side scan sonar as object search and identification tool. Hydroacoustics 2006, 9, 109–118. [Google Scholar]
  41. Lekkerkerk, H.-J.; Theijs, M.J. Handbook of Offshore Surveying. Acquisition Sensors, 2nd ed.; Skilltrade BV: Voorschoten, The Netherlands, 2012. [Google Scholar]
  42. Łukaszewicz, D.; Rowiński, L. Possibilities of detection and identification objects located on the sea bottom by means of a simple sidescan sonar. Hydroacoustics 2005, 8, 111–116. [Google Scholar]
  43. Model DF-1000 Digital Side Scan Sonar Tow Fish; Instruction Manual, EdgeTech: West Wareham, MA, USA, 2003.
  44. Sonar for Harbour Surveillance and Intruder Detection; Kongsberg Mesotech Ltd.: Port Coquitlam, BC, Canada, 2006; p. 7.
  45. Kongsberg Mesotech Ltd. MS 1000 High-Resolution Scanning Sonar & Software System for Underwater Inspection, Survey and Visualization 2013. Available online: https://escort-technology.com/wp-content/uploads/ms1000_iusv_bro_6pages_lr.pdf (accessed on 13 August 2020).
  46. Topczewski, Ł.; Cieśla, J.; Mikołajewski, P.; Adamski, P.; Markowski, Z. Monitoring of scour around bridge piers and abutments. Transp. Res. Procedia 2016, 14, 3963–3971. [Google Scholar] [CrossRef] [Green Version]
  47. Wawrzyniak, N.; Zaniewicz, G. Visualization of quay walls by means of scanning sonar images for the needs of a geoinformation port security system. Rocz. Geomatyki 2011, 2, 133–137. (In Polish) [Google Scholar]
Figure 1. Detection location of the wreck of the German aircraft carrier Graf Zeppelin in the Baltic Sea.
Remotesensing 12 04076 g001
Figure 2. One of the first images of the Graf Zeppelin wreck obtained with the multibeam echo sounder from the deck of St. Barbara.
Remotesensing 12 04076 g002
Figure 3. Planning of hydrographic survey and maneuvering around the aircraft carrier wreckage: (a) designing a measurement profile system; (b) diagram of the ship maneuvering in the wreckage area; (c) a multibeam data grid.
Remotesensing 12 04076 g003
Figure 4. Survey platform with bathymetric measuring systems: (a) the Arctowski hydrographic ship; (b) DESO25 Single Beam Graphic Sonar Recorder; (c) EM3000D (red), Multibeam (red), and EA400 (orange) Single Beam Sonar Transducer; (d) keel-mounted transducers of the DESO25 Echo Sounder.
Remotesensing 12 04076 g004
Figure 5. Operational parameters of the towed side-scan sonar.
Remotesensing 12 04076 g005
Figure 6. Towfish depth as a function of cable length and towing speed. Lc is a length of tow cable loosened behind the stern [m]; Fd is a towfish depth (distance from sea surface to the sonar [m]; V is the speed of towing [kts].
Remotesensing 12 04076 g006
Figure 7. Maximum sonar towing speeds as a function of detection distance for objects of three different lengths and sonar operating range R = 150 m (high resolution channel f = 500 kHz; sound speed c = 1430 m/s; horizontal beamwidth θh = 0.5 °).
Remotesensing 12 04076 g007
Figure 8. Maximum sonar towing speeds as a function of detection distance for objects of three different lengths for the sonar operation range R = 100 m; (high resolution channel f = 500 kHz; sound speed c = 1430 m/s; horizontal beamwidth θh = 0.5 °).
Remotesensing 12 04076 g008
Figure 9. The preparation steps of a scanning sonar for use on a diving platform: (a) scanning sonar; (b) mounting sonar to the mount and truss; (c) a diving platform with a diving bell on the rescue ship; (d) mounting a grate with the sonar to the diving platform; (e) stabilizing anchors with a sonar attached to the diving platform; (f) a sonar system and pair of divers prior to lowering to the aircraft carrier wreck.
Remotesensing 12 04076 g009
Figure 10. Single beam echo sounder data (Deso-25) acquired when crossing the shipwreck (a) and transition along and above Graf Zeppelin (b).
Remotesensing 12 04076 g010
Figure 11. Single beam echo sounder data (EA-400) acquired when crossing the shipwreck (a) and transition along and above Graf Zeppelin (b).
Remotesensing 12 04076 g011
Figure 12. Distribution of depth values in the area of the Graf Zeppelin aircraft carrier wreck (a) and presentation of multibeam echo sounder (MBES) data along the shipwreck (b).
Remotesensing 12 04076 g012
Figure 13. The swath view of wreck derived from MBES data.
Remotesensing 12 04076 g013
Figure 14. Digital terrain models of the aircraft carrier shipwreck Graf Zeppelin derived from MBES data. (ad) digital models viewed from different angles
Remotesensing 12 04076 g014
Figure 15. Sonograms acquired with analog low-frequency hull-mounted side-scan sonar Acson-100. (ad) same object seen from different angles.
Remotesensing 12 04076 g015
Figure 16. Sonograms acquired with a towed side-scan sonar DF-1000: (a) using operational parameters R = 150 m; Fa = 34 m; D = 75 m; (b) using operational parameters R = 150 m; Fa = 39 m; D = 75 m.
Remotesensing 12 04076 g016
Figure 17. Sonograms acquired with a towed side-scan sonar DF-1000: (a) using operational parameters R = 100 m; Fa = 50 m; D = 50 m; (b) using operational parameters R = 100 m; Fa = 40 m; D = 30 m.
Remotesensing 12 04076 g017
Figure 18. Sonograms acquired with a towed side-scan sonar DF-1000: (a) using operational parameters R = 100 m; Fa = 47 m; D = 24 m; (b) using operational parameters R = 100 m; Fa = 42 m; D = 28 m.
Remotesensing 12 04076 g018
Figure 19. Sonar imaging of the seabed near the wreck, a depth of 87 m.
Remotesensing 12 04076 g019
Figure 20. Side niches situated on the port side of the aircraft carrier.
Remotesensing 12 04076 g020
Figure 21. Sonar imagery of the bow part of the shipwreck with a distinctive airlift opening.
Remotesensing 12 04076 g021
Figure 22. A comparative analysis of sonar data with the appearance of the ship. Top view and port view of the aircraft carrier Graf Zeppelin [27].
Remotesensing 12 04076 g022
Figure 23. Location of side niches on the sonogram and the ship side silhouette.
Remotesensing 12 04076 g023
Figure 24. Identification of the port side of the shipwreck.
Remotesensing 12 04076 g024
Figure 25. Diagram of the proposed operating parameters used in the sonar study of the GZ wreck giving optimal angles of illumination with the acoustic beam.
Remotesensing 12 04076 g025
Figure 26. Deck equipment used for sonar towing operations in the absence of a cable winch and A-frame: (a) use of mooring capstan; (b) use of transport davit; (c) laying sonar cable on the deck.
Remotesensing 12 04076 g026
Figure 27. Acoustic echo over the wreck registered at 47 m depth (a); sonar echo detected with SSS (b) and results of remote underwater vehicles (ROV) investigation—mosaic of video shots made by Cmdr Adam Olejnik, the Polish Naval Academy (c).
Remotesensing 12 04076 g027
Table 1. Calculated across-track resolution of the ACSON-100 side-scan sonar.
Grazing Angle β80°70°60°50°40°30°20°10°
Ry [m]6.483.292.251.751.471.301.201.14
Table 2. Calculated across-track resolution of the DF-1000 EdgeTech side-scan sonar.
Grazing Angle β80°70°60°50°40°30°20°10°
Ry [m] for 100 kHz0.430.220.150.120.100.090.080.08
Ry [m] for 500 kHz0.040.020.020.010.010.010.010.01
Table 3. Calculated along-track resolution of the DF-1000 EdgeTech side-scan sonar.
Distance D10 m30 m50 m60 m70 m80 m100 m130 m150 m
Rx [m] for 100 kHz0.210.631.051.261.471.682.092.723.14
Rx [m] for 500 kHz0.090.260.440.520.610.700.871.131.31
Table 4. Calculated along-track resolution of the ACSON-100 side-scan sonar.
Distance D10 m30 m50 m60 m70 m80 m100 m130 m150 m
Rx [m] for 100 kHz0.220.441.091.311.531.752.182843.27
Publisher’s Note: MDPI stays neutral with regard to jurisdictional claims in published maps and institutional affiliations.

