Article

Over 150 Years of Change: Object-Oriented Analysis of Historical Land Cover in the Main River Catchment, Bavaria/Germany

by
Yrneh Ulloa-Torrealba
1,2,
Reinhold Stahlmann
3,
Martin Wegmann
4 and
Thomas Koellner
1,*
1
Professorship of Ecological Services (PES), BayCEER, University of Bayreuth, 95440 Bayreuth, Germany
2
Faculty of Geoinformatics, Munich University of Applied Sciences, 80333 Munich, Germany
3
Department of Biogeography, BayCEER, University of Bayreuth, 95440 Bayreuth, Germany
4
Department of Remote Sensing, Institute of Geography, University of Wuerzburg, 97074 Wuerzburg, Germany
*
Author to whom correspondence should be addressed.
Remote Sens. 2020, 12(24), 4048; https://doi.org/10.3390/rs12244048
Submission received: 12 October 2020 / Revised: 4 December 2020 / Accepted: 7 December 2020 / Published: 10 December 2020

Abstract

:
The monitoring of land cover and land use change is critical for assessing the provision of ecosystem services. One of the sources for long-term land cover change quantification is through the classification of historical and/or current maps. Little research has been done on historical maps using Object-Based Image Analysis (OBIA). This study applied an object-based classification using eCognition tool for analyzing the land cover based on historical maps in the Main river catchment, Upper Franconia, Germany. This allowed land use change analysis between the 1850s and 2015, a time span which covers the phase of industrialization of landscapes in central Europe. The results show a strong increase in urban area by 2600%, a severe loss of cropland (−24%), a moderate reduction in meadows (−4%), and a small gain in forests (+4%). The method proved useful for the application on historical maps due to the ability of the software to create semantic objects. The confusion matrix shows an overall accuracy of 82% for the automatic classification compared to manual reclassification considering all 17 sample tiles. The minimum overall accuracy was 65% for historical maps of poor quality and the maximum was 91% for very high-quality ones. Although accuracy is between high and moderate, coarse land cover patterns in the past and trends in land cover change can be analyzed. We conclude that such long-term analysis of land cover is a prerequisite for quantifying long-term changes in ecosystem services.

Graphical Abstract

1. Introduction

In Europe, historical reconstructions of the changes in the land over the last 300 hundred years provide information of a period when major transformations occurred due to agriculture, grazing activities, and the growth of urban settlements [1,2]. The monitoring of land change defined as an integration of land use and land cover, allows to identify and describe the underlying processes and factors that contribute to shape this arrangement [3,4,5].
Long time scale land use and land cover change analyses can be performed with the use of historical maps, which have been widely done in Central Europe [6,7] (see, for example, France [8], Czech Republic [7], Belgium [2], Italy [9], and Germany [4,10,11,12]). In Germany, analyses of land use and land cover change include historical information that dates back approximately 200 years, specifically in the region of Upper Franconia [4,12], Bavarian Forest [13], Swabian Jura [11], and, more recently, Leipzig [10]. However, the extraction of relevant information from historical maps requires that the different features are quantifiable. For this purpose, historical maps have to be georeferenced, and features have to be digitized and categorized in the corresponding land use and land cover classes [9].
Several classification methods have been described for image analysis: per-pixel, sub-pixel, per-field, context-based, knowledge-based, and combinational approaches of multiple classifiers [14]. Of these, pixel-based or object-based are two of the most common ones applied in the generation of thematic maps [3]. Specifically, historical maps classification has been done using several approaches: manual classification [10], vector GIS models (e.g., in ArcGIS) [4,13], object-based GRASS-GIS tools [9], pixel-based and shape classification using the PatchStat function from the SDM Tools R package [12], pixel-based classification using HistMapR R package [15], and final visual correction in several cases [9,16], among others.
Object-Based Image Analysis (OBIA) is based on segments or objects, but not single pixels. These objects include information of shapes, texture, edges, neighboring objects at different levels, and consider the context of the whole scene or image [17,18]. On the other hand, pixel-based classification methods, which deal largely with the information in a pixel, do not take into account the contextual information [18]. Objects contain more information (e.g., mean, median, etc.) than the spectral data provided by each pixel [17] and cannot be processed by traditional pixel approaches [18].
The limitations and advantages of the aforementioned approaches are also visible when applied to the classification of historical maps. OBIA methods are preferred over pixel-based approaches for this task [10,19]. During the analysis of individual pixel information, the context is missing, which is important for historical maps where the meaning of symbols depicted play a more important role than the colors on the map [15]. This requires some local knowledge to understand the symbology of the map [19]. For example, streets and buildings might have the same color, making it hard to separate into different land use and land cover classes [16,19]. Reported accuracy of a classification of a historical map using Maximum Likelihood (at pixel-level) and Random Forest (at object-level) was 13.8%, whereas the same analysis on an aerial image of the same area yielded accuracies of 75.5%, and 77.2%, respectively [19]. Automatization of the classification of historical maps is also important to reduce the time spent on manual digitization. The implementation of the histMapR R function tailored towards this goal, reduced the classification from two months for 1700 km2 to 1–2 days [15]. Another approach using vectorization reduced the digitization time down to 38%, when compared with manual processing of the images [20]. Regardless of the improvements made to automatize the segmentation and posterior classification of historical maps, some manual work has to be done because of the physical quality of the map, which influences the colors for every land use and land cover class [15]. The quality of these maps is often very poor, due to aging, bleaching effects, and physical damages. These physical characteristics create noise, which leads to classification errors [16].
There is still the need for methods that allow an effective and efficient way of classifying historical maps. This paper evaluates to which extent the classification and posterior analysis of historical maps of the Main catchment is possible using an OBIA approach considering that the selected study site has a large spatial scale (i.e., thousands of km2), and the mentioned challenges that these images impose (i.e., quality of historical maps). This research work represents an important contribution for the study of natural resources management in Germany. The selected study area is the Main river catchment, in Bavaria. Historical maps of the study site have many characteristics that make them suitable for object-based classification. They present different types of noise (i.e., color fading, different color tone among tiles, and stains), physical damage (e.g., scratches and areas of missing color), and elements that have a similar pixel value but a different semantic (e.g., topographic lines and letters). For the OBIA, eCognition was selected, being a specialized software for object-based analysis for remote sensing data [21]. Due to its characteristics, could deliver accurate image classification with higher analysis capacity while being less labor intensive [22].

2. Methods

2.1. Study Area

The Main river catchment was chosen as a study area for this research project for many reasons: the availability of scanned historical maps from the Bavarian Surveying Administration, which show the land cover of the region; the many associated ecosystem services; and the cities in this area. Due to the historical association of large parts of the cultural landscapes to the Markgrafschaft Brandenburg-Bayreuth, the landscape is an important residence area with Kulmbach and Bayreuth as urban centers [23].
The Main is the third largest tributary of the River Rhine. It has a mean discharge of 225 m3/s at its mouth. It has a length of 527 km and divides into two rivers: the Red and the White Main, which begin in the Fichtel Mountains and confluence near Kulmbach [24]. The total basin size is 27,840 km2 and extends over the federal states of Bavaria, Hesse, Baden-Württemberg, and Thuringia, in Germany [24].
The Red and White Main catchment area was selected for this project. It spans over the districts of Upper Franconia and a small portion of Upper Palatinate (Oberfranken and Oberpfalz, in German) (Figure 3). The catchment is located in the Obermainisch hills and mountains (Obermainisches Bruchschollenland) at an altitude of 270–900 m.a.s.l. In the north–south direction, the landscape is framed by the mountain ranges of the Franconian Switzerland in the west, and by the densely wooded slopes of the Frankonian Forest and the Fichtel Mountains in the east [23,25,26,27].

2.2. Data Used

The analysis of land cover change involved two time steps (Figure 1): an early period in the 19th century and a later in the 20th century.
Catchment shape. The Red and White Main catchment area is delimited by a vector file that includes a 2 km buffer to the river network (see Figure 3). This sums up to an area of 1467 km2. The buffer avoids errors (i.e., missing areas on the boundaries) while comparing with lower resolution rasters. The Main catchment vector file is clipped to the boundaries of the Upper Franconia district. This allows easier comparison with similar studies in the region. Land cover change analysis was restricted to this area.
Historical land cover. Historical maps—also known as “primary sheets” (Uraufnahme)—of the Kingdom of Bavaria were developed during several geographic campaigns during 1808–1864 at a scale of 1:5000. During this time, 22,000 maps were crafted in lithographic limestone for easy replication. Based on these primary sheets, 981 position sheets (Positionsblätter) were produced in the period of 1817–1872 at a scale of 1:25,000, and cover almost the whole extension of the former Kingdom of Bavaria [28]. The measuring of these maps was made originally for military and civilian purposes by the Military Topographic Bureau (Militärisch Topographisches Bureau) [28,29]. The surveying was used for a more exact taxation, therefore it shows highly accurate information of the land characteristics: type of use, productiveness, area, and ownership [28]. Therefore, the current Bavarian Administration for Surveying falls under the auspices of the Bavarian State Ministry of Finance. These maps are available online on the website “Bayern Atlas” by the Bavarian State Office for Digitisation, High-Speed Internet and Surveying (LDBV) (http://geoportal.bayern.de/bayernatlas).
For this project, we received 26 position sheets covering the catchment area described above in GeoTiff format, and projection EPSG: 31468, DHDN/Gauss-Kruger zone 4 from LDBV (see Figure S1). In addition, 456 primary sheets at the scale 1:5000 were obtained for crosschecking unclear cases of land cover on the position sheets.
Today’s land cover. The land cover information of the time step of 2015 was based on the official topographic-cartographic information system (i.e., ATKIS Amtliches Topographisch-Kartographisches Informationssystem) provided by the Bavarian Agency for Digitisation, High-Speed Internet and Surveying. From this dataset, the available non-overlapping objects classes are: (a) administrative areas, i.e., communities, counties, districts, and federal states (Gemeinschaft, Kreis, Regierungsbezirk, Bundesland); (b) water bodies; (c) different types of vegetated areas (e.g., agriculture, forest, heathland, peat lands, and swamps, as well as other not defined areas); and (d) transportation lines/areas, industrial, and residential areas as well as historical buildings or facilities.
Historical policy districts and cadastral information. The borders of the administrative units at that time, called “police districts”, were digitized based on two historical maps from 1853 and 1879 [30,31]. Historical statistical information from the 19th century about the different crops produced with the yield and area for the different police districts within the study site were used for comparison [32].
Land cover change categories. To compare the maps from both periods, the land cover classes were simplified to the low number of land cover types of the historical maps. Maps of both periods were classified into four following types:
  • Cropland: Arable land for crop production (Ackerland, Streuobstacker, Hopfen, and Gartenland)
  • Meadow: Pastures and grasslands (Grünland and Streuobstwiese)
  • Forest: Standing trees that serve for timber production (Wald)
  • Urban: Human settlements, e.g., cities, houses, historical buildings, transportation lines, and recreational areas (Siedlung)
Additional land cover types summing up to 0.4% of the area only present in the 20th century map were: plantations, nursery garden, standing trees, heathland, peat lands, swamps, and waste lands (minor land cover classes), as well as water bodies. The water bodies (i.e., standing and flowing water) covering 0.4% in current time were not classified, due to the complexity of identification in the historical maps. Therefore, we masked water bodies for the change analysis on the basis of their extend in 2015.

2.3. Classification of Historical Maps Using eCognition

Historical maps were classified using eCognition software from Definiens [21]. In this program, images were first segmented into meaningful objects, and afterwards several object-based algorithms were applied categorize all features. In this paper, “features” refer to elements to be found in an image, for example a forest plantation [33]. The classification was applied to an area of 2268 km2 (see Figure 3).
Pre-processing: Reduce historical maps heterogeneity. Due to the visible high heterogeneity within classes, an enhanced Frost Filter was applied to the historical images using ENVI version 5.1 (Exelis Visual Information Solutions, Boulder, Colorado). This smoothed the features and facilitated the subsequent classification (see effects in Figure 2A–D).
Layer normalization. The images are composed of three bands in the RGB channel: red, green, and blue. In the image analysis, more bands were included in order to detect better the different features using the variables that eCognition provides. For this task, every band or layer was normalized using two methods: linear or histogram to reduce bleaching and color differences between the separate maps. Normalization is an algorithm that is applied at the pixel level, i.e., the scene or image domain. The linear normalization stretches the pixel values distribution along the entire range; while the histogram normalization changes pixel values based on the accumulated histogram of the image. The nine bands together (3 RGB, 3 linearly normalized RGB, and 3 histogram normalized RGB) were used and combined to increase the accuracy of land classes detection.
Segmentation. Image processing in eCognition follows various steps: segmentation, semantic modeling, and semantic classification [22]. After an initial segmentation, many classification-based segmentations follow that improve the extent and identification of objects, describing an iterative process. In each step, more information is extracted from the image and used to improve the aggregation of objects [18]. The image processing was done in a structured way using 3 levels: most segmentation and classification algorithms were applied at “Level 1”; an uppermost level (“Level 2”) was used for a second level classification of the letters & lines into urban and not urban classes; and “Level 3” was created to select samples for the accuracy assessment. During the process, the following classes were defined, not all of them specifically related to the true land cover classes target:
  • Cropland: Arable land for crop production
  • Meadow: Pastures and grasslands
  • Forest: Standing trees that serve for timber production
  • Urban: Human settlements such as cities or houses
  • Letters & lines: topography lines, boundaries, urban areas, and letters
  • Non-urban: Temporary class created to differentiate some objects from letters & lines and urban classes; this category was used in few images
Segmentation is the identification and classification of homogeneous regions in an image [34]. Two methods were applied: quadtree-based at the pixel level and multi-resolution segmentation on level 1. The quadtree-based segmentation algorithm splits the pixel domain into a quadtree grid formed by square objects, where each square has a power of two and aligned to the image left and top borders. Every square has the maximum possible size according the homogeneity criteria defined by a color mode parameter with a scale of 60. The scale defines the maximum color difference within each selected image layer or band. The weight of the image layers depending on their importance or suitability for the segmentation result was equal in this case [21,35].
Multi-resolution segmentation is a bottom-up region merging technique that aggregates the quadtree image objects on Level 1, minimizing the average heterogeneity and maximizing the respective homogeneity. This algorithm starts with single pixel objects and merges them iteratively until the homogeneity criterion is reached [34]. For all the images analyzed, the homogeneity criterion was defined by a scale of 10, shape of 0.5, and compactness of 0.8. This homogeneity criterion is a measure of the objects size, texture, and internal heterogeneity. Similar to the quadtree segmentation, only RGB bands were considered in the segmentation. After a visual inspection of each RGB layer, the blue band was assigned a weight = 2, in comparison to bands red and green, where weight = 1. This weight value was taken into account when the algorithm classified each image. This procedure enhanced the contrast among the objects.
Variables created. A set of variables was created besides the relational functions provided by eCognition. They were applied to objects of the same level (i.e., Level 1 and Level 2) and allowed to distinguish between at least two different class features. The normalized brightness allows to see the equalized brightness of all the bands. It was calculated with the Customized Features tool using the following equation:
Normalized Brightness = (max − Brightness)/(max − min)
where max is the maximum and min the minimum of the brightness. Hue, Saturation, and Intensity (HSI) convert RGB color space values to HSI values. These variables were not only calculated using RGB layers but also the normalized layers. The total brightness of a layer is defined by the Intensity. Hue is the main or average wavelength of light that makes up a color. Saturation indicates the amount of a specific color in relation to gray [36]. In total, twelve HSI variables were calculated empirically (Table 1) and used throughout the whole classification in different stages (see Table S2). The variables were chosen after testing all possible combinations with each position sheet. The best combination of Hue, Saturation, and Intensity was the one that allowed distinguishing between two different class features in each position sheet.
Classification algorithms for cropland, forest, meadow, urban, non-urban, and letters & lines. For every image (×26) and every analysis class (×6), diverse sets of variables and algorithms were tested in terms of usefulness and range of action. This process was repeated approximately 312 times, for an average of two variables and algorithms per class. When not stated otherwise, all the values and thresholds for the variables and algorithms used here were calculated by visual inspection and trial and error.
In addition to the variables, extra bands, and algorithms presented above, parameters were also used in the classification process. These parameters or statistics are predefined in the software, e.g., mean, ratio, area, relative border, shape, variance, and covariance, among many others. During the class identification, mean, brightness, standard deviation, and shape indexes were the most used. Spatial features, such as area, relative border with a specific class, and distance to scene border, were used in the reshaping and border improvement phase. This distinction is not exclusive, since many combinations are possible. Due to the noise generated by physical damage as well as differences in the tone of many images, small-scale manual correction was necessary after the automatic classification. Exemplary classification results are shown in Figure 2.
The classification of objects into the desired land cover classes was done by a series of algorithms used iteratively (Table 2). The unique characteristics of every image determined the selection and frequency of use of each algorithm. For every set of variables, bands, and parameters used, threshold values were chosen and used in the classification. Objects in the image were assigned to a land cover class given that they meet the requirements set by the chosen thresholds. An overview of the type of algorithms used can be found in Table 2.
The objects in the historical maps were not classified all at once, but in diverse steps and levels or layers. First, letters & lines were separated from the rest of the image at the pixel level. The resultant layer containing the remaining objects were stored in the Level 1 layer. Second, cropland, meadow, and forest objects were identified in Level 1. Third, the letters & lines were processed in the Level 2 layer. Since urban objects share the same color and shape of letters & lines objects, these needed to be separated from each other, as well as the white background (non-urban class), in Level 2. The process of incorporating the letters & lines into the neighboring classes was difficult, since it created thorny borders that were laborious to smooth. Finally, Level 1 and 2 classified objects were merged into one layer containing the desired land cover classes: cropland, forest, meadow, and urban.
Land cover processing. Vector and topographic files were clipped to the area of the Main watershed in QGIS 2.14. Files from both time steps were merged (MMQGIS Plugin), cleaned (using module v.in.ogr.qgis from GRASS 7 in QGIS), and diffused (standard tool) to the Land cover classes of interest: cropland, forest, meadow, and urban. The resulting vector files for each time step were clipped to the Main catchment area and rasterized using QGIS Raster calculator tool.

2.4. Accuracy Assessment

Accuracy assessment was done in eCognition using the method “Error Matrix Based on TTA (Training and Test Area) Mask”. We used samples taken on each image (training samples on Level 3) to compare with the classification done in the model. The confusion matrix is created using observed and predicted samples for: cropland, forest, meadow and urban. The TTA Mask method includes various indexes in the final assessment: Producer, User, Hellden, Short, and Kappa Index of Agreement (KIA). The accuracy assessment of eCognition tests how well the own ruleset allows assigning the existing image material to the chosen classes. Thus, it describes the inner accuracy and not the absolute hit rate. It can be used to improve the own ruleset by specifically optimizing classes that do not achieve good values.
Therefore, a manual classification was carried out in addition for selected quadrants. For this purpose, a visual categorization of all map sheets in three groups according to their quality was done (see Figure S1). Then six position sheets were randomly selected in each group (assigning random numbers for each map within the three groups and usage of the three lowest ones). Since in the quality group “very good” only 5 maps were available, we resulted in 17 selected maps. A grid layer was created. One quadrant (2000 × 2000 m) within the grid layer for each of the selected maps was randomly chosen (via QGIS function Random points in extent). Each quadrant per map (total of 17 quadrants) was manually reclassified as shapes according to following land cover types: cropland, forest, meadow, and urban. This was done not only using the position sheets (1:25,000), but also that of the primary sheets (1:5000) with the more accurate information (see Figure S3). The area for each land cover type within one quadrant was calculated. The accuracy of the automatic classification of the historical images was evaluated based on the congruence with the manual classification. The confusion matrix between manual classification and eCognition classification was performed using ArcGIS Toolset Segmentation and Classification based on raster maps. One test unit corresponds to the size of one grid cell in the eCognition classification of approximately 23.36 m2. In total, 2,704,902 grid cells based on manually classified shapes were tested against the eCognition classification. The user and producer accuracies and the Kappa value were calculated for the 17 map sheets separately and for all in total.

3. Results

3.1. Historical Land Cover Maps Classified

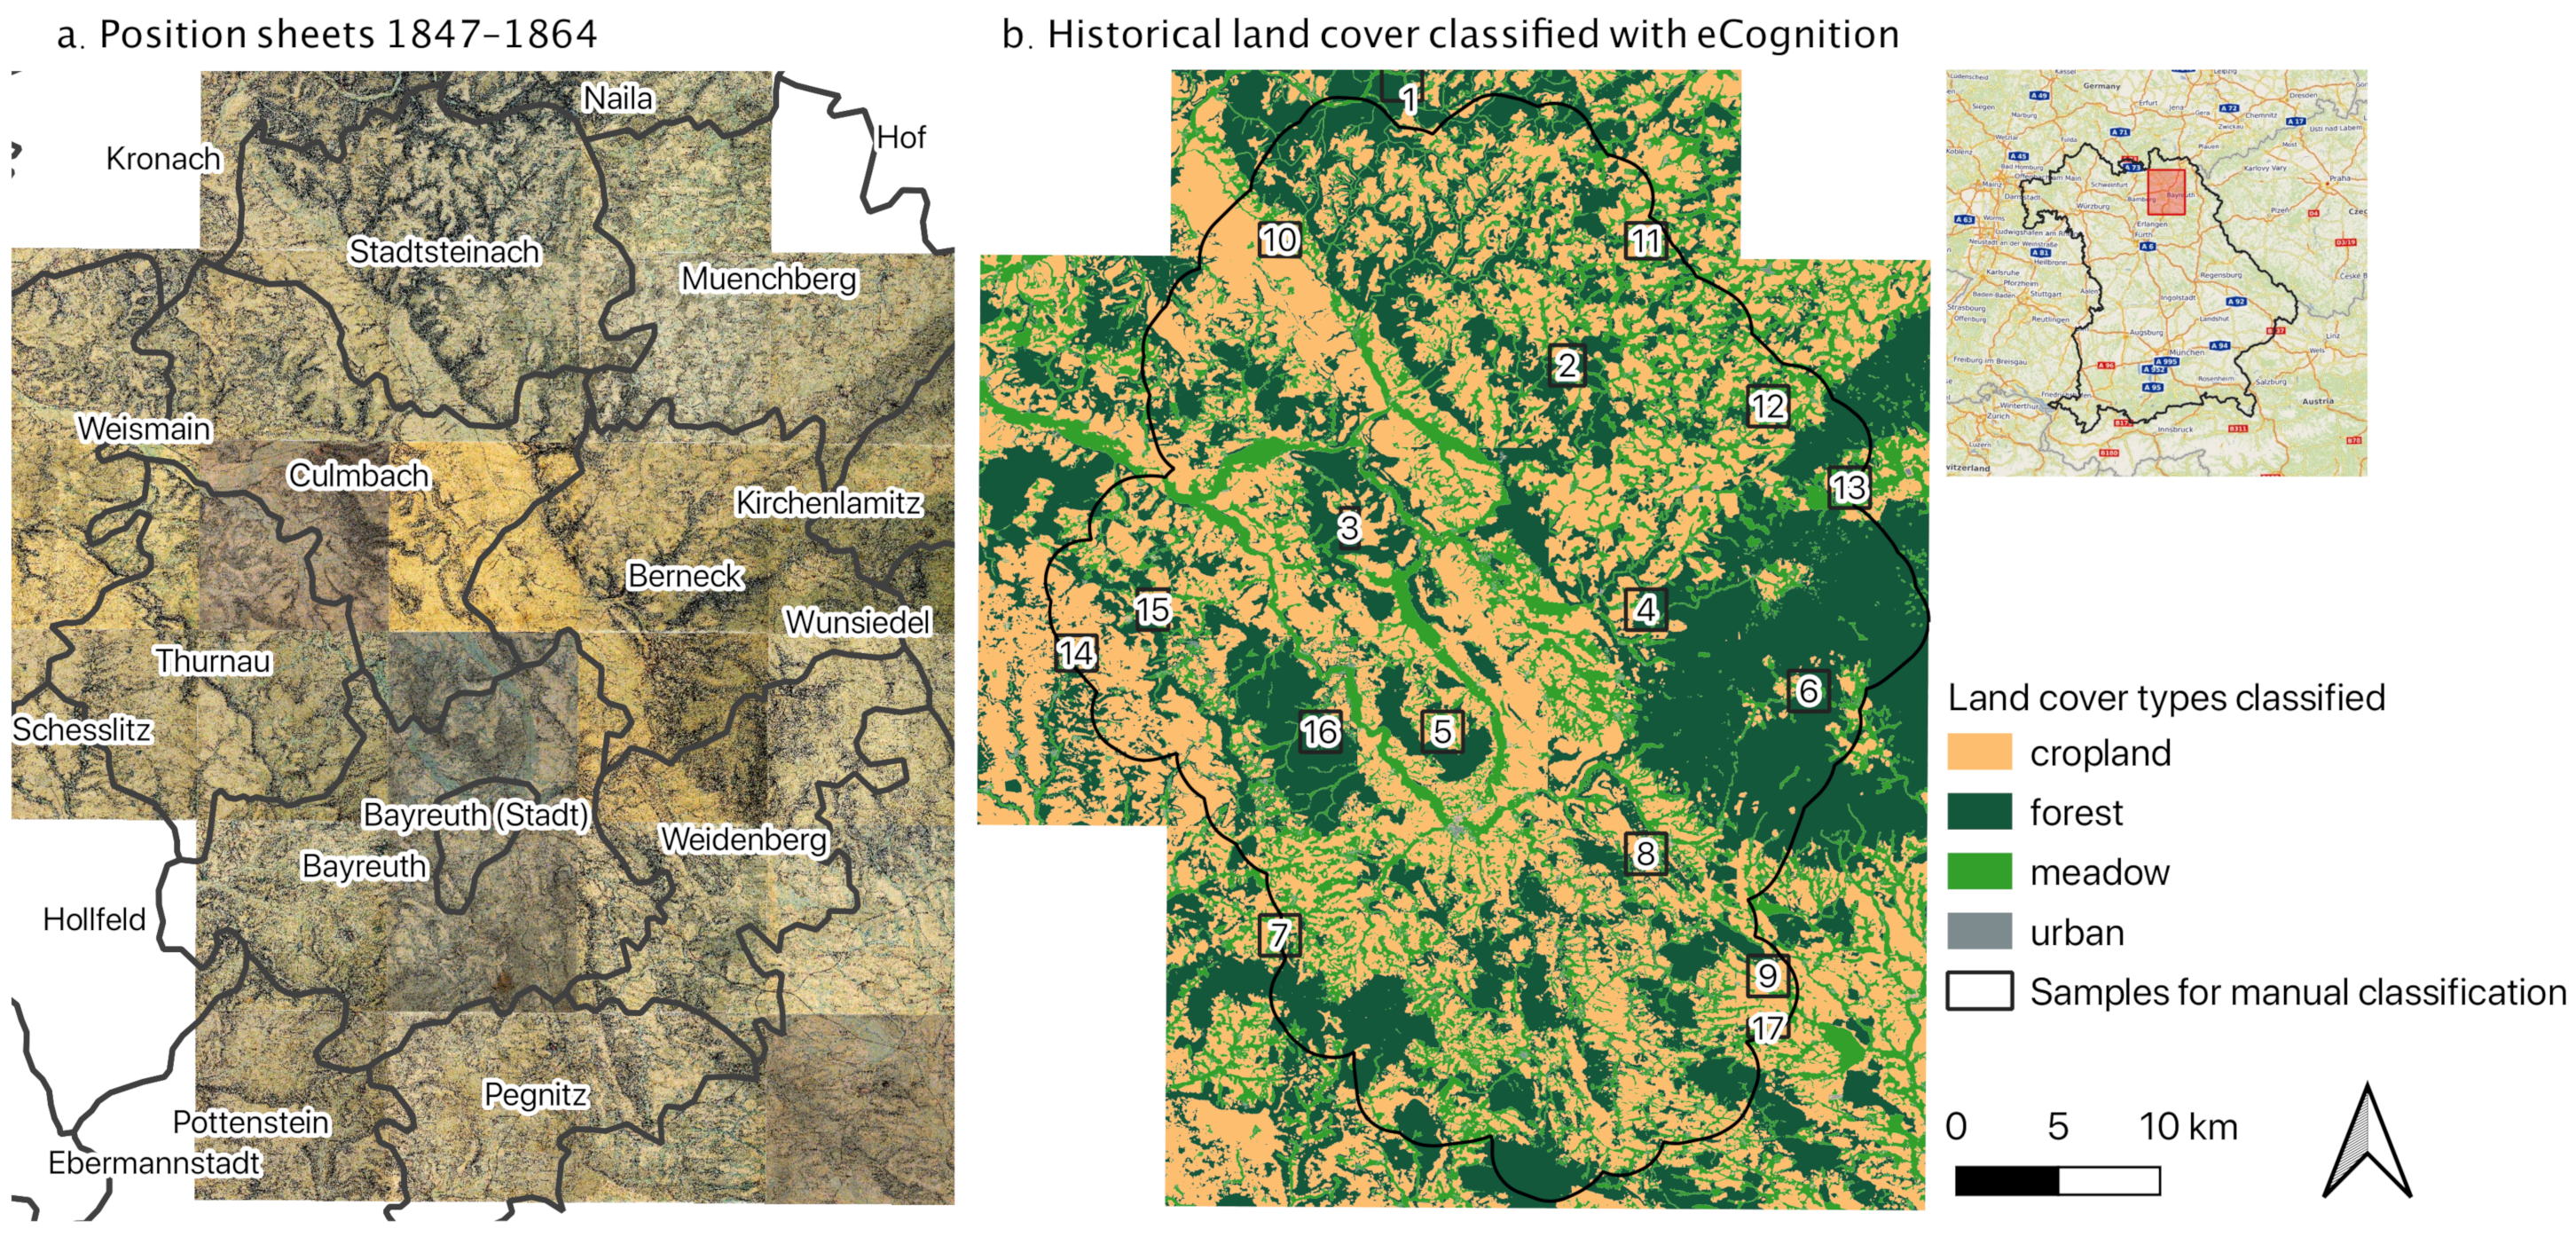
The position sheets created in the 19th century based on the primary sheets of the years 1847–1864 (for simplification labeled 1850) as well as the results for the automatic classification are shown in Figure 3. Figure 3a shows in addition the borders of the historical policy districts (equivalent to today’s counties) and Figure 3b the location of the randomly selected quadrants for the manual reclassification as well as the borders of the watershed of the rivers Red and White Main. According to the automatic classification, 40% of the land was classified as cropland, 35% as forest, 22% as meadows, and only 0.5% as urban areas. For 3% of the land, no land cover was classified, because police districts were larger than the sampled area. Differences between the policy districts with respect to land cover distribution are remarkable. In the 19th century cadastral statistics for the year 1853, 42% of the land was classified as cropland, 32% as forest, 20% as meadows, and 0.7% as urban areas (Table 3).

3.2. Change Analysis

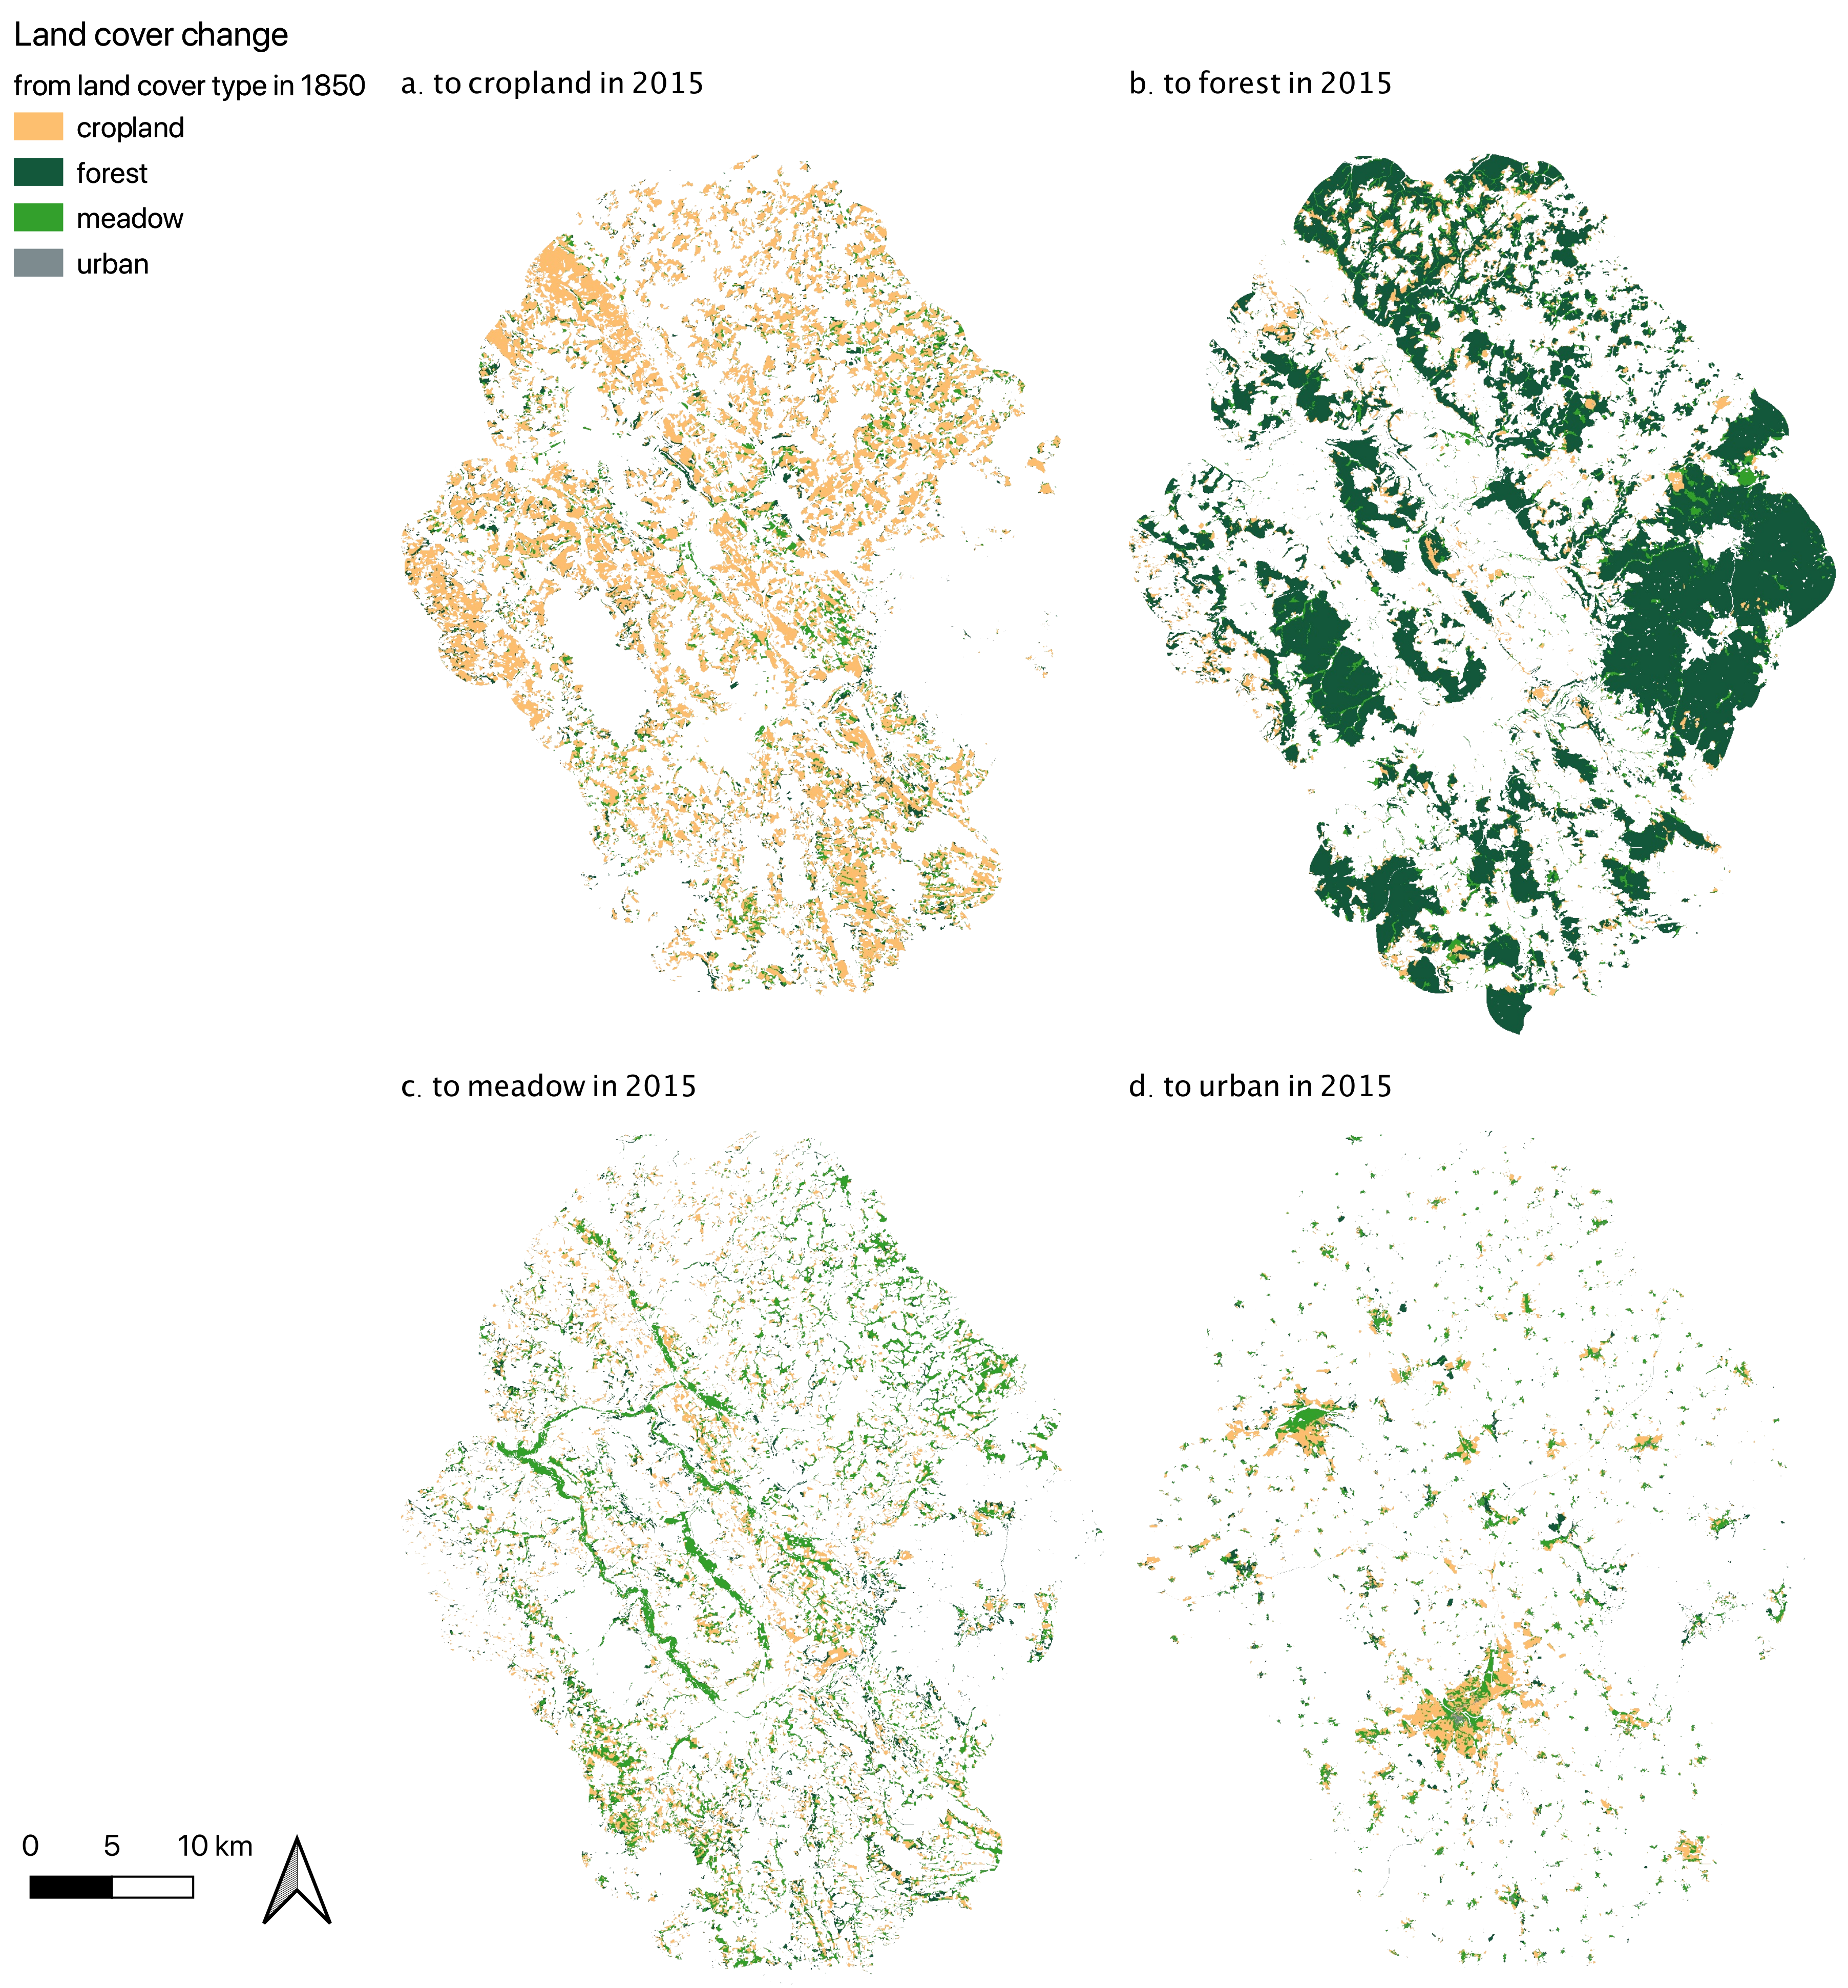
The analysis of land cover change was done for the watershed of the Rivers Red and White Main, because this allows using the results in further assessments of ecosystem services (e.g., erosion regulation, timber production, and crop production). Here, water bodies and other land cover were excluded from the analysis, because they sum up together only to 0.8 percent in current time and could not be classified on historical maps, because of technical difficulties. Overall, there was a strong increase in urban area by 2600% from 0.3% to 8.8% of the landscape, a severe loss of cropland (−24%), and a moderate one of meadows (−4%), as well as a slight gain in forests (+4%) (Table 4 and Figure S2). Cropland shows overall strong persistence; only some meadows and forests were turned into this land cover (Figure 4a). Similarly, forests generally show strong persistence, but former cropland and meadows were transformed into forests in more mountain areas in the Franconian Forests, Franconian Switzerland, and Fichtel Mountains (Figure 4b). Meadows show a moderate persistence and partly origin from cropland and less from forests (Figure 4c). Urban land in 2015 was mainly built on cropland and meadows of the 19th century (Figure 4d). Table 5 quantifies the spatially explicit change shown in Figure 4, i.e., how much land of a current land cover type was in the past in cropland, meadow, forest, or urban cover.

3.3. Accuracy Assessment

In general, the segmentation process produced classified images with high accuracy: 98 ± 0.4% (Overall accuracy) and 96 ± 0.06% (Kappa). Meadow and forest showed the highest accuracy, followed by cropland. However, urban class had the lowest accuracy for all indexes (see Table 6). This is probably due to the difficulty of separating letters & lines and urban classes. Similarly, low accuracies in the remaining classes reveals complications in separating objects from two or more classes. Generally, when low accuracies were registered, the producer, short, and Kappa indexes were lower than Hellden and user indexes.
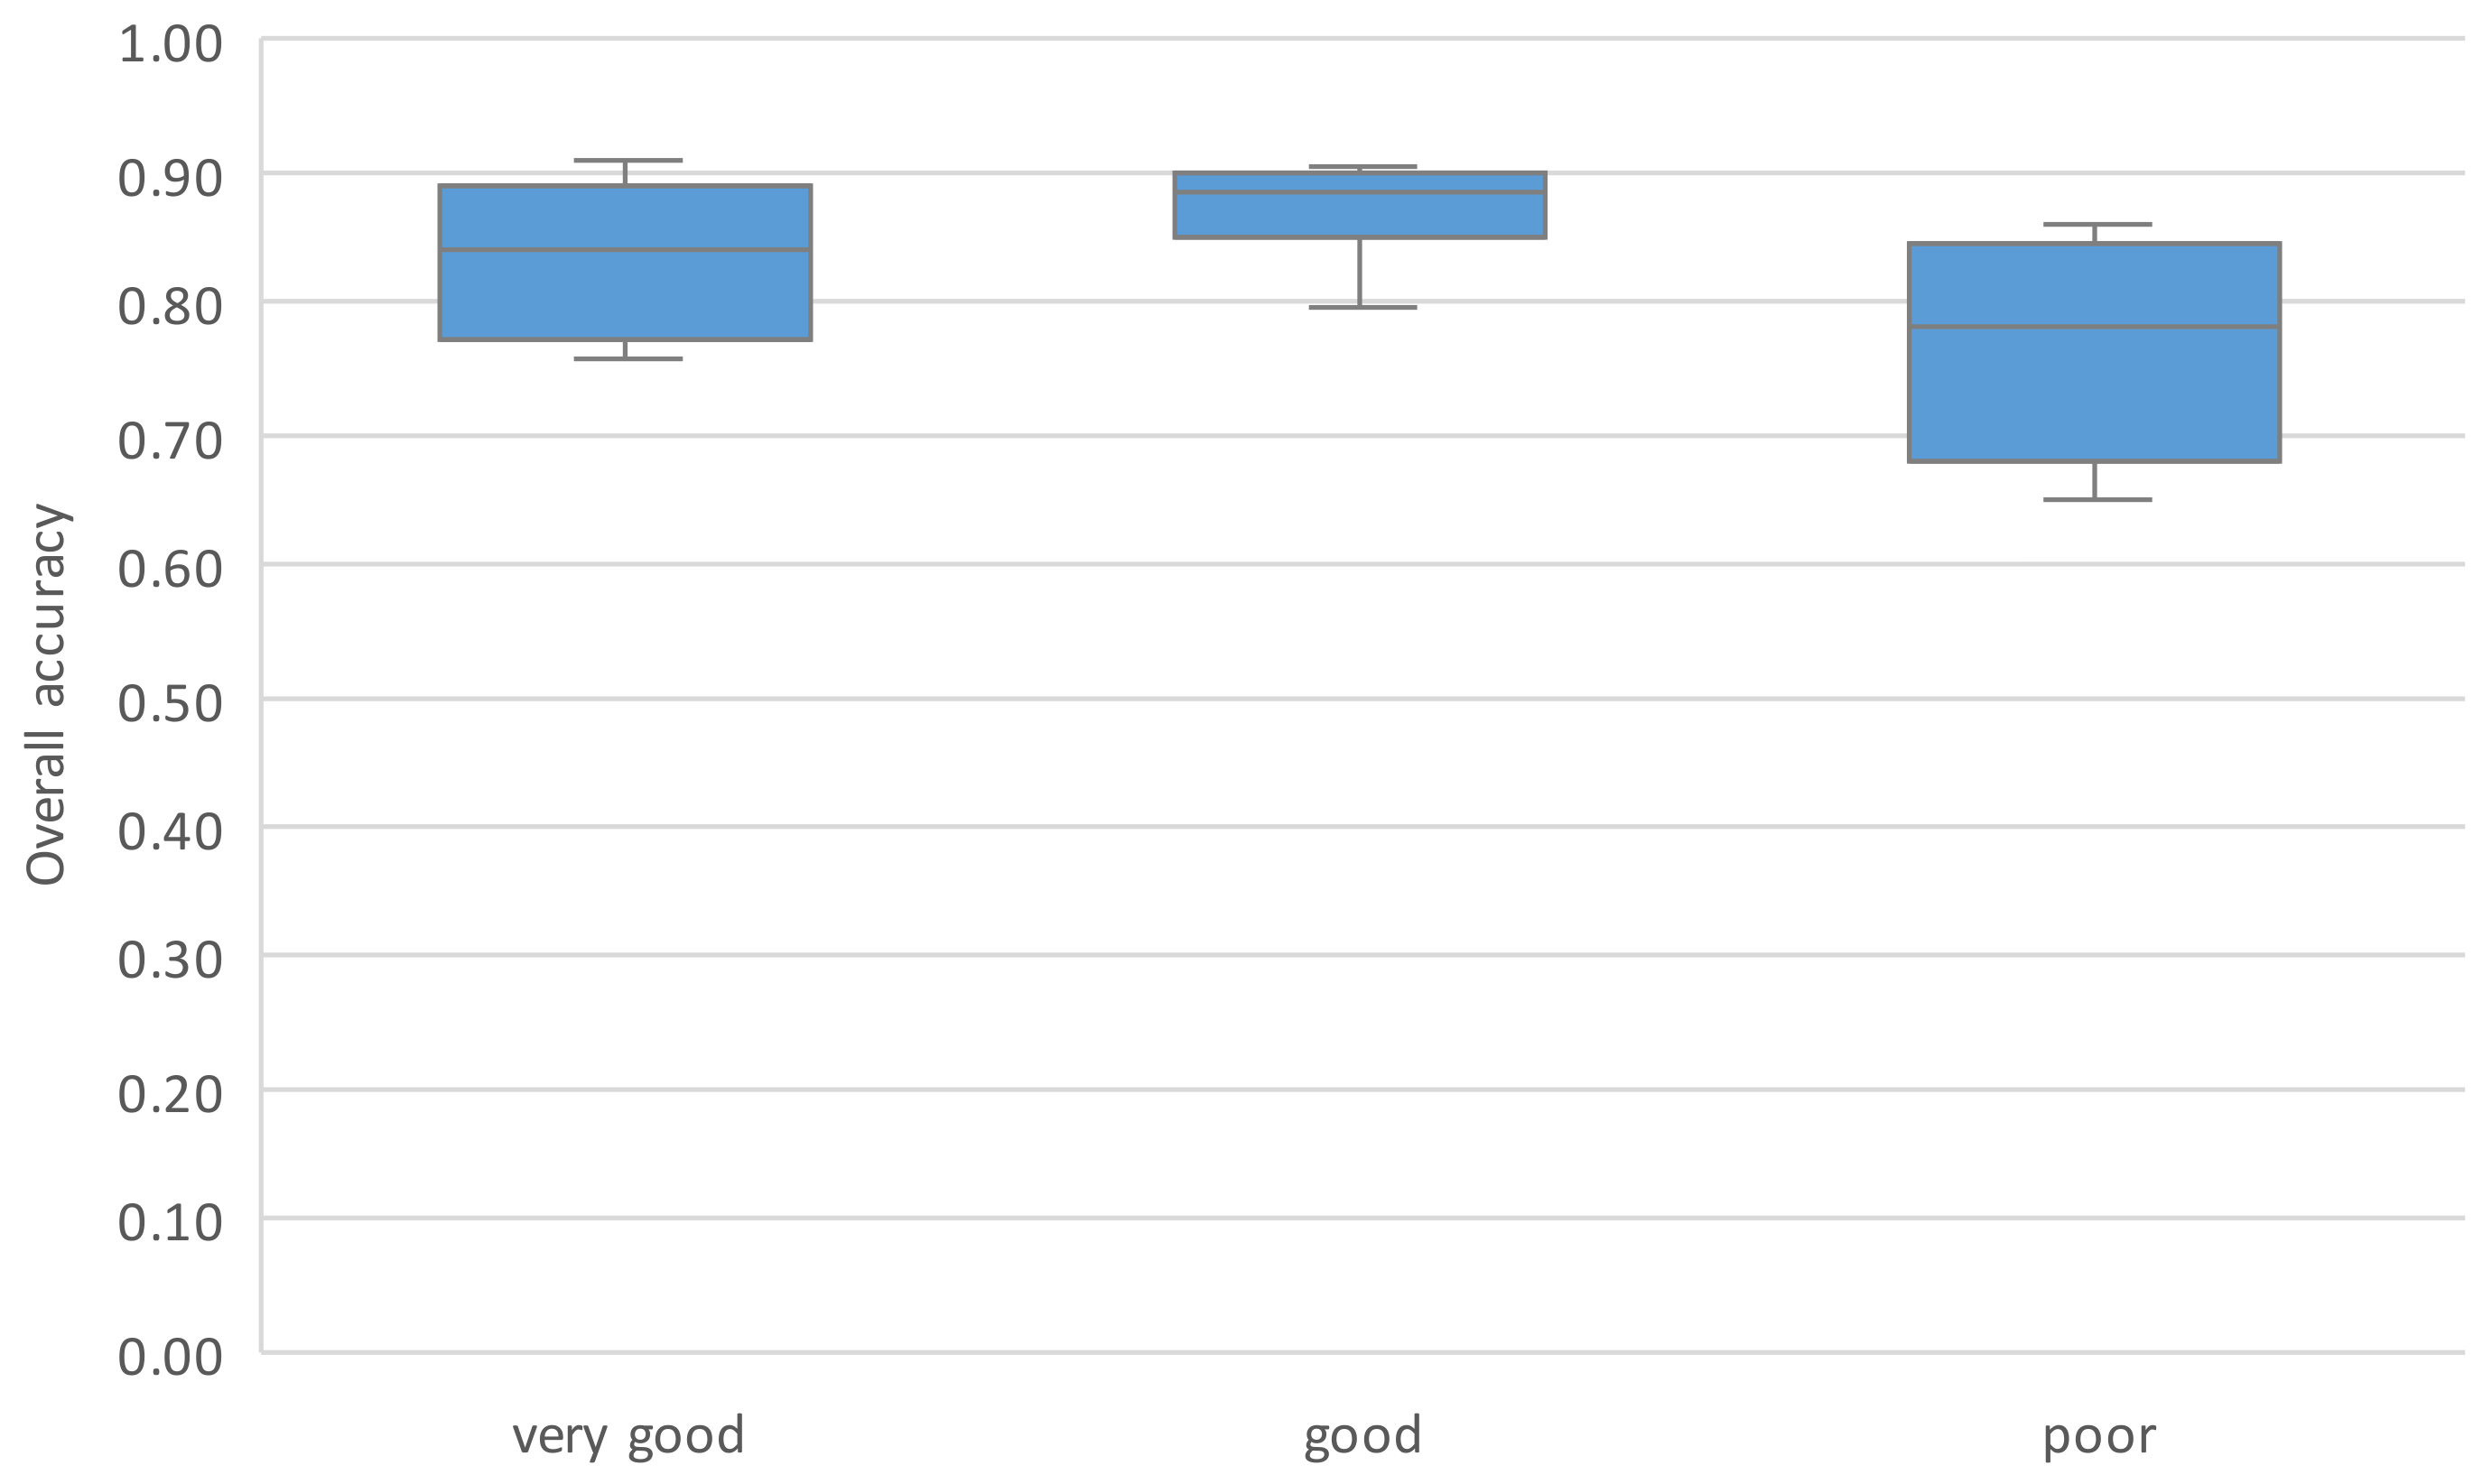
Additionally, the results of the algorithm for the automatic classification were compared with the manual reclassification. Areas for both were cropped to the same extent (see Figure S3). The confusion matrix (Table 7) shows the results for the accuracy assessment, which is overall 0.82 with a kappa of 0.73. The user accuracy for all 17 sample quadrants was 0.82 for cropland, 0.82 for forest, 0.83 for meadow, and 0.76 for urban. For water, it was 0 because eCognition algorithm did not capture this land cover at all. Differentiated results of the accuracy for three qualities of input maps are seen Table S1. Overall, maps with very good and good quality could be automatically classified with higher accuracy than those with poor quality (Figure 5).
The manual reclassification for the 17 sample quadrants revealed typical problems of the automatic classification using eCognition (see Figure 3 for overview and Figure S3 for details). These overestimated forests because of replacement of hachures (old style topographic lines) and letters of names with surroundings (e.g., Samples 8 and 1). Meadows were underestimated, because complex small-scale pattern of cropland and meadows could not be sufficiently resolved (e.g., Samples 7 and 12). This underestimation is also partly due to the fact that the position sheet (scale 1:25,000) we used for the automatic classification is a product of the primary sheets (1:5000). During this map transformation, complex meadow–cropland patterns were simplified into cropland. In the Fichtel Mountains, the dense hachures partly led to an overestimation of meadows. Underestimation of urban land cover is more an artifact, because in the automatic classification individual houses were selected, but in the manual reclassification the settled area was classified including the green space in between (e.g., IDs 7 and 9). Water bodies could not be classified at all automatically, because of their similarity to meadows. However, they were identified in the manual reclassification.

4. Discussion

4.1. Land Cover Change in the Main Catchment

Based on the classification of the historical maps, we could analyze the land cover change between 1850s and 2015. The results show a tremendous increase of urban settlement at the cost of fertile cropland and meadows formerly used for food production. This is in line with other studies, for example, only in Bamberg, Bayreuth, and Lichtenfels the urban expansion increased up to almost 460% in more than 150 years (from 2.60 km2 in 1850s to 14.49 km2 in 2011) [12]. The changes in the reported areas of the Upper Franconia were very low during the last part of the 19th century (1850–1900). Only from the 20th century onwards, the urban settlements and structures (pavement and building) increased during industrialization along with the extension and construction of road networks [4]. In our study, region forests moderately increased, also mainly on former cropland and former meadows in more mountainous areas.
Previous studies in nearby areas in Upper Franconia dominated by a karst topography of Jurassic limestone have shown that conversion from cropland to forests took place where these fields were left abandoned, planted, or located on slopes [13]. In the 19th century, this area was covered largely by agricultural (66%) surrounded by pastures and wastelands (9%). Meadows (3%), mostly located in the valleys, were the most intensively used areas of the region for fodder production. Urban areas where separated by belts of meadows and orchards. Wooded areas had a lower extension (18.2% in the Franconian Alb) and were mostly located on steep, shaded hillsides or very distant areas.

4.2. Remote Sensing of Historical Maps Using eCognition

Methods for object-based classification implemented in eCognition could deliver accurate image classification of historical maps with higher analysis capacity while being less labor intensive. It is built on to the approach originally known as Fractal Net Evolution [37]. It is suitable for object-based image classification and simulates human perception of an image. Objects are created using their pixel values and the contextual information of the patterns they create. Multi-scale analysis allows identification of objects at different linked resolution levels created by the user [18]. This multi-scale structure allows hierarchical networks of the objects, with meaningful connections between them, and the neighboring objects of the same level [18]. Besides its success, it also has many drawbacks. It does not provide tools for pre-processing of the data; for this, other software is needed. The classified images are not independently reproducible [22], because it requires the user perception and knowledge of the study area to orientate certain classification algorithms. Finally, the feature extraction is a long list of tools that are very useful but time consuming to sort out for the desired objective [22].
Object based image classification of historical maps have been proven to work well, when the historical maps have a good quality. This can be seen in previous work [9,15], where the input maps area relatively clear with distinct colors for each land cover type. Unfortunately, historic maps have mixed qualities often with physical damages. The problem we addressed in this study was how to deal with such imperfect maps in different ways. On the one side, we used the HSI variables, which were an important input for the classification. In this paper, the HSI feature with the lowest recognition accuracy is Saturation, while the normalized RGB bands and Hue have similar high discriminative power in a color-based object recognition. Hue was the feature more able to classify objects whereas intensity in a lesser extent—a result that coincides which previous research [18]. On the other side, the usage of normalized bands provided more information than just the three RGB bands that the historical maps have. A histogram matching or an improvement of the image contrast by means of a histogram was not possible, due to the low overlap between the position sheets.
The accuracy assessment of eCognition showed differences between the Kappa index of accuracy and overall accuracy. Since cropland, meadow, and forest are usually very large class objects in comparison with urban and account for the majority of the area of the maps, the probability of finding wrongly classified pixels is lower, which has less effect on overall accuracy [38]. On the contrary, Kappa represents the level of agreement of two dataset corrected by chance [39]. The confusion matrix of the images with low values of Kappa shows many errors of commission, which indicates that some pixels where recognized as forest or meadow, when in reality they are urban. Due to the relative small size of the urban objects and their overlap and similarity with hatching lines, the boundaries of urban objects or similar letters & lines objects were probably misclassified as their enclosing classes: meadow and forest. However, many authors advocate against the use of Kappa because of its mathematical and conceptual flaws and reliance on randomness [40]. To further check the accuracy of eCognition classification, we also performed the manual classification.
The results of the classification of the historical maps show good to moderate accuracy based on manual reclassification for 17 selected quadrants. It is worse compared to the accuracy assessed with eCognition. The comparison of the automatic classification with the manual one shows that the error per sample varies between 65% (Sample 8) and 91% (Sample 5) (Table S1 and Figure S3). Overall, the congruence was higher for the very good and good map qualities compared to the poor ones (Figure 5). Problems have been physical damages (Figure S4) and different tonalities of the historical maps leading to edge effects (Figure S5). Black hachures, which indicate the slope in the historical maps, led to problems in the classification. This was specifically true for steep slopes, where the hachures get very dense. In addition, the colors for meadows and cropland were difficult to distinguish especially on poor maps. Urban area also deviates between the automatic classification and manual one. In the latter, each individual house could not be indicated by a polygon, which was done in the automatic classification.
Additionally, the average land cover quantities were compared with the statistical tables by von Hermann (1857) [32]. Table 3 shows for the selected police districts that the area for the four land cover types based on the automatic classification matches the historical cadastral statistics quite well. However, streets, water bodies, and rocks and barren land could not be detected at all with the automatic algorithm. Even though the automatic classification assesses land cover with errors, it provides a possibility to digitize large areas covered by the historical maps. Figure S3 shows that the automatic classification could grasp the small-scale pattern of land cover remarkably well. Based on this capability, this study showed that the land cover change analysis reveals interesting spatial patterns in the whole catchment area.
We analyzed in this study 2268 km2 of the 19th century maps of whole Bavaria which in total cover more than 70,000 km2. This would provide a unique opportunity for large-scale land use and land cover change analysis in Central Europe based on a homogeneous dataset. For testing the automatic classification, we selected our case study region showing very good-, good-, and poor-quality tiles as input. Our work showed that it was necessary to develop a separate OBIA algorithm for each tile. However, not surprisingly, the accuracy of the high-quality maps is better compared to low-quality ones. This confirms the important effect of the image quality in the classification.

5. Conclusions

Our work showed that automatic classification of historical maps with mixed quality is possible, but accuracy is between high and moderate depending on the input quality of the maps. In addition to the historical maps at the scale of 1:25,000, more accurate maps called the primary sheets from the same time at a scale of 1:5000 are also available (see Figure S3). In future research it is advisable if those more detailed maps based not on a color coding (e.g., forest is dark green), but on symbolic coding (e.g., forest is shown with small hand drawn trees) are better suited to automatic classification. Nevertheless, we conclude that our work here allows spatially explicit insights into the land cover of pre-industrial times in comparison to today’s cover. Such land cover change analysis can be the basis in future research for the reconstruction of the changes in human–environment systems including an assessment of ecosystem services provided in a given region. Relevant ecosystem services are provisioning services (e.g., crops, fodder, timber, cattle, and fish) and regulating services (e.g., flood control and erosion control) [12]. This is specifically interesting because it covers the state of pre-industrialized land cover with low amount of urban land in the 19th century as well as the state of urbanized and industrialized landscapes in the 20th century. During this period of industrialization, Bavaria has changed from a low populated, self-sufficient country into a region with high population density, which relies on the imports of agricultural commodities from all over the world. This is a development exemplary for many regions worldwide.

Supplementary Materials

The following are available online at https://www.mdpi.com/2072-4292/12/24/4048/s1, Figure S1: Numbers and years of selected position sheets from 19th century Bavaria. Quality of tiles randomly selected (marked with *) for manual classification was (a) very good, (b) good or (c) poor. Position sheets in group (a) are 52, 53, 80, 105, 130; in group (b) 51, 78, 79, 102, 103, 129, 157, 159, 185; and in group (c) 76, 77, 104, 106, 128, 131, 132, 156, 158, 183, 184, 186. Figure S2: Land cover of 1850 and of 2015 as basis for change analysis. The water bodies on the historical map are taken from the current map assuming that their extent did not change. Figure S3: Comparison of automatic classification with manual classification for 17 randomly selected quadrants (see Figure S1 for location). For better assessment also the primary sheets (scale 1:5000 from 1847–1864) as well as the digital orthophotos (80 cm) from 2017 are shown. (Note: some quadrants are not rectangular, because of edge effects). Table S1: Comparison of automatic classification with manual classification. Figure S4: Physical damage examples of historical maps (A) scratches, (B) colours fading or missing, (C) stains and (D) incomplete features at borders. Figure S5: Edge effects due to differently coloured maps. Table S2: eCognition features used in classification specified for each of the map tiles. (With feature white: Brightness ≥ 254, Brightness = 0 and Distance to scene border = 0 Pxl).

Author Contributions

T.K., supervision, support with data and software questions, preparation of graphs and tables, and finalizing the paper; Y.U.-T., application of methods, interpretation and analysis of results, and drafting the paper; R.S., revision of the paper and technical support with software and hardware; and M.W., revision of the paper and support with software questions. All authors have read and agreed to the published version of the manuscript.

Funding

This research received no external funding.

Acknowledgments

We thank the Bavarian State Agency for Digitization, High-Speed Internet and Surveying (LDBV) for the provisioning of the historical land cover maps with the scale 1:5000 and 1:25,000. Specifically, Stefan Scholz from the Bayreuth Agency for Digitization, High-Speed Internet and Surveying supported us with his knowledge about the historical maps. Thanks are also given to Anne-Katrin Selbmann who performed the manual reclassification for the accuracy assessment, as well as Melissa Versluis, who checked additional area in a second round of manual classification. We thank Rebekka Riebl for digitizing the borders of the historical policy districts and the cadastral statistics data from 1853. Finally, we deeply acknowledge the work of hundreds and hundreds of field surveyors and cartographers who produced in the 19th century in a time span of over 60 years those highly accurate land cover maps in great detail for the whole Bavaria.

Conflicts of Interest

The authors declare no conflict of interest.

References

  1. Lambin, E.; Geist, H.J. Land-Use and Land-Cover Change: Local Processes and Global Impacts; Springer: Berlin/Heidelberg, Germany, 2006. [Google Scholar]
  2. Petit, C.C.; Lambin, E.F. Impact of data integration technique on historical land-use/land-cover change: Comparing historical maps with remote sensing data in the Belgian Ardennes. Landsc. Ecol. 2002, 17, 117–132. [Google Scholar] [CrossRef]
  3. Al-Fares, W. Historical Land Use/Land Cover Classification Using Remote Sensing; Springer: Berlin/Heidelberg, Germany, 2013; ISBN 978-3-319-00623-9. [Google Scholar]
  4. Bender, O.; Boehmer, H.J.; Jens, D.; Schumacher, K.P. Analysis of land-use change in a sector of Upper Franconia (Bavaria, Germany) since 1850 using land register records. Landsc. Ecol 2005, 20, 149–163. [Google Scholar] [CrossRef]
  5. Sohl, T.; Sleeter, B. Role of Remote Sensing for Land-Use and Land-Cover Change Modeling. In Remote Sensing of Land Use and Land Cover: Principles and Applications; CRC Press: Boca Raton, FL, USA, 2012; pp. 225–239. ISBN 978-1-4200-7075-0. [Google Scholar]
  6. Dallimer, M.; Davies, Z.G.; Diaz-Porras, D.F.; Irvine, K.N.; Maltby, L.; Warren, P.H.; Armsworth, P.R.; Gaston, K.J. Historical influences on the current provision of multiple ecosystem services. Glob. Environ. Chang. 2015, 31, 307–317. [Google Scholar] [CrossRef] [Green Version]
  7. Talich, M. Classification of digitised old maps and possibilities of its utilization. ePerimetron 2012, 7, 11. [Google Scholar]
  8. Herrault, P.-A.; Sheeren, D.; Fauvel, M.; Paegelow, M. Automatic Extraction of Forests from Historical Maps Based on Unsupervised Classification in the CIELab Color Space. In Geographic Information Science at the Heart of Europe; Vandenbroucke, D., Bucher, B., Crompvoets, J., Eds.; Springer International Publishing: Cham, Switzerland, 2013; pp. 95–112. ISBN 978-3-319-00614-7. [Google Scholar]
  9. Gobbi, S.; Ciolli, M.; La Porta, N.; Rocchini, D.; Tattoni, C.; Zatelli, P. New Tools for the Classification and Filtering of Historical Maps. Int. J. Geo-Inf. 2019, 8, 455. [Google Scholar] [CrossRef] [Green Version]
  10. Lautenbach, S.; Kugel, C.; Lausch, A.; Seppelt, R. Analysis of historic changes in regional ecosystem service provisioning using land use data. Ecol. Indic. 2011, 11, 676–687. [Google Scholar] [CrossRef]
  11. Bieling, C.; Plieninger, T.; Schaich, H. Patterns and causes of land change: Empirical results and conceptual considerations derived from a case study in the Swabian Alb, Germany. Land Use Policy 2013, 35, 192–203. [Google Scholar] [CrossRef]
  12. Früh-Müller, A.; Wegmann, M.; Koellner, T. Flood exposure and settlement expansion since pre-industrial times in 1850 until 2011 in north Bavaria, Germany. Reg Env. Chang. 2015, 15, 183–193. [Google Scholar] [CrossRef] [Green Version]
  13. Bender, O.; Boehmer, H.J.; Jens, D.; Schumacher, K.P. Using GIS to analyse long-term cultural landscape change in Southern Germany. Landsc. Urban Plan. 2005, 70, 111–125. [Google Scholar] [CrossRef]
  14. Blaschke, T.; Hay, G.J.; Kelly, M.; Lang, S.; Hofmann, P.; Addink, E.; Queiroz Feitosa, R.; van der Meer, F.; van der Werff, H.; van Coillie, F.; et al. Geographic Object-Based Image Analysis—Towards a new paradigm. ISPRS J. Photogramm. Remote Sens. 2014, 87, 180–191. [Google Scholar] [CrossRef] [PubMed] [Green Version]
  15. Auffret, A.G.; Kimberley, A.; Plue, J.; Skånes, H.; Jakobsson, S.; Waldén, E.; Wennbom, M.; Wood, H.; Bullock, J.M.; Cousins, S.A.O.; et al. HistMapR: Rapid digitization of historical land-use maps in R. Methods Ecol. Evol 2017, 8, 1453–1457. [Google Scholar] [CrossRef] [Green Version]
  16. Chiang, Y.-Y.; Leyk, S.; Knoblock, C.A. A Survey of Digital Map Processing Techniques. ACM Comput. Surv. 2014, 47, 1–44. [Google Scholar] [CrossRef]
  17. Blaschke, T. Object based image analysis for remote sensing. ISPRS J. Photogramm. Remote Sens. 2010, 65, 2–16. [Google Scholar] [CrossRef] [Green Version]
  18. Benz, U.C.; Hofmann, P.; Willhauck, G.; Lingenfelder, I.; Heynen, M. Multi-resolution, object-oriented fuzzy analysis of remote sensing data for GIS-ready information. ISPRS J. Photogramm. Remote Sens. 2004, 58, 239–258. [Google Scholar] [CrossRef]
  19. Liu, D.; Toman, E.; Fuller, Z.; Chen, G.; Londo, A.; Zhang, X.; Zhao, K. Integration of historical map and aerial imagery to characterize long-term land-use change and landscape dynamics: An object-based analysis via Random Forests. Ecol. Indic. 2018, 95, 595–605. [Google Scholar] [CrossRef]
  20. Chiang, Y.-Y.; Leyk, S.; Knoblock, C.A. Efficient and Robust Graphics Recognition from Historical Maps. In Graphics Recognition—New Trends and Challenges; Kwon, Y.-B., Ogier, J.-M., Eds.; Springer: Berlin/Heidelberg, Germany, 2013; pp. 25–35. [Google Scholar]
  21. Definiens. Definiens Developer 7: User Guide; Definiens: München, Germany, 2007. [Google Scholar]
  22. Nussbaum, S.; Menz, G. Object-Based Image Analysis and Treaty Verification; Springer: Dordrecht, The Netherlands, 2008. [Google Scholar]
  23. Bayerisches Landesamt für Umwelt 15. Bayreuther und Kulmbacher Land. In Entwurf Einer Kulturlandschaftlichen Gliederung Bayerns als Beitrag zur Biodiversität; Bayerisches Landesamt für Umwelt: Augsburg, Germany, 2011; p. 6. [Google Scholar]
  24. Wissing, J. A Hydrological Framework for Geo-referenced Steady-state Exposure Assessment in Surface Water on the Catchment Scale. Ph.D. Thesis, Osnabrück University, Osnabrück, Germany, 2010. [Google Scholar]
  25. Bayerisches Landesamt für Umwelt 12. Frankenwald mit Vorland. In Entwurf Einer Kulturlandschaftlichen Gliederung Bayerns als Beitrag zur Biodiversität; Bayerisches Landesamt für Umwelt: Augsburg, Germany, 2011; p. 9. [Google Scholar]
  26. Bayerisches Landesamt für Umwelt 13. Münchberger Land und Vogtland. In Entwurf Einer Kulturlandschaftlichen Gliederung Bayerns als Beitrag zur Biodiversität; Bayerisches Landesamt für Umwelt: Augsburg, Germany, 2011; p. 6. [Google Scholar]
  27. Bayerisches Landesamt für Umwelt 14. Fichtelgebirge mit Sechsaemterland. In Entwurf einer kulturlandschaftlichen Gliederung Bayerns als Beitrag zur Biodiversität; Bayerisches Landesamt für Umwelt: Augsburg, Germany, 2011; p. 8. [Google Scholar]
  28. Ziegler, T. Die Entstehung des Bayerischen Katasterwerks; Deutschen Vereins für Vermessungswesen (DVW) Landesverein Bayern e.V.: Munich, Germany, 1976. [Google Scholar]
  29. Seeberger, M. Wie Bayern Vermessen Wurde; Hefte zur Bayerischen Geschichte und Kultur; Haus der Bayerischen Geschichte: Augsburg, Germany, 2001. [Google Scholar]
  30. Lang, H. Charte vom Königreich Bayern nach den vorzüglichsten Hilfsmitteln neu gezeichnet von H. Lang. Nürnberg. 1853. Available online: http://gateway-bayern.de/BV011519761 (accessed on 31 October 2018).
  31. Algermissen, J.L.; Arendts, C. Spezialkarte des Königreiches Bayern in seiner neuen Gerichts- und Verwaltungs-Eintheilung vom 1 October 1879. Metz. 1888. Available online: http://gateway-bayern.de/BV011580694 (accessed on 31 October 2018).
  32. Von Hermann, F.B.W. Anbau und Ertrag, Besitzverhältnisse und Stückelung des Bodens, dann Lohn der Landbau-Arbeiter im Königreiche Bayern, nach dem Stande eines Mitteljahres aus amtlichen Quellen; Beiträge zur Statistik des Königreichs Bayern: München, Germany, 1857. [Google Scholar]
  33. Horning, N.; Leutner, B.; Wegmann, M. Land cover or image classification approaches. In Remote Sensing and GIS for Ecologists. Data in the Wild; Pelagic Publishing: Exeter, UK, 2016; pp. 166–196. [Google Scholar]
  34. Darwish, A.; Leukert, K.; Reinhardt, W. Image segmentation for the purpose of object-based classification. In Proceedings of the IEEE International Geoscience and Remote Sensing Symposium, Toulouse, France, 21–25 July 2003; Volume 3, pp. 2039–2041. [Google Scholar]
  35. Samet, H. The quadtree and related hierarchical data structures. Comput. Surv. 1984, 16, 187–260. [Google Scholar] [CrossRef] [Green Version]
  36. Lillesand, T.M.; Kiefer, R.W.; Chipman, J.W. Remote Sensing and Image Interpretation, 6th ed.; John Wiley & Sons: Hoboken, NJ, USA, 2008; ISBN 978-0-470-05245-7. [Google Scholar]
  37. Baatz, M.; Schäpe, A. Multiresolution Segmentation: An optimization approach for high quality multi-scale image segmentation. In Angewandte Geographische Informationsverarbeitung XII—Beitrage zum AGIT-Symposium, Salzburg 2000; Wichmann: Heidelberg, Germany, 2000; pp. 12–23. [Google Scholar]
  38. Lawrence, R.L.; Means, J.; Ripple, W. An Automated Method for Digitizing Color Thematic Maps. Am. Soc. Photogramm. Remote Sens. 1996, 62, 1245–1248. [Google Scholar]
  39. Stehman, S.V. Estimating the Kappa Coefficient and its Variance under Stratified Random Sampling. Am. Soc. Photogramm. Remote Sens. 1996, 62, 401–407. [Google Scholar]
  40. Pontius, R.G.; Millones, M. Death to Kappa: Birth of quantity disagreement and allocation disagreement for accuracy assessment. Int. J. Remote Sens. 2011, 32, 4407–4429. [Google Scholar] [CrossRef]
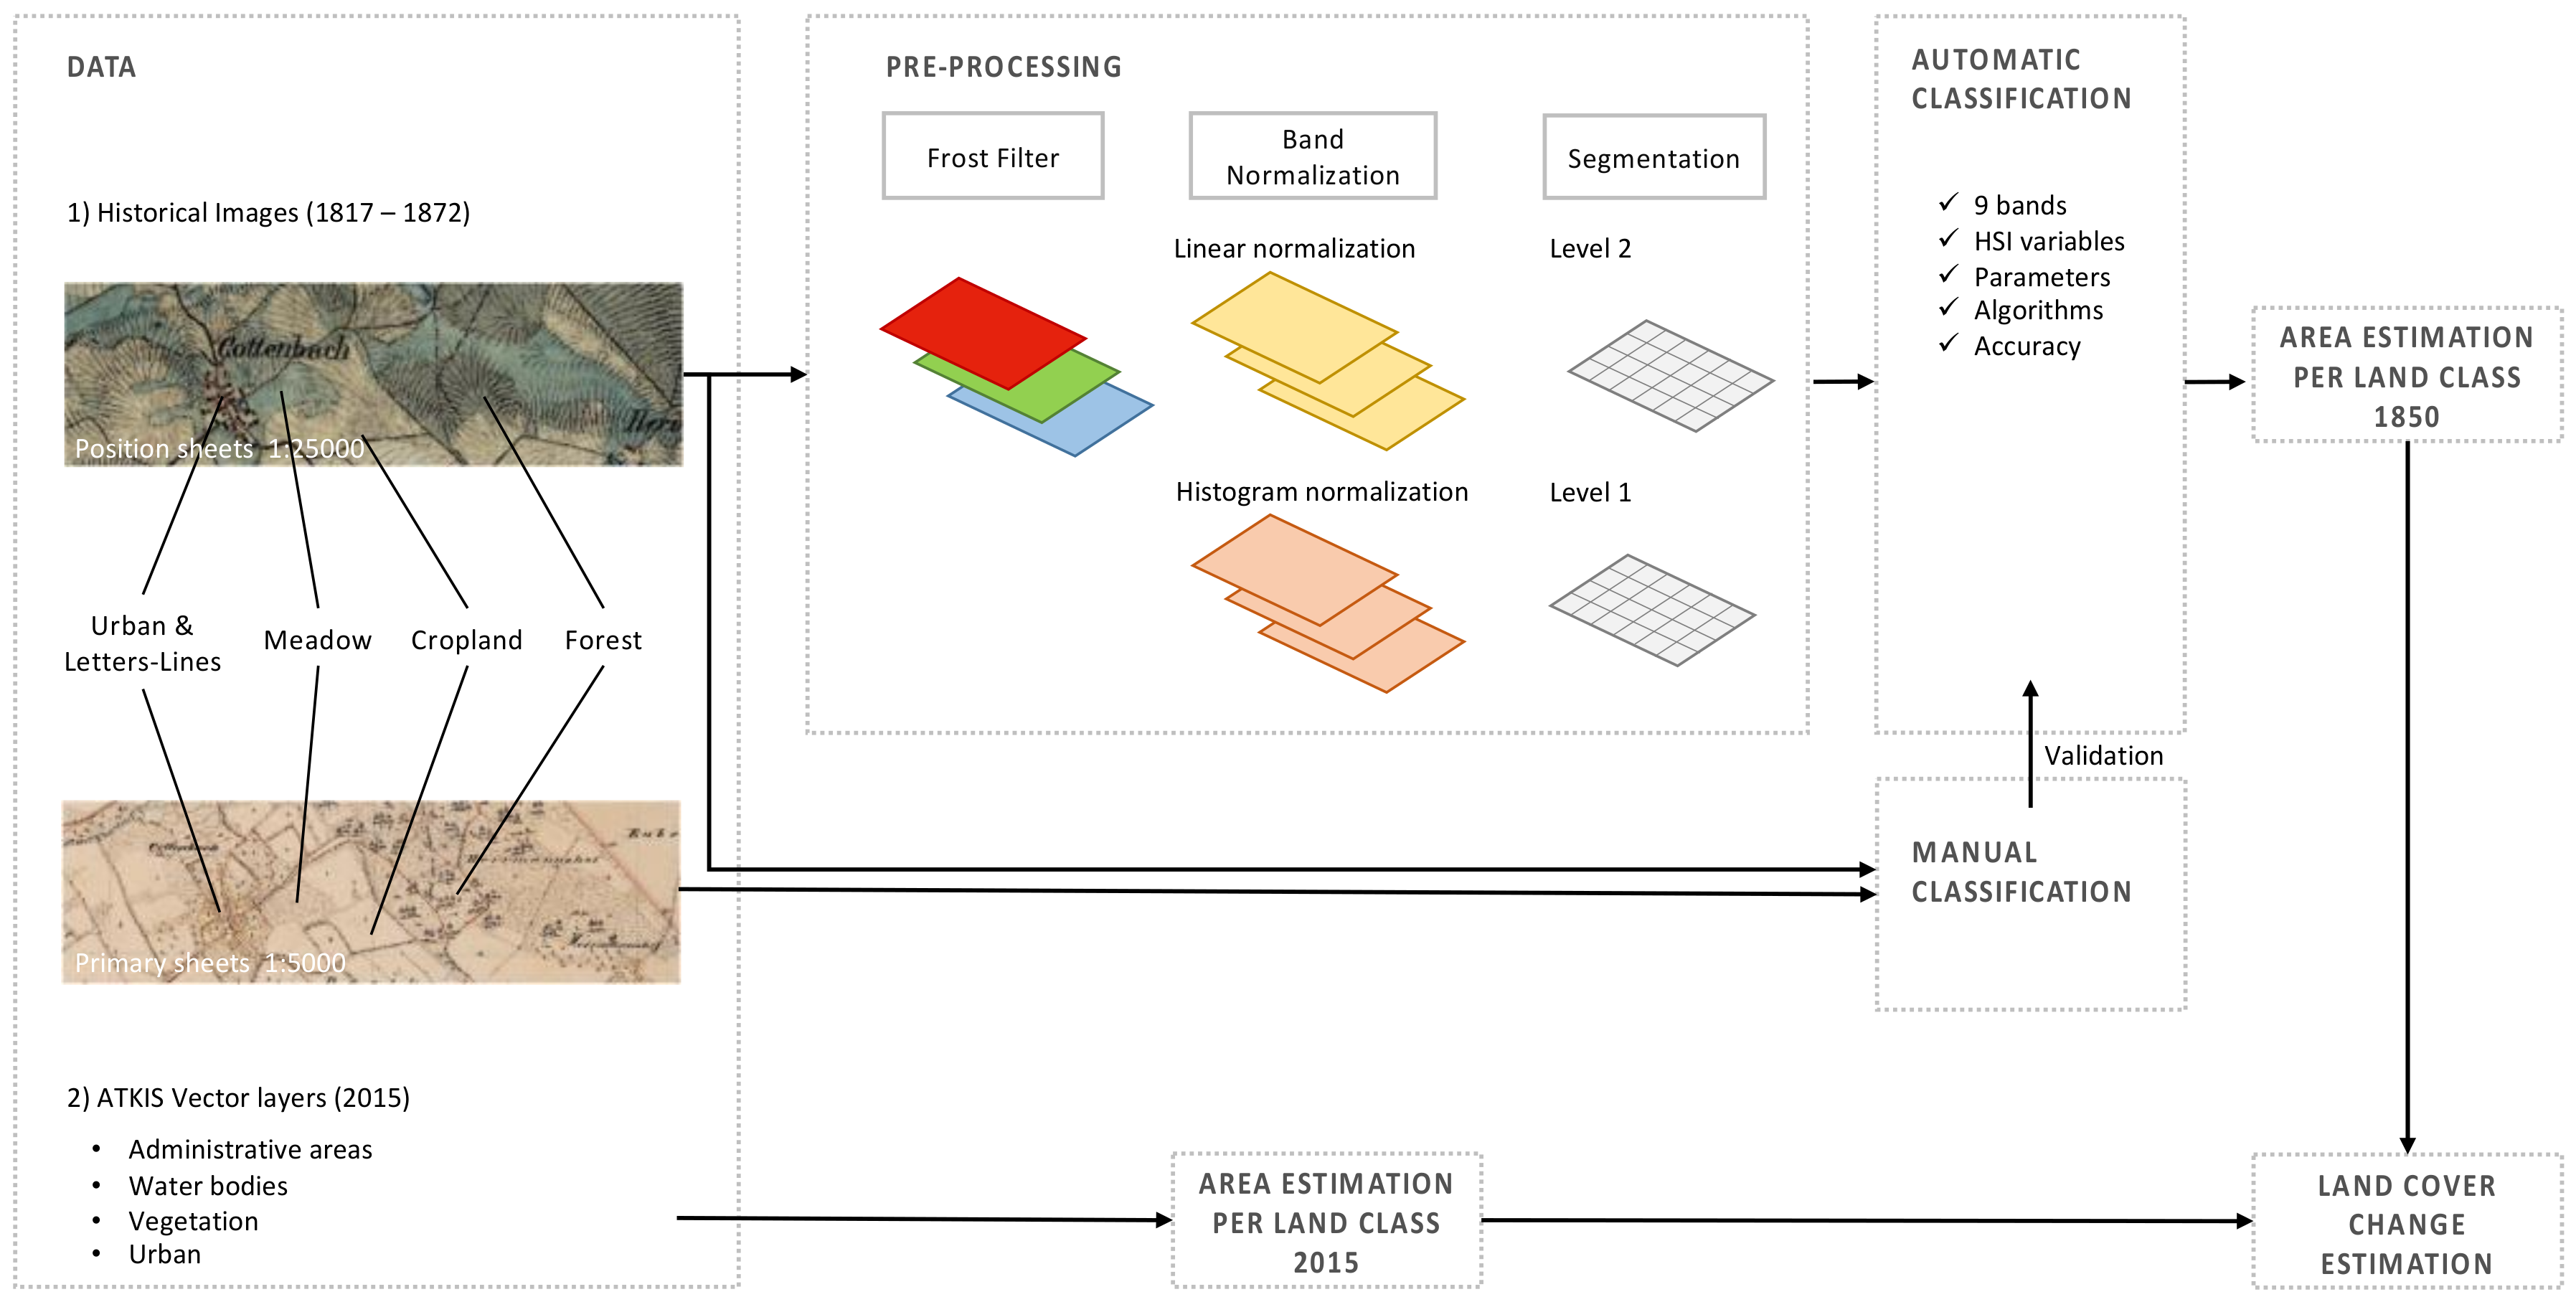
Figure 1. Flowchart of the method for land cover classification and change analysis.
Remotesensing 12 04048 g001
Figure 2. Classification results: (A) quadtree segmentation, Scale: 60, no filter; (B) quadtree segmentation, Scale 60, Frost Filter; (C) quadtree segmentation, Scale 100, no filter; (D) quadtree segmentation, Scale 100, Frost Filter; (E) multi-resolution segmentation, Shape: 0.1, Compactness: 0.9, Scale: 10; (F) multi-resolution segmentation, Shape: 0.1, Compactness: 0.9, Scale: 20; (G) multi-resolution segmentation, Shape: 0.5, Compactness: 0.8, Scale: 10; (H) multi-resolution segmentation, Shape: 0.5, Compactness: 0.8, Scale: 20; (I) image with faded colors or bleached where Meadow intersects cropland fields and the lines identify the final classification objects; (J) image with low contrast among classes where there are blue shades of rivers intersecting the forest, which are difficult to distinguish; (K) letters & lines and urban are colored purple and intersect cropland and meadow objects; (L) dark objects such as stains are misclassified as letters & lines on the basis of their layer values; (M) urban objects (little red and black squares) usually overlap letters & lines, hampering discrimination; (N) subset of image (PB078) classified: meadow, cropland and forest are visible (Overall Accuracy: 0.81, Overall Kappa: 0.71); and (O) subset of image (PB158) classified: meadow, cropland, urban and forest are visible (Overall Accuracy: 0.98, Overall Kappa: 0.96).
Remotesensing 12 04048 g002
Figure 3. (a) Original position sheets (1:25,000, 1847–1864) with the borders of the police districts from 1879; and (b) automatically classified land cover with locations of 17 quadrants for manual reclassification.
Remotesensing 12 04048 g003
Figure 4. (ad) Land cover change in the catchment of the Red and White Main.
Remotesensing 12 04048 g004
Figure 5. Overall accuracy of the automatic classification compared to the manual reclassification for 17 randomly selected quadrants. Maps were assigned with very good quality, good quality, and poor quality. Detailed results are in Table S1.
Remotesensing 12 04048 g005
Table 1. List of HSI variables calculated during the historical maps classification in eCognition. In every channel (Red, Green, and Blue), the layer used is specified. “H” layers are the histogram normalized bands, while “L” layers are the linear normalized bands.
HSI VariableRedGreenBlue
Hue1Blue-HRed-HRed
Hue2Blue-LRed-LGreen-L
Hue3Green-LGreen-HBlue-H
Hue4Red-HRedGreen
Hue5Red-LGreen-LGreen-H
Hue6GreenRedBlue
Intensity1Green-HBlue-HRed-H
Intensity2Green-LGreen-HBlue-H
Intensity3Red-HRedGreen
Intensity4Blue-LRed-LRed
Saturation1BlueBlue-LRed-L
Saturation2Blue-HRed-LRed
Table 2. List of algorithms used in eCognition during raster classification [33].
CategoryAlgorithmDescription
Basic
Classification
Assign classAssign a class to all objects of another class with a membership of 1
ClassificationClassifies object according their membership to a list of selected classes
Advanced ClassificationFind Enclosed by ClassFinds and classifies objects that are totally enclosed or surrounded by the target class
Basic Object
Reshaping
Merge RegionFusions all the objects of the indicated domain or class
Grow RegionExpands image objects incorporating neighboring objects
Convert to Sub-ObjectsSplits an object into the smaller objects in a level underneath
Advanced Object
Reshaping
Border OptimizationChanges the shapes of the objects by either adding (Dilatation) or removing (Erosion) sub-objects from the outer or inner border respectively
MorphologySmooths the border of objects using a mask created by the user. This mask either removes (Opening) or adds (Closing) pixels
Pixel-Based Object ReshapingPixel-Based Object ResizingGrows or shrinks objects based on a relative area defined by the user. Operates at the pixel level
Interactive OperationManual ClassificationAllows object classification with a click
ExportExport Vector LayersExports the selected classes and specifies format
and attributes
Table 3. (a). Historical land cover based on automatic classification broken down by police districts (see Figure 3a). (b). The 19th century cadastral statistics on land cover for the year 1853 [32].
CroplandForestsMeadowsUrbanStreetsWater BodiesRocks and Barren LandNO DATASum
[%][%][%][%][%][%][%][%][%]
(a) Automatic classification
Bayreuth (City)53.79.634.42.4NANANA0.0100.0
Bayreuth42.130.723.90.3NANANA3.0100.0
Berneck32.247.420.00.3NANANA0.0100.0
Culmbach42.234.323.20.3NANANA0.0100.0
Münchberg30.524.425.80.3NANANA19.0100.0
Pegnitz36.640.522.50.3NANANA0.0100.0
Stadtsteinach45.836.617.40.2NANANA0.0100.0
Thurnau46.138.613.80.4NANANA1.1100.0
Weidenberg27.552.120.10.3NANANA0.0100.0
Total area39.634.922.30.5NANANA2.6100.0
(b) Statistics 1853
Bayreuth (City)47.510.733.72.83.61.70.0NA100.0
Bayreuth44.227.224.80.52.10.50.6NA100.0
Berneck32.643.221.00.41.60.60.6NA100.0
Culmbach50.423.620.40.62.20.72.1NA100.0
Münchberg37.420.626.01.75.02.96.5NA100.0
Pegnitz36.242.215.80.31.90.53.0NA100.0
Stadtsteinach45.634.014.60.51.80.43.1NA100.0
Thurnau55.028.113.50.41.80.40.8NA100.0
Weidenberg33.640.322.00.41.80.51.4NA100.0
Total area42.231.819.80.72.30.82.3NA100.0
Table 4. Overall land cover change in the Main catchment.
Land Cover Type1850 [km2]2015 [km2]∆ [km2]1850 [%]2015 [%]Difference [%]Relative Change [%]
Cropland565431−13438.429.3−9.1−23.7
Forest5886102239.941.41.53.7
Meadow309296−1321.020.1−0.9−4.1
Urban51291250.38.88.52626.8
Table 5. Spatially explicit historical origin of today’s land cover assessed in percent.
Land Cover [%] 20151850CroplandForestMeadowUrbanSum
Cropland75.99.414.60100
Forest10.679.59.90100
Meadow38.715.845.40.1100
Urban45.21239.63.1100
Table 6. Accuracy assessment of four land classes on 26 tiles based on eCognition.
CroplandForestMeadowUrban
Producer accuracy0.94 ± 0.170.98 ± 0.030.98 ± 0.030.82 ± 0.16
User accuracy0.99 ± 0.010.97 ± 0.050.98 ± 0.020.95 ± 0.07
Hellden0.95 ± 0.170.98 ± 0.040.98 ± 0.020.87 ± 0.12
Short0.94 ± 0.180.95 ± 0.060.96 ± 0.040.79 ± 0.16
Kappa per class0.94 ± 0.190.97 ± 0.040.97 ± 0.040.82 ± 0.17
Overall Accuracy0.98 ± 0.04
Kappa0.97 ± 0.06
Table 7. Accuracy assessment of manually reclassified area based on 2.7 million grid cells.
Ground Truth (Manual Classification) User Accuracy
Class ValueCroplandForestMeadowUrbanWaterTotal
Classified (eCognition)Cropland839,44533,233149,6834000961,026,4570.82
Forest98,932823,25577,44112141811,001,0230.82
Meadow33,60955,751554,51514,45012,700671,0250.83
Urban183111119348723863970.76
Water0000000.00
Total972,169912,350782,83224,53613,0152,704,902
Producer accuracy0.860.900.710.200.00 0.82
Kappa 0.73
Publisher’s Note: MDPI stays neutral with regard to jurisdictional claims in published maps and institutional affiliations.