Article

Applying the Tropical Peatland Combustion Algorithm to Landsat-8 Operational Land Imager (OLI) and Sentinel-2 Multi Spectral Instrument (MSI) Imagery

1
Science, Technology, Engineering and Mathematics (STEM), Scarce Resources and Circular Economy (ScaRCE), University of South Australia, Adelaide/Mawson Lakes, SA 5000, Australia
2
Remote Sensing Application Center of Indonesian Institute of Aeronautics and Space (LAPAN), Jakarta 13710, Indonesia
3
Remote Sensing Technology and Data Center of Indonesian Institute of Aeronautics and Space (LAPAN), Jakarta 13710, Indonesia
*
Author to whom correspondence should be addressed.
Remote Sens. 2020, 12(23), 3958; https://doi.org/10.3390/rs12233958
Submission received: 14 September 2020 / Revised: 19 November 2020 / Accepted: 27 November 2020 / Published: 3 December 2020

Abstract

:
This study establishes a new technique for peatland fire detection in tropical environments using Landsat-8 and Sentinel-2. The Tropical Peatland Combustion Algorithm (ToPeCAl) without longwave thermal infrared (TIR) (henceforth known as ToPeCAl-2) was tested on Landsat-8 Operational Land Imager (OLI) data and then applied to Sentinel-2 Multi Spectral Instrument (MSI) data. The research is aimed at establishing peatland fire information at higher spatial resolution and more frequent observation than from Landsat-8 data over Indonesia’s peatlands. ToPeCAl-2 applied to Sentinel-2 was assessed by comparing fires detected from the original ToPeCAl applied to Landsat-8 OLI/Thermal Infrared Sensor (TIRS) verified through comparison with ground truth data. An adjustment of ToPeCAl-2 was applied to minimise false positive errors by implementing pre-process masking for water and permanent bright objects and filtering ToPeCAl-2’s resultant detected fires by implementing contextual testing and cloud masking. Both ToPeCAl-2 with contextual test and ToPeCAl with cloud mask applied to Sentinel-2 provided high detection of unambiguous fire pixels (>95%) at 20 m spatial resolution. Smouldering pixels were less likely to be detected by ToPeCAl-2. The detected smouldering pixels from ToPeCAl-2 applied to Sentinel-2 with contextual testing and with cloud masking were only 35% and 56% correct, respectively; this needs further investigation and validation. These results demonstrate that even in the absence of TIR data, an adjusted ToPeCAl algorithm (ToPeCAl-2) can be applied to detect peatland fires at 20 m resolution with high accuracy especially for flaming. Overall, the implementation of ToPeCAl applied to cost-free and available Landsat-8 and Sentinel-2 data enables regular peatland fire monitoring in tropical environments at higher spatial resolution than other satellite-derived fire products.

Graphical Abstract

1. Introduction

Tropical peatland is a significant source of global carbon [1,2]. The state of tropical peatland is mainly disturbed by conversion of peatland forest to other uses, especially for plantations. Peatland drainage [3] and peatland fires [4] have contributed to accelerating atmospheric carbon increases and consequential climate change [5,6]. Smouldering peatland fires burn organic soil and thick fuels (e.g., decaying leaves, tree branches and trunks), which release more carbon and smoke with greater particulate concentration than flaming fires [7,8]. Drought, unmanaged drainage, and land use change from natural peatland habitat to agricultural/plantation areas have led to high flammability conditions of degraded peatlands [9,10,11,12,13,14,15,16]. Peatland fires together with agriculture, forestry, and other land use are the main contributing sources (about 51%) to greenhouse gases emissions in Indonesia [17]. Figure 1 shows the estimated annual emission of peatland fires during 1997–2019 in the Equatorial Asian region including Indonesia and neighbouring countries [18]. The peak emissions from peatland fires, which occurred in 1997, 2002, 2006, 2009, 2015, and 2019, corresponded to the warm episodes of El Niño Southern Oscillation (ENSO) and the positive modes of Indian Ocean Dipole, as shown in the Oceanic Niño Index (ONI) and Dipole Mode Index (DMI) recorded by Climate Prediction Center and Physical Sciences Laboratory of National Oceanic and Atmospheric Administration, respectively [19,20]. In general, positive modes of these climate indices were associated with extreme droughts and contributed to Indonesian fires [21,22]. Beside the influences of extreme drought, mainly, peatland fires in Indonesia have anthropogenic origins [23,24,25]. Therefore, it is important to develop a comprehensive monitoring of peatland fires for control and minimisation of carbon emission.
Remote sensing satellites have been widely used for biomass burning detection. Research on remote sensing satellite applications, particularly for peatland fire detection and its assessment in Indonesia has been conducted from medium spatial resolution to low spatial resolution satellite sensors and from Unpiloted Aerial Vehicle (UAV) as shown in Table 1.
Cost-free satellite data with moderately frequent observations have potential to be used in regular peatland fires information collection. The cost-free and available medium spatial resolution (20–30 m) e.g., Sentinel-2 Multi Spectral Instrument (MSI) and Landsat-8 Operational Land Imager (OLI)/ Thermal Infrared Sensor (TIRS) regularly observe the Earth in the morning at about 10 am every five and 16 days, respectively. At lower spatial resolution (375 m) VIIRS is also available free of cost and provides the highest spatial resolution global active fire product for daytime and night-time among low spatial resolution cost-free active fire products. However, because fire products are not available for Sentinel-2, there exists an opportunity for the development of a detection algorithm for this sensor. A fire detection algorithm, particularly for peatland fires in tropical environments, e.g., Indonesia, called Tropical Peatland Combustion Algorithm (ToPeCAl), has been established using aerosol, shortwave infrared (SWIR) and longwave thermal infrared (TIR) spectra and applied to Landsat-8 OLI/TIRS daytime [27].
The possibility of merging fire information from medium spatial resolution data with low spatial and high temporal resolution data, Visible Infrared Imaging Radiometer Suite (VIIRS) 375 m, was undertaken via a comparison with ToPeCAl fire information from Landsat-8 OLI/TIRS and resulted in accuracies up to 90% for fires in Indonesia’s peatland [31]. Meanwhile, many of the combined fire products from middle spatial resolution sensor satellites are specifically designed for burnt area mapping [33,34,35,36]. A global active fire algorithm from middle spatial resolution data has been developed by [37,38,39,40] but is still limited for specific tropical peatland fires environments [26,27]. Moreover, research on spectral comparison between middle spatial resolution data, e.g., Landsat-8 and Sentinel-2, in many regions, e.g., conterminous United States, Australia, Southern Africa, Europe, and China showed good relationships [41,42,43,44,45]. However, this relationship needs to be explored over equatorial tropical environments.
Higher spatial and temporal information of peatland fires is potentially possible by applying ToPeCAl to Sentinel-2 MSI data. However, Sentinel-2 MSI only has SWIR for fire detection, while ToPeCAl originally used SWIR and TIR in Landsat-8 OLI/TIRS. An approach of using SWIR from medium spatial resolution data for fire detection has been explored by [37,38,39,40]. It may be possible to apply ToPeCAl without TIR to Sentinel-2 MSI for peatland fires detection in tropical environments.
Thus this study aimed to explore the potential of detecting tropical peatland fires particularly through the use of ToPeCAl at medium spatial resolution without the use of longwave thermal infrared imagery in order to provide peatland fire information at higher spatial resolution (20 m) and at a higher temporal frequency (five days) than Landsat 8; this would complement information from the medium spatial resolution of peatland fires from Landsat-8 (30 m) which is only available every 16 days. A combination of Sentinel-2 and Landsat-8 fire products, together with a lower spatial but higher temporal resolution active fire product, e.g., VIIRS 375 m at daily observation, could potentially ensure high spatial and medium to higher temporal information on peatland fires.
The objectives of this study are: (1) implementation and comparison of Tropical Peatland Combustion Algorithm without TIR (ToPeCAl-2) applied to Landsat-8 OLI, and (2) implementation and comparison of ToPeCAl-2 applied to Sentinel-2 MSI.

2. Data

2.1. Landsat-8 and Sentinel-2A/B

The National Aeronautics and Space Administration (NASA) and the Department of Interior United States Geological Survey (USGS) developed and launched the Landsat 8 satellite on 11 February 2013 with two science instruments, OLI and TIRS. Nine spectral bands, which span from the visible (VIS), the near infrared (NIR), the SWIR and the cirrus band at 30 m spatial resolution and 15 m for the panchromatic band, are collected in OLI. TIRS collects two bands of TIR spectra at 100 m spatial resolution. Landsat-8 with its near-polar and Sun-synchronous orbit provides a repeat earth observation every 16-days at an equatorial crossing time of 10.00 ± 15 min in a 185 km swath [46,47]. In this study, Landsat-8 data were accessed from https://earthexplorer.usgs.gov/.
Sentinel-2 satellites were developed by the European Commission and the European Space Agency (ESA). Sentinel-2A and 2B were launched on 23 June 2015 and 7 March 2017, respectively. The on-board MSI has 13 spectral bands ranging from the VIS, the NIR, and the SWIR at different spatial resolutions (10, 20 and 60 m). The orbit of Sentinel-2 satellites is Sun-synchronous with observation times close to Landsat local overpass time at 10.30 (descending orbit). The swath width of Sentinel-2 MSI is 290 km with a frequent revisit of five days at the equator from Sentinel-2A and Sentinel-2B. The Sentinel-2 MSI product is provided in tiles which cover 10,000 km2. In a single day of acquisition, the Sentinel-2 MSI product may consist of one or more tiles in a certain area [48]. Sentinel-2 data were accessed from https://scihub.copernicus.eu/dhus/#/home.
The bands used for applying ToPeCAl to Landsat-8 OLI/TIR and Sentinel-2 MSI and background mapping, e.g., water, cloud, and bright object are listed in Table 2.

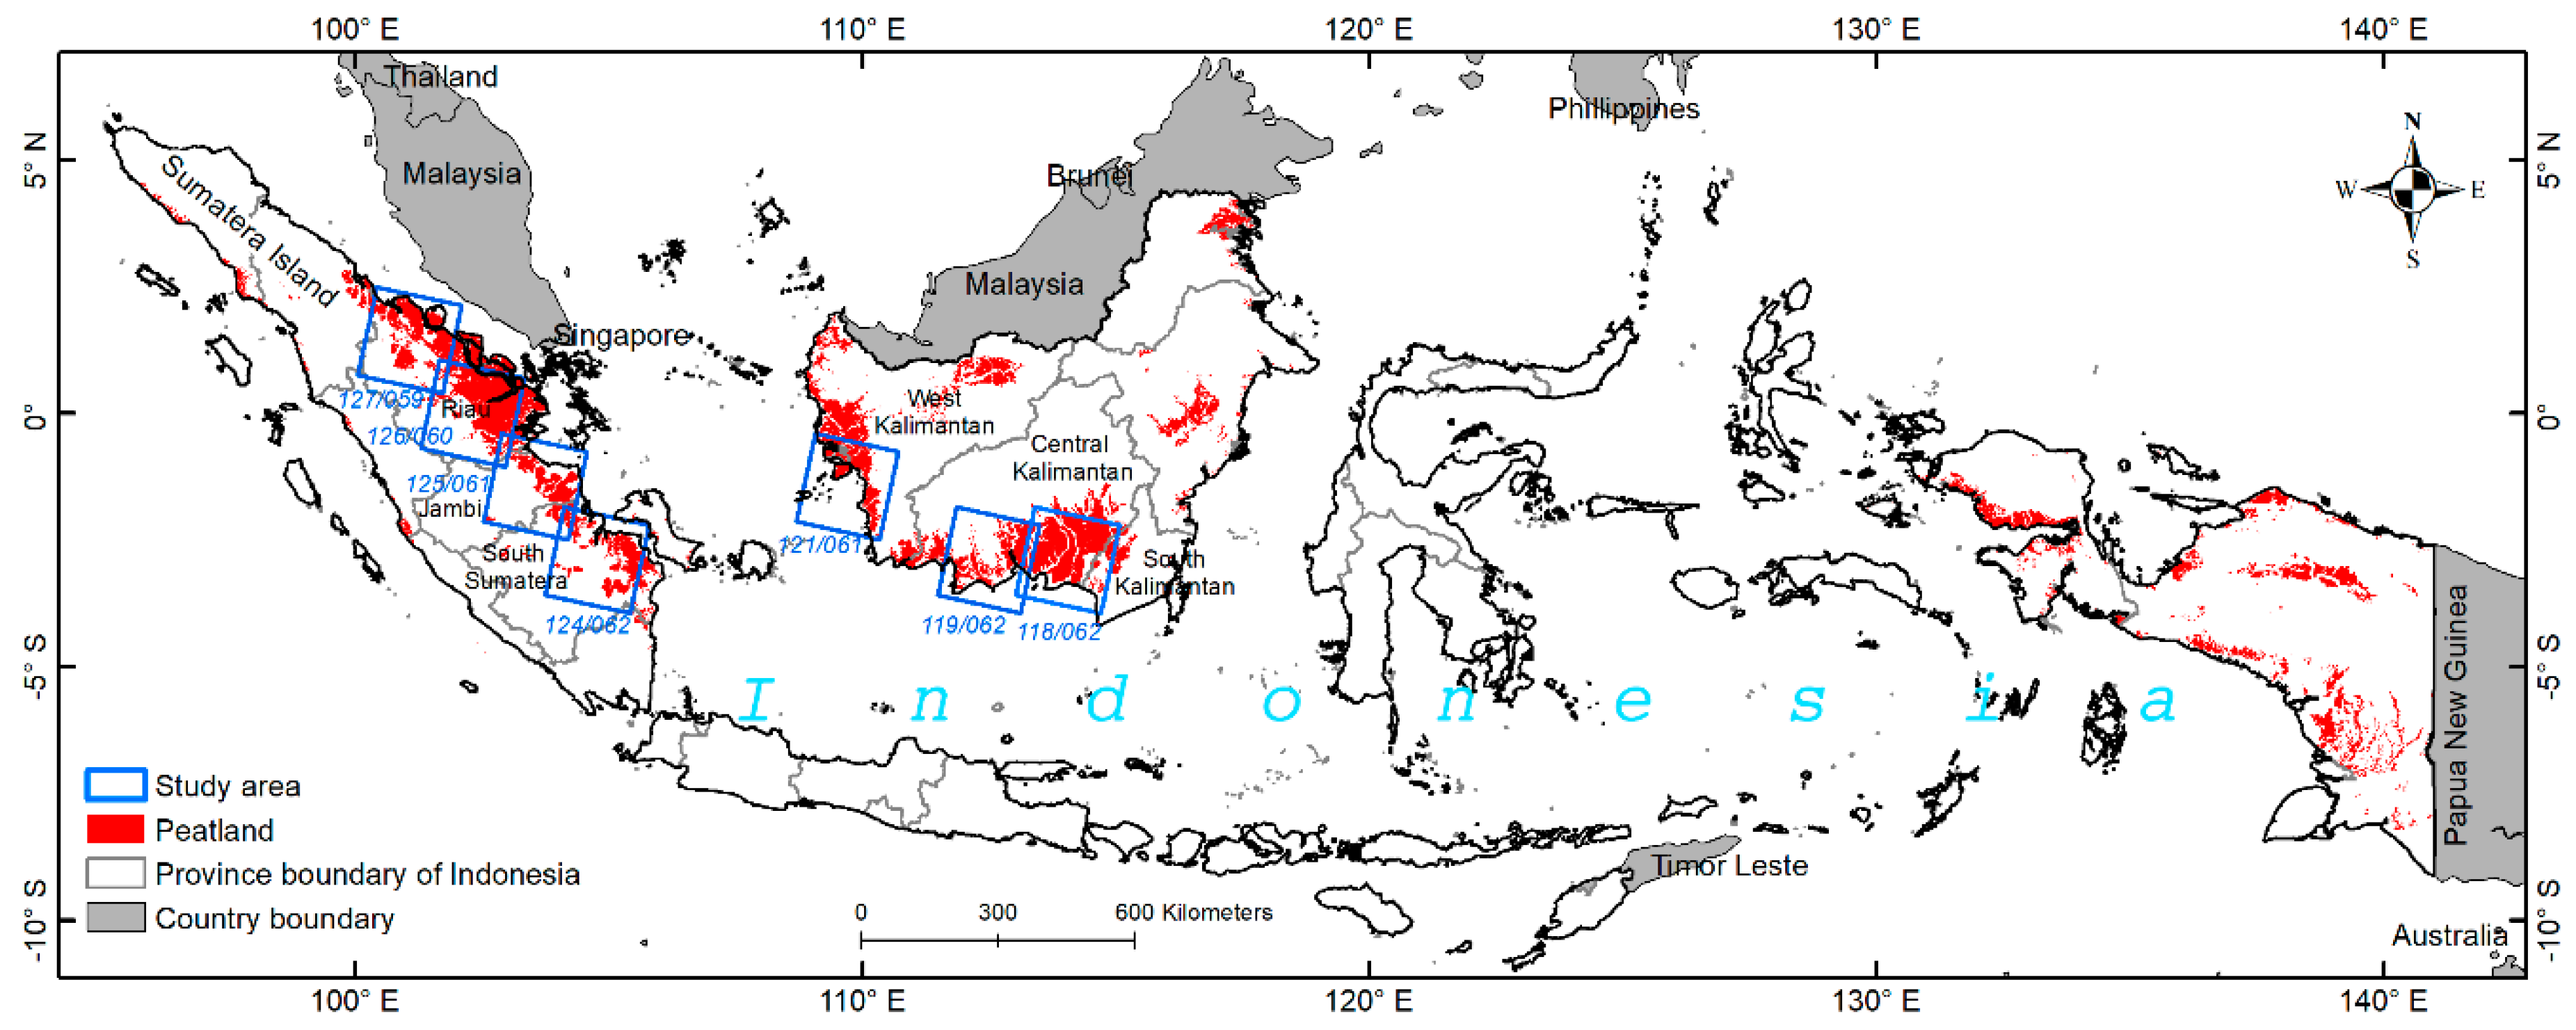
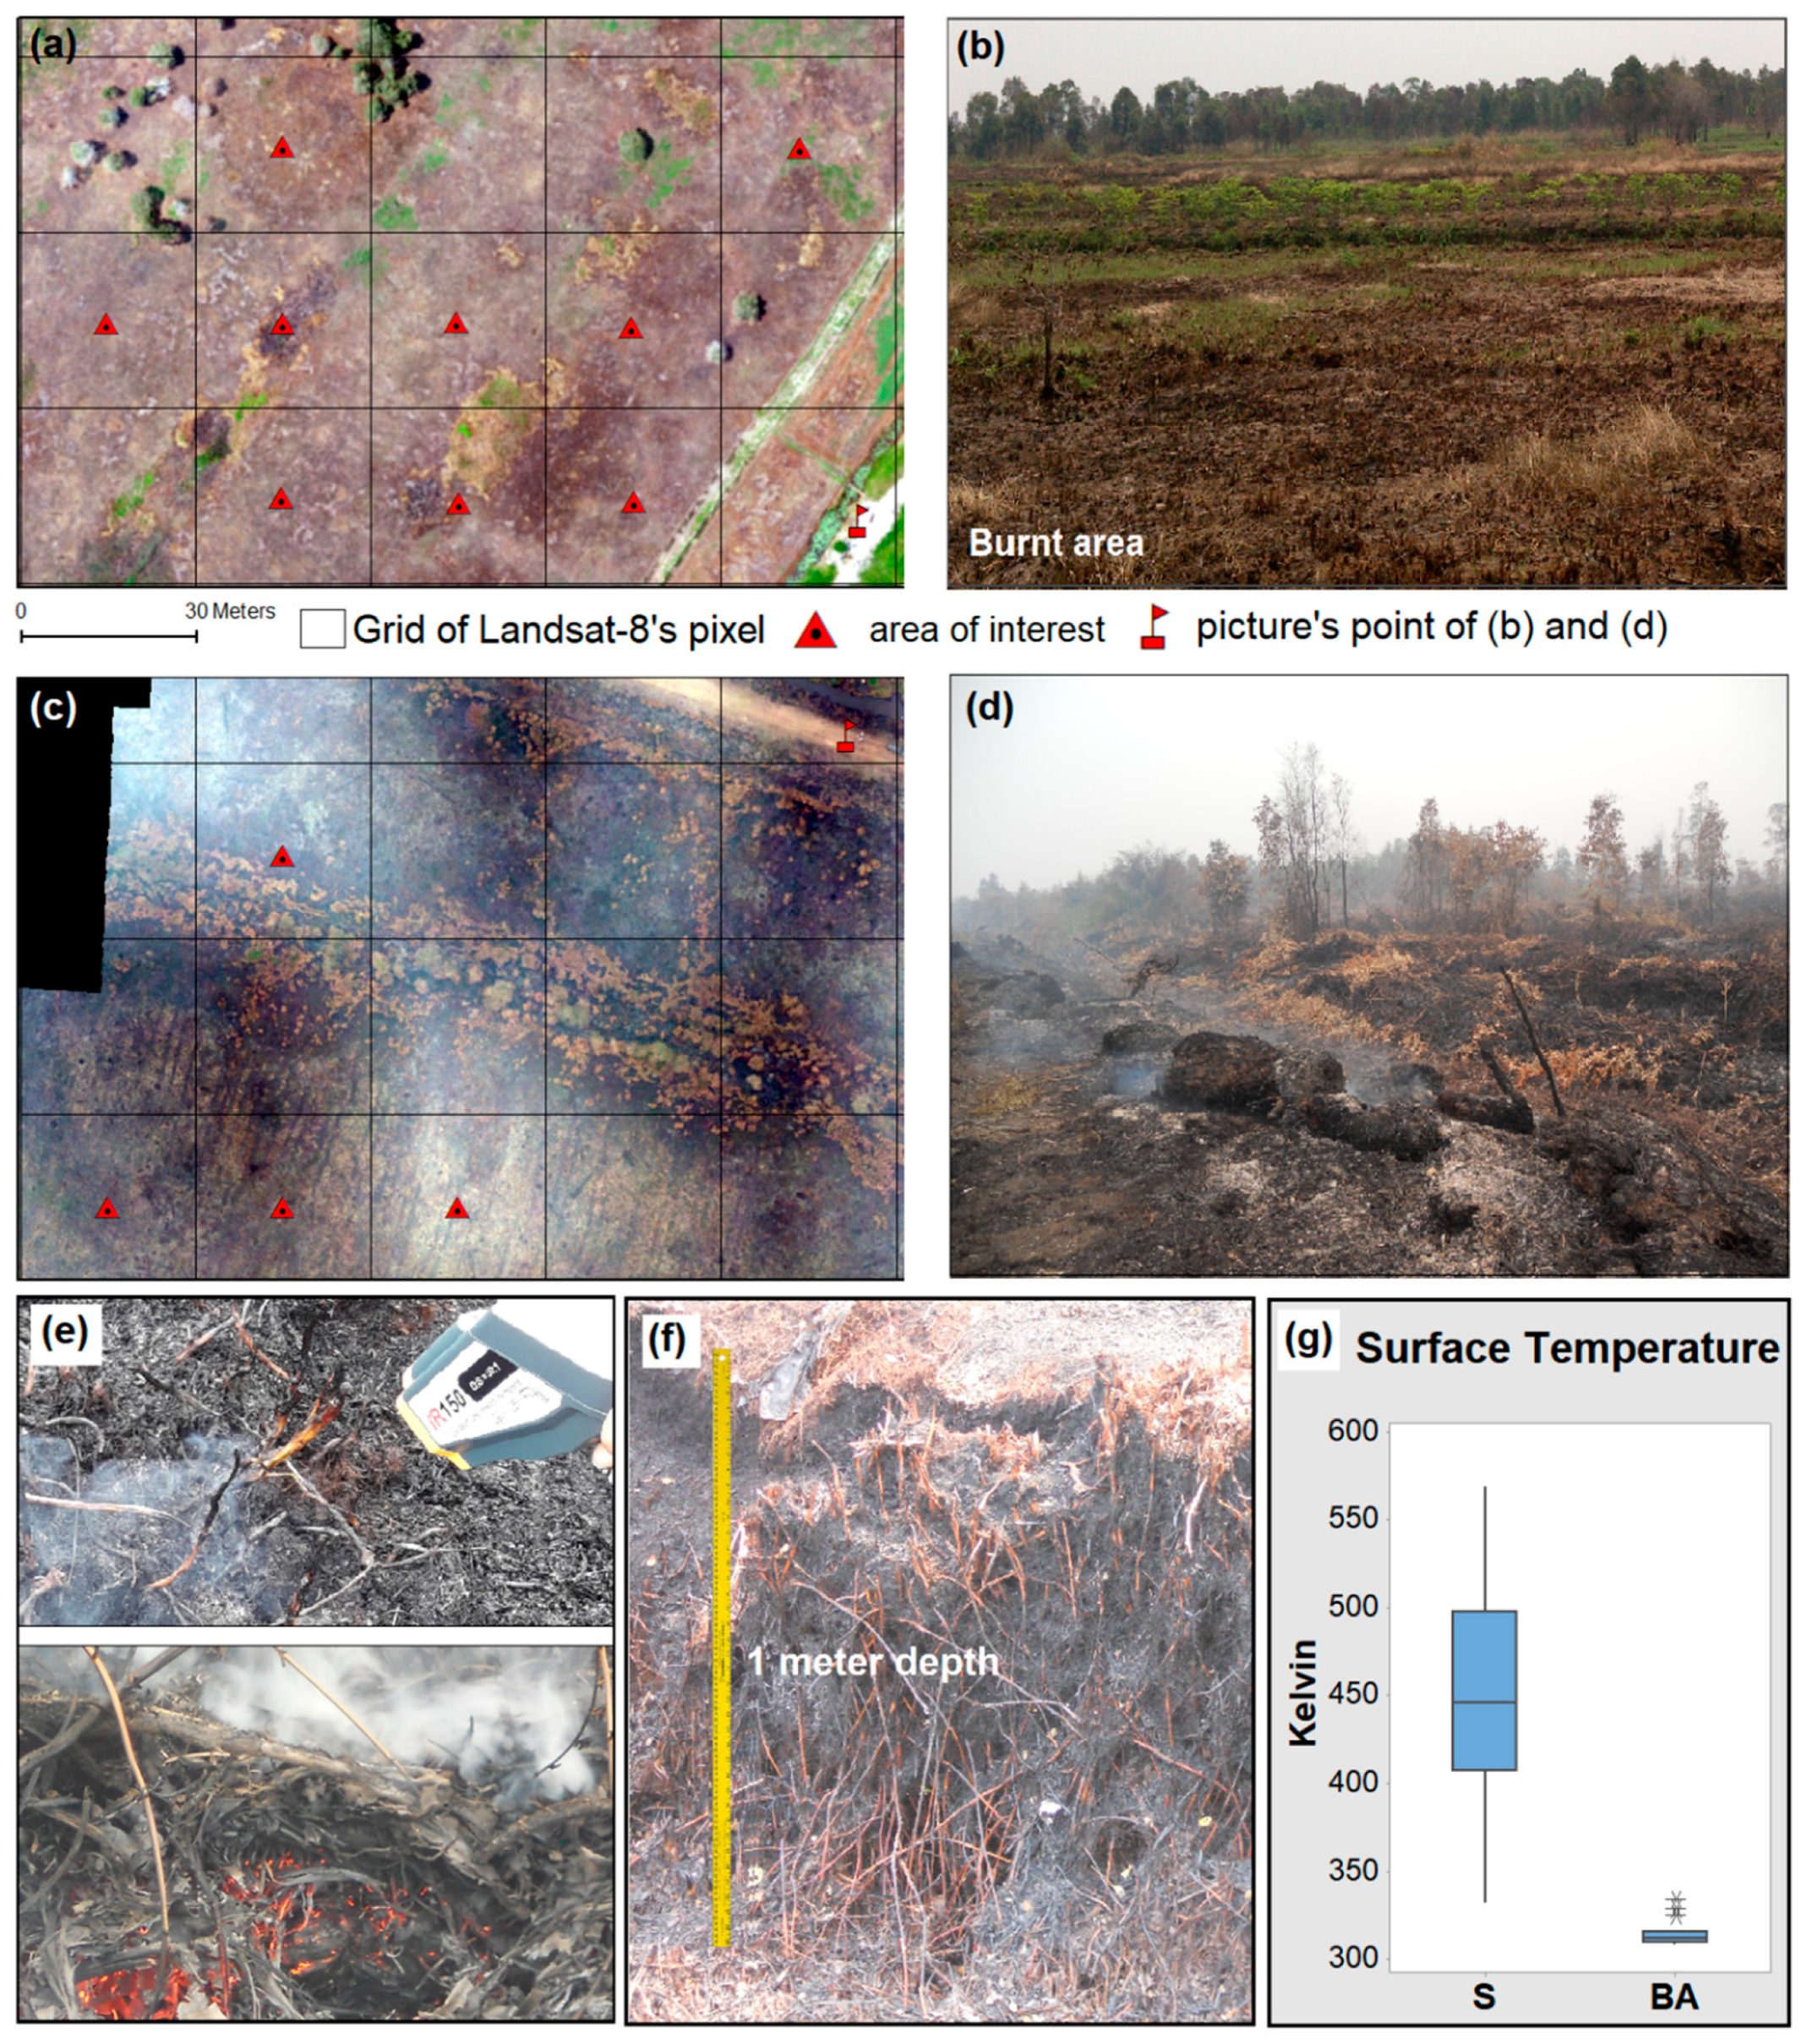
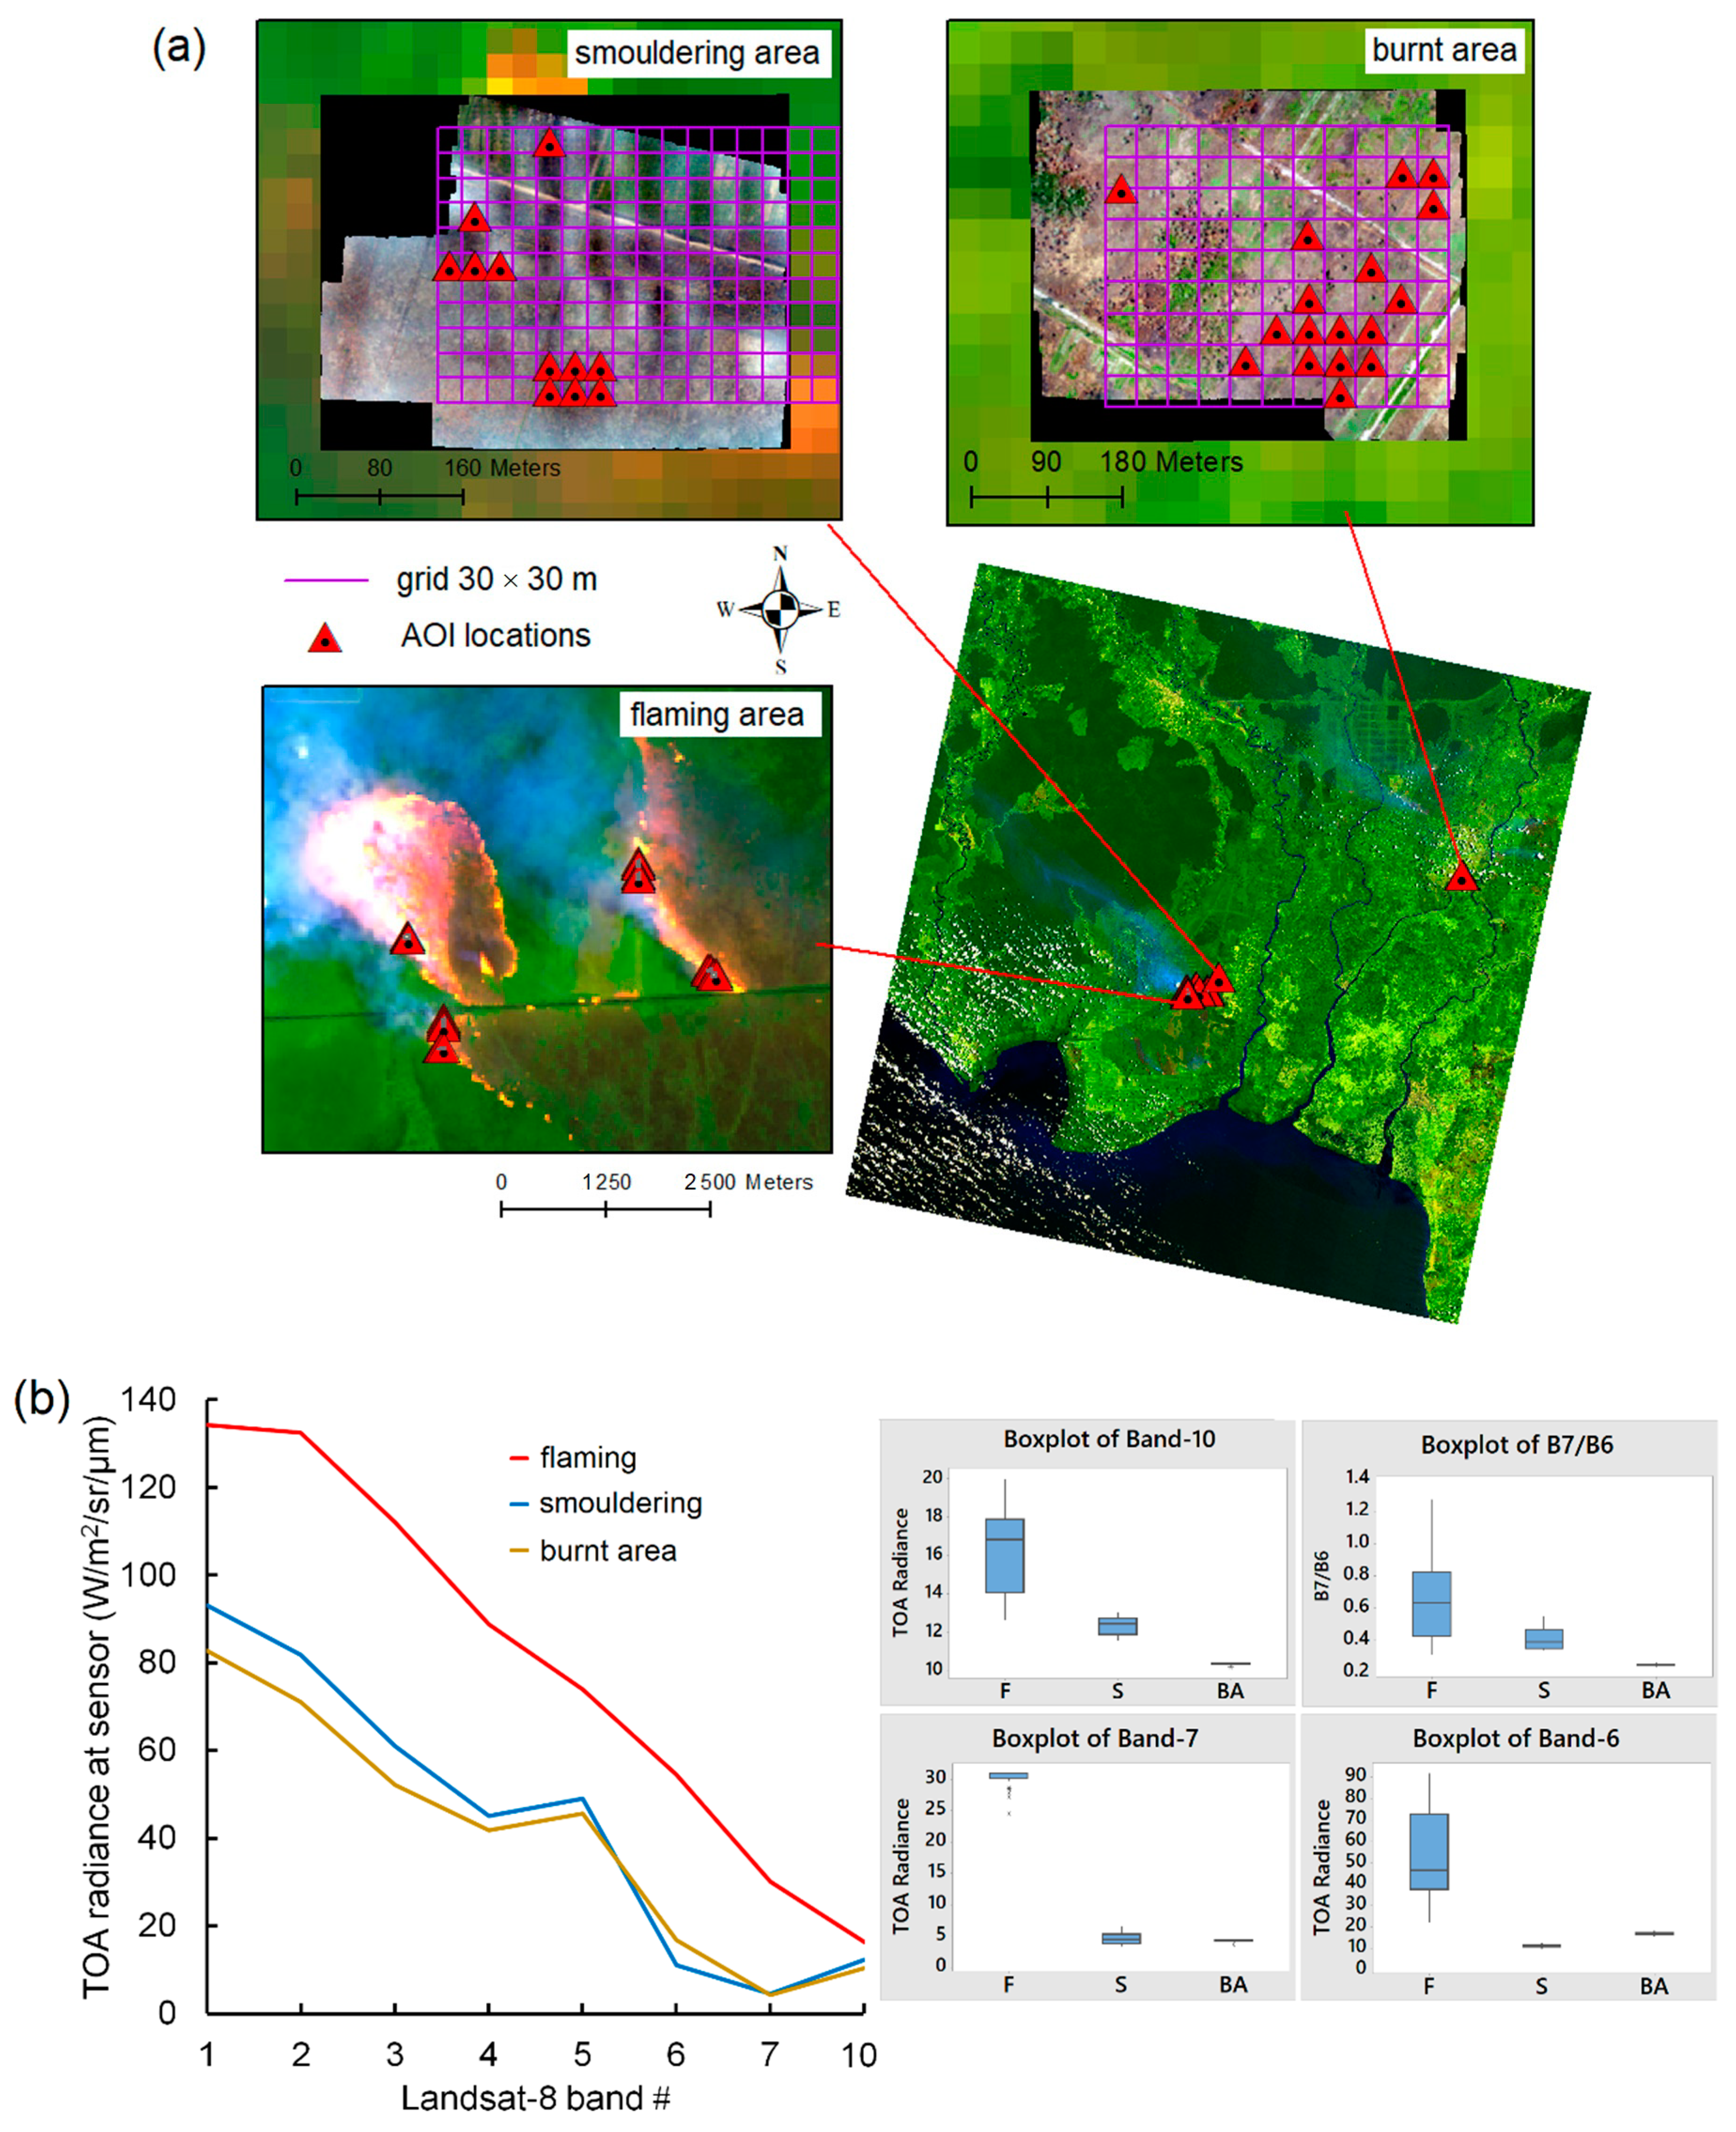
2.2. Study Area and Data Acquisition Period

Kalimantan and Sumatera are the dominant peatland fires prone areas in Indonesia and the focus areas for this research. The study areas were observed in seven scene coverage areas of Landsat-8 which span from South Kalimantan, Central Kalimantan, West Kalimantan, Riau, Jambi, and South Sumatera Provinces of Indonesia (Figure 2). Fifteen Landsat-8 images with fire features were selected from July 2015 to October 2019 over the study areas (Table 3). These data were used to explore the first objective which was executed in step 1 of data processing: applying and assessing ToPeCAl-2 to Landsat-8 OLI.
Nine pairs of Landsat-8 and Sentinel-2 acquired on the same day were used in this study (Table 4) to explore the second objective. The pairs of Landsat-8 and Sentinel-2 were used to undertake a spectral reflectance comparison prior to applying and assessing the application of ToPeCAl-2 to Sentinel-2 MSI; this constituted step 2 in the analysis. Data pairs with fire features analysed from the RGB image composites of SWIR-2, SWIR-1, and Red bands were selected for the implementation of ToPeCAl-2 applied to Sentinel-2 MSI.

3. Methods

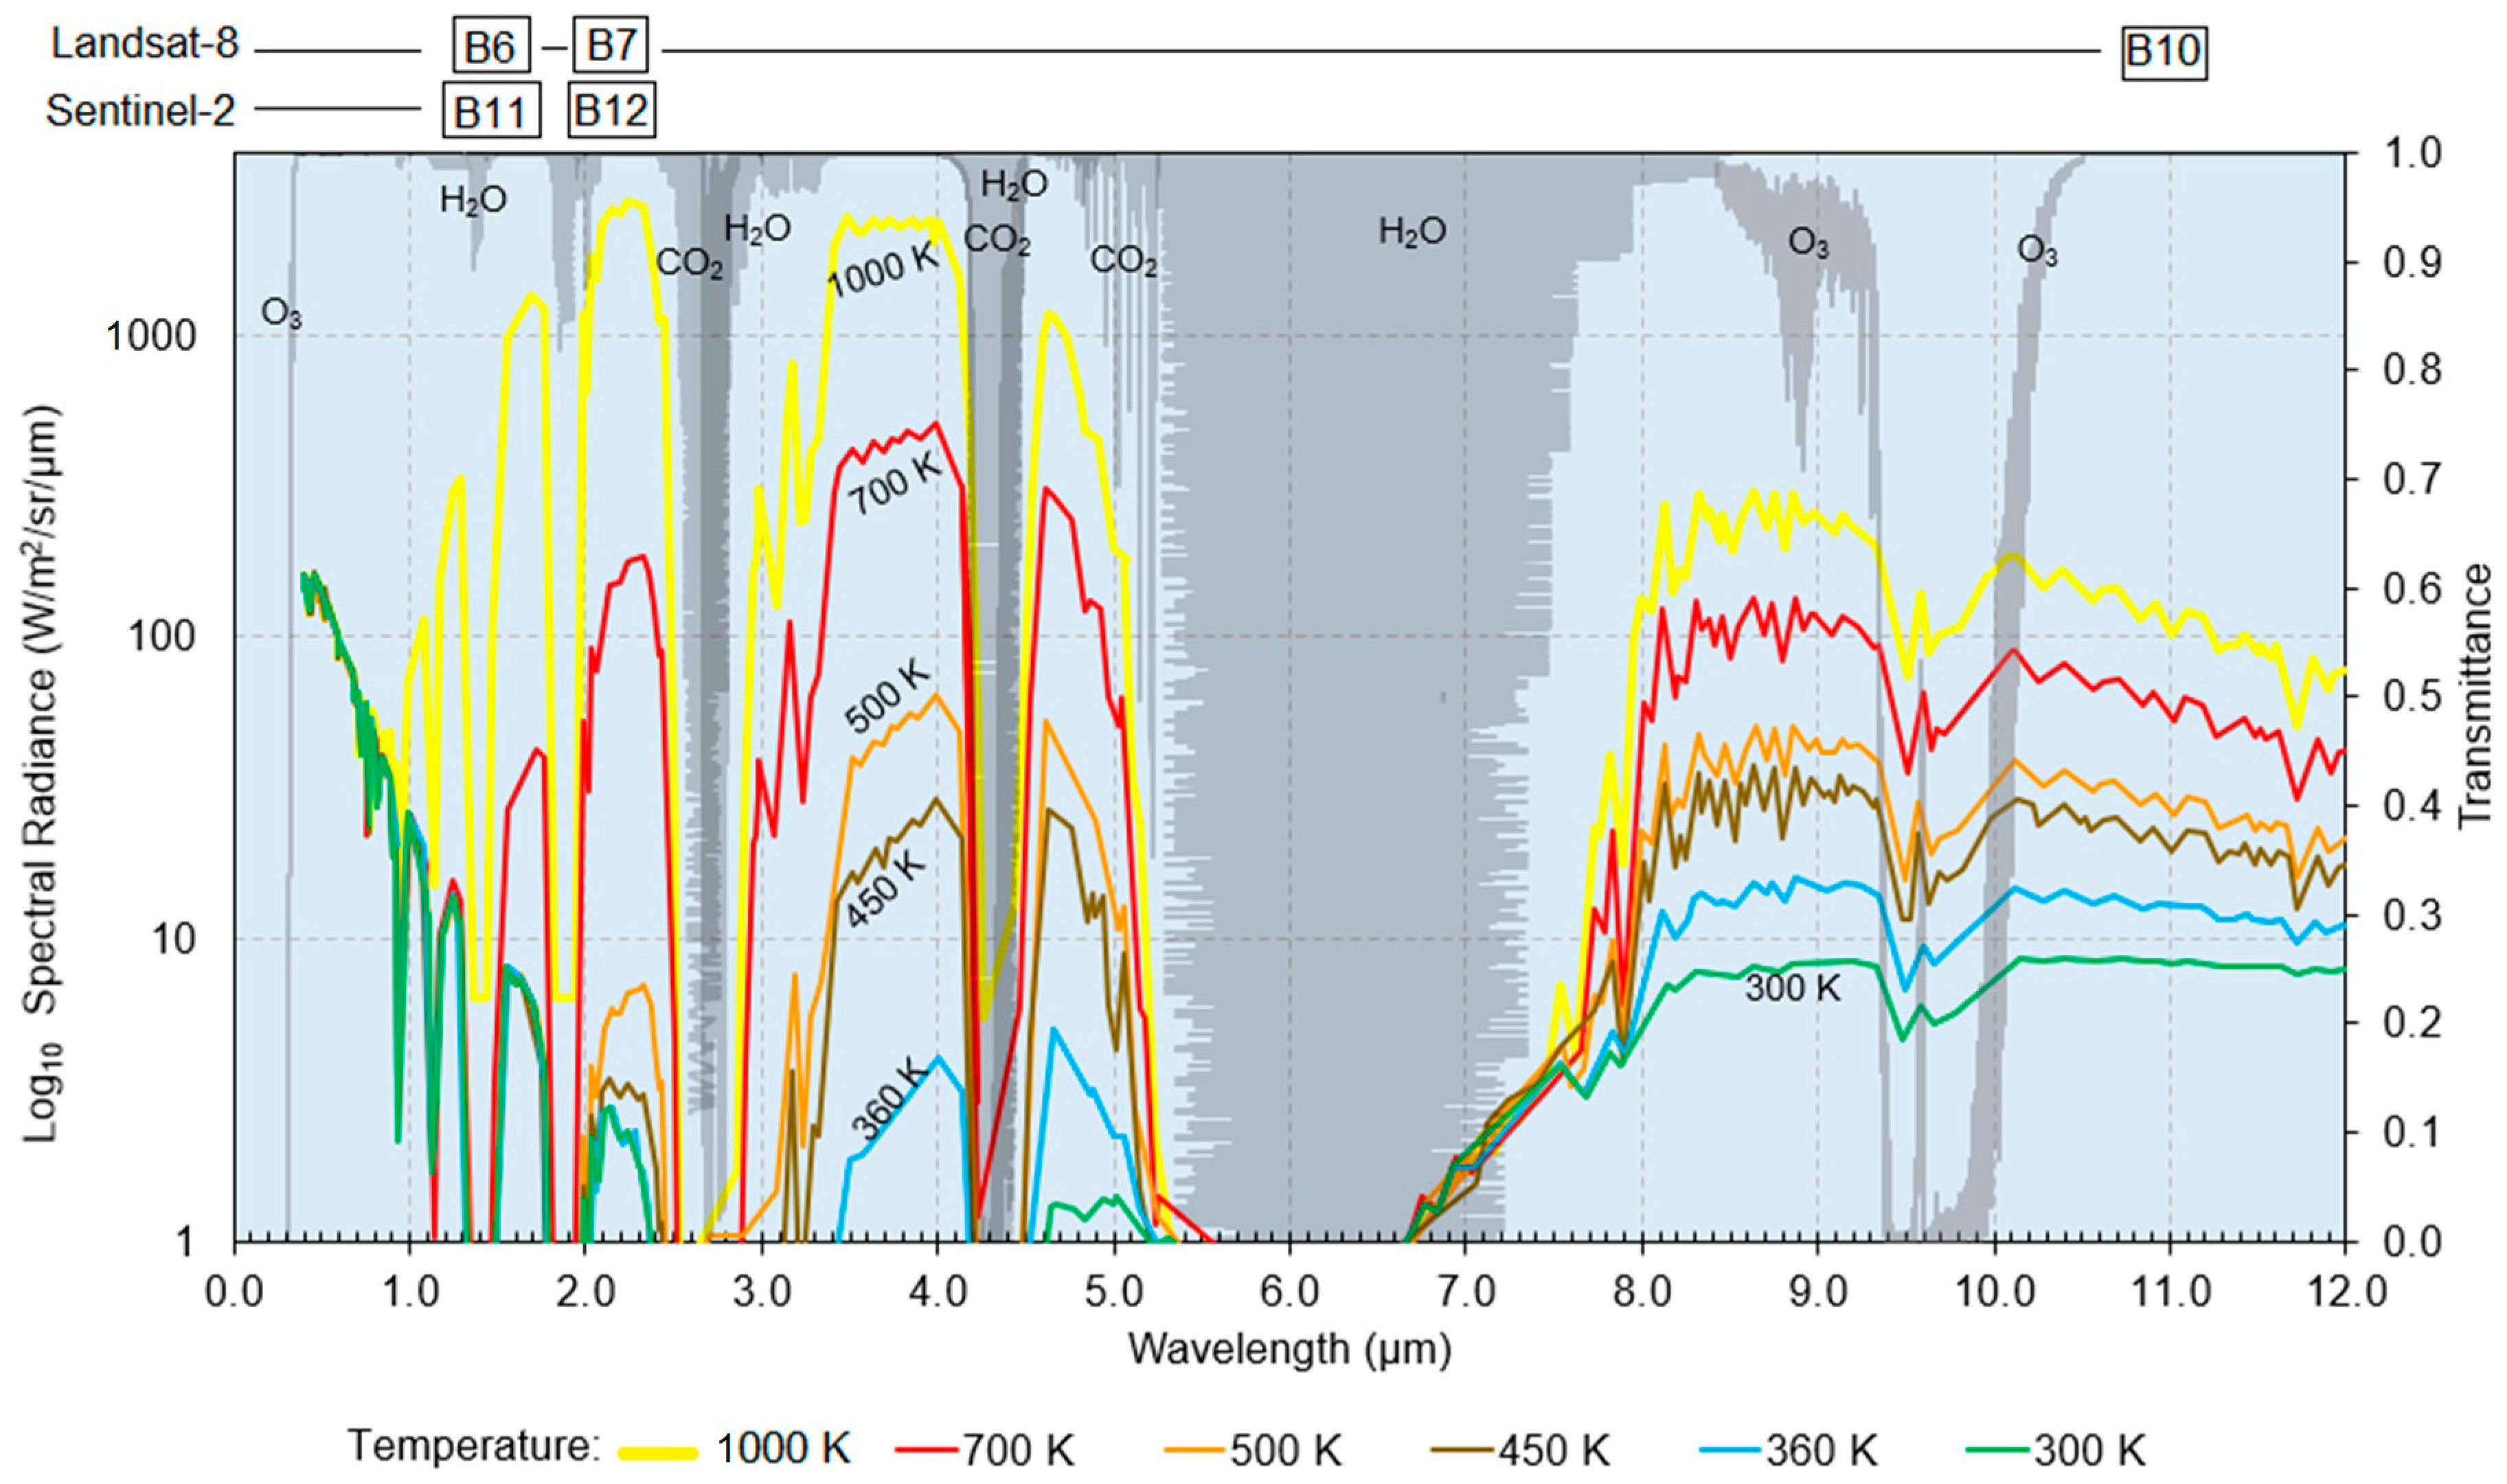
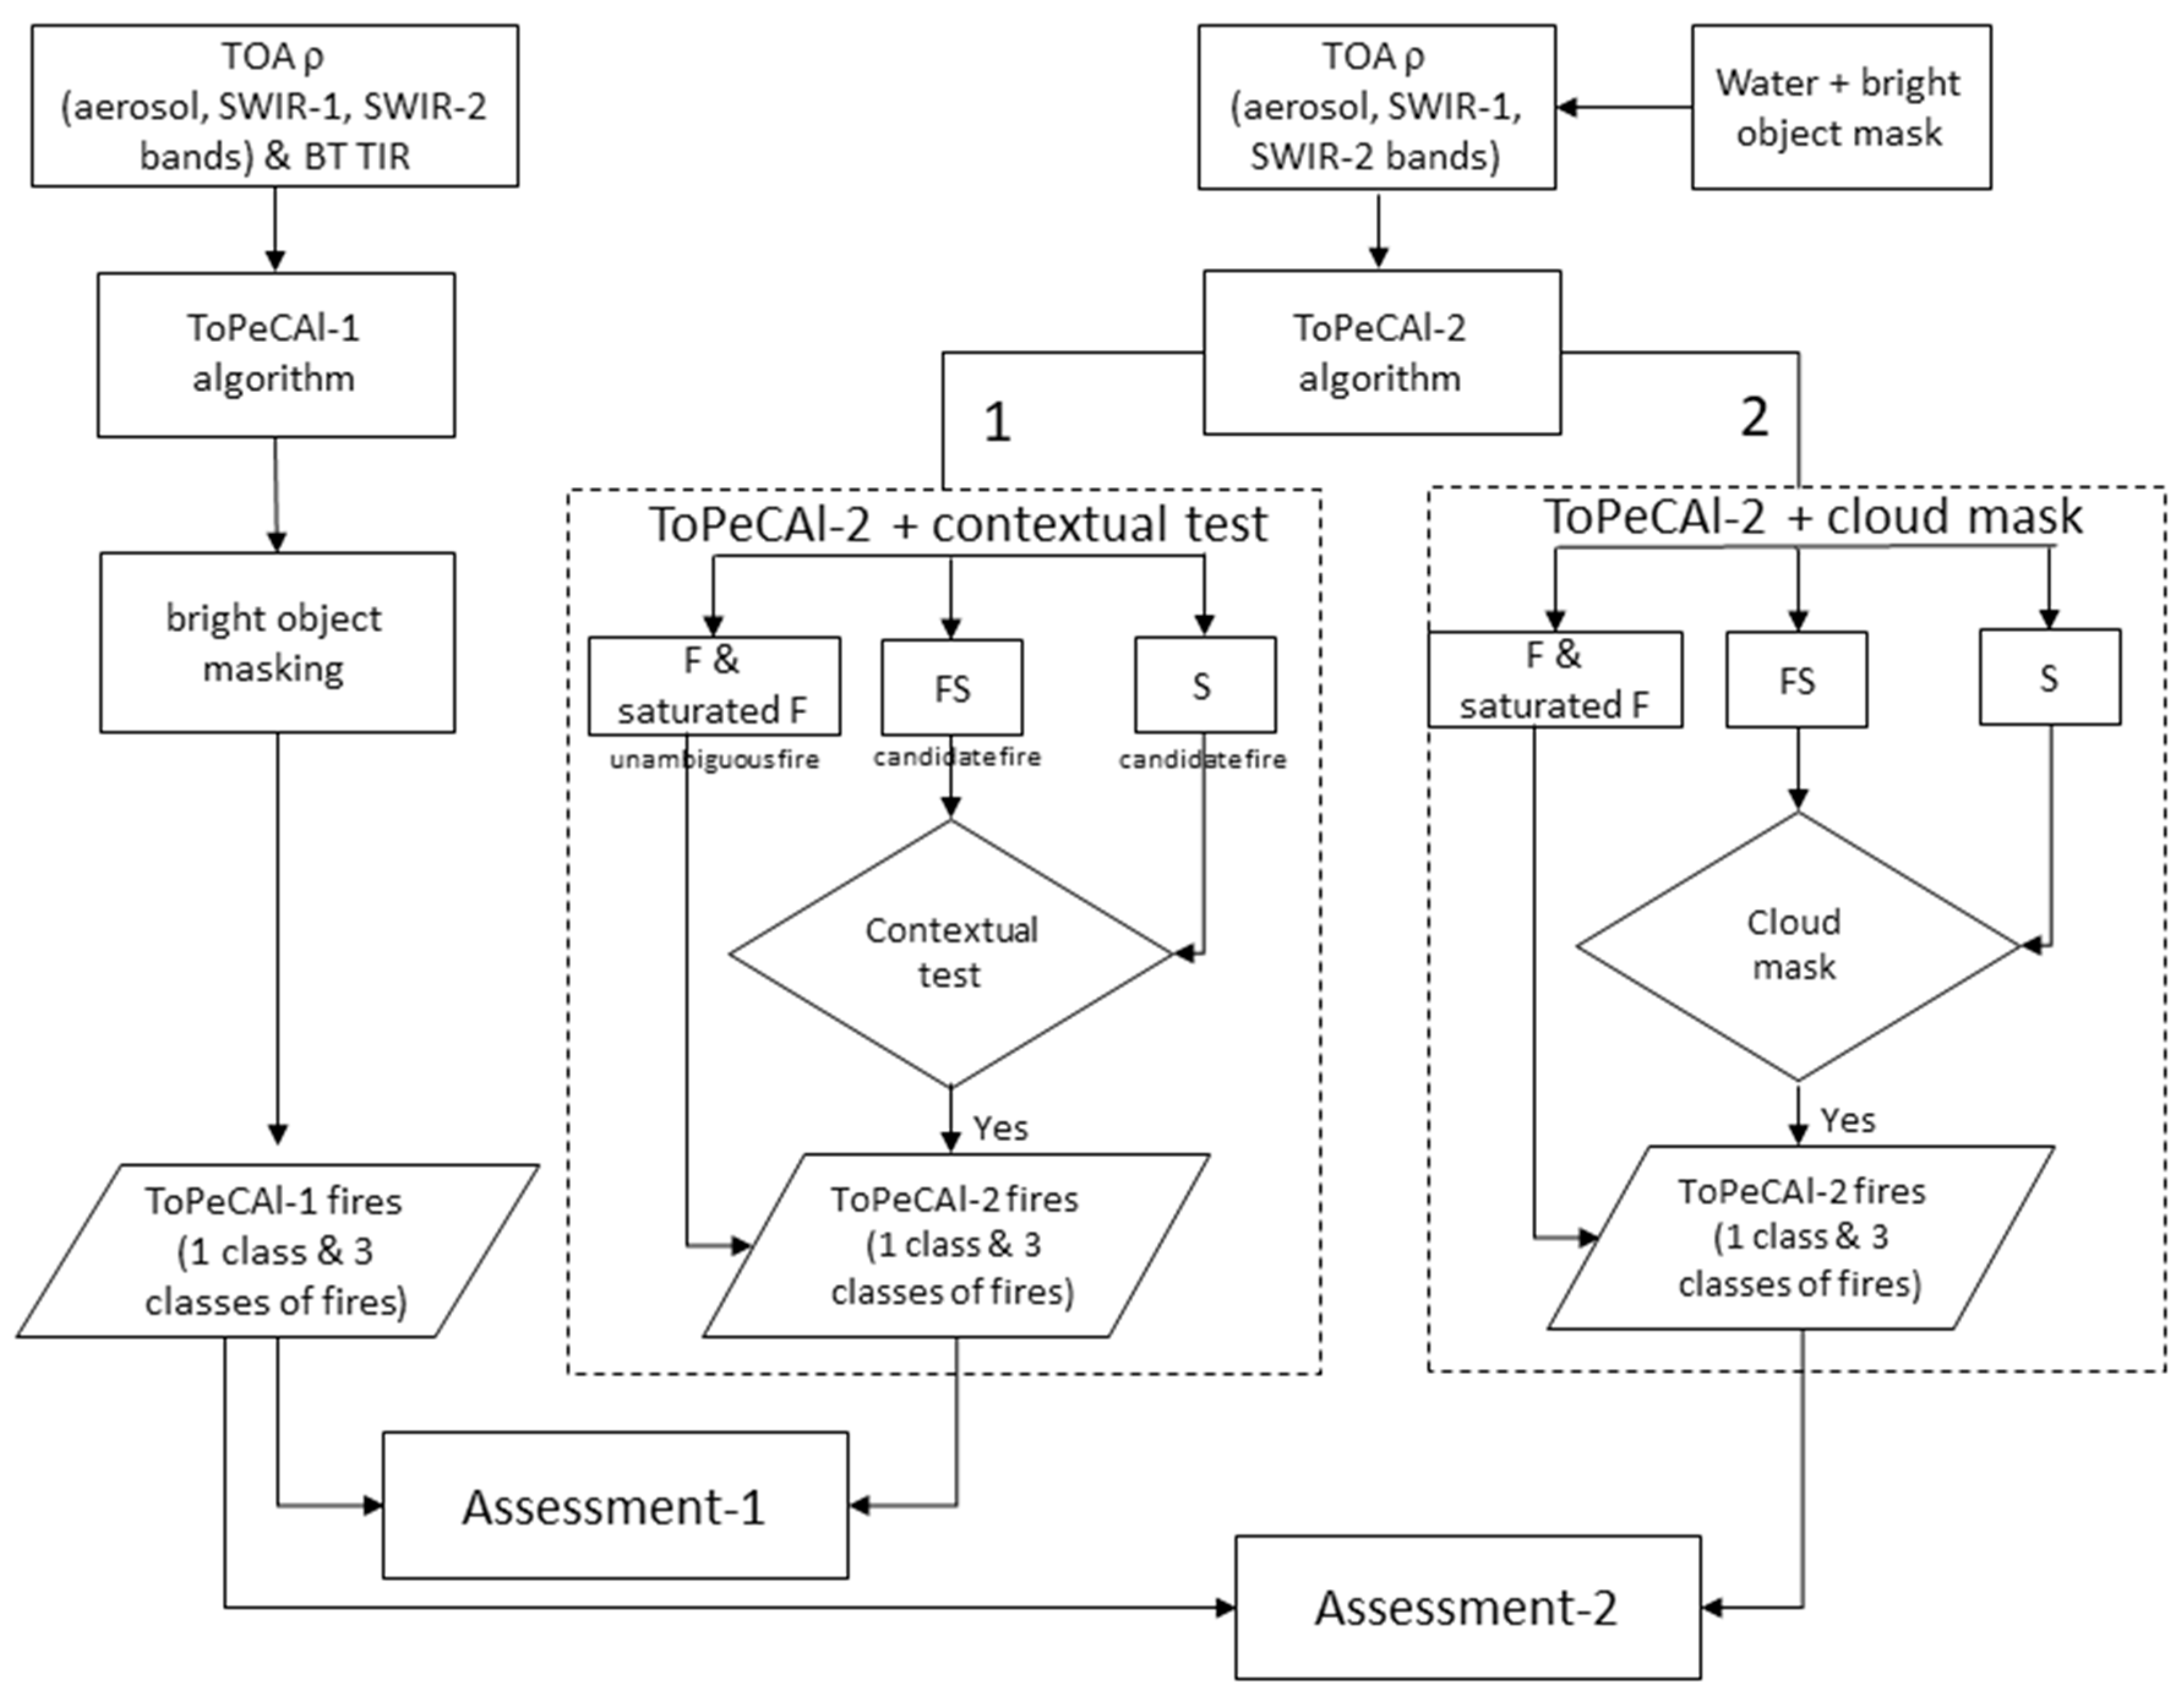
3.1. Tropical Peatland Combustion Algorithm with Shortwave Infrared (SWIR) and Thermal Infrared (TIR)

Figure 3 illustrates the principle of Planck’s Law which describes spectral radiance simulation using the MODerate resolution atmospheric TRANSmission (MODTRAN-5) for peatland with limited vegetation under assumption of ground albedo of 0.1 [52] and emissivity of 0.9 [53] at given temperatures of 300 K, 360K, 450 K, 500 K, 600 K, 700 K, and 1000 K under a tropical atmosphere and using a rural model with visibility of 3 km and hazy conditions. Previous studies observed that peatlands combustion temperature occurred at 360–500 K for smouldering, 500–700 K for smouldering but close to flaming, and at 700–1000 K for flaming [26,53,54]. The atmospheric windows where remote sensing of the biosphere best operates (light blue shading in Figure 3) shows the radiant energy of flaming peatlands (>700 K) clearly rising in SWIR region (1.6–2.2 μm) and reaching its peak in MWIR region (3–4 μm). Smouldering peatland spectral radiance falls in 360–500 K area, showing less energy in SWIR than MWIR. The presence of cool fires can also be observed in the Longwave Infrared (LWIR) which shows higher radiance than in SWIR. However, smouldering fires close to flaming (500–700 K) have less energy at LWIR compared with MWIR. The background temperature (~300 K) has a more significant emission in LWIR region. Thus, the wavelengths with high potential to observe peatland combustion using satellite remote sensing are in the 1.6–2.2 μm, 3–4 μm and 8–12 μm zones. However, reflected solar energy in SWIR may interfere with the detection of flaming at daytime, while the background temperature may affect the detection of cool fire in LWIR [55].
To examine the radiance profile of peatland fire from Landsat-8 OLI/TIRS, [27] analysed the top of atmosphere (TOA) radiance for peatland fires locations based on ground truth. The ground truth data were collected on the same day and up to two days after Landsat-8 observation over Central Kalimantan peatlands on 28 September 2018 at path/row of 118/062. The ground truth data were collected by helicopter from Disaster Management Agency, drone imaging for inaccessible locations, and by direct measurement for accessible peatland fires [27].
Figure 4 presents examples of areas of interest in burnt zones and smouldering peatland for extracting TOA radiances from Landsat-8 based on drone imagery in Central Kalimantan. Drone imagery in Figure 4a observed burnt areas on the same day with Landsat-8 observation on 28 September 2018. The burnt area is shown in bright brown tones from the drone image and also from surface pictures which were taken by using digital camera (Figure 4b). There was no smoke emanating from burnt areas and no smoky atmosphere in the area at the time these images were taken. Meanwhile, Figure 4c shows smouldering peatland which is shown in dark areas mixed with white tones, indicating ash as the product of smouldering [7,8,56]. The drone imagery of smouldering peatlands was taken two days after Landsat-8 observed the area on 28 September 2018. The surface picture of a part of smouldering peatlands (Figure 4d) was taken at the same time as drone imagery (Figure 4c). Smoky atmosphere existed in the areas when the field measurements were taken and some smoke was still emanating from the smouldering peatlands (Figure 4d). The accessible smouldering peatland areas were measured for surface temperature resulting in an average of 452 K by using a handheld IRtek IR150 dual-beam laser infrared thermometer (Figure 4e) while the average surface temperature of burnt area was about 315 K.
The graph in Figure 5 shows the profile of TOA radiances of Landsat-8 that were extracted from multiple pixels at a total of 1.62 ha of flaming, 2.43 ha of smouldering and 1.62 ha of burnt areas. Each of flaming, smouldering, and burnt area covered at least >80–90% of the pixel areas. The area of interest of smouldering and burnt areas were imaged by drone, while for flaming based features on large fire areas from 7-6-4 RGB image composites of Landsat-8 on 28 September 2018 in Central Kalimantan. The profile for flaming shows high spectral radiance in all bands of Landsat-8 (band 1–7, band-10) compared with smouldering and burnt area radiance. Smouldering showed a higher radiance at NIR (band-5) than burnt areas due to higher scattering from smoky surfaces and also some un-burnt vegetation still existing in the ongoing smouldering peatland which reflected more NIR than in the burnt area. In SWIR bands, burnt area reflectance was higher than smouldering area in band-6, but shown a similar value at band-7. The burnt area with less vegetation than in smouldering peatland may have lower surface moisture which leads to a higher reflection of SWIR in burnt areas. In TIR, smouldering peatland shows a slightly higher radiance than burnt area. Observation of the spectral plots suggests that for separating flaming, smouldering, and burnt area, taking a ratio of band-7 and band-6 may be productive. The spectral signatures in Figure 5 were acquired for guiding peatland fire validation from Landsat-8 images for some of locations which were not accessible. These profiles supported the development of ToPeCAl [27].
In addition, previous tropical peatland fire studies using field experiments and using remote sensing data were reviewed when selecting samples of peatland fires. In respect to acquisition times the low speed of peatland fire propagation permits sampling of smouldering areas on different days; in our case the time difference was up to 2 days after Landsat-8 acquisition. Low surface peatland fire propagation speed was reported at 3.8 cm/h (0.9 m/day) on average, or 6.5 cm/h (1.6 m/day) on maximum through field experiments in Central Kalimantan [54]. Meanwhile, the authors of [29] showed active fire propagation using TET-1 data, lasting for about 30 days, at 4 m/day (minimum) to 1,903 m/day (maximum) in Central Kalimantan. From personal communication with local staff of the Indonesian Disaster Management Agency, who accompanied ground truth work on 28 September–1 October 2018, peatland fires can last more than one week if no attempt to extinguish is made. Smouldering is a very persistent type of combustion, which is relatively easy to commence and difficult to suppress [7,8]. Once ignition has occurred, smouldering can exist for long periods (days, months or years). When peatland is ignited, the smouldering combustion dominates the flaming combustion [7,8] and its propagation develops both laterally and vertically [54,56]. Smouldering and flaming combustion can lead to one other; however, when the oxygen supply increases, as occurs with an increase in wind velocity, combustion becomes faster, temperature increases and a flaming state may eventuate [7,8].
ToPeCAl was first developed using SWIR and TIR spectral bands for peatland fire detection with a classification of clear and smoky/hazy tropical atmospheric conditions from the aerosol band (0.433–0.453 µm) of Landsat-8 over Indonesia [27]. The TOA reflectance of aerosol band, the TOA reflectance of SWIR bands (1.566–1.651 µm and 2.107–2.294 µm), and the TOA brightness temperature of TIR band (10.61–11.19 µm) were used in ToPeCAl. TOA reflectance for fire detection was introduced in previous studies using Advanced Spaceborne Thermal Emission and Reflection Radiometer (ASTER) and Landsat-8 by [37,38,39,40]. ToPeCAl uses TIR and SWIR to enhance the detection of smouldering and flaming combustion of tropical peatland fires [27]. ToPeCAl applied to Landsat-8 OLI/TIRS provided 82% accuracy compared with ground truth data with omission errors in small smouldering areas of non-homogeneous pixels less than one pixel of Landsat-8 and commission errors corresponding to bright building rooftops. Elimination of the urban area (building rooftops) from the analysis using a landuse map generated from Landsat-8 increased the accuracy to 93% for ToPeCAl fire mapping [27]. However, false detection may also occur for smouldering detection resulting from ToPeCAl, as the brightness temperature of smouldering peatlands showed slight differences with burnt areas (Figure 5).
In ToPeCAl [27], the potential combustion areas are first identified by use of the Shortwave Infrared Combustion Index (SICIρ), the ratio of TOA reflectance of SWIR-2 at the central wavelength of 2.2 µm ( ρ 2.2 ) to SWIR-1 at the central wavelength of 1.6 µm ( ρ 1.6 ). SICIρ values greater than 1 are classified as potential combustion areas, while the non-combustion areas, e.g., vegetation, water, urban area, and cloud, were masked using SICIρ < 1. Then, flaming and smouldering pixels are identified within the potential combustion areas using TOA reflectance of SWIR-2 ( ρ 2.2 ) and TOA brightness temperature of TIR ( BT 10.9 ) on relatively clear or smoky/hazy atmospheric conditions based on TOA reflectance of the aerosol band ( ρ 0.44 ). The ToPeCAl formulation is given by equations 1−12 [27]:
Peatland combustion types in relatively-clear atmospheric conditions:
SICI ρ =   ρ 2.2 ρ 1.6 ;   SICI ρ > 1
AND
ρ 0.44 < 0.27
AND
{ 0.09 ρ 2.2 0.31   AND   BT 10.9   297     ( smouldering )
0.31 < ρ 2.2 < 0.68   AND   BT 10.9   300   ( mix   of   flaming   and   smouldering )
ρ 2.2 0.68   AND   BT 10.9     307     ( flaming ) }
AND
SICI ρ     1   AND   ρ 2.2 0.68   AND   BT 10.9     307     ( flaming   for   close   to   saturated   pixel   of   SWIR   radiance )
Peatland combustion types in smoky/hazy atmosphere condition:
SICI ρ =   ρ 2.2 ρ 1.6 ;   SICI ρ > 1
AND
ρ 0.44 0.27
AND
{ 0.11 ρ 2.2 0.32   AND   BT 10.9     297   ( smouldering )
0.32 < ρ 2.2 < 0.47   AND   BT 10.9     297     ( mix   of   flaming   and   smouldering )
ρ 2.2 0.47   AND   BT 10.9     303     ( flaming ) }
AND
SICI ρ     1   AND   ρ 2.2 0.47   AND   BT 10.9     303     ( flaming   for   close   to   saturated   pixel   of   SWIR   radiance )
In this study, the ToPeCAl algorithm with SWIR and TIR is termed ToPeCAl-1, while ToPeCAl without TIR band is termed ToPeCAl-2. An initial comparison of ToPeCAl-1 and ToPeCAl-2 was conducted through visual analysis on the ToPeCAl fires product compared with 6-5-4 (SWIR-1, NIR, Red) RGB images of Landsat-8. In this visual analysis, the attention was to check what fire objects resulting from ToPeCAl-2 were not detected by ToPeCAl-1; that is, the false positives of ToPeCAl-2. From the 6-5-4 RGB images of Landsat-8, most of the false positive of ToPeCAl-2 fires occurred in the edge of cloud, permanent bright objects such as urban features or factory rooftops and mining areas (Table 5). This is indicative of false positive fire detection using ToPeCAl-2 for sensors with no TIR, e.g., Landsat-8 OLI and Sentinel-2 MSI.

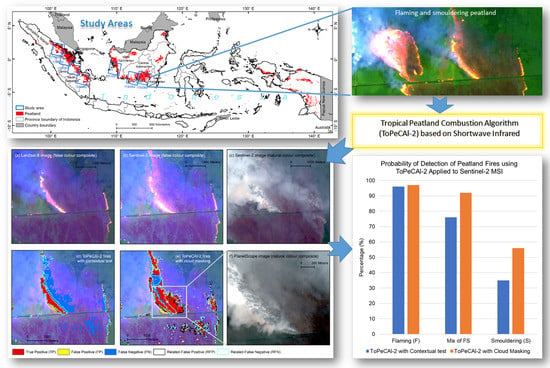
3.2. Tropical Peatland Combustion Algorithm without TIR (ToPeCAl-2)

ToPeCAl-1 formulation was adjusted to perform ToPeCAl-2. The general flowchart is shown in Figure 6. The adjustment of ToPeCAl-2 included:
  • Pre-processing for water body and permanent bright objects masking,
  • A variation of ToPeCAl-2 with contextual test for comparing candidate fire pixels with background pixels [37,38],
  • An alternative variation to ToPeCAl-2 using cloud masking.

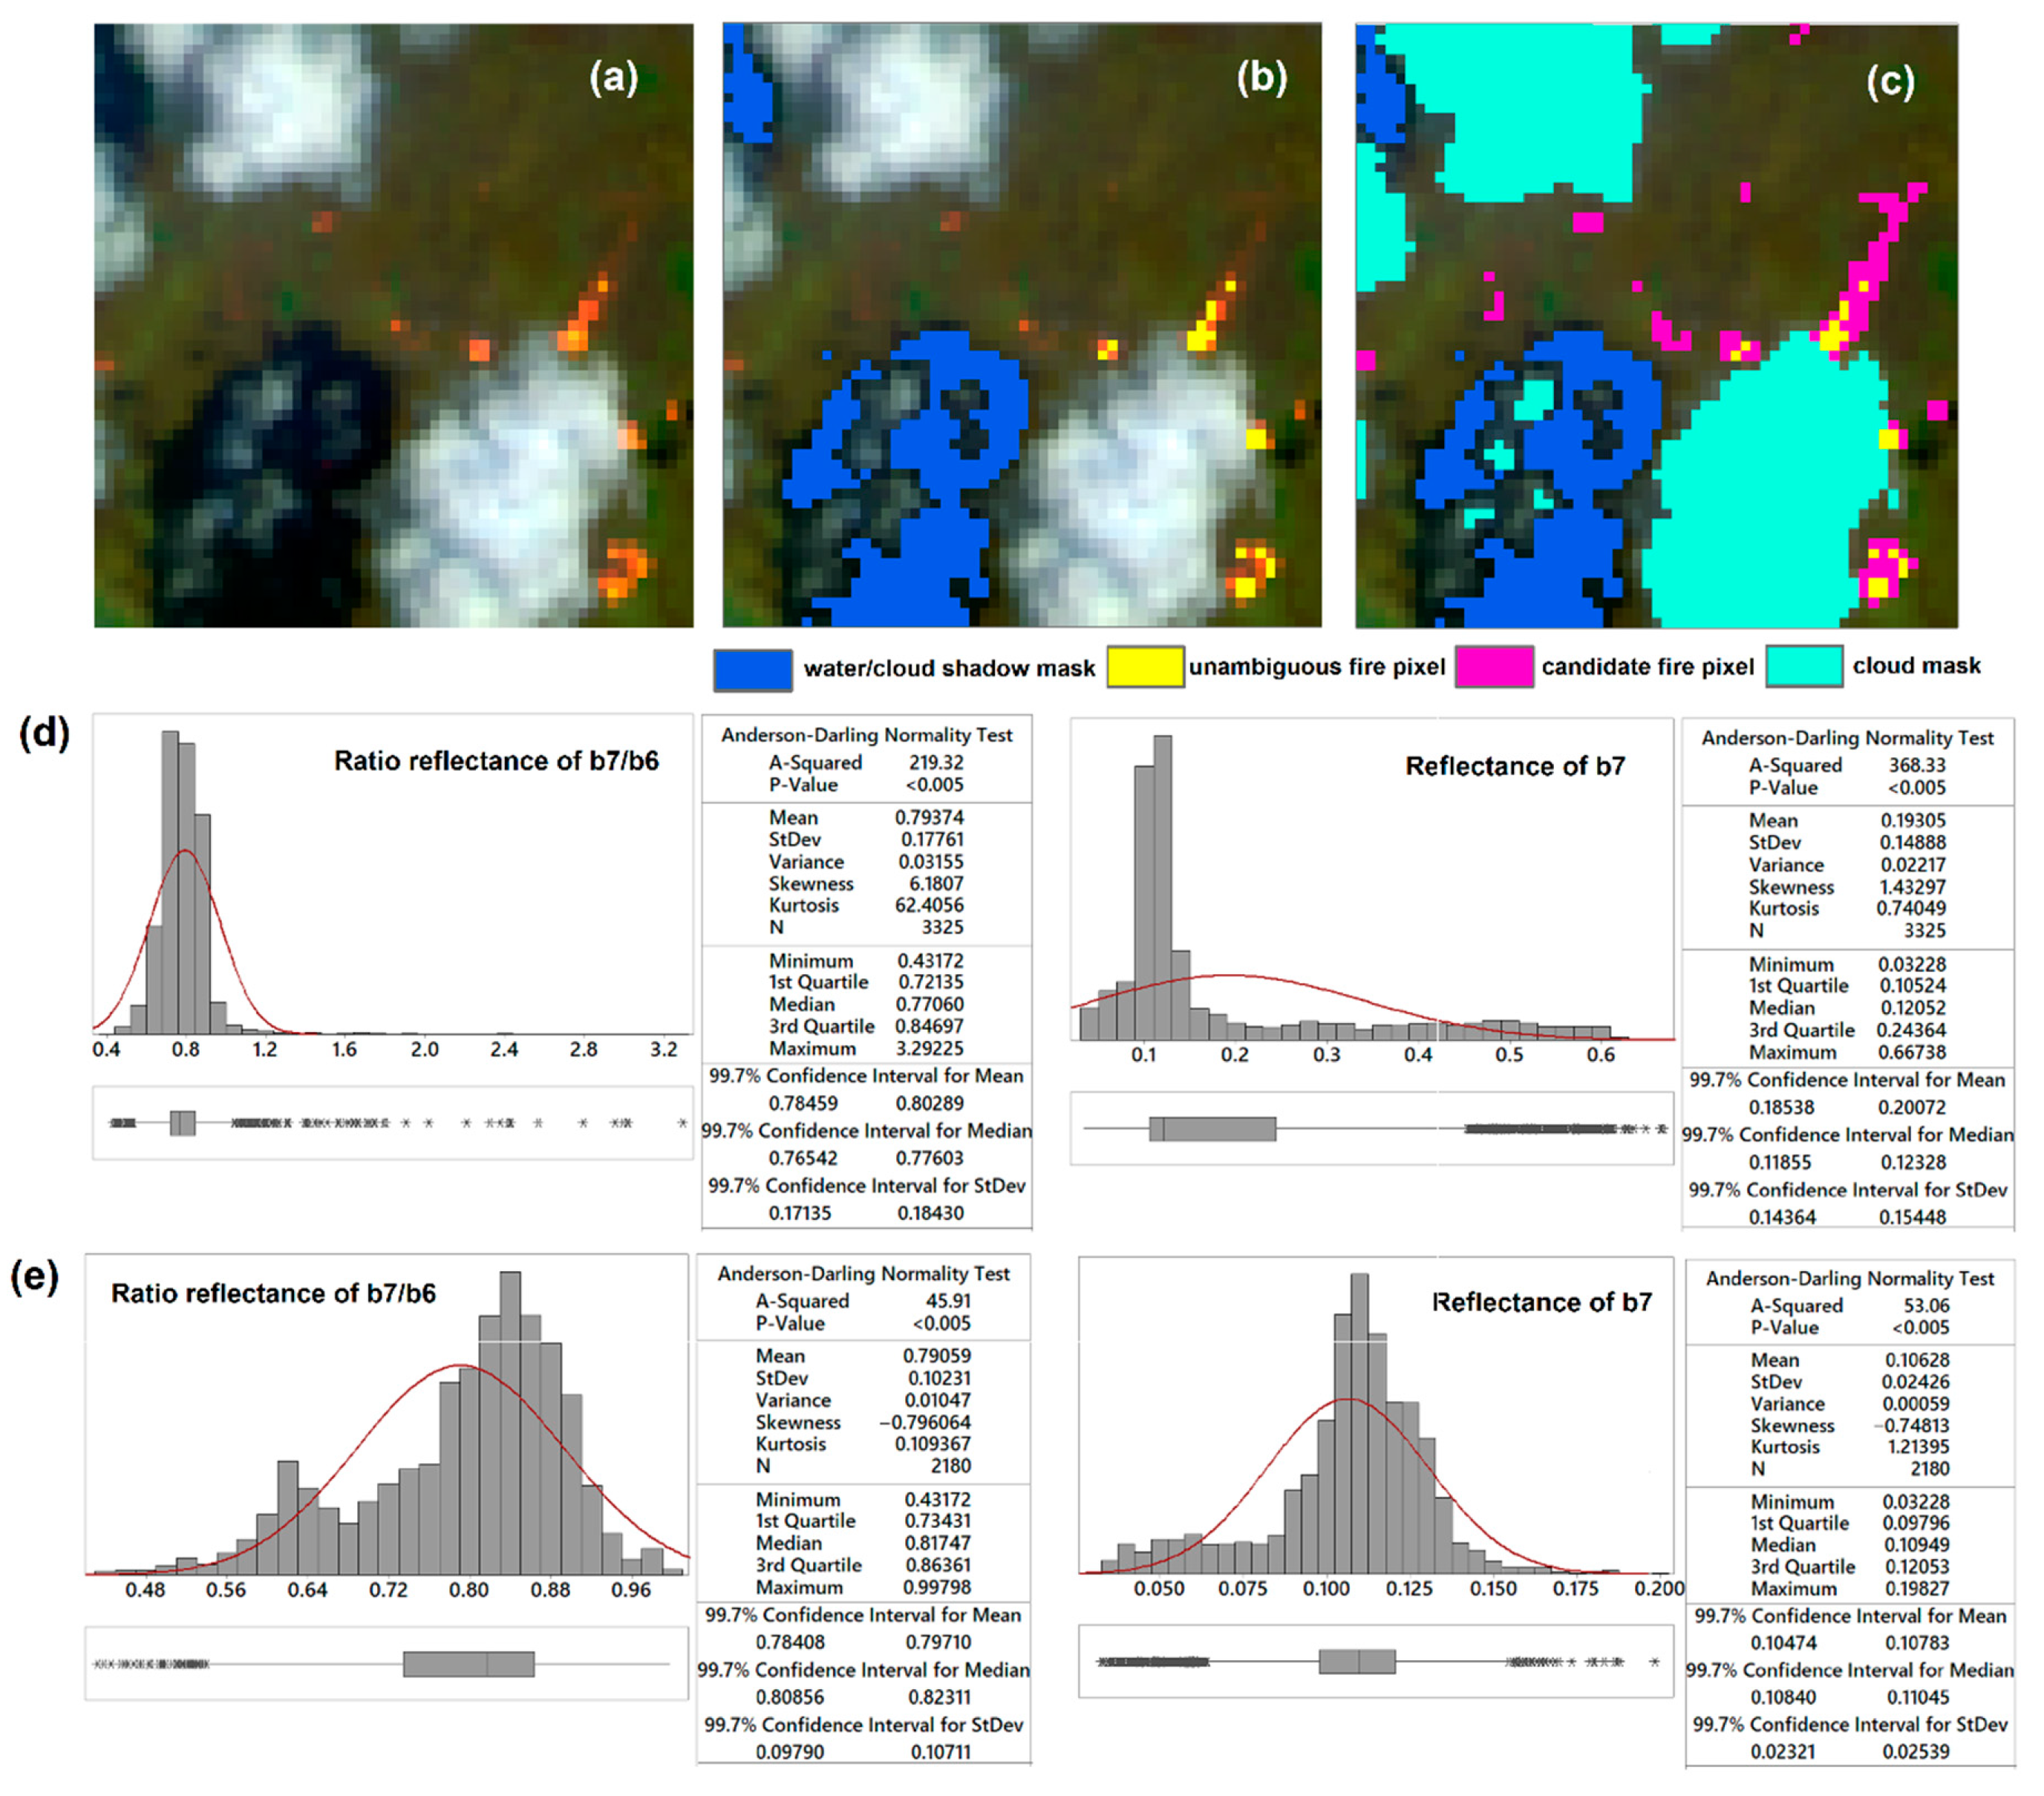
3.2.1. Water Masking

Water and permanent bright objects are outliers or potential outliers in the analysis for fire detection; thus, they were masked, firstly before applying ToPeCAl-2. Normalised Difference Water Index (NDWI) and Modified Normalised Difference Water Index (MNDWI) are widely used for water body mapping from middle spatial resolution data, e.g., Landsat-8 and Sentinel-2 [43,50,57]. NDWI uses green ( ρ 0.56 ) and NIR ( ρ 0.865 ) reflectance while MNDWI uses green and SWIR ( ρ 1.61 ) reflectance in their formulation (Equation (13)). We found that NDWI can map water bodies well in clear atmospheric conditions, but for some images with many fires and smoky conditions, NIR does not perform well due to smoke aerosol scattering; thus, MNDWI with SWIR wavelengths which are able to be better detected through smoke was used to map the water bodies. Both NDWI and MNDWI were applied in this study to overcome the variety of smoke conditions over multiple fire images. According to [50], NDWI values within 0 to 0.1 and MNDWI values within 0.2 to 0.35 can map water bodies well. In this study, NDWI > 0.1 and MNDWI > 0.35 was used to map water bodies. Some cloud shadows which have the same spectral character with water also were mapped using these thresholds (Equation (13)).
( NDWI > 0.1 )   OR   ( MNDWI > 0.35 )
NDWI = ρ 0.560     ρ 0.865 ρ 0.560   +   ρ 0.865 ; MNDWI = ρ 0.560     ρ 1.61 ρ 0.560   +   ρ 1.61

3.2.2. Permanent Bright Object Masking

Previously, in the application of ToPeCAl-1 an urban GIS map was used for masking potential false positive pixels in urban areas [27]. However, multitemporal high spatial resolution images from Google Earth confirmed that the false positive pixels were still found on building or factory rooftops outside the urban area and these objects are relatively permanent, e.g., building/factory and mining areas which existed through several years.
These permanent bright reflective objects can be more effectively eliminated to minimise the false positive pixels through the use of TOA reflectance of SWIR-2 ( ρ 2.2 ) . The mean value of ρ 2.2 > 0.2 was applied by [38] on multitemporal data of Landsat-8 OLI in co-located cloud free pixels in the previous 6 months (176 days) to eliminate false positives over permanent bright objects. However, it is rare to obtain cloud free pixels from multitemporal data of Landsat-8 for every 16-days in tropical environments. Thus, some adjustments were applied in this study to map the permanent bright objects with the following procedure:
  • Use of multitemporal Sentinel-2 MSI images instead of Landsat-8 OLI images to acquire more images containing cloud free pixels. This is a result of the higher temporal resolution of Sentinel-2 acquisition compared with Landsat-8. The cloud free pixels of the multitemporal images from Level-1C Sentinel-2 MSI for permanent bright object mapping were obtained via the Google Earth Engine platform [58]. According to [48], geometric image quality performance for multitemporal Sentinel-2 20 m bands was 6 m (2σ). To match with the fire product of ToPeCAl-2 applied to Landsat-8, the product of permanent bright objects from SWIR-2 band of Sentinel-2 was resampled to 30 m.
  • The median values of ρ 2.2 as applied by [40] instead of the mean values as used by [38]; thus, in this study, the median values of ρ 2.2 > 0.18 were used. This condition needs to exist in the first half-year (January–June) and in the second half-year (July–December) either in the year of data acquisition, or in the previous year. This seasonal period was selected to gain increased possibilities of obtaining cloud free images which were not based on the period of seasons in Indonesia. Otherwise, cloud free images were usually found in dry season (April–September) and barely any cloud free data in wet season (October–March). Permanent bright objects should also have relatively stable and high SWIR reflectance in any period. Thus, these conditions can be expressed as:
If   ( ( ρ 2.2   at   t ( jan - june ,   y ) )   OR   ( ρ 2.2   at   t ( jan - jun ,   y 1 ) ) )   >   0.18
AND
( ( ρ 2.2   at   t t ( jul - dec ,   y ) )   OR   ( ρ 2.2   at   t ( jul - dec ,   y - 1 ) ) )   >   0.18
then TRUE as bright permanent objects.
Where t(jan-june, y) and t(jan-june, y−1) are time period in January–June in on-going year and in previous year; t(jul-dec, y) and t(jul-dec, y−1) are time period in July–December in on-going year and in previous year.

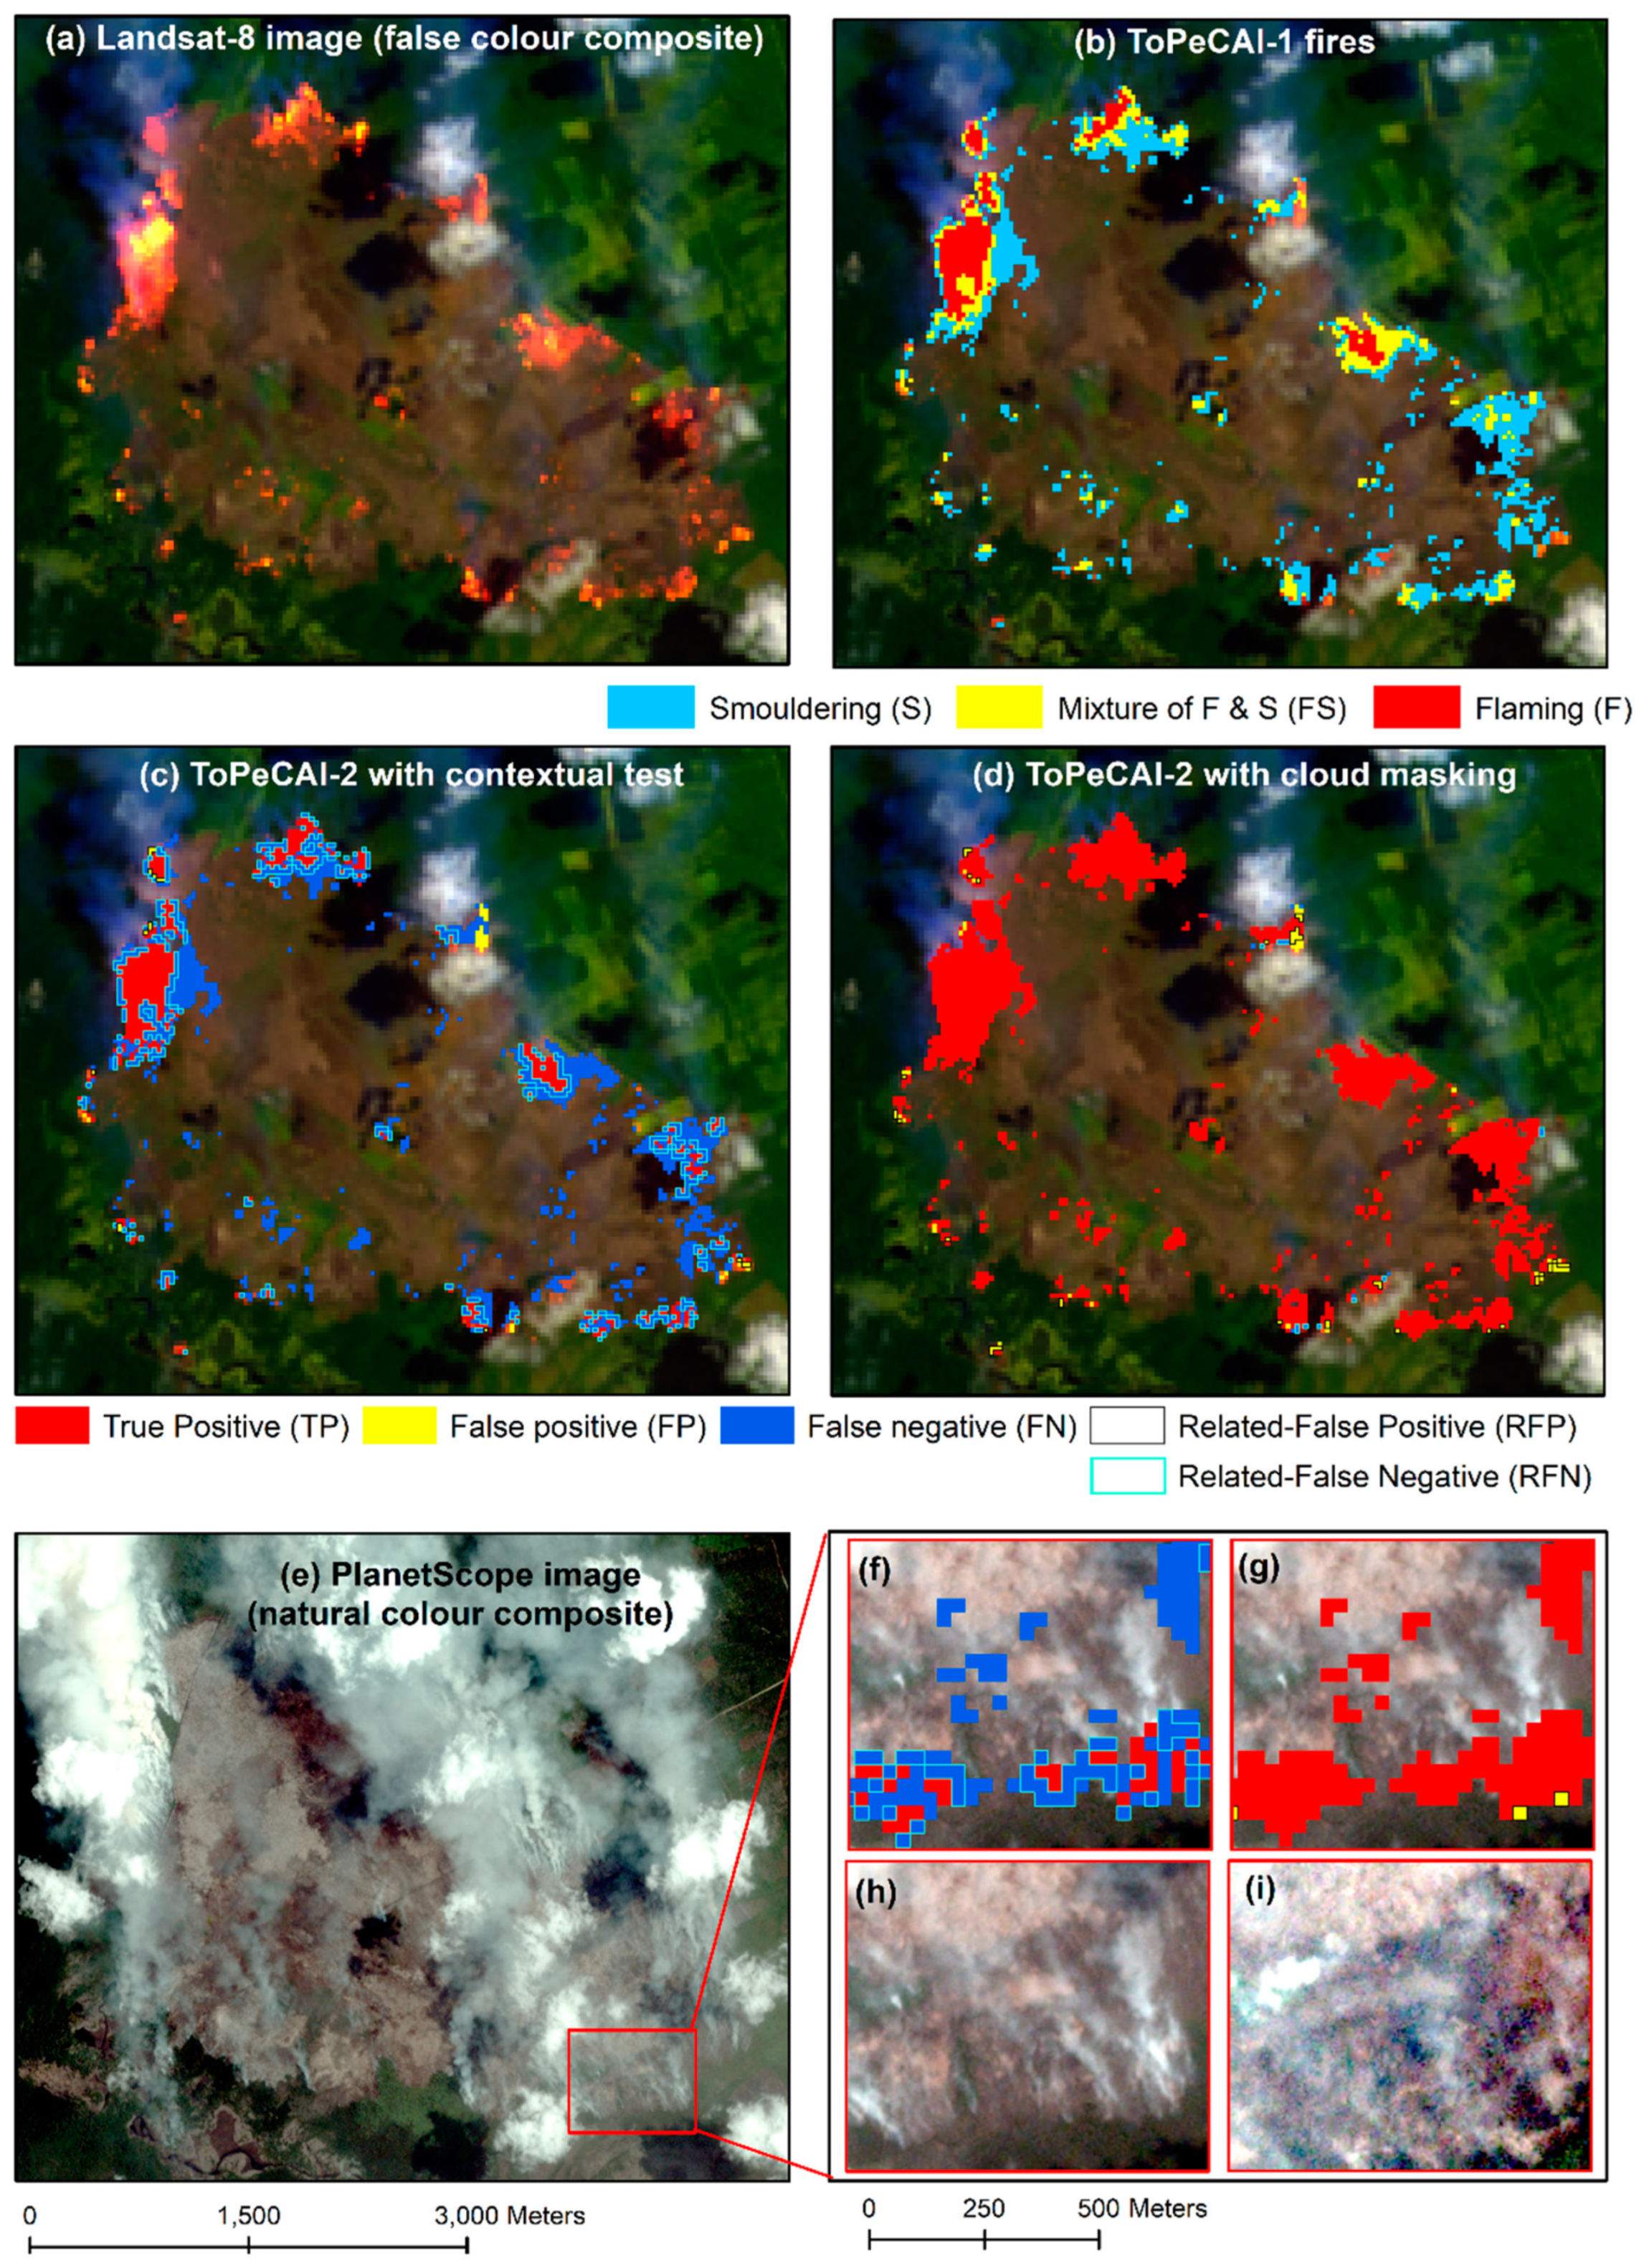
3.2.3. ToPeCAl-2 with Contextual Test

The form of ToPeCAl-2 for relatively clear sky and smoky/hazy atmospheres is similar to ToPeCAl-1 but without BT10.9. Unambiguous detection is for flaming fires (Equation (16)). For detection of flaming close to saturated pixel, SICIρ values in ToPeCAl-1 (Equations (6) and (12)) were expressed as ≤1 with conditions for ρ 2.2 and BT10.9. This SICIρ ≤ 1 resulted from ρ 1.6 or ρ 2.2   ≥ 1 and with a condition of ρ 1.6   ρ 2.2 . The actual values of SICIρ for close to saturated pixel were not explicitly stated in ToPeCAl-1 (Equations (6) and (12)), but because TIR does not exist in ToPeCAl-2 then it should be rewritten as ≥0.9 (Equation (17)). Meanwhile additional candidate fire pixels are from a mix of flaming and smouldering (FS) and smouldering pixels (Equations (18) and (19)).
Unambiguous fire pixels on clear sky or smoky/hazy atmosphere:
SICI ρ > 1   AND   ρ 0.44 < 0.27   AND   ρ 2.2 0.68 OR SICI ρ > 1   AND   ρ 0.44 0.27   AND   ρ 2.2 0.47
Fire pixels at close to saturation for flaming pixel on clear sky or smoky/hazy atmosphere:
SICI ρ   0.9   AND   ρ 0.44 < 0.27   AND   ρ 2.2 0.68   AND   ( ρ 2.2 1   AND   ρ 1.6     1 ) AND   ( ρ 1.6 ρ 2.2 ) OR SICI ρ 0.9   AND   ρ 0.44 0.27   AND   ρ 2.2 0.47   AND   ( ρ 2.2 1   AND   ρ 1.6     1 ) AND   ( ρ 1.6 ρ 2.2 )
Candidate fire pixels for FS pixels on clear sky or smoky/hazy atmosphere:
SICI ρ > 1   AND   ρ 0.44 < 0.27   AND   ρ 2.2 > 0.31 OR SICI ρ > 1   AND   ρ 0.44 0.27   AND   ρ 2.2 > 0.32
Candidate fire pixels for smouldering pixels on clear sky or smoky/hazy atmosphere:
SICI ρ > 1   AND   ρ 0.44 < 0.27   AND   0.09 ρ 2.2 0.31   OR SICI ρ > 1   AND   ρ 0.44 0.27   AND   0.11 ρ 2.2 0.32
A contextual algorithm was implemented to compare the candidate fire pixels from Equations (18) and (19) with background pixels. However, the unambiguous fire pixel (flaming) from Equation (16) and the close to saturated flaming pixels from Equation (17) were retained as peatland fire pixels. The contextual algorithm was sourced from [38] with a modification particularly on using the mean and standard deviation of the ratio of ρ 2.2 and ρ 1.6 rather than the ratio of ρ 2.2 and ρ 0.865 as used in [38]. The peatland fire pixels from ToPeCAl-2 were derived from the ratio of ρ 2.2 to ρ 1.6 and the reflectance of SWIR-2 ( ρ 2.2 ), thus the statistical calculations of the background pixels were also analysed based on these spectra.
The contextual search was set to a 61 × 61 pixel window similar to [37,38]. Valid background pixels ideally should not be contaminated with outlier pixels. However, in tropical peatland environments the background is mostly heterogeneous, potentially resulting in a non-normal distribution statistic of the background values. Dense cloud might also exist and also the fire pixels including candidate fire pixels in 61 × 61 pixel windows. These features can also influence the background statistics. In this study, the cloud mask product from Landsat-8 was not chosen as it mapped slightly larger cloud areas which misclassified some clear area as clouds. This result also was reported by [51] who suggested to use the Cloud Detection Algorithm Generation (CDAG) to perform better cloud masking. Thus, CDAG with single band of Red reflectance ( ρ 0.65 ) was applied to map clouds in this study. The formulation of cloud mask is given in Equation (20) [51].
ρ 0.65 > 0.21
Previous studies [37,38,40] only masked water/cloud shadow and unambiguous fire pixels from background analyses. In this study, permanent bright objects, dense cloud pixels and all of fire pixels, including candidate pixels from the population of the background were also masked. An example is shown in Figure 7c, but with no bright permanent object pixels existing in this sample. The histogram and population statistics of the ratio of reflectance of band-7 to band-6 and the reflectance of band-7 resulting from the image data corresponding to Figure 7b are shown in Figure 7d. Whilst the background statistics resulting from Figure 7c are shown in Figure 7e. Based on the histogram, Figure 7e exhibits less skewness than Figure 7d with improved data distribution for representing the mean and standard deviation values with 1σ to 3σ for the population.
After selecting valid background pixels, the candidate fire pixels from Equations (18) and (19) were tested by using a contextual algorithm (Equation (21)). The fire pixels that passed this test were merged with fire pixels resulting from Equations (16) and (17) as the peatland fires pixels.
Contextual test for candidate fire pixels:
ρ 2.2 ρ 1.6 > ( ρ 2.2 ρ 1.6 ¯ ) + max [ 3 σ ( ρ 2.2 ρ 1.6 ) ,   0.8 ]
and
ρ 2.2 > ρ 2.2 ¯ + max [ 3 σ ρ 2.2 ,   0.08 ]
where ( ρ 2.2 ρ 1.6 ¯ ) and σ ( ρ 2.2 ρ 1.6 ) are the mean and standard deviation of the ratio ρ 2.2 to ρ 1.6 respectively, while ρ 2.2 ¯ and σ ρ 2.2 are the mean and standard deviation of ρ 2.2 respectively from 61 × 61 pixel window centred on each potential fire pixel. The values of 0.8 and 0.08 in Equation (21) were sourced from [38] to avoid false alarms in unusually homogeneous regions [37].

3.2.4. ToPeCAl-2 with Cloud Masking

ToPeCAl-2 with cloud masking was another approach to eliminate false positives in cloud, dense cloud and the edge of cloud, instead of the contextual test approach. In this second approach, ToPeCAl-2 fires resulted from Equation (16) to Equation (20) were filtered with cloud masking, particularly for FS and smouldering pixels, to remove false positives. However, the cloud mask data was not produced from Equation (21); rather it was obtained from cloud mask product of Level-2 pixel-qa of Landsat-8. The cloud mask from pixel-qa provided a larger cloud area which assisted in removing the false positive pixels in the edge of cloud.

3.2.5. Pixel-Based Comparison of ToPeCAl-2 Applied to Landsat-8 Operational Land Imager (OLI) with ToPeCAl-1 Applied to Landsat-8 OLI/Thermal Infrared Sensor (TIRS)

A pixel-based comparison of 15 Landsat-8 images was conducted between the fire products of ToPeCAl-2 with the fire products of ToPeCAl-1. The reference fire data was ToPeCAl-1 fires. The comparison of peatland fires was calculated for three classes of peatland combustions and one combined class of fire. The three classes of peatland combustions from ToPeCAl are flaming (F), smouldering (S), and mix of flaming and smouldering (FS). The one fire class (Fire) was created by integrating the three peatland combustion classes into one class. Statistical analyses generated the probability of detection (POD), false positive (commission error) and false negative (omission error). POD was calculated by the ratio of true positive fires between ToPeCAl-2 and ToPeCAl-1 to the total fires produced in the reference data (ToPeCAl-1). Commission error was counted from the ratio of the ToPeCAl-2 fires which were not detected in ToPeCAl-1 to the total ToPeCAl-2 fires, while omission error can be computed as 1-POD.
In addition to ToPeCAl-1 Landsat-8 fires as the reference, others image data, e.g., Google Earth and PlanetScope were used to confirm any indication of fires or false detections. The PlanetScope data were accessed from Planet explorer at www.planet.com.

3.3. Implementation and Comparison of ToPeCAl-2 on Sentinel-2 Multi Spectral Instrument (MSI)

3.3.1. Sentinel-2 MSI Data Pre-Processing

The TOA reflectance of Sentinel-2 MSI data were obtained from Level-1C. Some of the Sentinel-2 listed in Table 4 consisted of more than one tile for the corresponding Landsat-8 scene, thus the data of the Sentinel-2 tiles were mosaicked with nearest neighbor resampling method to preserve the original values of data. In the overlap zones, the images with less cloud cover were selected as the primary data. The tiles were mosaicked for each band of aerosol ( ρ 0.443 ), green ( ρ 0.560 ), NIR ( ρ 0.865 ), SWIR-1( ρ 1.610 ) and SWIR-2 ( ρ 2.190 ). The spatial resolution of aerosol and green bands was resampled to 20 m to match with spatial resolution of the SWIR bands to produce fire pixels. Pre-processing to mask out water and permanent bright objects was conducted by using Equation (13) to Equation (15). A general flowchart, which is presented in Figure 6, was also applied to Sentinel-2 to produce fire pixels with an initial investigation of sensor comparison for both Landsat-8 OLI and Sentinel-2 MSI and is described in Section 3.3.2.

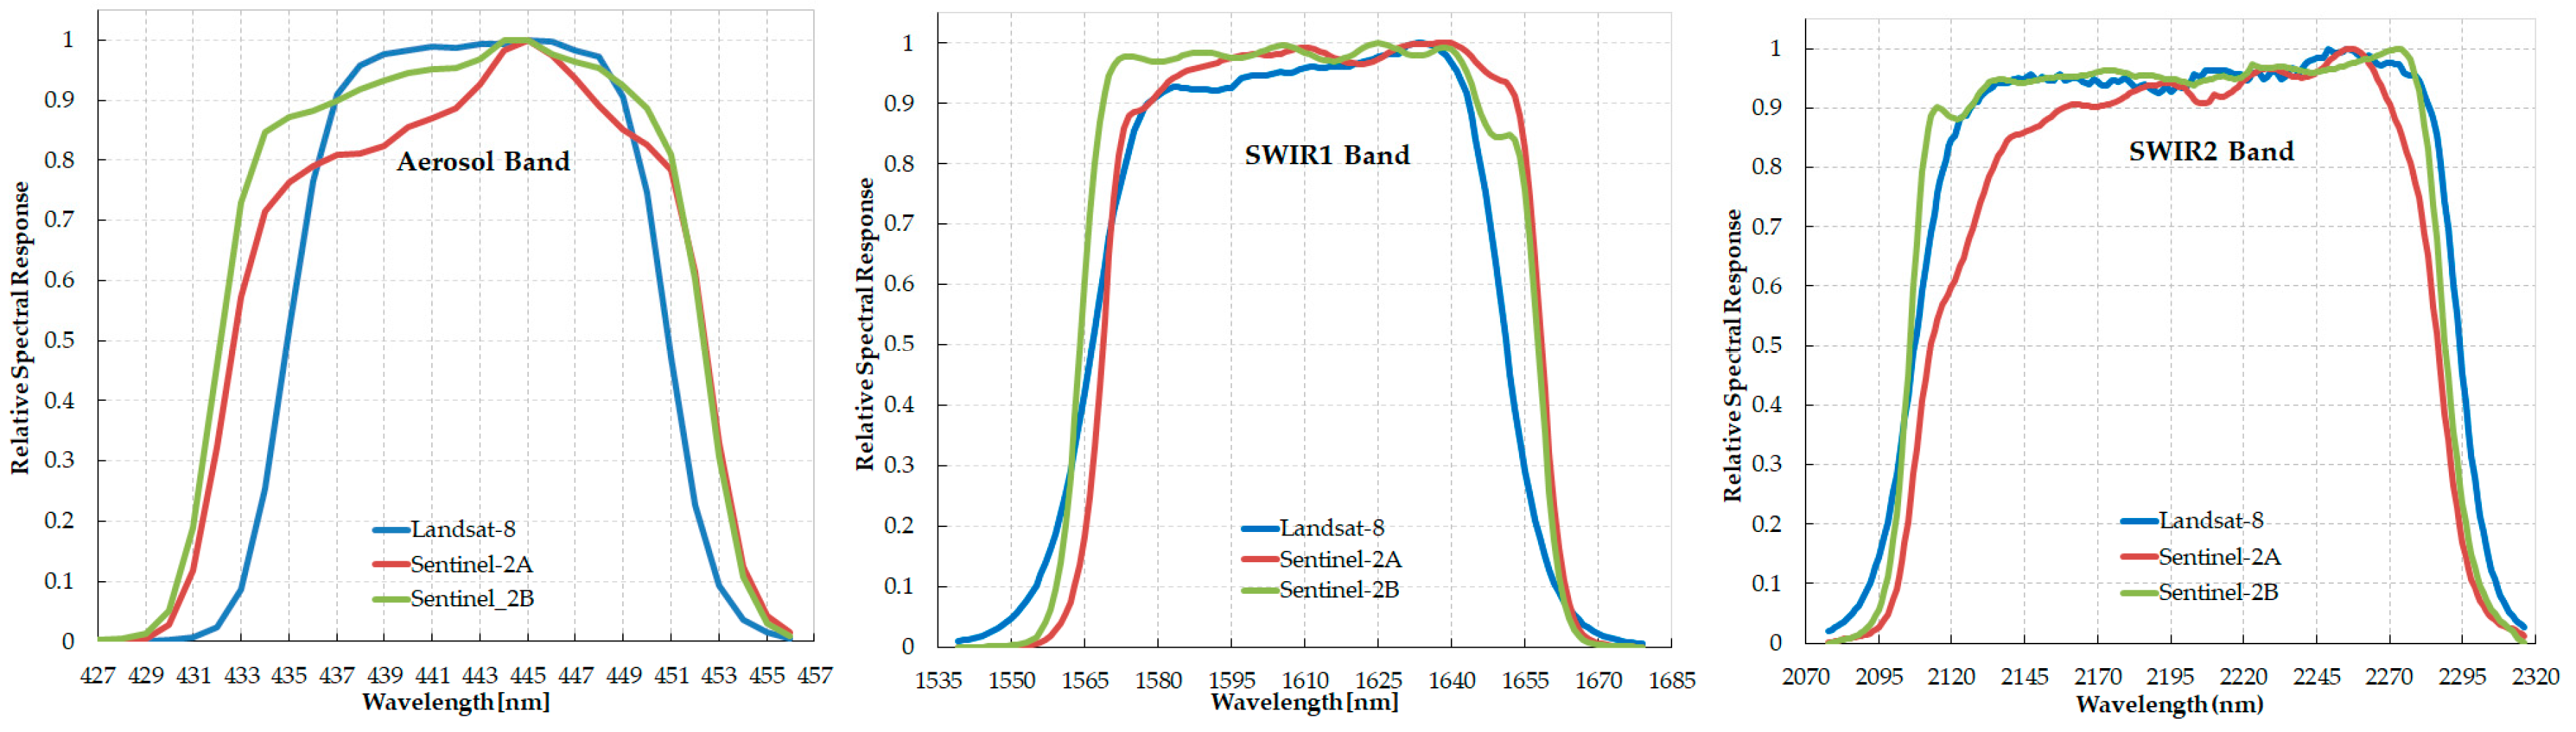
3.3.2. Sentinel-2A MSI and Landsat-8 OLI Spectral Reflectance Sensor Comparison

In order to apply ToPeCAl-2 developed from Landsat-8 OLI data, an initial comparison of the difference between spectral reflectance from Landsat-8 OLI and Sentinel-MSI at band-1, SWIR-1 and SWIR-2 was conducted. Figure 8 shows that the spectral response function of Sentinel-2A/2B MSI slightly varied compared with Landsat-8 OLI at aerosol band, SWIR-1 and SWIR-2 bands. The spectral response data was sourced from ESA [59,60].
Pairs of Sentinel-2A/2B MSI pixels and Landsat-8 OLI pixels on the same day of acquisition also exhibiting fire features in the same area in both data were compared at aerosol, SWIR-1 and SWIR-2 bands. All bands used in ToPeCAl were set at the same spatial resolution of 20 m using the nearest neighbor resampling method in projection of UTM/WGS84. In this study, a valid pixel selection for comparing TOA reflectance of Sentinel-2 and Landsat-8 was built from the same data acquisition utilising criteria which were provided in Scene Classification (SC) of Sentinel-2 from Level-2A through Sen2Cor and pixel-qa of Landsat-8 from Level-2. The valid pixels were from vegetation and non-vegetation class based on the SC data.
In addition to the cloud masking, the physical environment close to cloud generates cloud adjacency effects or 3-D radiative effects. The cloud adjacency effects cause a brighter pixels around the edge of clouds and an increased high-biased aerosol optical depth thus contributing to an increase in observed reflectance [61,62,63,64]. The parallax error due to a difference of earth viewing angles observed from Sentinel-2 spectral bands also was mentioned as a possible displacement of cloud mask [61]. In this study, an additional 40 m (2 pixels) buffer from the cloud mask was generated and applied to masking the cloud adjacency effects in the remaining imagery. The cloud mask was merged from medium and high confidence cloud from Sentinel-2 data.
Meanwhile, the mask data from pixel-qa of Landsat-8 were cloud, cloud shadow, water, and high confidence cirrus. All of the mask data selected from SC data and pixel-qa data were merged as one mask and then applied to Sentinel-2A/2B MSI and Landsat-8 OLI images.
The valid pixels of TOA reflectance data of Sentinel-2A/2B and Landsat-8 OLI in aerosol, SWIR-1 and SWIR-2 bands were then statistically compared and analysed using t-tests to determine if there was a significant difference between the means of Sentinel-2 and Landsat-8 TOA reflectance. Ordinary least squares (OLS) regression analysis was also conducted to explore the relationships using the slope and intercept coefficient values between the TOA reflectance of the two sensors. The goodness of fit and significance of the OLS regressions were defined by the coefficient of determination and statistic p-value.

3.3.3. Implementation of ToPeCAl-2 Applied to Sentinel-2 MSI

ToPeCAl-2 was applied to original values of TOA reflectance of Sentinel-2 MSI and to the transformed values of TOA reflectance of Sentinel-2 MSI resulting from the OLS regression equations between Landsat-8 and Sentinel-2 at band aerosol, SWIR-1 and SWIR-2. As tested in Landsat-8 OLI, ToPeCAl-2 applied to Sentinel-2 was also adjusted by implementing two approaches, i.e., ToPeCAl-2 with contextual test and ToPeCAl-2 with cloud masking.
The formulation of ToPeCAl-2 with contextual test was based on to Equation (16) to Equation (21). However, the cloud mask was not generated from Equation (20). The cloud product from SC map of Sentinel-2 was used for background analysis in the contextual test and for removing false positive pixels from FS and smouldering pixels in the second approach of ToPeCAl-2 adjustment, ToPeCAl-2 with cloud masking.
The masking data used for calculating ToPeCAl-2 was different from the masks data for analysing the spectral relationship between Sentinel-2 and Landsat-8 in the Section 3.3.2. The mask data used in ToPeCAl-2 application was high confidence cloud from SC map with additional buffer zone of five pixels (100 m) from outside high confidence cloud polygon. According to [65], the high and medium confidence cloud has above 65% and 35% of cloud probability, respectively. The buffer created around dense cloud was also aimed to mask the cloud adjacency effects close to dense cloud. The medium confidence cloud, which was not adjacent to high confidence cloud, was not masked out from the calculation of ToPeCAl-2 in order to detect possible fire pixels under the thin cloud.

3.3.4. Pixel-Based Comparison of ToPeCAl-2 Applied to Sentinel-2 MSI with ToPeCAl-1 Applied to Landsat-8 OLI/TIRS

The comparison of fire products of ToPeCAl-2 applied to Sentinel-2 MSI were conducted on a pixel-basis with the fire products of ToPeCAl-1 applied to Landsat-8 OLI/TIRS as reference. The statistical comparisons conducted were POD, false positive (commission error), and false negative (omission error). Potential geometric error existing between both Sentinel-2 and Landsat-8, which is about 38 m (2σ) [66] and peatland fires propagation zone during the difference in time of observation between Landsat-8 and Sentinel-2 were considered for analysing the zones of true positive fires. According to [29], the peatland fires propagation can be approximated at 1.3 m/min. This value was then multiplied by the time difference between acquisition of Landsat-8 and Sentinel-2 to estimate the potential spread of peatland fires between the observations. Thus, fire pixels located in the zone of geometric error plus the zone of peat fire propagation from the true positive fires were counted as spatially related true positive fire pixels. Others fire features from higher spatial resolution images, e.g., Google Earth and PlanetScope were also used to confirm any indication of fires or false detections.

4. Results

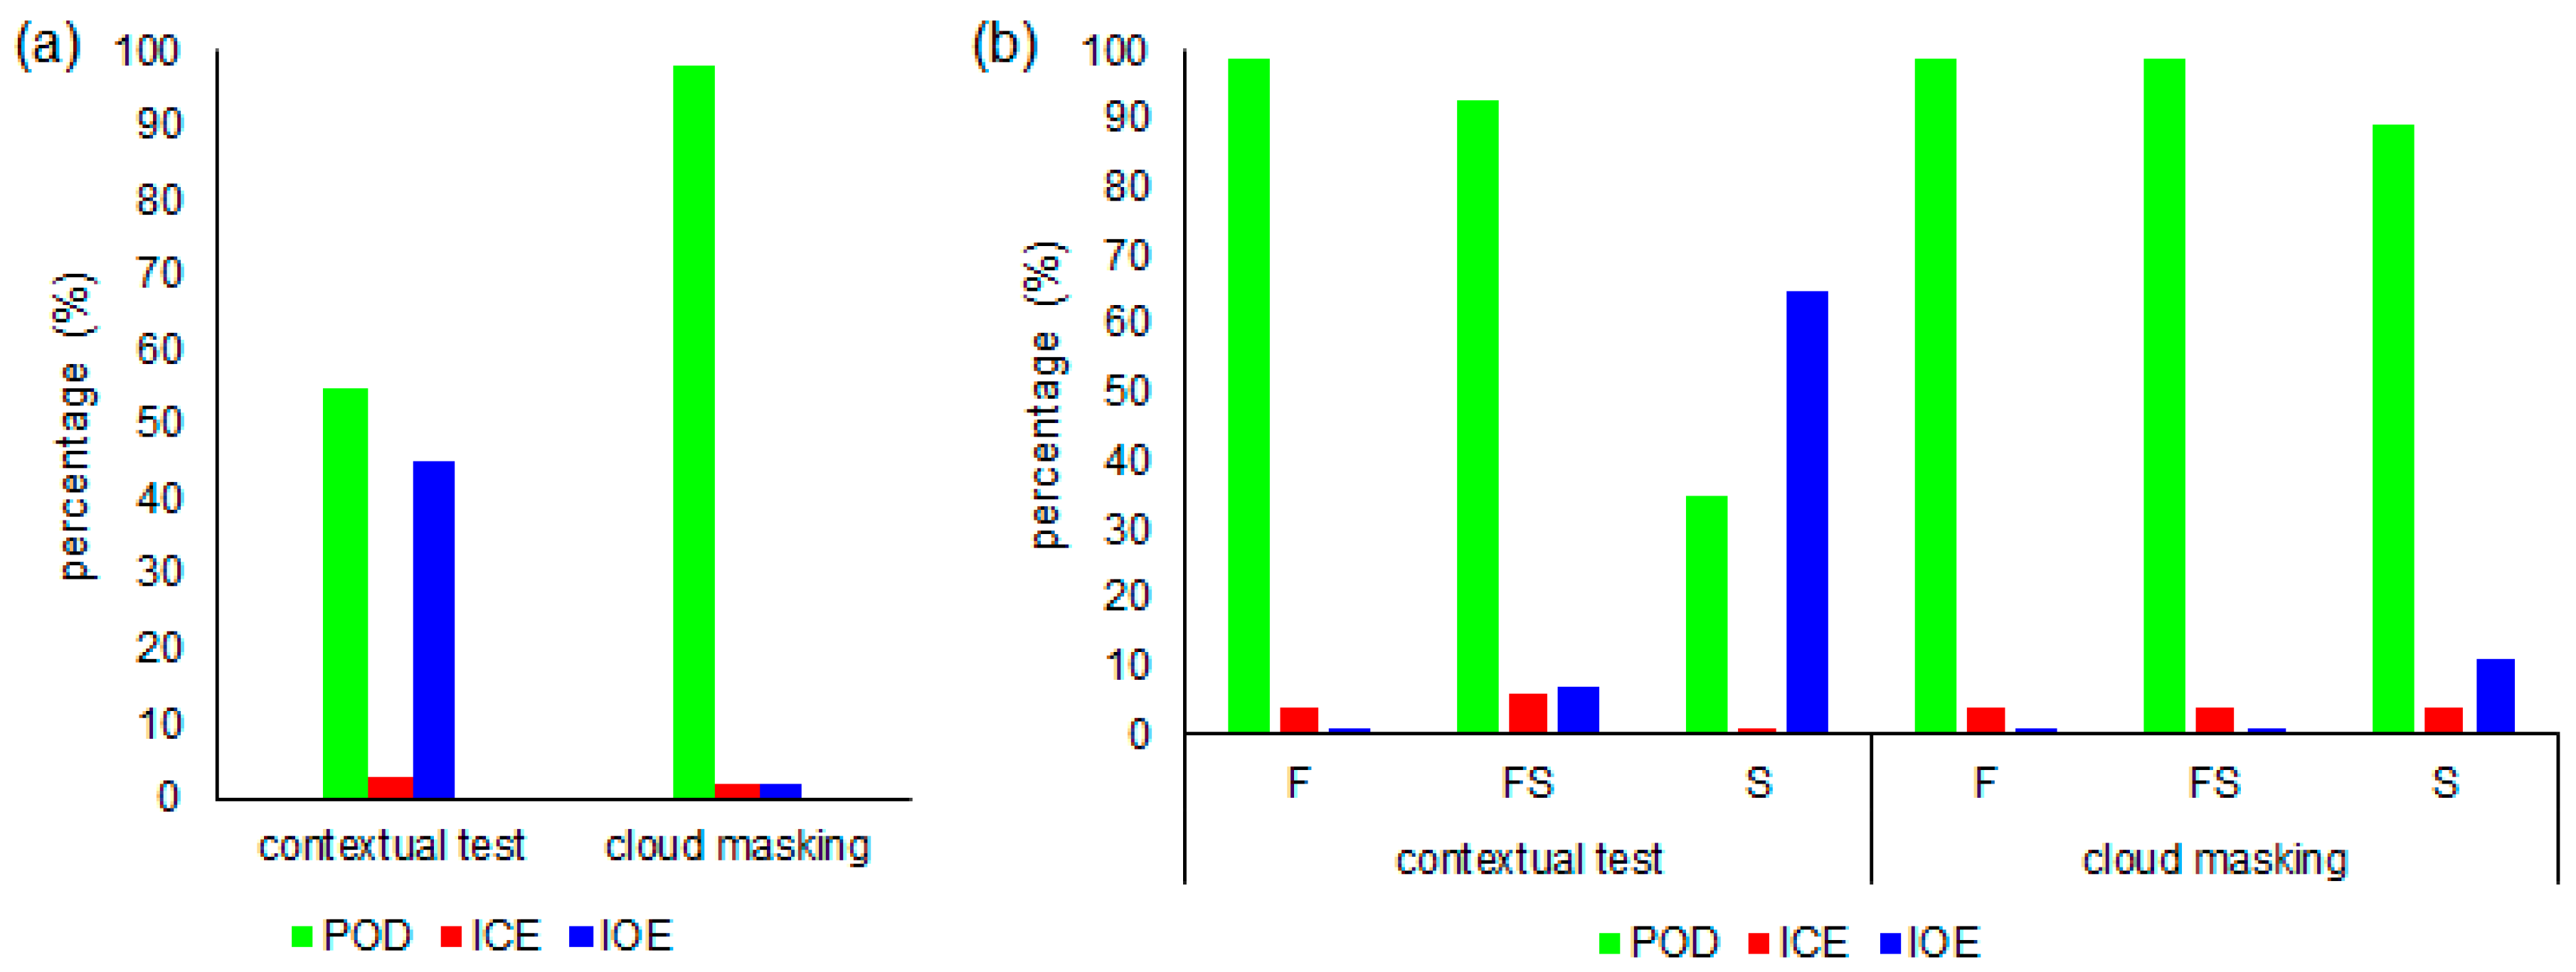
4.1. Statistical Comparison of ToPeCAl-2 Applied to Landsat-8 OLI and ToPeCAl-1 Applied to Landsat-8 OLI/TIRS

ToPeCAl-1 and ToPeCAl-2 was applied to about 609 million pixels from fifteen Landsat-8 OLI/TIRS images. Figure 9a shows POD of ToPeCAl-2 with contextual test and cloud masking provided 55% and 98%, respectively. The percentage of independent commission errors (ICE) from ToPeCAl-2 with contextual test and ToPeCAl-2 with cloud masking were low (≤3%). Meanwhile, a high independent omission error (IOE) resulted from ToPeCAl-2 with contextual test (45%). Low of IOE resulted from ToPeCAl-2 with cloud masking (2%). Detail statistical values can be found in Appendix A-Table A1.
Figure 9b shows the comparison of ToPeCAl-1 and ToPeCAl-2 from two approaches in three classes of peatland fires. Both of F and FS pixels resulting from ToPeCAl-2 with either contextual test or cloud masking provided high POD (93–99%). Meanwhile, the accuracy of detection of smouldering pixels from ToPeCAl-2 with contextual test was less than from ToPeCAl-2 with cloud masking. The POD of smouldering pixels from ToPeCAl-2 with contextual test was only 35% with IOE of 65%. Referring to the result shown in Figure 9a, the low POD of ToPeCAl-2 with contextual test was related to the poorer detection of smouldering pixels, as shown in Figure 9b. Detailed statistical values of this comparison can be found in Appendix A-Table A2.
Figure 10 shows an example comparing the results of ToPeCAl-2 from the two approaches compared to ToPeCAl-1 in Riau’s peatland. There are obvious fires features visually shown in orange to yellow tones in the false composite of RGB Landsat-8 image (Figure 10a) and Figure 10b shows the fire areas resultant from ToPeCAl-1 as the fire reference. ToPeCAl-2 with contextual test (Figure 10c) resulted in less true positive (TP) pixels than from ToPeCAl-2 with cloud masking (Figure 10d). The TP from ToPeCAl-2 with contextual test which are shown in red colour were general spatially correlated with flaming pixels from ToPeCAl-1 (Figure 10b), while the TP from ToPeCAl-2 with cloud masking (Figure 10d) corresponds to all the fires in ToPeCAl-1. Figure 10e is the natural RGB composite of PlanetScope data with spatial resolution of 3.7 m about 11 min before Landsat-8 observation on 29 August 2019. Fire features cannot be displayed from the natural RGB image of PlanetScope, but smoke as an indication of fires, shown from this RGB image, confirmed peatland fires detected by ToPeCAl-1 and ToPeCAl-2. An enlarged area (red square) of burning peatlands on PlanetScope image was made and overlaid with fires resulting from ToPeCAl-2 with contextual test (Figure 10f) and ToPeCAl-2 with cloud masking (Figure 10g). Most of FN pixels from ToPeCAl-2 with contextual test (Figure 10f) were in the area of burning peatlands with smoke features in Figure 10h. Meanwhile, Figure 10i shows PlanetScope image at the same area with Figure 10h after three days on 1 September 2019. Some of the burnt areas in dark tones were covered by smoke which could be sourced from smouldering peatlands or surrounding areas. However, based on the experience observed during ground truth and drone mapping in Central Kalimantan, the burnt peatlands were still emitting smoke after 2–3 days [27].

4.2. Relationship Between Top of Atmosphere (TOA) Reflectance of Landsat-8 and Sentinel-2 for Aerosol and SWIR Bands

The number of pixel pairs for TOA reflectance values comparison between Landsat-8 and Sentinel-2 ranged between two million and 27.7 million. The aerosol band showed high variability in regression slope values with the lowest value at 0.14 in Jambi and South Sumatera sites and the highest value at 1.07 in a Central Kalimantan site. The data pairs with weak relationships for the aerosol bands also experienced lower R2 values in the SWIR-1 and SWIR-2 bands compared with the higher R2 data for other regressions. Each data pair with higher R2 values (greater than 0.70 at SWIR-2) were merged into one data set with 58.7 million pairs of pixels and analysed with OLS regression. The merged data provided 0.66, 0.78, and 0.83 for R2 at aerosol, SWIR-1, and SWIR-2 bands, respectively. The results of OLS these regression analyses were significant at p-values < 0.001. The statistical values can be found in Appendix A-Table A3.
Table 6 summaries the t-test statistic resulting from the mean differences between TOA reflectance of Landsat-8 OLI and TOA reflectance of Sentinel-2 MSI with transformation and no transformation at aerosol, SWIR-1 and SWIR-2 bands. In general, the Sentinel-2 TOA reflectance values with transformation and no transformation were slightly greater than Landsat-8 OLI. The mean difference of TOA reflectance from the two sensors with no transformation at aerosol, SWIR-1, and SWIR-2 bands were 0.0045, 0.0171, and 0.0086, respectively with p-values < 0.001 indicating statistical significance. Meanwhile, the mean differences of the transformed TOA reflectance values of Sentinel-2 MSI sourced from the merged OLS model and the local OLS model with the TOA reflectance of OLI were lower than the mean difference resulting from Sentinel-2 TOA reflectance with no transformation.

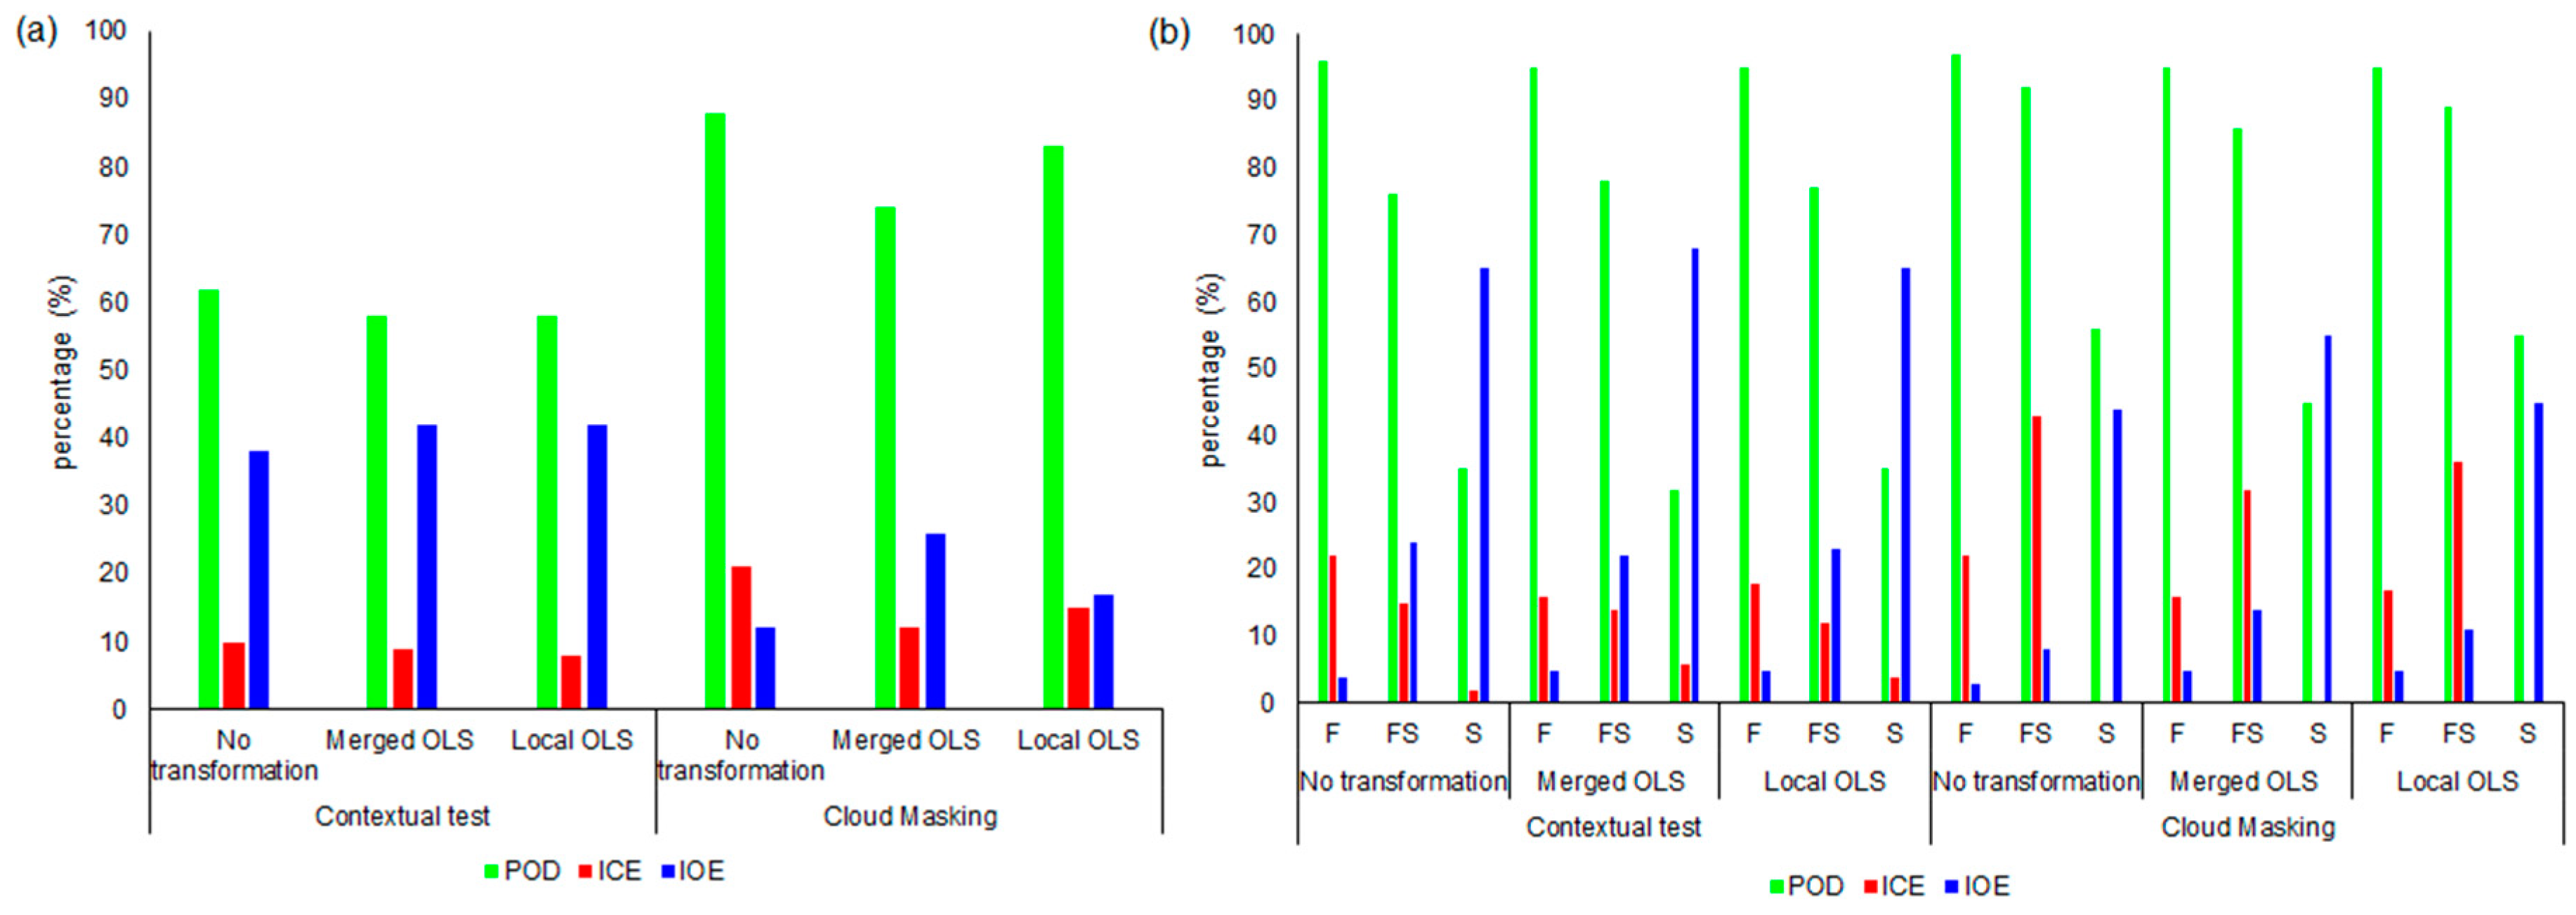
4.3. Implementation and Comparison of ToPeCAl-2 Applied to Sentinel-2 MSI

As mentioned in Table 4 only four of the nine pairs of data sets were found with fire features on both Sentinel-2 and Landsat-8 images. ToPeCAl-2 with contextual test and ToPeCAl-2 with cloud masking were applied to more than 128 million pixels of Sentinel-2 MSI at 20 m spatial resolution. Figure 11a shows the performance of ToPeCAl-2 fires resultant from Sentinel-2 MSI compared with the ToPeCAl-1 fires of Landsat-8 OLI/TIRS. Based on the three OLS transformation models, the highest POD resulted from no transformation value for both ToPeCAl-2 with contextual test and ToPeCAl-2 with cloud mask. Overall, the POD of ToPeCAl-2 with cloud mask (88%) was higher than ToPeCAl-2 with contextual test (62%). However, ToPeCAl-2 with cloud mask showed a higher independent commission error (ICE) and a lower independent omission error (IOE) than ToPeCAl-2 with contextual test. The ICE of ToPeCAl-2 with cloud masking and contextual test from the no transformation model were 21% and 10%, while the IOE were 12% and 38%, respectively. Detailed statistical values can be found in Appendix A-Table A4.
To distinguish the origin of classes of fire in ICE and IOE pixels, Figure 11b presents the ToPeCAl fires comparison shown in Figure 11a in the three peatland fires classes, i.e., flaming, mix of flaming and smouldering (FS) and smouldering. Flaming pixels were well detected (≥95%) in ToPeCAl-2 from either ToPeCAl-2 with contextual test or ToPeCAl-2 with cloud masking. About 76–78% of FS pixels from ToPeCAl-2 with contextual test agreed with ToPeCAl-1, while 86–97% of FS pixels were found from ToPeCAl-2 with cloud masking. Smouldering pixels were less well-detected (32–56%) from both ToPeCAl-2 with highest detection from ToPeCAl-2 with cloud masking (56%). The ICE shows the highest error percentage in flaming or FS pixel, while IOE was high in smouldering pixel. Detail statistical values can be found in Appendix A-Table A5.
In general, Figure 11 shows a lower smouldering pixel detection and a higher FS or flaming detection from ToPeCAl-2. ToPeCAl-2 with cloud masking showed a higher peatland fire detection for overall fires, but with higher false positive pixels in FS or flaming fire and lower false negative pixels in smouldering fire. Whilst ToPeCAl-2 with contextual test was likely to have lower false positive pixels in FS fire but, higher false negative in smouldering fire.
Figure 12 shows an example of the comparison of ToPeCAl-2 fires resulted from Sentinel-2 image with ToPeCAl-1 fires resulted from Landsat-8 image in Central Kalimantan. The Sentinel-2 image was acquired nine minutes before the Landsat-8 image. The RGB composite of SWIR-2, SWIR-1 and Red bands was applied to Landsat-8 image (Figure 12a) and to the Sentinel-2 image (Figure 12b) to enhance the fire features under heavy smoke conditions; fires cannot be seen in the natural RGB composite as shown in Figure 12c. Figure 12d,e show fires resultant from ToPeCAl-2 with contextual test and ToPeCAl-2 with could masking applied to Sentinel-2 image, respectively. True positive (TP) fire pixels are shown in red colour in most of the fire areas. A boundary of spatially related-false positive fires (RFP) is shown in black bordered squares and spatially related-false negative fires (RFN) in cyan bordered squares shown adjacent to the true positive fires. Some of these RFP/RFN were within the distance of the geometric error from both Sentinel-2 and Landsat-8 and within the boundary of peatland fires propagation which was based on estimates from the previous research [29] at 1.3 m/m horizontally. These RFP and RFN pixels were counted as the true positive pixels. In Figure 12d, some ToPeCAl-2 fires with contextual test remained as false negative (FN) pixels in blue colour while from ToPeCAl-2 with cloud masking some of these FN pixels were classified as true positive pixels (red colour) in Figure 12e. An enlargement of fires area which classified as FN from ToPeCAl-2 with contextual test and TP from ToPeCAl-2 with cloud masking is presented in the PlanetScope image with natural colour composite (Figure 12f) on the same day with Sentinel-2 and Landsat-8. PlanetScope images have a higher spatial resolution (3.7 m) than Sentinel-2 but SWIR is not available in PlanetScope. However, it can show smoke as an indication of fires, as illustrated in Figure 12f.
Another example in smaller peatland fires (about 104 ha) is presented in Figure 13. Peatland fires started with bluish smoke emanating from ground in the false colour composite of Sentinel-2 image (Figure 13a) and pixels detected as fire from ToPeCAl-2 with contextual test and ToPeCAl-2 with cloud masking in Figure 13b,c, respectively. The FN areas (blue colour) in Figure 13b,c correspond to the dark area with smoke shown by PlanetScope image on Figure 13d. The PlanetScope image was acquired three minutes after Sentinel-2 acquisition. Some smoke emanates from dark burning peatland and is one of the characteristics of smouldering peatlands which were observed in the field. The RFP and RFN fire pixels showed adjacent to TP areas resultant from ToPeCAl-2 corresponded to smoke features from the ground in PlanetScope image (Figure 13d). The RFN/RFP pixels adjacent to TP fires were classified as FS and smouldering pixels from ToPeCAl-1 of Landsat-8. The FS and smouldering pixels surrounding unambiguous fire pixels were found by [54] in their field experiment in Central Kalimantan’s peatland. Peatland fires (smouldering or FS fires) were found at 20–30 m distance surrounding the front line of the burning area due to lateral propagation of smouldering fires at <20 cm depth as described in Figure 13e. This scheme for peatland fires propagation supports the results of ToPeCAl fires detection.

5. Discussion

5.1. Comparison and Adjustment of ToPeCAl-2 to Landsat-8 OLI

The comparison and adjustment of ToPeCAl without TIR (ToPeCAl-2) was conducted in order to explore the potential of this algorithm for the detection of tropical peatland fires using Sentinel-2 MSI data. An initial test was accomplished by implementing ToPeCAl-2 compared with ToPeCAl-1 on the same source of Landsat-8 data. In this study, ground truth to validate the ToPeCAl-2 fires performance were not conducted; however, ToPeCAl-1 was validated by ground truth data and provided 82% accuracy which can be improved by removing permanent bright objects [27]. Although ToPeCAl-1 has SWIR and TIR to support peatland fire mapping, the spatial resolution of TIR in Landsat-8 is quite low to observe small peatland fires, often in mixed pixels which contain heterogeneous objects. However, smouldering pixels resultant from ToPeCAl-1, which are located adjacent to or surrounding unambiguous fire, may be considered as the true smouldering peatland. Smouldering is a very persistent type of combustion, which is relatively easy to commence and difficult to suppress [7] and its residual can last for days after flaming fires pass over [56]. Smouldering and flaming peatland fires can lead to one other, however, when the oxygen supply increases, as occurs with an increase in wind velocity, combustion becomes faster, temperature increases and a flaming state may eventuate [7,8]. Other than that, from field experiment, [54] found that smouldering peatlands were found in surrounding or adjacent un-slashed areas to the burning peatland. The information gained from laboratory and field experiments [7,8,49,52] for peatland fire characteristics support the interpretation of peatland fires resultant from satellite.
In addition, for confirming of ToPeCAl-2 fire detections, some verification occurred by observing the state of smoke emanating from fire areas which are shown in natural RGB images from PlanetScope on the same day with Landsat-8/Sentinel-2 as shown in Figure 10, Figure 12 and Figure 13. However, some of the smouldering or FS pixels detected by ToPeCAL-2 were difficult to be verified using specific smoke features in a generally smoky atmosphere, which can influence the quality of radiometry of PlanetScope RGB images. Further investigation on the radiometry of smoke features can potentially support the validation of ToPeCAl-2 for mapping peatland fires.
In this study, the adjustments of ToPeCAl were performed by adding a pre-processing for water masking, permanent bright object masking and performing some filtering methods on ToPeCAl-2 results, i.e., contextual test and cloud masking. ToPeCAl-2 with contextual test examining FS and smouldering fire pixels was compared to their background statistics using mean and standard deviation in 61 × 61 pixel window. In this contextual test, high confidence fire pixels were adopted from previous literature [37,38,40] by using statistical values of mean+3σ or 99.7% of confidence level for active fire detection. The fire pixels that passed this contextual test were highly likely to be active fire or flaming fire. Peatland fires particularly smouldering fire has lower combustion power and low temperature which is significantly different with flaming fires. A lower confidence level, e.g., 95% (mean+2σ) or 68% (mean+σ) for the background statistic can be tested to cover low confidence fires such as smouldering peatland fires. However, ToPeCAl-2 depends only on SWIR for detecting peatland fires, thus it may be possible to generate more false positive smouldering pixels by lowering the confidence level, for example, in burnt areas. Additional analysis such as smoke detection and analysis for smouldering peatland can be added to confirm smouldering fire pixels. In this study, ToPeCAl-2 with contextual test applied to Landsat-8 OLI provided low detection (55%) of fires compared with ToPeCAl-1 fires. From the results comparison using peatland fires types derived from ToPeCAl-1, the missed detection of ToPeCAl-2 with contextual test was for smouldering fire at about 45%. Flaming and FS fire pixels were well detected by ToPeCAl-2 with contextual test (≥93%).
A second approach was conducted by implementing cloud mask to ToPeCAl-2 fires. Initial assessment of ToPeCAl-2 fires compared with RGB image of Landsat-8 using visual analysis showed that false positive pixels occurred in cloud and at the edge of cloud. These false positive pixels were from FS and smouldering fire pixels detected by ToPeCAl-2. Thus, the cloud mask was only applied to FS and smouldering pixels, while unambiguous fire pixels (flaming and close to saturated flaming) were classified as true fire pixels. Dense cloud with highly reflective aerosols tends to brighten the cloud [67] which might be classified as false detection in ToPeCAl-2. The uncertainty in observation on the edge of cloud is commonly termed “cloud adjacency effects” or “3-D radiative effects”. These can increase the reflectance around the edge of cloud with an increase of aerosol properties [62,63,64]. The cloud adjacency effect has also exhibited as a problem in other optical remote sensing applications, e.g., ocean monitoring [68] and atmospheric monitoring [62,64]. The results of ToPeCAl-2 with cloud mask provided higher percentage of peatland fire detection (98%) because only FS and smouldering pixels occurring in cloud areas were removed as fire pixels. Lower counts of false positive and false negative pixel resulted from this model. Most of FS and smouldering pixels that passed cloud masking were located in areas surrounding true positive fire pixels. However, the smouldering pixels resultant from ToPeCAl-2 may include false positive pixels in burnt areas as they have similar SWIR reflectance as shown in Figure 5.
Although most permanent bright objects pixels were excluded in ToPeCAl-2 by implementing bright object masking, it is still possible to have some of them generate false positive pixels in ToPeCAl-2′s results. Undetected bright objects were potentially due to the mixture of reflectance with other dominant objects (e.g., soil and vegetation in one-pixel area) and some of the rooftops had lower SWIR reflectance than the threshold used (<0.18). Most of the mining areas identified as false positive pixels also exhibited mixed reflectance with some dark soils, thus resulting in lower reflectance than the threshold for bright object masking. Some miss-detection of mining areas was possible due to their typical landscape which often consists of open-cut quarries which generate deep shadows leading to a decrease in reflectance. However, the state of the particular mining landscapes in this research requires further checking with very high spatial resolution data (for example Geo-eye, World-View 4 or SkySat). The removal of false positives related to mining areas and industrial gas flares can also be assisted via the use of other data sources, such as the record of location of registered mining areas and industrial gas flares from government agencies.

5.2. Relationships between TOA Reflectance of Sentinel-2 and Landsat-8 at Aerosol and SWIR bands

There was a significant difference of the mean values between TOA reflectance of Sentinel-2 and Landsat-8 at aerosol, SWIR-1, and SWIR-2 bands in the study areas. The mean differences of TOA reflectance from the two sensors at SWIR bands found in this study were slightly higher than the mean difference resulting from previous research in the Conterminous United States and southern Africa [41,45]. There was a lack of consistent relationship found in aerosol band which was also reflected at SWIR-1 and SWIR-2 bands. Conversely, good relationships of TOA reflectance at SWIR-1 and SWIR-2 bands were associated with a good relationship at aerosol band at other locations and times. The data resampling from lower to higher spatial resolution applied to aerosol band of Sentinel-2 and Landsat-8 could possibly influence the poorer relationship between both sensors at the aerosol band. Moreover, in this study sensor to sensor relationship analysis was conducted based on a linear empirical model, whereas the pre-launch relative spectral response of Landsat-8 and Sentinel-2, at mid spatial resolution, particularly in the aerosol band (Figure 8), shows obvious sensitivity differences of signal across the wavelength range. The atmospheric conditions, e.g., moist or dry, also influence the spectral response of SWIR [60]. The variability in coefficients from OLS modelling, suggests that corrections from TOA reflectance of Sentinel-2 to Landsat-8 should not be applied in ToPeCAl, as the modelling exhibits too much uncertainty. However, the subtle differences in band sensitivities between Sentinel-2 and Landsat-8 might be significant for other applications.
The atmospheric conditions in the tropics can be an important factor which influences the relationship of TOA reflectance between Sentinel-2 and Landsat-8, although the environments, season, and geographic location may also affect the relationships. Another aspect to consider is the cloud product of Sentinel-2 data which is generated from Sen2COR [65]. This might generate uncertainty in providing a clear image due to a lack of thermal data that can impact the approach and efficacy of cloud masking [61,69], particularly in tropical atmospheres. The influence of terrestrial environments, such as vegetation types, seasons, and an improvement of cloud masking product in tropical environments can be investigated further for relating the TOA reflectance of Sentinel-2 and Landsat-8.

5.3. The Application of ToPeCAl-2 to Sentinel-2 Data

The results of ToPeCAl-2 were not sensitive to the effects of TOA reflectance correction from Sentinel-2 to Landsat-8. Thus, ToPeCAl-2 with no transformation value can be applied to Sentinel-2 MSI. General results for peatland fires pattern resultant from ToPeCAl-2 applied to Landsat-8 were also found in ToPeCAl-2 applied to Sentinel-2. ToPeCAl-2 applied to Sentinel-2 with cloud masking provided higher detection for overall peatland fires with POD of 88%, ICE of 21% and IOE of 12%. Meanwhile, ToPeCAl-2 with a contextual test provided lower POD (62%), but with lower ICE (10%) and higher IOE (38%). The results also showed that smouldering fires were less likely to be detected from ToPeCAl-2 applied to Sentinel-2 data, but flaming pixels were well detected. Although ToPeCAl-2 with cloud masking resulted lower IOE than ToPeCAl-2 with contextual test, especially for smouldering pixels, validation still needs to be investigated for those smouldering pixels which may contain false detection in burnt areas. Meanwhile, the false positive pixels from ToPeCAL-2 might be the result from another fire at a different time of observation or un-detected bright object pixels. The POD values from the comparison of two fires produced from Sentinel-2 and Landsat-8 were presented in order to illustrate the strong similarity of fire pattern and the existence of fire for a certain time difference. Thus, they can be utilised together to fill temporal gaps in detailed fire spatial information.
The choice of using ToPeCAl-2 with contextual test or ToPeCAl-2 with cloud masking is dependent on the purpose for obtaining the peatland fires information. Users who are dealing with fire extinguishment may utilise ToPeCAl-2 fires from contextual test which provided high confidence of flaming detection. For users who work in peatland rehabilitation or carbon loss inventory from peatland fires, then the fire product from ToPeCAl-2 with cloud masking can be considered. However, smouldering resulting from ToPeCAl-2 especially from cloud masked approach still needs further validation. One should also consider the advantages and the limitation of both ToPeCAl-2 models.
The application of ToPeCAl without TIR to Sentinel-2 MSI and relying on SWIR to detect fires in tropical peatland environments is possible, but may present with false positives related to bright objects and warm soil due to the contamination of sun radiation on SWIR reflectance during daytime. Smouldering peatlands can also be confirmed by observation of smoke over smouldering surfaces; a process which can be explored in further research. Overall, without MIR or TIR, ToPeCAl has a weaker detectability of smouldering peatland which is important for carbon emission estimations. This constraint introduces a future challenge to provide a sensor, or constellation of sensors incorporating MIR/TIR with similar, or better, temporal and spatial resolution specifications to Sentinel-2 to improve peatland fire monitoring; for example the Copernicus High Spatio-Temporal Resolution Land Surface Temperature Mission – LSTM mission which is planned by European Space Agency for future earth observation in 2025 [70].

6. Conclusions

A new technique for peatland fires detection in tropical peatland environments has been established using Landsat-8 OLI and Sentinel-2 MSI data in this study. ToPeCAl-2 (ToPeCAl without TIR) applied to Sentinel-2 MSI generates reliable results for fire detection at 20 m resolution especially for flaming and mix of flaming and smouldering with less smouldering detection. Furthermore, it can be combined with the use of ToPeCAl-1 to fill in the peatland fires information gaps at Landsat-8 spatial resolution (30 m) for tropical environment conditions, e.g., Indonesia. ToPeCAl-2 and ToPeCAl-1 has similar capability on detecting flaming fires (>95%) in tropical peatland environments. Smouldering peatlands detected by ToPeCAl-2 were only 35–56% correct, which still may include false detection in warm soil or burnt areas. ToPeCAl-2 with contextual test provides less detection of smouldering pixel than ToPeCAl-2 with cloud-masked approach. To further extend these smouldering results, especially from ToPeCAl with cloud-masked, requires further investigation and ground validation.
Adjustments to eliminate the false positive fires pixels were applied to ToPeCAl-2 to enhance its performance. It is important for tropical peatland fires management, with limited resources, to support a priority to extinguish actual biomass fires, which extend over large areas, rather than send resources to incorrectly identified fires.
In relating peatland fires products from Sentinel-2 and Landsat-8 at different times certain aspects were also examined, including the geometric errors between the two sensors, spectral response, and the propagation of fires between images captured at different times. The subtle differences in the spectral response of Landsat-8 and Sentinel-2 were less significant for fire detection, possibly due to specific local atmospheric conditions which can interfere with TOA reflectance in tropical environments.
There is a high potential to apply ToPeCAl-2 to Sentinel-2 MSI for operational peatland fires monitoring especially for flaming conditions, together with ToPeCAl-1 applied to Landsat-8 OLI/TIRS, leading to a higher temporal monitoring frequency than currently available from a single sensor alone. An integration with lower spatial resolution fire products from VIIRS 375 m data will also complement peatland fires monitoring on daily basis.

Author Contributions

The research was designed and conceptualised by P.S., D.B., and E.J. Data processing and analysis by P.S. supervised by D.B. and E.J. Principal Supervision by D.B. Paper writing by P.S. with review and editorial advice from D.B., E.J., M.R.K., and O.R. All authors have read and agreed to the published version of the manuscript.

Funding

This research received no external funding and the APC was funded by Remote Sensing Applications Center of Indonesian National Institute of Aeronautics and Space (LAPAN).

Acknowledgments

This research was supported by Ministry of Research and Technology/National Research and Innovation Agency of the Republic of Indonesia (Kementerian Riset dan Teknologi/Badan Riset dan Inovasi Nasional) under the Research and Innovation in Science and Technology Project (RISET-Pro) from World Bank Loan No. 8245-ID, and Science, Technology, Engineering and Mathematics (STEM) of the University of South Australia. We would like to thank the reviewers for their constructive comments on our manuscript.

Conflicts of Interest

The authors declare no conflict of interest.

Appendix A

Table A1. Statistical comparison of ToPeCAl-2 to ToPeCAl-1 applied to Landsat-8 images data based on contextual test and cloud masking approach. The comparison was for one class of fire and ToPeCAl-1 was the reference fire data. Column a to h are the summation values from 15 datasets of Landsat-8. False positive and false negative pixels consisted of fires spatially related to true positive fires—called related false positive/negative (RFP/RFN) and independent false positive/negative (IFP/IFN) pixels. The RFP pixels were the fire pixels that were adjacent to the true positive fire pixels within a one pixel outer buffer; they were considered not to be counted as commission errors calculation and can be classified as true positive pixels. Likewise, the RFN pixels for omission error. (TN = True Negative; TP = True Positive; FP = False Positive; RFP = Related False Positive; IFP = Independent False Positive; FN = False Negative; RFN = Related False Negative; IFN = Independent False Negative; POD = Probability of Detection, ICE = Independent Commission Error, IOE = Independent Omission Error).
MethodTN (Pixel)TP (Pixel)FP (Pixel)RFP (Pixel) *IFP (Pixel)FN (Pixel)RFN (Pixel) *IFN (Pixel)POD (%)ICE (%)IOE (%)
(a)(b)(c) (d)(e)(f)(g)(h)
Contextual 609,216,24337,0412551606194563,12417,91545,20955345
Cloud masking609,216,38396,847241383115823312147718359822
* spatially adjacent to the true positive fire pixels; IFP = c−d; IFN = f−g; POD = ( b + d + g b + d + g + h ) ; ICE = ( e b + d + g + e ) ; IOE = (100−POD).
Table A2. As per Table A1 but showing the comparison of fire classes, i.e., flaming (F), smouldering (S), and mix of flaming and smouldering (FS).
MethodTN (pixel)Fire ClassesTP (Pixel)FP (Pixel)RFP (Pixel) *IFP (Pixel)FN (Pixel)RFN (Pixel) *IFN (Pixel)POD (%)ICE (%)IOE (%)
(a)(b)(c) (d)(e)(f)(g)(h)
Contextual609,216,245F11,971871301570252167859941
FS13,842137429110832945182311229367
S78423061429259,92515,92544,00035165
Cloud mask609,216,383F11,9718713225492521381149941
FS17,18711294576726184891299941
S65,4814134137222861142114489411
* spatially adjacent to the true positive fire pixels; IFP = c−d; IFN = f−g; POD = ( b + d + g b + d + g + h ) ; ICE = ( e b + d + g + e ) ; IOE = (100−POD).
Table A3. Landsat-8 OLI TOA reflectance as a function of Sentinel-2 MSI TOA reflectance at aerosol, SWIR-1, and SWIR-2 bands. Intercept and slope were derived from the ordinary least squares (OLS) regression of total data (n). The coefficients of determination (R2) were significant at p-values < 0.001. The data sites were Central Kalimantan and South Kalimantan (CK-SK), Jambi and South Sumatera (JSS), and Riau.
BandSiteAcquisition DateInterceptSlopenR2
AerosolCK-SK28 September 2018 a0.00220.929727,701,8210.8585
14 August 20190.03500.77694,012,7590.5439
6 September 2019−0.00711.07637,656,7630.5784
JSS21 August 2018 b0.02950.785327,540,9360.5553
31 August 20190.09280.14272,705,6350.1242
13 September 20180.04570.349712,913,9440.1642
Riau16 April 2019 c0.00500.63784,785,8800.4004
9 May 20190.07920.365211,602,2090.1379
28 July 20190.08500.29512,689,8920.0642
CK-SK, JSS and Riau (merged data a,b,c)28 September 2018 a,
21 August 2018 b,
16 April 2019 c
0.01690.850958,716,8430.6619
SWIR-1CK-SK28 September 2018 a−0.00430.887827,701,8210.8669
14 August 2019 −0.00410.92994,012,7590.8856
6 September 20190.01640.85527,656,7630.7647
JSS21 August 2018 b0.01930.851627,540,9360.7769
31 August 20190.06540.27172,705,6350.4016
13 September 20180.02950.426112,913,9440.6305
Riau16 April 2019 c0.03050.72134,785,8800.6091
9 May 20190.06810.580811,602,2090.4267
28 July 20190.06380.33162,689,8920.4026
CK-SK, JSS and Riau (merged data a,b,c)28 September 2018 a,
21 August 2018 b,
16 April 2019 c
0.01310.840458,716,8430.7856
SWIR-2CK-SK28 September 2018 a0.00040.855327,701,8210.8649
14 August 2019 −0.00020.89684,012,7590.8846
6 September 20190.00590.87107,656,7630.8099
JSS21 August 2018 b0.00640.877627,540,9360.8261
31 August 20190.01700.32982,705,6350.5879
13 September 20180.01080.445912,913,9440.7337
Riau16 April 2019 c0.00890.77714,785,8800.7094
9 May 20190.02220.661911,602,2090.5070
28 July 20190.02460.36802,689,8920.4148
CK-SK, JSS and Riau (merged data a,b,c)28 September 2018 a,
21 August 2018 b,
16 April 2019 c
0.00410.854958,716,8430.8318
Table A4. Statistical comparison of fires resultant from ToPeCAl-2 with contextual test and ToPeCAl-2 with cloud masking applied to Sentinel-2 MSI compared with fires resultant from ToPeCAl-1 applied to Landsat-8 OLI/TIRS images. The comparison was for one class of fire. The TOA reflectance used in ToPeCAl-2 were with no transformation values and with transformation values from the merged OLS model and local OLS model. (TN = True Negative; TP = True Positive; FP = False Positive; RFP = Related False Positive; IFP = Independent False Positive; FN = False Negative; RFN = Related False Negative; IFN = Independent False Negative; POD = Probability of Detection, ICE = Independent Commission Error, IOE = Independent Omission Error).
MethodTN (Pixel)TP (Pixel)FP (Pixel)RFP (Pixel) *IFP (Pixel)FN (Pixel)RFN (Pixel) *IFN (Pixel)POD (%)ICE (%)IOE (%)
(a)(b)(c) (d)(e)(f)(g)(h)
ToPeCAl-2 with Contextual test
No transformation128,855,17722,66494224578484446,92318,43428,489621038
Merged OLS 128,541,53419,00282794202407750,98519,45731,52858942
Local OLS128,552,02019,63274353675376050,46019,64830,81258842
ToPeCAl-2 with Cloud Masking
No transformation128,909,37838,16929,01310,50518,50831,93722,3669571882112
Merged OLS128,921,72329,54715,6347878775640,53020,44320,087741226
Local OLS 128,913,90136,11823,45611,82711,62933,95919,88214,077831517
* spatially adjacent to the true positive fire pixels; IFP = c−d; IFN = f−g; POD = ( b + d + g b + d + g + h ) ; ICE = ( e b + d + g + e ) ; IOE = (100−POD).
Table A5. As per Table A4 but showing the comparison of fire classes, i.e., flaming (F), smouldering (S), and mix of flaming and smouldering (FS).
MethodTN (Pixel)Fire ClassesTP (Pixel)FP (Pixel)RFP (Pixel) *IFP (Pixel)FN (Pixel)RFN (Pixel) *IFN (Pixel)POD (%)ICE (%)IOE (%)
(a) (b)(c) (d)(e)(f)(g)(h)
ToPeCAl-2 with Contextual test
No transformation128,825,338F71025910257233382336190043696224
FS2000300217621240516830692099761524
S132777441136339,79512,88126,91435265
Merged OLS128,541,534F62153720176919513092249759595165
FS1891276815281240592039082012781422
S1053174283890441,87412,15129,72332668
Local OLS128,538,496F62424157185023073229263159895185
FS177123571388969593138812050771223
S1369117756860937,97012,11625,85435465
ToPeCAl-2 with Cloud Masking
No transformation128,905,237F72935763252532382075172634997223
FS293922,98610,43812,54847643225153992438
S----24,75713,80110,95656044
Merged OLS 128,917,292F61983756183619202954238556995165
FS312911,90460805824535332632090863214
S----31,75114,40917,34245055
Local OLS 128,909,701F63014101189222092817231949895175
FS319519,15098529298523432991935893611
S----25,62513,97011,65555045
* spatially adjacent to the true positive fire pixels; IFP = c−d; IFN = f−g; POD = ( b + d + g b + d + g + h ) ; ICE = ( e b + d + g + e ) ; IOE = (100−POD).

References

  1. Page, S.E.; Rieley, J.; Banks, C. Global and regional importance of the tropical peatland carbon pool. Glob. Chang. Biol. 2011, 17, 798–818. [Google Scholar] [CrossRef] [Green Version]
  2. Page, S.E.; Baird, A.J. Peatlands and global change: Response and resilience. Annu. Rev. Environ. Resour. 2016, 41, 35–57. [Google Scholar] [CrossRef]
  3. Carlson, K.M.; Goodman, L.K.; May-Tobin, C.C. Modeling relationships between water table depth and peat soil carbon loss in Southeast Asian plantations. Environ. Res. Lett. 2015, 10, 074006. [Google Scholar] [CrossRef]
  4. Stockwell, C.E.; Jayarathne, T.; Cochrane, M.A.; Ryan, K.C.; Putra, E.I.; Saharjo, B.H.; Nurhayati, A.D.; Albar, I.; Blake, D.R.; Simpson, I.J.; et al. Field measurements of trace gases and aerosols emitted by peat fires in Central Kalimantan, Indonesia, during the 2015 El Niño. Atmos. Chem. Phys. 2016, 16, 11711–11732. [Google Scholar] [CrossRef] [Green Version]
  5. Murdiyarso, D.; Lilleskov, E.; Kolka, R. Tropical peatlands under siege: The need for evidence-based policies and strategies. Mitig. Adapt. Strateg. Glob. Chang. 2019, 24, 493–505. [Google Scholar] [CrossRef] [Green Version]
  6. Huijnen, V.; Wooster, M.J.; Kaiser, J.W.; Gaveau, D.L.A.; Flemming, J.; Parrington, M.; Inness, A.; Murdiyarso, D.; Main, B.; van Weele, M. Fire carbon emissions over Maritime Southeast Asia in 2015 largest since 1997. Sci. Rep. UK 2016, 6, 26886. [Google Scholar] [CrossRef] [Green Version]
  7. Rein, G. Smouldering fires and natural fuels. In Fire Phenomena and the Earth System: An Interdisciplinary Guide to Fire Science; Belcher, C.M., Ed.; Wiley and Sons: Hoboken, New Jersey, USA, 2013; Chapter 2; pp. 15–34. ISBN 978-047-06574-8-5. [Google Scholar]
  8. Rein, G. Smoldering combustion. In SFPE Handbook of Fire Protection Engineering; Hurley, M.J., Gottuk, D.T., Hall, J.R., Jr., Harada, K., Kuligowski, E.D., Puchovsky, M., Torero, J.L., Watts, J.M., Jr., Wieczorek, C.J., Eds.; Springer: New York, NY, USA, 2016; pp. 581–603. [Google Scholar]
  9. Hooijer, A.; Silvius, M.; Woesten, H.; Page, S. Peat-CO2 Assessment of CO2 Emissions from Drained Peatlands in SE Asia; Delft Hydraulics Report Q3943; Delft Hydraulics: Delft, The Netherlands, 2006; p. 41. [Google Scholar]
  10. Joosten, H.; Clarke, D. Wise Use of Mires and Peatlands; International Mire Conservation Group and International Peat Society: Devon, UK, 2002; ISBN 951-97744-8-3. [Google Scholar]
  11. Parish, F.; Sirin, A.; Charman, D.; Joosten, H.; Minayeva, T.; Silvius, M.; Stringer, L. Assessment of Peatlands, Biodiversity, and Climate Change; Global Environment Centre and Wetland International: Kuala Lumpur, Malaysia; Wageningen, The Netherlands, 2008; ISBN 978-983-43751-0-2. [Google Scholar]
  12. Rydin, H.; Jeglum, J.K. The Biology of Peatlands; Oxford University Press: Oxford, UK, 2006; ISBN 9780198528722. [Google Scholar] [CrossRef]
  13. Suyanto, S.; Applegate, G.; Permana, R.; Khususiyah, N.; Kurniawan, I. The role of fire in changing land use and livelihoods in Riau-Sumatra. Ecol. Soc. 2004, 9, 15. [Google Scholar] [CrossRef]
  14. Kobayashi, S.; Segah, H.; Momota, E. Local community safeguard by REDDC and payment for ecosystem services (PES) in peatland. In Tropical Peatland Ecosystems; Osaki, M., Tsuji, N., Eds.; Springer: Tokyo, Japan, 2016; pp. 563–584. ISBN 978-4-431-55680-0. [Google Scholar] [CrossRef]
  15. Rieley, J.; Page, S. Tropical peatland of the world. In Tropical Peatland Ecosystems; Osaki, M., Tsuji, N., Eds.; Springer: Tokyo, Japan, 2016; pp. 3–32. ISBN 978-4-431-55680-0. [Google Scholar] [CrossRef]
  16. Miettinen, J.; Liew, S.C. Connection between fire and land cover change in Southeast Asia: A remote sensing case study in Riau, Sumatra. Int. J. Remote Sens. 2005, 26, 1109–1126. [Google Scholar] [CrossRef]
  17. Boer, R.; Dewi, R.G.; Ardiansyah, M.; Siagian, U.W. Indonesia Second Biennial Update Report, Under the United Nations Framework Convention on Climate Change; Directorate General of Climate Change, Ministry of Environment and Forestry: Jakarta, Indonesia, 2018; ISBN 978-602-51356-8-2.
  18. Global Fire Data. Global Fire Emissions Database. Available online: http://globalfiredata.org/pages/data/ (accessed on 1 July 2020).
  19. Climate Prediction Center, National Oceanic and Atmospheric Administration. Cold & Warm Episodes by Season. Available online: https://origin.cpc.ncep.noaa.gov/products/analysis_monitoring/ensostuff/ONI_v5.php (accessed on 1 July 2020).
  20. Physical Sciences Laboratory, National Oceanic and Atmospheric Administration. Dipole Mode Index. Available online: https://psl.noaa.gov/gcos_wgsp/Timeseries/DMI/ (accessed on 14 September 2020).
  21. Alsepan, G.; Minobe, S. Relations between interannual variability of regional-scale Indonesian precipitation and large-scale climate modes during 1960–2007. J. Clim. 2020, 33, 5271–5291. [Google Scholar] [CrossRef] [Green Version]
  22. Pan, X.; Chin, M.; Ichoku, C.M.; Field, R.D. Connecting Indonesian fires and drought with the type of el niño and phase of the indian ocean dipole during 1979–2016. J. Geophys. Res. Atmos. 2018, 123, 7974–7988. [Google Scholar] [CrossRef]
  23. Bowen, M.R.; Bompard, J.M.; Anderson, I.P.; Guizol, P.; Gouyon, A. Anthropogenic Fires in Indonesia: A View from Sumatra. In Forest Fires and Regional Haze in Southeast Asia; Eaton, P., Radojevic, M., Eds.; Nova Science: New York, NY, USA, 2000; pp. 41–66. [Google Scholar]
  24. Dennis, R.A.; Mayer, J.; Applegate, G.; Chokkalingam, U.; Colfer, C.J.P.; Kurniawan, I.; Lachowski, H.; Maus, P.; Permana, R.P.; Ruchiat, Y.; et al. Fire, people and pixels: Linking social science and remote sensing to understand underlying causes and impacts of fires in Indonesia. Hum. Ecol. 2005, 33, 465–504. [Google Scholar] [CrossRef]
  25. Purnomo, H.; Shantiko, B.; Sitorus, S.; Gunawan, H.; Achdiawan, R.; Kartodihardjo, H.; Dewayani, A.A. Fire economy and actor network of forest and land fires in Indonesia. For. Policy Econ. 2017, 78, 21–31. [Google Scholar] [CrossRef]
  26. Elvidge, C.D.; Zhizhin, M.; Hsu, F.; Baugh, K.; Khomarudin, M.; Vetrita, Y.; Sofan, P.; Suwarsono; Hilman, D. Long-wave infrared identification of smoldering peat fires in Indonesia with nighttime Landsat data. Environ. Res. Lett. 2015, 10, 065002. [Google Scholar] [CrossRef] [Green Version]
  27. Sofan, P.; Bruce, D.; Jones, E.; Marsden, J. Detection and validation of tropical peatland flaming and smouldering using Landsat-8 SWIR and TIRS bands. Remote Sens. 2019, 11, 465. [Google Scholar] [CrossRef] [Green Version]
  28. Siegert, F.; Zhukov, B.; Oertel, D.; Limin, S.; Page, S.E.; Rieley, J.O. Peat fires detected by the BIRD satellite. Int. J. Remote Sens. 2004, 25, 3221–3230. [Google Scholar] [CrossRef]
  29. Atwood, E.; Englhart, S.; Lorenz, E.; Halle, W.; Wiedemann, W.; Siegert, F. Detection and characterization of low temperature peat fires during the 2015 fire catastrophe in Indonesia using a new high-sensitivity fire monitoring satellite sensor (FireBIRD). PLoS ONE 2016, 11, e0159410. [Google Scholar] [CrossRef] [Green Version]
  30. Elvidge, C.D.; Zhizhin, M.; Hsu, F.-C.; Baugh, K. VIIRS nightfire: Satellite pyrometry at night. Remote Sens. 2013, 5, 4423. [Google Scholar] [CrossRef] [Green Version]
  31. Sofan, P.; Bruce, D.; Schroeder, W.; Jones, E.; Marsden, J. Assessment of VIIRS 375 m active fire using tropical peatland combustion algorithm applied to Landsat-8 over Indonesia’s peatlands. Int. J. Digit. Earth 2020. [Google Scholar] [CrossRef]
  32. Burke, C.; Wich, S.; Kusin, K.; McAree, O.; Harrison, M.E.; Ripoll, B.; Ermiasi, Y.; Mulero-Pázmány, M.; Longmore, S. Thermal-drones as a safe and reliable method for detecting Subterranean peat fires. Drones 2019, 3, 23. [Google Scholar] [CrossRef] [Green Version]
  33. Roy, D.P.; Huang, H.; Boschetti, L.; Giglio, L.; Yan, L.; Zhang, H.H.; Li, Z. Landsat-8 and Sentinel-2 burned area mapping—A combined sensor multi-temporal change detection approach. Remote Sens. Environ. 2019, 231, 111254. [Google Scholar] [CrossRef]
  34. Quintano, C.; Fernández-Manso, A.; Fernández-Manso, O. Combination of Landsat and Sentinel-2 MSI data for initial assessing of burn severity. Int. J. Appl. Earth Obs. 2018, 64, 221–225. [Google Scholar] [CrossRef]
  35. García-Llamas, P.; Suárez-Seoane, S.; Fernández-Guisuraga, J.M.; Fernández-García, V.; Fernández-Manso, A.; Quintano, C.; Taboada, A.; Marcos, E.; Calvo, L. Evaluation and comparison of Landsat 8, Sentinel-2 and Deimos-1 remote sensing indices for assessing burn severity in Mediterranean fire-prone ecosystems. Int. J. Appl. Earth Obs. 2019, 80, 137–144. [Google Scholar] [CrossRef]
  36. Fiona, N.; Kudzai Shaun, M.; Blessing, K.; Henry, N.; Monalisa Shingirayi, M. Exploring THE UTIlity of Sentinel-2 MSI and Landsat 8 OLI in burned area mapping for a heterogenous savannah landscape. PLoS ONE 2020, 15, e0232962. [Google Scholar]
  37. Giglio, L.; Csiszar, I.; Restás, Á.; Morisette, J.T.; Schroeder, W.; Morton, D.; Justice, C.O. Active fire detection and characterization with the Advanced Spaceborne Thermal Emission and Reflection Radiometer (ASTER). Remote Sens. Environ. 2008, 112, 3055–3063. [Google Scholar] [CrossRef]
  38. Schroeder, W.; Oliva, P.; Giglio, L.; Quayle, B.; Lorenz, E.; Morelli, F. Active fire detection using Landsat-8/OLI data. Remote Sens. Environ. 2016, 185, 210–220. [Google Scholar] [CrossRef] [Green Version]
  39. Murphy, S.W.; de Souza Filho, C.R.; Wright, R.; Sabatino, G.; Correa Pabon, R. Hotmap: Global hot target detection at moderate spatial resolution. Remote Sens. Environ. 2016, 177, 78–88. [Google Scholar] [CrossRef]
  40. Kumar, S.S.; Roy, D.P. Global operational land imager Landsat-8 reflectance-based active fire detection algorithm. Int. J. Remote Sens. 2018, 11, 154–178. [Google Scholar] [CrossRef] [Green Version]
  41. Chastain, R.; Housman, I.; Goldstein, J.; Finco, M.; Tenneson, K. Empirical cross sensor comparison of Sentinel-2A and 2B MSI, Landsat-8 OLI, and Landsat-7 ETM+ top of atmosphere spectral characteristics over the Conterminous United States. Remote Sens. Environ. 2019, 221, 274–285. [Google Scholar] [CrossRef]
  42. Flood, N. Comparing Sentinel-2A and Landsat 7 and 8 using surface reflectance over Australia. Remote Sens. 2017, 9, 659. [Google Scholar] [CrossRef] [Green Version]
  43. Mandanici, E.; Bitelli, G. Preliminary comparison of Sentinel-2 and Landsat 8 imagery for a combined use. Remote Sens. 2016, 8, 1014. [Google Scholar] [CrossRef] [Green Version]
  44. Shang, R.; Zhu, Z. Harmonizing Landsat 8 and Sentinel-2: A time-series-based reflectance adjustment approach. Remote Sens. Environ. 2019, 235, 111439. [Google Scholar] [CrossRef]
  45. Zhang, H.K.; Roy, D.P.; Yan, L.; Li, Z.; Huang, H.; Vermote, E.; Skakun, S.; Roger, J.-C. Characterization of Sentinel-2A and Landsat-8 top of atmosphere, surface, and nadir BRDF adjusted reflectance and NDVI differences. Remote Sens. Environ. 2018, 215, 482–494. [Google Scholar] [CrossRef]
  46. Irons, J.R.; Dwyer, J.L.; Barsi, J.A. The Next landsat satellite: The landsat data continuity mission. Remote Sens. Environ. 2012, 122, 11–21. [Google Scholar] [CrossRef] [Green Version]
  47. Loveland, T.R.; Irons, J.R. Landsat 8: The plans, the reality, and the legacy. Remote Sens. Environ. 2016, 185, 1–6. [Google Scholar] [CrossRef] [Green Version]
  48. Drusch, M.; Del Bello, U.; Carlier, S.; Colin, O.; Fernandez, V.; Gascon, F.; Hoersch, B.; Isola, C.; Laberinti, P.; Martimort, P.; et al. Sentinel-2: ESA’s optical high-resolution mission for GMES operational services. Remote Sens. Environ. 2012, 120, 25–36. [Google Scholar] [CrossRef]
  49. Barsi, J.A.; Alhammoud, B.; Czapla-Myers, J.; Gascon, F.; Haque, M.O.; Kaewmanee, M.; Leigh, L.; Markham, B.L. Sentinel-2a MSI and Landsat-8 OLI radiometric cross comparison over desert sites. Eur. J. Remote Sens. 2018, 51, 822–837. [Google Scholar] [CrossRef]
  50. Du, Y.; Zhang, Y.; Ling, F.; Wang, Q.; Li, W.; Li, X. Water bodies’ mapping from Sentinel-2 imagery with modified normalized difference water index at 10-m spatial resolution produced by sharpening the SWIR band. Remote Sens. 2016, 8, 354. [Google Scholar] [CrossRef] [Green Version]
  51. Sun, L.; Mi, X.; Wei, J.; Wang, J.; Tian, X.; Yu, H.; Gan, P. A cloud detection algorithm-generating method for remote sensing data at visible to short-wave infrared wavelengths. ISPRS J. Photogramm. Remote Sens. 2017, 124, 70–88. [Google Scholar] [CrossRef]
  52. Caiazzo, F.; Malina, R.; Staples, M.D.; Wolfe, P.J.; Yim, S.H.L.; Barrett, S.R.H. Quantifying the climate impacts of albedo changes due to biofuel production: A comparison with biogeochemical effects. Environ. Res. Lett. 2014, 9, 024015. [Google Scholar] [CrossRef] [Green Version]
  53. Hayasaka, H.; Takahashi, H.; Limin, S.H.; Yulianti, N.; Usup, A. Peat fire occurrence. In Tropical Peatland Ecosystems; Osaki, M., Tsuji, N., Eds.; Springer: Tokyo, Japan, 2016; pp. 377–395. [Google Scholar]
  54. Usup, A.; Hashimoto, Y.; Takashi, H.; Hayasaka, H. Combustion and thermal characteristics of peat fire in tropical peatland in Central Kalimantan, Indonesia. Tropics 2004, 14, 1–19. [Google Scholar] [CrossRef] [Green Version]
  55. Wooster, M.J.; Roberts, G.; Smith, A.M.S.; Johnston, J.; Freeborn, P.; Amici, S.; Hudak, A.T. Thermal remote sensing of active vegetation fires and biomass burning events. In Thermal Infrared Remote Sensing: Sensors, Methods, Applications; Kuenzer, C., Dech, S., Eds.; Springer: Dordrecht, The Netherlands, 2013; pp. 347–390. [Google Scholar]
  56. Santoso, M.A.; Huang, X.; Prat-Guitart, N.; Christensen, E.; Hu, Y.; Rein, G. Smouldering Fires and Soils; CSIRO Publishing: Collingwood, Australia, 2019; p. 382. [Google Scholar]
  57. Xi, Y.; Thinh, N.X.; Li, C. Preliminary comparative assessment of various spectral indices for built-up land derived from Landsat-8 OLI and Sentinel-2a MSI imageries. Eur. J. Remote Sens. 2019, 52, 240–252. [Google Scholar] [CrossRef] [Green Version]
  58. Gorelick, N.; Hancher, M.; Dixon, M.; Ilyushchenko, S.; Thau, D.; Moore, R. Google Earth Engine: Planetary-scale geospatial analysis for everyone. Remote Sens. Environ. 2017, 202, 18–27. [Google Scholar] [CrossRef]
  59. ESA. Sentinel-2 Spectral Response Functions (S2-SRF) COPE-GSEG-EOPG-TN-15-0007, 3.0 ed.; European Space Agency, 2017. Available online: https://earth.esa.int/web/sentinel/user-guides/sentinel-2-msi/document-library/-/asset_publisher/Wk0TKajiISaR/content/sentinel-2a-spectral-responses (accessed on 5 May 2020).
  60. Barsi, J.; Lee, K.; Kvaran, G.; Markham, B.; Pedelty, J. The spectral response of the Landsat-8 operational land imager. Remote Sens. 2014, 6, 10232–10251. [Google Scholar] [CrossRef] [Green Version]
  61. Baetens, L.; Desjardins, C.; Hagolle, O. Validation of Copernicus Sentinel-2 cloud masks obtained from MAJA, Sen2Cor, and FMask processors using reference cloud masks generated with a supervised active learning procedure. Remote Sens. 2019, 11, 433. [Google Scholar] [CrossRef] [Green Version]
  62. Spencer, R.S.; Levy, R.C.; Remer, L.A.; Mattoo, S.; Arnold, G.T.; Hlavka, D.L.; Meyer, K.G.; Marshak, A.; Wilcox, E.M.; Platnick, S.E. Exploring aerosols near clouds with high-spatial-resolution aircraft remote sensing during SEAC4RS. J. Geophys. Res. Atmos. 2019, 124, 2148–2173. [Google Scholar] [CrossRef] [PubMed]
  63. Várnai, T.; Marshak, A. Near-cloud aerosol properties from the 1 km resolution MODIS ocean product. J. Geophys. Res. Atmos. 2014, 119, 1546–1554. [Google Scholar] [CrossRef] [Green Version]
  64. Wen, G.; Marshak, A.; Cahalan, R.F.; Remer, L.A.; Kleidman, R.G. 3-D aerosol-cloud radiative interaction observed in collocated MODIS and ASTER images of cumulus cloud fields. J. Geophys. Res. 2007, 112, D13204. [Google Scholar] [CrossRef] [Green Version]
  65. Richter, R.; Louis, J.; Muller-Wilm, U. Sentinel-2 MSI–Level 2A Products Algorithm Theoretical Basis Document; Telespazio VEGA Deutschland GmbH: Darmstadt, Germany, 2012; Available online: https://forum.step.esa.int/uploads/default/original/2X/f/f3aa9be5ad9aab427885b536d0a30a5d47f45202.pdf (accessed on 6 May 2020).
  66. Storey, J.; Roy, D.P.; Masek, J.; Gascon, F.; Dwyer, J.; Choate, M. A Note on The Temporary misregistration of Landsat-8 Operational Land Imager (OLI) and Sentinel-2 Multi Spectral Instrument (MSI) imagery. Remote Sens. Environ. 2016, 186, 121–122. [Google Scholar] [CrossRef] [Green Version]
  67. NASA Earth Observatory. Aerosols and Clouds (Indirect Effects). Available online: https://earthobservatory.nasa.gov/features/Aerosols/page4.php (accessed on 4 September 2020).
  68. Feng, L.; Hu, C. Cloud adjacency effects on top-of-atmosphere radiance and ocean color data products: A statistical assessment. Remote Sens. Environ. 2016, 174, 301–313. [Google Scholar] [CrossRef]
  69. Zhu, Z.; Wang, S.; Woodcock, C.E. Improvement and expansion of the FMask algorithm: Cloud, cloud shadow, and snow detection for Landsats 4–7, 8, and Sentinel 2 images. Remote Sens. Environ. 2015, 159, 269–277. [Google Scholar] [CrossRef]
  70. Koetz, B.; Berger, M.; Blommaert, J.; Bello, U.D.; Drusch, M.; Duca, R.; Gascon, F.; Ghent, D.; Hoogeveen, J.; Hook, S.; et al. Copernicus High Spatio-Temporal Resolution Land Surface Temperature Mission: Mission Requirements Document; ESA: Noorwijk, The Netherlands, 2019; p. 89. [Google Scholar]
Figure 1. Estimated annual emission of peatland fires in Equatorial Asia in 1997–2019 from Global Fire Emissions Database version 4.1 (http://www.globalfiredata.org/data.html) and the Oceanic Niño Index (ONI) and Dipole Mode Index (DMI) using 3 month running average of sea surface temperature anomalies during November-December-January period. Climate indices data were accessed at https://origin.cpc.ncep.noaa.gov/products/analysis_monitoring/ensostuff/ONI_v5.php and https://psl.noaa.gov/gcos_wgsp/Timeseries/Data/dmi.had.long.data.
Remotesensing 12 03958 g001
Figure 2. Study areas (blue trapezoid) coverage of Landsat-8 scene areas (path/row of 118/062, 119/06, 121/061, 124/062, 125/061, 126/060, 127/059) over Kalimantan and Sumatera’s peatland (in red). Peatland data sources from the Indonesian Ministry of Agriculture (2011). Administration boundaries are from Geospatial Information Agency of Indonesia.
Remotesensing 12 03958 g002
Figure 3. Spectral radiance simulated using MODerate resolution atmospheric TRANSmission (MODTRAN) for peatland with limited vegetation. The simulation was made based on albedo of 0.1 with an assumption of emissivity of 0.9 over burning peatland at 300 K, 360 K, 450 K, 500 K, 700 K and 1000 K under a tropical atmosphere and using a rural model. The atmospheric transmittance is presented in light blue background, while water vapour and gas absorption is portrayed in grey. This graph assumes 100% of the pixels corresponding to objects are at the nominated temperature and that might be unrealistic for some flaming at 30 × 30 m pixels, but it may be realistic for smouldering pixels. The graph is not definitive—it gives suggestions as to where to observe peatland fires using remote sensing.
Remotesensing 12 03958 g003
Figure 4. (a) Example of field picture taken from drone over burnt areas. The areas of interest were selected at homogenous pixels (>80–90% of pixel area of Landsat-8 was burnt area and smouldering peatland). Drone imaging was taken using Da-Jiang Innovations (DJI) Phantom Pro-4 on the same day with Landsat-8 acquisition (28 September 2018); (b) Picture of burnt area taken from the surface by digital camera in the burnt areas shown in Figure (a) at different orientation; (c) Example of smouldering peatlands taken by drone on 30 September 2018, two days after Landsat-8 acquisition time; (d) Picture of smouldering peatlands taken from surface in area of the smouldering peatlands in Figure (c) at different orientation; smoke shown from smouldering logs and surface peatlands; (e) Measurement of surface temperature on smouldering peatland using handheld IRtek IR150 dual-beam laser infrared thermometer; smouldering features below the peatland surface (to −20 cm) with smoke at the surface; (f) An example of peatland depth (1 m) consists of decaying roots and organic soil as the fuels for smouldering peatland; (g) Boxplots of smouldering (S) peatland and burnt area temperatures at the surface from 44 smouldering locations and 16 burnt area (BA) locations.
Remotesensing 12 03958 g004
Figure 5. (a) Inset map of burnt area, smouldering and flaming area with area of interest (AOI) over Landsat-8 image; the AOI of burnt area and smouldering were selected based on drone image while flaming area based on obvious fire features on RGB Landsat-8 image (b) Profile of Top of Atmospheric (TOA) radiance of Landsat-8 bands for flaming, smouldering peatland, and burnt areas locations collected from ground truth data on 28 September 2018 to 1 October 2018. Smouldering locations were observed two days after Landsat-8 acquisition due to the longer proses of burning in smouldering peatlands. The Landsat-8 imagery was acquired on 28 September 2018 in Central Kalimantan (path/row of 118/62). Boxplots of band 10, band-7, band-6 and ratio of band-7 to band-6 of Landsat-8 are presented. The ratio of band-7 to band-6 shows a potential index for separating combustion and non-combustion areas. F, S, and BA represent flaming, smouldering and burnt areas respectively.
Remotesensing 12 03958 g005
Figure 6. Flowchart of general methods used for ToPeCAl-2 compared with ToPeCAl-1. Two methods were assessed, i.e., ToPeCAl-2 with contextual test and ToPeCAl-2 with cloud masking. F is flaming; FS is mix of flaming and smouldering; S is smouldering. TOA is top of atmosphere; ρ is reflectance; BT is brightness temperature; SWIR is shortwave infrared; TIR is thermal infrared.
Remotesensing 12 03958 g006
Figure 7. (a) Example of 764 Red-Green-Blue (RGB) image of Landsat-8 on 28 September 2018 and a 61 × 61 pixel window size with some fire features (in yellow to oranges tones) and background pixels with dominant objects, e.g., cloud (white), cloud shadow (black), soil/open land (brown), and vegetation (green); (b) The same RGB image as (a) overlaid with water/cloud shadow mask (blue) and obvious fire pixels (yellow) as per-previous studies [37,38,40]; saturated flaming pixels and permanent bright objects did not exist in this sample; (c) The same with (b) but with additional masks for cloud (light green) and candidate fire pixels (pink); (d) The histogram and population statistics of the ratio reflectance band-7 ( ρ 2.2 ) to band-6 ( ρ 1.6 ) and reflectance of band-7 of background pixels which excluded water/cloud shadow and unambiguous fire pixels as shown spatially in (b); (e) The histogram and population statistics of the same variable with (d) but with additional masks of cloud and candidate fire pixels. The ratio of band-7/band-6 and reflectance of band-7 data (d,e) do not follow a normal distribution according the Anderson-Darling goodness of fit statistic at confidence level of 99.7% (3σ), corresponding to a heterogeneous background, but data in (e) is more normal then (d).
Remotesensing 12 03958 g007
Figure 8. Relative spectral response curve at aerosol-band, SWIR-1 and SWIR-2 bands of Sentinel-2A/2B and Landsat-8 Operational Land Imager (OLI). The data was accessed from https://landsat.gsfc.nasa.gov/preliminary-spectral-response-of-the-operational-land-imager-in-band-band-average-relative-spectral-response/ and https://earth.esa.int/documents/247904/685211/S2-SRF_COPE-GSEG-EOPG-TN-15-0007_3.0.xlsx.
Remotesensing 12 03958 g008
Figure 9. (a) Percentage of probability of detection (POD), independent commission errors (ICE) and independent omission errors (IOE) of ToPeCAl-2 with contextual test and ToPeCAl-2 with cloud masking applied to Landsat-8 OLI compared with fires resultant from ToPeCAl-1 applied to Landsat-8 OLI/TIRS images; (b) As per Figure (a) but showing the comparison of fire classes, i.e., flaming (F), smouldering (S), and mix of flaming and smouldering (FS).
Remotesensing 12 03958 g009
Figure 10. (a) RGB image of Landsat-8 OLI with SWIR-2 band as Red layer, SWIR-1 band as Green layer, and Red band as Blue layer. Landsat-8 image was acquired on 29 August 2019 over Riau’s peatland; (b) ToPeCAl-1 fires overlaid on the same RGB image of Landsat-8 in Figure (a); (c) Result of ToPeCAl-2 fires with contextual test compared with ToPeCAl-1 fires from the same Landsat-8 image of Figure (a); (d) Comparison result of ToPeCAl-2 with cloud masking. TP is the true positive fire pixel; FP is the false positive fire pixel; FN is the false negative fire pixel. The RFP or RFN is the spatially related of false positive/false negative pixels which adjacent to TP pixel and existed within one pixel buffer from the TP pixel; (e) Natural RGB image of PlanetScope in the same area of Landsat-8 image and the same day about 11 min before Landsat-8 acquisition on 29 August 2019; (f,g) An enlargement of peatland fires in the area of red squares line on Figure (e) with fires from ToPeCAl-2 with contextual test and ToPeCAl-2 with cloud masking, respectively; (h,i) the same enlargement area with Figure (f,g), but showing smoke features from PlanetScope images on 29 August 2019 and 1 September 2019, respectively.
Remotesensing 12 03958 g010
Figure 11. (a) Percentage of probability of detection (POD), independent commission errors (ICE) and independent omission errors (IOE) of ToPeCAl-2 with contextual test and ToPeCAl-2 with cloud masking applied to Sentinel-2 images compared with fires resultant from ToPeCAl-1 applied to Landsat-8 images; (b) As per Figure (a) but showing the comparison of fire classes, i.e., flaming (F), smouldering (S), and mix of flaming and smouldering (FS). The Top of Atmosphere (TOA) reflectance used in ToPeCAl-2 were with no transformation values and with transformation values from the merged Ordinary least squares (OLS) model and local OLS model.
Remotesensing 12 03958 g011
Figure 12. (a) RGB image of Landsat-8 with SWIR-2 band as Red layer, SWIR-1 band as Green layer, and Red band as Blue layer. Landsat-8 was acquired on 28 September 2018 at 2:34 Universal Time Coordinated (UTC) over Central Kalimantan’s peatland; the dark straight line below the fires features (light yellow) is a river canal; green is vegetation and reddish purple is burnt area; (b) The same RGB composite image with Figure (a), but for Sentinel-2, which was acquired nine minutes before Landsat-8; (c) Natural RGB composite of Sentinel-2 on the same data with Figure (b); (d) Peatland fires from ToPeCAl-2 with contextual test applied to Sentinel-2 image compared with ToPeCAl-1 fires from Landsat-8 overlaid on RGB image of Sentinel-2; (e) the same with Figure (d) but from ToPeCAl-2 with cloud mask; (f) Natural composite of PlanetScope image on 28 September 2018 at 2:47 UTC showing smoke emanating from fire areas (white square) in Figure (e).
Remotesensing 12 03958 g012
Figure 13. (a) Peatland fire areas (±104 ha) presented in false colour composite for Sentinel-2 image on 28 September 2018 in Central Kalimantan. Light pink to yellow represented fire areas with bluish smoke emanating from fire areas; (b) ToPeCAl-2 fires with contextual test overlaid on RGB image of Sentinel-2 in the same area with Figure (a). The RFP and RFN pixels are adjacent to TP fires (red colour). In this data pairs of Sentinel-2 and Landsat-8, the RFP and RFN pixels were within geometric error (38 m) and propagation zones (12 m) which about 50 m from TP pixels (magenta square line); (c) As per Figure (b) but from ToPeCAl-2 with cloud mask; (d) PlanetScope image in natural colour composite showed smoke emanating from fires areas from in the same area and in three minutes after Sentinel-2′s acquisition; (e) Surface peatland fires propagation in lateral (horizontal) direction according to [54] from field experiment in Central Kalimantan’s peatland after ignition and during surface burning in the first stage; the propagation were also in depth spread in the next stage.
Remotesensing 12 03958 g013
Table 1. List of peatland fire detection research using medium to low spatial resolution satellite data and unpiloted aircraft in Indonesia (OLI is Operational Land Imager; TIRS is Thermal Infrared Sensor; BIRD is Bi-spectral InfraRed Detection; HSRS is HotSpot Recognition System; TET-1 is Technology Experiment Carrier; Suomi NPP is Suomi National Polar-orbiting Partnership; SWIR is shortwave infrared; TIR is longwave thermal infrared; MWIR is mid-wave infrared; VIIRS is Visible Infrared Imaging Radiometer Suite; UAV is Unpiloted Aerial Vehicle).
Satellite/AircraftSensorPrimary Spectra Used for Fire DetectionRevisit Time (Day)Spatial Resolution (m)Main ObjectiveReference
Landsat-8OLI & TIRSSWIR, TIR1630Peatland fire detection at nighttime & daytime[26,27]
BIRDHSRSMWIR, TIR2–3370Peatland fire detection at daytime[28]
TET-1TET-1MWIR2–5160Peatland fire detection at daytime[29]
Suomi NPPVIIRSSWIR0.5750Peatland fire detection at nighttime[30]
MWIR, TIR0.5375Assessment of active fire[31]
UAVTau2 TIRTIRas needed0.185Peatland fire detection at daytime[32]
Table 2. Landsat-8 OLI and Sentinel-2 Multi Spectral Instrument (MSI) spectral band information used in Tropical Peatland Combustion Algorithm (ToPeCAl) and background mapping [27,38,46,49,50,51].
Landsat-8 OLI/TIRSentinel-2 MSIType of Information and Purpose
BandCentre Wavelength (µm)Spatial Resolution (m)BandCentre Wavelength (µm)Spatial Resolution (m)
1 (coastal aerosol)0.443301 (coastal aerosol)0.43320 (resampled from 60)TOA reflectance for classifying clear and smoky atmosphere
3 (Green)0.561303 (Green)0.56020 (resampled from 10)TOA reflectance for water masking
4 (Red)0.66530---TOA reflectance for cloud masking
5 (NIR)0.865308a (NIR)0.86520TOA reflectance for water masking
6 (SWIR-1)1.6093011 (SWIR-1)1.61020TOA reflectance for fire mapping & water masking
7 (SWIR-2)2.2013012 (SWIR-2)2.19020TOA reflectance for fire mapping & bright object mapping
10 (TIR)10.930 (resampled from 100)---TOA brightness temperature for fire mapping
Table 3. List of Landsat-8 data for applying and assessing Tropical Peatland Combustion Algorithm (ToPeCAl) without TIR (ToPeCAl-2) in Central Kalimantan, South Kalimantan, West Kalimantan, Riau, Jambi, and South Sumatera.
Study AreaAcquisition DateLandsat-8′s Path/Row
Central Kalimantan and South Kalimantan11 August 2018118/062
12 September 2018118/062
28 September 2018118/062
29 July 2019118/062
14 August 2019118/062
6 September 2019119/062
West Kalimantan9 September 2015121/061
Jambi and South Sumatera11 October 2019124/062
27 October 2019124/062
20 August 2015125/061
15 August 2019125/061
31 August 2019125/061
Riau7 September 2019126/060
20 August 2016127/059
29 August 2019127/059
Table 4. List of Landsat-8 and Sentinel-2 data for applying and assessing application of ToPeCAl-2 to images over Central Kalimantan, South Kalimantan, West Kalimantan, Riau, Jambi, and South Sumatera. There are four pairs of Landsat-8 and Sentinel-2 images contained fires in the same areas on the day of acquisition. Descending orbit Landsat-8 images were acquired at 2–12 min after Sentinel-2 image acquisition. The state of fire features was identified from the Red-Green-Blue (RGB) image composites of SWIR-2, SWIR-1, and Red bands of Sentinel-2 and Landsat-8 images.
Study AreaAcquisition DateLandsat-8′s Path/RowSentinel-2′s TileDifference Time (Minutes)Fire Features
Central Kalimantan and South Kalimantan28 September 2018118/062S-2A (T49MHS, T49MHT, T50MKB, T50MKC)9Yes
14 August 2019118/062S-2A (T49MHT, T50MKC)9Yes
Central Kalimantan 6 September 2019119/062S-2A (T49MGS, T49MGT, T49MHT)5Yes
Jambi and South Sumatera21 August 2018124/061
124/062
S-2A (T48MVC, T48MVD, T48MWC)5No
31 August 2019125/061S-2B (T48MUD)12Yes
13 September 2018125/061S-2A (T48MUD)2No
Riau16 April 2019126/059S-2B (T47NRA, T47NRB, T48NTF, T48NTG)7No
9 May 2019127/059S-2B (T47NPB, T47NQC, T47NRB)3No
28 July 2019127/059S-2B (T47NQB)4No
Table 5. Visual comparison on false positive fire pixels of ToPeCAl with SWIR and TIR (ToPeCAl-1) and ToPeCAl without TIR (ToPeCAl-2) applied to Landsat-8 images.
ObjectToPeCAl-1ToPeCAl-2Recommendation for Eliminating the False Positive Pixels on ToPeCAl-2
Edge of cloudnoyesContextual test or cloud masking
Permanent bright objects lessmorepermanent bright object masking
Table 6. The mean differences of TOA reflectance of Sentinel-2 Multi Spectral Imager (MSI) and Landsat-8 OLI at aerosol, SWIR-1, and SWIR-2 bands. Total data (n) were compiled from three data sets representing study sites in Central Kalimantan and South Kalimantan (CK-SK), Jambi and South Sumatera (JSS), and Riau. * Resulted from t-test with significant different at p-values < 0.001.
OLS ModelSiteAcquisition Daten (Pixel)Mean of the Differences of MSI-OLI
Aerosol BandSWIR-1 BandSWIR-2 Band
No-transformationCK-SK
JSS
Riau
28 September 2018
21 August 2018
16 April 2019
58,716,8430.004497 *0.017121 *0.008576 *
Merged OLS modelCK-SK
JSS
Riau
28 September 2018
21 August 2018
16 April 2019
58,716,8430.000047 *0.000015 *0.000027 *
Local OLS modelCK-SK
JSS
Riau
28 September 2018
21 August 2018
16 April 2019
58,716,843−0.006369 *0.000024 *0.000193 *
Publisher’s Note: MDPI stays neutral with regard to jurisdictional claims in published maps and institutional affiliations.

