Article

Nocturnal Surface Urban Heat Island over Greater Cairo: Spatial Morphology, Temporal Trends and Links to Land-Atmosphere Influences

by
Ahmed M. El Kenawy
1,2,*,
Mohamed Hereher
1,3,
Sayed M. Robaa
4,
Matthew F. McCabe
5,
Juan I. Lopez-Moreno
6,
Fernando Domínguez-Castro
7,8,
Islam M. Gaber
9,
Talal Al-Awadhi
1,
Ali Al-Buloshi
1,
Noura Al Nasiri
1,
Salim Al-Hatrushi
1,
Petra-Manuela Schuwerack
10,
Dhais Peña-Angulo
6,
Mohamed M. Abdelaal
2 and
Sergio M. Vicente-Serrano
6
1
Department of Geography, Sultan Qaboos University, Al Khoud, Muscat 123, Oman
2
Department of Geography, Mansoura University, Mansoura 35516, Egypt
3
Department of Environmental Sciences, Damietta University, New Damietta 34511, Egypt
4
Department of Astronomy, Space Science and Meteorology, Faculty of Science, Cairo University, Cairo 12613, Egypt
5
Division of Biological and Environmental Sciences and Engineering, King Abdullah University of Science and Technology, Thuwal 23955, Saudi Arabia
6
Instituto Pirenaico de Ecología, Campus de Aula Dei, Avda. Montañana, 50059 Zaragoza, Spain
7
Aragonese Agency for Research and Development Researcher (ARAID), 50018 Zaragoza, Spain
8
Department of Geography, University of Zaragoza, 50009 Zaragoza, Spain
9
GIS Specialist and MA Student, Department of Geography, South Valley University, Qena Branch, Qena 83523, Egypt
10
University of Plymouth at Britannia Royal Naval College, Dartmouth, Devon TQ6 9EN, UK
*
Author to whom correspondence should be addressed.
Remote Sens. 2020, 12(23), 3889; https://doi.org/10.3390/rs12233889
Submission received: 23 October 2020 / Revised: 25 November 2020 / Accepted: 25 November 2020 / Published: 27 November 2020
(This article belongs to the Section Urban Remote Sensing)

Abstract

:
This study assesses the spatial and temporal characteristics of nighttime surface urban heat island (SUHI) effects over Greater Cairo: the largest metropolitan area in Africa. This study employed nighttime land surface temperature (LST) data at 1 km resolution from the Moderate Resolution Imaging Spectroradiometer (MODIS) Aqua sensor for the period 2003–2019. We presented a new spatial anomaly algorithm, which allowed to define SUHI using the most anomalous hotspot and cold spot of LST for each time step over Greater Cairo between 2003 and 2019. Results demonstrate that although there is a significant increase in the spatial extent of SUHI over the past two decades, a significant decrease in the mean and maximum intensities of SUHI was noted. Moreover, we examined the dependency between SUHI characteristics and related factors that influence energy and heat fluxes between atmosphere and land in urban environments (e.g., surface albedo, vegetation cover, climate variability, and land cover/use changes). Results demonstrate that the decrease in the intensity of SUHI was mainly guided by a stronger warming in daytime and nighttime LST in the neighborhood of urban localities. This warming was accompanied by a decrease in surface albedo and diurnal temperature range (DTR) over these areas. Results of this study can provide guidance to local urban planners and decision-makers to adopt more effective mitigation strategies to diminish the negative impacts of urban warming on natural and human environments.

Graphical Abstract

1. Introduction

The Greater Cairo is the largest metropolitan area in Africa. It has witnessed rapid changes in population, urbanization, and extensive economic activities over both space and time, inducing critical impacts on the local environment, carbon cycle, and even climate change [1]. For example, the population of Greater Cairo has increased dramatically over the past decades from 2.4 million (1950) to 20.58 million (2018) and currently represents more than 20% of the total population of the Egyptian territory [2]. Greater Cairo is one of the most densely metropolitan areas worldwide, with a population density approaching 8300 inhabitants per km2. Moreover, it is one of the most polluted cities in the world, with extremely high levels of particular matter (PM10). The deterioration of air quality is mainly driven by natural (e.g., sandy and dust storms) and anthropogenic (e.g., traffic, industries, and biomass burning) emission sources [3]. In addition, Greater Cairo has witnessed rapid urbanization in the past few decades, with new cities (e.g., 6th October and Al Obour) being born and added to the “traditional” megacity. This rapid trend of urbanization is projected to continue in the future, mainly due to demographic forces (e.g., high population growth, continuing internal migration from surrounding less-developed regions) and urban sprawl into agricultural lands. All these natural and human stressors, combined with a possible future acceleration of air temperature and intensification of extreme heat waves, may act to increase the heat load to urban dwellers [4,5,6].
There is an increasing global interest in characterizing surface urban heat island (SUHI) effects at different spatial scales, ranging from a unique city, e.g., [7,8] to national, continental, and global scales, e.g., [9,10,11]. This interest is motivated mainly by the adverse impacts, associated with SUHI, on natural and human environments, as well as the potential benefits resulting from their mitigation. These studies mostly rely on in situ observation, remote sensing data, and/or numerical modelling. With advancements in remote sensing techniques, it has been feasible to assess characteristics of SUHI at more detailed spatial and temporal scale and for an increasing span of time [12]. A rich body of work has employed satellite imagery to analyze the different characteristics of SUHIs using improved space-based data. Examples of these studies include assessing intensity and spatial extent of SUHI, e.g., [13,14], their temporal changes; physical mechanisms and driving forces, e.g., [15,16,17]; impacts on natural and human environments, e.g., [18,19]; and mitigation strategies, e.g., [20,21].
As the main demographic, administrative, and economic urban center in Egypt, Greater Cairo has gained the attention of researchers and scientists, with several investigations focusing on air pollution, e.g., [22,23]; road traffic, e.g., [24,25]; climate variability, e.g., [26]; poverty, e.g., [27]; criminal behavior, e.g., [28]; health conditions, e.g., [29,30]; land use changes, e.g., [31,32]; and urban growth, e.g., [30,33,34,35]. For Greater Cairo, it is quite challenging to make a comprehensive assessment of SUHI based on ground measurements alone, especially with the large heterogeneity of urban features. More simply, this is due to the sparse distribution of meteorological stations, which hinders the capacity to adequately represent the patterns, dynamics, and driving forces of SUHI. As such, earlier comprehensive attempts have been made to analyze SUHI and its main spatial and temporal characteristics using remote sensing data, e.g., [36,37,38,39,40,41]. However, a detailed review of these studies reveals that they characterized SUHI for individual, arbitrarily selected, and less representative dates or for a specific portion of the whole domain of Greater Cairo. Moreover, all of these studies employed different versions of Landsat data, which has a limited revisit time that can even be extended due to cloud cover influence [42]. From a temporal perspective, the infrequent repeat coverage of Landsat data was insufficient to provide a temporarily continuous multi-decadal assessment of changes in SUHI characteristics (e.g., intensity, spatial extent) over Greater Cairo. In addition, these studies lack the opportunity to address the links of SUHI characteristics with important land-atmosphere drivers (e.g., surface albedo, diurnal temperature range (DTR), etc.)
Some remote sensing products (e.g., the Moderate Resolution Imaging Spectroradiometer (MODIS) sensors on the Terra and Aqua satellites) are temporally-continuous, with a coarser resolution (250 m–1 km) but still enough when considering the total area (2453 km2) of Greater Cairo. This presents an opportunity to explore the multitemporal variability of SUHI, with a spatial coverage quite adequate to describe its morphology and spatial patterns. Due to their relatively high spatial and temporal resolution, MODIS products have increasingly been used to monitor SUHI in different regions worldwide e.g., [10,14,17,43]. For Greater Cairo, such a long-term spatially detailed assessment of SUHI characteristics and attribution of their driving forces is lacking. Importantly, the timely and spatially explicit characteristics of MODIS-land surface temperature (LST) data used in this study can provide meaningful results for decision makers to assess the risk and vulnerability associated with intensification of SUHI and to plan and design adaptation or mitigation measures. Moreover, such an assessment is needed, recalling that the response to climate change in the Greater Cairo region may be more complicated and challenging than in other regions, due to rapid and uncontrolled urban and population growth.
Overall, this study aims to (1) assess the spatial and temporal variability of SUHI in Greater Cairo from January 2003 to December 2019 using 1 km MODIS nighttime LST data, and to (2) determine the physical mechanism and drivers (e.g., vegetation cover, surface albedo, land use) that can control the derived SUHI variability. Results of this study can guide future efforts towards mitigation and abatement strategies in Greater Cairo.

2. Study Area

With a total area of 2453 km2, Greater Cairo is located between the latitudes of 29°42′32″N and 30°17′11″N and the longitudes of 30°47′35″E and 31°48′22″E (Figure 1). Greater Cairo represents the economic heartland of Egypt, including the main national governments, manufacturing industries, electrical power stations, tourist centers, cultural sites, business establishments, and universities. It is a rapidly growing metropolitan region, which witnessed continuous changes in its physical and human environments [26]. While industry and services are the main economic activities in the central areas, agriculture remains the key activity in suburban areas [40]. However, these suburban areas have also witnessed a drastic decrease in its agricultural land since 2011, with almost 9600 ha being converted from agricultural to urban use [31]. The northern and southern portions of the study region are occupied by two main industrial complex zones, Shoubra El-Khiema and Helwan, respectively [26]. From a climatic perspective, Greater Cairo is located in the extratropical zone, with hot and dry summers and moderate and dry winters (BWh according to the Köppen–Geiger classification). The mean annual temperature is almost 22 °C, while the mean annual rainfall is 20.4 mm, with annual rainy days generally below 10 (based on the observed meteorological records for the period 1983–2019). Rainfall is scarce, with less than 10 rainy days per year, mainly distributed in winter and spring. The climate is continental with high DTR, high solar radiation, clear sky, and frequent sandstorms [44]. Topography of Greater Cairo is almost flat, with no clear topographical gradients. The main highest elevations are located in Moqattam hills to the east, with elevations generally exceeding 300 m (Figure 1). Greater Cairo is surrounded by sandy deserts from the east and west. In this study, the Greater Cairo region was defined administratively, incorporating five main cities: Cairo, Giza, Shoubra El-Khiema, 6th October, and Al Obour. Although this definition is based primarily on aggregation of local administrative units (N = 68) (e.g., municipalities, small local jurisdictions, etc.) (Figure 1), it also accounts for the combination of population densities and built-up land, in comparison to other surrounding areas. Furthermore, this definition did not miss the main functions of the city, particularly as an urban center whose economic influence extends beyond their traditional boundaries to commuting zones through what is called “travel-to-work” flows.

3. Materials and Methods

3.1. Datasets

3.1.1. MODIS LST

This study employed the full archive (January 2003–December 2019) of the 8-day composites of the LST product (MOD11A2) (https://lpdaac.usgs.gov/). Specifically, nighttime surface temperatures were extracted from the Aqua satellite (MYD11A2V.6) for the Greater Cairo domain. MODIS Aqua acquires nighttime (1:30 a.m.) near-surface temperature data at a 1 km grid resolution. Herein, it is worth noting that a preference was made to analyze the nocturnal (nighttime) SUHI characteristics rather than daytime SUHI. This decision is mainly fueled by the notion that SUHI is determined largely by the behavior of both surface temperature and sensible heat flux [45]. Typically, in continental regions, the differences between surface and air temperatures become much larger during nighttime. Furthermore, the intensity and distribution of SUHI are impacted more by anthropogenic heat releases and climate forces (e.g., albedo), which are more enhanced during nighttime, mainly due to the active outgoing shortwave radiation in the absence of the sun [17]. This makes nighttime SUHI more representative of energy and heat fluxes between the surface and atmosphere, as compared to daytime SUHI. Here, it is noteworthy to indicate that we also use the daytime LST product (MOD11A2) to explore the links between nocturnal SUHI characteristics and daytime LST on one hand and to assess the role of DTR in the evolution of SUHI on the other hand.

3.1.2. MODIS Albedo

There are a variety of land-atmospheric conditions that influence characteristics of SUHI (e.g., land use/cover, surface albedo, relative humidity, cloud cover, soil moisture, wind speed, etc.) Land surface albedo, defined as the fraction of incident solar radiation reflected by land surface, is one of the key variables controlling land-atmosphere energy fluxes and can thus determine the intensity and spatial extension of SUHI [46,47]. Typically, a decrease in the albedo of urban settlement areas can induce an increase in land and surface air temperatures and accordingly enhance any warming effect [48]. To explore the feedback between surface albedo and characteristics of SUHI, we employed the 16-day composites of surface reflectance from the Aqua (MYD) satellite. The standard MODIS bidirectional reflectance distribution function (BRDF)/albedo product (MCD43A) provides the weighting parameters (isotropic, volumetric, and geometric) necessary for describing the reflectance anisotropy at a 1-km grid resolution. The MCD43 series of albedo are produced using the MODIS (BRDF)/Albedo algorithm [49]. This dataset showed a good performance over a wide variety of land covers [50,51,52]. MODIS BRDF/albedo values were only retrieved for multiangular atmospherically corrected pixels with high-quality data (i.e., cloud-free, low-aerosol optical depth). Specifically, high-quality BRDF and albedo values were retrieved only when there were a sufficient number of observations with good angular sampling. Otherwise, the data were considered of poor quality and assigned error flags. As the MODIS albedo data are estimated at 8-day resolution, with 16-day acquisition periods, a multi-day average may introduce uncertainties in the obtained results, as it can offset day-to-day cycle of albedo. Nonetheless, in our study domain, this kind of effect is non-significant. The possible impacts of both natural (e.g., vegetation growth, wet spells) and human processes (e.g., harvesting crops, deforestation, and revegetation) are minimized in this arid environment. Accordingly, the 16-day average albedo is less impacted by diurnal changes and episodic meteorological and vegetation impacts.

3.1.3. MODIS NDVI

With the high-resolution spectral information from passive sensors, a wide range of remote sensing vegetation indices have been employed to characterize vegetation dynamics. Ref. [53] provided a comprehensive review of the advantages and limitations of different remotely sensed vegetation indices. In this study, NDVI was computed using MOD13A2 and MYD13A2 V006 16-day composites for the period from January 2003 to December 2019 at 1 km grid interval. This resolution is consistent with the spatial resolution of MODIS LST (1 km). The data were provided by the U.S. Geological Survey (USGS) through the Land Processes Distributed Active Archive Center (LP DAAC) (https://lpdaac.usgs.gov/). Similar to all remotely sensed data employed in this study, the raw data were subjected to a quality control procedure to minimize the possible impacts of atmospheric conditions (e.g., clouds, aerosols), exclude poor-quality observations, and interpolate missing values. A comprehensive description of this quality control procedure is outlined in [54]. The NDVI was simply computed using the red and infrared reflectance of the surface, while the Maximum Value Composite (MVC) of NDVI was calculated using the algorithm adopted by [55]. MODIS-derived NDVI has been widely used in applications related to vegetation phenology and greening [56,57,58,59,60].

3.1.4. Land Use/Land Cover Data

Recalling the remarkable diversity of landscape over Greater Cairo, it was important to assess the effects of land cover/land use (LCLU) types on the spatial morphology and intensity of SUHI over Greater Cairo. For this purpose, we employed the digital map of LCLU types for Greater Cairo, which was produced by the Central Agency for Public Mobilization and Statistics (CAPMS) in 2018 (http://www.capmas.gov.eg/HomePage.aspx). Herein, we defined eight main categories of LCLU types: cropland, natural vegetation, water bodies, built-up, vacant land, industrial land, agricultural land, and roads (Supplementary Figure S1). This map was generated based on intensive field surveys and data processing and retrieval within a Geographic Information Systems (GIS) and remote sensing environments. The accuracy of the 2018 LCLU classes was assessed using sample (reference) points generated randomly from high-resolution data (Google Earth) and validated against field data. The accuracy assessment suggests that the post-processing classes were highly accurate, with overall accuracies exceeding 95%. Unfortunately, LCLU maps were not available for parts of the eastern domain of Greater Cairo, mainly occupied by some recently developed cities (e.g., Obour, Shorouk, and Badr, Egypt).

3.2. Spatial Morphology of SUHI

Although the impacts of SUHI on natural and human environment may be more intensive during the warm season (i.e., summer), with adverse impacts on human comfort, heat-related mortality, energy production and consumption, our decision was made to assess characteristics of SUHI on a seasonal basis. The decision was mainly guided by the notion that Greater Cairo is located in an extratropical zone, where the climate shows a high intra-annual variability, with strong seasonal differences. For example, due to its inland location, night-time temperature tends to be much cooler during winter and much higher during summer. Moreover, it is impacted by northerly winds in winter, while western flows dominate in spring. In addition, the effects of aerosols, which can significantly impact the amount of incoming solar radiation, can be more pronounced during spring and fall than in winter and summer. Accordingly, the response of SUHI to these stressors, as well as their effects, can vary greatly with season.
One of the key challenges in defining SUHI is how to accurately define both urban and suburban areas, as there are different quantitative and qualitative criteria that can be used for this purpose. “Urban” is a complex concept, which makes it difficult to provide a globally acceptable definition of urban and suburban areas. As such, different approaches have been adopted to make such a differentiation between urban and suburban areas. These approaches applied a wide variety of criteria (e.g., population size, land area, total built-up area, population densities, green space ratio, dominant economic activities, social organization, etc.) [61]. These challenges in making a clear definition of urban and suburban areas are strongly reflected in characterization of SUHI, as there is also no definitive criterion for the definition of SUHI. Specifically, while some studies have defined SUHI based on land cover categories [62], others relied on impervious surface areas [43] or local climate zones [63]. Ref [34] provided a comprehensive discussion of how the detection of SUHI can vary considerably according to the applied methodology and selected criteria.
In this study, we tried to overcome the limitations of defining urban and suburban areas, which can vary –even in the same city or town- according to the adopted LCLU classification algorithm [64,65], the spatial resolution of remote sensing products [66], etc. Specifically, to assess changes in the spatial morphology of the SUHI over Greater Cairo, we adopted a new approach, which accounts for LST differences between the different parts of the city following a spatial anomaly algorithm. This algorithm defines SUHI through comparing LST between the most anomalous “hotspot” and “cold spot” across the city, taking into consideration data structure across the whole spatial domain (i.e., spatial anomaly). Specifically, our approach depends on defining the intensity and spatial extent of SUHI using spatial anomaly, in which LST at each grid is compared with all grids for each independent month over the whole study period (January 2003–December 2019). Fortunately, as opposed to observation stations, the relatively high spatial resolution (1 km) of MODIS night-time LST allows for the application of this methodology.
Herein, nighttime LST at each time step (8-day composite) for each grid was compared with those corresponding to all grids (N = 3289), where this spatial anomaly was computed, as follows:
L S T a n o m a l y =   L S T i μ  
where LSTi refers to nighttime LST at grid i at a particular time step, while μ indicates the average of nighttime LST for all grids at the same time step. After defining LSTanomaly for each grid for all time steps within the whole study period, these anomalies were aggregated on a monthly basis. To define the spatial extent of the most anomalous “hotspot” and “cold spot” across the city for a particular month from January 2003 to December 2019, the grid (i) was assigned to the most anomalous hotspot when:
L S T a n o m a l y   f o r   g r i d   i   > 0.5   ( Q 75 f o r   a l l   g r i d s     Q 25 f o r   a l l   g r i d s ) +   Q 75 f o r   a l l   g r i d s  
Alternatively, the grid is assigned to the most anomalous cold spot when:
L S T a n o m a l y   f o r   g r i d   i < Q 25 f o r   a l l   g r i d s 0.5   ( Q 75 f o r   a l l   g r i d s   Q 25 f o r   a l l   g r i d s )  
Following Equations (2) and (3), the first (third) quartile for the anomalies of all grids for each month was calculated. Specifically, the third quartile (Q75) refers to the value of the 75th percentile calculated for the values of all LST anomalies for all grids. On the other hand, the first quartile (Q25) refers to the value of the 25th percentile calculated for LST anomalies for all grids on the same month. Based on these equations, each grid within the Greater Cairo will be assigned to the most anomalous hotspot if it meets the conditions of Equation (2), while it will be classified within the most anomalous cold spot in the city if it fulfills the requirement of Equation (3). Interestingly, this method allows to define the transitional thermal zones between the most anomalous hot and cold spots, given that the remaining grids (i.e., those did not meet the requirements of either Equation (2) or (3) will constitute this transitional zone.
Overall, the main innovative aspects of this proposed methodology are that (i) only grids with anomalous high (hotspot) and low (cold spot) nighttime LST anomalies are kept, which are likely to reflect heat and energy budget in the most and less urbanized areas across the city, respectively; (ii) this approach avoids arbitrarily-based definitions of climate zones within the city, whose results are site dependent and highly variable amongst months, seasons, and years; (iii) it minimizes uncertainties in defining SUHI, which are mostly related to how urban and suburban areas are delineated; (iv) according to this procedure, the grids with the most anomalous high and cold nighttime LST are defined, using a robust statistical definition, taking into account all grids spanning the whole study region; (v) this method captures well the spatial gradient (i.e., gradual changes over space) of LST over the whole domain, which enables to define if there are any changes in the trajectories and spatial structure of SUHI; (vi) more importantly, this methodology allows to define the dynamical characteristic of SUHI, as represented by spatial anomalies of LST at an individual time step but also through assessing the temporal evolution of these anomalies at independent time scales (e.g., monthly, seasonally and annually), allowing for assessing the varying responses of SUHI characteristics to different land-atmosphere drivers over time; and (vii) in comparison to some earlier studies, which define SUHI using normalization or standardized LST values, defining SUHI using spatial anomalies of LST allows to express differences in LST between the most anomalous hot and cold spots in the city in absolute values (i.e., °C), not normalized or standardized units. This aspect is important in urban environments, as it gives a direct evaluation of changes in the mean and maximum intensities of SUHI over time, which facilitates the comparison between cities located in different geographical and climatic zones.
After defining the spatial extent of the most anomalous hot and cold spots, we computed SUHI intensity as the difference of spatially-averaged nighttime LST between these markedly contrasted areas (i.e., hot vs. cold spot) for each month during the period from January 2003 to December 2019. Here, we employed two indices of SUHI intensity. The first is the mean intensity, which refers to the difference in the mean between anomalous hot and cold spots. The latter is the maximum intensity, which is defined as the maximum difference between these two areas. The calculation of the intensity of SUHI in this manner gives insights into heat stress and surface-atmosphere energy fluxes. Based on the derived intensity/spatial extent of the most anomalous hot and cold spots, time-series for the 17-year-period were identified for each grid on a seasonal basis. Seasons are defined as winter (DJF), spring (MAM), summer (JJA), and fall (SON).
Another important characteristic of SUHI is orientation and growth direction. Herein, we employed the Standard Deviational Ellipse (SDE) method to examine the spatial distribution of the centroids of the most anomalous hot and cold spots around their geometric center, which gives insights into trends (changes over time) in their dispersion and orientation [67,68]. Specifically, SDE can indicate the spatial shift in these anomalous hot and cold spots through comparing their centers over the study period. This comparison is based on calculating the standard deviation of the x-coordinates and y-coordinates of these centers from the mean center to define the axes of the ellipse. Recalling that the centers of these anomalous hot and cold spots tend to have a Gaussian distribution, as they can relatively be clustered over space, our decision was made to calculate SDE at one standard deviation, which covers approximately 68% of all centroids. Based on this ellipse, it is possible to define a particular spatial orientation of the varying centroids of the anomalous hot and cold spots over time. In particular, SDE can be described by means of four parameters: center, length of the major axis, length of the minor axis, and angle of rotation. The center of the ellipse is the mean center of all centroids. The lengths of the major and minor axes are calculated based on deviations from the mean center, where the long axis of the SDE indicates the direction of maximum dispersion, and the short axis the minimum dispersion of all centroids [67,68]. On the other hand, the rotation angle is a function of the deviations in the x-axis and y-axis from the mean center [67,69]. Overall, this method provides useful spatial information about directional trends of hot and cold spots (e.g., central tendency, dispersion, and direction).

3.3. Temporal Changes in SUHI and Land-Atmosphere Driving Forces

Temporal changes in the total area corresponding to the anomalous hot and cold spots between 2003 and 2019 were assessed using the ordinary least squares regression model. The slope of the linear regression model indicates the amount of change in the spatial extent of these anomalous spots, where higher slope values suggest stronger changes and vice versa. The sign of the trend (i.e., positive and negative) is determined by the sign of the slope. Here, we expressed the amount of changes in the areas represented by the hot and cold spots, proportional to the total area of Greater Cairo (%/decade). To assess the statistical significance of the detected trends, we employed the non-parametric modified Mann–Kendall statistic [70]. This is a non-parametric rank-based statistic that is less impacted by data distribution or the presence of outlier values in the data. Importantly, this test limits the possible influence of serial correlation, which is common in climate series, on the significance of the trends. The statistical significance was assessed at the 95% confidence interval (p < 0.05). Here, we categorized the statistical significance of the defined trends into four classes: statistically significant and positive (p < 0.05), statistically significant and negative (p < 0.05), statistically non-significant and positive (p > 0.05), and statistically non-significant and negative (p > 0.05). Similarly, trend detection (expressed in °C/decade) and its statistical significance were assessed for the intensity of both hot and cold spot areas on a seasonal basis. Similarly, changes in a range of climatic and environmental variables (e.g., albedo, vegetation cover, day and nighttime LSTs, and DTR), which have a major influence on SUHI evolution, were assessed for the period 2003–2019 on a seasonal scale. Herein, changes in the different characteristics of SUHI and the corresponding environmental drivers were assessed on a seasonal basis.

4. Results

4.1. Temporal Changes of SUHI

Figure 2 depicts the temporal evolution of the intensity of SUHI over Greater Cairo between 2003 and 2019 using two different indices (i.e., mean and maximum intensity). While the mean intensity indicates the differences between spatially averaged temperature anomalies of the most anomalous hot and cold spots, the maximum intensity summarizes the highest differences in temperature anomalies between these two areas. As illustrated in Figure 2, results suggest a decrease in the mean intensity of SUHI over the past 17 years. The largest decrease was found for warm seasons: spring (−0.47 °C/decade) and summer (−0.41 °C/decade). Exceptionally, fall was the only season that exhibited an increase (0.20 °C/decade) in the mean intensity of SUHI. Notably, changes in the mean intensity of SUHI were only statistically significant for warm seasons (i.e., spring and summer) (p < 0.05), while they were non-significant for cold seasons (i.e., winter and fall). In accordance with the observed decline in the mean intensity of SUHI, results also reveal a decrease in the maximum intensity of SUHI over Greater Cairo. Interestingly, we noted that seasons that exhibited larger changes in the mean intensity of SUHI conversely showed smaller changes in the maximum intensity, and vice versa. For example, while spring indicated the strongest decline in the mean intensity of SUHI, it showed a weak and statistically non-significant decrease (−0.09 °C/decade, p > 0.05) in the maximum intensity of SUHI. A similar pattern was also observed during winter, as a strong significant decline (−0.46 °C/decade, p < 0.05) in the maximum intensity of SUHI was noted, compared to a weak and non-significant decrease in the mean intensity. Notably, fall was the only season that showed a weak and non-significant decrease in both the mean and maximum intensity of SUHI.
The probability distribution function (pdf) of the mean intensity of SUHI indicates that the long-term (2003–2019) average of the mean intensity of SUHI was 5.6 °C (Figure 3). However, these mean differences between LST of the most anomalous hot- and cold-spot areas show some considerable seasonal differences. Specifically, a higher mean intensity was found during fall (6.1 °C), whereas a lower intensity occurred in summer (4.5 °C). The mean intensity seems to be quite similar for winter and spring, with values of 5.6 °C and 5.7 °C, respectively. Indeed, in some exceptional years, the intensity of SUHI showed high anomalous values. This was the case in fall of 2014 (7.7 °C) and 2017 (7.5 °C) (refer to Figure 2). In contrast, the intensity of SUHI occasionally exhibited lower heating conditions (e.g., for summers of 2018 and 2016), where the mean differences between spatially averaged temperature of areas of hot and cold spot did not exceed 3.9 and 4.1 °C, respectively (Figure 2). Figure 3 suggests that the strongest gradient in LST between hot- and cold-spot areas, as revealed by the maximum intensity indicator, was found during fall. The maximum differences in LST reached on average 11.1 °C during fall, compared to 8 and 7.9 °C for spring and winter, respectively. Rather, the gradient of LST was lower during summertime, as the maximum intensity of SUHI was only 6.3 °C. Overall, an inspection of Figure 2 and Figure 3 reveals that the mean and maximum intensity of SUHI tended to decrease over the past 17 years, especially during spring and summer. Conversely, this intensity showed an increasing tendency during fall, with high spatial gradient of nighttime LST between central and rural areas.
As opposed to the observed decrease in the intensity of SUHI, findings—following the results of the modified Mann–Kendall statistic—show that the spatial extent exhibited a statistically significant increase (p < 0.05) from 2003 to 2019 (Figure 4). This statistically significant increase was evident for all seasons and annually. However, a stronger increase in the domains of most anomalous hotspot (SUHI) was found during springtime (3.33%/decade) and winter (2.04%/decade). Rather, summer showed the lowest increase (1.60%/decade). In the same context, the cold spot area, defined climatologically following Equation (3), showed a decrease in its spatial extension in all seasons, with the strongest decline found in summer (–5.08%/decade) and fall (–4.26%/decade). Figure 5 confirms this finding, indicating that on average, the spatial coverage of SUHI during fall and summer was higher than in winter and spring. As depicted, the SUHI during fall and summer occupied almost 7.23 and 5.69% of the total area of Greater Cairo. The area of SUHI decreased drastically during spring (4.11%) and winter (4.82%). A completely reversed picture was found for anomalous cold spots (which are mostly assigned to sub-urban areas), as they had a broader spatial coverage in winter (13.17%) and spring (11.29%), compared to summer (8.4%) and fall (9.16%). A comparison of Figure 3 and Figure 5 reveals some interesting results. First, it can be noted that SUHI with higher intensity had a lower spatial coverage and vice versa. For example, the mean and maximum intensity of SUHI was lower during summer, as compared to winter and spring. However, summer indicated a broader spatial coverage of SUHI (5.69%) than in winter (4.82%) and spring (4.11%).
Exceptionally, fall was the season with the most enhanced spatial extension (7.23%) and more intense (6.1 °C) SUHI. Moreover, it seems that the increase in the spatial coverage of cold-spot areas corresponds to a decline in the mean and maximum intensities of hotspot domains, and vice versa. This dependency was evident for most seasons, with the only exception found during the warmest season (i.e., summer), which is characterized by a less extended cold spots and a less intense hotspots. Overall, these findings imply that, apart from fall, Greater Cairo has become a city with less intense but more spatially extended SUHI from 2003 to 2019.

4.2. Spatial Characteristics of SUHI

Figure 6 illustrates the spatial distribution of LST anomaly calculated on a seasonal basis. LST anomaly was calculated at each grid cell considering the spatial anomaly procedure described in Section 3.2. These anomalies give indications on the intensity of SUHI in each season. Moreover, changes in the intensity of LST at each grid were computed using the least squares regression model and presented for the different seasons between 2003 and 2019 (Figure 6). As depicted, it seems that SUHI generally showed less spatial differences between the different seasons, where positive LST anomalies were distributed mainly over central parts of the city, with a distinct northern-southern axis. Correspondingly, negative anomalies of LST were more pronounced over the eastern and western parts of the city, but with stronger negative anomalies at the far boundaries of the city. However, some distinct seasonal differences can also be noted. Specifically, it seems that the behavior of SUHI during cold seasons (i.e., winter and fall) is guided mainly by the warmer (positive) anomalies of LST in central portions of the city, which are markedly higher than suburban areas. In contrast, during summertime, it seems that this behavior is largely controlled by the stronger negative anomalies in suburban areas than smaller positive anomalies in core urban areas. Figure 6 also informs that SUHI had a compacted shape in all seasons, where all grids with strong positive LST are exclusively located in the inner part of the city. As noted, LST anomalies were more intense over central areas during winter and fall, and to a lesser extent in summer. Nonetheless, due to stronger negative anomalies of LST in suburban areas, the intensity of SUHI was much stronger in fall and spring. On the other hand, although central parts of the city exhibited the strongest positive LST anomaly during wintertime, LST anomalies at the suburban zone (the lowest anomaly was only −2.6 °C) modulated the intensity of SUHI in winter. As illustrated in Figure 6, the strongest gradient of LST anomaly was found in spring and fall, with much differences of LST anomalies between areas of hotspot (urban) and cold spots (mostly suburban areas). The strong negative anomaly of LST over suburban areas in fall and spring, as compared to winter and spring, is evident in Supplementary Figure S2.
Figure 6 also illustrates the temporal trends of LST anomalies on a seasonal scale from 2003 to 2019 (right panels). The spatial patterns of these trends seem to be in contradiction to the patterns found for the climatology of LST anomalies (left panels). Specifically, the core of the city, which exhibited higher nighttime LST anomalies, showed a tendency towards a decrease over the study period. In contrast, vast areas of the suburban zone witnessed an increase in LST anomaly in all seasons. These findings together suggest a decrease in the mean and maximum intensity of SUHI, due to narrowing the differences of LST anomaly between urban and suburban areas. This narrowing was more evident during fall and spring and to a lesser extent in winter.
Figure 7 depicts the smallest and largest spatial domain of the most anomalous hotspot defined from 2003 to 2019 over Greater Cairo. This definition was simply made considering the highest and lowest number (frequency) of grids assigned to these hotspots for each particular season over the whole study period. Specifically, the smallest spatial extension of these hotspots was defined using the lowest number of grids assigned to SUHI, following Equation (2), for each season during the study period, while the largest extension was computed considering the highest number of grids that were classified as anomalous cold spots for each season from 3003 to 2019. Again, a comparison between the lowest and highest spatial coverage of these hotspots indicates that the shape of SUHI is highly compacted over space in all seasons, suggesting that Greater Cairo is a monocentric city in terms of SUHI distribution. As expected, the spatial coverage of these hotspots was more extended during fall, while the development of these spots over space was less pronounced during summertime.
Figure 8 illustrates the major and minor axes of the Standard Deviational Ellipse (SDE) calculated for SUHI, represented by anomalous hotspots, across the city, with their main statistics (e.g., central mean, angle of rotation, etc.) are listed in Table 1. These findings summarize the dynamics of SUHI over space through defining its varying centroids and spatial orientation over time. As depicted, there is a shift in the centroid of SUHI towards the north in winter and fall, while this centroid moves to the south during summer and spring. However, the distance between the most northward and southward centroids of SUHI is less than 12 km (Figure 8). These main centers remain around Al Khalifa, Azbakiya, and Basateen districts (refer to Figure 1). An inspection of Figure 8 indicates that the SUHI during summertime had a less extended spatial distribution, while this distribution reached its maximum extension during fall. The major axes of SDEs for all seasons indicate that SUHI often grows in the north and northeast directions in cold seasons (winter and fall), while moving to the south during warm seasons (spring and summer).
In the same context, the minor axes show that SUHI rarely extends towards the west direction. As opposed to SUHI, Table 1 informs that the distribution of cold-spot zones had a northeastern direction in summer and an eastern orientation in other seasons. As illustrated in Figure 8, the larger standard deviation along the x-axis suggests that SDE had an extremely enlarged shape, especially for winter, spring, and fall, with a zonal rather than a meridional expansion. This suggests that cold-spot areas mainly grow in the east and west directions. The lowest standard deviations of summer SDE indicate that summer had a small and compacted ellipse, with a minimized spatial shift over time than other seasons.

4.3. Links to Land-Atmosphere Drivers

Figure 9 shows Pearson’s correlation coefficients calculated between nighttime LST anomaly and a range of key climatic variables in Greater Cairo. The correlation was computed for the detrended series to avoid the possible presence of trends in the original series, which can affect the significance and magnitude of correlation. As depicted in Figure 9, it can be noted that nighttime LST anomaly was negatively correlated with albedo in all seasons, except for fall. However, it seems that there was no great difference in LST-albedo association between urbanized and suburban areas during winter and spring. Rather, Figure 9 indicates that the impact of albedo on the anomaly of night LST was more pronounced during summer and autumn. However, the direction of this dependency was different, given that nighttime LST over SUHI correlated negatively with albedo during summertime (Pearson’s r = −0.41 on average), and positively (Pearson’s r = 0.31 on average) in fall. For NDVI, results demonstrate weak negative correlations with nighttime LST anomaly in all seasons, albeit with slightly improved dependency during the rainy seasons (winter and early spring). The influence of daytime LST on nighttime LST anomaly was seasonally dependent, with a stronger association during summer and fall. Similar to albedo, this dependency showed a different sign of association but with positive correlation (Pearson’s r = 0.31 on average) in summer and negative correlation (Pearson’s r = −0.41 on average) in fall. For nighttime LST, results indicate that the magnitude of nighttime LST had a positive impact on the spatial anomaly of nighttime LST (i.e., differences of LST between the grid and all grids) in most seasons, apart from fall. This means that nighttime LST rise over a specific grid is reflected directly in an increase in the anomaly of LST in this grid: i.e., relative intensity as compared to other grids. Figure 9 also indicates that nighttime LST anomaly was negatively correlated with DTR, suggesting an increase in LST anomaly when DTR decreases, and vice versa. Such a case was evident for all seasons and for the whole domain, including SUHI and its neighborhood. However, this dependency was much stronger for areas far from the SUHI domain, with a stronger association found during fall (Pearson’s r = −0.6 on average) and spring (Pearson’s r = −0.4 on average).
Figure 10 depicts the statistical significance of the trends calculated for the different climatic and environmental variables over the anomalous hotspot (SUHI) area and other parts of Greater Cairo, while their amounts of change for the 17 year period are illustrated in Figure 11. Figure 10 indicates a dominant increasing trend of albedo in SUHI area over the past two decades, especially during spring and summer. However, this increase was not statistically significant (p > 0.05) in the majority of the area.
In summer, almost 29.3% of SUHI area witnessed a statistically significant positive trend. In contrast, the majority of SUHI (62.9%) exhibited a general non-significant tendency towards a decrease in albedo during fall. As opposed to SUHI area, other parts of Greater Cairo showed strong variations of albedo trends, given that almost all categories of trends were presented for these areas. However, a great portion of these areas showed a significant decreasing trend, mainly in winter (significant: 46.3%, non-significant: 29.6%) and fall (significant: 50.5%, non-significant: 22.4%).
Moreover, changes in vegetation greening, as revealed by NDVI, indicated strong temporal variations, but with a dominance of non-significant positive trends, especially over SUHI area. Daytime LST showed a positive trend during spring and fall over SUHI area, while it conversely exhibited more negative trends in winter and summer. Notably, almost all of the Greater Cairo region exhibited a warming trend of nighttime LST during all seasons. The trend was only statistically non-significant in winter (p > 0.05). As guided by the strong warming trend of nighttime LST, DTR showed a decreasing trend in all seasons, being non-significant in winter alone. Examining Figure 11, it can be noted that cold-spot (suburban) areas of Greater Cairo witnessed a stronger cooling trend of albedo and DTR than SUHI area. In contrast, they exhibited a higher warming trend of both day and nighttime LST than SUHI area. These patterns can be seen during all seasons, with the spatial distribution of these trends provided in Supplementary Figures S3–S7.
Figure 12 illustrates the averaged amount of changes in the different environmental and climatic variables as a function of the dominant LCLU types. It is indicated that the positive trend of albedo corresponded mainly to agricultural uses, with stronger changes occurring in summer (0.07%/decade, p < 0.05). In contrast, other LCLU types witnessed a decrease in albedo between 2003 and 2019. The highest rates of decrease were found for vacant land and areas with a main industrial use. These trends were much stronger during fall (−1.1%/decade for vacant lands, and −0.5% for industrial use). On the other hand, an increase of daytime LST was found mainly for the agricultural and industrial land uses in all seasons. Built-up areas exhibited an increase in daytime LST during spring and fall, and conversely a declining trend in winter and summer. As opposed to other environmental and climatic variables, it is obvious that, regardless of the dominant LCLU type, a positive trend of nighttime LST prevailed over Greater Cairo. Nonetheless, the strongest warming was found for industrial land use areas, especially in spring (1.9 °C/decade) and summer (1.8 °C/decade). In contrast, the weakest changes were found for built-up areas, mainly in winter (0.5 °C/decade). For DTR, apart from vacant land, negative trends were dominant for all LCLU types. Notably, the last panel of Figure 12 suggests that built-up area, industrial, and agricultural land uses are the main LCLU types controlling the development of SUHI over Greater Cairo, as the industrial areas witnessed the most rapid positive changes in nighttime LST anomalies between 2003 and 2019, while agricultural and built-up areas exhibited the rapid negative changes. The strength of changes in both directions determines the intensity and growth of SUHI over Greater Cairo.

5. Discussion

5.1. Spatial and Temporal CharActeristics of SUHI

Due to their relatively high spatial and temporal resolution, MODIS products have been widely used to determine the spatial and temporal characteristics of SUHI [13,14,16,17]. In this study, the enhanced spatial resolution of MYD11A2V.6 overcomes the limitations of ground measurements over Greater Cairo, which are typically sparse in space and time. In this study, the resolution of MODIS data allows for detecting changes in SUHI characteristics over Greater Cairo at a detailed 1 km spatial scale and for a continuous 17-year time period (January 2003–December 2019).
Results demonstrated that on average the mean intensity of SUHI over Greater Cairo was 5.6 °C for the period 2003–2019, which is higher than the SUHI intensity found for other cities in Africa [71]. In their assessment of the diurnal and seasonal SUHI intensity for 419 cities across the globe, Ref [71] estimated an annual intensity of nighttime SUHI over a number of major Africa cities of between 0.8 and 1.2 °C, a range that is comparable with other global cities [11]. Our findings also indicate that the intensity of SUHI shows important seasonal differences. Specifically, the mean intensity of SUHI tends to be higher during fall (6.5 °C), compared to other seasons like winter (5.7 °C), spring (5.6 °C), and summer (4.5 °C). In the same context, the maximum SUHI intensity reached its highest mean during fall (12 °C), which is also comparable to that found for mega cities like Tokyo and Seoul [72].
Findings indicated that the intensity of SUHI has declined over Greater Cairo between 2003 and 2019, while the spatial extension has been enlarged. Our results on the decline in the intensity of SUHI over Greater Cairo are opposed to those presented in some earlier studies (e.g., [36,39]). For example, ref. [39] suggested an increase in the intensity of UHI, mainly attributed to increased urbanization. This discrepancy can be simply linked to data density and the different methodologies applied to define SUHI. In earlier studies over Greater Cairo (e.g., [36,39,40]), the intensity of SUHI was commonly represented for a few unrepresentative and arbitrarily-selected dates, which do not reflect adequately the “real” dynamical evolution of SUHI over time. This makes those results mostly biased by the selected date, season, and even the spatial domain for which the differences between urban and suburban areas were computed. Rather, our approach employed continuous time series spanning the whole period from January 2003 to December 2019, with a unique time series for each grid of the 3290 grid cells covering Greater Cairo, which provides a detailed spatiotemporal analysis of SUHI characteristics. In this study, the mean and maximum intensities of SUHI were computed using all grids over the study domain, which captures well the high heterogeneous LST anomalies over Greater Cairo.
According to our study, the decline in the intensity of SUHI over Greater Cairo can be attributed to the narrowing of the differences of LST between urban and suburban areas (Figure 6). Such a narrowing may be linked to the rapid increase in nighttime LST over suburban areas, as compared to SUHI area, particularly during spring and fall (Figure 11). This finding agrees with [73] who found stronger trends in non-urban areas of Greater Cairo, compared to the core of the city. Our study demonstrates that nighttime showed strong positive trends over suburban areas on the order of 1.7, 1.6, 1.4, and 0.8 °C/decade during spring, summer, fall, and winter, respectively, compared to relatively weaker changes of 1.1 °C/decade (spring and summer), 1 °C/decade (fall), and 0.3 °C/decade (winter) for SUHI area. The positive trend of nighttime LST over these suburban areas has been confirmed in earlier studies over Egypt. For example, ref. [44] found a statistically significant trend of nighttime LST during winter and spring, while [74] indicated a rapid increase of LST over the most populated areas in Egypt on the order of 1.54 °C/decade for the period 2003–2014. Moreover, findings concur with a number of recent regional [75,76] and global assessments [77]. In their global assessment of changes in LST, ref. [77] found strong positive trends of nighttime LST over the northern hemisphere between 2001 and 2012. Similarly, ref. [75] indicated a warming trend of nighttime LST over Greece between 2000 and 2007, while daytime LST exhibited a decreasing trend. In addition to the role of climate variability, the rapid increase in both daytime and nighttime LST over the past two decades might be amplified by the decline in agricultural lands over these areas, which has been evident for agricultural zones in the entire Egyptian territory [31,78,79]. Ref. [80] demonstrated that although the per capita agricultural land area decreased from 0.48 ha to 0.14 during the 20th century, this decline has been more pronounced in the past two decades, reaching only 0.03 ha in 2016 [79]. This decline is mostly associated with the rapid population increase and accordingly high demand for other competitive land uses, including housing, infrastructure, and recreation [31]. It is well-established that a lack of natural vegetation or a decrease in cropland area can induce a decline in the albedo and accordingly a decrease in latent heat of evapotranspiration, which enhances the growth of SUHI. This impact has been reported as one of the key processes impacting the development of SUHI for some metropolitan cities like Tokyo [81]. Unfortunately, urban expansion is horizontal and uncontrolled in these suburban regions (i.e., increasing number and scattered buildings with low heights), which induces the loss of vast areas of agricultural uses. What makes this situation more complicated is that the agricultural land loss in suburban zones of Greater Cairo is expected to continue into the future, given the current high population and urbanization rates in the city. Ref. [33] employed a Land Change Modeler to predict future scenarios of urban sprawl in Greater Cairo, which indicated that almost 14% of vegetation coverage and 4% of the desert areas are likely to be urbanized by 2025.
It was also determined that fall was the only season that exhibited an increase in the intensity and spatial extension of SUHI over Greater Cairo. In fall, there is an increase in the pollutant concentrations over the agricultural areas in the delta to the north and over the suburban areas of the study region: largely driven by burning rice straw after harvesting, especially in late September and October. According to [82], almost 3.1 million tons of rice straw are directly burned in open fields in Egypt each year. Ref. [83] indicated that rice straw burning contributes to 35.82% of the total greenhouse gas emissions (GHGs) in Egypt, including carbon dioxide (CO2), methane (CH4), and nitrous oxide (N2O), in addition to particulate matter (PM) [84]. It is well-established that air pollutants, especially aerosols, contribute to absorbing and reemitting longwave radiation. This process hinders the cooling from a radiating surface (so called “pseudo-greenhouse” effect) and accordingly induces an increase in air temperature and growth of SUHI towards the eastern areas of Greater Cairo [62]. Another possible explanation of the increase in the intensity and spatial extension of SUHI can be related to dust and sandstorms. According to [85], Egypt is ranked among the top 10% of countries with populations affected by strong sand and dust storms. These weather events frequently blow during transitional season (i.e., spring and fall), but with a maximum frequency in April and May. In spring, hot desert depressions (known locally as the Khamsin) prevail over northern and central Egypt. These depressions attract strong (25–50 m/s) hot dry and dusty wind from the Sahara in the west and south, inducing an increase in aerosols and atmospheric pollution and accordingly enhance the warming effect of these pollutants [86]. Furthermore, these hot winds exert more heating to the air, leading to above-normal air temperatures. In fall, dust storms are linked mainly to the Red Sea Trough, which is placed primarily over the southeastern portions of the country. These dust storms bring easterly hot and dry dust from the Arabian Peninsula to the Middle East, which explains the eastern extension of SUHI during this season. According to [87], the Red Sea Trough contributed to roughly 22.1% of observed dust days over the eastern Mediterranean between 1958 and 2006. More recently, ref. [88] indicated that the Red Sea Trough is the most contributing weather type for dust storms over North Africa and the Arabian Peninsula during fall. Indeed, the severity of sand and dust storms is more intensified over Greater Cairo due to the lack of rainfall during spring and fall seasons, a consequence of its location in an arid and natural vegetation-scarce region, surrounded by vast deserts. We certainly stress the role of surrounding deserts in the development of SUHI in Greater Cairo. In particular, these deserts have higher air temperature than Greater Cairo during the daytime but lower during the nighttime. As these deserts are more extended to the west, this hinders the possibility of SUHI to extend to the west due to its cooling effect.

5.2. Driving Forces of SUHI

An attempt to link characteristics of SUHI over Greater Cairo with a spectrum of physical (e.g., albedo, vegetation cover, and climate variability) and anthropogenic stressors (e.g., land use types) was undertaken. Results reveal distinct spatial variations between the SUHI and neighboring areas. For example, the intensity of SUHI is correlated significantly with albedo, especially during summer and fall. However, this association shows a different sign: i.e., positive correlation with SUHI intensity in fall and, conversely, a negative dependency during summertime. In summer, the consumption of energy (e.g., air conditioners) is typically higher than other seasons due to heat loading, inducing greater emissions of GHGs and accordingly lower albedo. However, it should also be stressed that the role of emissions in defining the amount of atmospheric albedo can vary depending on the pollutant.
It seems that vegetation has a minimal impact of the severity and spatial extension of SUHI, given the lack of dense vegetation in the city and the distribution of less dense and scattered vegetation. The negative association between vegetation greening in SUHI and intensity of nighttime LST is slightly stronger during the very short rainy season. Importantly, this study reveals that climate variability exerts strong influence on the intensity of SUHI, as significant thermal differences between urban and suburban areas were noted. Specifically, both urban and suburban areas exhibited a significant increase in nighttime LST, albeit with stronger changes over the suburban areas. These differences contributed to modulating the intensity of SUHI and explained the decreasing trend in this intensity over the past two decades. Notably, areas of SUHI are characterized by lower DTR compared to surrounding areas. This is typically the case in the most urbanized areas worldwide, due to the interaction between several variables (e.g., cloud cover, tropospheric aerosols, joint influence of different land uses, etc.) Herein, it should be stressed that heat-energy fluxes in urban environments can also be impacted by other important climatic variables (e.g., wind speed, relative humidity, and cloudiness). A number of studies have confirmed the negative association between SUHI intensity and cloudiness and wind speed. For example, ref. [89] suggested that SUHI is approximately the fourth root of both wind speed and cloud coverage. Unfortunately, access to detailed wind speed and cloud cover data is limited for Greater Cairo, which hinders the ability to provide a comprehensive assessment of the effects of these variables on SUHI characteristics. Nonetheless, the decrease in the intensity of SUHI during summertime might be linked to cloudiness impact. According to [44], Egypt exhibited a significant increase (0.53%/decade) in cloud coverage during summertime over the last two decades, which could impact heat and energy transfer via insolation and thus induce a decline in air and surface temperatures. Such responses are evident in this study, as almost 63.4% of the SUHI area presented a decrease in daytime LST between 2003 and 2019, although this trend was not statistically significant for the majority of these areas (Figure 10).
Among the different land use types, results demonstrate that built-up area and areas of industrial locations were the most contributing land use types to intensification of SUHI in Greater Cairo. While built-up areas had a warming effect during daytime, they had a cooling effect (due to reemitted radiation) during the nighttime. As such, like agricultural lands, they contribute to diminishing the intensity of SUHI during nighttime (Figure 11). Indeed, this effect is more pronounced during warm seasons (i.e., spring and summer), due to higher incoming radiation during daytime. In contrast, industrial areas, which are primarily located in the northern and southern complexes of the city, are sources for heavy greenhouse gases and pollutants that intensify SUHI, especially in northern and southern Greater Cairo (Figure 6).
Interestingly, this study found that water bodies showed a minimal impact on the development of SUHI (results not shown), which can be attributed to the notion that the majority of canals and streams are small (e.g., only a few meters in diameter), and accordingly, there is a lack of evaporation rates necessary for cooling. However, we should stress that the current resolution of the MODIS AQUA data is still too coarse to account for the comparatively small cooling effects from these small water bodies. However, although a considerable part of these water channels, especially those located in the western part of Greater Cairo, act as ultimate sinks for industrial and domestic waste in the city, breezes move from land to water during nighttime. This could explain the minimal influence of these water bodies on the intensity of nighttime LST.
In most populated areas, the city has developed vertically due to the lack of empty lands and the high competition among the different land uses (e.g., residence, commerce, industry, etc.) This explains why SUHI area is generally characterized by lower albedo (lower heat released during nighttime), especially in areas of street canyons (Figure 13). Moreover, these buildings absorb much of the incoming solar radiation during the day, and conversely reduce remitted long-wave radiation during nighttime, putting more energy into sensible heat. A reversed picture can be found in suburban areas, where buildings are of low height. Moreover, due to the dominance of high buildings and accordingly decreased sky view, SUHI witnesses high heat storage in their building structures. This situation can induce more released anthropogenic heat, as a consequence of the blockage effect of these high buildings [90]. In particular, these high buildings act as a blocker against urban ventilation because of the wind tunnel effects in streets and the unusual wind turbulence. This shows an increase in the Bowen ratio (i.e., the ratio of sensible to latent heat fluxes) and accordingly temperature rise. In their assessment of the impact of urban climate on the energy consumption of buildings in Athens (Greece), ref. [91] found that wind speed, which is a main source of urban natural ventilation, in areas of undisturbed wind conditions is almost stronger 10 times than air flow in urban canyons. Indeed, this impact is more pronounced during warm seasons (i.e., summer and spring), due to air stability in the boundary layer and lack of vertical movement. In this context, it is noteworthy to stress that urban areas have a strong thermal anisotropy, compared to other landscapes [92]. This thermal anisotropy contributes significantly to urban climate, as it determines both surface sensible heat flux and upward longwave flux [93]. However, it is expected that this effect is more pronounced during daytime, when solar insolation is much stronger and there are strong contrasts between shaded and sunlit facets within urban canopies. However, during nighttime, it is also evident that there are different cooling rates, mainly due to the different urban surface structure and materials and accordingly different radiative transfer processes. At nighttime, thermal anisotropy is largely controlled by thermal inertia of materials, internal heating of buildings, and other relevant processes that impact the net loss of longwave radiation. In this context, it is expected that nighttime thermal anisotropy will show more pronounced impacts on SUHI during warm seasons (i.e., summer and spring), mainly due to strong solar heating. This daytime heating is expected to delay radiative exchange from materials and buildings in the night, keeping nighttime surface temperature relatively warm. An opposite picture is expected during cold seasons (i.e., winter and fall), as sun heating is much weaker during these periods of the year (due to cloudiness, shorter daytime, aerosol effects, etc.), resulting in less differences of thermal inertia of materials between daytime and nighttime and accordingly more rapid nighttime radiative exchanges and thus cooling of nighttime LST. However, it should be stressed that the possible effects of thermal anisotropy are mostly linked to a wide range of factors, including surface form and properties, season, solar angle, weather conditions dominating in the boundary layer (e.g., wind direction and speed), and it is thus quite challenging to properly isolate the effect of each of these individual factors. As such, making a comprehensive assessment of the effect of thermal anisotropy on nocturnal SUHI requires very detailed spatial and temporal data either from remote sensing or observations.
In extratropical areas like Greater Cairo, the dominance of descending air motions and anticyclonic conditions during warm seasons is responsible for low tropospheric stability [94]. This atmospheric stability can enhance the intensity of SUHI in this highly populated metropolitan region, as it increases pollutant concentrations [95,96,97]. In their assessment of the links between population size and the intensity of SUHI for 12 megacities in Asia, ref. [72] found a positive correlation between the magnitude and spatial coverage of SUHI and city populations. This association can be expected given that these populated areas are likely to include more metabolisms (higher number of buildings, vehicles, etc.) and, accordingly, an intensification of heat content.

5.3. Study Limitations and Outlook

Albeit with their high accuracy, the spatial and temporal resolution of MODIS products is still relatively coarse to monitor and diagnose all of the characteristics of SUHI with high confidence, especially in metropolitans with heterogeneous environmental conditions. This is simply because SUHI dynamics and impacts can vary significantly within both the time of day and over short distances, as SUHI is a mutual phenomenon, with complex interactions between a wide variety of physical (e.g., wind speed, relative humidity, soil properties, and pollution) and anthropogenic processes (e.g., green areas, building material, sky view factor, streets width and direction, building height, etc.) In big metropolitan areas like Greater Cairo, climate and the environment are obviously highly interconnected and indeed can be in feedback with each other (either positive or negative). These interactions require detailed data over space and time that span a wide spectrum of urban environment components to provide a robust assessment of SUHI characteristics. Unfortunately, the available data, whether from observations, reanalysis, or remote sensing products, remain insufficient in both space and time, to meet many of these requirements. Other important demographic, economic, and social indicators are also needed to provide a full accounting (e.g., flows of energy). As such, it is desired to employ data at more enhanced spatial (e.g., meters) and temporal resolution (e.g., hourly or sub-daily) to comprehensively account for energy exchange processes and accordingly provide a complete and accurate picture of the urban thermal environment in Greater Cairo. These high-resolution spatiotemporal data could improve the calculation of heating and cooling energy in the city and accordingly contribute to better understanding of SUHI dynamics.

6. Conclusions

A comprehensive assessment of the spatial and temporal characteristics of SUHI and their driving forces over one of the largest metropolitan areas in the world was performed. Our assessment was based on employing MODIS nighttime LST at 1 km spatial resolution and 8-day composites for the 17-year period encompassing January 2003 to December 2019. This study introduced a new spatial anomaly algorithm that quantitatively defines the most anomalous hot- and cold-spot of LST over Greater Cairo. This approach allowed to delineate SUHI and characterize its variability over time and space. The main findings of this study are the following:
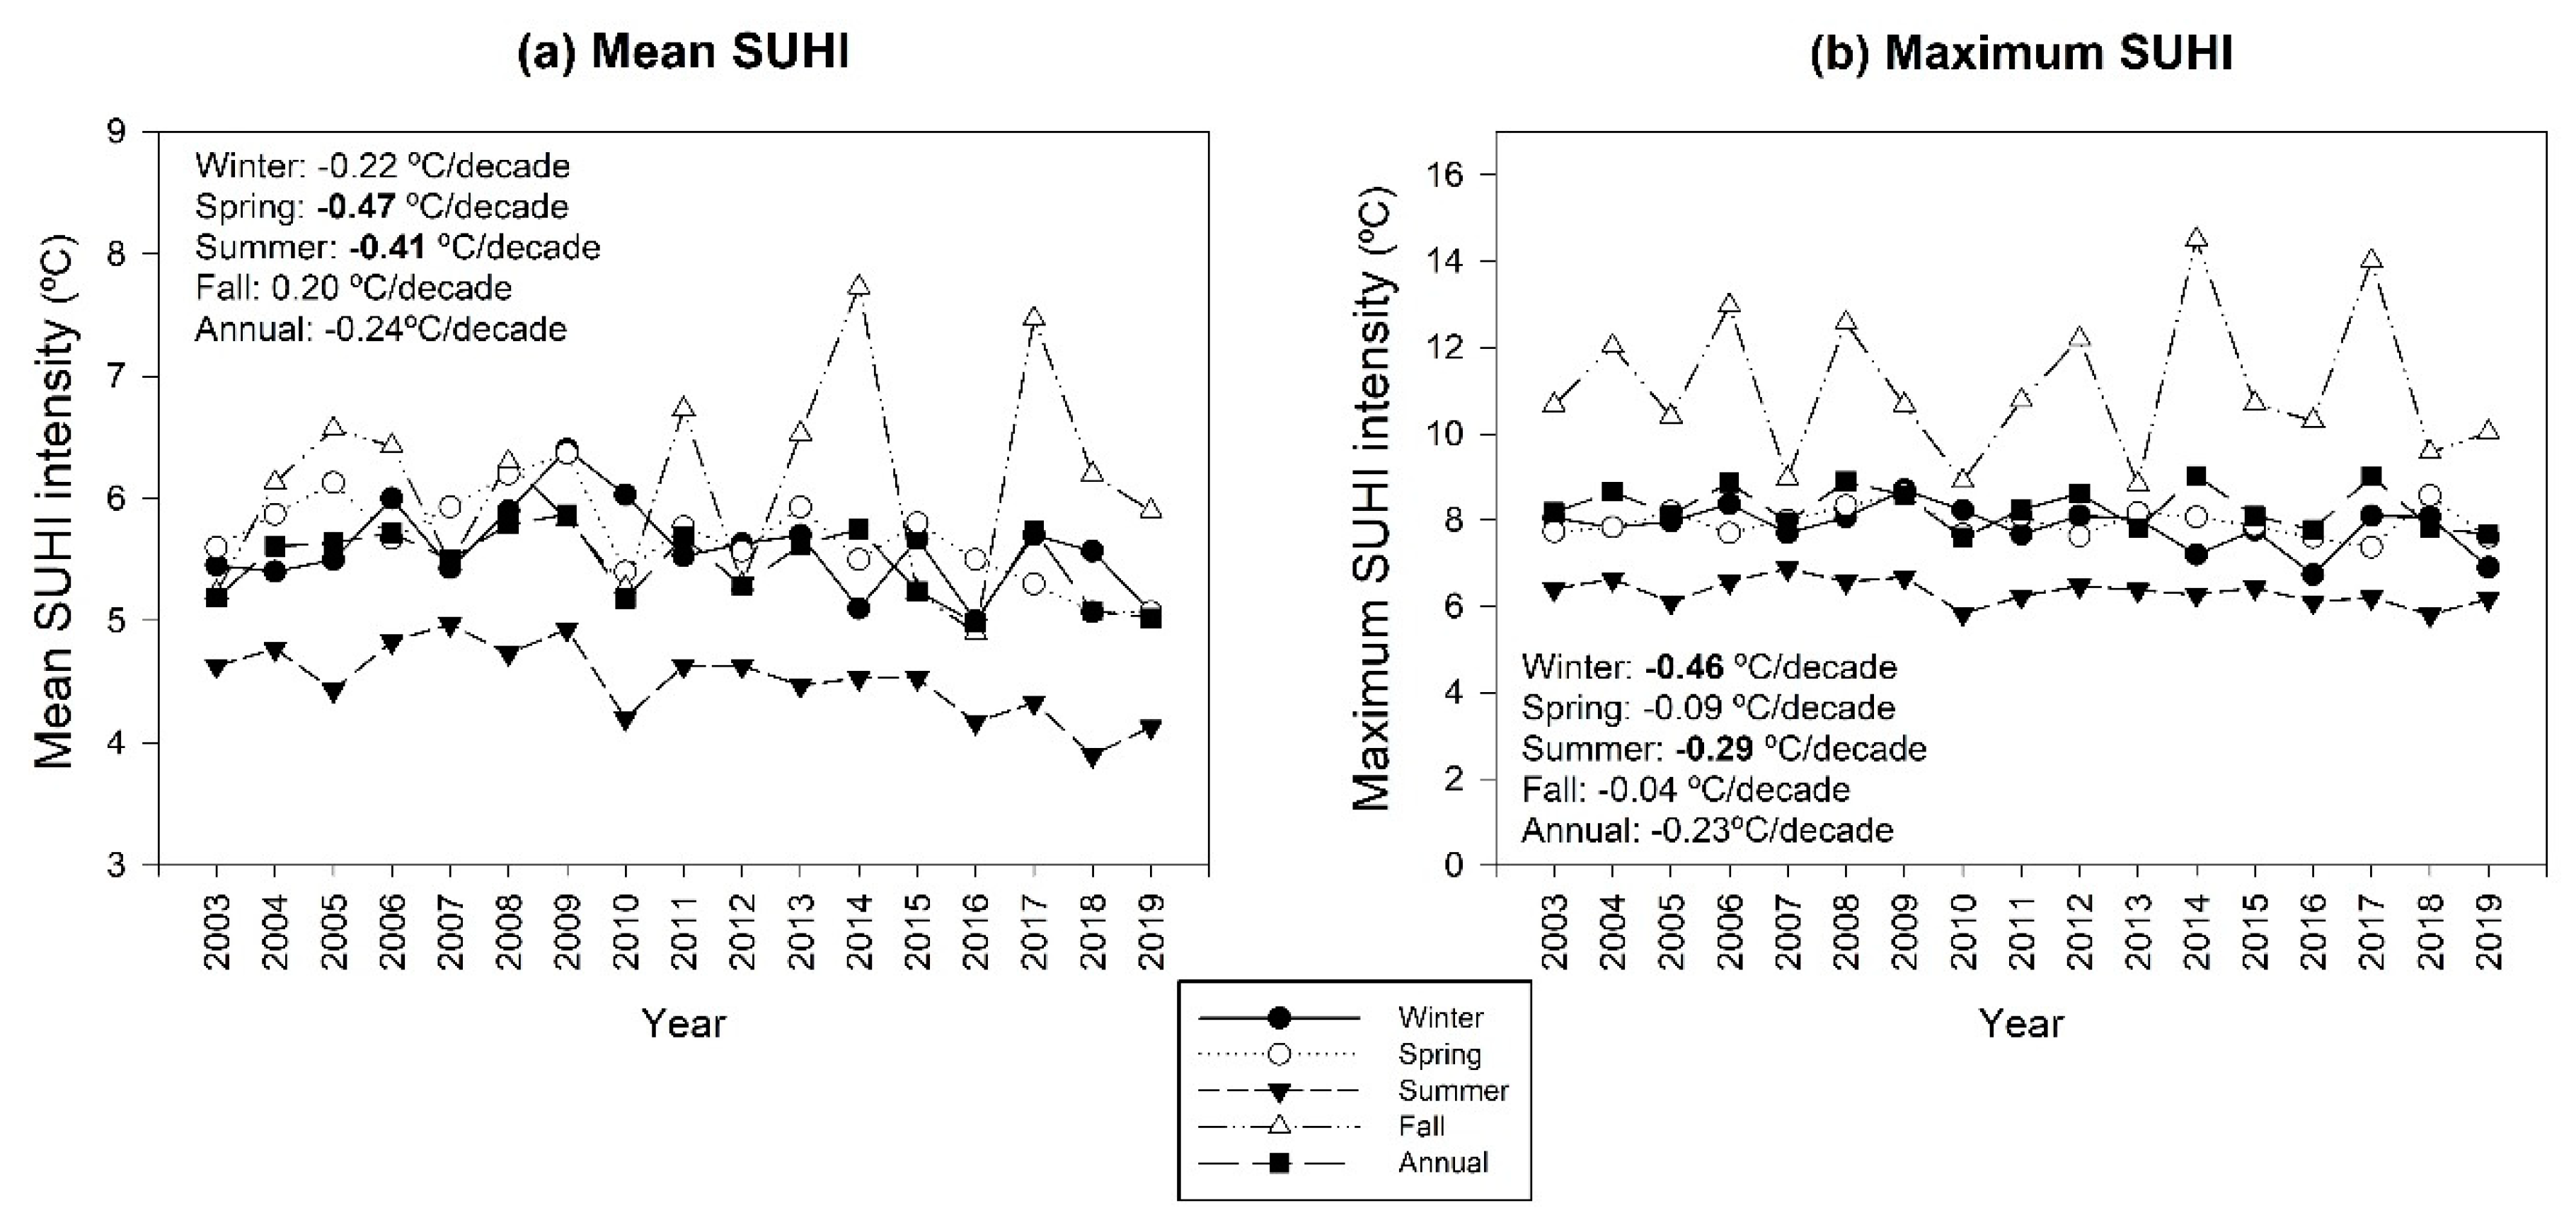
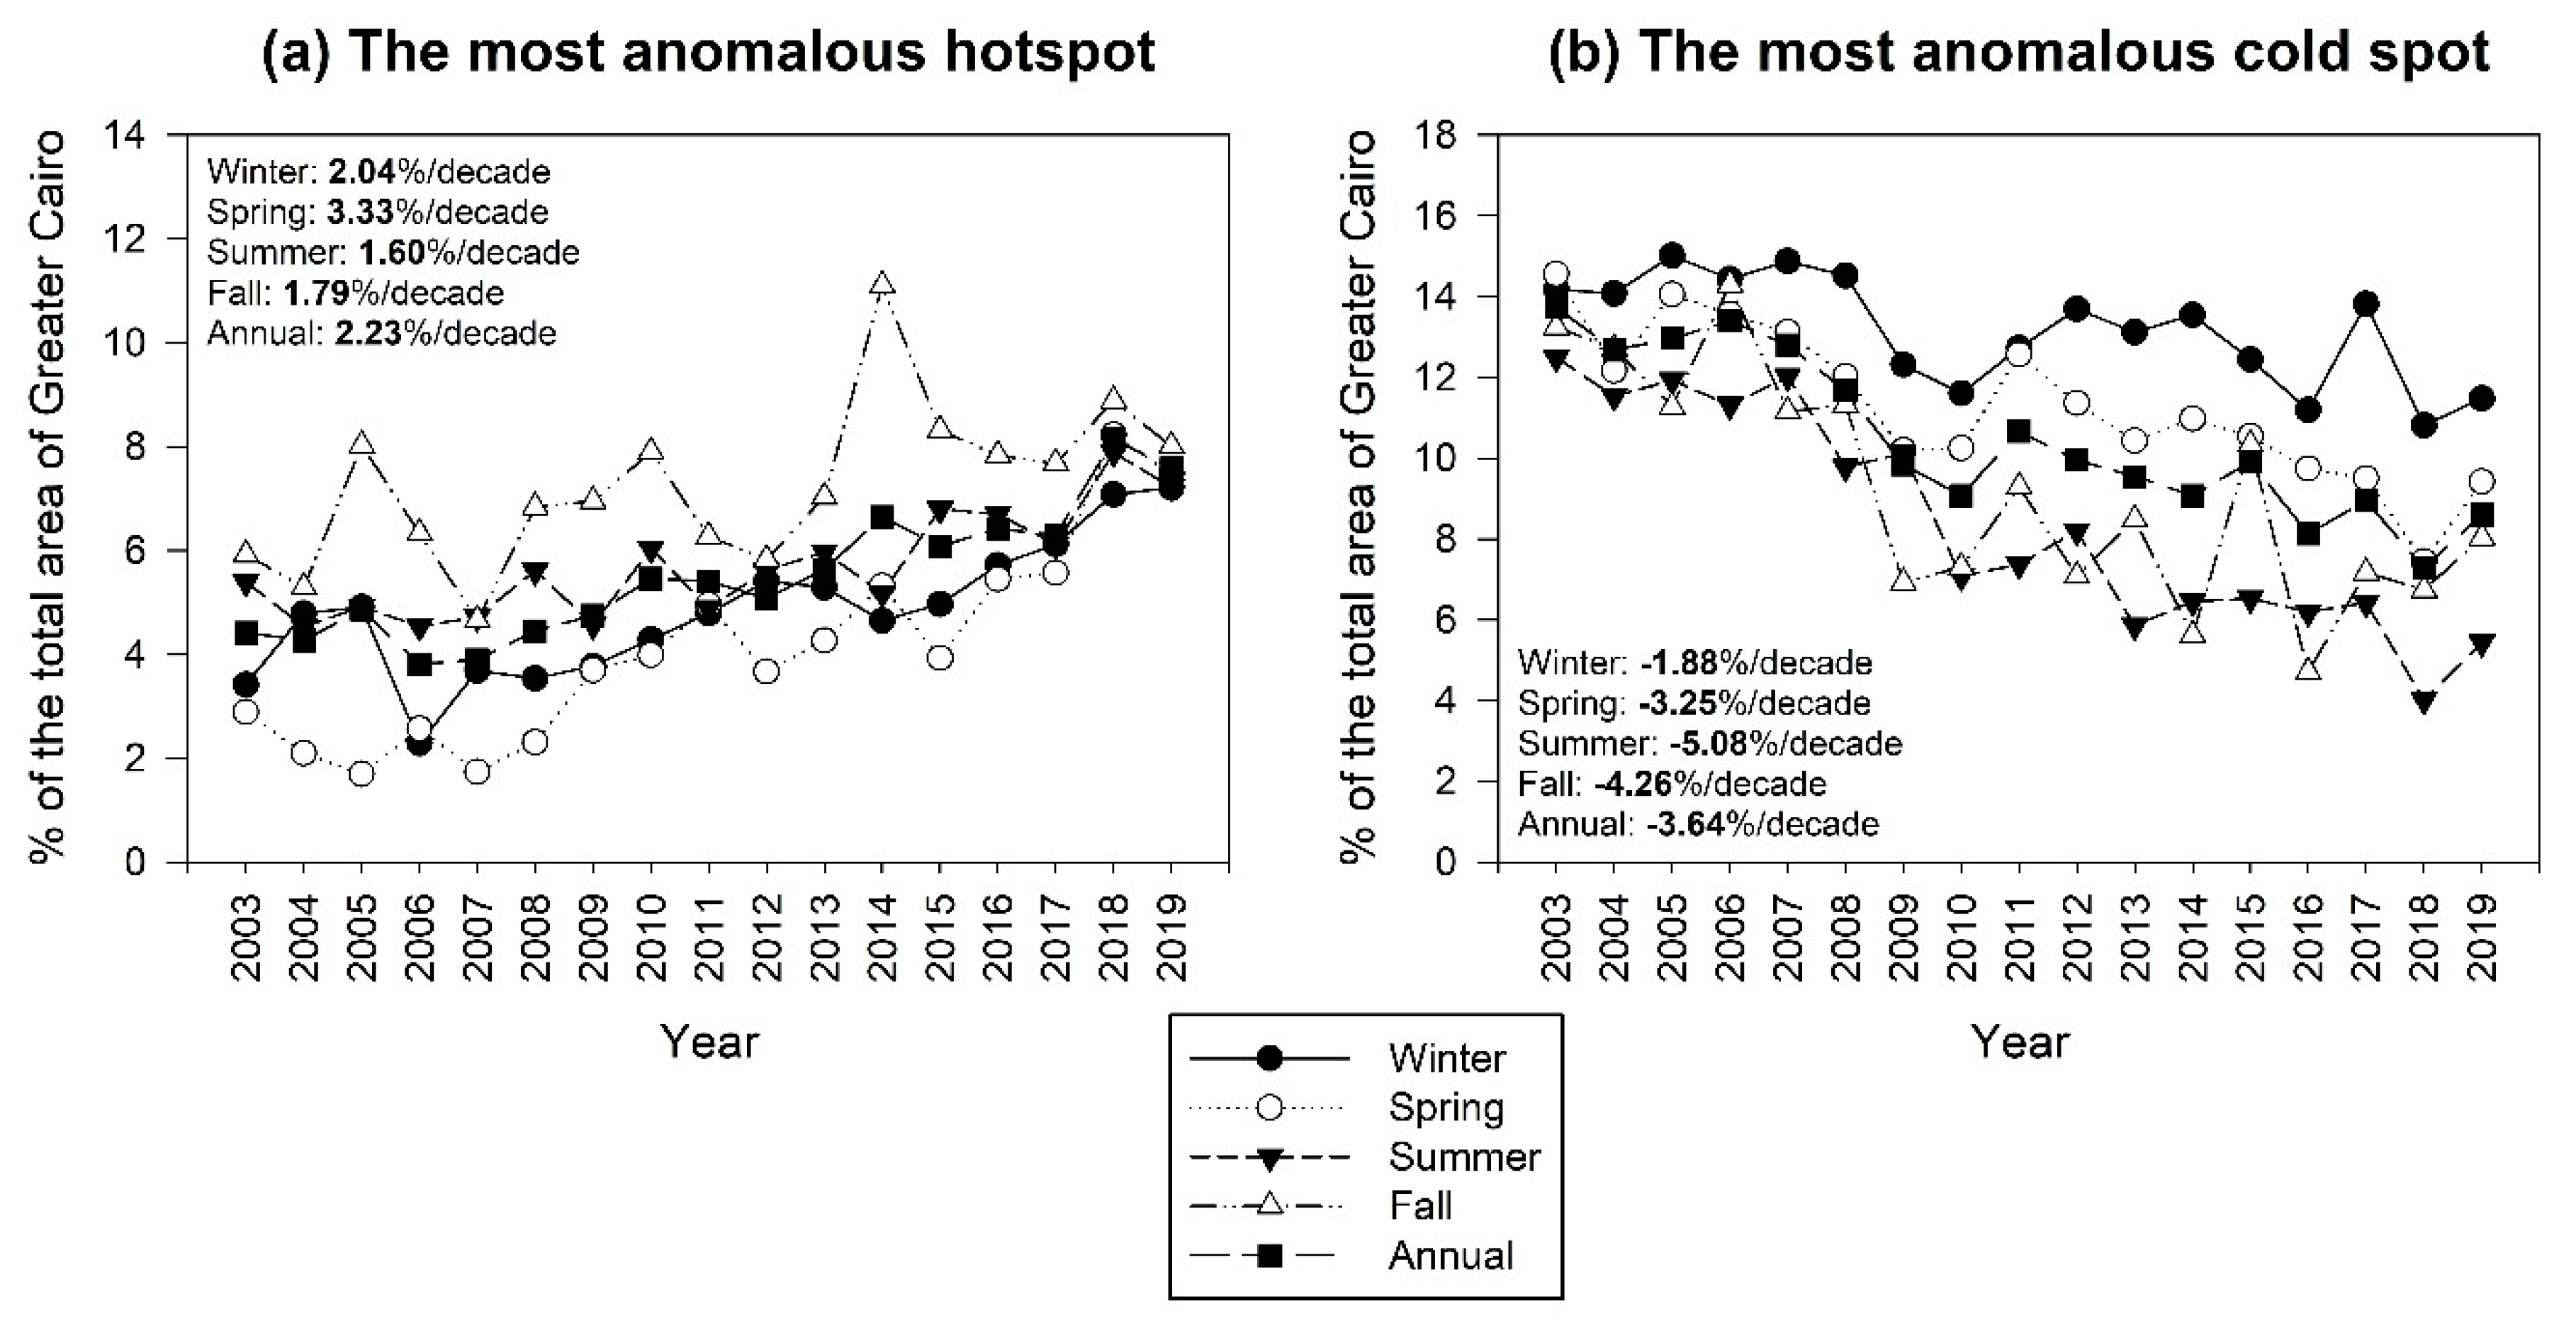
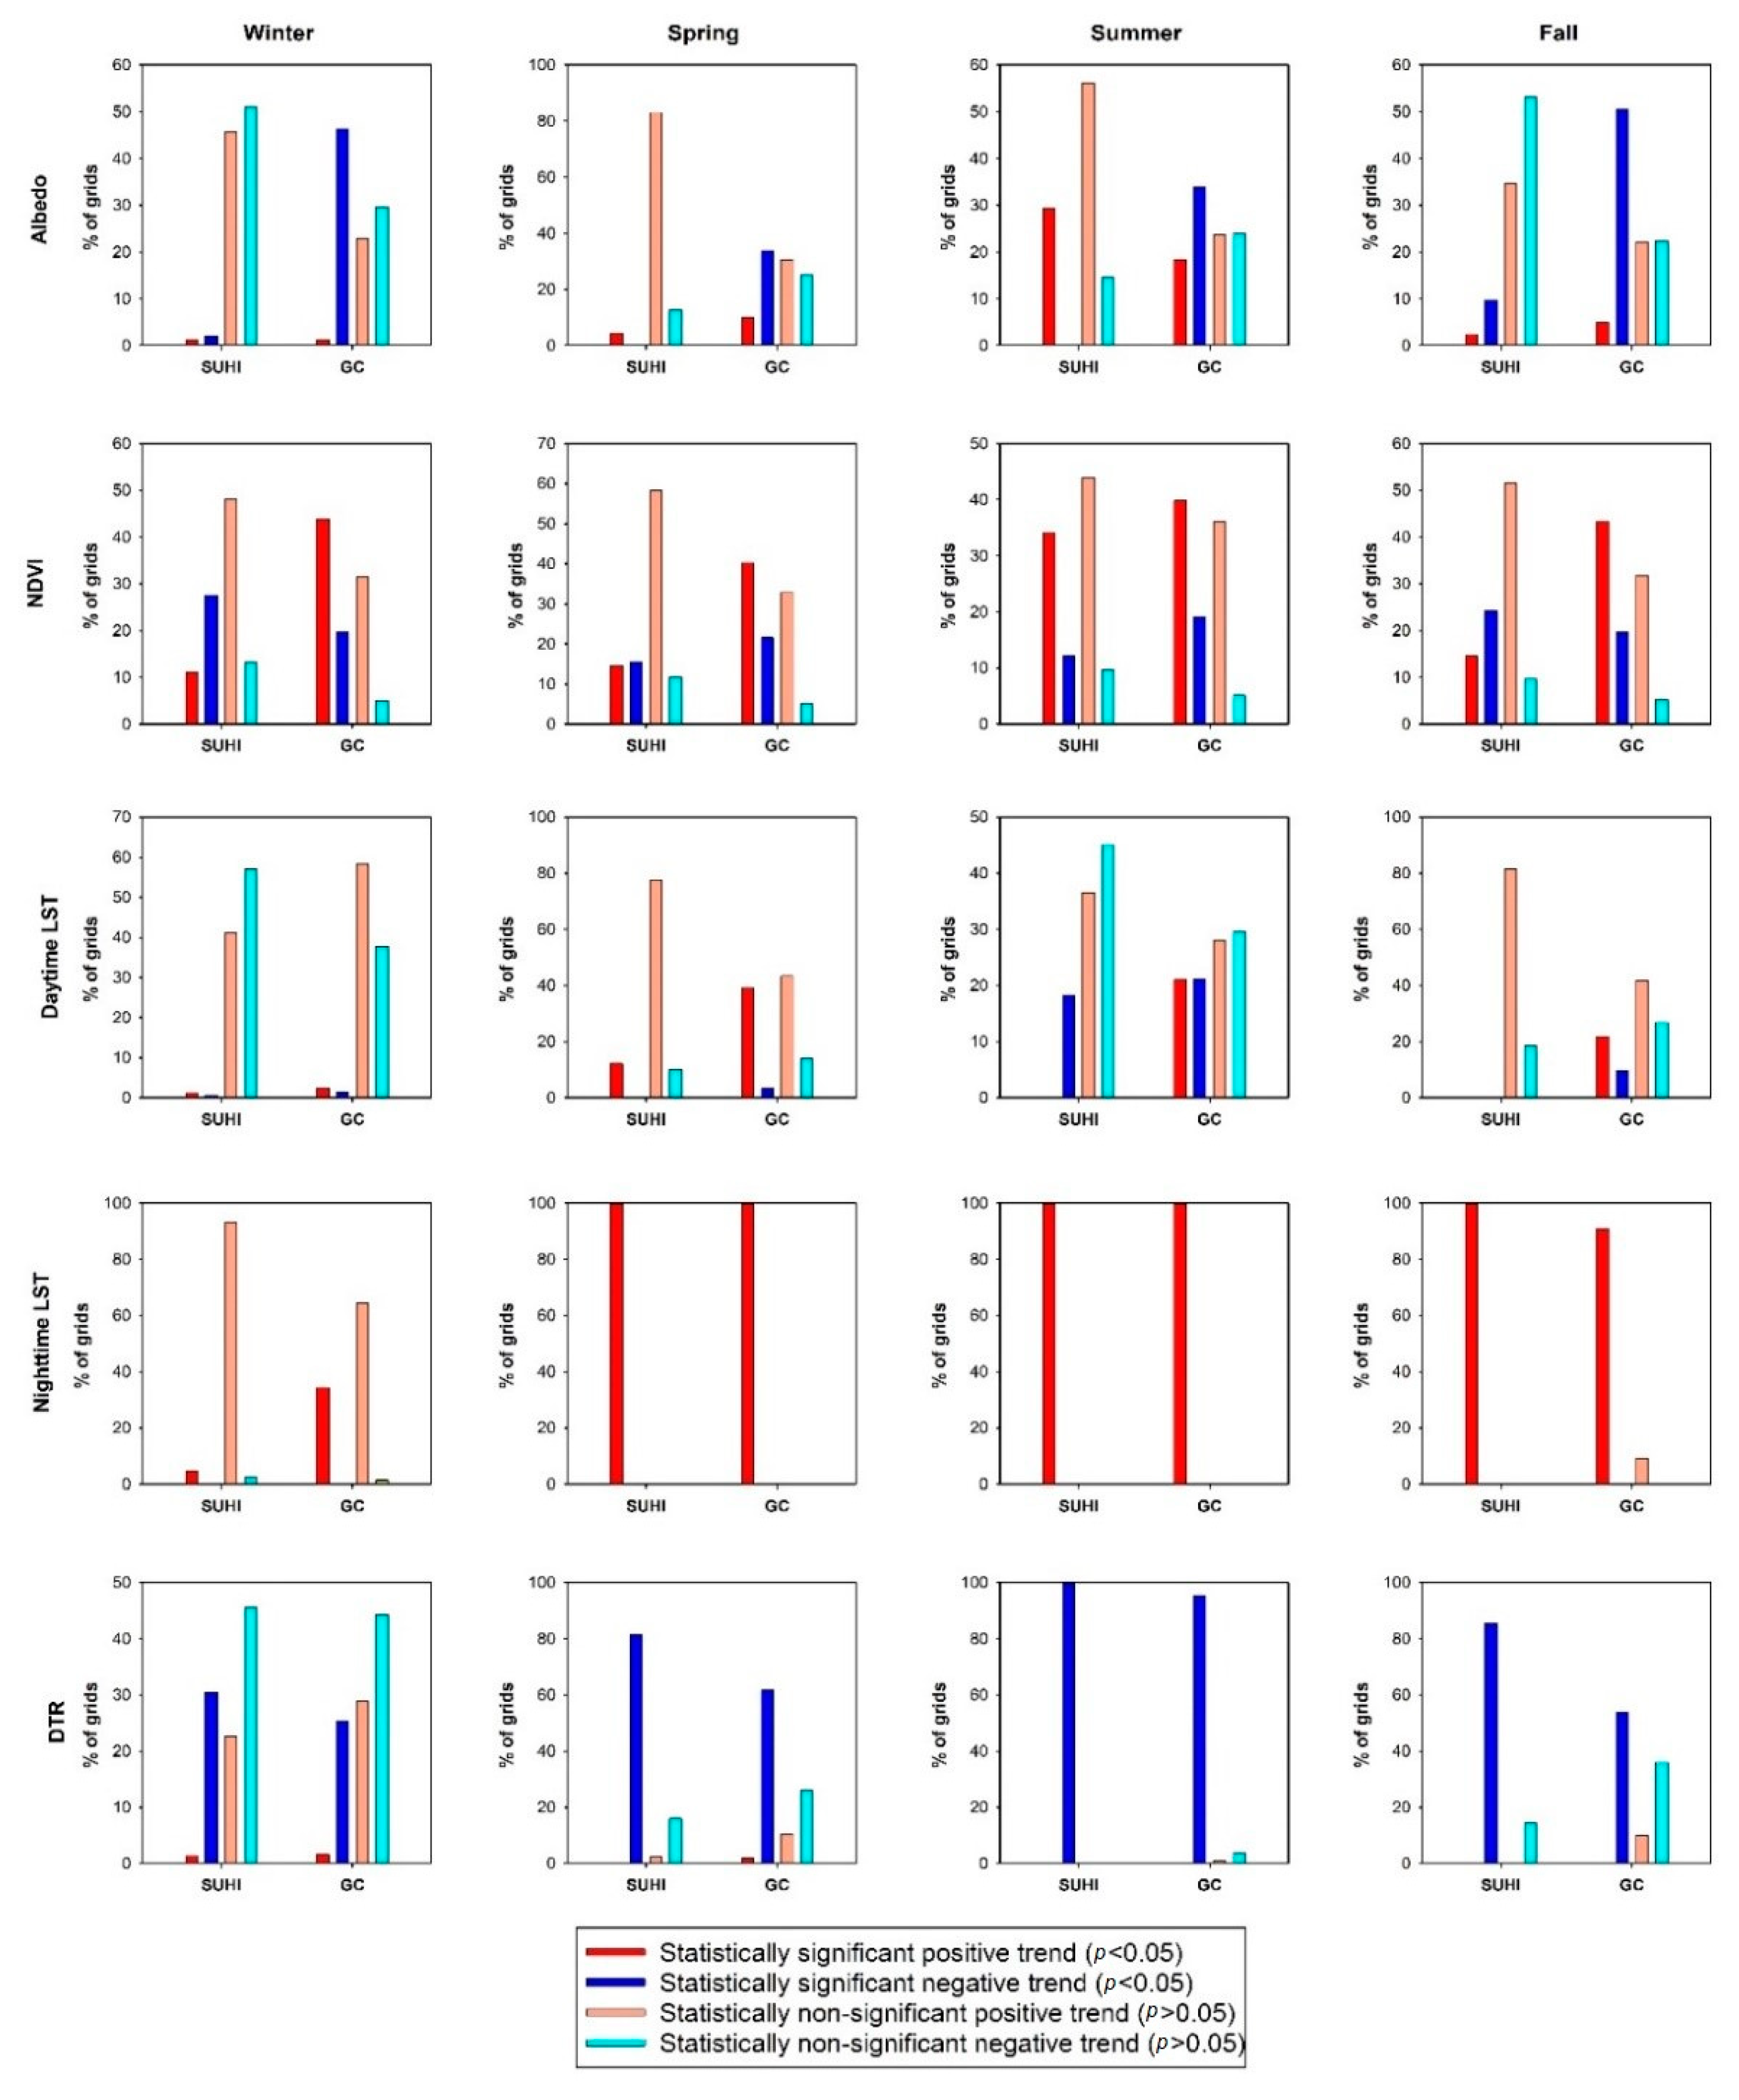
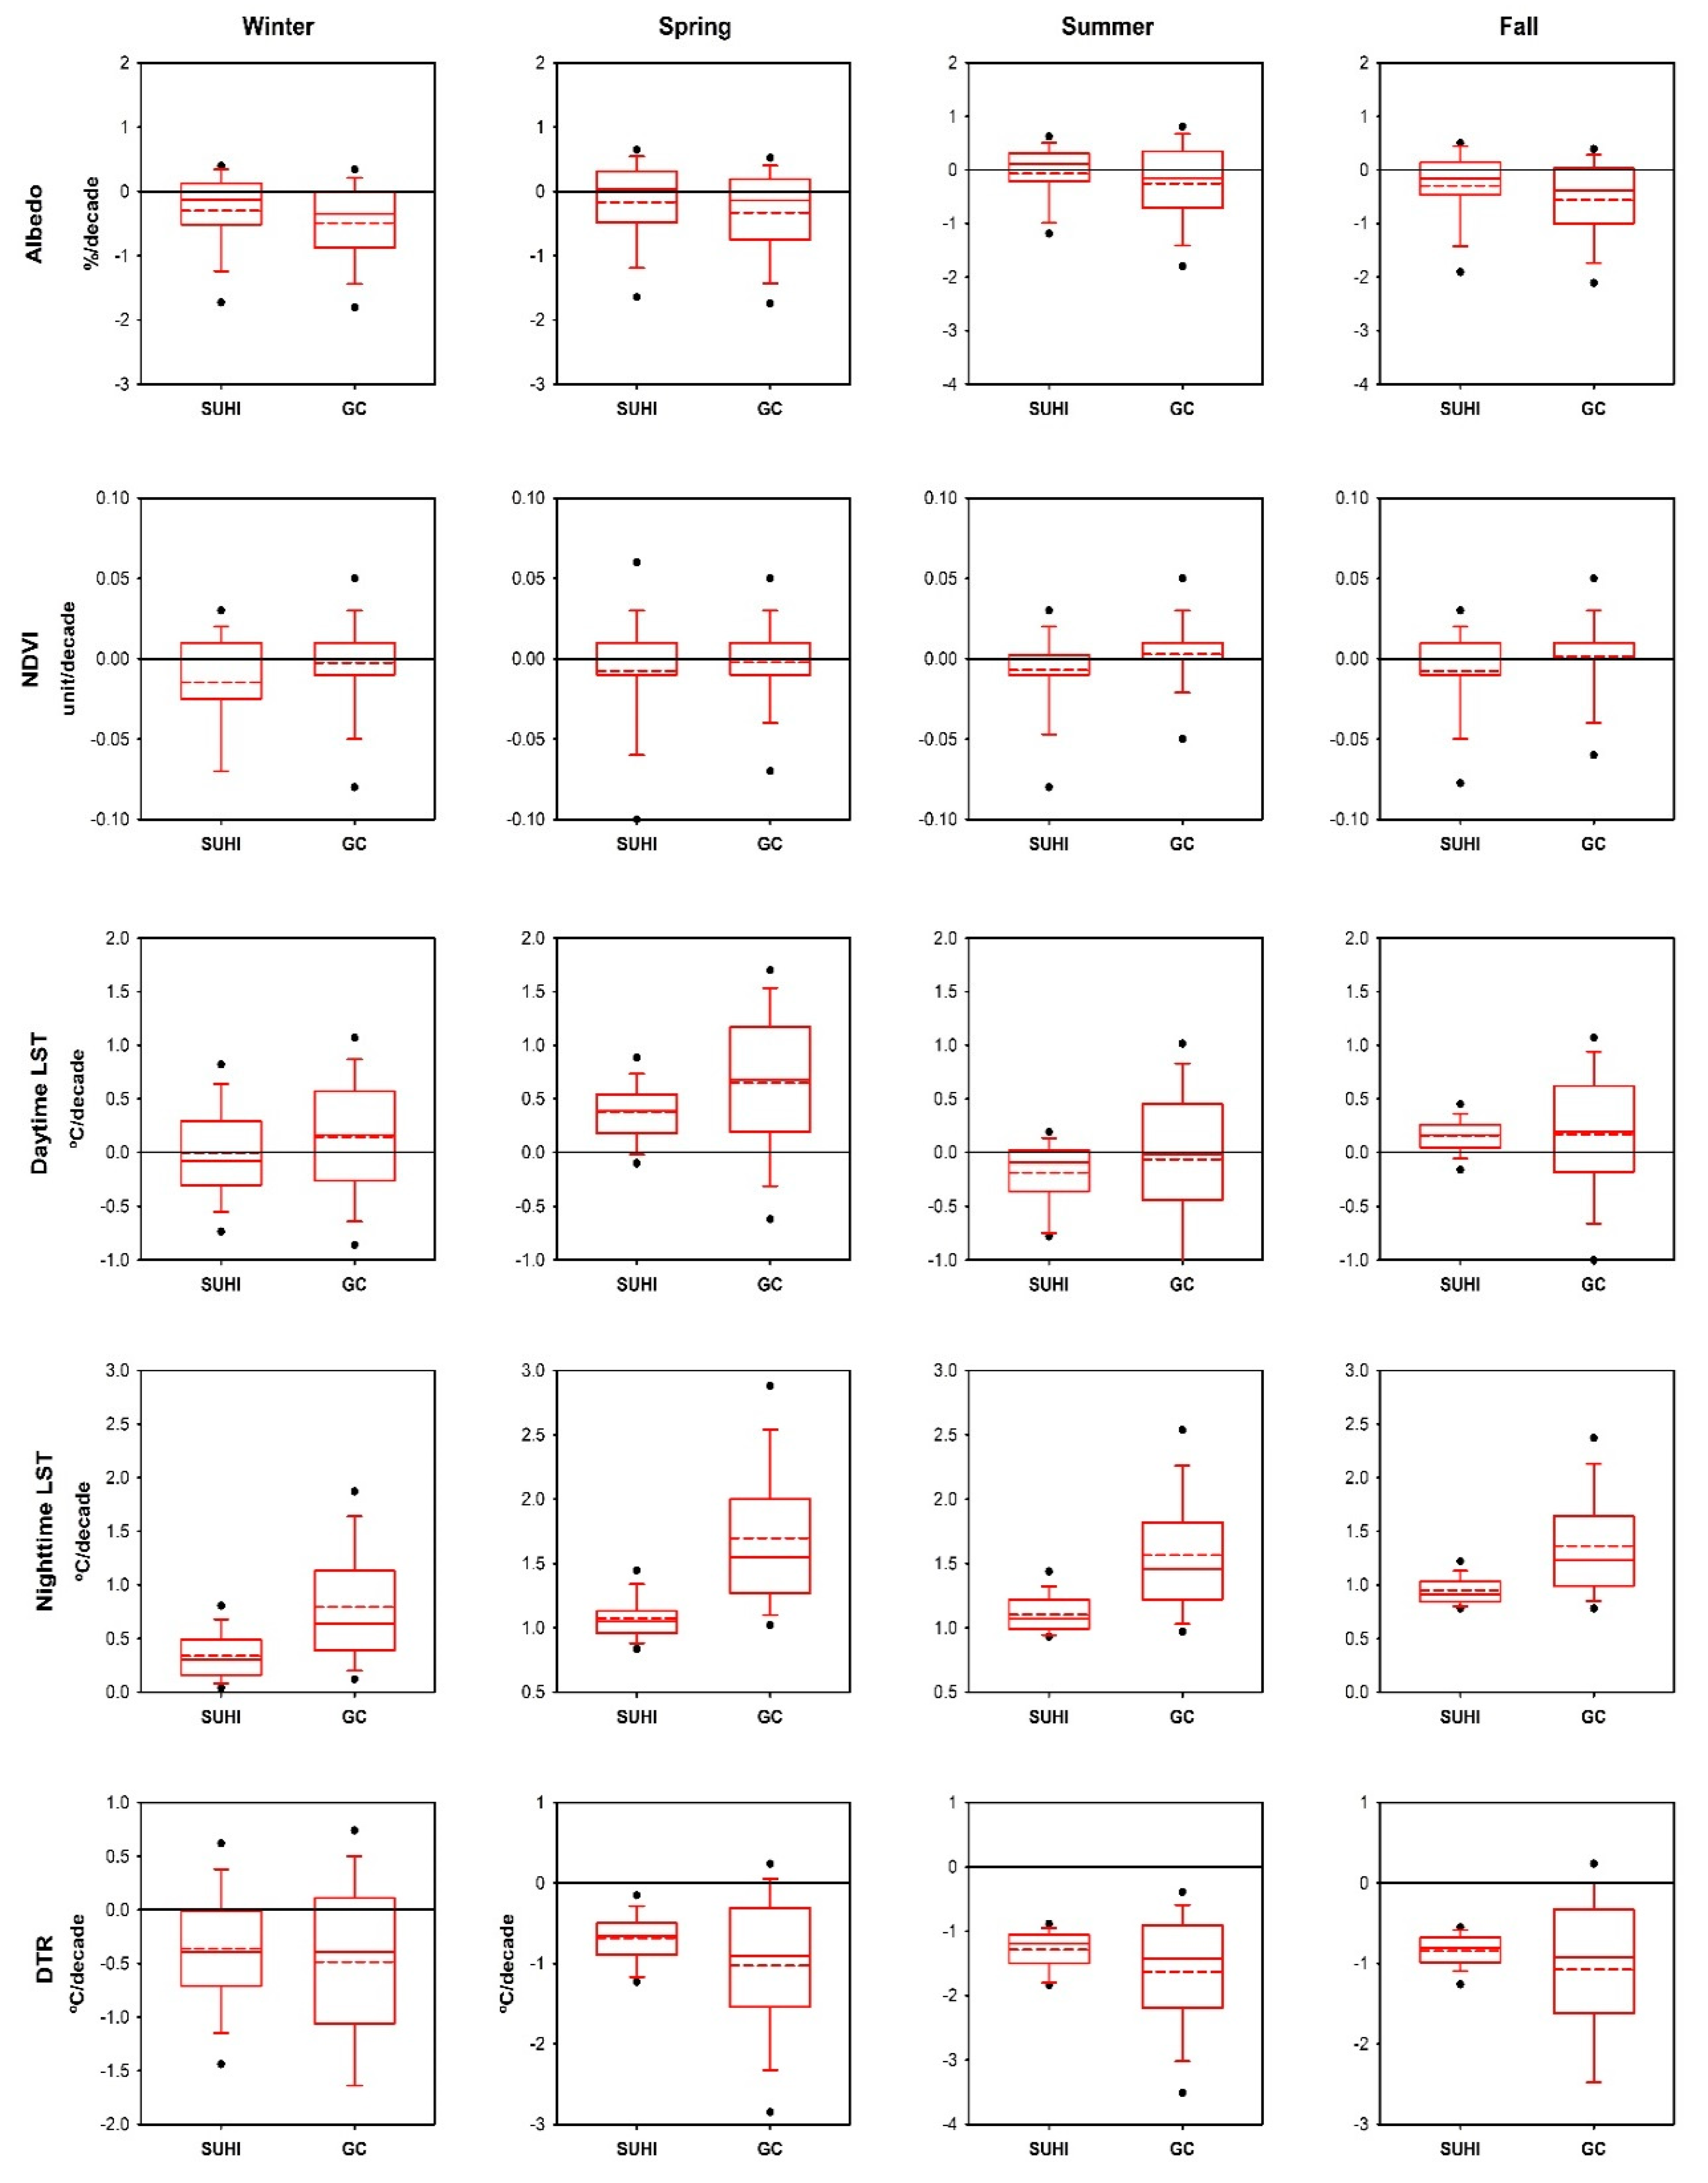
Changes in the intensity and spatial coverage of SUHI were analyzed using the least squares regression method and the modified Mann–Kendall statistic at the 95% significance level (p < 0.05). Results indicate a decline in the intensity of SUHI over Greater Cairo over the past 17 years, while an increase in the spatial extension of this island increased significantly. The decrease in the intensity of SUHI was mainly driven by stronger changes in albedo and daytime and nighttime LSTs over suburban areas, which modulated the intensity over central areas of the city.
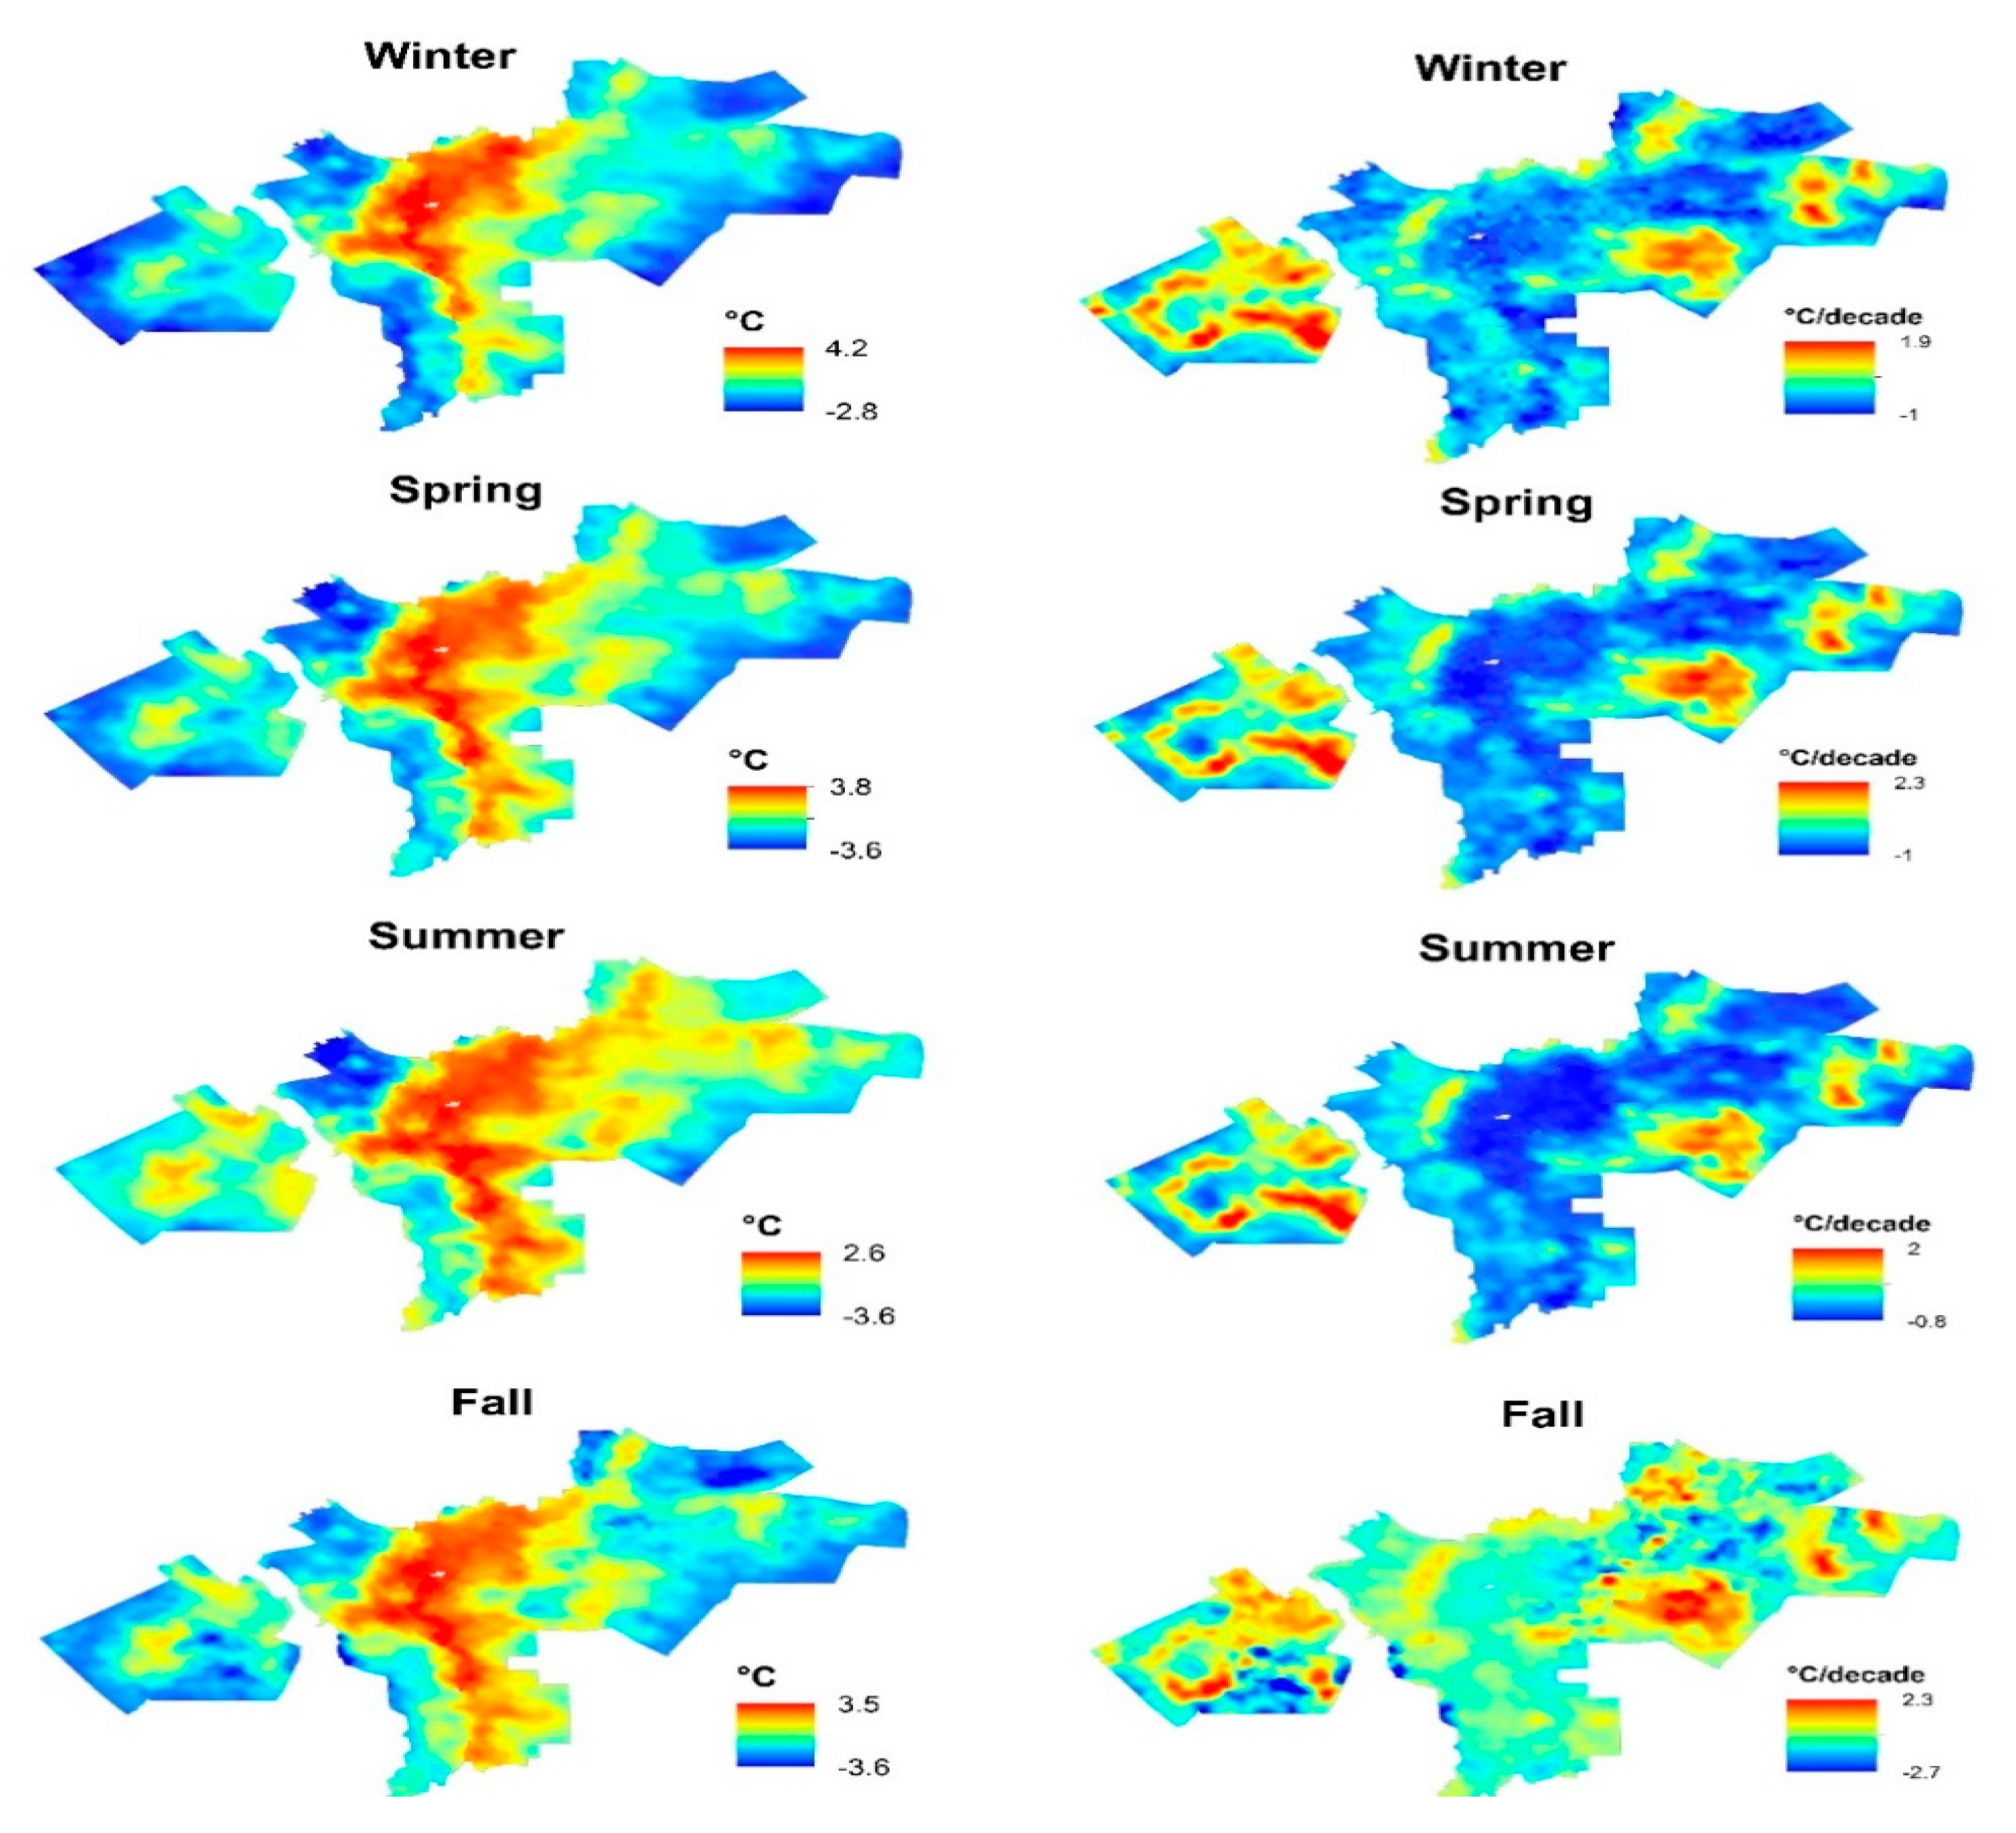
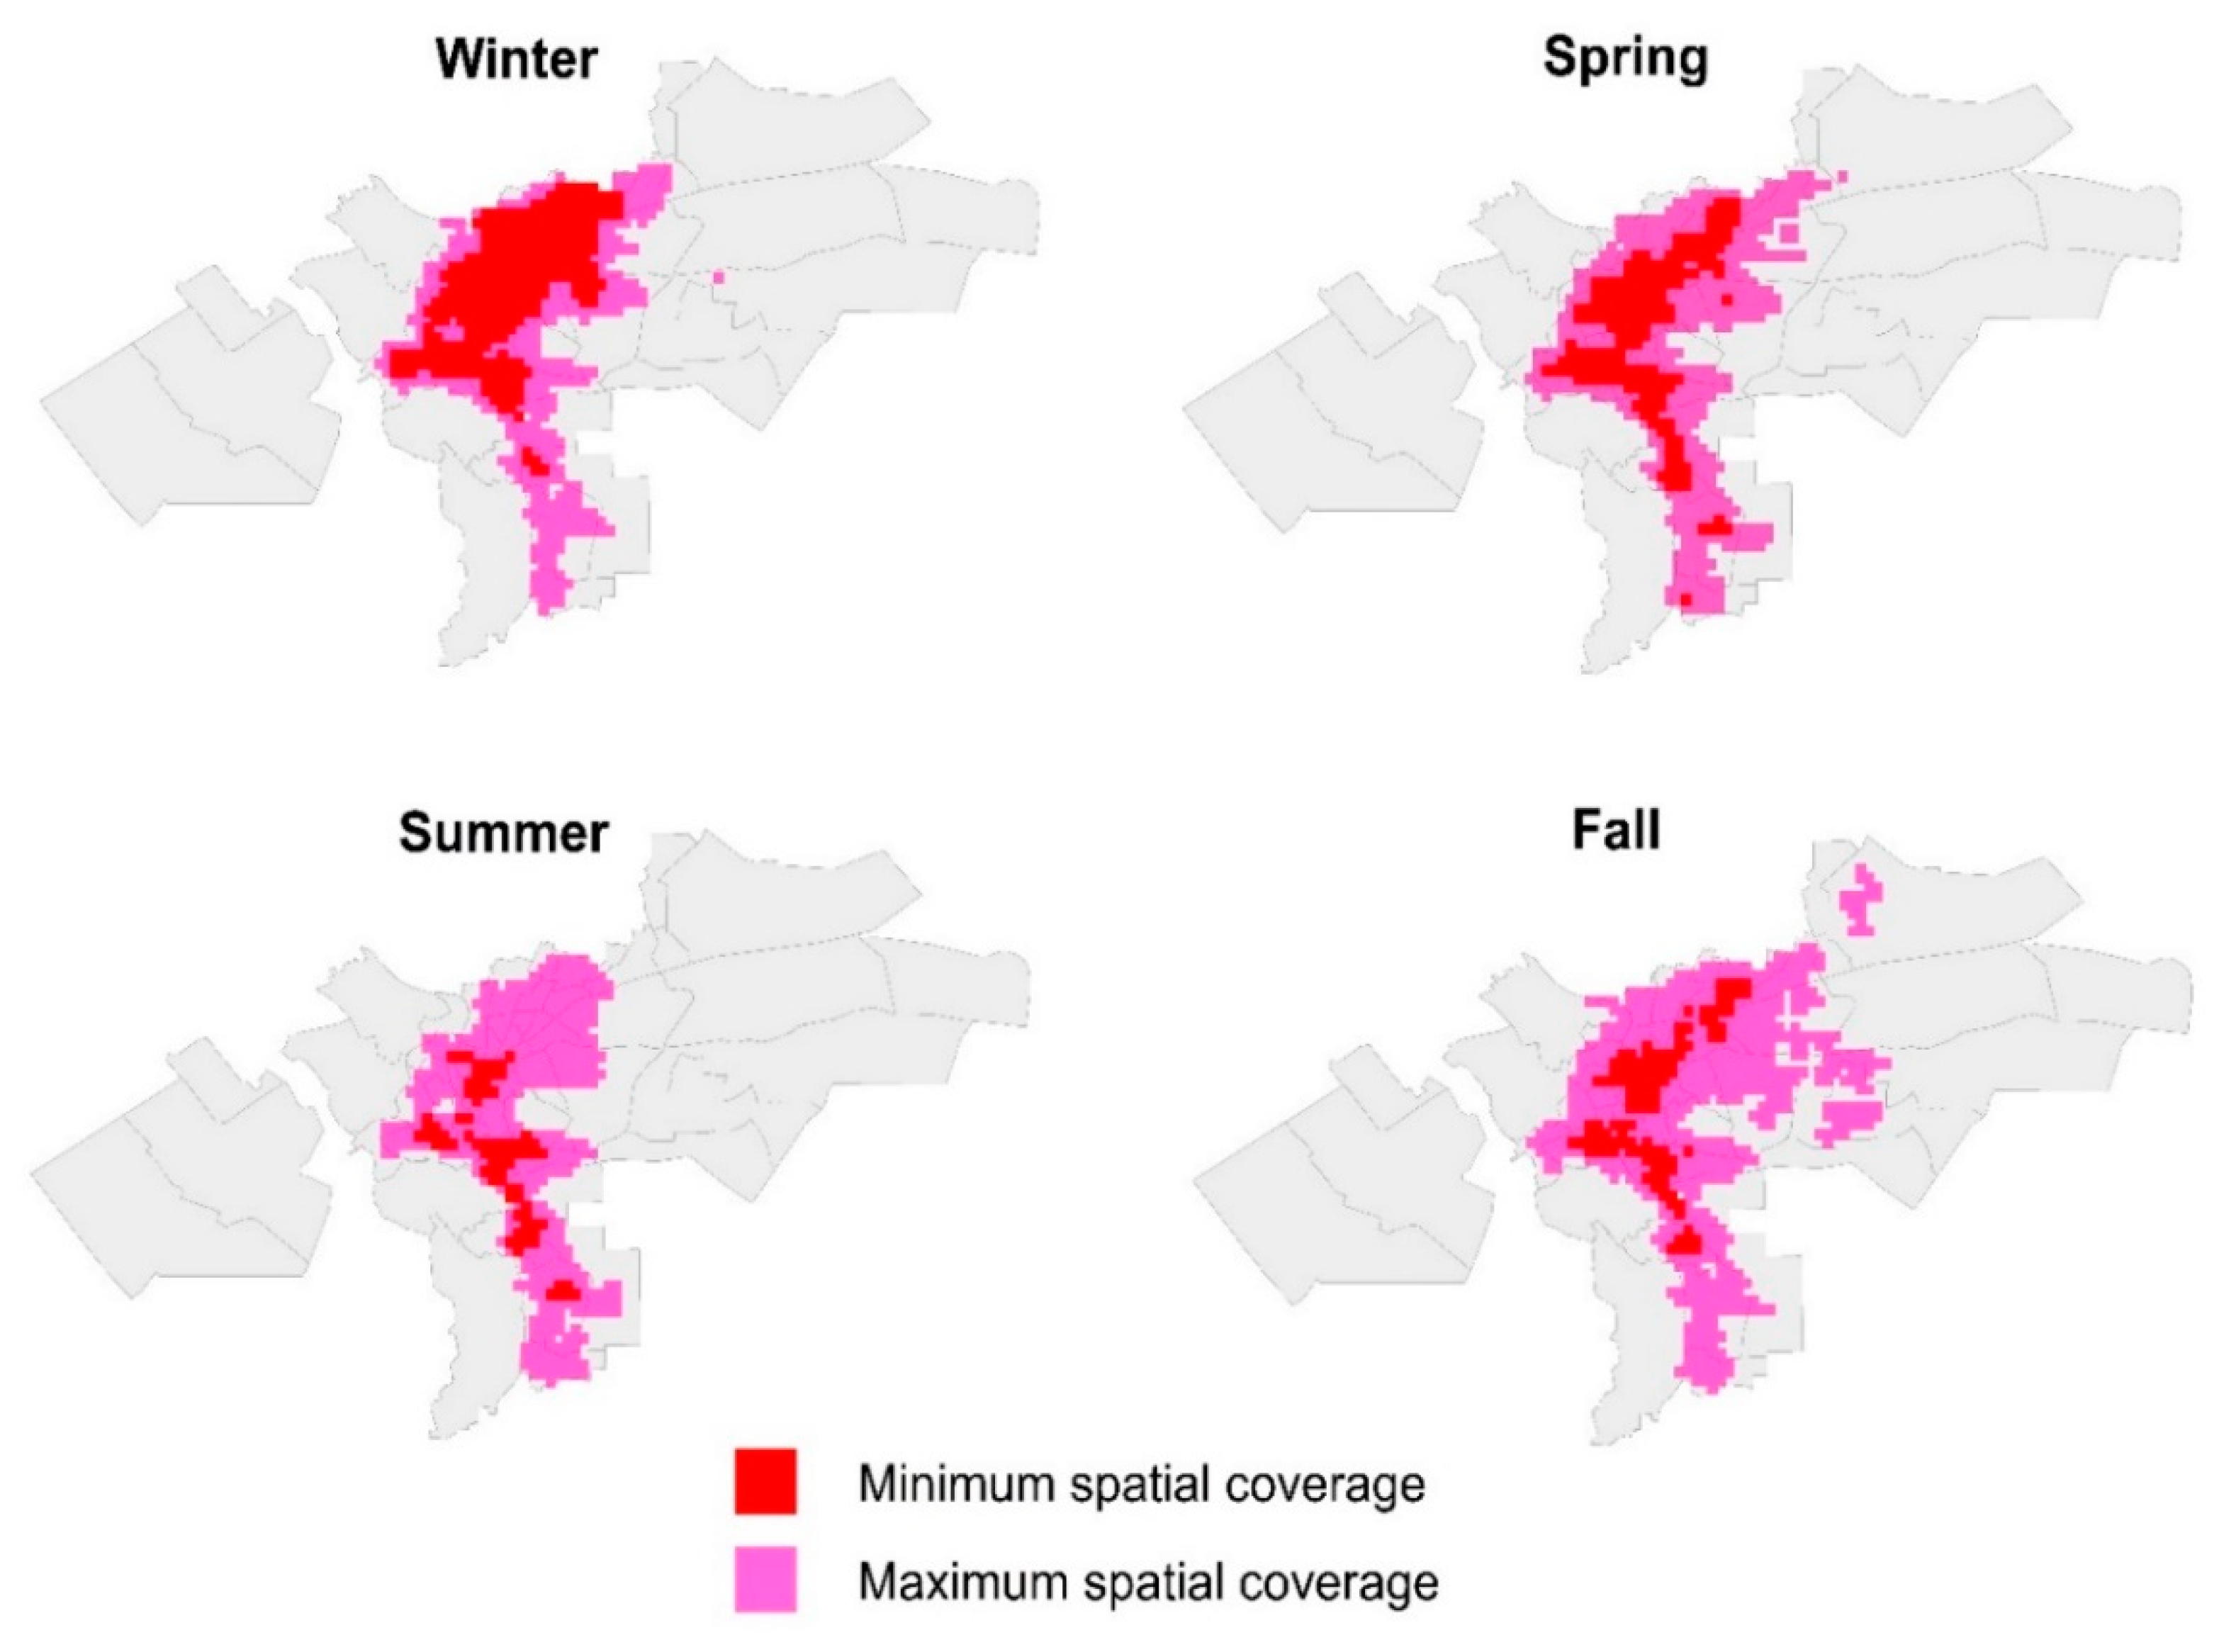
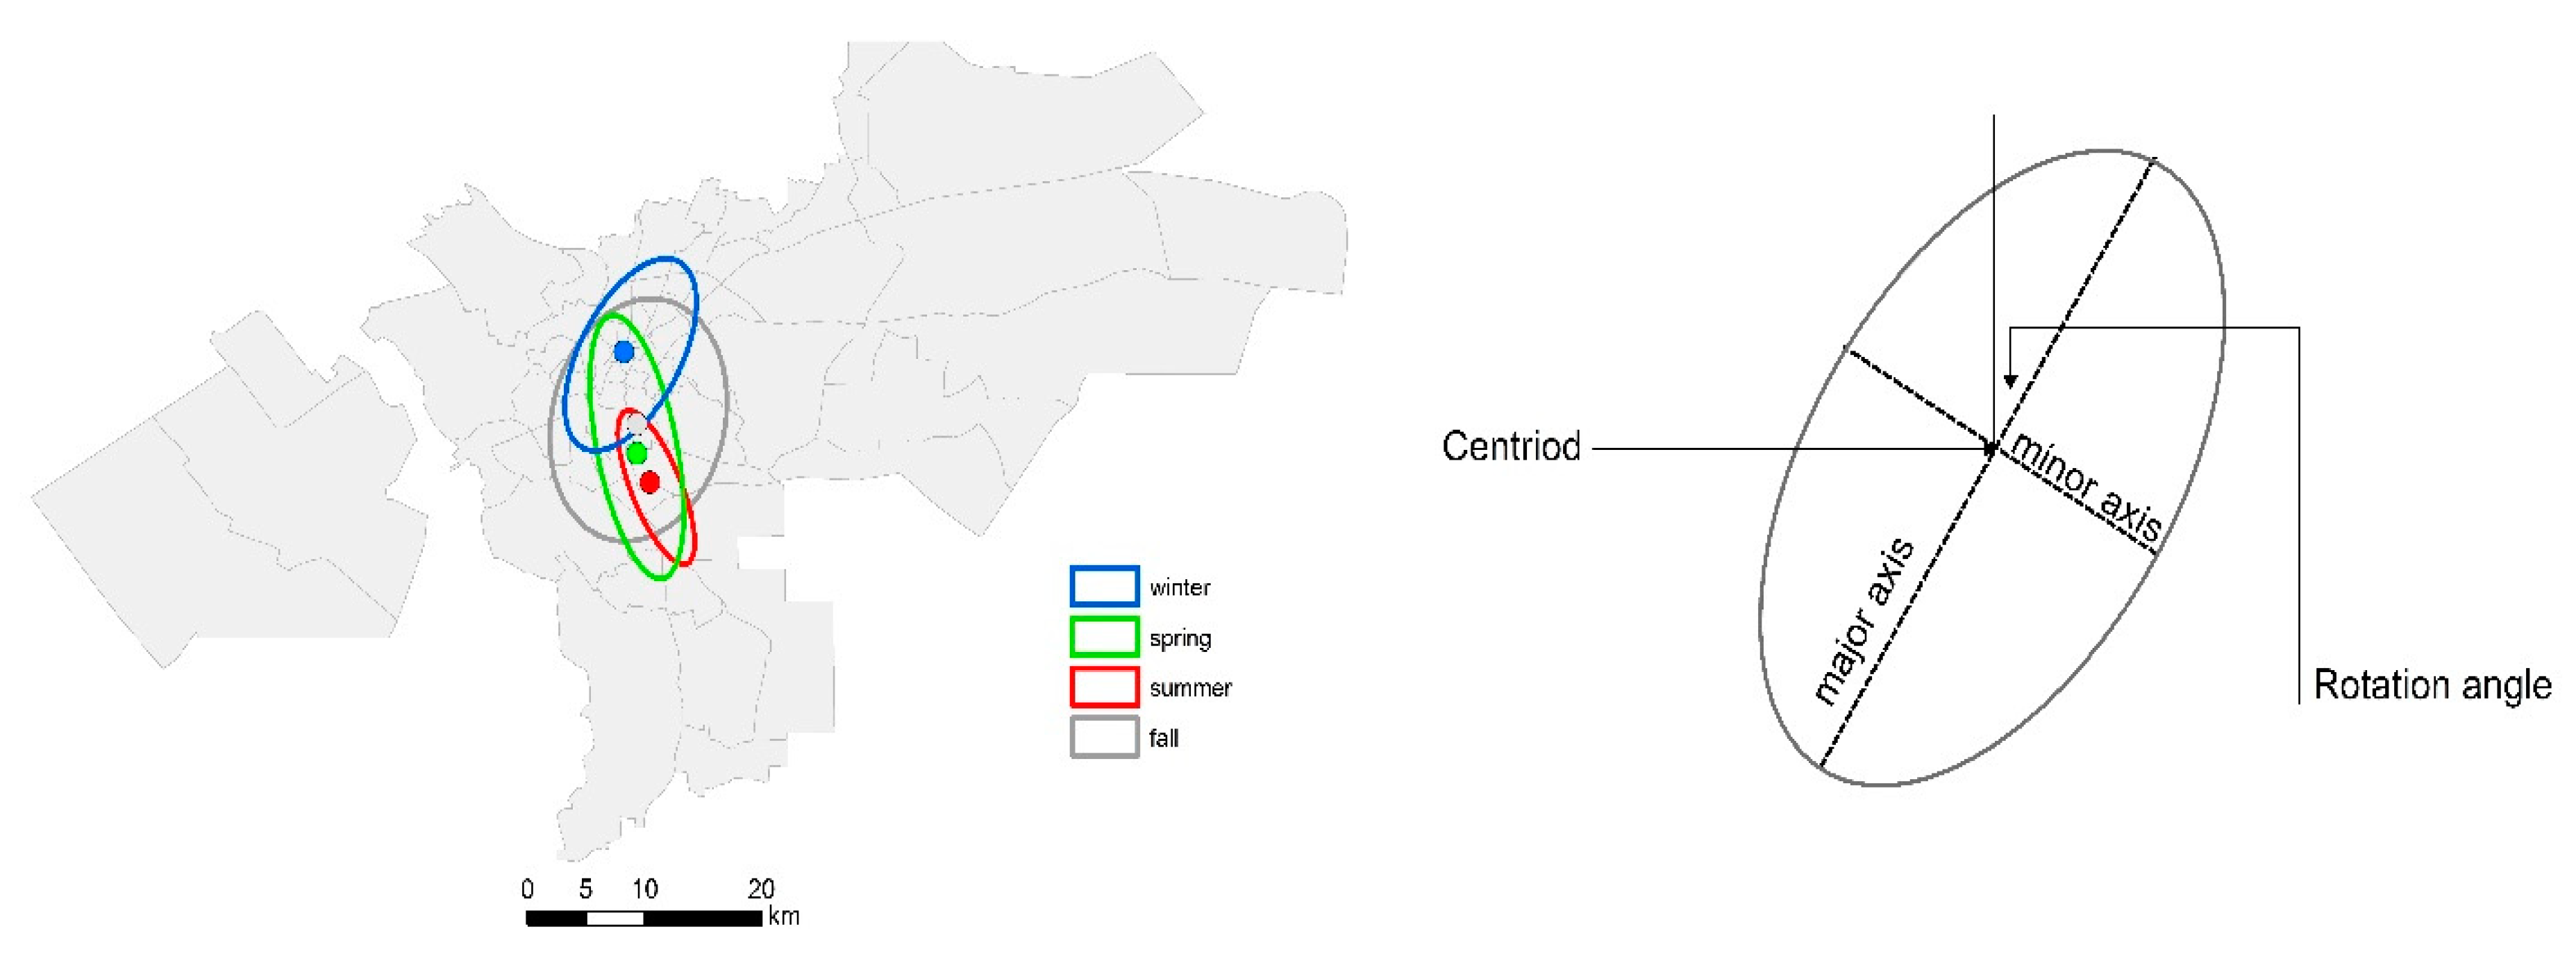
Based on the SDE algorithm, this study defined the dynamical changes of SUHI over space through defining changes in the centroid and orientation of SUHI. The SUHI is more compacted during summertime, while it is more extended over space in fall and spring. The development of SUHI occurs mainly over a northern and northeastern trajectory, while its development is constrained in the eastern and western directions.
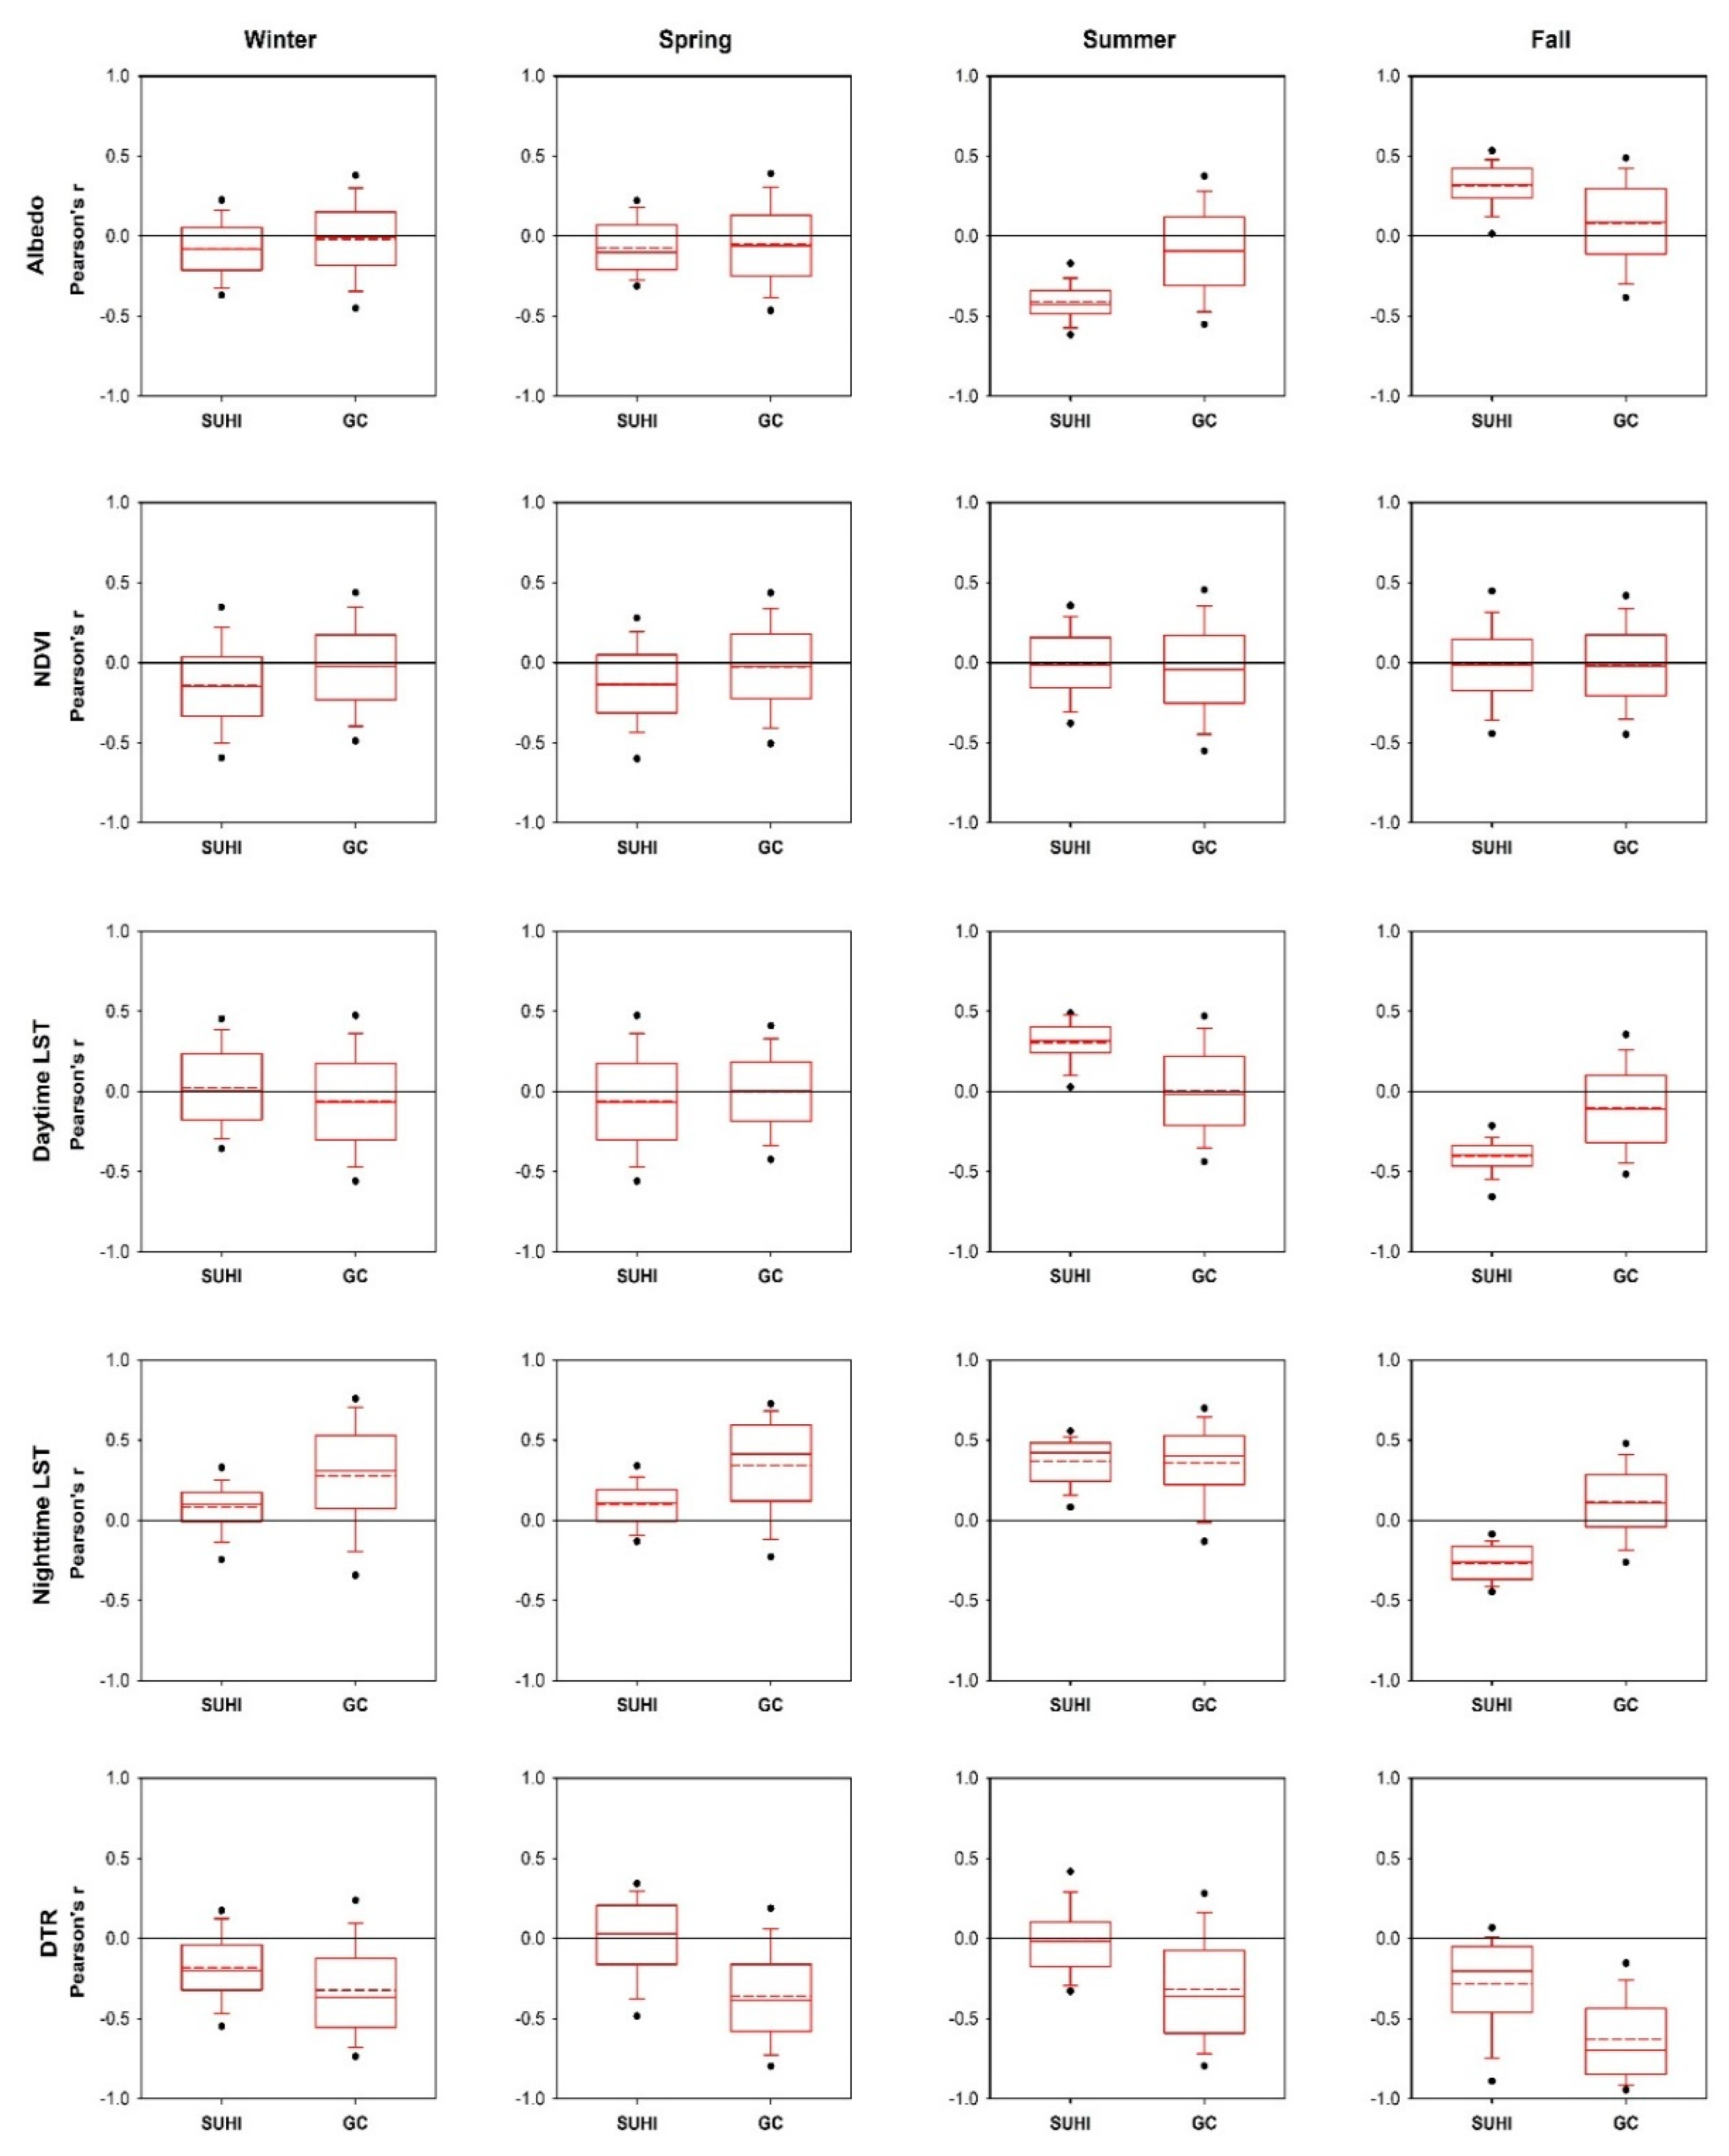
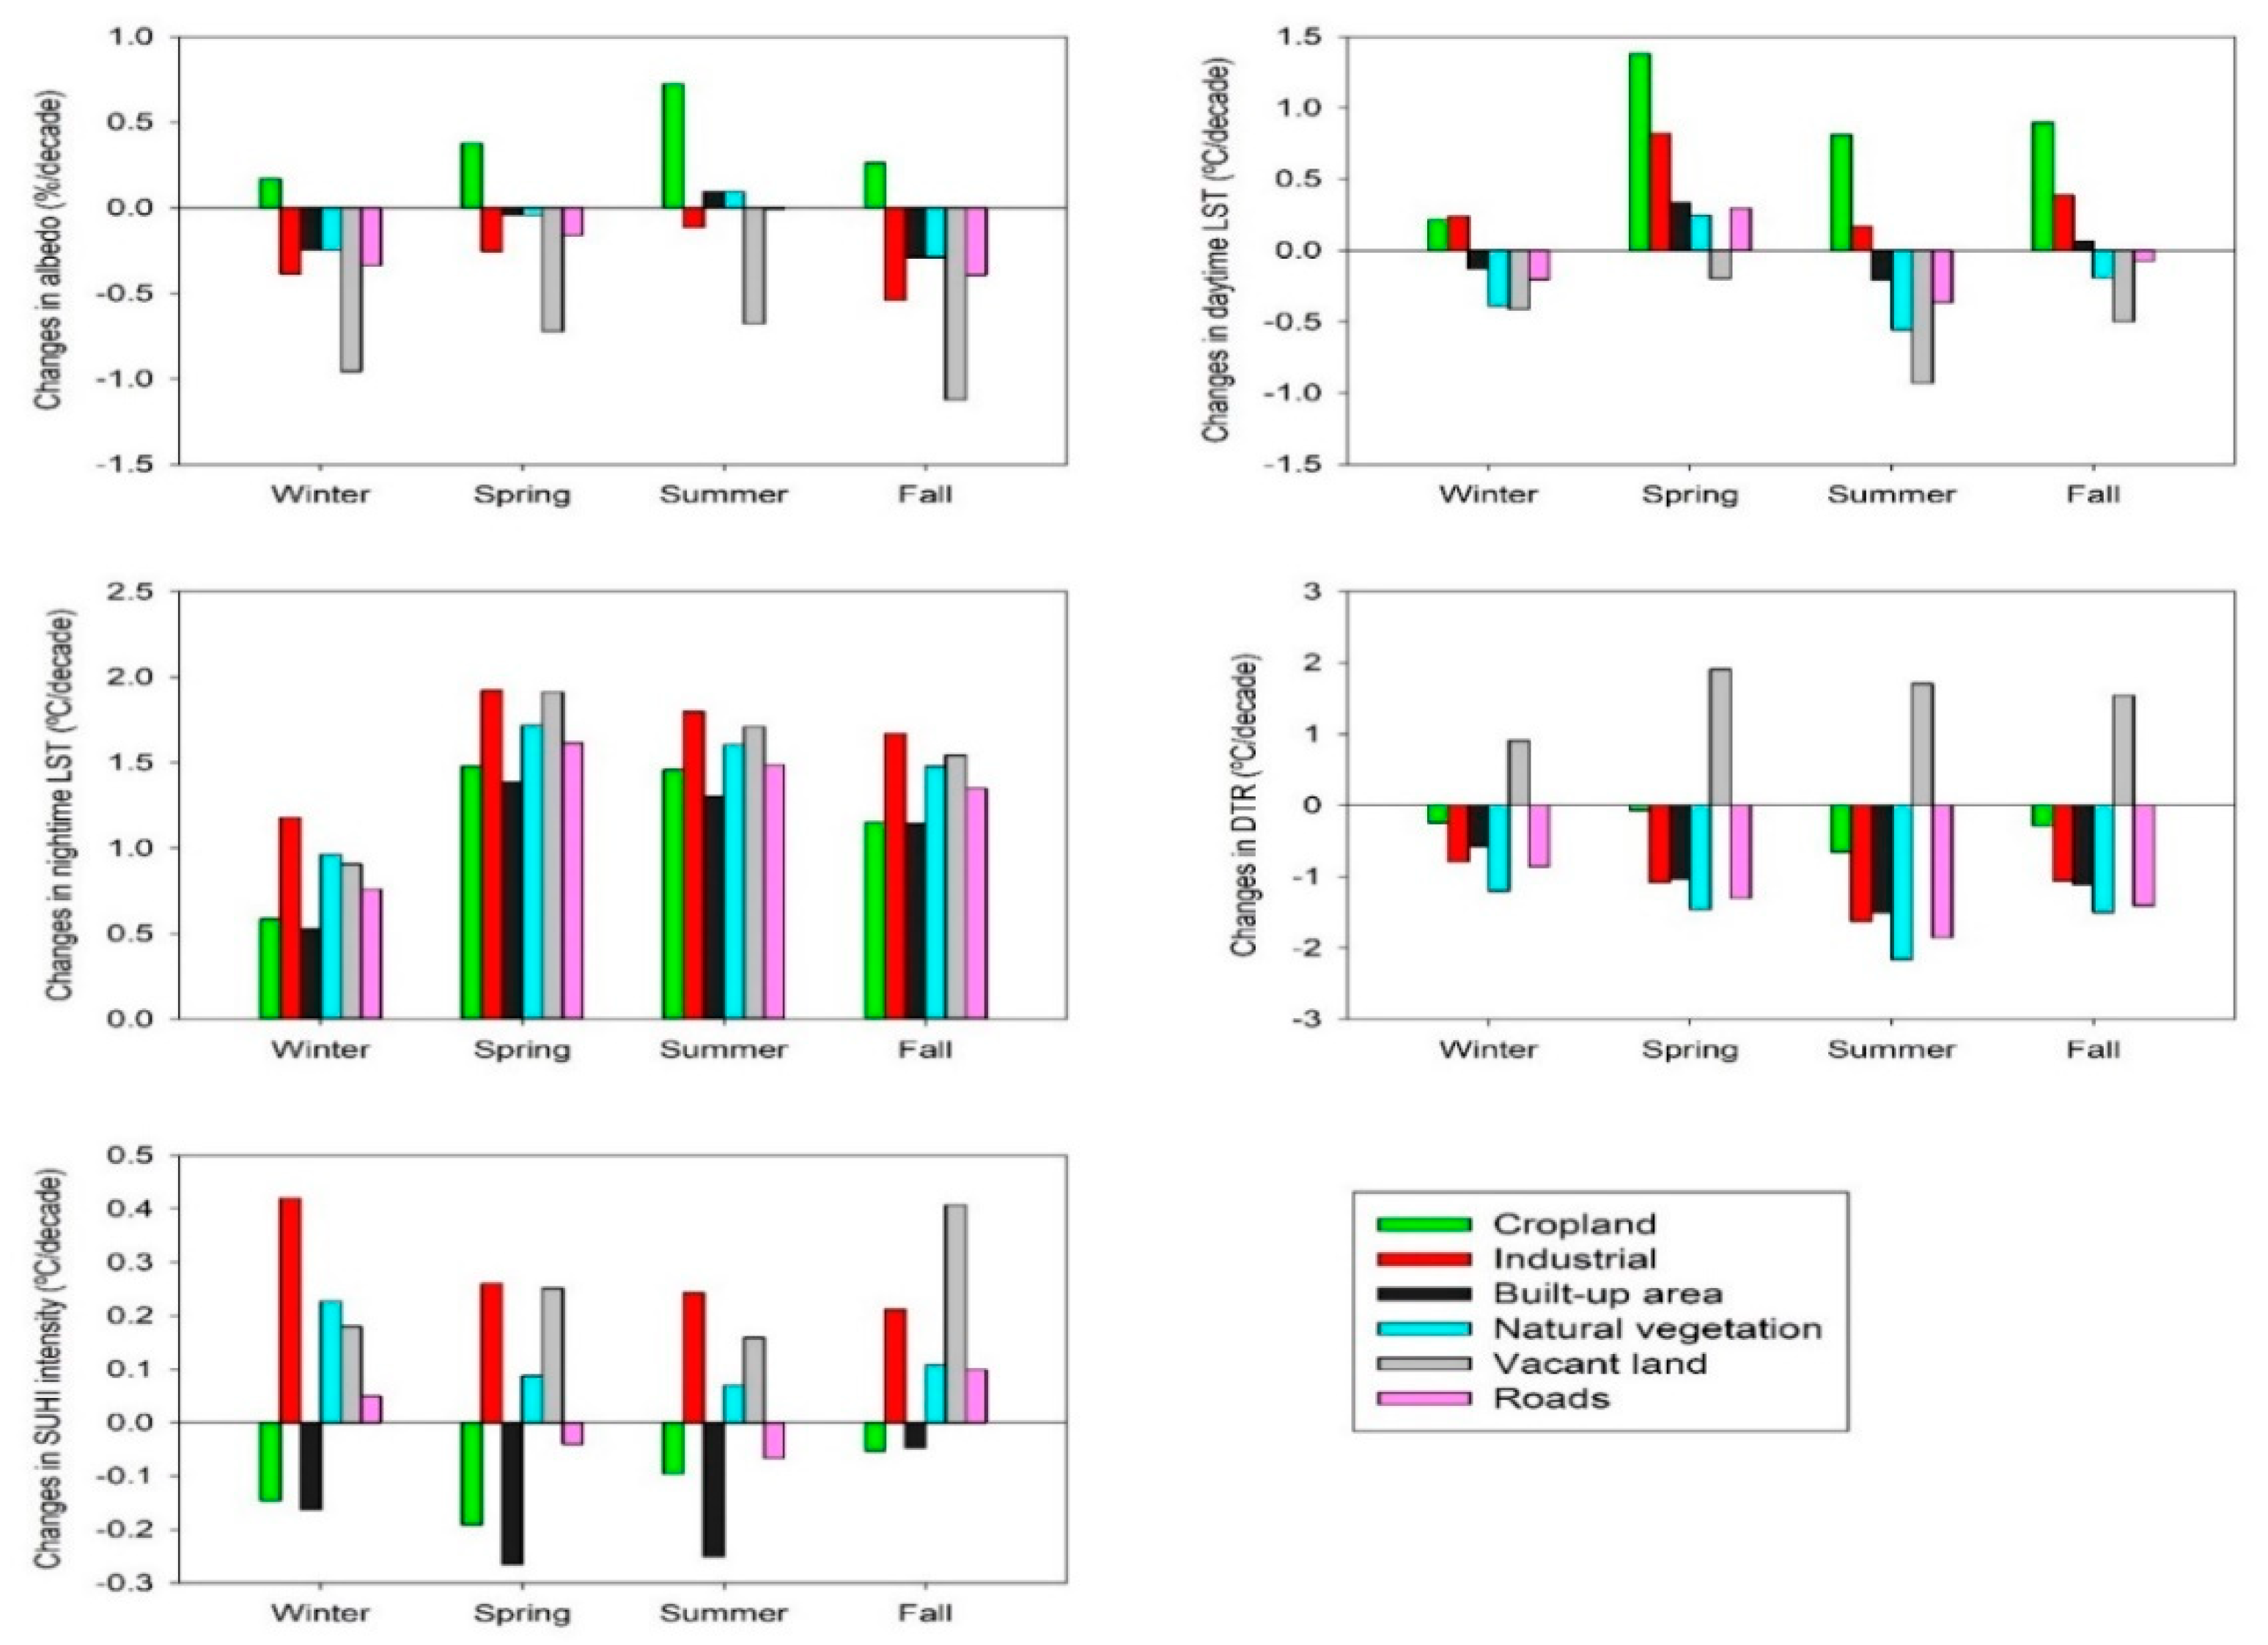
The spatial and temporal changes of SUHI characteristics were linked to a range of physical (e.g., albedo, vegetation cover, climate variability) and anthropogenic (e.g., land cover/use) determinants that control the intensity and spatial extent of SUHI. These variables explain a considerable percentage of land–atmosphere coupling processes in urban environments.
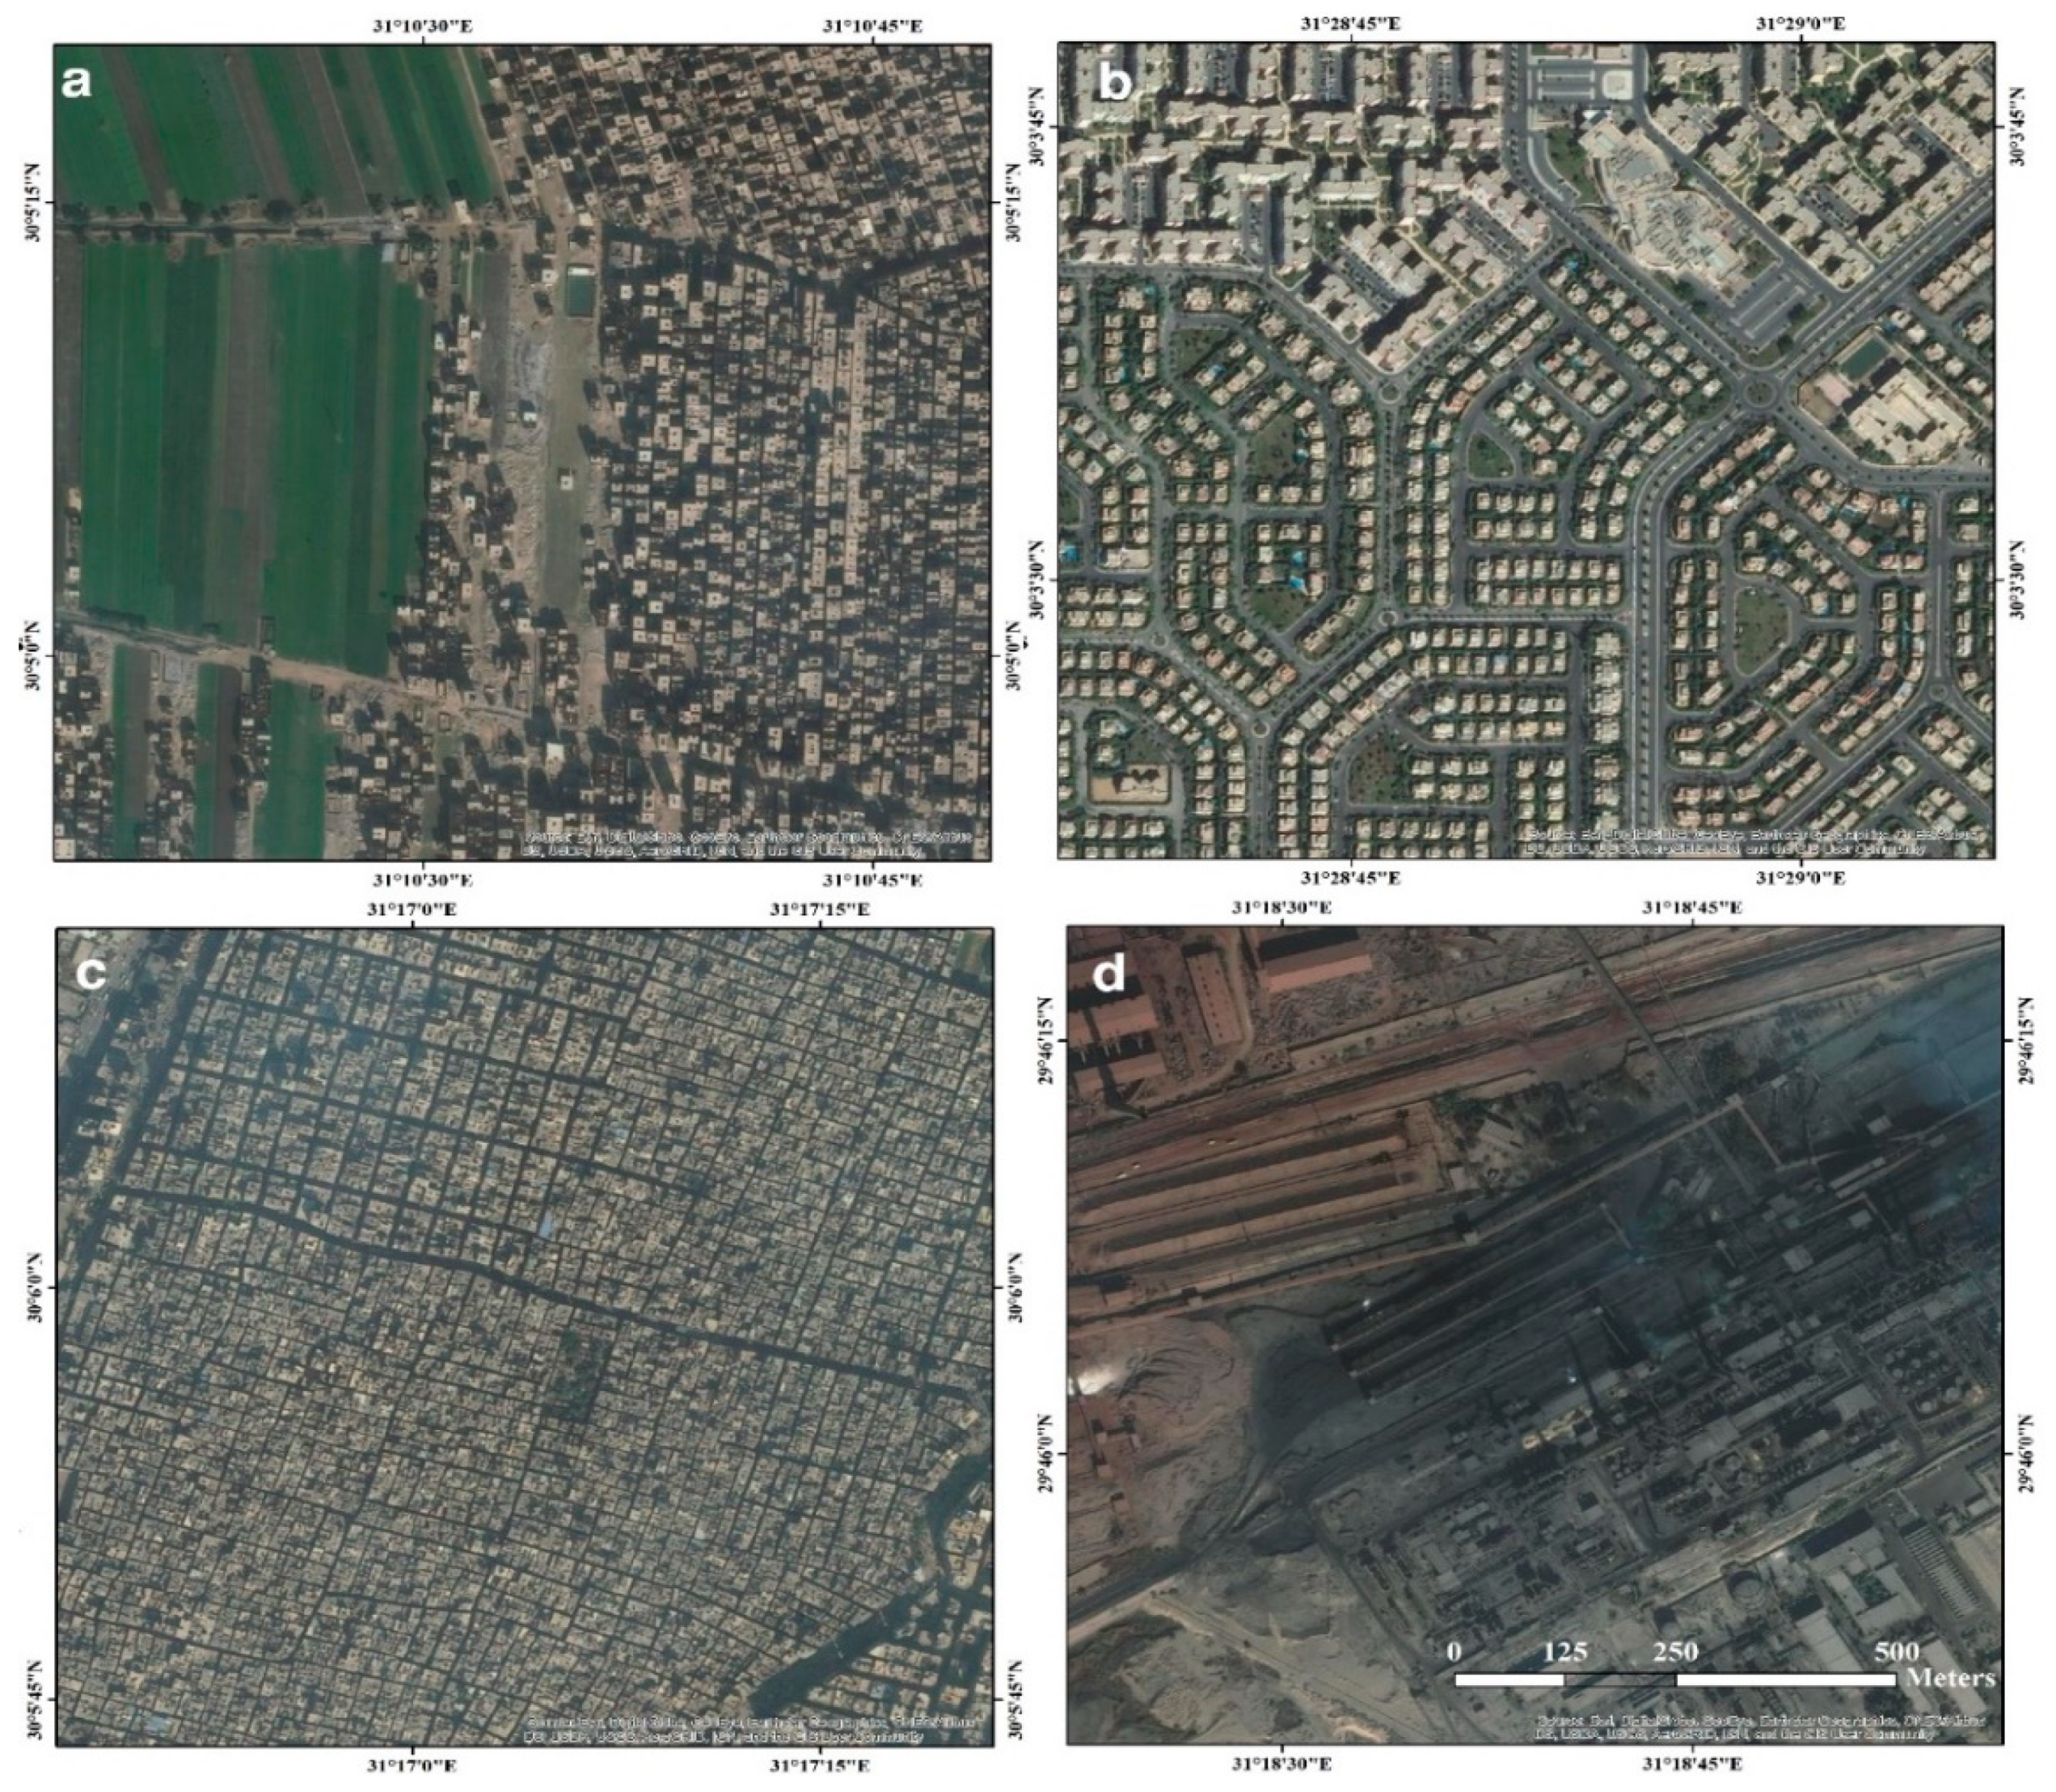
This study stresses the role of climate variability and land cover/use types in determining the intensity and spatial coverage of SUHI over Greater Cairo. It is noted that the warming of SUHI corresponded to industrial locations, while the built-up area and agricultural areas have a cooling effect. Moreover, less evaporative shallow water bodies have a non-significant role in modulating the intensity of SUHI.
Results of this study could have important implications for human thermal comfort and heat-related illnesses, providing guidance and help policy makers adopt appropriate mitigation strategies to diminish the impacts of SUHI on natural and human environments in an important city like Greater Cairo.
From a policy standpoint, results of this work can help local urban planners improve their understanding of the association between thermal behavior and urban landscape at a relatively detailed spatial scale. This is important recalling the spatial heterogeneity and non-linear interactions between different components of the urban system. This improved understanding could help urban planners to develop relevant plans to address the negative impacts of climate change, which are likely to increase in the future, on urban climate in Greater Cairo. Moreover, the innovative method applied to quantify UHI characteristics allows to provide clear, rigorous, and detailed spatial assessment of SUHI behavior and dynamics over Greater Cairo. All this information could be integrated and transferred into meaningful objects in the urban planning process (e.g., urban design and restructure plans), contributing to developing of comprehensive guidelines and strategies to adapt to climate change impacts, especially at fine spatial resolution in the city. Moreover, the applied methodology could be extrapolated to other cities in Egypt and elsewhere, as it adopts a rigorous statistical approach that considers both climatic and spatial parameters to determine SUHI characteristics.

Supplementary Materials

The following are available online at https://www.mdpi.com/2072-4292/12/23/3889/s1, Figure S1: Spatial distribution of the dominant LCLU types in Greater Cairo in 2018. The road network and water channels are illustrated separately in the right panel. Figure S2: Averaged intensity of nighttime LST anomaly over urban and suburban areas from 2003 to 2019. The vertical dotted line indicates the mean for all grids. Figure S3: Seasonal changes (%/decade) of albedo between 2003 and 2019. Figure S4: Seasonal changes (index unit/decade) of NDVI between 2003 and 2019. Figure S5: Seasonal changes (°C/decade) of daytime LST between 2003 and 2019. Figure S6: Seasonal changes (°C/decade) of nighttime LST between 2003 and 2019. Figure S7: Seasonal changes (°C/decade) of DTR between 2003 and 2019.

Author Contributions

Experimental design and conceptualization, all authors; database design, A.M.E.K., M.H., S.M.R., M.M.A. and I.M.G.; data extraction and manipulation, A.M.E.K., M.H., S.M.R. and M.M.A.; data visualization, A.M.E.K., M.H., A.A.-B., T.A.-A., N.A.N., S.A.-H. and D.P.-A.; manuscript writing—review and editing, A.M.E.K., S.M.V.-S., J.I.L.-M., M.F.M., F.D.-C. and P.-M.S. All authors have read and agreed to the published version of the manuscript.

Funding

This research was funded by the research project PCIN-2015-220 and CGL2014-52135-C03-01 financed by the Spanish Commission of Science and Technology and FEDER, IMDROFLOOD financed by the Water Works 2014 co-funded call of the European Commission and INDECIS, which is part of ERA4CS, an ERA-NET initiated by JPI Climate, and funded by FORMAS (SE), DLR (DE), BMWFW (AT), IFD (DK), MINECO (ES), ANR (FR) with co-funding by the European Union (Grant 690462).

Acknowledgments

We also would like to thank the ORNL DAAC for providing MODIS/VIIRS LST data. A. El Kenawy, M. Hereher, Talal Al-Awadhi, Ali Al-Buloshi, Noura Al Nasiri, and Salim Al-Hatroushi are administratively supported by Sultan Qaboos University, Oman. MFM was supported by the King Abdullah University of Science and Technology (KAUST).

Conflicts of Interest

The authors declare no conflict of interest.

References

  1. Salem, M.; Tsurusaki, N.; Divigalpitiya, P.; Kenawy, E. An Effective Framework for Monitoring and Measuring the Progress towards Sustainable Development in the Peri-Urban Areas of the Greater Cairo Region, Egypt. World 2020, 1, 1–19. [Google Scholar] [CrossRef]
  2. CAPMAS. Central Agency for Public Mobilization and Statistics. Available online: http://www.capmas.gov.eg/HomePage.aspx (accessed on 29 July 2020).
  3. Wheida, A.; Nasser, A.; El-Nazer, M.; Borbon, A.; El-Ata, G.A.A.; Wahab, M.A.; Alfaro, S.C. Tackling the mortality from long-term exposure to outdoor air pollution in megacities: Lessons from the Greater Cairo case study. Environ. Res. 2018, 160, 223–231. [Google Scholar] [CrossRef]
  4. Tan, J.; Zheng, Y.; Tang, X.; Guo, C.; Li, L.; Song, G.; Zhen, X.; Yuan, D.; Kalkstein, A.J.; Li, F.; et al. The urban heat island and its impact on heat waves and human health in Shanghai. Int. J. Biometeorol. 2010, 54, 75–84. [Google Scholar] [CrossRef] [PubMed]
  5. Lelieveld, J.; Hadjinicolaou, P.; Kostopoulou, E.; Chenoweth, J.; El Maayar, M.; Giannakopoulos, C.; Hannides, C.; Lange, M.A.; Tanarhte, M.; Tyrlis, E.; et al. Climate change and impacts in the Eastern Mediterranean and the Middle East. Clim. Chang. 2012, 114, 667–687. [Google Scholar] [CrossRef] [Green Version]
  6. Evans, J.P. 21st century climate change in the Middle East. Clim. Chang. 2009, 92, 417–432. [Google Scholar] [CrossRef]
  7. Deilami, K. Kamruzzaman Modelling the urban heat island effect of smart growth policy scenarios in Brisbane. Land Use Policy 2017, 64, 38–55. [Google Scholar] [CrossRef]
  8. Li, G.; Zhang, X.; Mirzaei, P.A.; Zhang, J.; Zhao, Z. Urban heat island effect of a typical valley city in China: Responds to the global warming and rapid urbanization. Sustain. Cities Soc. 2018, 38, 736–745. [Google Scholar] [CrossRef]
  9. Peng, S.; Piao, S.; Ciais, P.; Friedlingstein, P.; Ottle, C.; Bréon, F.-M.; Nan, H.; Zhou, L.; Myneni, R.B. Surface Urban Heat Island Across 419 Global Big Cities. Environ. Sci. Technol. 2012, 46, 696–703. [Google Scholar] [CrossRef]
  10. Clinton, N.; Gong, P. MODIS detected surface urban heat islands and sinks: Global locations and controls. Remote Sens. Environ. 2013, 134, 294–304. [Google Scholar] [CrossRef]
  11. Bechtel, B.; Demuzere, M.; Mills, G.; Zhan, W.; Sismanidis, P.; Small, C.; Voogt, J. SUHI analysis using Local Climate Zones—A comparison of 50 cities. Urban Clim. 2019, 28, 100451. [Google Scholar] [CrossRef]
  12. José, R.S.; Perez, J.; González, R. Very High Resolution Urban Simulations with WRF/UCM and CMAQ over European Cities. In Urban Environment; Springer: Berlin/Heidelberg, Germany, 2013; pp. 293–301. [Google Scholar]
  13. Peres, L.D.F.; De Lucena, A.J.; Filho, O.C.R.; França, J.R.D.A. The urban heat island in Rio de Janeiro, Brazil, in the last 30 years using remote sensing data. Int. J. Appl. Earth Obs. Geoinformation 2018, 64, 104–116. [Google Scholar] [CrossRef]
  14. Li, H.; Zhou, Y.; Li, X.; Meng, L.; Wang, X.; Wu, S.; Sodoudi, S. A new method to quantify surface urban heat island intensity. Sci. Total. Environ. 2018, 624, 262–272. [Google Scholar] [CrossRef] [PubMed]
  15. Singh, P.; Kikon, N.; Verma, P. Impact of land use change and urbanization on urban heat island in Lucknow city, Central India. A remote sensing based estimate. Sustain. Cities Soc. 2017, 32, 100–114. [Google Scholar] [CrossRef]
  16. Bao, T.; Li, X.; Zhang, J.; Zhang, Y.; Tian, S. Assessing the Distribution of Urban Green Spaces and its Anisotropic Cooling Distance on Urban Heat Island Pattern in Baotou, China. ISPRS Int. J. Geo Inf. 2016, 5, 12. [Google Scholar] [CrossRef]
  17. Zhou, D.; Zhao, S.; Liu, S.; Zhang, L.; Zhu, C. Surface urban heat island in China’s 32 major cities: Spatial patterns and drivers. Remote Sens. Environ. 2014, 152, 51–61. [Google Scholar] [CrossRef]
  18. Zhou, D.; Bonafoni, S.; Zhang, L.; Wang, R. Remote sensing of the urban heat island effect in a highly populated urban agglomeration area in East China. Sci. Total. Environ. 2018, 628–629, 415–429. [Google Scholar] [CrossRef]
  19. Heaviside, C.; MacIntyre, H.; Vardoulakis, S. The Urban Heat Island: Implications for Health in a Changing Environment. Curr. Environ. Heal. Rep. 2017, 4, 296–305. [Google Scholar] [CrossRef]
  20. Gunawardena, K.; Wells, M.; Kershaw, T. Utilising green and bluespace to mitigate urban heat island intensity. Sci. Total Environ. 2017, 584, 1040–1055. [Google Scholar] [CrossRef]
  21. Touchaei, A.G.; Hosseini, M.; Akbari, H. Energy savings potentials of commercial buildings by urban heat island reduction strategies in Montreal (Canada). Energy Build. 2016, 110, 41–48. [Google Scholar] [CrossRef]
  22. Khoder, M. Ambient levels of volatile organic compounds in the atmosphere of Greater Cairo. Atmospheric Environ. 2007, 41, 554–566. [Google Scholar] [CrossRef]
  23. Hassanien, M.A.; Abdel-Latif, N.M. Polycyclic aromatic hydrocarbons in road dust over Greater Cairo, Egypt. J. Hazard. Mater. 2008, 151, 247–254. [Google Scholar] [CrossRef] [PubMed]
  24. Ali, S.; Tamura, A. Road traffic noise levels, restrictions and annoyance in Greater Cairo, Egypt. Appl. Acoust. 2003, 64, 815–823. [Google Scholar] [CrossRef]
  25. Ali, S.; Tamura, A. Road traffic noise mitigation strategies in Greater Cairo, Egypt. Appl. Acoust. 2002, 63, 1257–1265. [Google Scholar] [CrossRef]
  26. Robaa, S.M. Urban-suburban/rural differences over Greater Cairo, Egypt. Atmósfera 2003, 16, 157–171. [Google Scholar]
  27. Sabry, S. How poverty is underestimated in Greater Cairo, Egypt. Environ. Urbanization 2010, 22, 523–541. [Google Scholar] [CrossRef] [Green Version]
  28. Nada, K.H.; Suliman, E.D.A. Violence, abuse, alcohol and drug use, and sexual behaviors in street children of Greater Cairo and Alexandria, Egypt. AIDS 2010, 24, S39–S44. [Google Scholar] [CrossRef]
  29. Jimenez, A.P.; Eldin, N.S.; Rimlinger, F.; El-Daly, M.; El-Hariri, H.; El-Hoseiny, M.; Mohsen, A.; Mostafa, A.; Delarocque-Astagneau, E.; Abdel-Hamid, M.; et al. HCV iatrogenic and intrafamilial transmission in Greater Cairo, Egypt. Gut 2010, 59, 1554–1560. [Google Scholar] [CrossRef]
  30. Osman, T.; Divigalpitiya, P.; Arima, T. Driving factors of urban sprawl in Giza Governorate of Greater Cairo Metropolitan Region using AHP method. Land Use Policy 2016, 58, 21–31. [Google Scholar] [CrossRef]
  31. Salem, M.; Tsurusaki, N.; Divigalpitiya, P. Remote sensing-based detection of agricultural land losses around Greater Cairo since the Egyptian revolution of 2011. Land Use Policy 2020, 97, 104744. [Google Scholar] [CrossRef]
  32. Rashed, T.; Weeks, J.R.; Gadalla, M.S.; Hill, A.G. Revealing the Anatomy of Cities through Spectral Mixture Analysis of Multispectral Satellite Imagery: A Case Study of the Greater Cairo Region, Egypt. Geocarto Int. 2001, 16, 7–18. [Google Scholar] [CrossRef]
  33. Megahed, Y.; Cabral, P.; Silva, J.; Caetano, M. Land Cover Mapping Analysis and Urban Growth Modelling Using Remote Sensing Techniques in Greater Cairo Region—Egypt. ISPRS Int. J. Geo Inf. 2015, 4, 1750–1769. [Google Scholar] [CrossRef] [Green Version]
  34. Stewart, I.D. A systematic review and scientific critique of methodology in modern urban heat island literature. Int. J. Clim. 2011, 31, 200–217. [Google Scholar] [CrossRef]
  35. Hereher, M.E. Analysis of urban growth at Cairo, Egypt using remote sensing and GIS. Nat. Sci. 2012, 4, 355–361. [Google Scholar] [CrossRef] [Green Version]
  36. Abutaleb, K.A.; Ngie, A.; Darwish, A.; Ahmed, M.; Arafat, S. Assessment of Urban Heat Island Using Remotely Sensed Imagery over Greater Cairo, Egypt. Adv. Remote Sens. 2015, 4, 35–47. [Google Scholar] [CrossRef] [Green Version]
  37. Effat, H.A.; Hassan, O.A.K. Change detection of urban heat islands and some related parameters using multi-temporal Landsat images; a case study for Cairo city, Egypt. Urban Clim. 2014, 10, 171–188. [Google Scholar] [CrossRef]
  38. Shahraiyni, H.T.; Sodoudi, S.; El-Zafarany, A.; El Seoud, T.A.; Ashraf, H.; Krone, K. A Comprehensive Statistical Study on Daytime Surface Urban Heat Island during Summer in Urban Areas, Case Study: Cairo and Its New Towns. Remote Sens. 2016, 8, 643. [Google Scholar] [CrossRef] [Green Version]
  39. El-Hattab, M.; Amany, S.M.; Lamia, G.E. Monitoring and assessment of urban heat islands over the Southern region of Cairo Governorate, Egypt. Egypt. J. Remote Sens. Space Sci. 2018, 21, 311–323. [Google Scholar] [CrossRef]
  40. Abbas, W. Temperature in the Metropolitan Cairo Using Geographical Information Systems and Remote Sensing. Ph.D. Thesis, Ain Shams University, Cairo, Egypt, 2013. [Google Scholar]
  41. Hereher, M.E. Retrieving spatial variations of land surface temperatures from satellite data—Cairo region, Egypt. Geocarto Int. 2016, 32, 1–23. [Google Scholar] [CrossRef]
  42. Ju, J.; Roy, D.P. The availability of cloud-free Landsat ETM+ data over the conterminous United States and globally. Remote Sens. Environ. 2008, 112, 1196–1211. [Google Scholar] [CrossRef]
  43. Imhoff, M.L.; Zhang, P.; Wolfe, R.E.; Bounoua, L. Remote sensing of the urban heat island effect across biomes in the continental USA. Remote Sens. Environ. 2010, 114, 504–513. [Google Scholar] [CrossRef] [Green Version]
  44. El Kenawy, A.M.; Hereher, M.E.; Robaa, S.M. An Assessment of the Accuracy of MODIS Land Surface Temperature over Egypt Using Ground-Based Measurements. Remote Sens. 2019, 11, 2369. [Google Scholar] [CrossRef] [Green Version]
  45. Li, H.; Zhou, Y.; Wang, X.; Zhou, X.; Zhang, H.; Sodoudi, S. Quantifying urban heat island intensity and its physical mechanism using WRF/UCM. Sci. Total. Environ. 2019, 650, 3110–3119. [Google Scholar] [CrossRef] [PubMed]
  46. Morini, E.; Touchaei, A.G.; Rossi, F.; Cotana, F.; Akbari, H. Evaluation of albedo enhancement to mitigate impacts of urban heat island in Rome (Italy) using WRF meteorological model. Urban Clim. 2018, 24, 551–566. [Google Scholar] [CrossRef]
  47. Taha, H. Urban climates and heat islands: Albedo, evapotranspiration, and anthropogenic heat. Energy Build. 1997, 25, 99–103. [Google Scholar] [CrossRef] [Green Version]
  48. Akbari, H.; Matthews, H.D.; Seto, D. The long-term effect of increasing the albedo of urban areas. Environ. Res. Lett. 2012, 7, 024004. [Google Scholar] [CrossRef]
  49. Schaaf, C.B.; Gao, F.; Strahler, A.H.; Lucht, W.; Li, X.; Tsang, T.; Strugnell, N.C.; Zhang, X.; Jin, Y.; Muller, J.-P.; et al. First operational BRDF, albedo nadir reflectance products from MODIS. Remote Sens. Environ. 2002, 83, 135–148. [Google Scholar] [CrossRef] [Green Version]
  50. Wang, Z.; Schaaf, C.; Sun, Q.; Kim, J.; Erb, A.M.; Gao, F.; Roman, M.O.; Yang, Y.; Petroy, S.; Taylor, J.R.; et al. Monitoring land surface albedo and vegetation dynamics using high spatial and temporal resolution synthetic time series from Landsat and the MODIS BRDF/NBAR/albedo product. Int. J. Appl. Earth Obs. Geoinf. 2017, 59, 104–117. [Google Scholar] [CrossRef]
  51. Hovi, A.; Lindberg, E.; Lang, M.; Arumäe, T.; Peuhkurinen, J.; Sirparanta, S.; Pyankov, S.; Rautiainen, M. Seasonal dynamics of albedo across European boreal forests: Analysis of MODIS albedo and structural metrics from airborne LiDAR. Remote Sens. Environ. 2019, 224, 365–381. [Google Scholar] [CrossRef]
  52. Trlica, A.; Hutyra, L.R.; Schaaf, C.L.; Erb, A.; Wang, J.A. Albedo, Land Cover, and Daytime Surface Temperature Variation Across an Urbanized Landscape. Earth’s Futur. 2017, 5, 1084–1101. [Google Scholar] [CrossRef] [Green Version]
  53. Xue, J.; Su, B. Significant Remote Sensing Vegetation Indices: A Review of Developments and Applications. J. Sens. 2017, 2017, 1–17. [Google Scholar] [CrossRef] [Green Version]
  54. Roy, D.P.; Borak, J.S.; Devadiga, S.; Wolfe, R.E.; Zheng, M.; Descloitres, J. The MODIS Land product quality assessment approach. Remote Sens. Environ. 2002, 83, 62–76. [Google Scholar] [CrossRef]
  55. Huete, A.; Didan, K.; Miura, T.; Rodriguez, E.P.; Gao, X.; Ferreira, L.G. Overview of the radiometric and biophysical performance of the MODIS vegetation indices. Remote Sens. Environ. 2002, 83, 195–213. [Google Scholar] [CrossRef]
  56. Meroni, M.; Fasbender, D.; Rembold, F.; Atzberger, C.; Klisch, A. Near real-time vegetation anomaly detection with MODIS NDVI: Timeliness vs. accuracy and effect of anomaly computation options. Remote Sens. Environ. 2019, 221, 508–521. [Google Scholar] [CrossRef]
  57. Zhang, Y.; Ling, F.; Foody, G.M.; Ge, Y.; Boyd, D.S.; Li, X.; Du, Y.; Atkinson, P.M. Mapping annual forest cover by fusing PALSAR/PALSAR-2 and MODIS NDVI during 2007–2016. Remote Sens. Environ. 2019, 224, 74–91. [Google Scholar] [CrossRef] [Green Version]
  58. Baeza, S.; Paruelo, J.M. Land Use/Land Cover Change (2000–2014) in the Rio de la Plata Grasslands: An Analysis Based on MODIS NDVI Time Series. Remote Sens. 2020, 12, 381. [Google Scholar] [CrossRef] [Green Version]
  59. Wang, Y.; Xue, Z.; Chen, J.; Chen, G. Spatio-temporal analysis of phenology in Yangtze River Delta based on MODIS NDVI time series from 2001 to 2015. Front. Earth Sci. 2018, 13, 92–110. [Google Scholar] [CrossRef]
  60. Lumbierres, M.; Méndez, P.F.; Bustamante, J.; Soriguer, R.C.; Santamaría, L. Modeling Biomass Production in Seasonal Wetlands Using MODIS NDVI Land Surface Phenology. Remote Sens. 2017, 9, 392. [Google Scholar] [CrossRef] [Green Version]
  61. Weeks, J.R. Defining Urban Areas. In Remote Sensing of Urban and Suburban Areas; Springer: Berlin/Heidelberg, Germany, 2010; pp. 33–45. [Google Scholar]
  62. Cao, C.; Lee, X.; Liu, S.; Schultz, N.; Xiao, W.; Zhang, M.; Zhao, L. Urban heat islands in China enhanced by haze pollution. Nat. Commun. 2016, 7, 12509. [Google Scholar] [CrossRef]
  63. Geletič, J.; Lehnert, M.; Dobrovolný, P. Land Surface Temperature Differences within Local Climate Zones, Based on Two Central European Cities. Remote Sens. 2016, 8, 788. [Google Scholar] [CrossRef] [Green Version]
  64. Ridd, M.K.; Liu, J. A Comparison of Four Algorithms for Change Detection in an Urban Environment. Remote Sens. Environ. 1998, 63, 95–100. [Google Scholar] [CrossRef]
  65. Rogan, J.; Franklin, J.; Stow, D.; Miller, J.; Woodcock, C.; Roberts, D. Mapping land-cover modifications over large areas: A comparison of machine learning algorithms. Remote Sens. Environ. 2008, 112, 2272–2283. [Google Scholar] [CrossRef]
  66. Grekousis, G.; Mountrakis, G.; Kavouras, M. An overview of 21 global and 43 regional land-cover mapping products. Int. J. Remote Sens. 2015, 36, 5309–5335. [Google Scholar] [CrossRef]
  67. Zhao, P.; Kwan, M.-P.; Zhou, S. The Uncertain Geographic Context Problem in the Analysis of the Relationships between Obesity and the Built Environment in Guangzhou. Int. J. Environ. Res. Public Heal. 2018, 15, 308. [Google Scholar] [CrossRef] [PubMed] [Green Version]
  68. Dong, W.; Yang, K.; Xu, Q.-L.; Liu, L.; Chen, J. Spatio-temporal pattern analysis for evaluation of the spread of human infections with avian influenza A(H7N9) virus in China, 2013–2014. BMC Infect. Dis. 2017, 17, 704. [Google Scholar] [CrossRef] [PubMed] [Green Version]
  69. Ayhan, I.; Cubukcu, K.M. Explaining historical urban development using the locations of mosques: A GIS/spatial statistics-based approach. Appl. Geogr. 2010, 30, 229–238. [Google Scholar] [CrossRef]
  70. Hamed, K.H.; Rao, A.R. A modified Mann-Kendall trend test for autocorrelated data. J. Hydrol. 1998, 204, 182–196. [Google Scholar] [CrossRef]
  71. Li, L.; Zha, Y.; Zhang, J. Spatially non-stationary effect of underlying driving factors on surface urban heat islands in global major cities. Int. J. Appl. Earth Obs. Geoinformation 2020, 90, 102131. [Google Scholar] [CrossRef]
  72. Tran, H.; Uchihama, D.; Ochi, S.; Yasuoka, Y. Assessment with satellite data of the urban heat island effects in Asian mega cities. Int. J. Appl. Earth Obs. Geoinformation 2006, 8, 34–48. [Google Scholar] [CrossRef]
  73. Polydoros, A.; Mavrakou, T.; Cartalis, C. Quantifying the Trends in Land Surface Temperature and Surface Urban Heat Island Intensity in Mediterranean Cities in View of Smart Urbanization. Urban Sci. 2018, 2, 16. [Google Scholar] [CrossRef] [Green Version]
  74. Hereher, M.E. Time series trends of land surface temperatures in Egypt: A signal for global warming. Environ. Earth Sci. 2016, 75, 1218. [Google Scholar] [CrossRef]
  75. Eleftheriou, D.; Kiachidis, K.; Kalmintzis, G.; Kalea, A.; Bantasis, C.; Koumadoraki, P.; Spathara, M.E.; Tsolaki, A.; Tzampazidou, M.I.; Gemitzi, A. Determination of annual and seasonal daytime and nighttime trends of MODIS LST over Greece—Climate change implications. Sci. Total Environ. 2018, 616–617, 937–947. [Google Scholar] [CrossRef] [PubMed]
  76. Luintel, N.; Ma, W.; Ma, Y.; Wang, B.; Subba, S. Spatial and temporal variation of daytime and nighttime MODIS land surface temperature across Nepal. Atmos. Ocean. Sci. Lett. 2019, 12, 305–312. [Google Scholar] [CrossRef] [Green Version]
  77. Mao, K.; Ma, Y.; Tan, X.; Shen, X.; Liu, G.; Li, Z.; Chen, J.M.; Xia, L. Global surface temperature change analysis based on MODIS data in recent twelve years. Adv. Space Res. 2017, 59, 503–512. [Google Scholar] [CrossRef] [Green Version]
  78. Hereher, M.E. The status of Egypt’s agricultural lands using MODIS Aqua data. Egypt. J. Remote Sens. Space Sci. 2013, 16, 83–89. [Google Scholar] [CrossRef] [Green Version]
  79. El-Kawy, O.R.A.; Ismail, H.A.; Yehia, H.M.; Allam, M.A. Temporal detection and prediction of agricultural land consumption by urbanization using remote sensing. Egypt. J. Remote Sens. Space Sci. 2019, 22, 237–246. [Google Scholar] [CrossRef]
  80. El-Hefnawi, A. Protecting agricultural land from urbanization or “Managing” the conflict between informal urban growth while meeting the demands of the communities: Lessons learnt from the Egyptian policy reforms. In Proceedings of the Third Urban Research Symposium on Land Development, Urban Policy and Poverty Reduction; World Bank Institute of Applied Economic Research, Brasilia, Brazil, 4–6 April 2005. [Google Scholar]
  81. Kondoh, A.; Nishiyama, J. Changes in hydrological cycle due to urbanization in the suburb of Tokyo Metropolitan area, Japan. Adv. Space Res. 2000, 26, 1173–1176. [Google Scholar] [CrossRef]
  82. Abdelhady, S.; Borello, D.; Shaban, A.; Rispoli, F. Viability Study of Biomass Power Plant Fired with Rice Straw in Egypt. Energy Procedia 2014, 61, 211–215. [Google Scholar] [CrossRef] [Green Version]
  83. Farag, A.A.; Radwan, H.A.; Abdrabbo, M.A.A.; Heggi, M.A.M.; McCarl, B.A. Carbon Footprint for Paddy Rice Production in Egypt. Nat. Sci. 2013, 11, 36–45. [Google Scholar]
  84. Lemieux, P.M.; Lutes, C.C.; Santoianni, D.A. Emissions of organic air toxics from open burning: A comprehensive review. Prog. Energy Combust. Sci. 2004, 30, 1–32. [Google Scholar] [CrossRef]
  85. Yang, H.; Zhang, X.; Zhao, F.; Wang, J.; Shi, P.; Liu, L. Mapping Sand-dust Storm Risk of the World. In World Atlas of Natural Disaster Risk; Shi, P., Kasperson, R., Eds.; Springer: Berlin/Heidelberg, Germany, 2015; pp. 115–150. [Google Scholar]
  86. Ramanathan, V.; Feng, Y. Air pollution, greenhouse gases and climate change: Global and regional perspectives. Atmospheric Environ. 2009, 43, 37–50. [Google Scholar] [CrossRef]
  87. Ganor, E.; Osetinsky, I.; Stupp, A.; Alpert, P. Increasing trend of African dust, over 49 years, in the eastern Mediterranean. J. Geophys. Res. Space Phys. 2010, 115, D07201. [Google Scholar] [CrossRef] [Green Version]
  88. Bodenheimer, S.; Lensky, I.M.; Dayan, U. Characterization of Eastern Mediterranean dust storms by area of origin; North Africa vs. Arabian Peninsula. Atmos. Environ. 2019, 198, 158–165. [Google Scholar] [CrossRef]
  89. Morris, C.J.G.; Simmonds, I.; Plummer, N. Quantification of the Influences of Wind and Cloud on the Nocturnal Urban Heat Island of a Large City. J. Appl. Meteorol. 2001, 40, 169–182. [Google Scholar] [CrossRef]
  90. Shahmohamadi, P.; Che-Ani, A.I.; Maulud, K.N.A.; Tawil, N.M.; Abdullah, N.A.G. The Impact of Anthropogenic Heat on Formation of Urban Heat Island and Energy Consumption Balance. Urban Stud. Res. 2011, 2011, 1–9. [Google Scholar] [CrossRef] [Green Version]
  91. Santamouris, M.; Papanikolaou, N.; Livada, I.; Koronakis, I.; Georgakis, C.; Argiriou, A.; Assimakopoulos, D.N. On the impact of urban climate on the energy consumption of buildings. Sol. Energy 2001, 70, 201–216. [Google Scholar] [CrossRef]
  92. Voogt, J.A. Assessment of an Urban Sensor View Model for thermal anisotropy. Remote Sens. Environ. 2008, 112, 482–495. [Google Scholar] [CrossRef]
  93. Lagouarde, J.-P.; Hénon, A.; Irvine, M.; Voogt, J.A.; Pigeon, G.; Moreau, P.; Masson, V.; Mestayer, P. Experimental characterization and modelling of the nighttime directional anisotropy of thermal infrared measurements over an urban area: Case study of Toulouse (France). Remote Sens. Environ. 2012, 117, 19–33. [Google Scholar] [CrossRef]
  94. Samanta, D.; Dash, M.K.; Goswami, B.N.; Pandey, P.C. Extratropical anticyclonic Rossby wave breaking and Indian summer monsoon failure. Clim. Dyn. 2016, 46, 1547–1562. [Google Scholar] [CrossRef]
  95. Khodakarami, J.; Ghobadi, P. Urban pollution and solar radiation impacts. Renew. Sustain. Energy Rev. 2016, 57, 965–976. [Google Scholar] [CrossRef]
  96. Azevedo, J.A.; Chapman, L.; Muller, C.L. Quantifying the Daytime and Night-Time Urban Heat Island in Birmingham, UK: A Comparison of Satellite Derived Land Surface Temperature and High Resolution Air Temperature Observations. Remote Sens. 2016, 8, 153. [Google Scholar] [CrossRef] [Green Version]
  97. Kotharkar, R.; Bagade, A. Evaluating urban heat island in the critical local climate zones of an Indian city. Landsc. Urban Plan. 2018, 169, 92–104. [Google Scholar] [CrossRef]
Figure 1. Location of Greater Cairo, its topography, and main administrative divisions. Topography was presented based on the SRTM GL1 digital elevation model (DEM) EM at 30-m spatial resolution (https://lpdaac.usgs.gov/products/srtmgl1v003/).
Remotesensing 12 03889 g001
Figure 2. Seasonal and annual variability of mean (a) and maximum (b) surface urban heat island (SUHI) intensity over Greater Cairo between 2003 and 2019. Amount of change in the intensity of SUHI is provided; only numbers given in bold are statistically significant at the 95% confidence interval (p < 0.05).
Remotesensing 12 03889 g002
Figure 3. Probability distribution function (pdf) of the mean (a) and maximum SUHI (b) calculated on a seasonal basis for Greater Cairo between 2003 and 2019. The provided numbers indicate the mean of each season.
Remotesensing 12 03889 g003
Figure 4. Seasonal and annual variability of the total area of the most anomalous hot (a) and cold spot (b) between 2003 and 2019, as compared to the total area of Greater Cairo. Amount of change in the total areas of both spots is provided; only numbers given in bold are statistically significant at the 95% confidence interval (p < 0.05).
Remotesensing 12 03889 g004
Figure 5. Probability distribution function (pdf) of the areas represented by the most anomalous hot (a) and cold spots (b), as compared to the total area of Greater Cairo. Results are presented on a seasonal basis for the period between 2003 and 2019. The provided numbers indicate the mean for each season.
Remotesensing 12 03889 g005
Figure 6. Left: Spatial anomaly of land surface temperature (LST) over Greater Cairo, averaged for the study period 2003–2019; right: changes (°C/decade) in LST anomalies over the period 2003–2019. Herein, changes were assessed for each season using the ordinary linear least squares regression model.
Remotesensing 12 03889 g006
Figure 7. The minimum and maximum spatial extents of SUHI over Greater Cairo for the period 2003–2019.
Remotesensing 12 03889 g007
Figure 8. Standard deviational ellipses (SDEs) of the spatial coverage of the most anomalous hotspot over Greater Cairo for the period 2003–2019. SDEs were computed using one standard deviation. The colored circles in the left panel refer to the centroid of hotspot for each season. The right panel indicates the different elements of SED.
Remotesensing 12 03889 g008
Figure 9. Pearson’s correlation coefficient calculated between the detrended nighttime LST anomaly and a variety of driving forces between 2003 and 2019. Results are presented for the SUHI area, as compared to other parts of Greater Cairo (GC).
Remotesensing 12 03889 g009
Figure 10. Statistical significance of trends of albedo, NDVI, daytime LST, nighttime LST and DTR from 2003 to 2019. Statistical significance was assessed using the modified Mann–Kendall statistic at the 95% confidence interval (p < 0.05). Statistical significance of trends is presented for hotspot (SUHI) area, as compared to other parts of Greater Cairo (GC).
Remotesensing 12 03889 g010
Figure 11. Amount of change in the different environmental and climatic variables calculated for SUHI against other parts of Greater Cairo (GC).
Remotesensing 12 03889 g011
Figure 12. Amount of change in the different environmental and climatic variables, as a function of the dominant LCLU types in Greater Cairo. Changes in the intensity of SUHI as a function of these types are also presented.
Remotesensing 12 03889 g012
Figure 13. Spatial portraits of different LCLU types in Greater Cairo, reflecting the strong heterogeneous landscape of Greater Cairo. Each panel represents a pixel of 1 km, where (a) represents a suburban agricultural zone located to the west of Al-Waraq island in western Cairo; (b) represents a well-planned suburban residential zone, characterized by its low-height building, in the east of the city; (c) represents a classic heavily urbanized and populated area in central Cairo (Al Waely district); and (d) represents the industrial complex of Helwan in southern Cairo.
Remotesensing 12 03889 g013
Table 1. The main statistics of the Standard Deviational Ellipse (SDE) method for the most anomalous hot and cold spot domains.
IndicatorThe Most Anomalous HotspotThe Most Anomalous Cold Spot
WinterSpringSummerFallWinterSpringSummerFall
Central mean(31.25, 30.06)(31.26, 29.99)(31.27, 29.97)(31.26, 30.01)(31.15, 29.99)(31.18, 30.1)(31.12, 30.13)(31.36, 30.07)
Rotation31.66167.36155.4718.0883.8781.2130.4565.87
Standard deviation along X-axis4.43.32.27.749.538.53.545.1
Standard deviation along Y-axis7.79.96.69.916.513.26.616.5
Publisher’s Note: MDPI stays neutral with regard to jurisdictional claims in published maps and institutional affiliations.

