Evaluating Feature Extraction Methods with Synthetic Noise Patterns for Image-Based Modelling of Texture-Less Objects

 ,
,  ,
,
Abstract
:1. Introduction
2. Structure-from-Motion Multi-View Stereo Pipeline
2.1. Feature Extraction—Feature Detection and Description
2.1.1. HARRIS Corner Detector
2.1.2. Shi-Tomasi Method
2.1.3. MSER
2.1.4. SIFT
2.1.5. SURF
2.1.6. BRISK
2.1.7. KAZE
2.2. Feature Matching
2.3. Bundle Adjustment
2.4. Dense Cloud Reconstruction
2.5. Mesh Reconstruction
3. Proposed Methodology
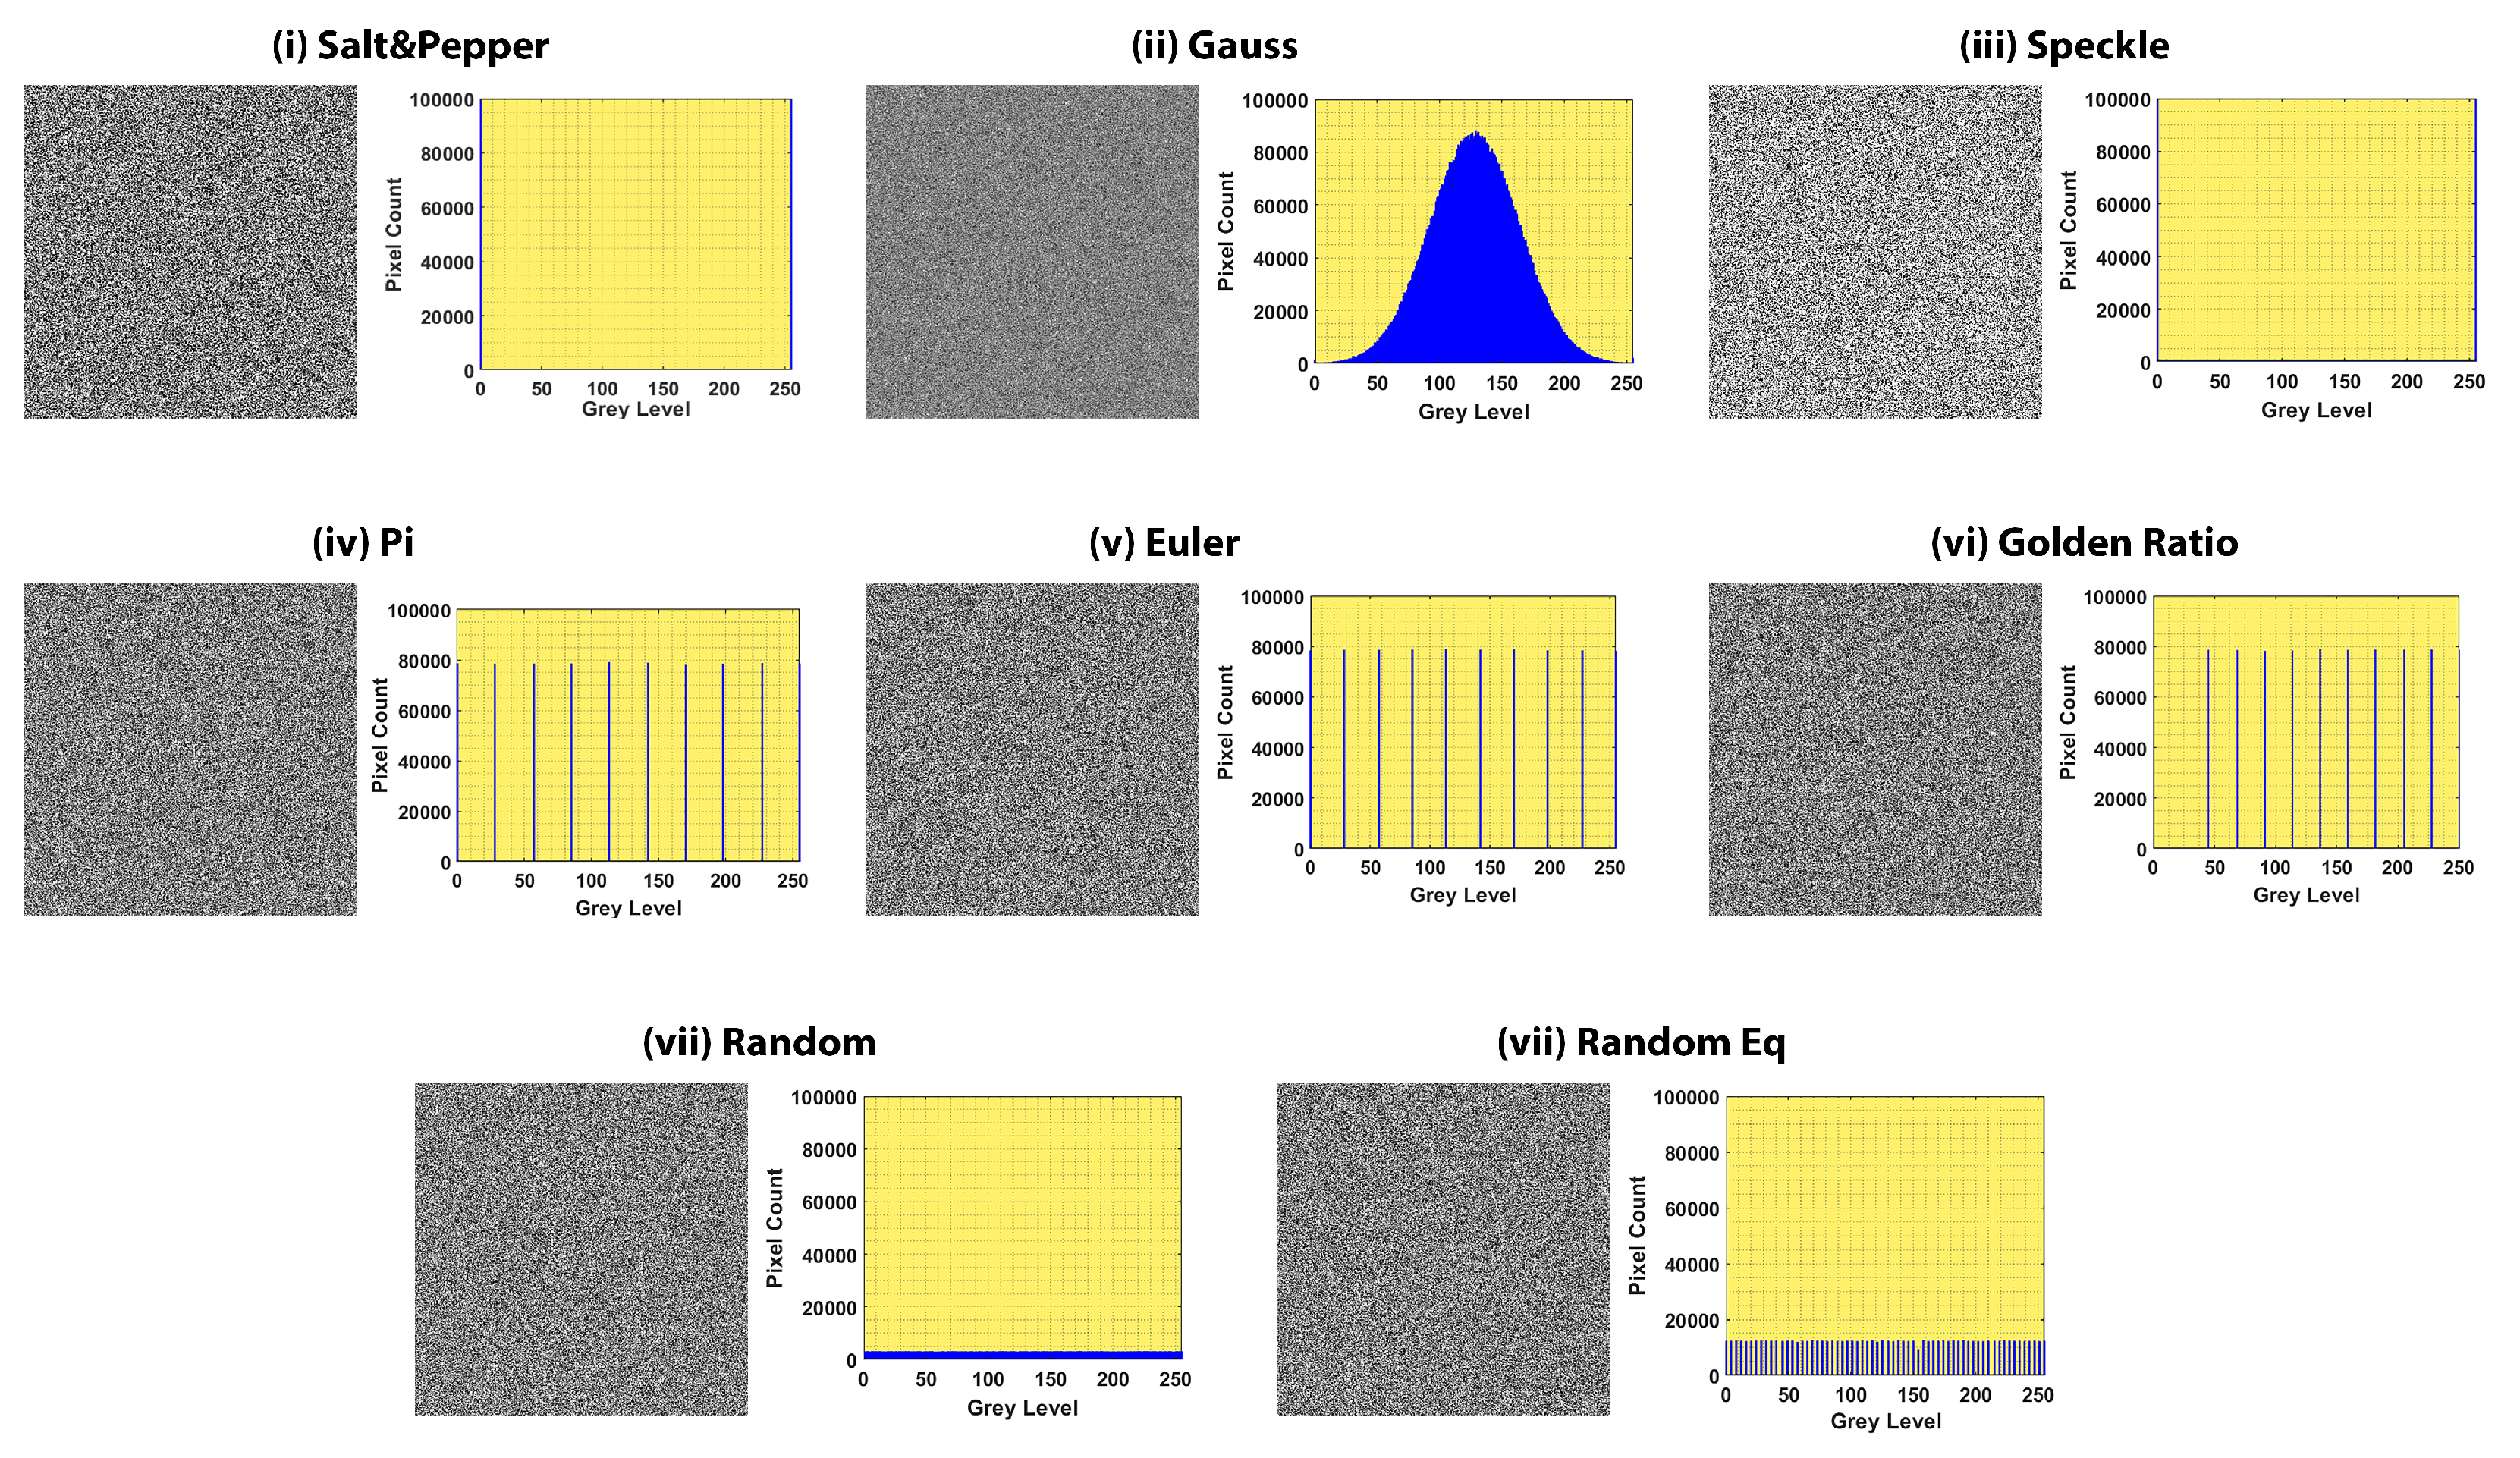
3.1. Pattern Generation
3.2. Experiment Setup and 3D Reconstruction Outline
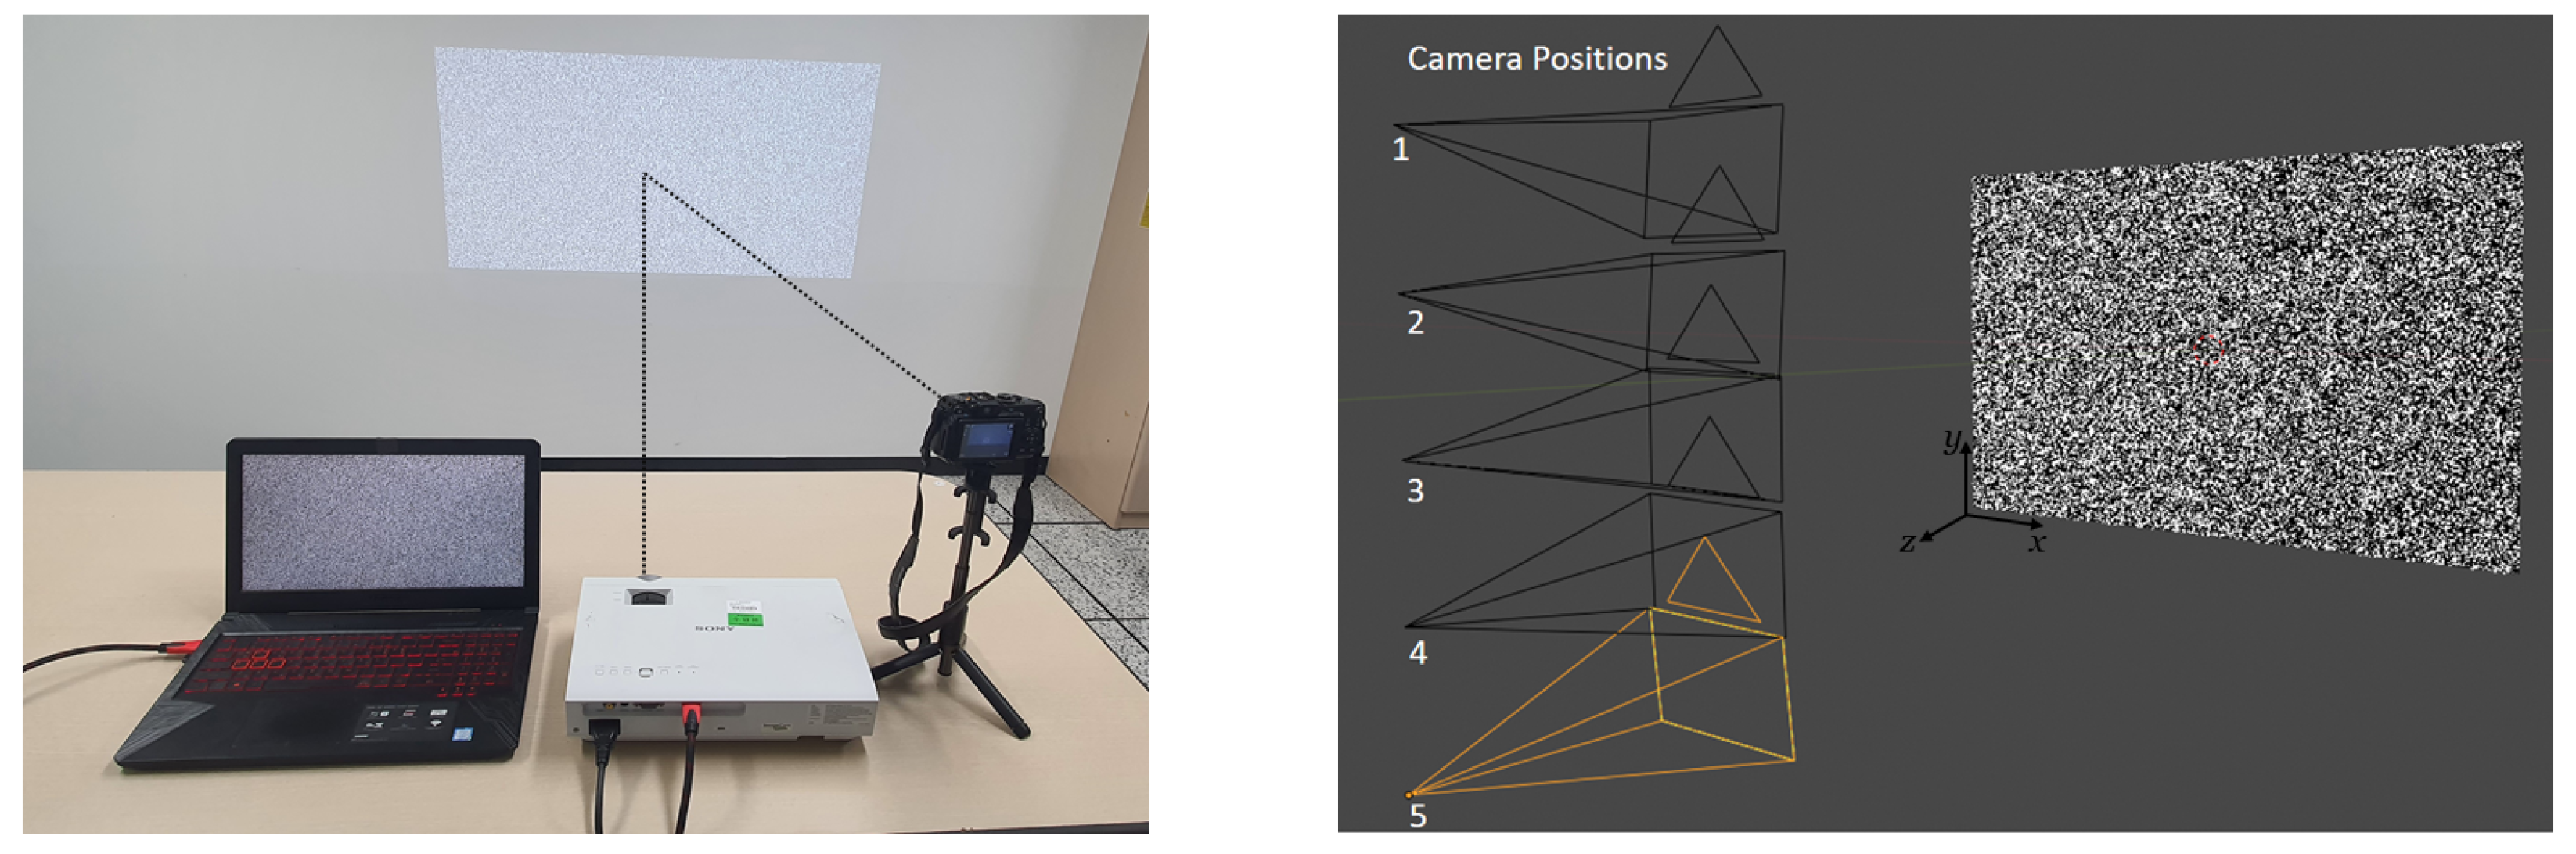
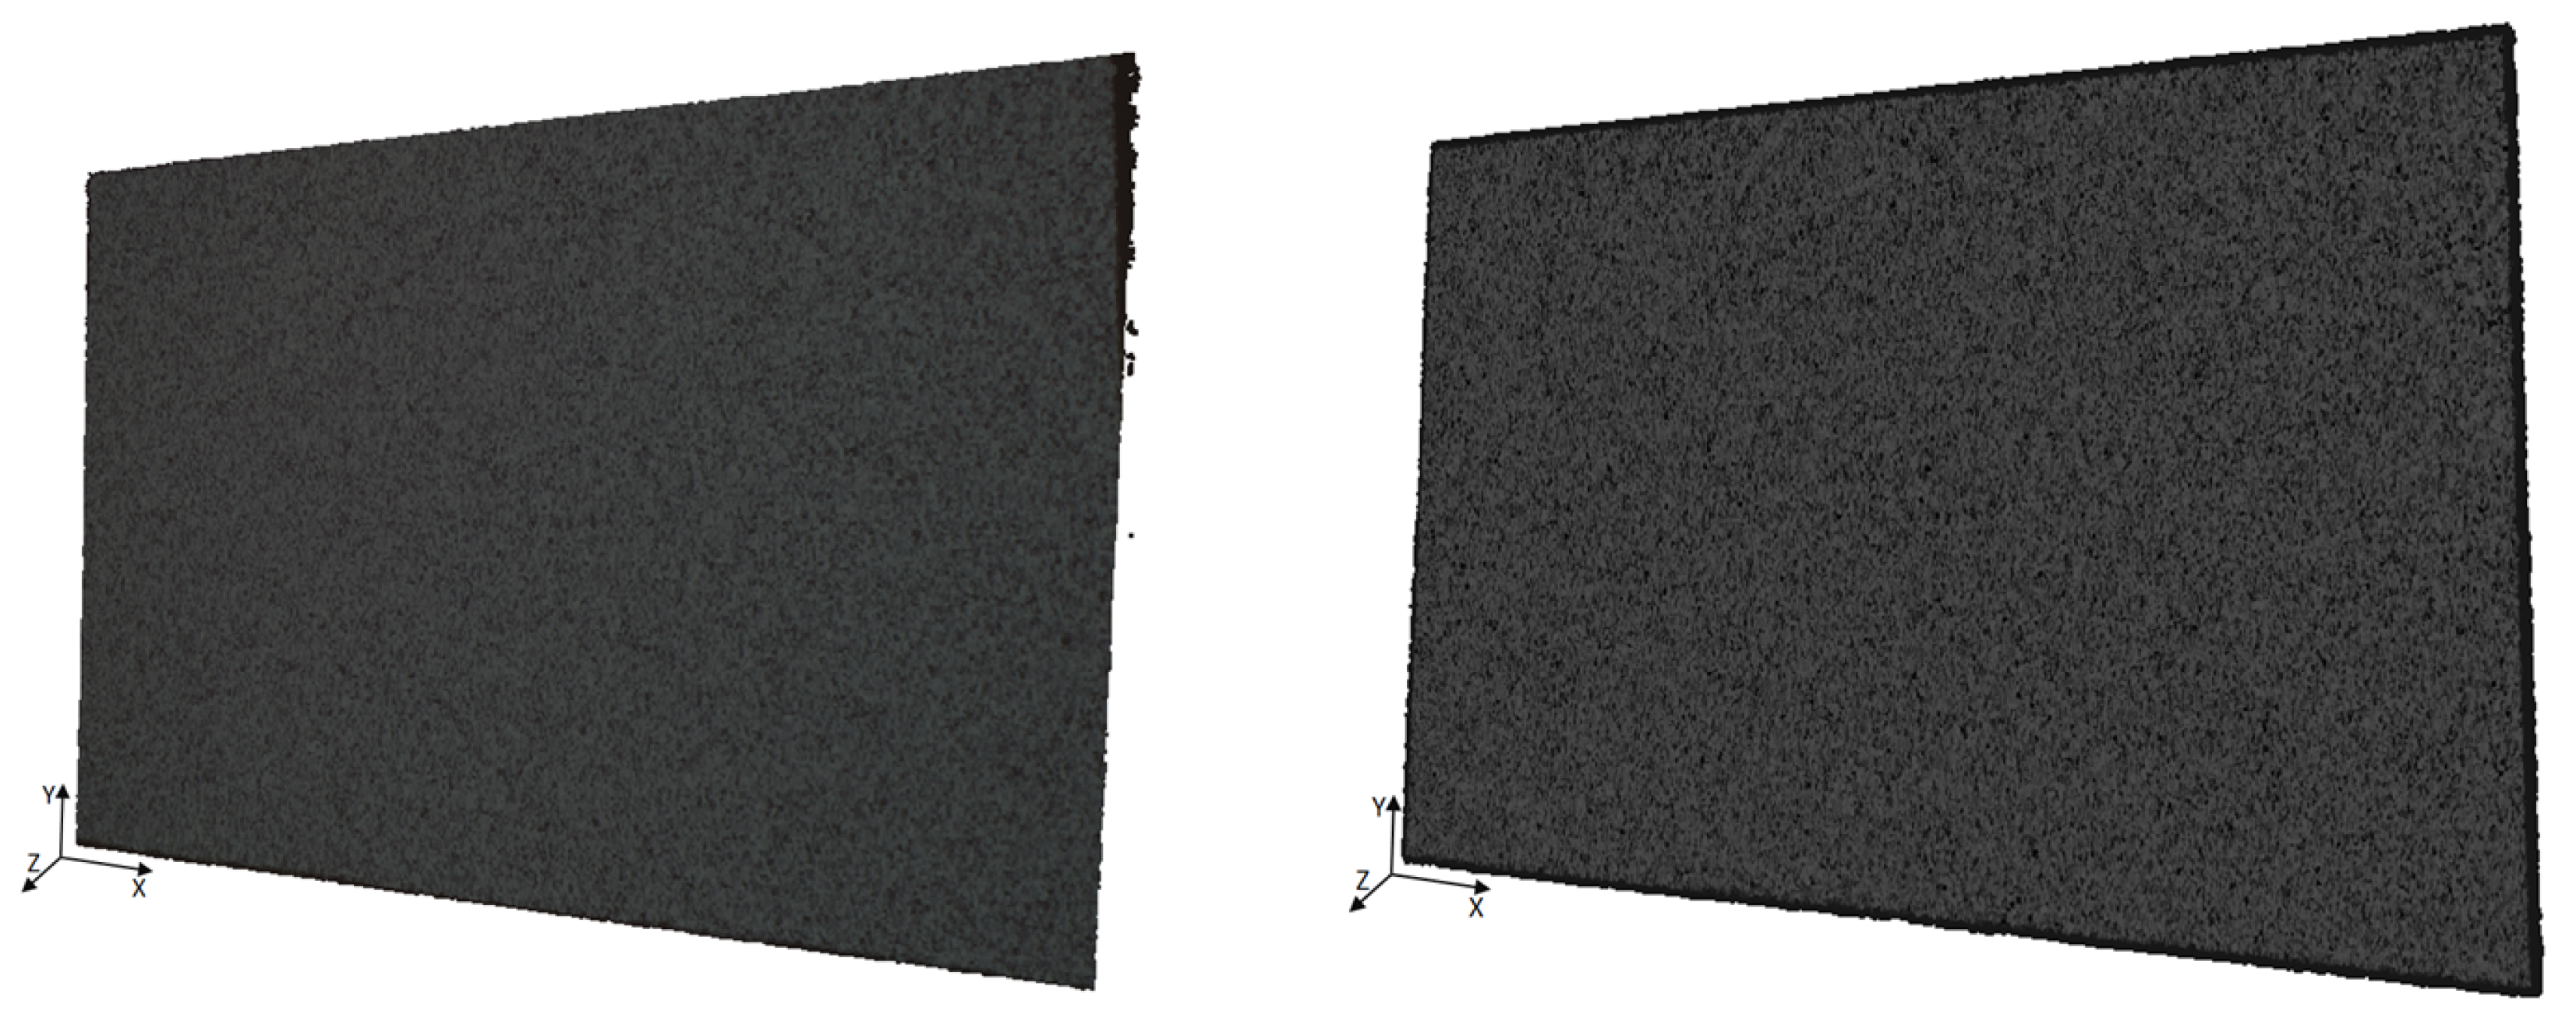
3.2.1. Phase One: Planar Surface Data Collection
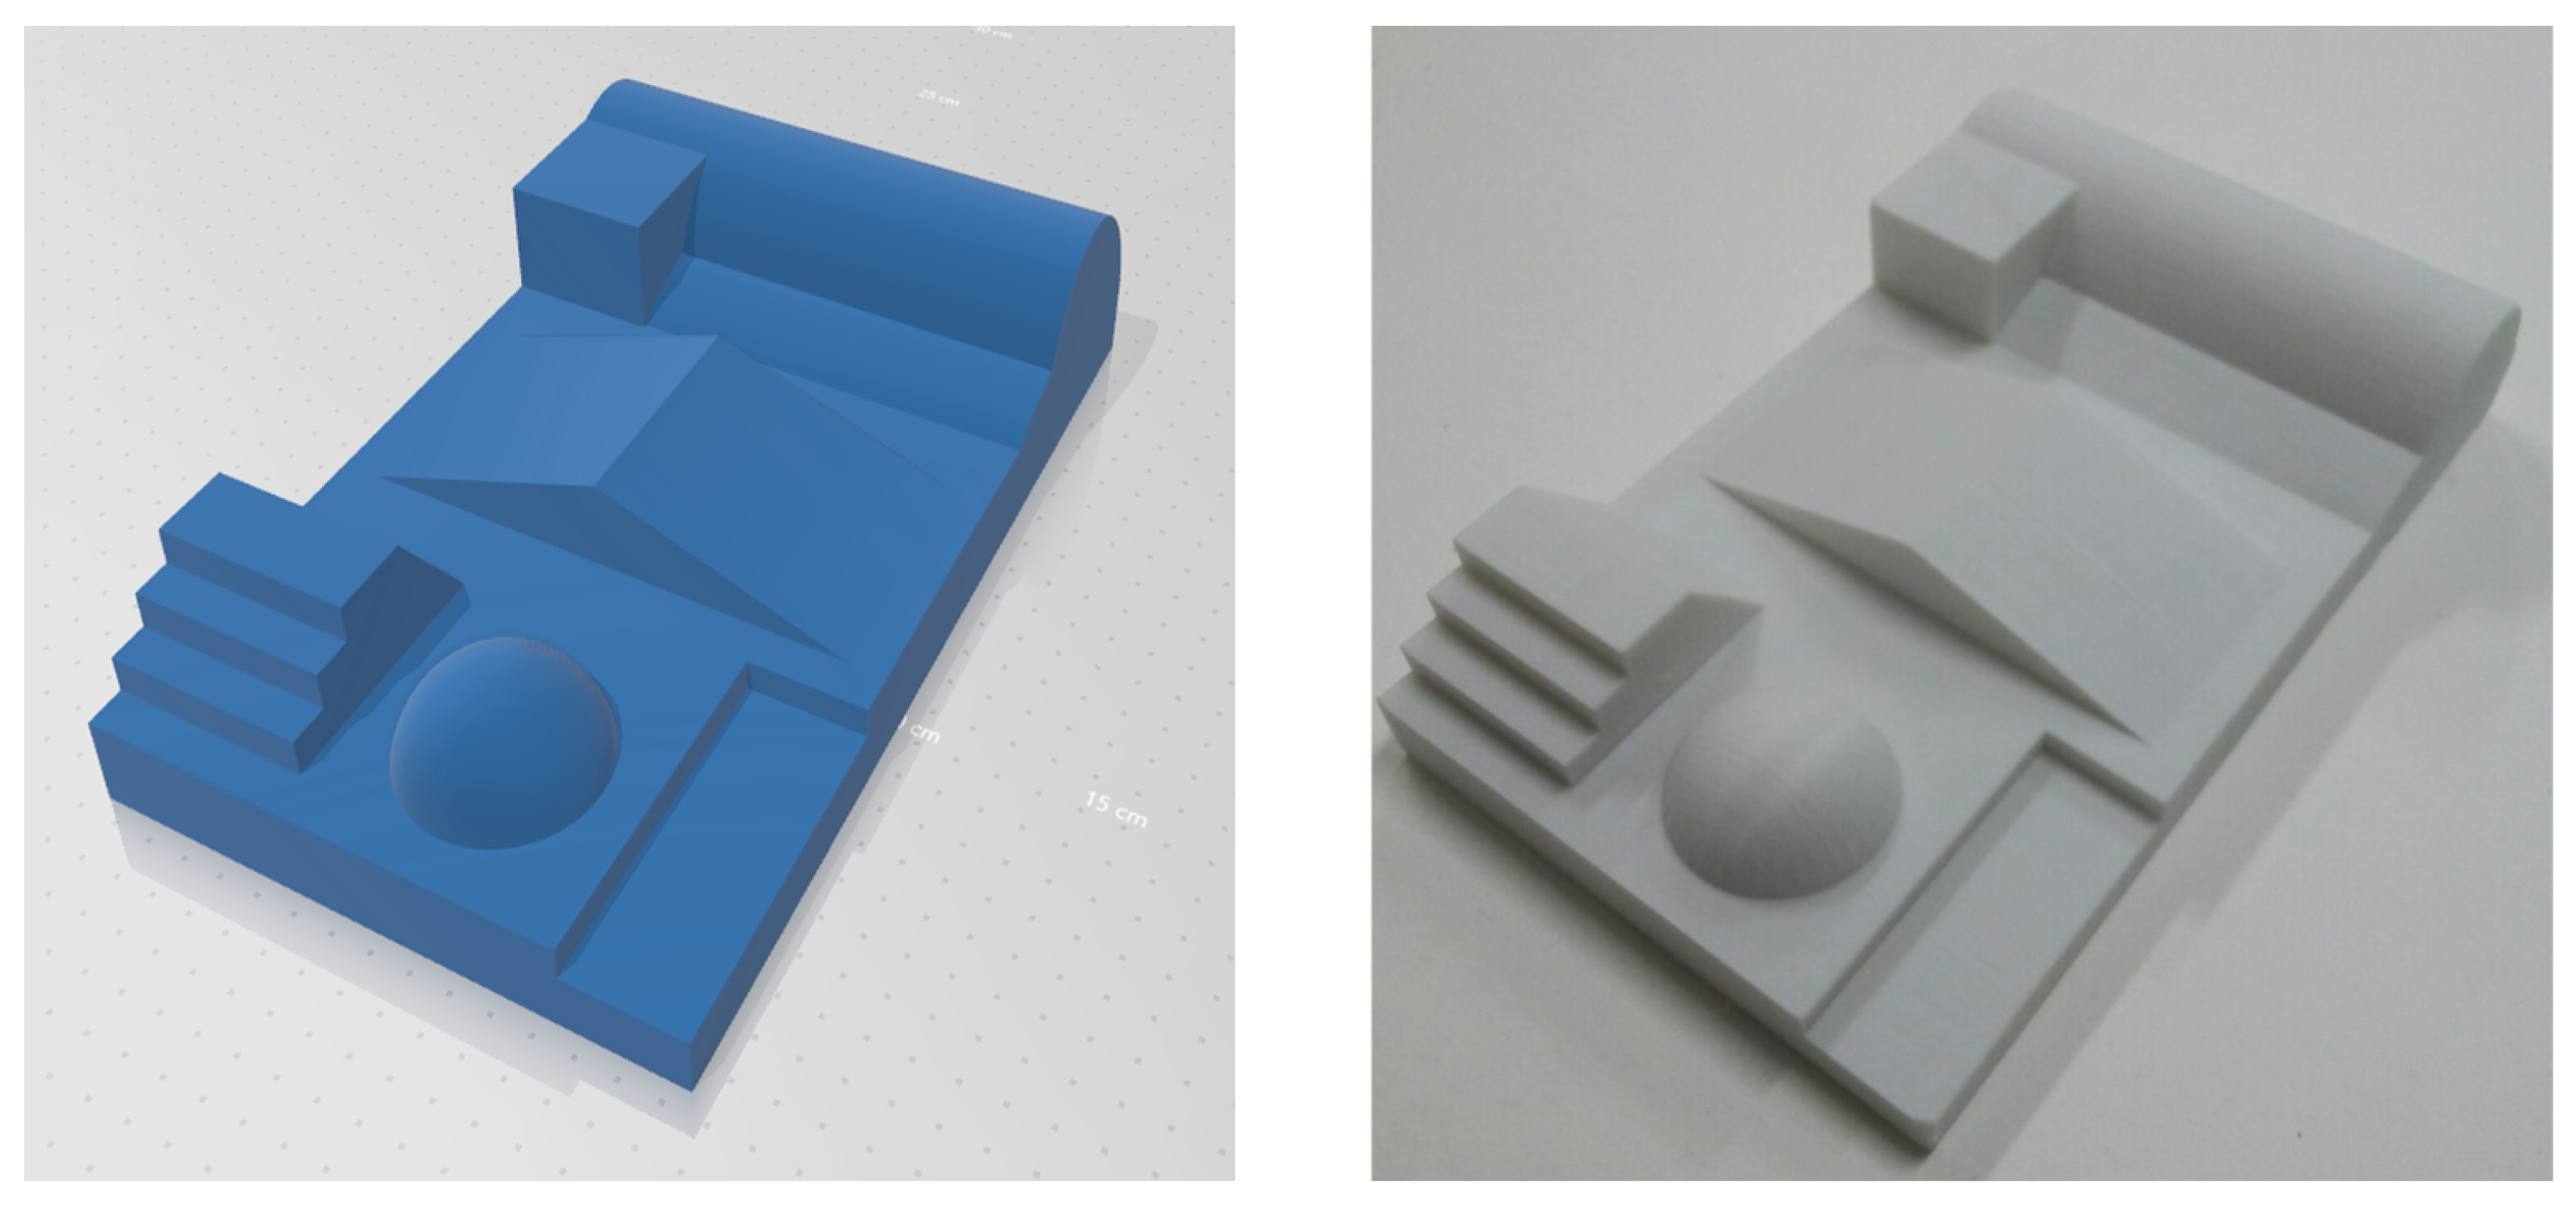
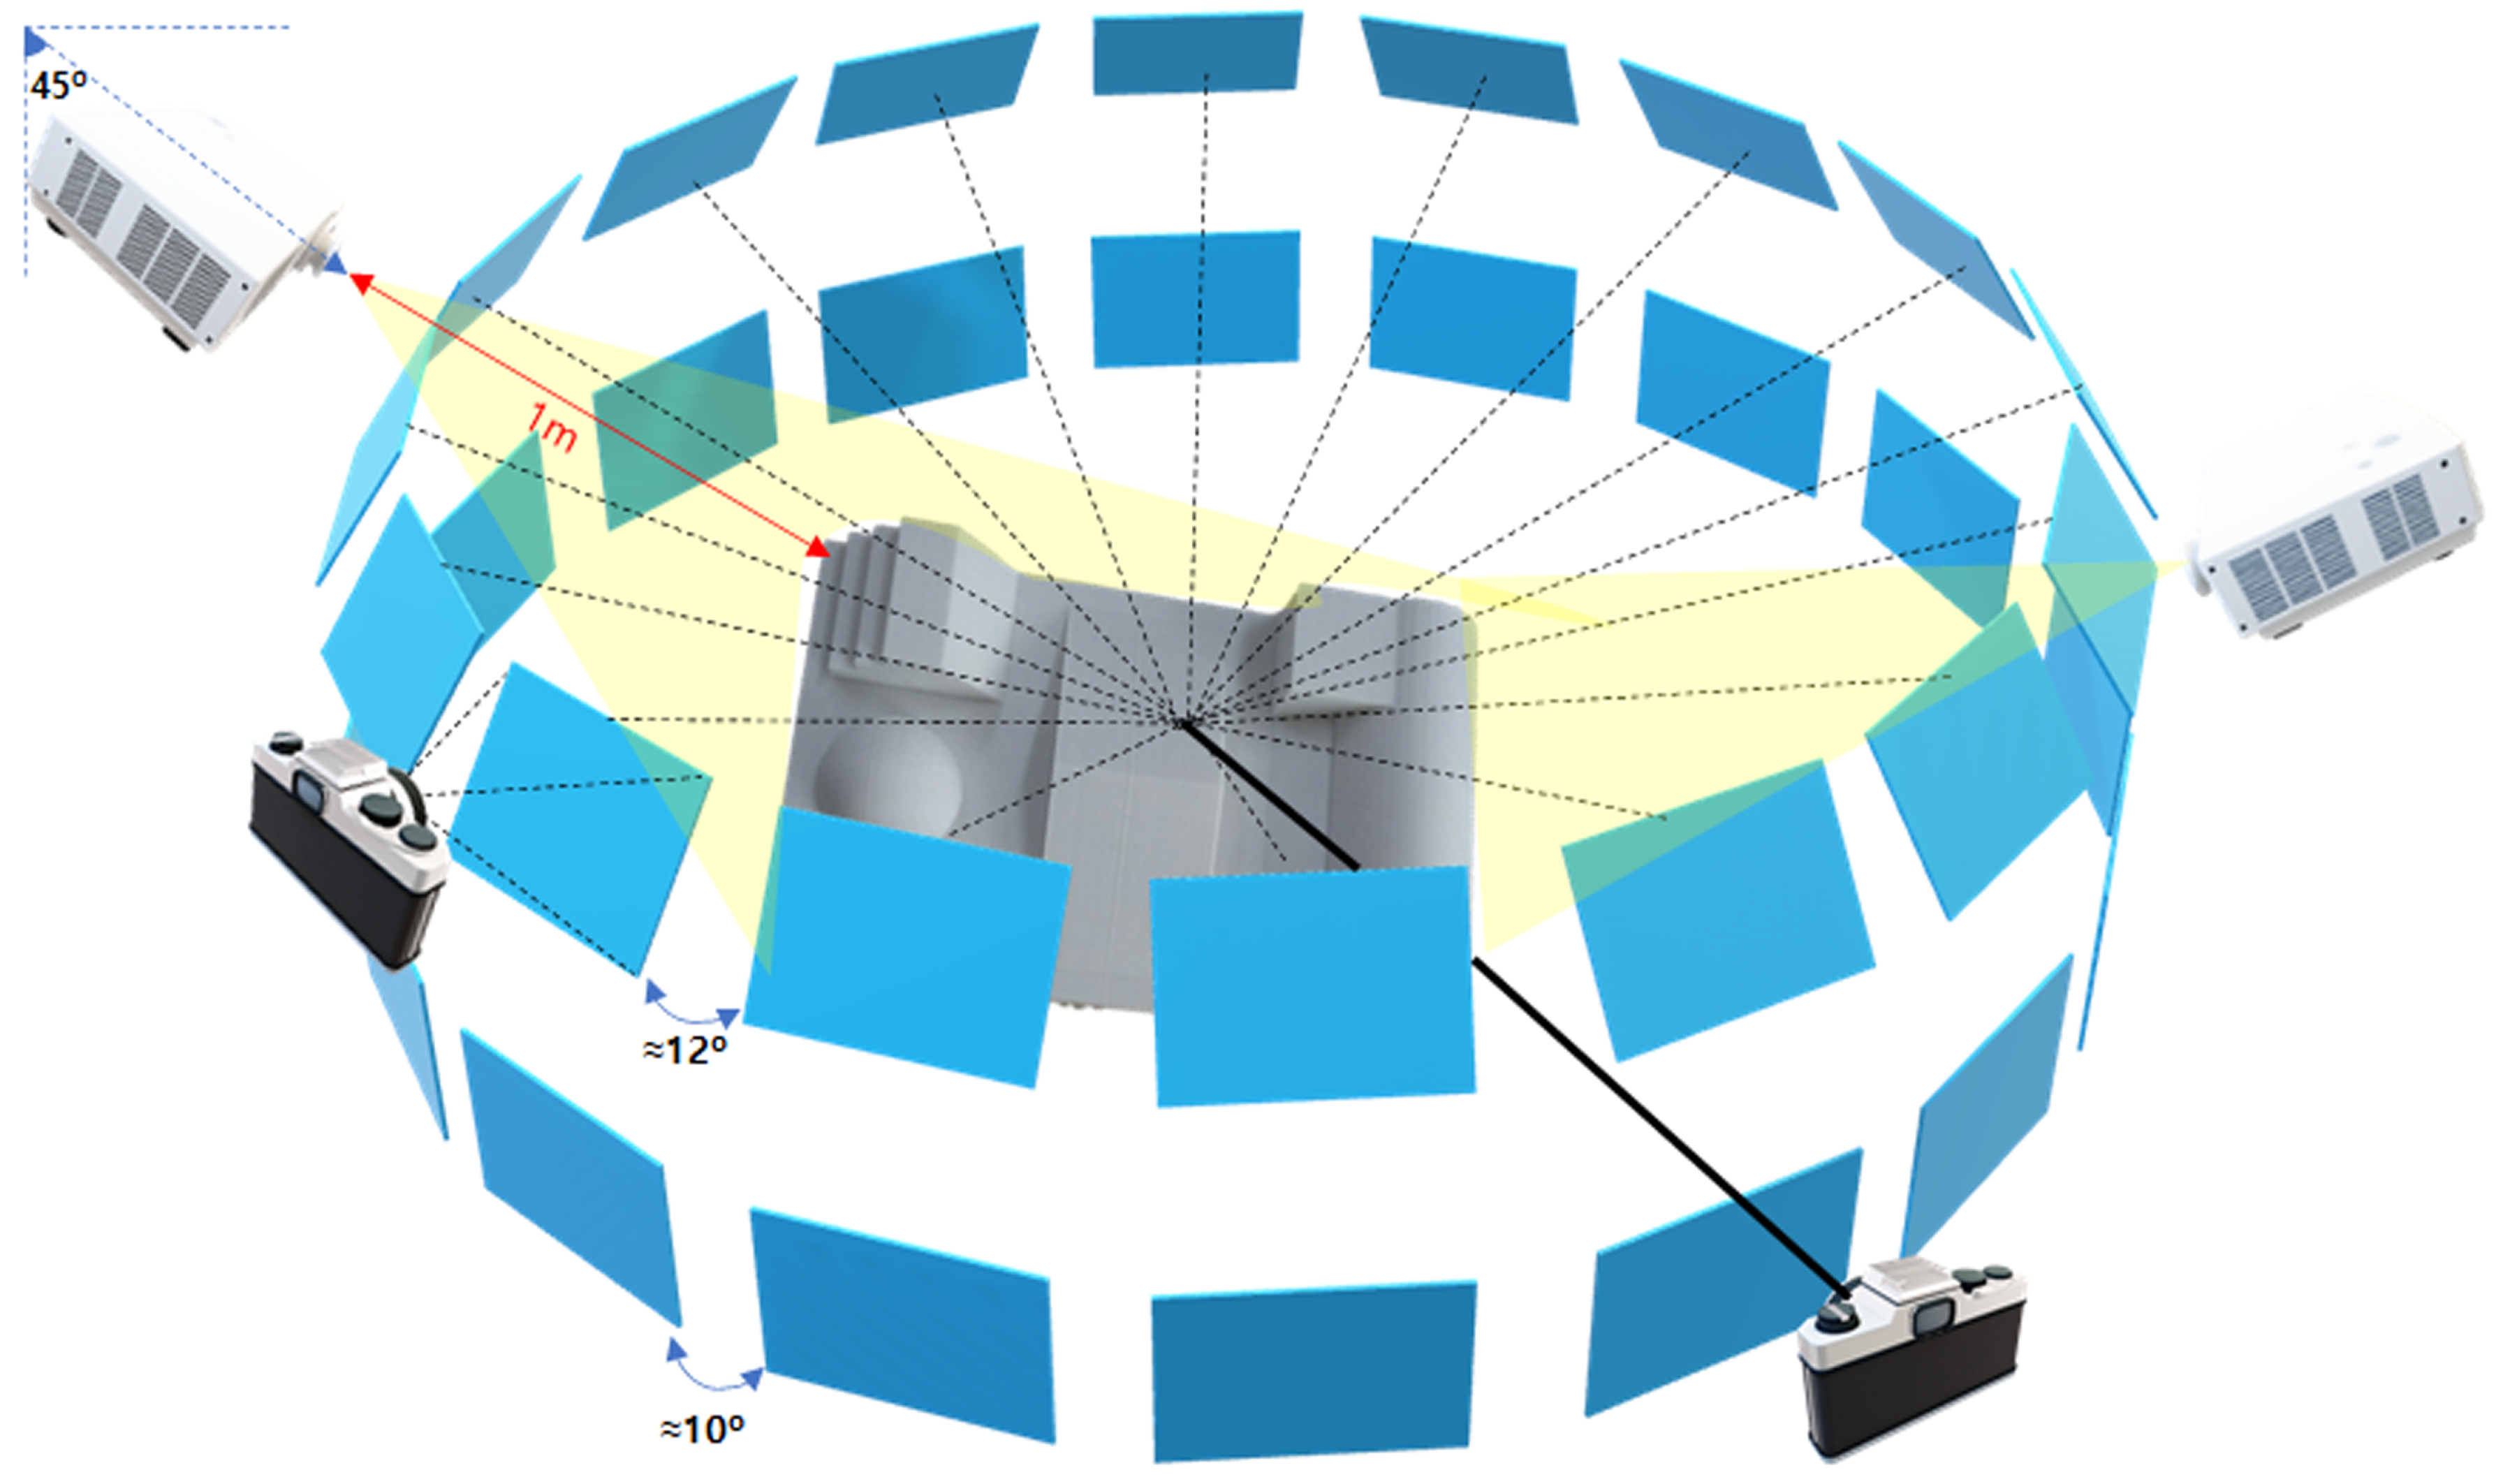
3.2.2. Phase Two: Complex Surface Image Acquisition
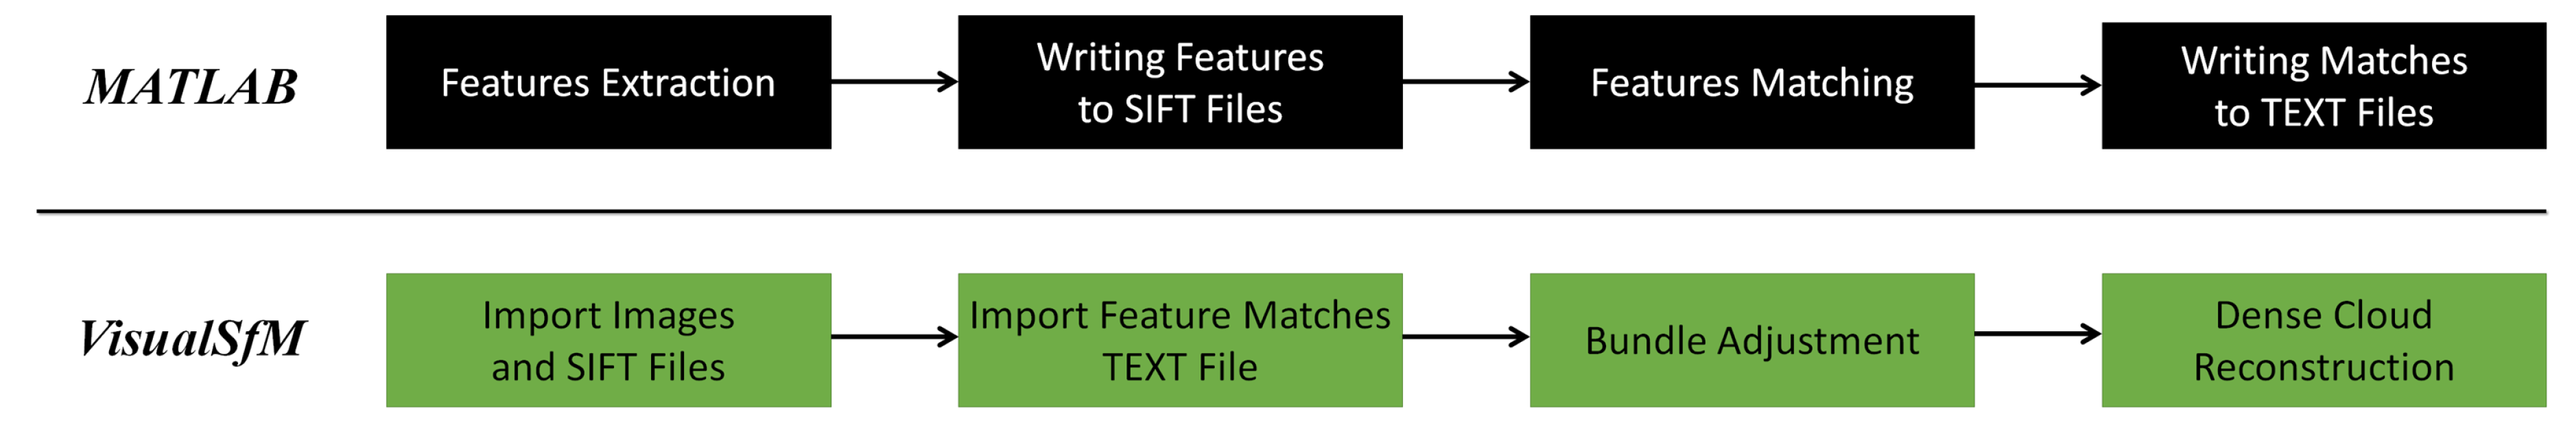
3.3. 3D Reconstruction Using Feature Extraction and Matching Plug-In
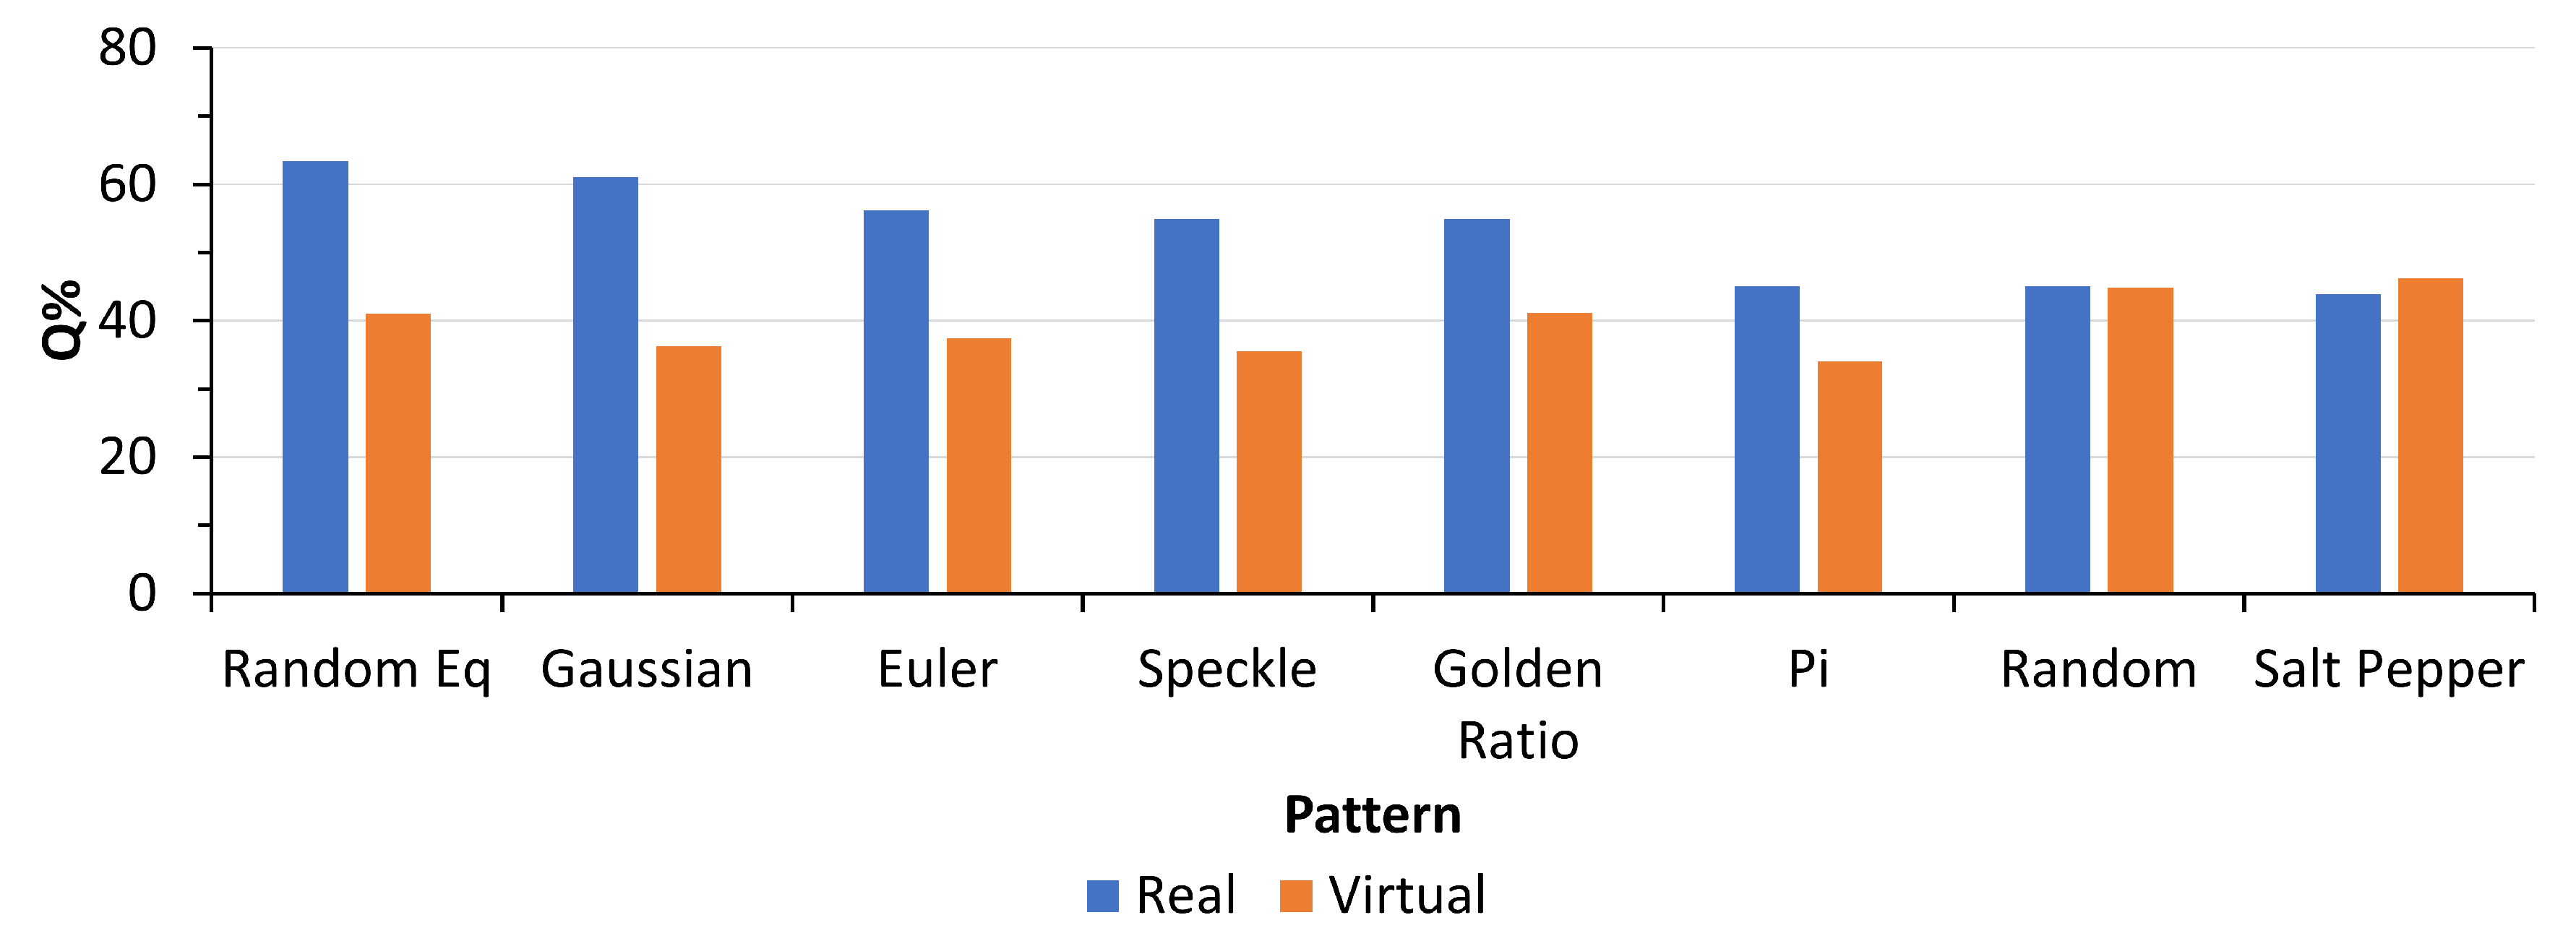
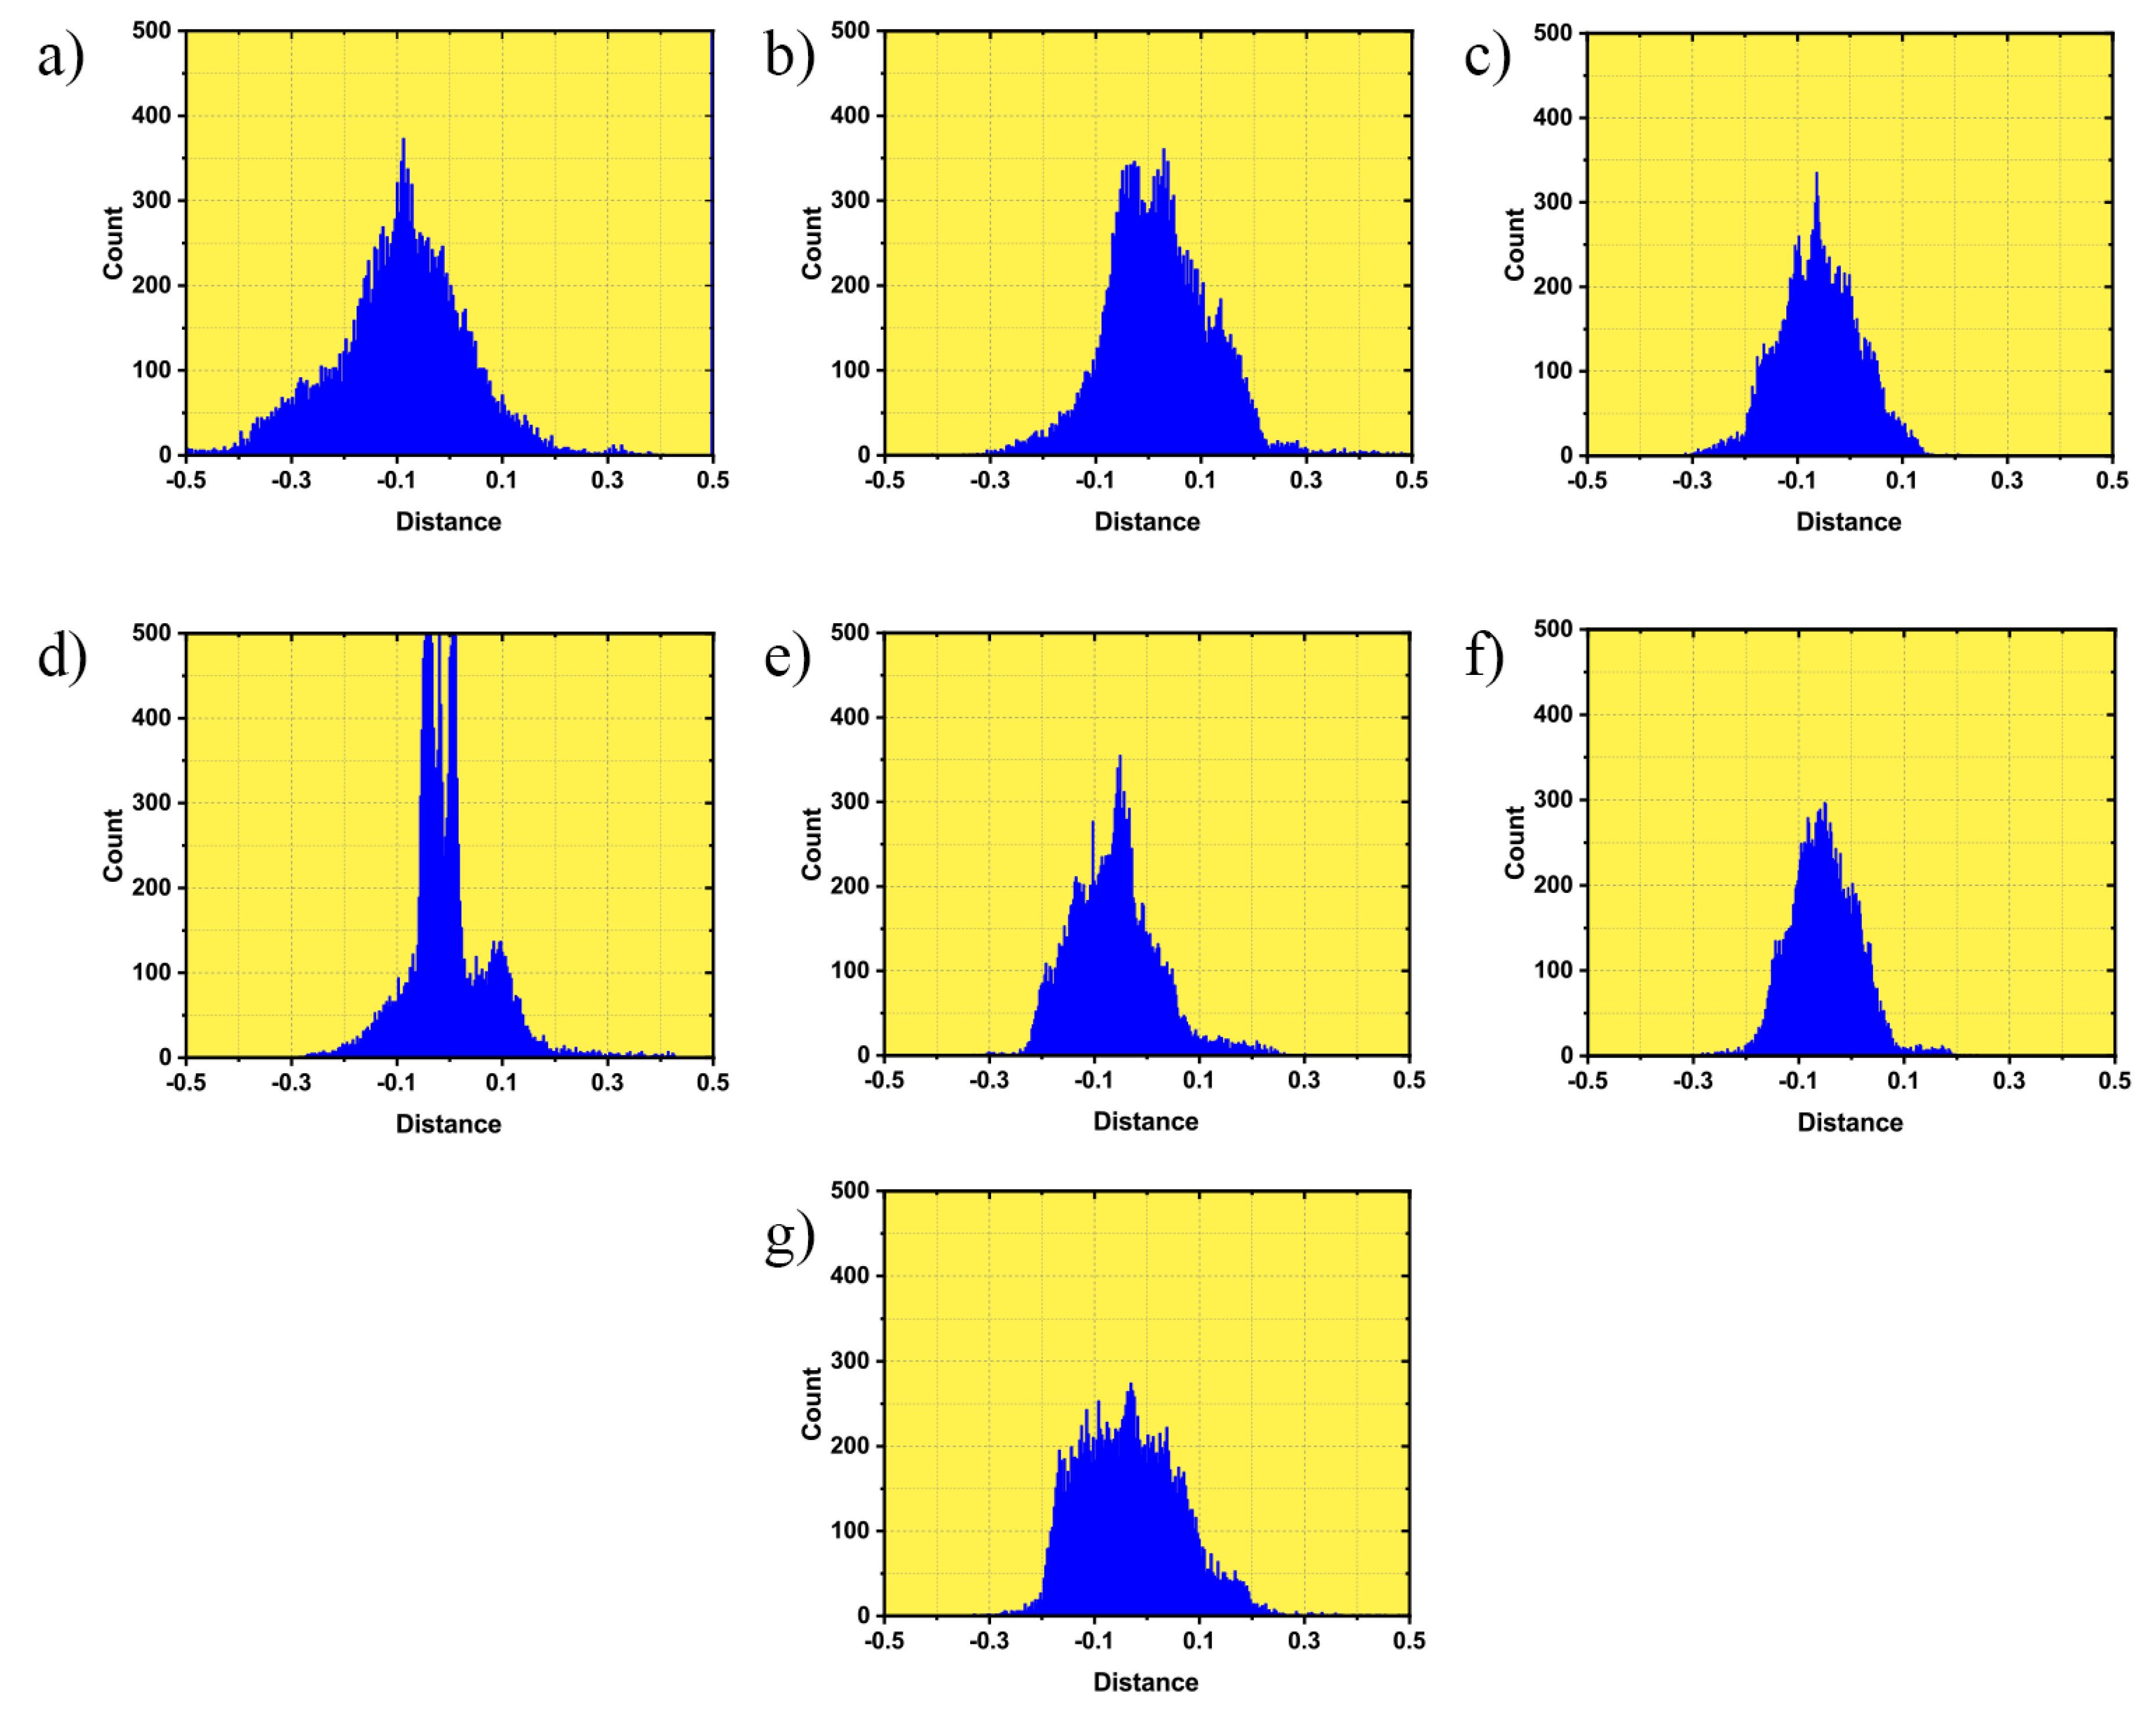
4. Results
5. Discussion
6. Conclusions
Author Contributions
Funding
Acknowledgments
Conflicts of Interest
Appendix A

| Method Name | Matlab Function for Feature Detection | Matlab Function for Feature Description |
|---|---|---|
| HARRIS | detectHARRISFeatures(MinQuality, 0.01) | extractFeatures(‘method’, ‘SURF’, ‘size’, 128) |
| Shi-Tomsi | detectMinEigenFeatures(MinQuality, 0.2) | extractFeatures(‘method’, ‘SURF’, ‘size’, 128) |
| MSER | detectMSERFeatures(‘ThresholdDelta’, 1, ‘MaxAreaVariation’, 0.5) | extractFeatures(‘method’, ‘SURF’, ‘size’, 128) |
| SURF | detectSURFFeatures(‘NumOctave’, 4, ‘MetricThreshold’, 50) | extractFeatures(‘size’, 128) |
| KAZE | detectKAZEFeatures(‘Threshold’, 0.0001) | extractFeatures(‘size’, 128) |
| BRISK | detectBRISKFeatures(‘MinQuality’, 0.1, ‘MinContrast’, 0.15) | extractFeatures(‘size’, 128) |
| SIFT | SiftGPU with default parameters | extractFeature(‘size’, 128) |
References
- Aicardi, I.; Chiabrando, F.; Lingua, A.M.; Noardo, F. Recent trends in cultural heritage 3D survey: The photogrammetric computer vision approach. J. Cult. Herit. 2018, 32, 257–266. [Google Scholar] [CrossRef]
- Bianco, S.; Ciocca, G.; Marelli, D. Evaluating the Performance of Structure from Motion Pipelines. J. Imaging 2018, 4, 98. [Google Scholar] [CrossRef] [Green Version]
- Chang, Y.C.; Detchev, I.; Habib, A. A photogrammetric system for 3D reconstruction of a scoliotic torso. In Proceedings of the ASPRS 2009 Annual Conference, Baltimore, MD, USA, 9–13 March 2009; p. 12. [Google Scholar]
- Poux, F.; Valembois, Q.; Mattes, C.; Kobbelt, L.; Billen, R. Initial User-Centered Design of a Virtual Reality Heritage System: Applications for Digital Tourism. Remote Sens. 2020, 12, 2583. [Google Scholar] [CrossRef]
- Bruno, F.; Bruno, S.; De Sensi, G.; Luchi, M.L.; Mancuso, S.; Muzzupappa, M. From 3D reconstruction to virtual reality: A complete methodology for digital archaeological exhibition. J. Cult. Herit. 2010, 11, 42–49. [Google Scholar] [CrossRef]
- Kim, J.M.; Shin, D.K.; Ahn, E.Y. Image-Based Modeling for Virtual Museum. In Multimedia, Computer Graphics and Broadcasting; Kim, T.H., Adeli, H., Grosky, W.I., Pissinou, N., Shih, T.K., Rothwell, E.J., Kang, B.H., Shin, S.J., Eds.; Springer: Berlin/Heidelberg, Germany, 2011; Volume 262, pp. 108–119. [Google Scholar]
- Zancajo-Blazquez, S.; Gonzalez-Aguilera, D.; Gonzalez-Jorge, H.; Hernandez-Lopez, D. An Automatic Image-Based Modelling Method Applied to Forensic Infography. PLoS ONE 2015, 10, e0118719. [Google Scholar] [CrossRef]
- Laviada, J.; Arboleya-Arboleya, A.; Álvarez, Y.; González-Valdés, B.; Las-Heras, F. Multiview three- dimensional reconstruction by millimetre-wave portable camera. Sci. Rep. 2017, 7, 6479. [Google Scholar] [CrossRef]
- Hammond, J.E.; Vernon, C.A.; Okeson, T.J.; Barrett, B.J.; Arce, S.; Newell, V.; Janson, J.; Franke, K.W.; Hedengren, J.D. Survey of 8 UAV Set-Covering Algorithms for Terrain Photogrammetry. Remote Sens. 2020, 12, 2285. [Google Scholar] [CrossRef]
- Forsmoo, J.; Anderson, K.; Macleod, C.J.A.; Wilkinson, M.E.; DeBell, L.; Brazier, R.E. Structure from motion photogrammetry in ecology: Does the choice of software matter? Ecol. Evol. 2019, 9, 12964–12979. [Google Scholar] [CrossRef]
- Iglhaut, J.; Cabo, C.; Puliti, S.; Piermattei, L.; O’Connor, J.; Rosette, J. Structure from Motion Photogrammetry in Forestry: A Review. Curr. For. Rep. 2019, 5, 155–168. [Google Scholar] [CrossRef] [Green Version]
- Hamacher, A.; Kim, S.J.; Cho, S.T.; Pardeshi, S.; Lee, S.H.; Eun, S.J.; Whangbo, T.K. Application of Virtual, Augmented, and Mixed Reality to Urology. Int. Neurourol. J. 2016, 20, 172–181. [Google Scholar] [CrossRef]
- Perez, E.; Merchan, P.; Merchan, M.J.; Salamanca, S. Virtual Reality to Foster Social Integration by Allowing Wheelchair Users to Tour Complex Archaeological Sites Realistically. Remote Sens. 2020, 12, 419. [Google Scholar] [CrossRef] [Green Version]
- Buyukdemircioglu, M.; Kocaman, S. Reconstruction and Efficient Visualization of Heterogeneous 3D City Models. Remote Sens. 2020, 12, 2128. [Google Scholar] [CrossRef]
- Bassier, M.; Vincke, S.; De Lima Hernandez, R.; Vergauwen, M. An Overview of Innovative Heritage Deliverables Based on Remote Sensing Techniques. Remote Sens. 2018, 10, 1607. [Google Scholar] [CrossRef] [Green Version]
- Lee, J.; Hafeez, J.; Kim, K.; Lee, S.; Kwon, S. A Novel Real-Time Match-Moving Method with HoloLens. Appl. Sci. 2019, 9, 2889. [Google Scholar] [CrossRef] [Green Version]
- Ozyesil, O.; Voroninski, V.; Basri, R.; Singer, A. A Survey of Structure from Motion. arXiv 2017, arXiv:1701.08493. [Google Scholar]
- Engler, O.; Randle, V. Introduction to Texture Analysis: Macrotexture, Microtexture, and Orientation Mapping, 2nd ed.; Google-Books-ID: MpLq_0Bkn6cC; CRC Press: Boca Raton, FL, USA, 2009. [Google Scholar]
- Ahmadabadian, A.H.; Yazdan, R.; Karami, A.; Moradi, M.; Ghorbani, F. Clustering and selecting vantage images in a low-cost system for 3D reconstruction of texture-less objects. Measurement 2017, 99, 185–191. [Google Scholar] [CrossRef]
- Hosseininaveh Ahmadabadian, A.; Karami, A.; Yazdan, R. An automatic 3D reconstruction system for texture-less objects. Robot. Auton. Syst. 2019, 117, 29–39. [Google Scholar] [CrossRef]
- Koutsoudis, A.; Ioannakis, G.; Vidmar, B.; Arnaoutoglou, F.; Chamzas, C. Using noise function-based patterns to enhance photogrammetric 3D reconstruction performance of featureless surfaces. J. Cult. Herit. 2015, 16, 664–670. [Google Scholar] [CrossRef]
- Santosi, Z.; Budak, I.; Stojakovic, V.; Sokac, M.; Vukelic, D. Evaluation of synthetically generated patterns for image-based 3D reconstruction of texture-less objects. Measurement 2019, 147, 106883. [Google Scholar] [CrossRef]
- Hafeez, J.; Kwon, S.C.; Lee, S.H.; Hamacher, A. 3D surface reconstruction of smooth and textureless objects. In Proceedings of the International Conference on Emerging Trends Innovation in ICT (ICEI), Pune, India, 3–5 February 2017; pp. 145–149. [Google Scholar]
- Hafeez, J.; Lee, S.; Kwon, S.; Hamacher, A. Image Based 3D Reconstruction of Texture-less Objects for VR Contents. Int. J. Adv. Smart Converg. 2017, 6, 9–17. [Google Scholar] [CrossRef] [Green Version]
- Hafeez, J.; Jeon, H.J.; Hamacher, A.; Kwon, S.C.; Lee, S.H. The effect of patterns on image-based modelling of texture-less objects. Metrol. Meas. Syst. 2018, 25, 755–767. [Google Scholar]
- Harris, C.; Stephens, M. A combined corner and edge detector. In Proceedings of the Fourth Alvey Vision Conference, Manchester, UK, 31 August–2 September 1988; pp. 147–151. [Google Scholar]
- Shi, J.; Tomasi. Good features to track. In Proceedings of the IEEE Conference on Computer Vision and Pattern Recognition, Seattle, WA, USA, 21–23 June 1994; pp. 593–600. [Google Scholar]
- Leutenegger, S.; Chli, M.; Siegwart, R.Y. BRISK: Binary Robust invariant scalable keypoints. In Proceedings of the International Conference on Computer Vision, Barcelona, Spain, 6–13 November 2011; pp. 2548–2555. [Google Scholar]
- Lowe, D.G. Distinctive Image Features from Scale-Invariant Keypoints. Int. J. Comput. Vis. 2004, 60, 91–110. [Google Scholar] [CrossRef]
- Bay, H.; Tuytelaars, T.; Van Gool, L. SURF: Speeded Up Robust Features. In Lecture Notes in Computer Science, Proceedings of the Computer Vision—ECCV, Graz, Austria, 7–13 May 2006; Leonardis, A., Bischof, H., Pinz, A., Eds.; Springer: Berlin/Heidelberg, Germany, 2006; pp. 404–417. [Google Scholar]
- Alcantarilla, P.F.; Bartoli, A.; Davison, A.J. KAZE Features. In Lecture Notes in Computer Science, Proceedings of the Computer Vision—ECCV, Florence, Italy, 7–13 October 2012; Fitzgibbon, A., Lazebnik, S., Perona, P., Sato, Y., Schmid, C., Eds.; Springer: Berlin/Heidelberg, Germany, 2012; pp. 214–227. [Google Scholar]
- Matas, J.; Chum, O.; Urban, M.; Pajdla, T. Robust wide-baseline stereo from maximally stable extremal regions. Image Vis. Comput. 2004, 22, 761–767. [Google Scholar] [CrossRef]
- MATLAB—The MathWorks Inc. Available online: www.mathworks.com (accessed on 10 August 2020).
- Tomasi, C.; Kanade, T. Detection and Tracking of Point Features; Technical Report; Carnegie Mellon University: Pittsburgh, PA, USA, 1991. [Google Scholar]
- Wu, C. SiftGPU: A GPU Implementation of Scale Invariant Feature Transform (SIFT). Available online: http://cs.unc.edu/ccwu/siftgpu (accessed on 10 August 2020).
- Mikolajczyk, K.; Schmid, C. A performance evaluation of local descriptors. IEEE Trans. Pattern Anal. Mach. Intell. 2005, 27, 1615–1630. [Google Scholar] [CrossRef] [Green Version]
- Fischler, M.A.; Bolles, R.C. Random sample consensus: A paradigm for model fitting with applications to image analysis and automated cartography. Commun. ACM 1981, 24, 381–395. [Google Scholar] [CrossRef]
- Chum, O.; Matas, J. Matching with PROSAC—Progressive sample consensus. In Proceedings of the IEEE Computer Society Conference on Computer Vision and Pattern Recognition (CVPR’05), San Diego, CA, USA, 20–25 June 2005; Volume 1, pp. 220–226. [Google Scholar]
- Triggs, B.; McLauchlan, P.F.; Hartley, R.I.; Fitzgibbon, A.W. Bundle Adjustment—A Modern Synthesis. In Lecture Notes in Computer Science, Proceedings of the Vision Algorithms: Theory and Practice, Corfu, Greece, 21–22 September 1999; Triggs, B., Zisserman, A., Szeliski, R., Eds.; Springer: Berlin/Heidelberg, Germany, 2000; pp. 298–372. [Google Scholar]
- Furukawa, Y.; Curless, B.; Seitz, S.M.; Szeliski, R. Towards Internet-scale multi-view stereo. In Proceedings of the IEEE Computer Society Conference on Computer Vision and Pattern Recognition, San Francisco, CA, USA, 13–18 June 2010; pp. 1434–1441. [Google Scholar]
- Furukawa, Y.; Ponce, J. Accurate, Dense, and Robust Multiview Stereopsis. IEEE Trans. Pattern Anal. Mach. Intell. 2010, 32, 1362–1376. [Google Scholar] [CrossRef]
- Kazhdan, M.; Funkhouser, T.; Rusinkiewicz, S. Rotation Invariant Spherical Harmonic Representation of 3D Shape Descriptors. In Proceedings of the Eurographics Symposiumon Geometry Processing, Aachen, Germany, 23–25 June 2003; p. 9. [Google Scholar]
- Blender Online Community. blender.org—Home of the Blender Project—Free and Open 3D Creation Software. Available online: www.blender.org (accessed on 10 August 2020).
- Agisoft Metashape. Agisoft LLC: St. Petersburg, Russia. Available online: www.https://www.agisoft.com (accessed on 10 August 2020).
- Wu, C. Towards Linear-Time Incremental Structure from Motion. In Proceedings of the 2013 International Conference on 3D Vision, 3DV’13, Seattle, WA, USA, 29 June–1 July 2013; IEEE Computer Society: Washington, DC, USA, 2013; pp. 127–134. [Google Scholar]
- CloudCompare—Open Source Project. Available online: www.cloudcompare.org (accessed on 10 August 2020).
- Besl, P.J.; McKay, H.D. A method for registration of 3-D shapes. IEEE Trans. Pattern Anal. Mach. Intell. 1992, 14, 239–256. [Google Scholar] [CrossRef]


| Pattern | HARRIS | Shi-Tomasi | MSER | SIFT | SURF | KAZE | BRISK | |||||||
|---|---|---|---|---|---|---|---|---|---|---|---|---|---|---|
| Real | Virtual | Real | Virtual | Real | Virtual | Real | Virtual | Real | Virtual | Real | Virtual | Real | Virtual | |
| Salt Pepper | 333,776 | 374,435 | 349,877 | 377,170 | 349,547 | 408,694 | 351,819 | 388,882 | 345,854 | 377,295 | 336,758 | 388,948 | 321,687 | 370,238 |
| Gaussian | 321,254 | 374,636 | 324,931 | 389,168 | 349,592 | 389,766 | 355,264 | 388,848 | 332,265 | 390,024 | 341,559 | 377,505 | 325,654 | 388,532 |
| Speckle | 316,190 | 389,723 | 331,225 | 390,690 | 311,359 | 390,762 | 328,399 | 408,792 | 328,996 | 407,496 | 384,552 | 387,681 | 297,111 | 388,306 |
| Pi | 396,052 | 388,957 | 416,462 | 378,691 | 372,798 | 408,658 | 401,546 | 408,516 | 390,739 | 388,939 | 386,662 | 374,973 | 402,154 | 379,557 |
| Euler | 399,088 | 389,295 | 397,218 | 389,423 | 406,699 | 375,686 | 390,470 | 390,660 | 405,226 | 390,583 | 381,252 | 375,611 | 394,009 | 389,582 |
| Golden Ratio | 400,332 | 377,244 | 403,797 | 389,335 | 386,266 | 389,482 | 392,946 | 408,541 | 391,867 | 390,148 | 396,991 | 381,597 | 395,247 | 378,049 |
| Random | 404,362 | 376,049 | 409,327 | 374,895 | 393,276 | 378,269 | 393,584 | 384,666 | 405,537 | 375,217 | 388,368 | 389,247 | 383,595 | 378,560 |
| Random Eq | 408,148 | 377,950 | 401,035 | 378,761 | 395,661 | 392,000 | 396,536 | 389,200 | 387,835 | 375,170 | 391,230 | 376,407 | 402,779 | 376,006 |
| Pattern | HARRIS | Shi-Tomasi | MSER | SIFT | SURF | KAZE | BRISK | |||||||
|---|---|---|---|---|---|---|---|---|---|---|---|---|---|---|
| Real | Virtual | Real | Virtual | Real | Virtual | Real | Virtual | Real | Virtual | Real | Virtual | Real | Virtual | |
| Salt Pepper | 0.007964 | 0.000727 | 0.001395 | 0.002825 | 0.004711 | 0.002905 | 0.002012 | 0.000851 | 0.002124 | 0.005984 | 0.008351 | 0.003033 | 0.012119 | 0.00451 |
| Gaussian | 0.005142 | 0.004051 | 0.003201 | 0.001263 | 0.003245 | 0.004886 | 0.00193 | 0.000891 | 0.001664 | 0.004059 | 0.002719 | 0.008868 | 0.004523 | 0.004501 |
| Speckle | 0.003624 | 0.006985 | 0.004261 | 0.005722 | 0.005113 | 0.000764 | 0.00302 | 0.000686 | 0.002735 | 0.002529 | 0.002354 | 0.003657 | 0.030517 | 0.007487 |
| Pi | 0.001699 | 0.00202 | 0.004283 | 0.002457 | 0.004052 | 0.009611 | 0.000971 | 0.000909 | 0.00478 | 0.0038 | 0.003925 | 0.003455 | 0.001394 | 0.009267 |
| Euler | 0.004596 | 0.003036 | 0.006106 | 0.003678 | 0.003926 | 0.002073 | 0.002374 | 0.000813 | 0.005827 | 0.002245 | 0.003115 | 0.002656 | 0.011435 | 0.002133 |
| Golden Ratio | 0.002782 | 0.006474 | 0.002302 | 0.004619 | 0.002895 | 0.004815 | 0.002319 | 0.001045 | 0.001293 | 0.004292 | 0.002504 | 0.003125 | 0.00494 | 0.004823 |
| Random | 0.004561 | 0.000614 | 0.004148 | 0.007706 | 0.001869 | 0.000741 | 0.001034 | 0.000819 | 0.003893 | 0.006808 | 0.002048 | 0.004414 | 0.002996 | 0.004258 |
| Random Eq | 0.002171 | 0.000632 | 0.00251 | 0.006221 | 0.001938 | 0.004773 | 0.001546 | 0.000743 | 0.00339 | 0.002134 | 0.002076 | 0.006545 | 0.001245 | 0.000896 |
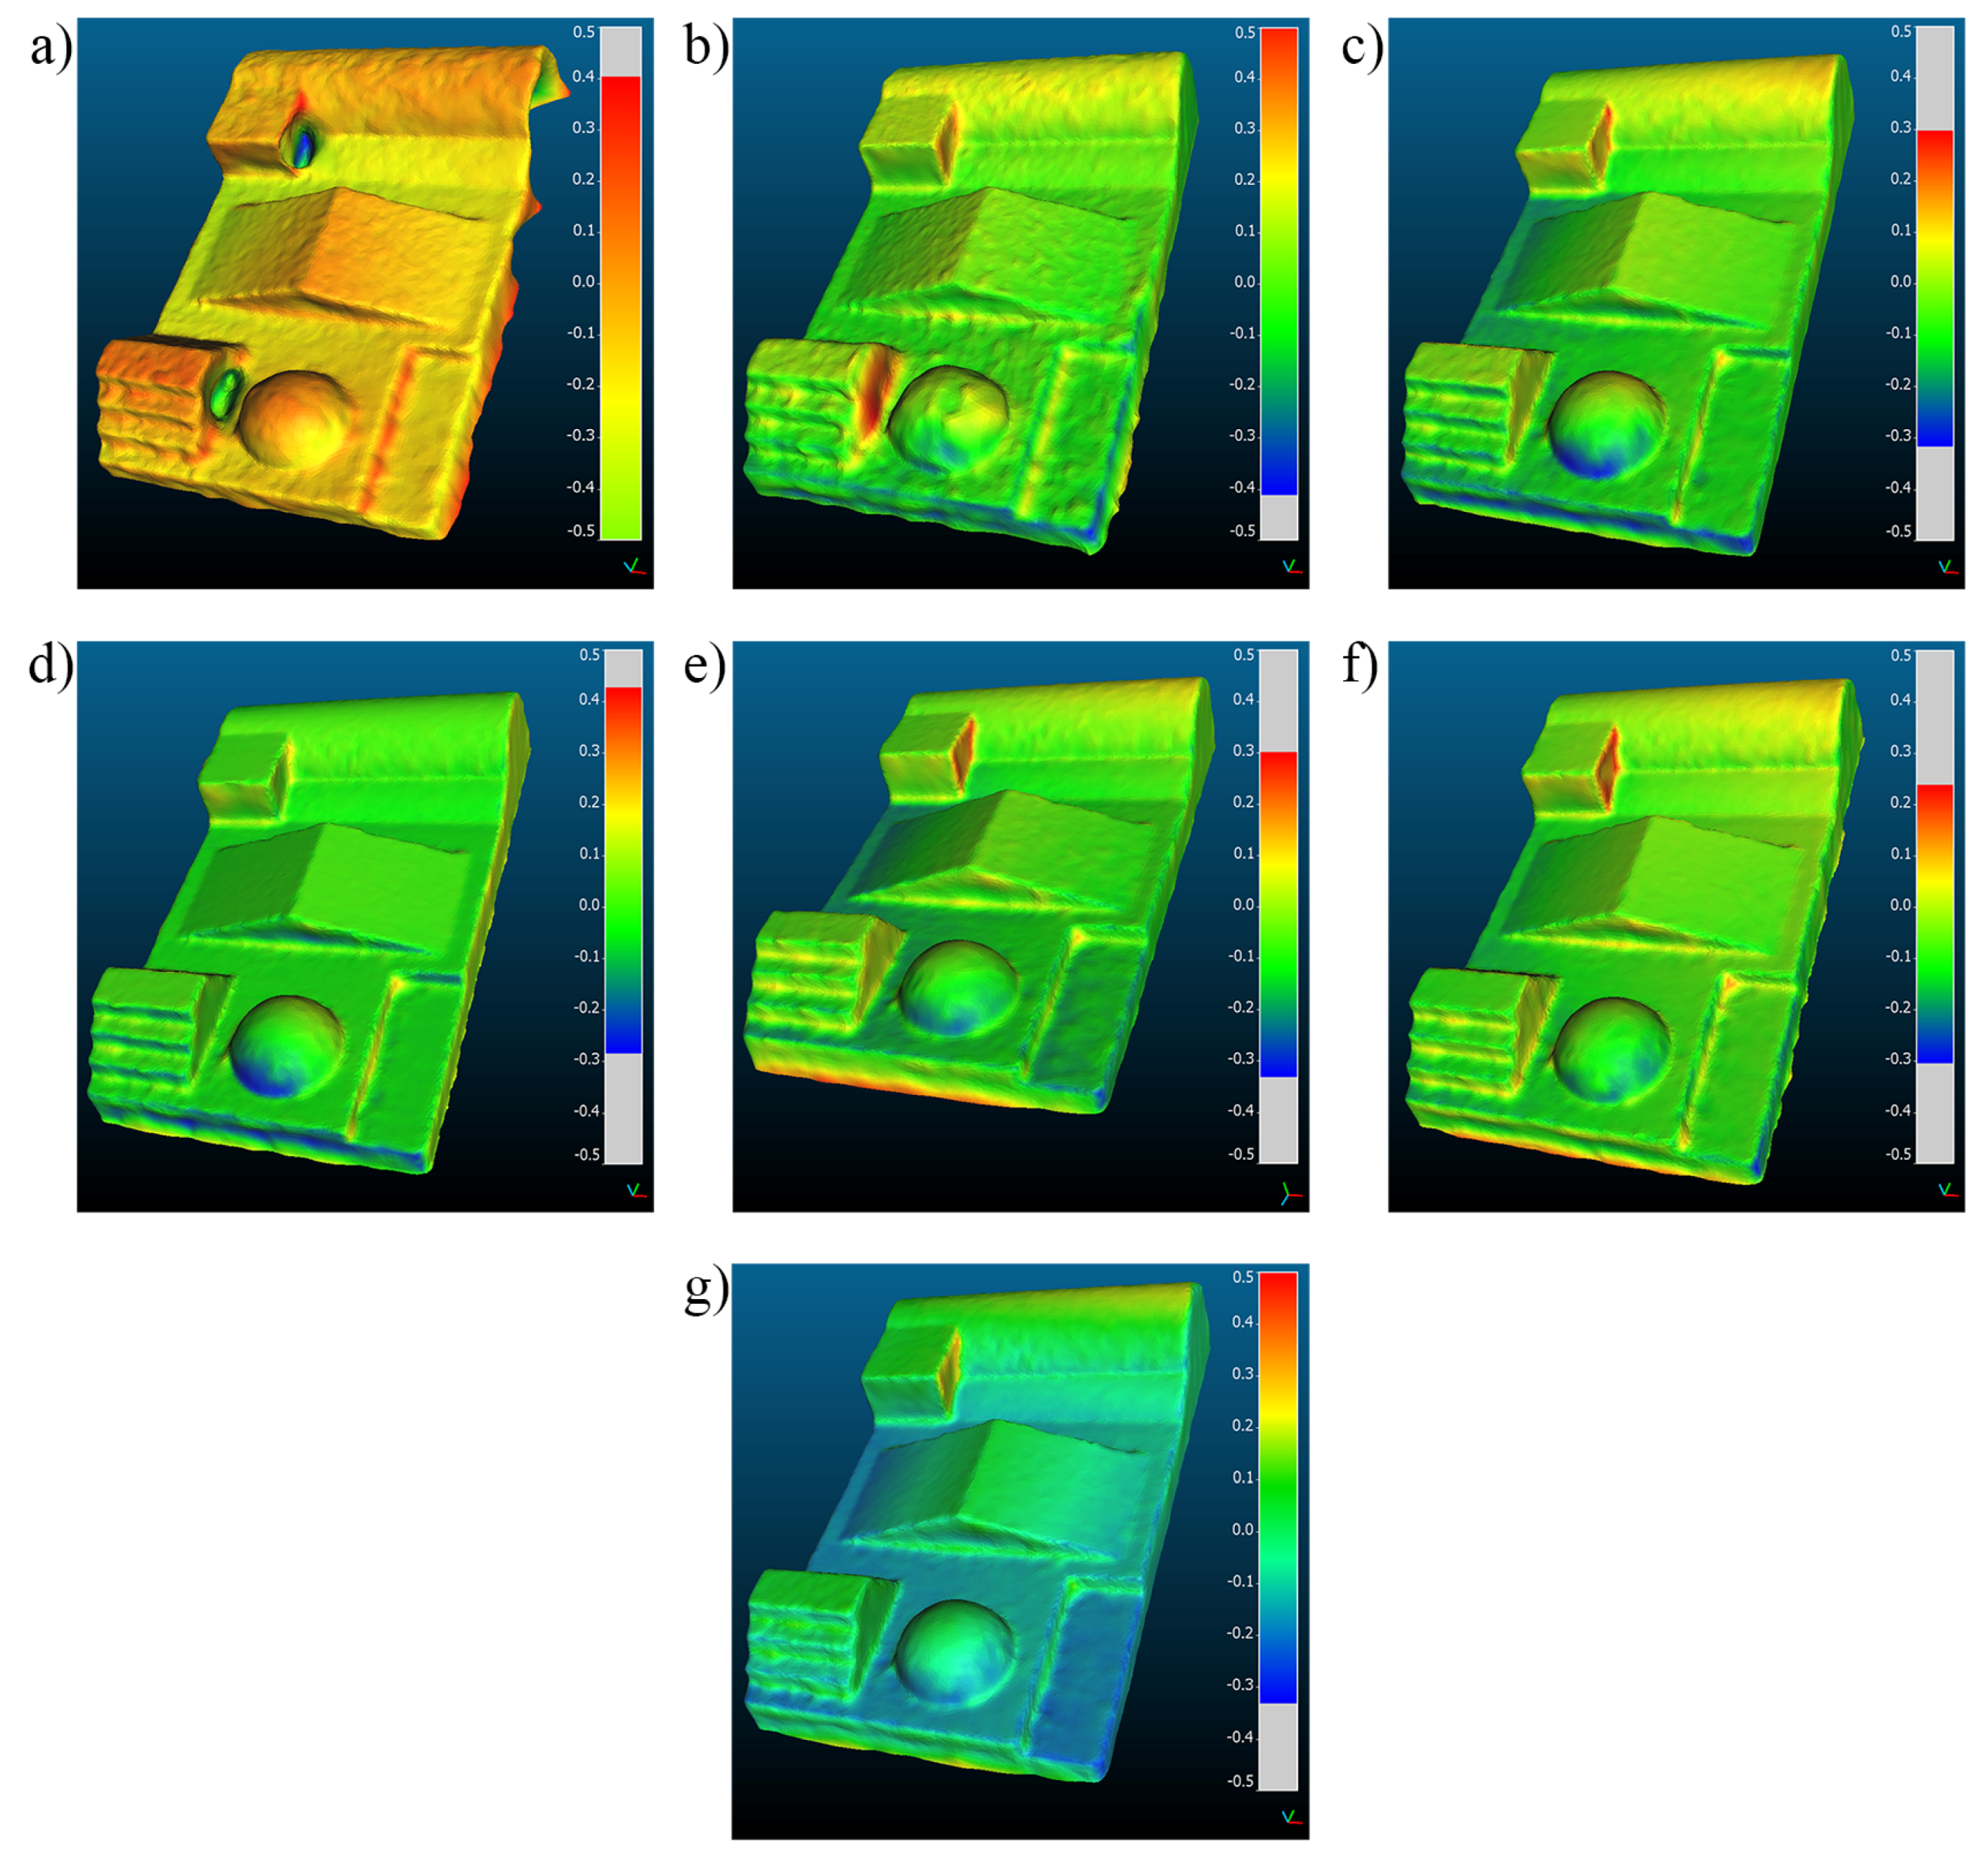
| Method | Mesh | M. Distance | St. Deviation |
|---|---|---|---|
| Vertices | [mm] | [mm] | |
| HARRIS | 77,875 | −0.1134 | 0.1798 |
| Shi-Tomasi | 90,497 | 0.0183 | 0.1011 |
| MSER | 87,923 | −0.0584 | 0.0758 |
| SIFT | 89,334 | −0.0099 | 0.0801 |
| SURF | 86,790 | −0.0228 | 0.0822 |
| KAZE | 86,198 | −0.0092 | 0.0635 |
| BRISK | 85,982 | −0.0322 | 0.0967 |
Publisher’s Note: MDPI stays neutral with regard to jurisdictional claims in published maps and institutional affiliations. |
© 2020 by the authors. Licensee MDPI, Basel, Switzerland. This article is an open access article distributed under the terms and conditions of the Creative Commons Attribution (CC BY) license (http://creativecommons.org/licenses/by/4.0/).
Share and Cite
Hafeez, J.; Lee, J.; Kwon, S.; Ha, S.; Hur, G.; Lee, S. Evaluating Feature Extraction Methods with Synthetic Noise Patterns for Image-Based Modelling of Texture-Less Objects. Remote Sens. 2020, 12, 3886. https://doi.org/10.3390/rs12233886
Hafeez J, Lee J, Kwon S, Ha S, Hur G, Lee S. Evaluating Feature Extraction Methods with Synthetic Noise Patterns for Image-Based Modelling of Texture-Less Objects. Remote Sensing. 2020; 12(23):3886. https://doi.org/10.3390/rs12233886
Chicago/Turabian StyleHafeez, Jahanzeb, Jaehyun Lee, Soonchul Kwon, Sungjae Ha, Gitaek Hur, and Seunghyun Lee. 2020. "Evaluating Feature Extraction Methods with Synthetic Noise Patterns for Image-Based Modelling of Texture-Less Objects" Remote Sensing 12, no. 23: 3886. https://doi.org/10.3390/rs12233886
APA StyleHafeez, J., Lee, J., Kwon, S., Ha, S., Hur, G., & Lee, S. (2020). Evaluating Feature Extraction Methods with Synthetic Noise Patterns for Image-Based Modelling of Texture-Less Objects. Remote Sensing, 12(23), 3886. https://doi.org/10.3390/rs12233886