Article

Application of High-Resolution Radar Rain Data to the Predictive Analysis of Landslide Susceptibility under Climate Change in the Laonong Watershed, Taiwan

1
Department of Civil Engineering, National Taipei University of Technology, Taipei 10608, Taiwan
2
Division of Watershed Management, Taiwan Forestry Research Institute, Taipei 100051, Taiwan
3
Department of Geography, National Changhua University of Education, Changhua 50074, Taiwan
4
Department of Geography, National Taiwan University, Taipei 10617, Taiwan
5
Department of Soil and Water Conservation, National Pingtung University of Science and Technology, Pingtung 912301, Taiwan
*
Author to whom correspondence should be addressed.
Remote Sens. 2020, 12(23), 3855; https://doi.org/10.3390/rs12233855
Submission received: 22 October 2020 / Revised: 22 November 2020 / Accepted: 23 November 2020 / Published: 25 November 2020
(This article belongs to the Special Issue Open Access Satellite Imagery Processing and Applications)

Abstract

:
Extreme rainfall has caused severe road damage and landslide disasters in mountainous areas. Rainfall forecasting derived from remote sensing data has been widely adopted for disaster prevention and early warning as a trend in recent years. By integrating high-resolution radar rain data, for example, the QPESUMS (quantitative precipitation estimation and segregation using multiple sensors) system provides a great opportunity to establish the extreme climate-based landslide susceptibility model, which would be helpful in the prevention of hillslope disasters under climate change. QPESUMS was adopted to obtain spatio-temporal rainfall patterns, and further, multi-temporal landslide inventories (2003–2018) would integrate with other explanatory factors and therefore, we can establish the logistic regression method for prediction of landslide susceptibility sites in the Laonong River watershed, which was devastated by Typhoon Morakot in 2009. Simulations of landslide susceptibility under the critical rainfall (300, 600, and 900 mm) were designed to verify the model’s sensitivity. Due to the orographic effect, rainfall was concentrated at the low mountainous and middle elevation areas in the southern Laonong River watershed. Landslide change analysis indicates that the landslide ratio increased from 1.5% to 7.0% after Typhoon Morakot in 2009. Subsequently, the landslide ratio fluctuated between 3.5% and 4.5% after 2012, which indicates that the recovery of landslide areas is still in progress. The validation results showed that the calibrated model of 2005 is preferred in the general period, with an accuracy of 78%. For extreme rainfall typhoons, the calibrated model of 2009 would perform better (72%). This study presented that the integration of multi-temporal landslide inventories in a logistic regression model is capable of predicting rainfall-triggered landslide risk under climate change.

Graphical Abstract

1. Introduction

Taiwan is characterized by steep terrain and geological weakness co-evolving with seismic activity, monsoons, and typhoons, resulting in the high vulnerability of Taiwan. For example, the mean annual rainfall is approximately 2510 mm, with 78% of precipitation occurring from May to October [1]. Under the impacts of global climate change, the uneven temporal and spatial distribution of rainfall has intensified the variability of short-duration, high-intensity rainfall events [2,3,4,5]. Meanwhile, the climatic and hydrological cycles in Taiwan tend to be more extreme, leading to frequent floods or droughts [2,6,7,8,9,10,11]. The river and groundwater discharge have also been affected [12]. During Typhoon Morakot in 2009, the accumulated rainfall of Alishan rainfall station in Chiayi county reached 3060 mm within 3 days, exceeding the highest rainfall in Taiwan. Typhoon Morakot also caused 677 deaths, 22 missing, and 4 serious injuries across Taiwan, and caused economic losses of about 3 billion USD in total, accounting for about 0.75% of annual gross domestic product [13].
In terms of methods for landslide susceptibility, different from the given weight of landslide factors by experts, which depend on historical disaster records, in this study, we use a statistical method to calculate the correlation between the landslide catalog and the rainfall factors under climate change [14,15]. Researchers have developed the methods to predict landslide susceptibility, but prediction with high accuracy is still difficult. One of the reasons is that landslide susceptibility is strongly affected by regional characteristics. For example, landslide in Taiwan mainly occurs in concentrated rainfall during summer and autumn. To improve the accuracy of the prediction, reliable official long-term hydrological and morphological datasets are widely collected for the specific watershed and we use the statistical methods to develop landslide susceptibility models suitable for the specific watershed [16]. Rainfall forecasting and landslide susceptibility derived from remote sensing data have been widely adopted for disaster prevention in recent years. Understanding of spatial information and statistical models can be integrated and is helpful for disaster prevention and early warning. For example, Fang et al. used radar rainfall forecast data (quantitative precipitation estimation and segregation using multiple sensors, QPESUMS) to establish a monitoring and early-warning model for landslides along the Suhua Highway [17]. Chen et al. adopted QPESUMS to establish a warning model for predicting zones at risk of rainfall-induced hillslope disasters [18]. Chang et al. integrated QPESUMS and the adaptive network-based fuzzy inference system (ANFIS) for forecasting rainfall patterns, and its results provide productive information on flood warnings [19]. Youssef and Pourghasemi used 7 machine learning algorithms to integrate 12 spatial information factors to draw a landslide susceptibility map for the Abha watershed [20]. Lin et al. used an improved self-organizing linear output map (ISOLO), support vector machine (SVM), and logistic regression, and integrated 12 landslide factors to construct a landslide susceptibility map considering the annual maximum rainfall in 48 h to provide a reference for disaster prevention management in the future [21]. Zhao et al. applied logistic regression and 20 landslide factors to analyze the landslide susceptibility with different grid sizes, and the results showed that the rainfall factor had a high influence in determining the pattern of the landslide susceptibility map [22]. Hemasinghea et al. adopted a logistic regression model and considered the slope, aspect ratio, lithology, land use, distance to the river, and distance to roads to construct a landslide susceptibility map for Badulla District, Sri Lanka, and the results showed that land use was the main cause of the landslides [23]. Logistic regression is widely used to estimate the landslide susceptibility model. Since logistic regression can understand the relationship between factors better than other models (such as SVM), therefore, we use it for the construction of the landslide susceptibility model.
In 2009, Typhoon Morakot devastated southern Taiwan and was the most serious typhoon disaster of the past 10 years in Taiwan. The Laonong River watershed area suffered from a serious landslide disaster [24,25]. Focusing on the investigation and analysis of the heavy rainfall events and landslide disasters in this area between 2003 and 2018, this study aimed to understand the local long-term rainfall trends by analyzing the rainfall characteristics (precipitation, rainfall frequency, and rainfall intensity) and to identify the hot spots of rainfall through spatial analysis. Then, the explanatory factors were integrated into a logistic regression model to establish prediction models for landslides susceptibility induced by heavy rainfall in the Laonong River watershed, which can help in understanding the impacts of different types of rainfall under climate change at the landslide locations. Moreover, insights are provided for the development of follow-up adjustment strategies to improve prevention technologies and early-warning capacities for disasters in mountainous agriculture and forestry belts.

2. Materials and Methods
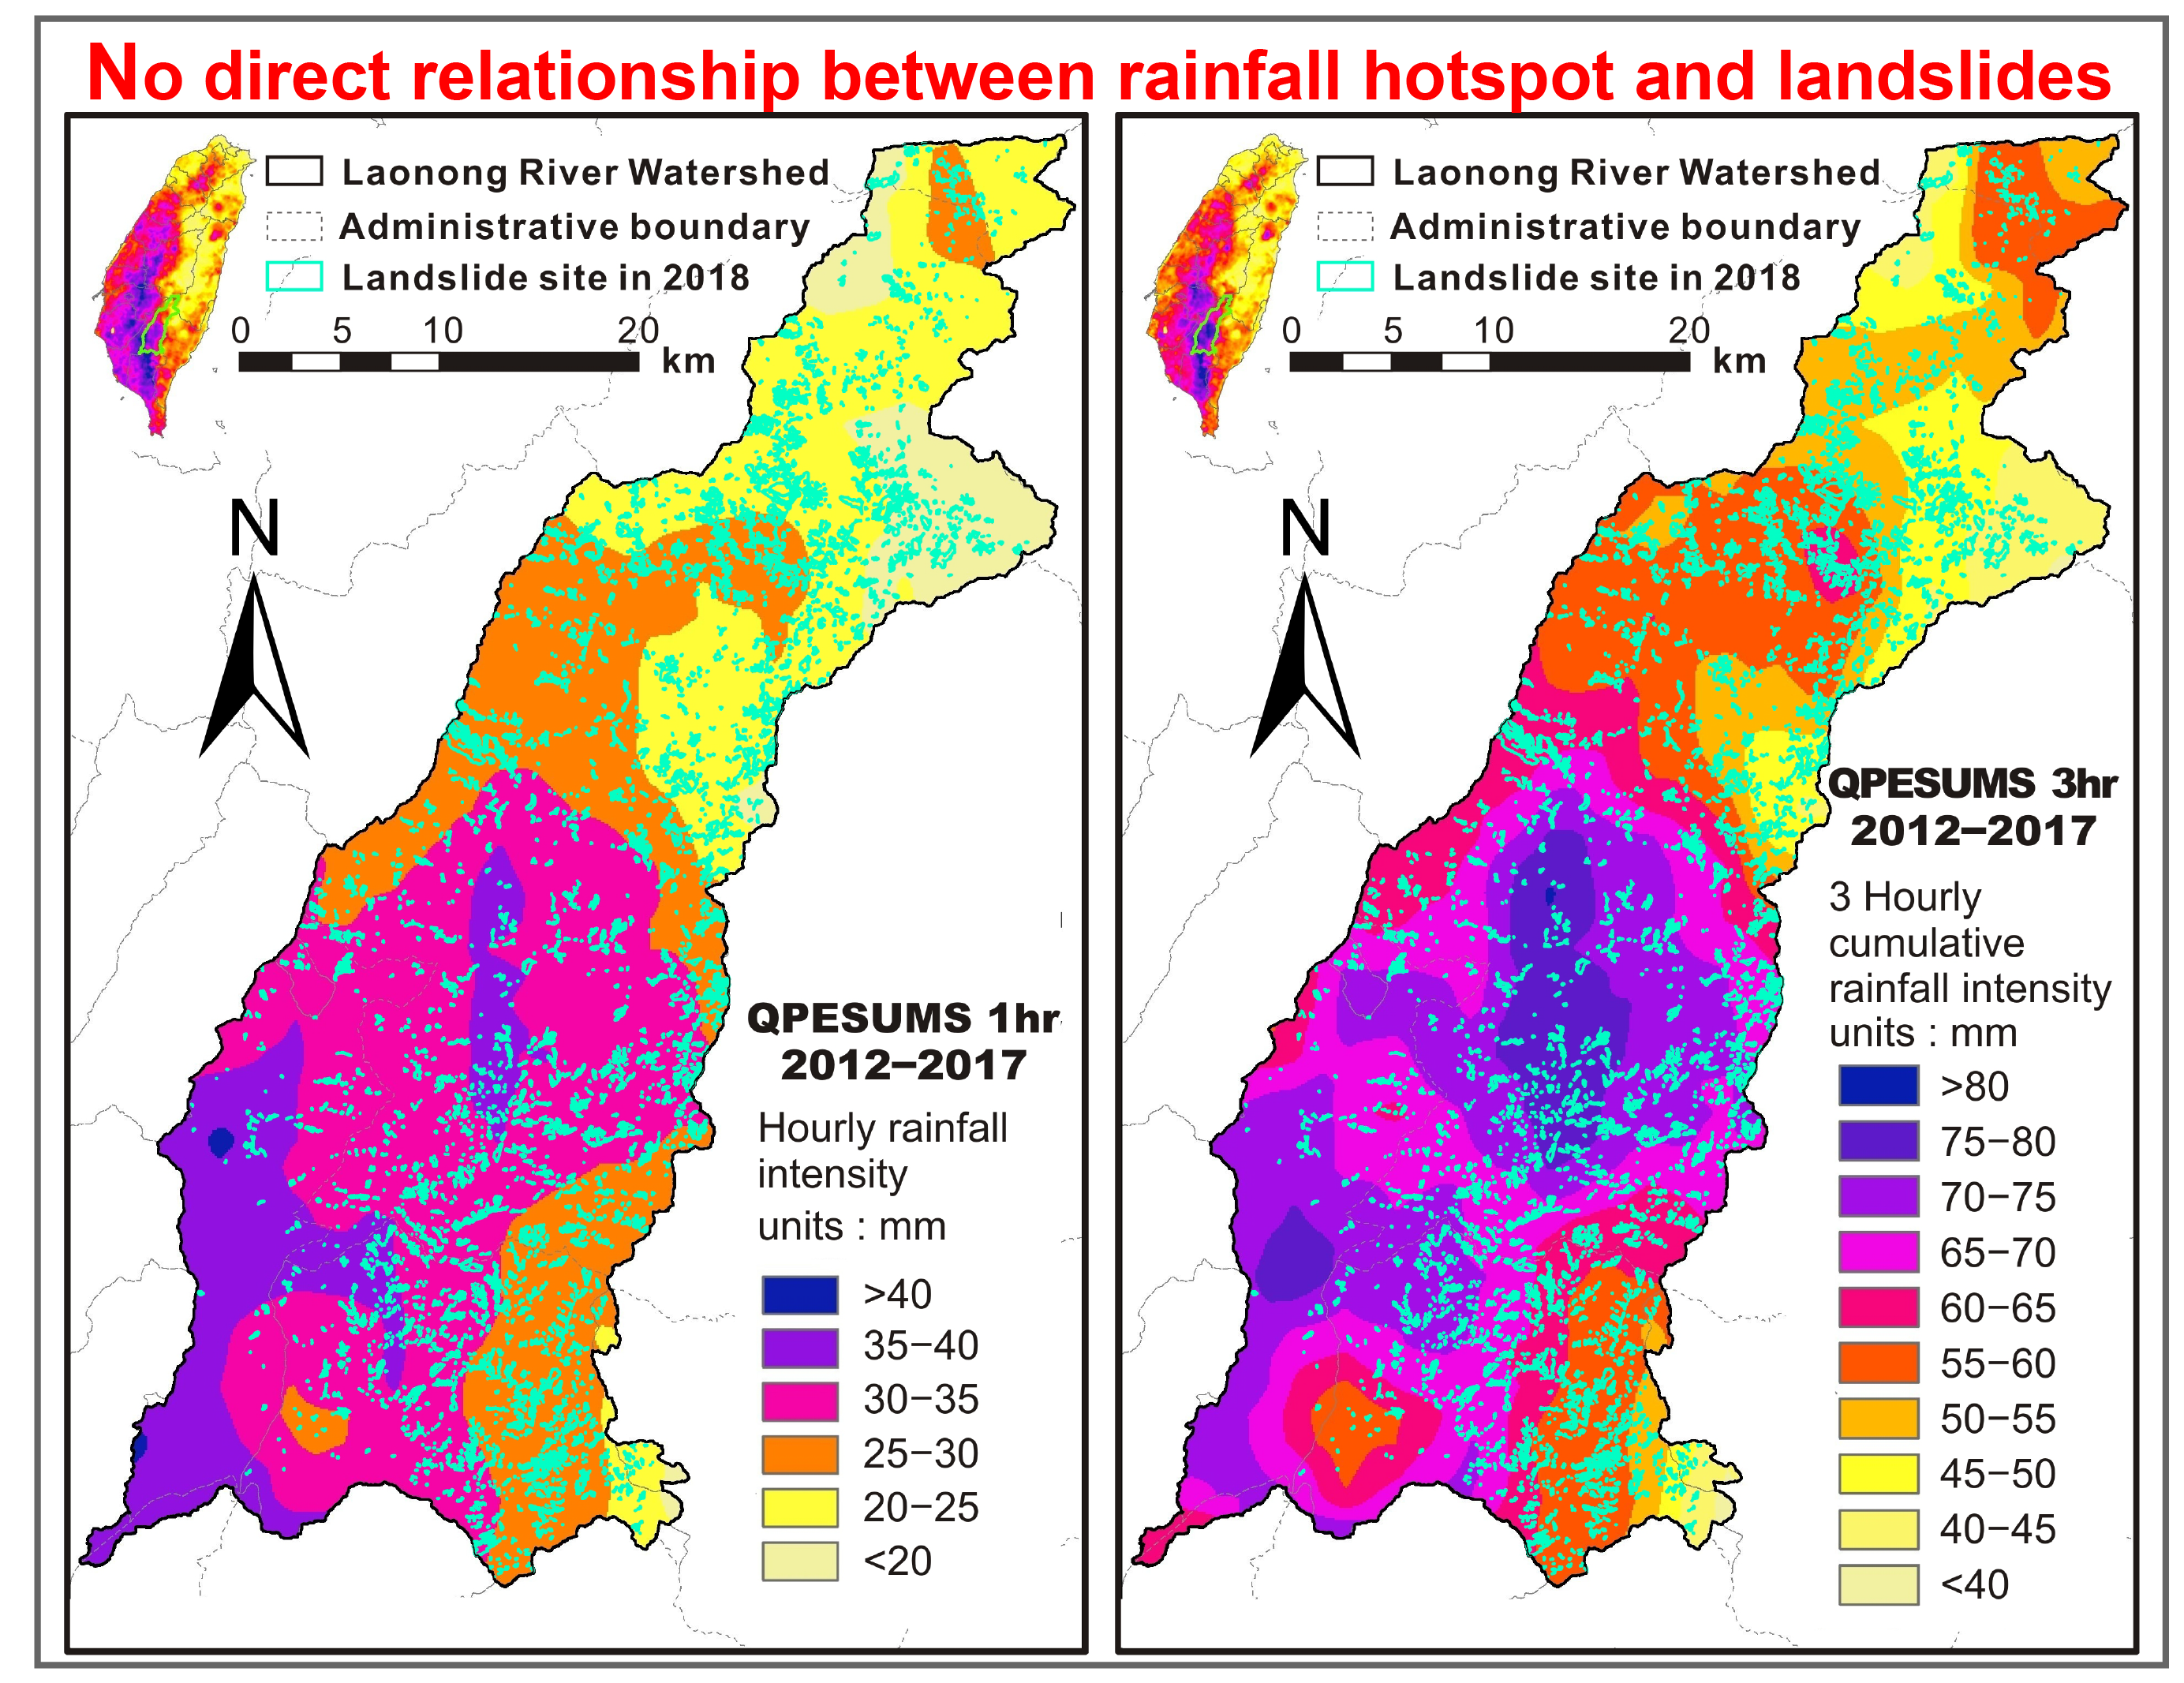
2.1. Research Area

The Laonong River is the largest tributary of the Gaoping River, with a total length of 137 km, and its watershed is the largest in Taiwan, with an area of 1409 km2. Most of the watershed area is within the territory of Kaohsiung City. Laonong river originates from the East peak of Yushan Mountain [26] (Figure 1). The altitude ranges from 35 to 3500 m. Geological formation includes Lushan formation, which accounts for the highest proportion of 38.9%, and the Pilushan formation, accounting for 35.1%. Therefore, shale and slate are the main geological composition. The climate is subtropical monsoon with an average annual temperature of about 24.2 °C. The annual rainfall is about 2477 to 5295 mm and precipitation of 90%, concentrated in the period from May to September [27,28,29,30,31].

2.2. Rainfall Data Sources and Classification

Rainfall data was derived from the Taiwan Climate Change Projection Information and Adaptation Knowledge Platform (TCCIP) and QPESUMS radar rainfall data from the Central Weather Bureau (CWB), Ministry of Transportation and Communications (MOTC). The rainfall data retrieved from TCCIP were the regular grid rainfall data with a spatial resolution of 1 × 1 km and a temporal coverage from 1960 to 2015. Rainfall data of TCCIP is produced by NCDR (National Science and Technology Center for Disaster Reduction), and MOST (Ministry of Science and Technology). NCDR collect the observation data of rainfall stations in Taiwan island scale and gridded into the 1 × 1 km resolution grid data. The weather stations include CWB automatic rainfall stations, the Water Resources Agency (WRA) MOEA (Ministry of economic affairs), and the Soil and Water Conservation Bureau (SWCB), COA (Council of Agriculture), Executive Yuan, Taiwan Power Company, and Taiwan forestry research institute, etc. The QPESUMS system is one of the remote sensing technologies and was jointly developed and built by the CWB, The NOAA (National Oceanic and Atmospheric Administration) National Severe Storms Laboratory of the United States, the Water Resources Agency (WRA) MOEA, and the SWCB, COA. The QPESUMS system integrates multiple observation data (including radar echo, rainfall station, and lightning, etc.), and combines them with a geographic information system (GIS) to enhance the real-time monitoring capability of disastrous weather such as typhoon, plum rain, afternoon convection, etc. The important development of the QPESUMS system is based on radar data. Since Doppler weather radar has the characteristics of all-weather observation and can observe large-scale rainfall and airflow characteristics, it is a very important tool for meteorological observation. We can use dense radar observations to obtain high-resolution three-dimensional (3D) data (1 × 1 km grid data) in time and space to help us understand the changes in weather systems [17]. There are 11 Doppler weather radars in Taiwan, including 4 Doppler weather radars (S-band, 10 cm wavelength, scanning every 10 min, resolution 1 km) in Hualian, Kenting, Qigu, and Zhongzheng International Airport, and 7 dual-polarization Doppler radars (C-band, 5 cm wavelength, scanning every 2 min, resolution 250 m) in Wufenshan, Linyuan, Nantun, Shulin, Qingquangang base of the air force, Magong, and Green Island. For the mountainous terrain of Taiwan, the dense radar observation network helps different radars to make up for the observation blind area caused by terrain obstruction. The related products of QPESUMS include: (1) the echo data synthesized by the radar network in Taiwan, (2) 1 and 24 h cumulative rainfall distribution—analysis of measured rainfall in the past 1 and 24 h at the whole rainfall observation station, (3) real-time monitoring of convective cells—the location of existing convective cells is detected by radar observations, (4) forecast of rain area in the next hour—based on the current rainfall situation estimated by radar data, the rain area forecast obtained by extension method, and (5) rainfall observation—rainfall values measured by rainfall stations in the past 10 min, 1, 3, 6, 12, and 24 h. Compared with the traditional method that can only use the data of ground rainfall stations to estimate the rainfall in other areas without rainfall stations, the advantage of the system is that it can objectively estimate the rainfall in areas without rainfall stations. The QPESUMS system also provides real-time radar data which can be used to accurately estimate rainfall information through comprehensive analysis [32]. The derivative products include gridded quantitative rainfall estimation and quantitative rainfall forecast products. The radar data used by the QPESUMS system in quantitative precipitation estimation is the lowest elevation angle synthesized echo that is close to the ground and is not affected by the landscape. The Z-R relationship [33] is as follows:
Z = 32.5R1.65
where Z is the reflectivity and R is the rainfall rate.
The estimated rainfall is corrected in cooperation with the real-time observation data from ground rain-gauge stations. Not only can the extreme values corresponding to the areas without rain-gauge stations be estimated by the system, but the estimated cumulative rainfall distribution is also more objective than the observations from a single station [34]. The available data interval is limited because of the time of system construction. The data used in this study were from 2012 to 2017. Using the QPESUMS radar rainfall data, it is possible to analyze the differences in the spatial pattern of rainfall events, as well as the rainfall hot spots.
The rainfall classification in this study is based on the criteria of heavy (torrential) rain as per the levels defined by the CWB, MOTC: heavy rain is defined as the accumulated rainfall of more than 80 mm in 24 h or hourly rainfall of more than 40 mm, extremely heavy rain is defined as an event with 24 h accumulated rainfall of more than 200 mm or 3 h accumulated rainfall of more than 100 mm, and torrential rain is defined as an event with 24 h accumulated rainfall of more than 350 mm. According to the different rainfall levels, long-term changes in the frequency of heavy rainfall in the study area were enumerated and the rainfall hot spots were analyzed.

2.3. Interpretation of Landslide Areas and Analysis of Their Changes

2.3.1. Landslide Inventory

Satellite imagery has the advantages of a short data acquisition period, no topographic limitations, and wide image data coverage. It can be used to obtain comprehensive disaster information in real-time and is widely applied in landslide monitoring. To understand multitemporal landslides in the Laonong River watershed, the multi-temporal landslide maps and satellite images of the Laonong River from 2003 to 2015 published by the Forestry Bureau on the Taiwan Geospatial One-Stop Portal (TGOS Portal) were obtained, and we also interpreted the landslide map by using the same interpreted method [35] derived from the 2016 to 2018 SPOT (Satellite for observation of Earth) satellite imagery. Although the landslide inventory was credible and complete, the time interval of image interpretation was on the annual scale, which was too long for this study. Therefore, landslide map data were only used for analyzing the annual changes in the landslide areas, whereas the short-duration information on landslide areas after a single large-scale typhoon event was obtained from the self-interpreted SPOT satellite imagery. The normalized difference vegetation index (NDVI) was calculated by using multi-spectral information and combined with the supervised classification method, and then applied in the satellite image interpretation to explore the relationship between vegetation in landslide areas in the watershed and heavy rainfall.
NDVI has a good response to vegetation on the ground, it produces a value close to 0 in exposed soil and rock areas because they have similar reflectivity values in near-infrared and red-light bands. Because surface waters and snow-covered areas have a higher value in the red-light band than the near-infrared band, they have negative NDVI values [36]. With the above features, an NDVI value of 0.05 was used as a threshold for rapid preliminary identification in this study, with the research area preliminarily divided into vegetation and non-vegetation areas. Then, the landslide areas were extracted through manual interpretation so that the landslide area extraction could be achieved effectively and accurately. The formula for the NDVI is as follows:
N D V I = N I R R E D N I R + R E D
where NIR is the reflectivity of the near-infrared band and RED is the reflectivity of the red-light band.

2.3.2. Multitemporal Changes in Landslide Areas and Extraction of Explanatory Factors

Using the landslide inventory, the area of landslide sites in each year was converted to a landslide ratio, i.e., the ratio of the total area of landslides to the area of the watershed, which served as a parameter for measuring and comparing the scale of landslides in each year. In addition to rainfall, the geological and explanatory factors are also the key driving factors of landslides. The factors often considered in the analysis include elevation, slope, aspect, geology, vegetation, and land cover. With the improvement and development of instruments in recent years, high-precision elevation data can be produced through light detection and ranging (LiDAR) surveying and mapping technology. In contrast to the DEM data, the multi-penetration characteristic of LiDAR allows it to describe elevation changes under forests in mountainous areas, and the DEM data output is accurate and suitable for terrain analysis. In this study, the 20 m DEM produced by the Ministry of the Interior using LiDAR surveying was adopted to generate various factors for developing a landslide susceptibility model.

2.4. Establishment of the Landslide Susceptibility Model

2.4.1. Model and Factor Selection

Multivariate logistic regression is the most commonly used method in the establishment of landslide susceptibility models [21,22,23]. Various factors including rainfall, elevation, slope, aspect, topographic curvature, topographic roughness, geological conditions, and NDVI were used as variables in the statistical regression analysis [37]. Logistic regression is a special form of log-linear model [38], and logistic distribution is a binary variable distribution function. The curve of this function is similar to the cumulative distribution curve of a random variable. When one binary variable in the log-linear model is regarded as the dependent variable and the model is defined as a series of independent variable functions, this log-linear model is a logistic regression model, whose formula is as follows:
ln ( P i 1 P i ) =   α   +   k n β k x k i
where Pi = P (yi = 1|x1i, x2i, …, xni) is the probability of an event at the i-th grid cell when a series of independent variables (x1i, x2i, …, xni) are given, xki is value of the k-th explanatory landslide factor at the i-th grid cell, and α and βk are the regression coefficients of each factor. In this study, the ten explanatory factors were used in the logistic regression. To test coefficients of the explanatory factors and their significance, we run the logistic regression model in the SPSS (Statistical Product and Service Solutions) software. The non-significant variables will be excluded from the model until all variables are significant at the 0.05 level. The calculation procedure of the ten explanatory variables is described as below:
  • Elevation (unit: meters): The altitude above sea level is directly calculated from the DEM for all of Taiwan with a 20 m resolution provided by the Ministry of the Interior.
  • Slope (unit: degrees): Calculated from the DEM data of the Ministry of the Interior with the 20 m resolution by using ArcGIS 10.7 (Spatial Analyst of extension tool).
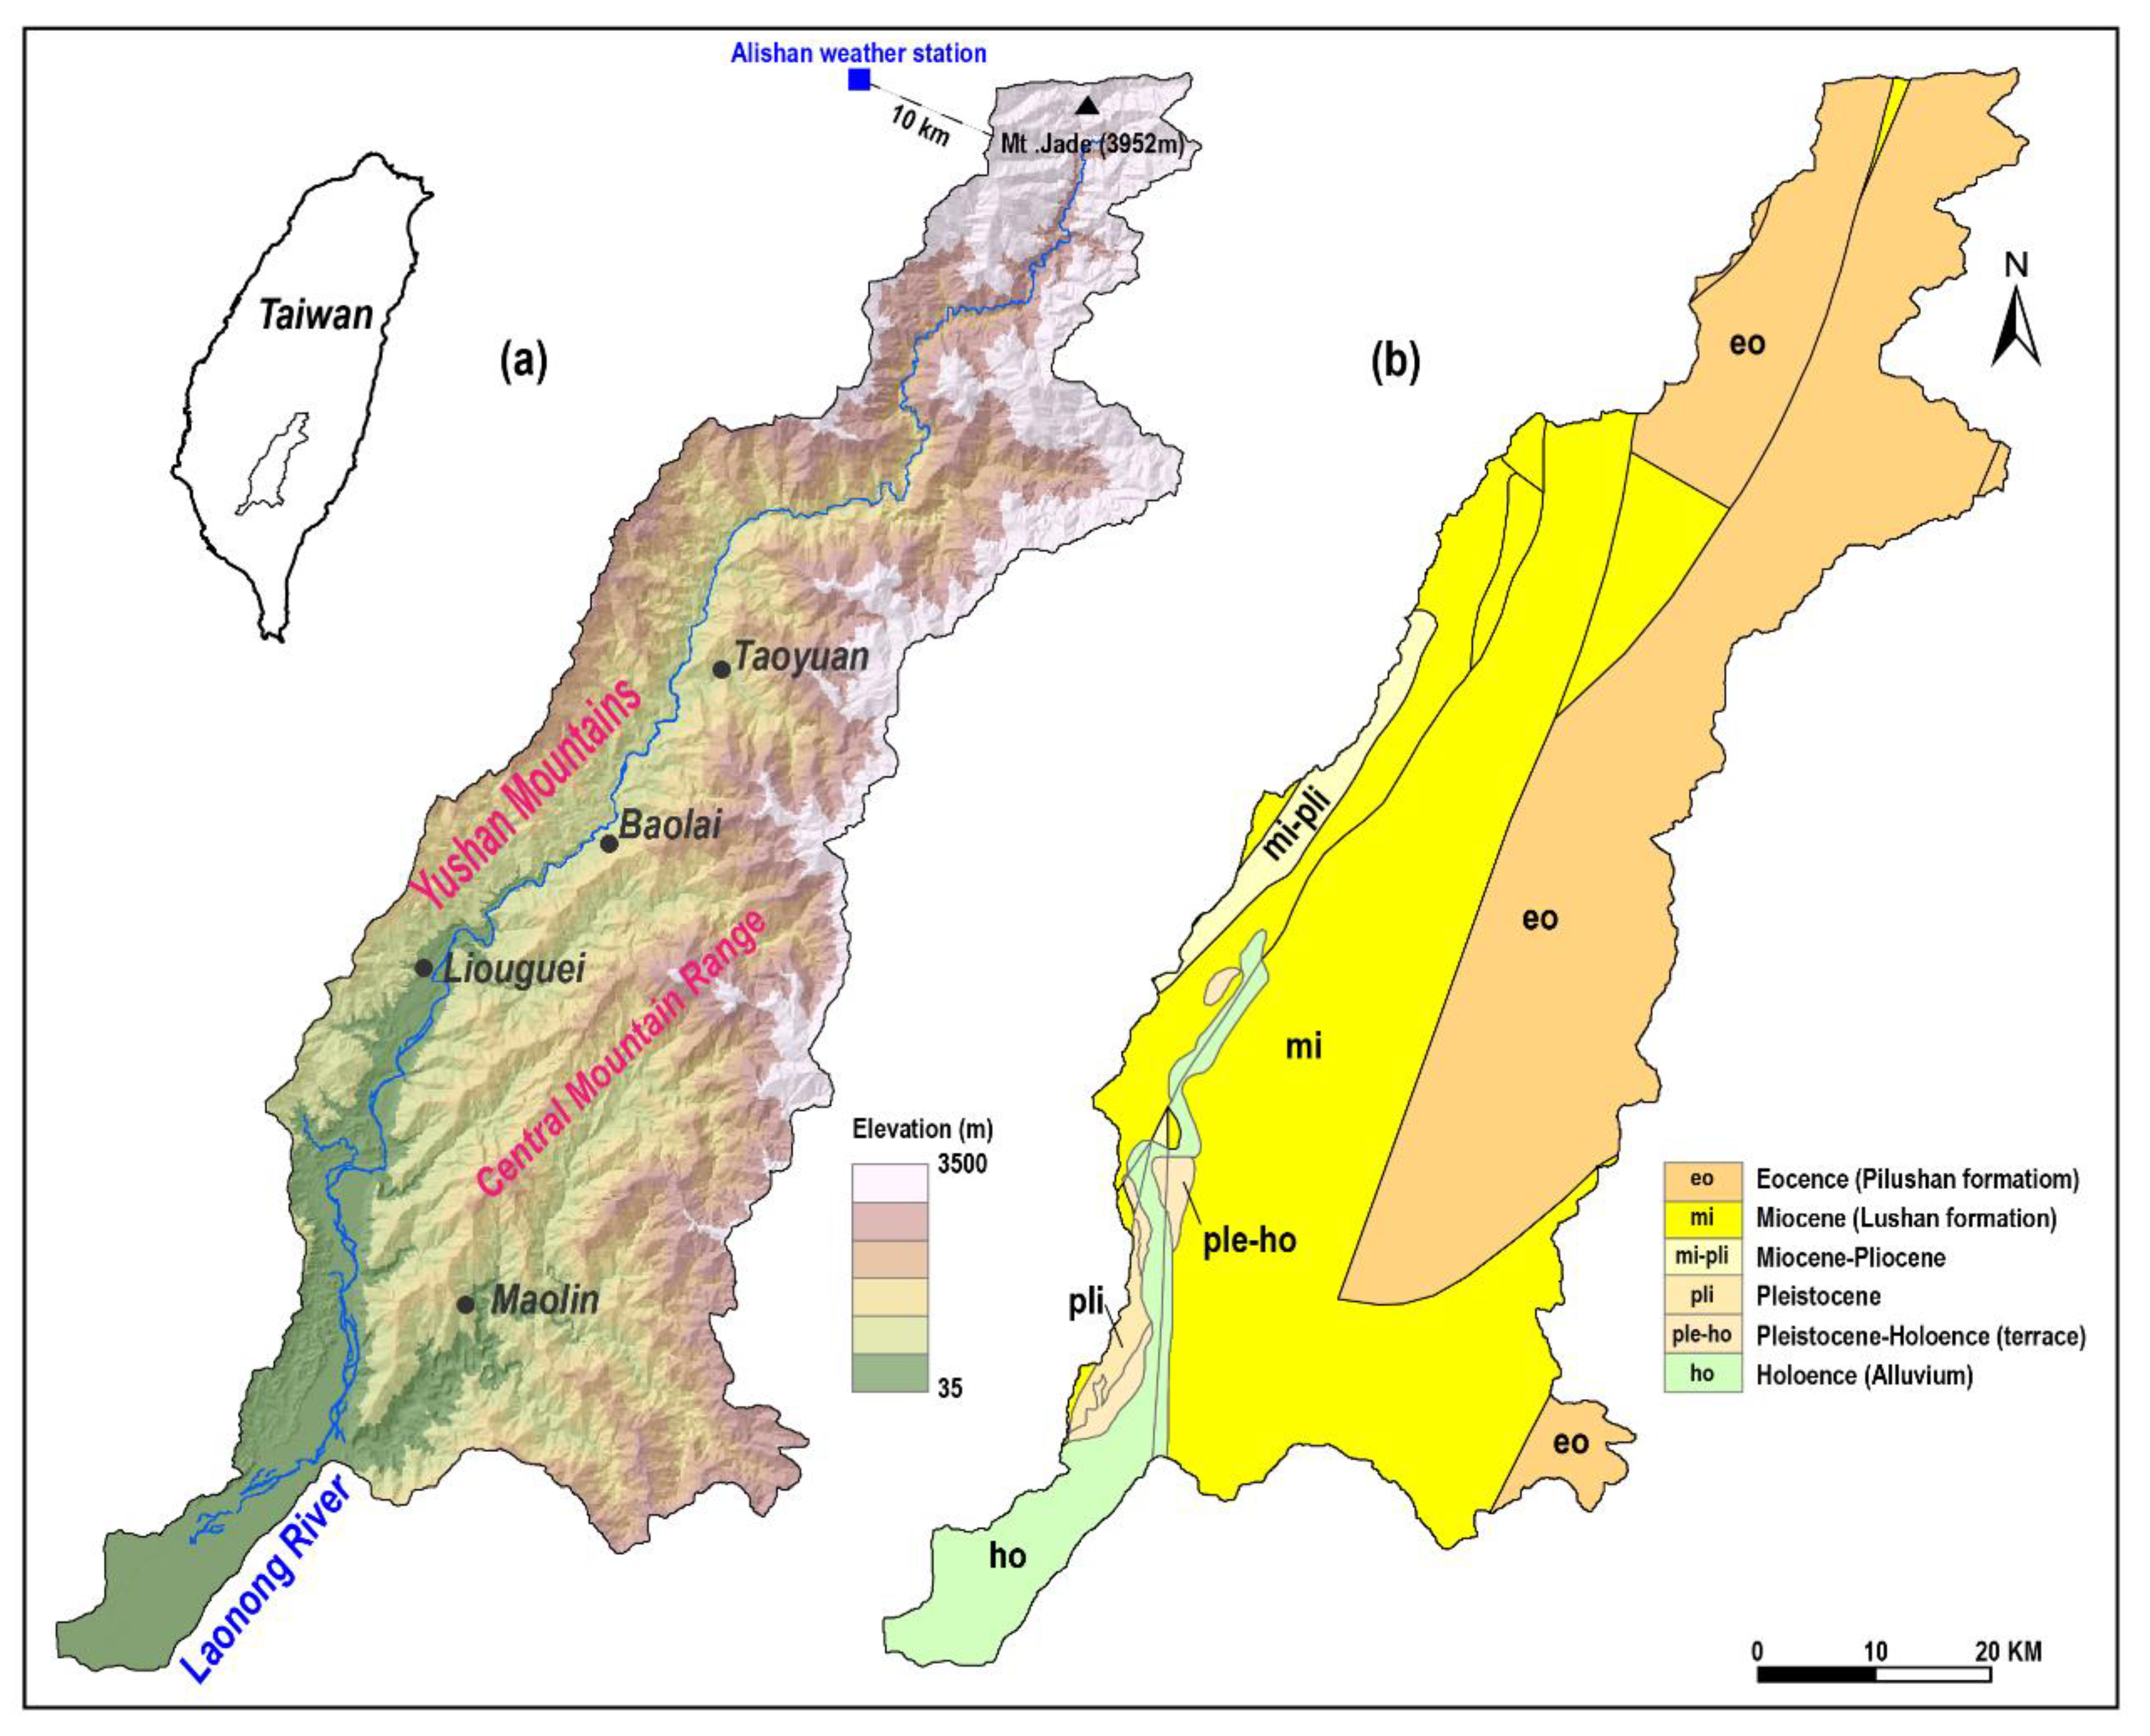
  • Topographic roughness (unit: meters): The degree of topographic change in the area. Topographic roughness is calculated by using ArcGIS 10.7, with the standard deviation of the elevation values in a circular window (3 × 3 pixel, moving window) as a measure of the degree of elevation variation in the area [39]. A schematic diagram of the circular window is shown in Figure 2, and the standard deviation (SD) is calculated as follows:
    S D h = i   (   Z i     Z _   ) 2 n c   1
    where SDh is the topographic roughness, nc is the number of points within the window, Zi is the elevation value of each point, and Z _ is the mean value of the elevation of each point within the window.
  • Slope roughness (unit: degrees): The variations of slope within the area. Using the slope roughness, it is possible to find out whether a landslide would occur in the landscape with drastic slope variations. The calculation method and tool are the same as the topographic roughness, and is calculated as follows:
    S D s = i   (   Z i   Z _   ) 2 n c 1
    where SDs is the slope roughness, nc is the number of points within the window, Zi is the slope value of each point, and Z _ is the mean value of the slope of each point within the window.
  • Aspect sine value and cosine value (unitless): There will be numerical discontinuities if the aspect is expressed as an angle (e.g., 0° = 360°), and thus the aspect can be decomposed into an X vector and a Y vector, i.e., the aspect sine value and aspect cosine value, respectively. A positive sine value indicates the degree to the east, and a negative sine value indicates the degree to the west, a positive cosine value indicates the degree to the north, and a negative cosine value indicates the degree to the south. The value can be calculated from the DEM data by using ArcGIS 10.7 (Spatial Analyst of extension tool).
  • NDVI before landslides (unitless): NDVI is the most common index for evaluating the surface vegetation status in an area [40,41,42,43]. The NDVI value before the flood season can be used as a quantitative value for the vegetation status before landslides. It was calculated from SPOT satellite imagery by Erdas Imagine 4.0.
  • Maximum accumulated rainfall in 24 h (unit: mm): In previous studies, it was often believed that rainfall intensity is related to landslide events [44,45]. However, the choice of rainfall intensity differed based on the different regions or research objectives. In previous studies on rainfall thresholds for landslides in southwestern Taiwan, the accumulated rainfall in 6, 12, 24, 48, and 72 h in autumn during different years was adopted in the variance analysis, and it was found that the 24 h accumulated rainfall had the lowest variation coefficient [46], i.e., the internal changes and differences in data corresponding to the 24 h accumulated rainfall are relatively small. The rainfall value is calculated by the Kriging method.
  • Topographic wetness index (TWI, unit: m2): The ability of the terrain to control soil moisture. The steeper the slope, the faster the runoff speed, the lower the degree of infiltration, and thereby, the lower the soil moisture content [47]. Because the watershed area is relatively large and the slope is mild in low and flat areas, the soil water content is relatively high. If the water content under the slope is large, the pore water pressure of soil increases, and the soil is affected by the lifting force of water. The value can be calculated by using ArcGIS 10.7. As a result, the probability of slope failure and sliding becomes higher, and is expressed as follows:
    ω = ln ( A s tan θ )
    where ω is the TWI, As is the watershed area above a certain point, and θ is the slope.
  • Geology (unitless): Different geological conditions affect the strength of rock mass, joint density, joint structures, etc. We used the local geological formations (Figure 1) as a categorical variable in the model. The data are transferred from vector data to grid data.
  • Distance to the river (unit: meters): The distance from any point to the river. Landslides may occur on both sides of the riverbank. Continuous erosion on the foundation slope makes the area unstable, and a landslide is likely to occur during high-intensity rainfall. The distance from the river channel is obtained by analysis using ArcGIS 10.7 (path distance), which is to calculate the flow path from the river channel to the landslide.

2.4.2. Model Calibration and Validation

Model Calibration

Logistic regression was selected as the statistical method for model construction. The size of samples in logistic regression is equal to random sampling, which is to establish the model by taking the same number of pixel samples from the landslide area and non-landslide area. The landslide map information of each year is provided by the Forestry Bureau, council of agriculture, and interpreted by satellite images. The area of non-landslide distribution in the watershed is the non-landslide area. In 2005, 5000 samples were randomly sampled in the landslide and non-landslide areas, 8000 samples were selected in the 2009 model, and 9000 samples were collected in a mixed model, including 4000 samples in 2005 and 5000 samples in 2009. Since the model is also a pixel scale analysis, sampling is also carried out at the pixel level. The environmental variables are converted into 30 m grid format data. Multiple samples may be taken from a single slope landslide site, while the environmental variables within the same landslide may be different, such as slope, aspect, or vegetative state, which affect whether the location of the pixel has high landslide susceptibility, and the identification accuracy of the calibrated model should reach over 70%.

Model Validation

The Receiver Operating Characteristic (ROC) curve is a graph used to test sensitivity and specificity, with the diagonal serving as a reference line. If the ROC curve lies on the diagonal, the landslide and non-landslide areas are not distinguishable; if the ROC curve bends toward the upper left corner from the diagonal, the test results of landslide and non-landslide areas have high sensitivity and good specificity ability [48].
Generally, in order to judge the quality of the inspection method, in addition to looking at the graph of the ROC curve, AUC (area under the ROC curve) can also be used to judge the distinguishing ability of the ROC curve. The range of the AUC value is from 0 to 1, and the larger the value means the better performance. The greater the AUC value, the higher the proportion of correct interpretation, the lower the rate of misidentification, and the better the prediction accuracy. Meanwhile, the area under the ROC curve in the graph will also be larger. Swets [49] pointed out that an AUC value of fewer than 0.5 means that the model lacks interpretability, an AUC value between 0.5 and 0.7 represents low interpretation accuracy, and a value between 0.7 and 0.9 represents high accuracy.

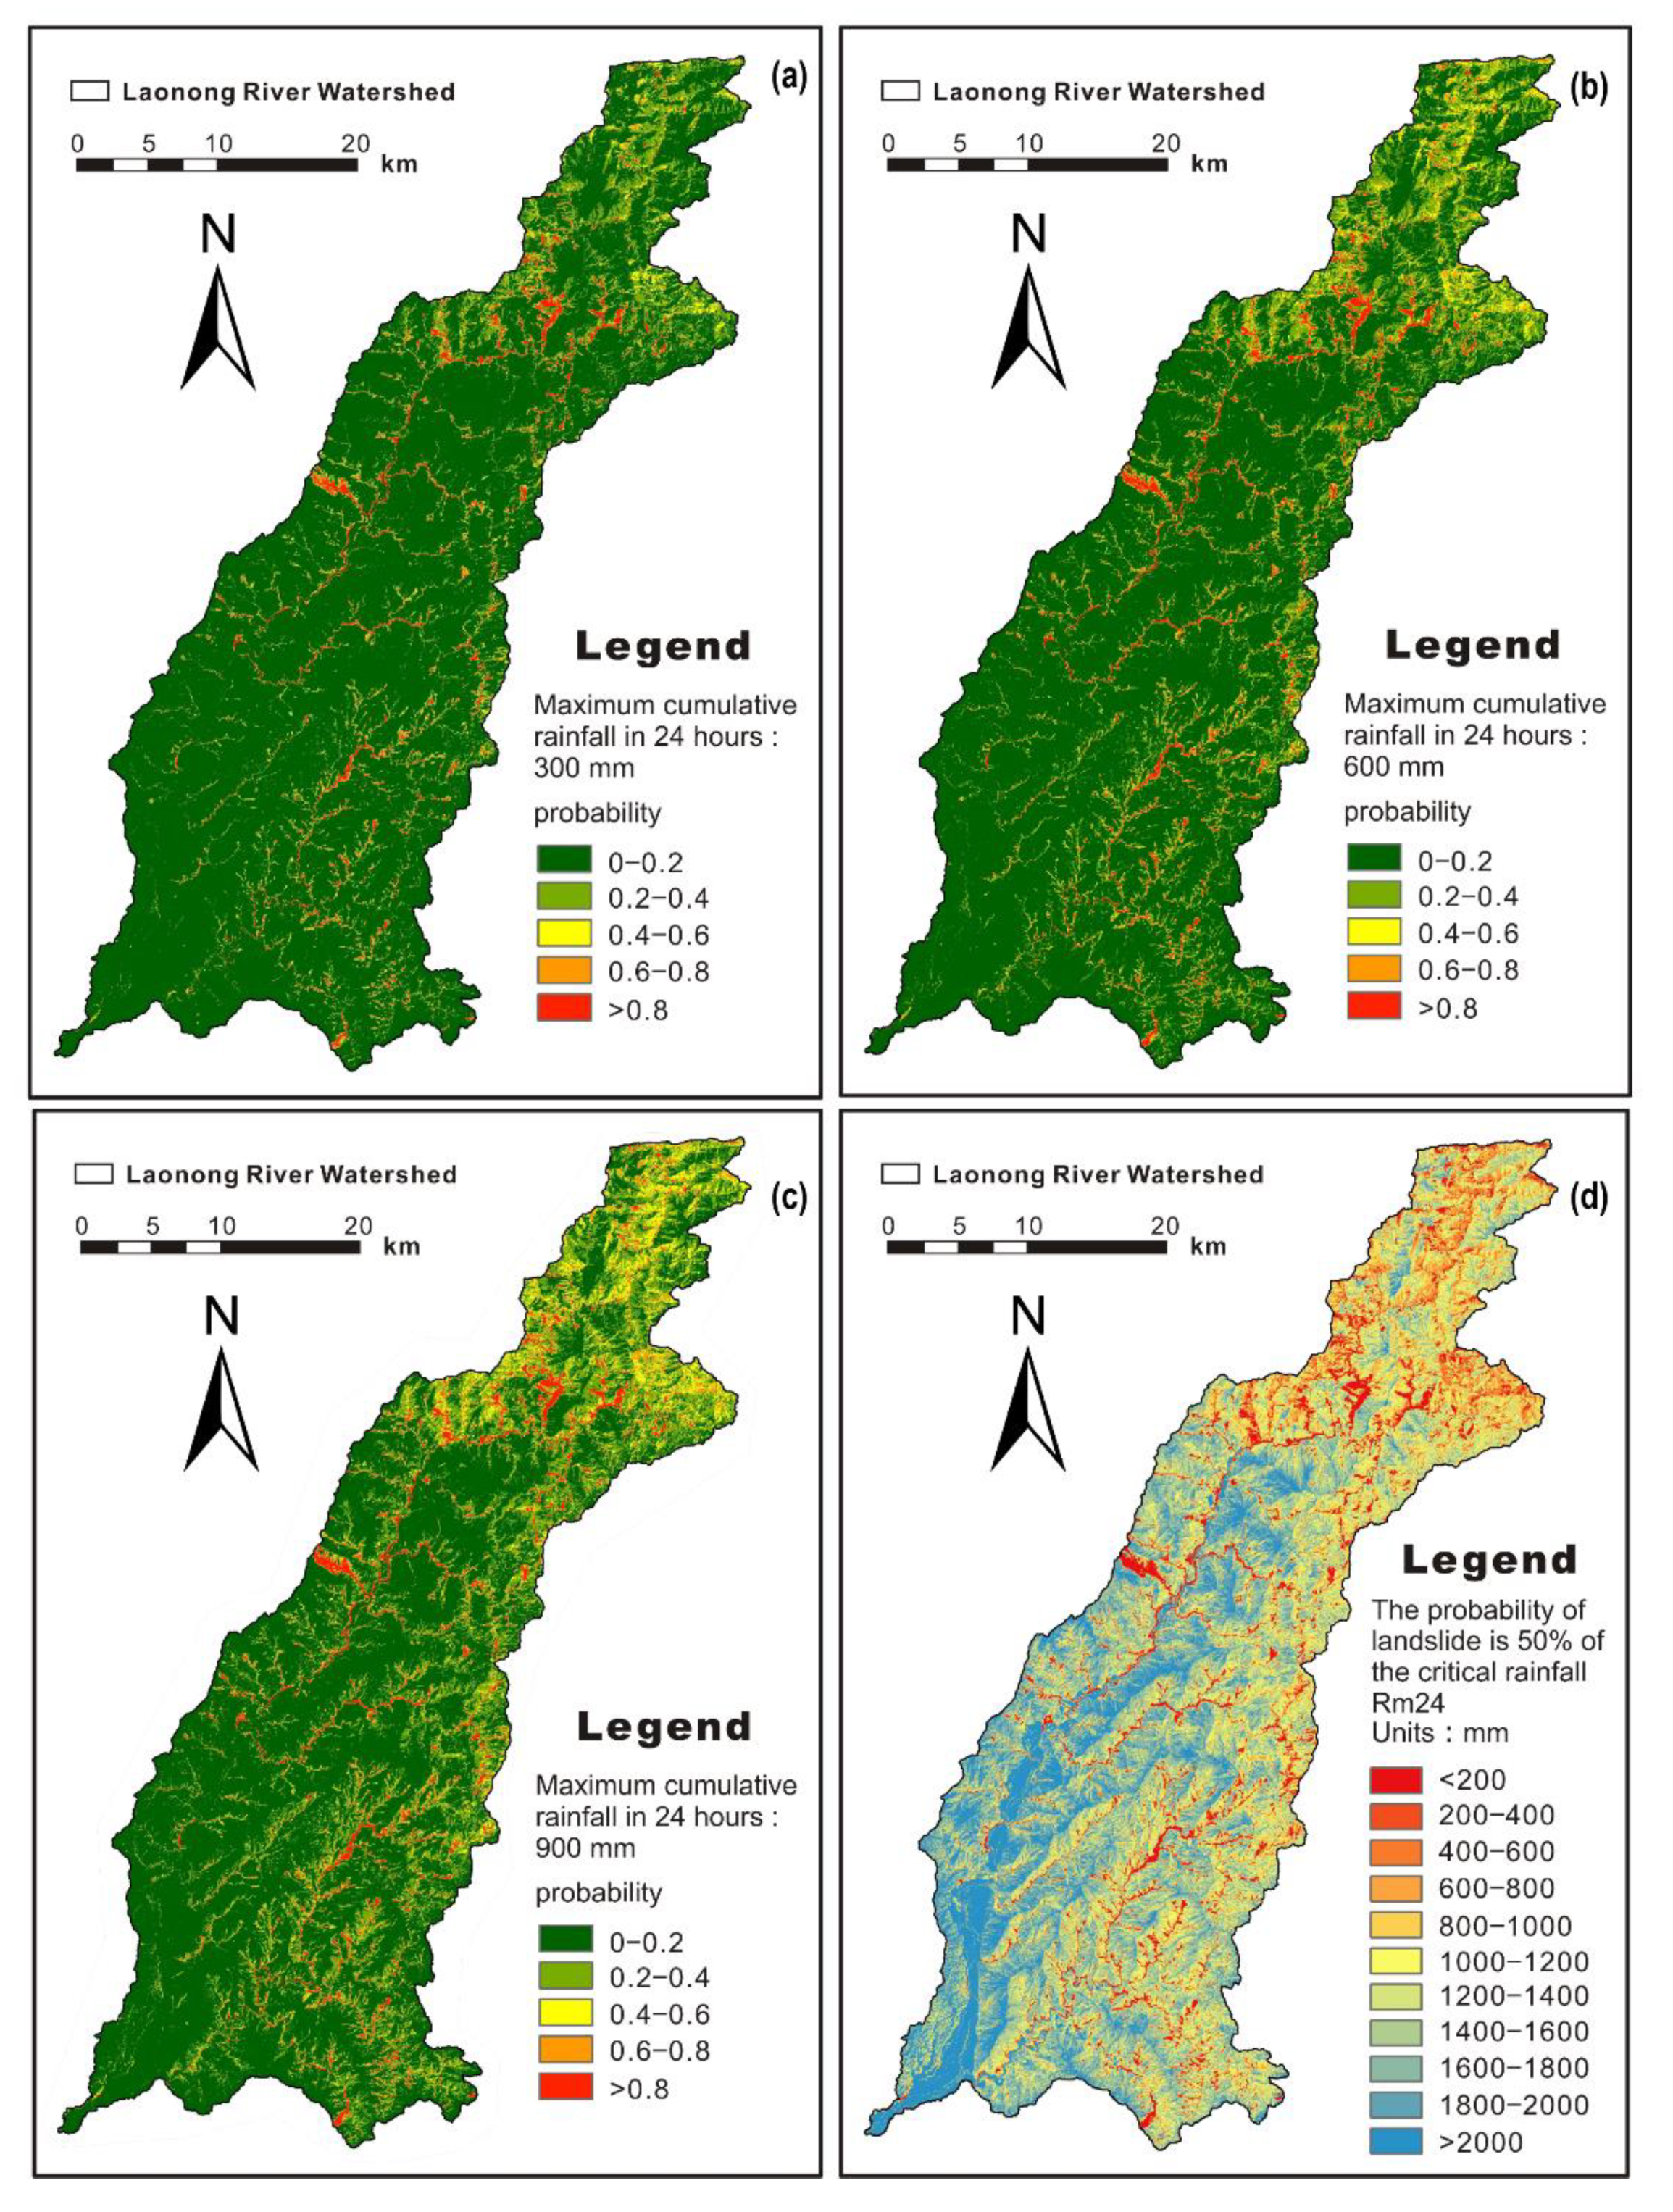
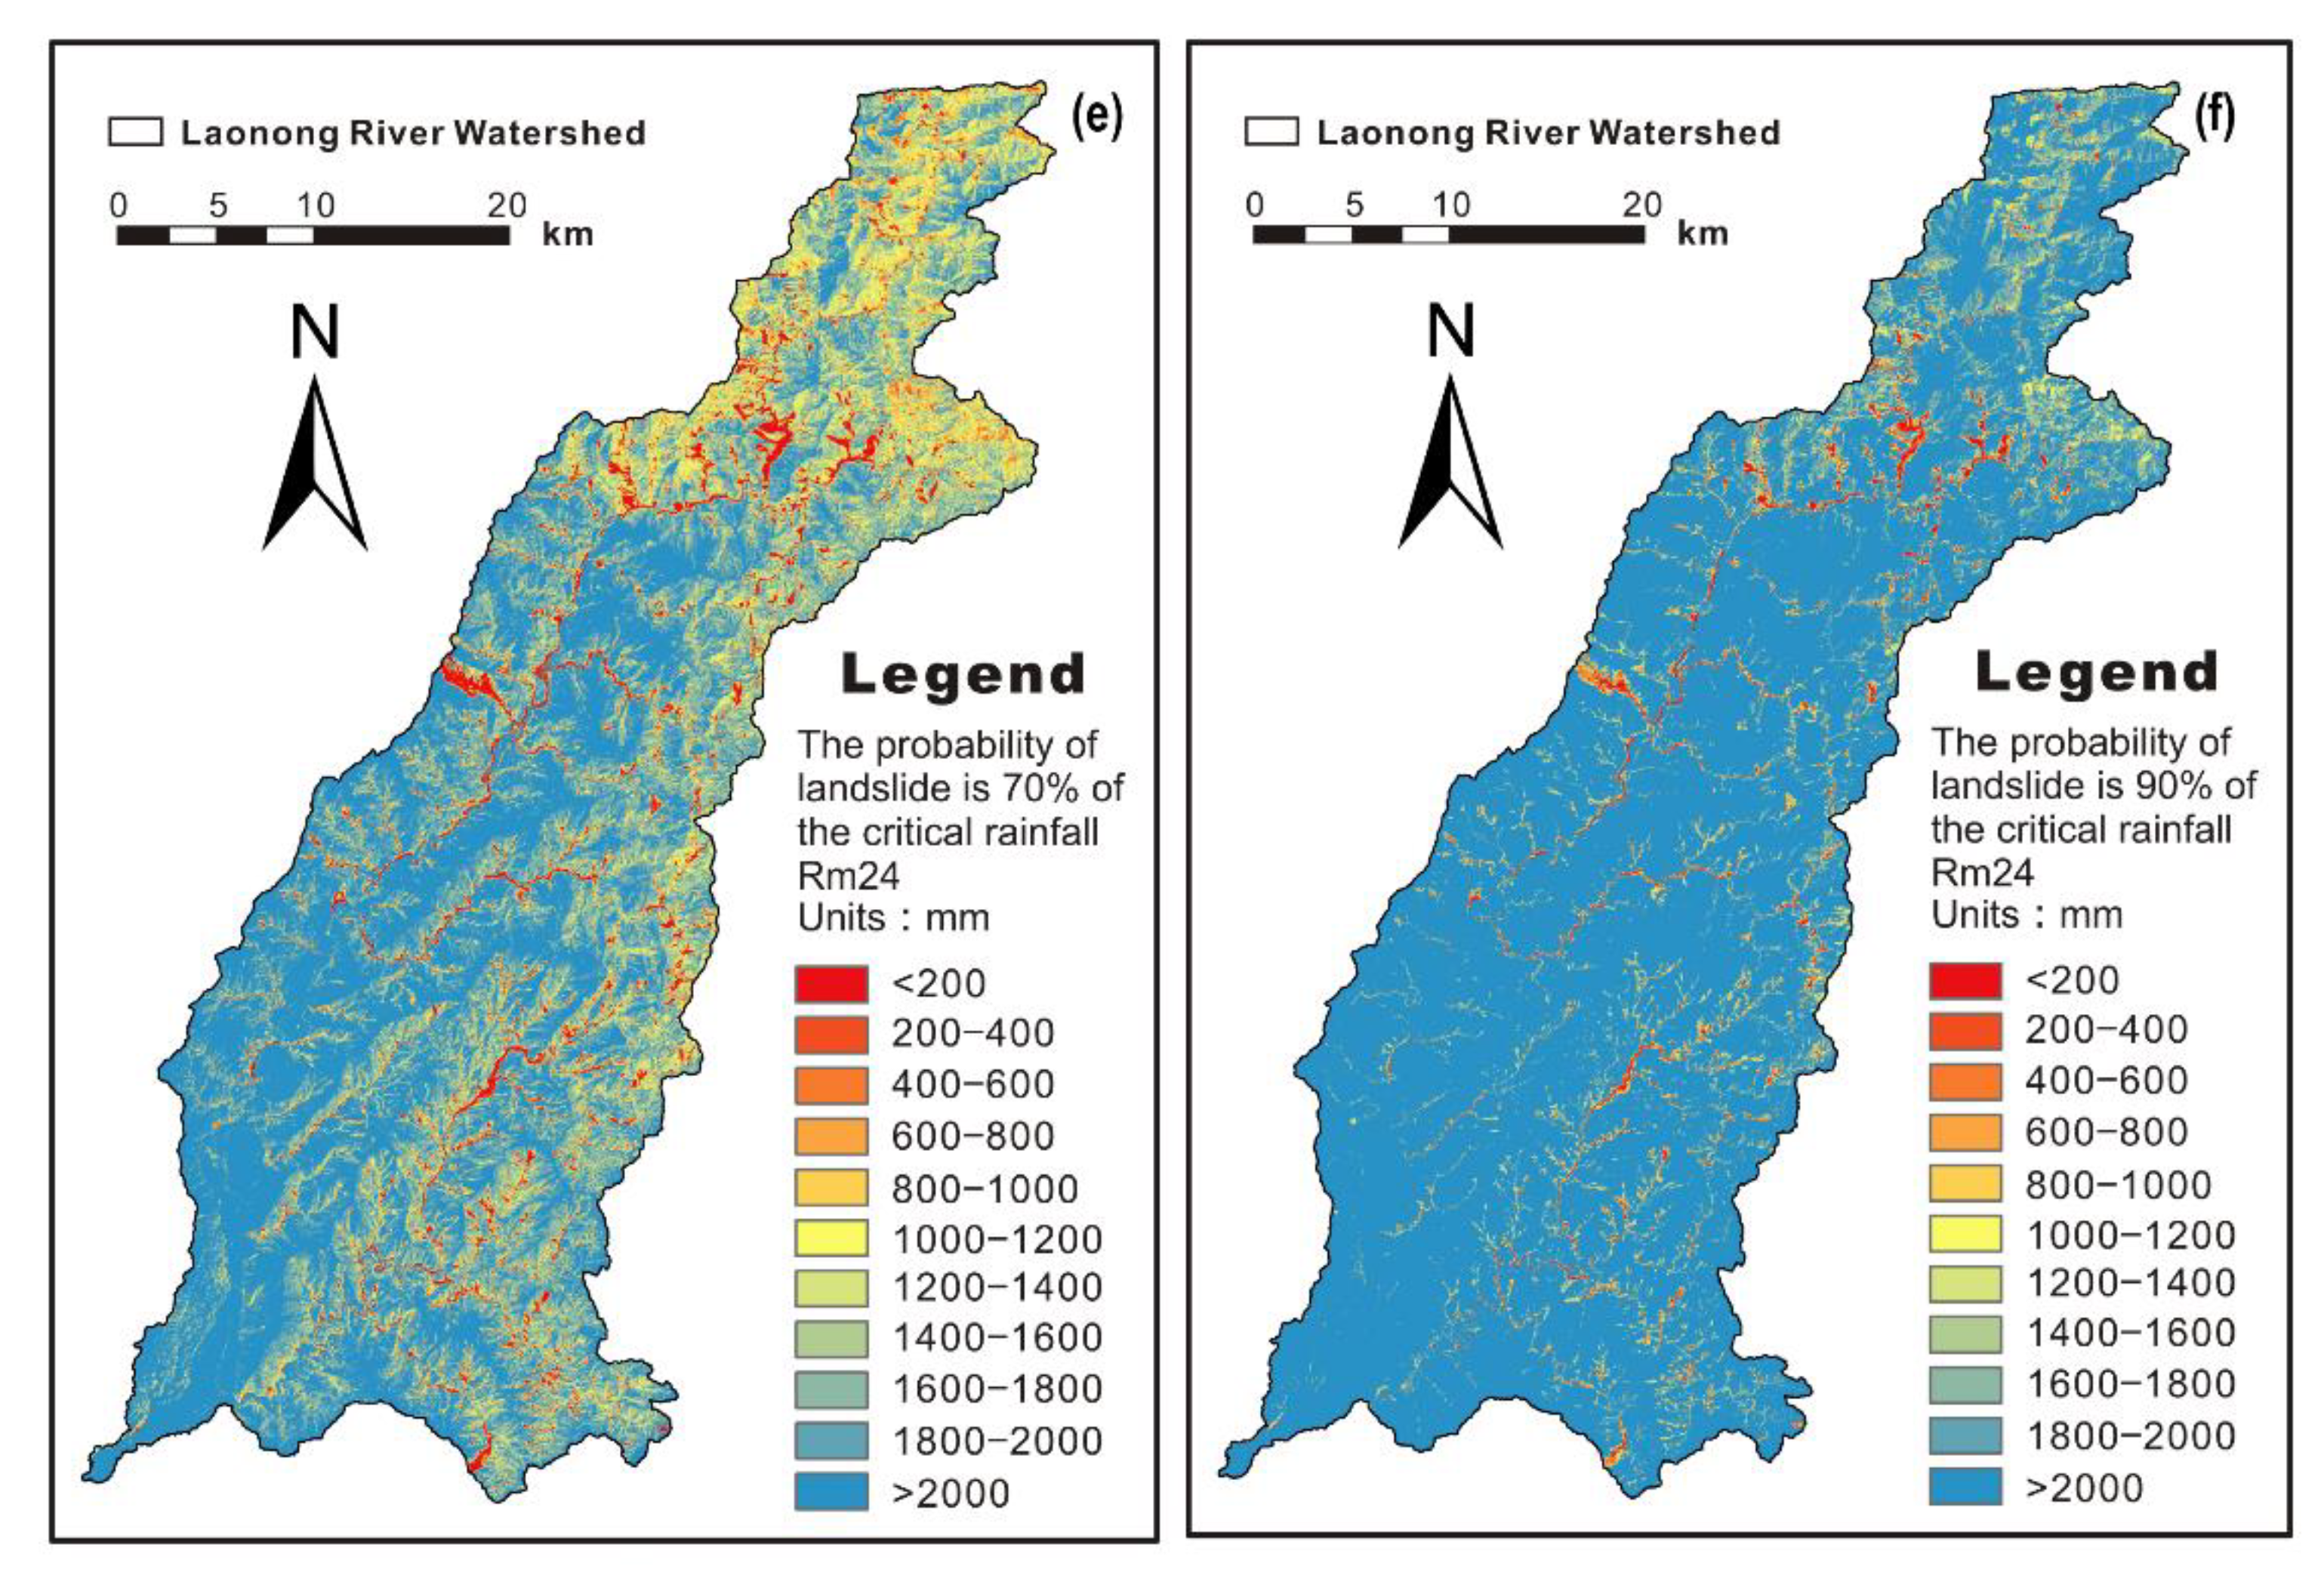
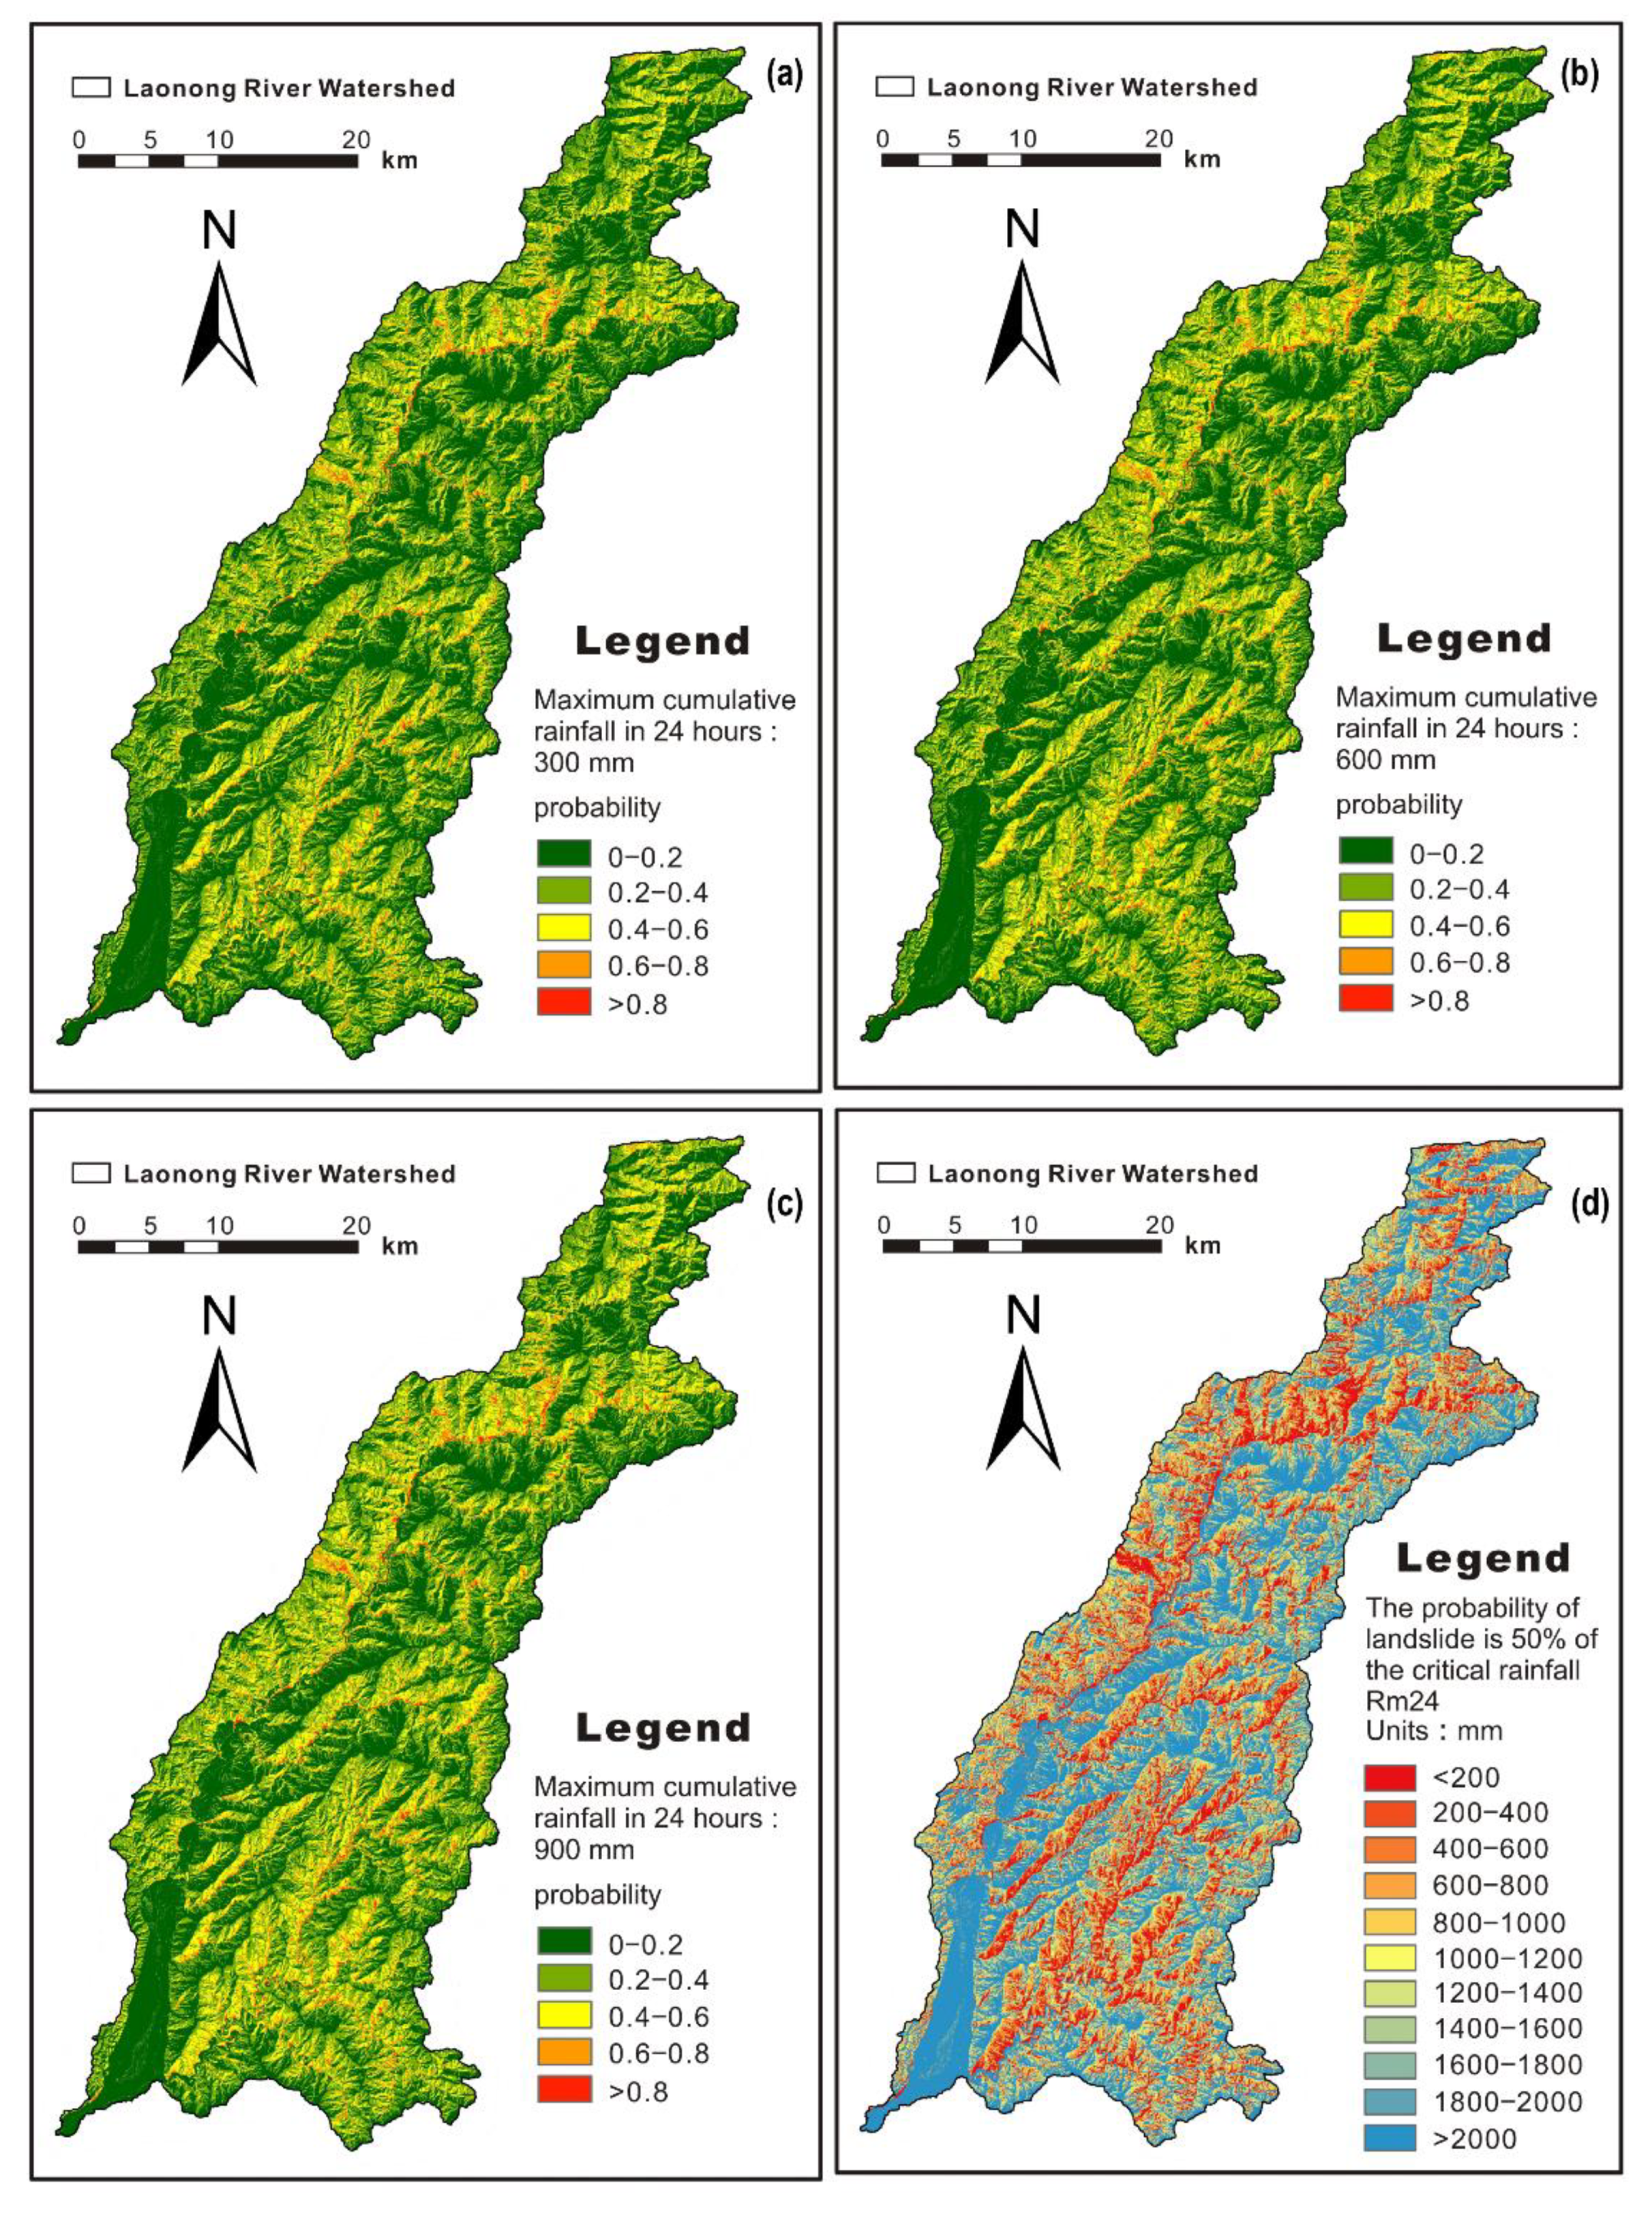
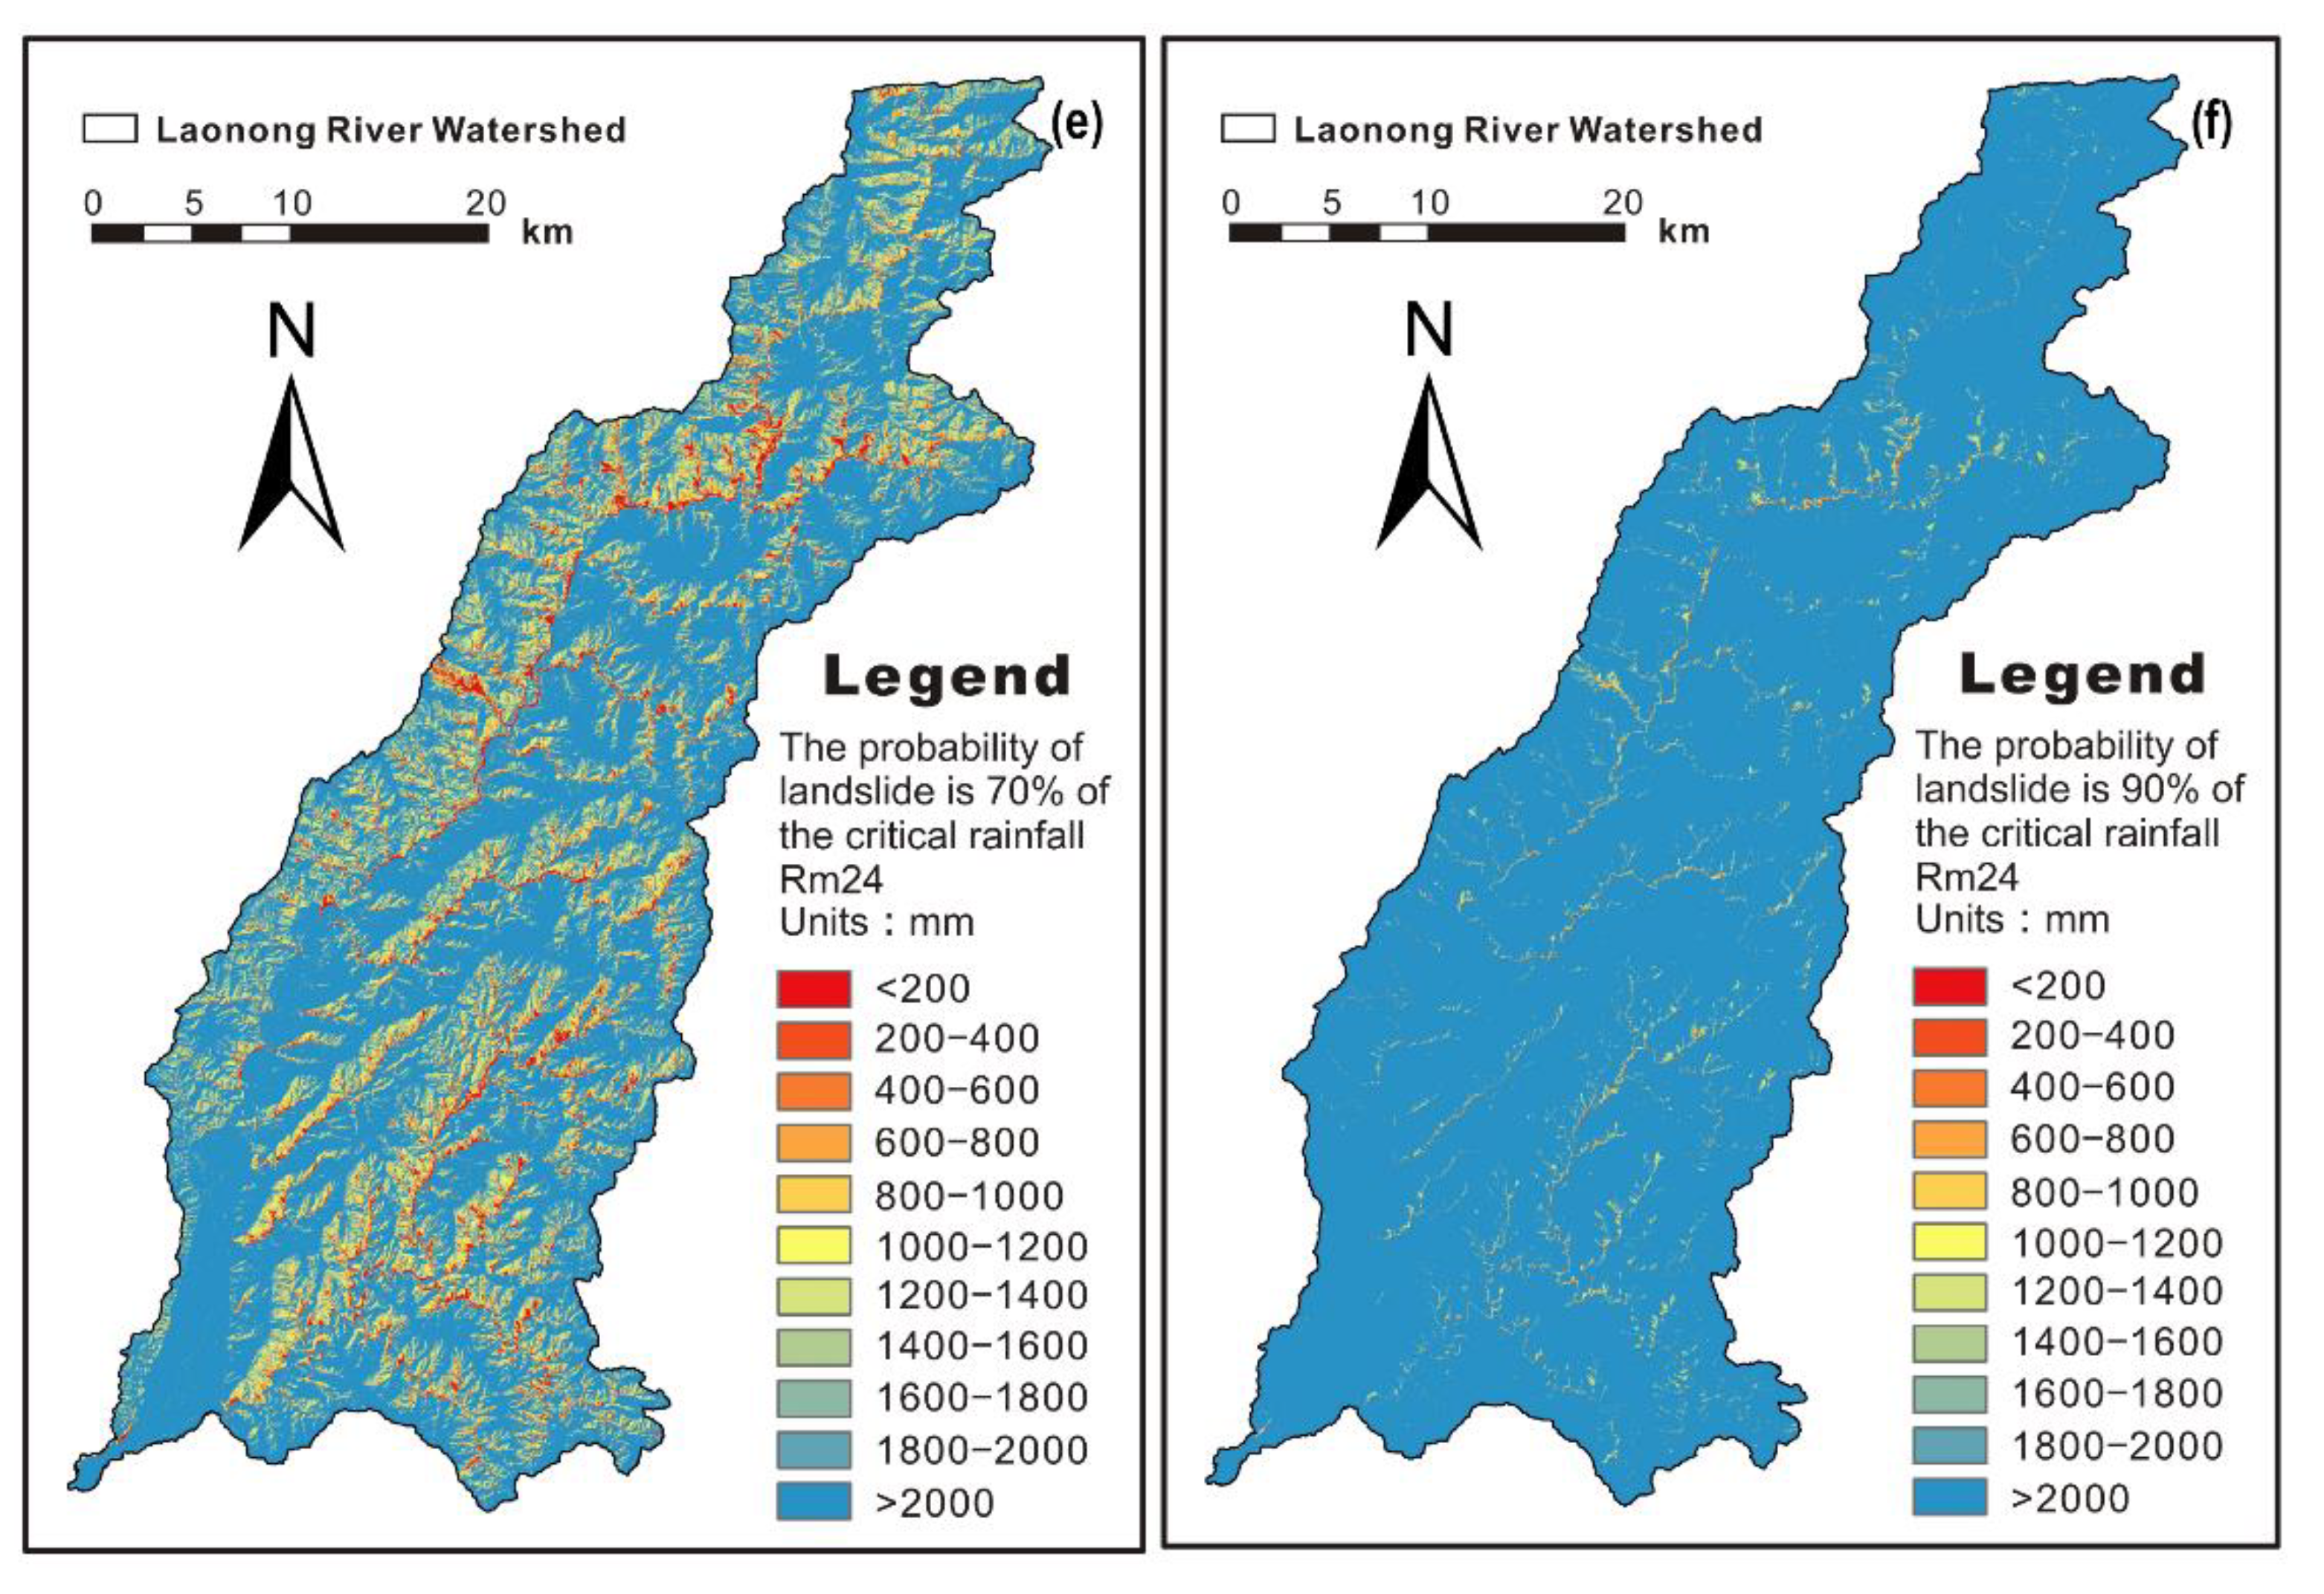
2.4.3. Landslide Risk and Critical Rainfall under Different Rainfall Scenarios

A disaster risk map is usually calculated as the product of hazard, exposure, and vulnerability [50]. In the Laonong watershed, the land-uses are primarily indigenous forests and rarely cultivated fields and building areas. The importance of the forest resource and human-made facilities may be different for different management authorities (e.g., disaster prevention and forest management authorities). Besides, the occurrence of the landslide can destroy all human life and infrastructures, so the vulnerability of the facilities can be ignored. Therefore, the factors of exposure and vulnerability were ignored, and only the factor of the hazard was considered in this risk map. It should be noted that the simplification of the risk factors may underestimate the landslide risk in the building areas for disaster management. For the application of the best model, we assume that the geological and topographical factors are fixed, and the NDVI can only be generated using the latest (2019) image. Therefore, rainfall is used as the designated factor to simulate landslide susceptibility under the different rainfall intensities. The probability of landslide under different rainfall scenarios was estimated based on the explanatory parameters, and the simulated probability values were classified into five categories (Table 1).
In addition, the landslide susceptibility models were used to infer critical rainfall that induces disasters, and the critical rainfall values in the study area under the disaster probabilities of 50%, 70%, and 90% were simulated, which can be used as standards for rainfall warnings in the future to prevent disasters before they happen.

3. Results

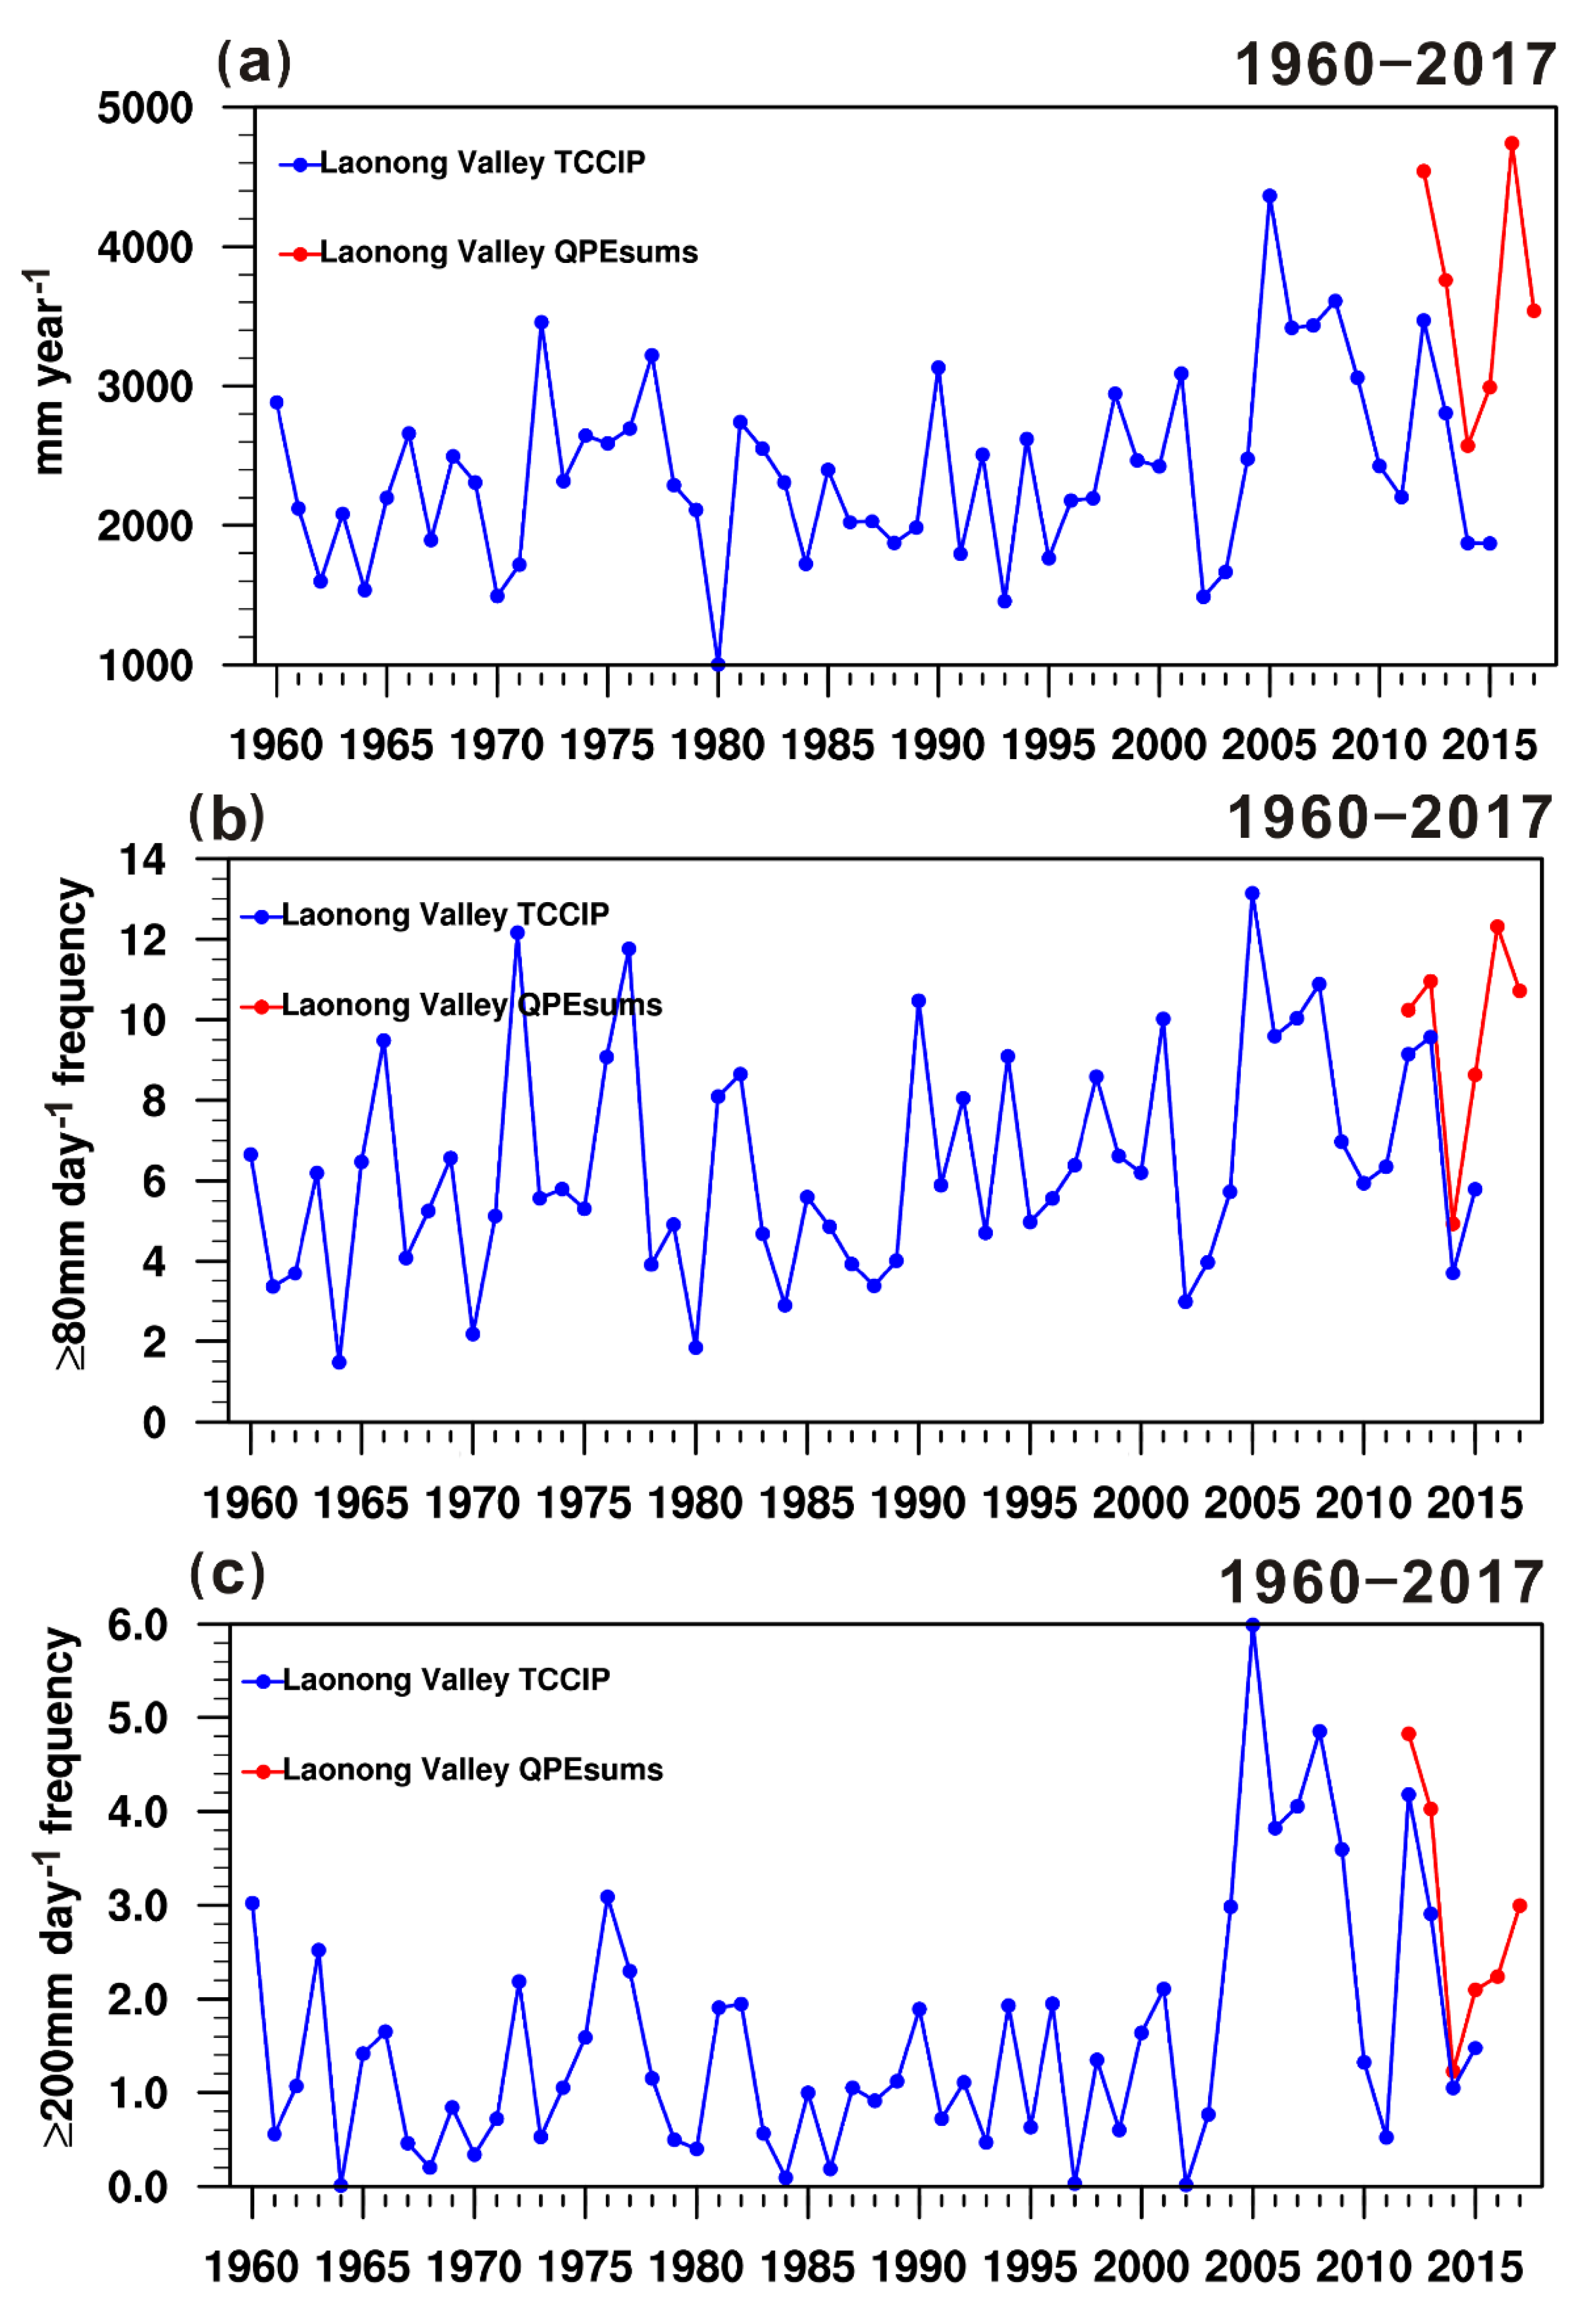
3.1. Long-Term Rainfall Variations

According to the long-term changes in annual rainfall of TCCIP from 1960 to 2017 (Figure 3a), after 2000, annual rainfall exhibited an increasing trend, peaking between 2005 and 2009. The long-term changes in the frequency of heavy rain (Figure 3b) had interannual fluctuations, yet the frequency did not greatly increase or decrease. The frequency was only slightly higher during the periods of 1971–1978 and 2005–2009. For the long-term changes in the frequency of extremely heavy rain (Figure 3c), it can be seen that the frequency after 2004 was significantly higher than that in the previous 40 years, which may be related to the number of typhoons. After 2000, the path tracking of typhoons in the northwest Pacific Ocean generally shifted northward, causing significantly more typhoons to invade Taiwan [51]. Moreover, the probability of extremely heavy rainfall events related to typhoons has also increased greatly [52]. Compared with the increase of annual rainfall after 2004 and the frequency change of heavy rain, it shows that the increase of annual rainfall is closely related to the occurrence frequency of heavy rain, that is, the main contribution of the increased annual rainfall comes from the form of heavy rainfall. Besides, the TCCIP and QPE sums exhibit significant differences in annual rainfall (Figure 3a) but are corresponding in the events of daily rainfall up to 80 and 200 mm (Figure 3b,c). This underestimation of TCCIP in annual rainfall resulted from the relatively few rainfall stations and missed some local precipitation in the mountainous areas.

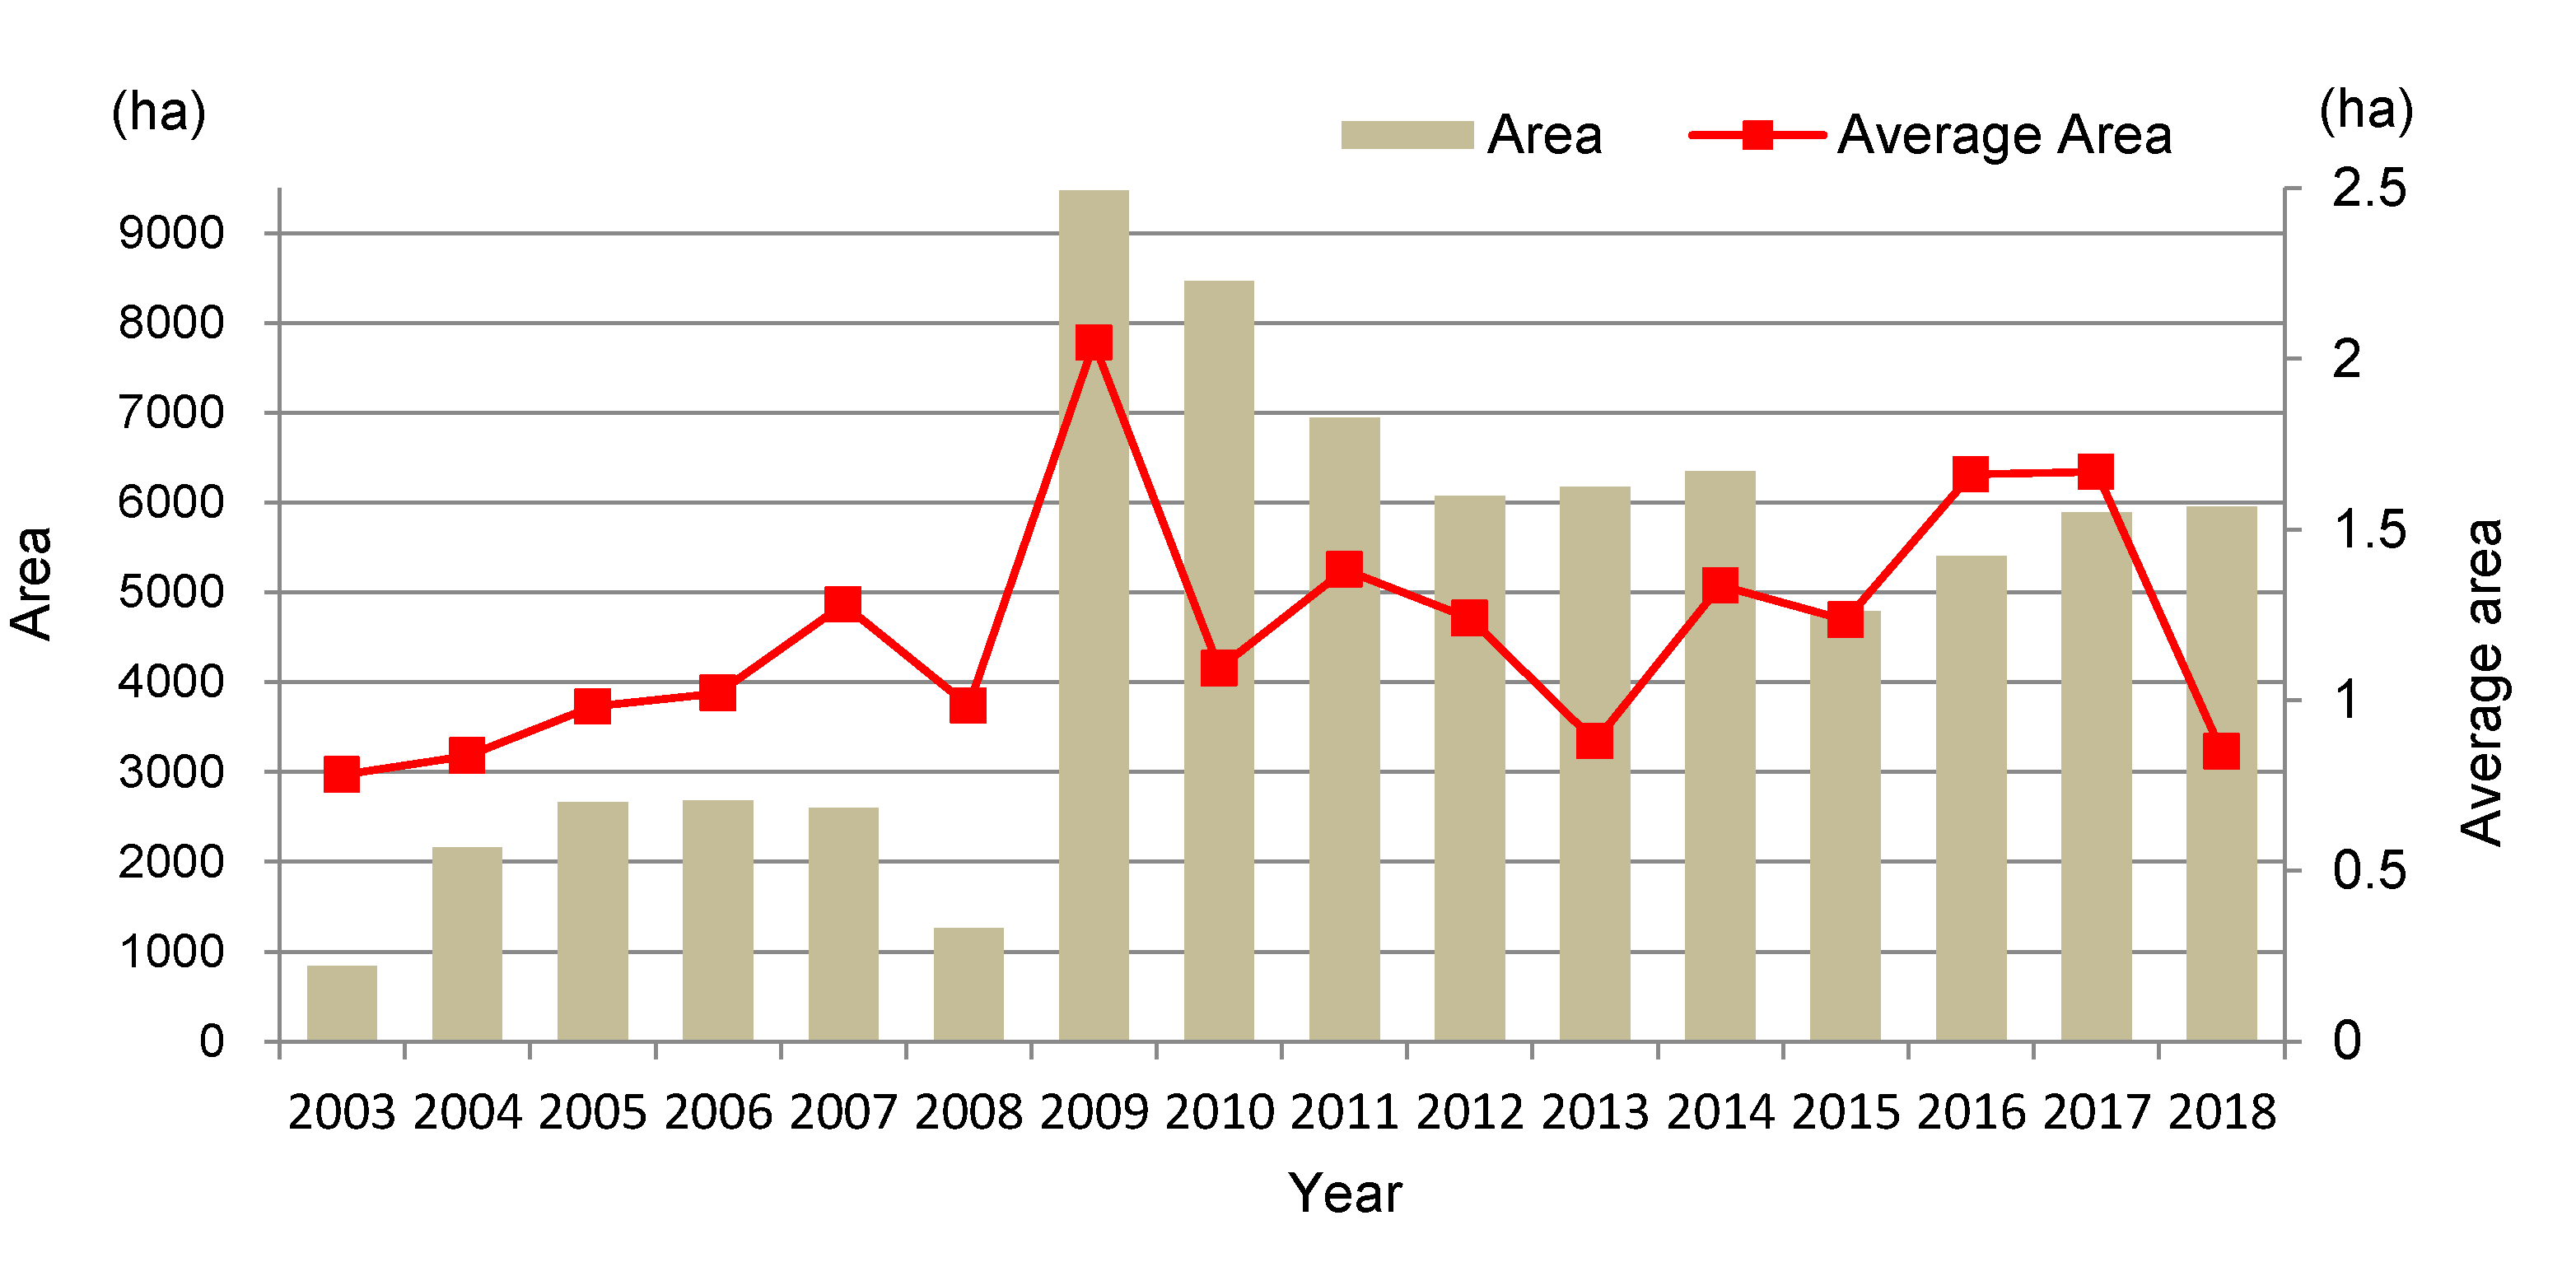
3.2. The Multitemporal Changes in Landslide Areas

The annual changes in the area of landslides in the Laonong River watershed from 2003 to 2018 are shown in Table 2. From 2003 to 2008, the area of landslides was less than 2700 ha, and the landslide ratio of the watershed was about 1.5%. The statistics show that after Typhoon Morakot (2009), the area of landslides increased to 9472.67 ha, and the landslide ratio of the watershed rose to 6.96%. Compared with the average landslide ratio of 1.5% before 2008, approximately 5.46% of land cover was transformed into landslide areas.
After Typhoon Morakot, the area of landslides showed a gradually declining trend (Figure 4). Specifically, the area of landslides reduced sharply from 2009 to 2012, indicating that the landslide areas caused by Typhoon Morakot had recovered, but there was still a long way to go to reach the status characterizing the area before the typhoon disaster. The area of landslides from 2013 to 2018 remained between 4786 and 6352 ha, and the landslide ratio of the watershed fluctuated between 3.5% and 4.5%. The change in the landslide area ratio shows that, after Typhoon Morakot in 2009, vegetation cover was restored in a considerable amount of landslide area within 3 years. However, the recovery from large-scale deep-seated landslides is difficult. During the rainy season, repeated landslides prevented the landslide ratio from reaching the level before Typhoon Morakot in 2009.
Before Typhoon Morakot in 2009, the average landslide area was less than 1.28 ha, which increased to 2.05 ha after the typhoon, showing that many large-scale landslides occurred. From 2009 to 2010, the number of landslide sites increased from 4615 to 7337, and the landslide area decreased by 1005 ha. In 2010, the average landslide area was reduced to 1.09 ha, i.e., the number of landslide sites increased whereas the area of landslides decreased. One possible reason could be that the invasion and growth of herbaceous plants on areas affected by large-scale landslides aided in the recovery of the local vegetation and fragmented the shape of single large landslides. Thus, the site of a previously large landslide can be counted as multiple landslide areas in the interpretation. The average landslide area between 2011 and 2018 remained at 0.85–1.67 ha, except for the slight increase in the landslide scale due to the successive impacts of Typhoon Nibert and Typhoon Megi in 2016. In general, after Typhoon Morakot, the average landslide area in the Laonong River watershed remained higher than that before the typhoon disaster for a long time, which might be related to the fact that land recovery is difficult in large-scale landslide areas.

3.3. Landslide Susceptibility Model and Explanatory Factors

We first used the landslide inventory of 2009 Typhoon Morakot to establish the landslide susceptibility model. The results of logistic regression analysis (Table 3) show that there are nine optimal explanatory factors: the maximum continuous rainfall in 24 h, elevation, slope, aspect sine value, aspect cosine value, TWI, distance to the river, NDVI before landslides, and geology. Moreover, the overall accuracy from the prediction model reached 72.12% (Table 4), and the AUC value of 0.788. Then, the tested model of 2009 is further verified by using the landslide of 2005 Typhoon Haitang. However, the AUC value declined to 0.639 (Table 4). This result indicates that a model calibrated using an intense rainfall event may not be capable of predicting the landslide triggered by moderate rainfall.
Due to the low accuracy in the calibration model in 2009, the study also used the 2005 Typhoon Haitang for developing the model. The optimal factor combination of this model included eight factors: the maximum continuous rainfall in 24 h, slope, aspect sine value, aspect cosine value, TWI, distance to the river, NDVI before landslides, and geological conditions, and the overall accuracy from the prediction model could reach 77.78% and AUC values of 0.895. By using the landslide of 2009 Typhoon Morakot, the AUC value, however, declined to 0.619. The 2005 calibrated model applies not only to rare and extreme events but also to most typhoon-induced landslide events.
This study aimed to establish a general landslide susceptibility model. Therefore, a mixed sampling of the two typhoon-induced landslide events was adopted for model establishment. The overall prediction accuracy of the calibrated model was 69.81% (Table 4), and the optimal factor combination included ten factors: the maximum continuous rainfall in 24 h, elevation, slope, topographic roughness, aspect sine value, aspect cosine value, TWI, distance to the river, NDVI before landslides, and geology. The performance was not as good as that of the 2005 calibrated model. However, its validation performances on both events were acceptable (0.772 for 2005 Typhoon Haitang and 0.811 for 2009 Typhoon Morakot), showing that the mixed calibrated model described in this study can be used as an auxiliary tool for the general model.
By comparing the Wald value performances of the three sets of calibrated models, the controlling factors in each model could be determined. In the 2005 calibrated model, the NDVI before landslides and geology are the main controlling factors. The NDVI before landslides plays a critical role, and its odds ratio (Exp β) is 0.001, indicating that vegetation coverage helps to reduce the probability of landslides under the background of perennial typhoon-induced landslide events. In the 2009 calibrated model, the main controlling factors are the aspect of cosine value, aspect sine value, geology, and TWI. Among these, the aspect factors are the key parameters. Although the NDVI before landslides reached a significant level, its Wald value was the lowest among the group of parameters, implying that under large-scale extreme rainfall events, the impact of vegetation coverage on slope stability is significantly reduced and that the topographic conditions become dominant. The important parameters in the mixed calibrated model are the aspect cosine value, NDVI before landslides, aspect sine value, geology, and TWI, including key parameter adjustments of vegetation and topographic conditions. As a result, the model validation performance during extreme events and perennial typhoon events is not as good as those of the other single-event calibrated models.

4. Discussion

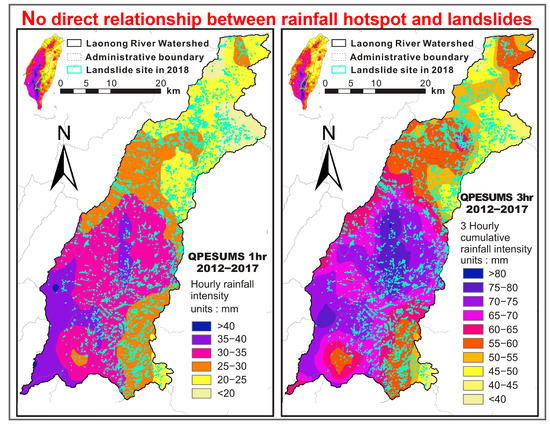
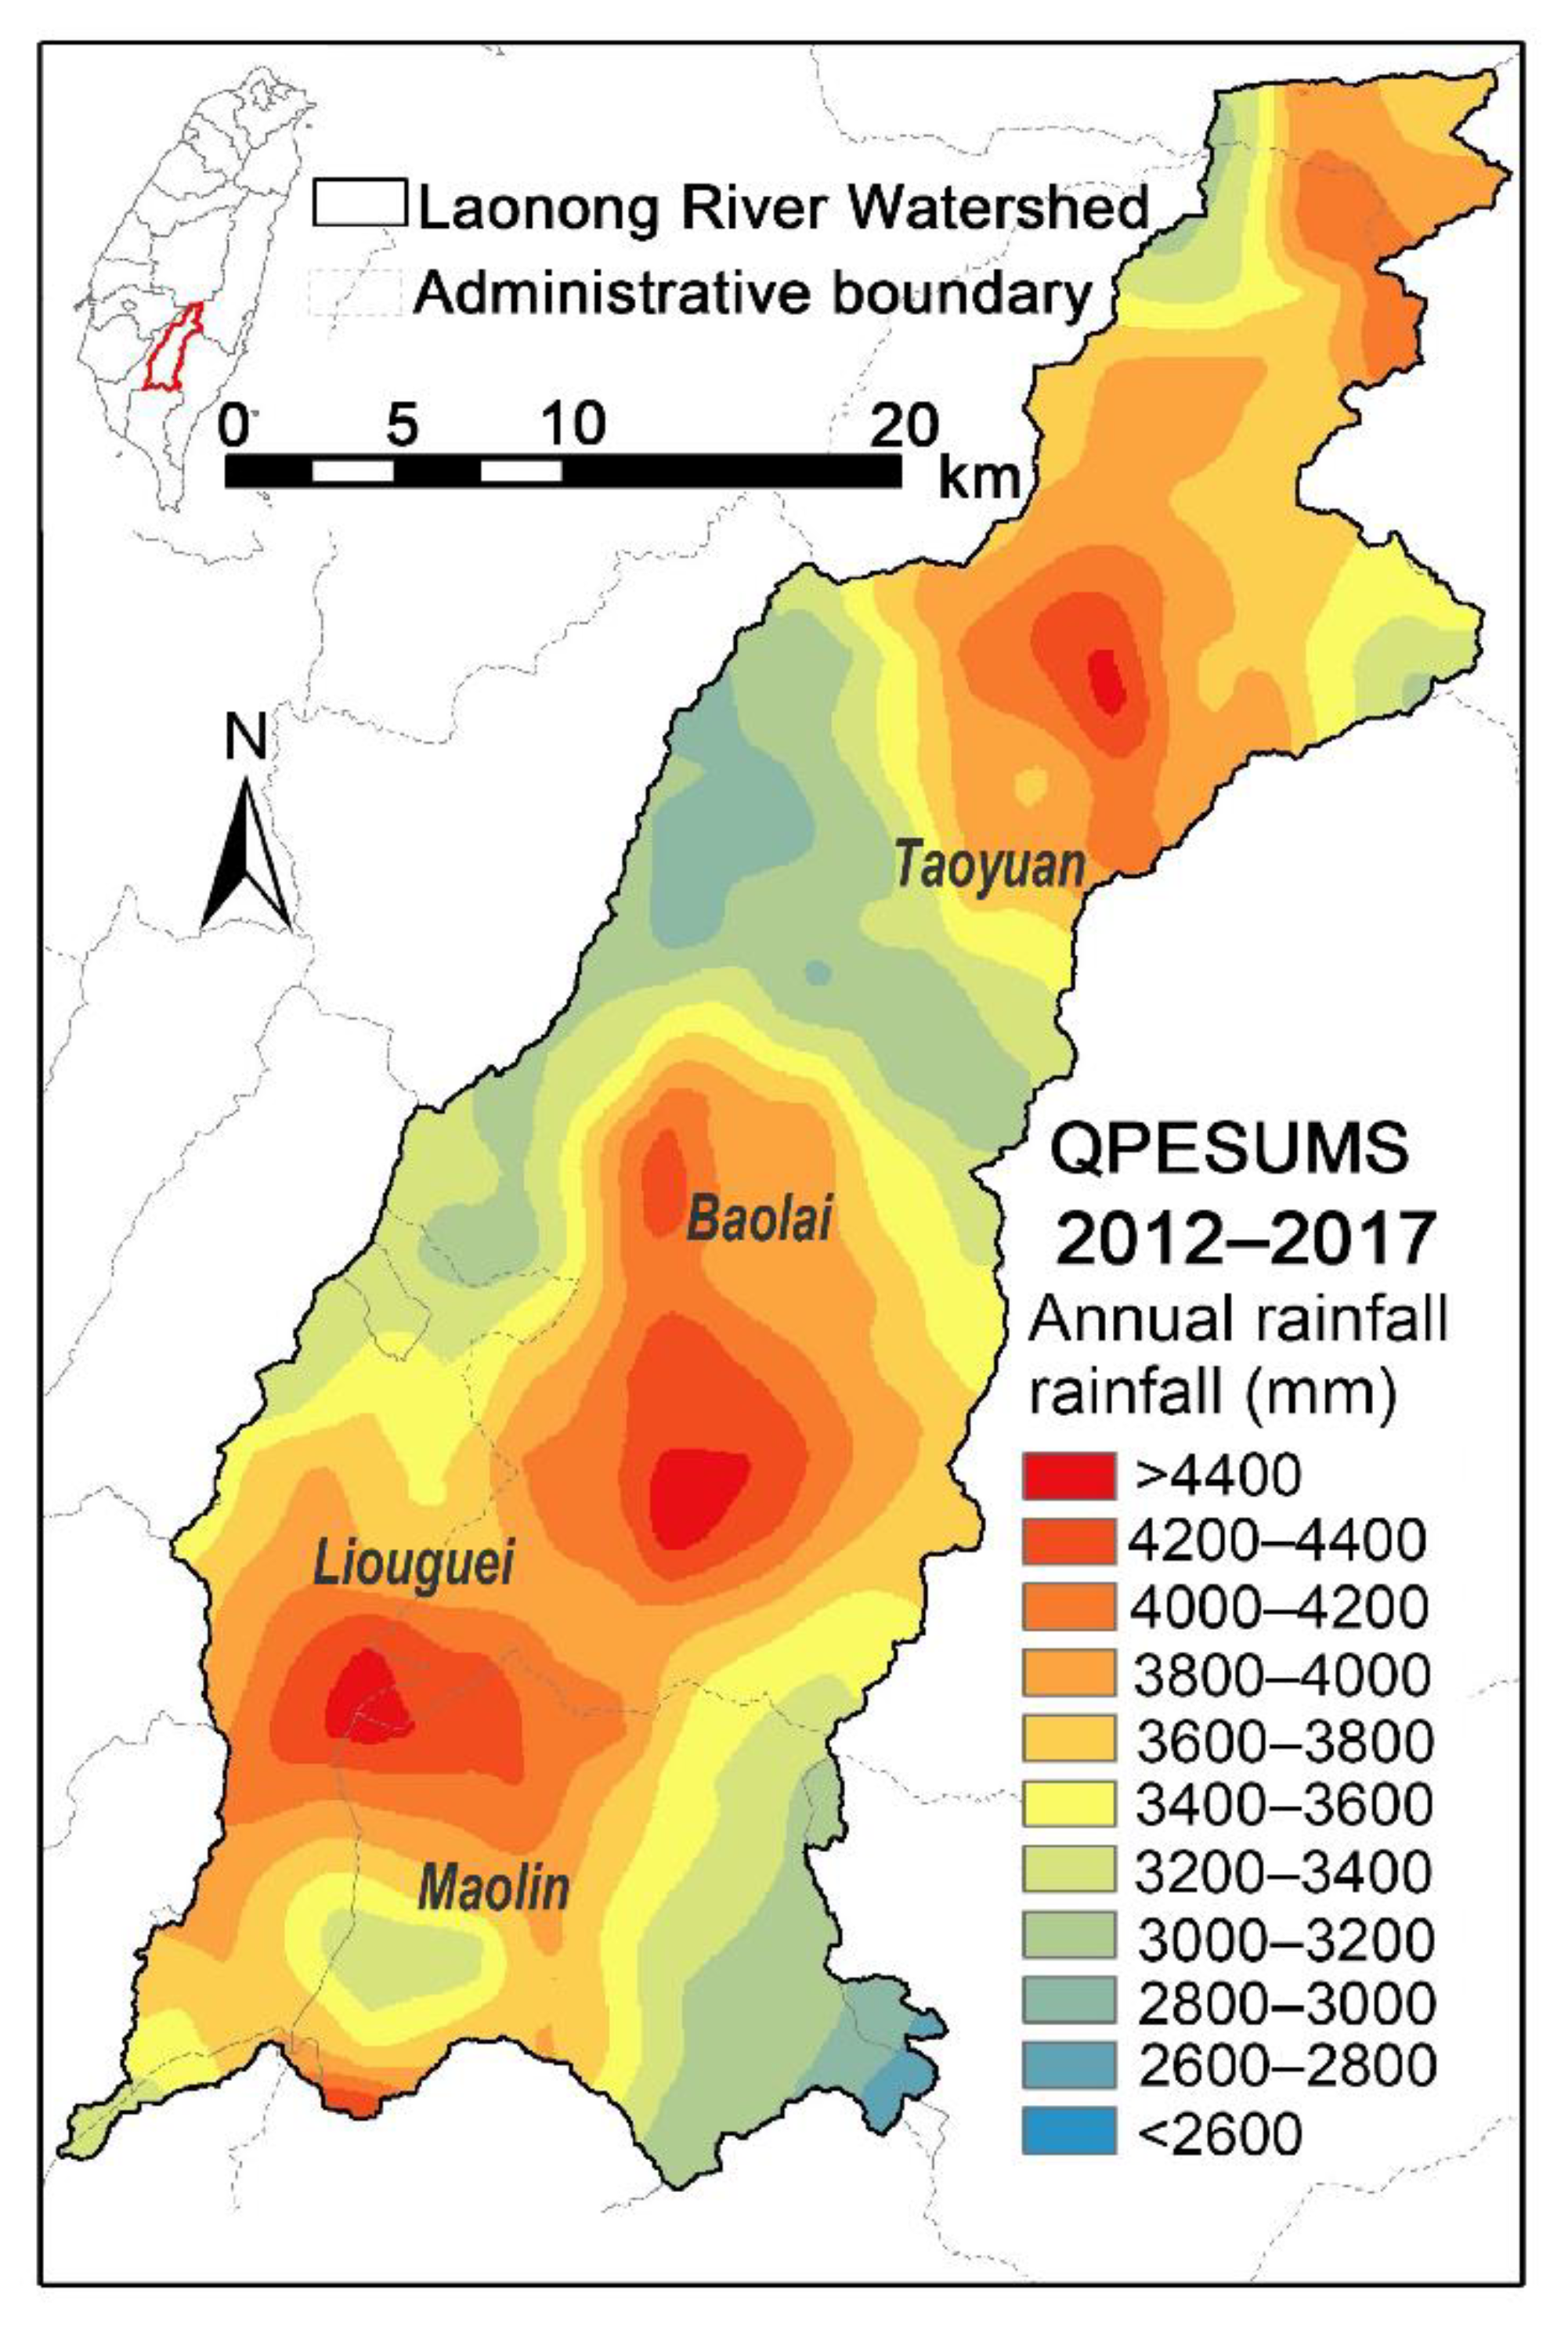
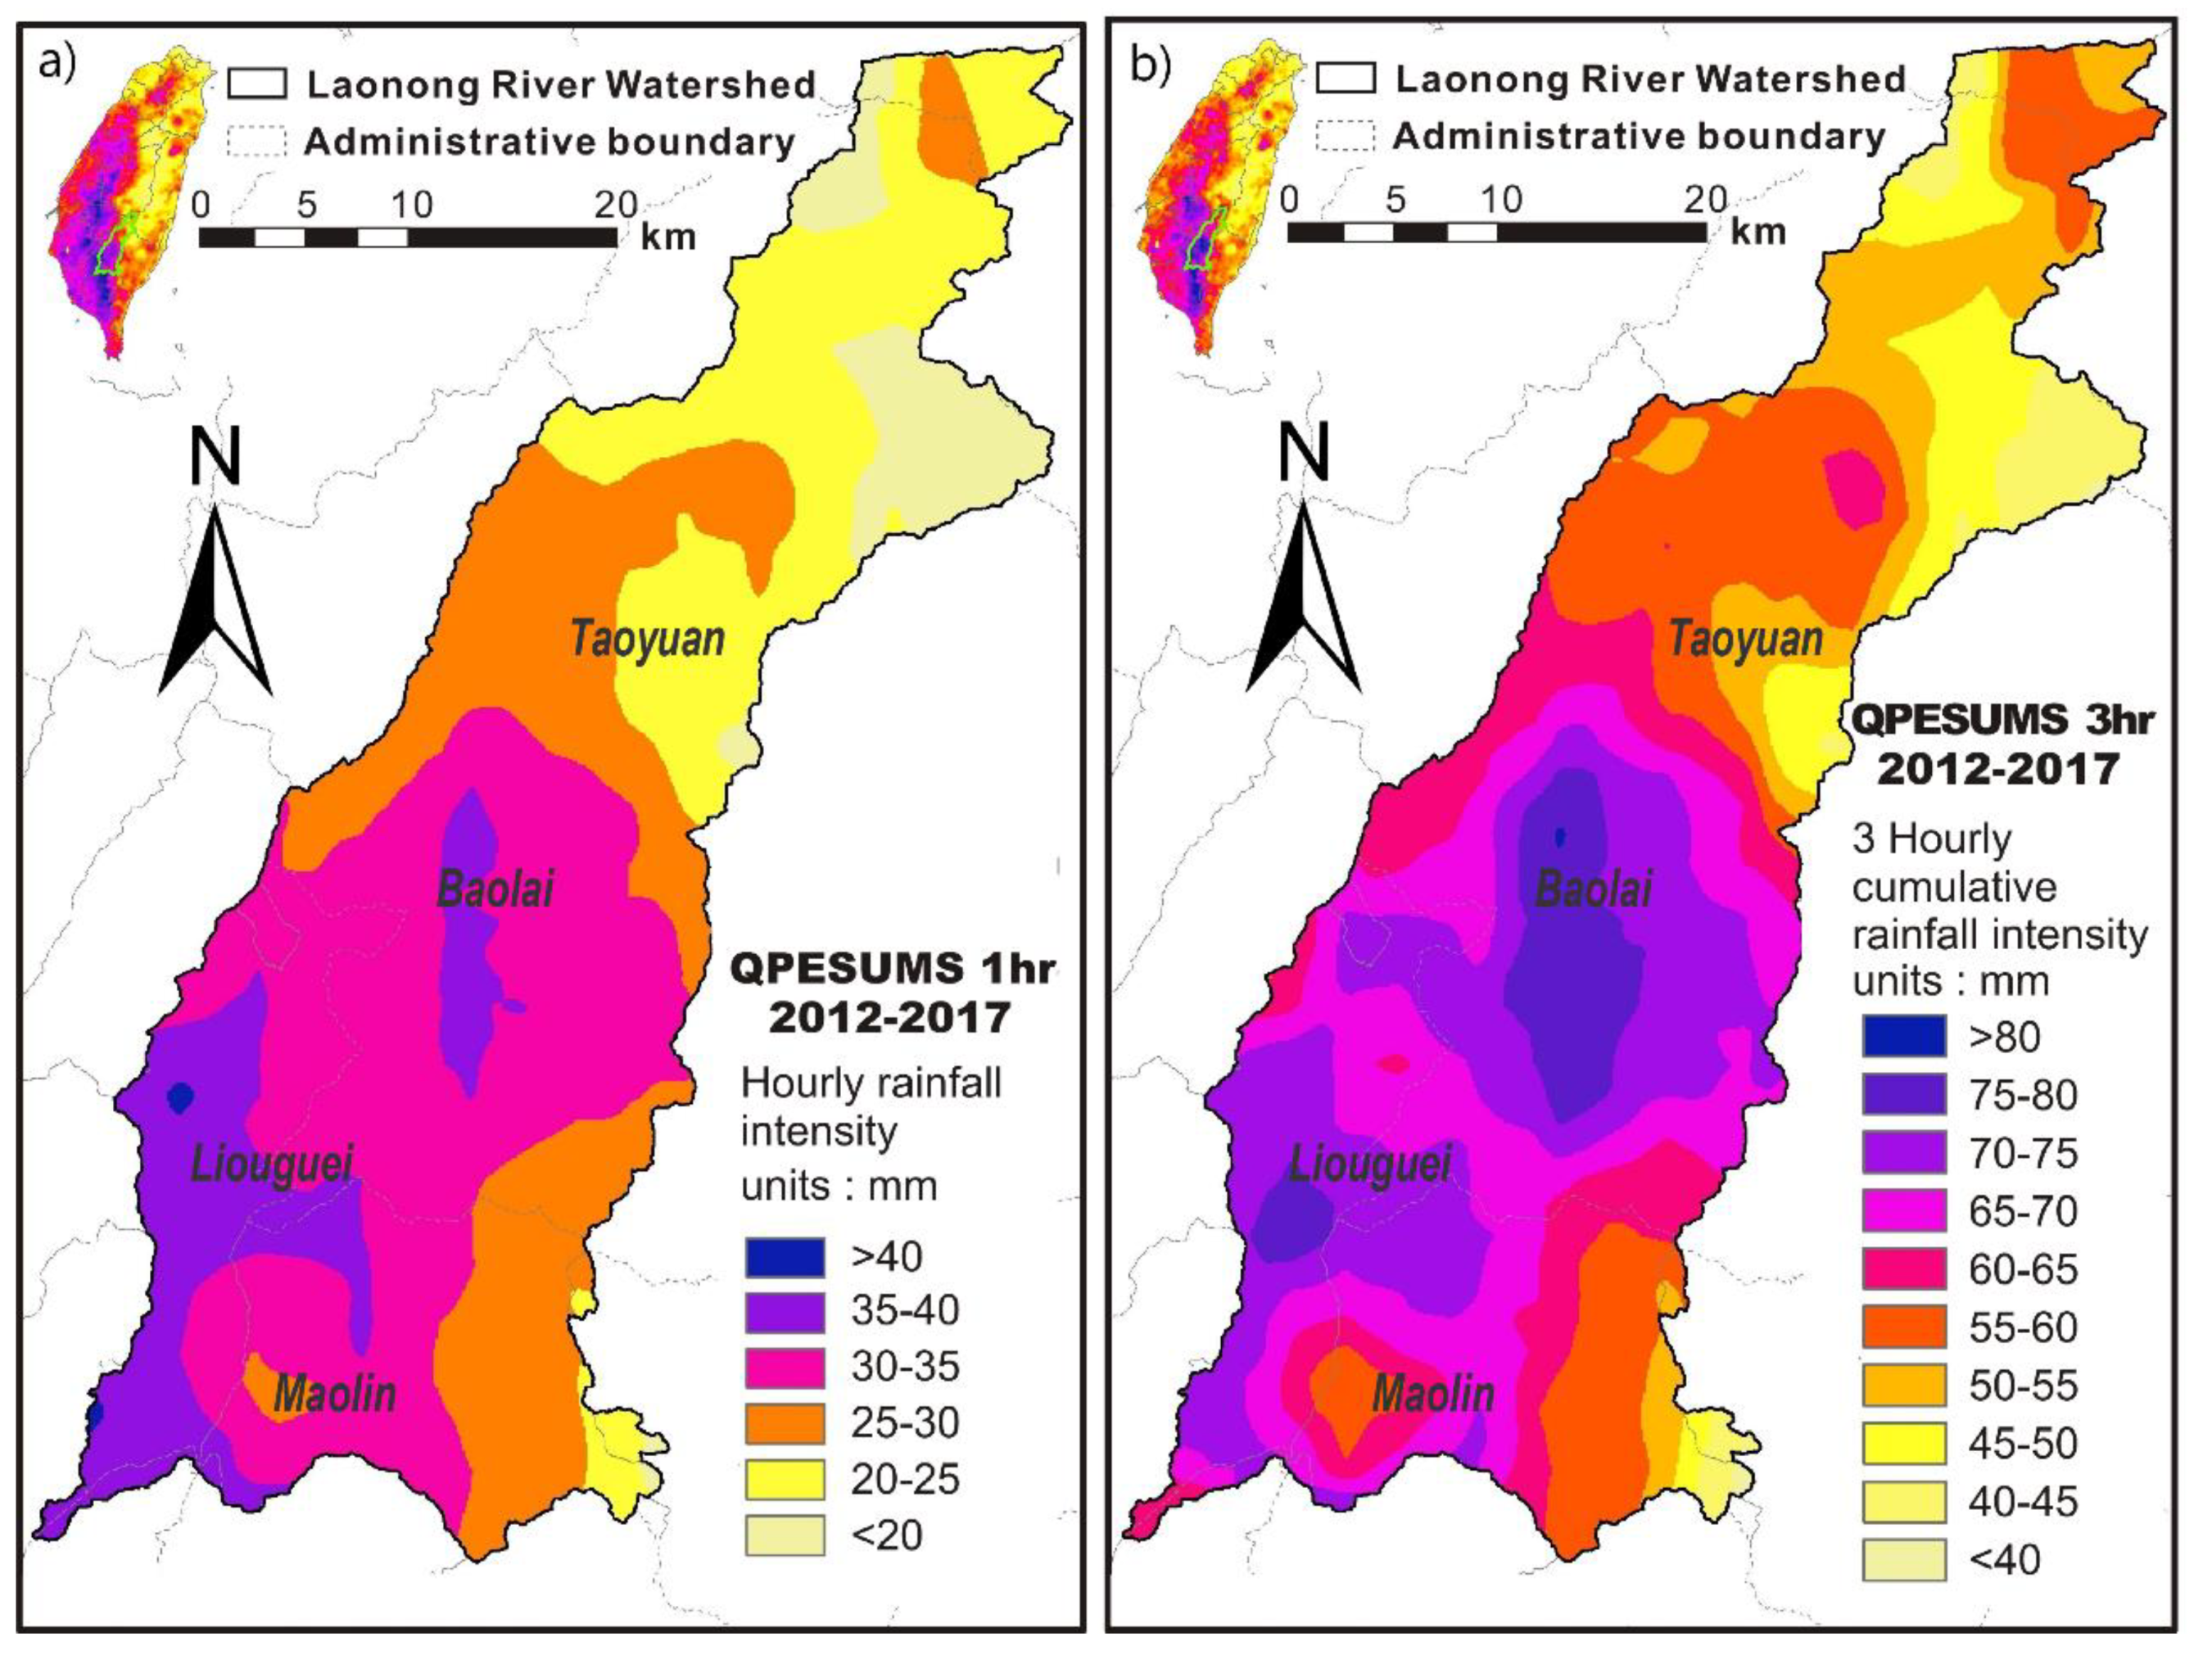
4.1. Rainfall Hot Spots and Landslides

The changes in the long-term rainfall frequency and the spatial distribution of rainfall in the research area were analyzed based on the QPESUMS data from 2012 to 2017 (Figure 5). It can be seen that the rainfall is concentrated in two hot spots. The southern rainfall center lies at the junction of the Liouguei District and Maolin District in Kaohsiung City and extends northward to the southern part of the Taoyuan District, while the northern rainfall center is in the northern part of Taoyuan District, located in the upstream valley of the Laonong River. The southern rainfall center is larger than the northern center in both the area coverage and the rainfall amount.
The main reasons for that are the influence of concentrated rainfall in summer and plum rain season, and the influence of terrain amplitude effect. In summer, typhoon and southwest monsoon bring strong wind and rainfall. In the shallow mountain area and middle altitude area in the south of Laonong River watershed, a large amount of rainfall is caused by the combination of terrain amplitude. The rainfall decreases in the middle part of the river valley, and some water vapor can be intercepted near the high altitude of the central mountain range. In autumn, the rainfall in the watershed decreased significantly, and the rainfall gradually shifted to the high-altitude area, which also showed that the seasonal rainfall variation in the southwest of the watershed was quite large. For example, southwest-facing slopes are the windward side during typhoon Morakot, and typhoon-induced landslides are concentrated on southeast-facing slopes [53]. In contrast, the southeast slopes are mostly forward slopes. Heavy rainfall penetrates between the rock formation and increases the pore water pressure, which may increase the probability of landslide by reduced friction [54].
To understand the spatial distribution of extremely heavy rainfall, the top 1% of rainfall events were selected based on the hourly rainfall and the 3 h accumulated rainfall to map the spatial distribution of extreme rainfall intensity. The results show that the spatial distribution patterns of heavy rain and extremely heavy rainfall events are the same. The top 1% of the average rainfall is mainly distributed in a hot spot in the south of the watershed. The hourly rainfall intensity of these events can generally reach more than 30 mm (Figure 6a), and the accumulated rainfall in 3 h can reach 65 mm (Figure 6b). This hot spot can be further divided into two rainfall centers, the valley area in the low mountains on the southwest side, and the central-southern watershed, along the dividing crest of the Baolai.

4.2. Landslide Risk Ranking and Simulation of Critical Rainfall Scenarios

According to the model validation results, both the 2005 calibrated model and the mixed model are suitable landslide susceptibility models for the Laonong River watershed. The 2005 calibrated model is the main model. When the scale of rainfall is large, the results of the mixed model can be referred to as a supplement. The simulation results of the 2005 calibrated model (Table 5) show that under the rainfall scenario of 300 mm, the area characterized at the high-risk level or above accounted for 3.95% of the watershed, which gradually increased to 5.07% under 600 mm rainfall conditions and 6.68% under 900 mm rainfall. The simulation results of the mixed model (Table 6) show that under the rainfall scenario of 300 mm, the area corresponding to the high-risk level or above accounted for 4.51% of the watershed, which increased to 5.20% under 600 mm rainfall and 6.02% under 900 mm rainfall. In 2005, the maximum 24 h average rainfall in the watershed caused by Typhoon Haitang was approximately 667 mm, and the landslide ratio of the watershed was 1.96%. Comparing the simulation results for areas of high-risk level or above under a rainfall scenario of 600 mm given by the two models, the landslide area was overestimated by approximately 3%. For Typhoon Morakot in 2009, the maximum 24 h average rainfall was approximately 1020 mm, and the landslide ratio of the watershed after the disaster was 6.96%. Comparing the simulation results for areas of high-risk level or above under a rainfall scenario of 900 mm given by the two models, the landslide area was slightly underestimated by 0.28% (2005 model) and 0.94% (mixed model). Although there were slight differences observed in the comparison between the landslide ratios of historical disaster events and the 2019 parameter simulations, which are mainly comparison errors due to the different conditions of vegetation factors, the models can be used to measure the actual differences in landslides induced by historical disastrous rainfall events. The simulations with the two models revealed that most areas in the watershed are characterized by slight landslide risk. However, the mixed calibrated model gives a higher proportion of areas with low-to-moderate risk levels and the proportion of areas with low risk or above increases when rainfall is lower than that in the simulation results of the 2005 calibrated model, which is related to the contribution of topographic conditions in the mixed model. In the application of risk ranking, if a single event is estimated to be high-intensity homogeneous rainfall, the mixed model provides better results. In this study, however, our goal is to present that models calibrated from landslide inventories with different rainfall intensity have different weight of explanatory variable. For the test model in 2005, the previous NDVI is an important explanatory variable, but not for the test model in 2009 (Table 3). This could be because great intensive rainfall in 2009 Typhoon Morakot decreased the shear strength of hillslopes which have already largely exceeded the effects of root cohesion reinforcement. Therefore, the results suggest that a mixed calibrated model could be used as a supplement to the general model but cannot easily catch all the landslide with different rainfall intensity. For example, Chang et al. suggested that a catch-all model (combine all landslide datasets with different rainfall intensity) can predict landslides triggered by a strong typhoon (intensive rainfall intensity) but not a weak typhoon (low rainfall intensity), because a weak typhoon usually triggers a small number of landslides in isolated areas, which can be missed by a model developed from other typhoon events [55].
With fixed topographic conditions, the possible critical values under different disaster probabilities can be calculated using the logistic regression model. Three levels of landslide probability, i.e., 50%, 70%, and 90%, were used in the simulations to analyze the accumulated rainfall in 24 h that may cause disasters in each area. The study results can be used as a reference in the form of regional disaster-prevention maps for villages and residents (Figure 7 and Figure 8). During rainstorm and typhoon events, the evaluation results based on the regional observation values can be applied to prevent disasters from occurring.

5. Conclusions

Spatial distribution of annual rainfall in the Laonong River watershed indicated two rainfall hot spots, the junction of the Liouguei District and Maolin District in Kaohsiung City, and the northern part of Taoyuan District. Additionally, frequency of heavy rain and extremely heavy rain has increased significantly, which may suggest that satellite images should be updated before the flood season every year for simulating the disaster risk. According to the changes in landslide areas, the average landslide ratio before 2008 was 1.5%, which rapidly increased to 6.96% after Typhoon Morakot and fluctuated between 3.5% and 4.5% after 2013. The average landslide area remained at a high level for a long time, which is speculated to be related to the difficulty in restoration after large-scale landslides.
Calibration and validation results of the landslide susceptibility models showed that the calibrated model of 2005 is preferred for conditions of perennial typhoon-induced landslides. For extremely heavy rainfall, the calibrated model of 2009 should be adopted for better simulation results. The results of the logistic regression model showed that the vegetation before rainfall event is related to the reduction of landslide susceptibility. It indicates that the treatment of landslide in the Laonong River watershed is effective. The assessment of the landslide susceptibility model in this study can draw up a long-term landslide-control strategy for rainstorm events, which can improve the efficiency of landslide area remediation. For extreme rainfall events with a high risk of disaster, disaster damage assessment can also be carried out in advance, and action strategies can be planned to achieve the purpose of disaster reduction.

Author Contributions

Conceptualization, C.-W.T. and C.-W.C.; methodology, C.-E.S., S.-F.W., Y.-C.C. and J.-Y.T.; software, Y.-C.C. and J.-Y.T.; validation, C.-W.T. and C.-J.Y.; formal analysis, Y.-C.C. and J.-Y.T.; resources, C.-W.T.; data curation, Y.-C.C. and J.-Y.T.; writing—original draft preparation, C.-W.T., C.-W.C. and C.-J.Y.; writing—review and editing, C.-W.T., C.-W.C. and C.-J.Y.; visualization, Y.-C.C.; supervision, C.-W.T. and S.-F.W.; project administration, C.-W.T. and S.-F.W.; funding acquisition, C.-W.T. All authors have read and agreed to the published version of the manuscript.

Funding

This research was funded by the 2019 Agricultural Science-7.8.2-Forestry-G2 Science and Technology Project of Taiwan Forestry Research Institute, Council of Agriculture, Executive Yuan, R. O. C. (Taiwan).

Acknowledgments

The authors appreciate the support from Taiwan Forestry Research Institute, Council of Agriculture, Executive Yuan, R. O. C. (Taiwan).

Conflicts of Interest

The authors declare no conflict of interest.

References

  1. Yu, P.-S.; Yang, T.-C.; Kuo, C.-C. Evaluating long-term trends in annual and seasonal precipitation in Taiwan. Water Resour. Manag. 2006, 20, 1007–1023. [Google Scholar] [CrossRef]
  2. Liu, H.Y.; Gao, J.X.; Li, Z.G. The advances in the application of remote sensing technology to the study of land covering and land utilization. Remote Sens. Land Resour. 2009, 4, 7–12. [Google Scholar]
  3. Tu, J.; Chou, C. Changes in precipitation frequency and intensity in the vicinity of Taiwan: Typhoon versus non-typhoon events. Environ. Res. Lett. 2013, 8, 014023. [Google Scholar] [CrossRef]
  4. Derin, Y.; Anagnostou, E.; Berne, A.; Borga, M.; Boudevillain, B.; Buytaert, W.; Chang, C.-H.; Chen, H.; Delrieu, G.; Hsu, Y.C.; et al. Evaluation of GPM-era global satellite precipitation products over multiple complex terrain regions. Remote Sens. 2019, 11, 2936. [Google Scholar] [CrossRef] [Green Version]
  5. Chang, K.-J.; Tseng, C.-W.; Tseng, C.-M.; Liao, T.-C.; Yang, C.J. Application of unmanned aerial vehicle (uav)-acquired topography for quantifying typhoon-driven landslide volume and its potential topographic impact on rivers in mountainous catchments. Appl. Sci. 2020, 10, 6102. [Google Scholar] [CrossRef]
  6. Soden, B.J.; Held, I.M. An assessment of climate feedbacks in coupled ocean–atmosphere models. J. Clim. 2006, 19, 3354–3360. [Google Scholar] [CrossRef]
  7. Vecchi, G.A.; Soden, B.J. Global warming and the weakening of the tropical circulation. J. Clim. 2007, 20, 4316–4340. [Google Scholar] [CrossRef] [Green Version]
  8. Chou, C.; Tu, J.-Y.; Tan, P.-H. Asymmetry of tropical precipitation change under global warming. Geophys. Res. Lett. 2007, 34, 17708. [Google Scholar] [CrossRef] [Green Version]
  9. Sun, Y.; Solomon, S.; Dai, A.; Portmann, R.W. How often will it rain? J. Clim. 2007, 20, 4801–4818. [Google Scholar] [CrossRef]
  10. Chou, C.; Chiang, J.C.H.; Lan, C.-W.; Chung, C.-H.; Liao, Y.-C.; Lee, C.-J. Increase in the range between wet and dry season precipitation. Nat. Geosci. 2013, 6, 263–267. [Google Scholar] [CrossRef]
  11. Huang, P.; Xie, S.-P.; Hu, K.; Huang, G.; Huang, R. Patterns of the seasonal response of tropical rainfall to global warming. Nat. Geosci. 2013, 6, 357–361. [Google Scholar] [CrossRef]
  12. Tan, C.-C.; Tung, C.-P. Climate change impacts on Taipei groundwater recharge. J. Taiwan Agric. Eng. 2008, 54, 1–15. [Google Scholar]
  13. National Science and Technology Center for Disaster Reduction. Disaster Survey and Analysis of Morakot Typhoon; research project 2010; National Science Council: Taipei, Taiwan, 2010. (In Chinese) [Google Scholar]
  14. Chung, Y.-C. Probe into the Regional Landslide Susceptibility Analysis—A Case Study in the Shimen Reservoir Catchment Area. Master’s Thesis, Department of Earth Sciences, National Central University, Tainan, Taiwan, 2009. (In Chinese). [Google Scholar]
  15. Wei, L.-W.; Huang, C.-M.; Huang, W.-K.; Lee, C.-F.; Chi, C.-C. Development and Application of Rainfall Triggered Landslides Warning Information System. Sinotech Eng. 2018, 57–67. (In Chinese). Available online: https://www.sinotech.org.tw/journal/Abstract/?n=303 (accessed on 22 October 2020). (In Chinese).
  16. Wu, C.-H.; Chen, S.-C. The evaluation of the landslide potential prediction models used in Taiwan. J. Soil Water Conserv. 2004, 36, 295–306. (In Chinese) [Google Scholar]
  17. Fang, Y.M.; Hung, P.S.; Cheng, M.Y.; Yu, P.S.; Huang, M.H.; Huang, Y.H. Study on the establishment of slope collapse monitoring and early warning model of Suhua highway. Harb. Rep. 2012, 92, 32–38. (In Chinese) [Google Scholar] [CrossRef]
  18. Chen, C.-Y.; Chen, J.-W.; Chen, K.-W.; Lin, Y.-C. Warning Model for Predicting the Risk Zones of Rainfall-Induced Slopeland Disasters. J. Chin. Soil Water Conserv. 2019, 50, 1–10. (In Chinese) [Google Scholar]
  19. Chang, L.-C.; Chiang, Y.-M.; Tsai, M.-J.; Shieh, M.-C.; Hsu, K.; Sorooshian, S. Watershed rainfall forecasting using neuro-fuzzy networks with the assimilation of multi-sensor information. J. Hydrol. 2014, 508, 374–384. [Google Scholar] [CrossRef] [Green Version]
  20. Youssef, A.M.; Pourghasemi, H.R. Landslide susceptibility mapping using machine learning algorithms and comparison of their performance at Abha Basin, Asir Region, Saudi Arabia. Geosci. Front. 2020. [Google Scholar] [CrossRef]
  21. Lin, G.-F.; Chang, M.-J.; Huang, Y.-C.; Ho, J.-Y. Assessment of susceptibility to rainfall-induced landslides using improved self-organizing linear output map, support vector machine, and logistic regression. Eng. Geol. 2017, 224, 62–74. [Google Scholar] [CrossRef]
  22. Zhao, Y.; Wang, R.; Jiang, Y.; Liu, H.; Wei, Z. GIS-based logistic regression for rainfall-induced landslide susceptibility mapping under different grid sizes in Yueqing, Southeastern China. Eng. Geol. 2019, 259, 105147. [Google Scholar] [CrossRef]
  23. Hemasinghe, H.; Rangali, R.; Deshapriya, N.; Samarakoon, L. Landslide susceptibility mapping using logistic regression model (a case study in Badulla District, Sri Lanka). Procedia Eng. 2018, 212, 1046–1053. [Google Scholar] [CrossRef]
  24. Lin, M.-L.; Chen, T.-W.; Lin, C.-W.; Ho, D.-J.; Cheng, K.-P.; Yin, H.-Y.; Chen, M.-C. Detecting large-scale landslides using lidar data and aerial photos in the Namasha-Liuoguey area, Taiwan. Remote Sens. 2013, 6, 42–63. [Google Scholar] [CrossRef] [Green Version]
  25. Wu, C. Comparison and evolution of extreme Rainfall-Induced landslides in Taiwan. ISPRS Int. J. Geo Inf. 2017, 6, 367. [Google Scholar] [CrossRef] [Green Version]
  26. Lin, J.-C. Top. Ten Geographical Issues in Taiwan; Book Republic Publishing Group: Taipei, Taiwan, 2008. [Google Scholar]
  27. Liang, F.-W. A Study of Landslide Susceptibility Analysis vs Rainfall at Lao-Nong River Watershed. Master’s Thesis, Department of Soil and Water Conservation, National Chung Hsing University, Taichung, Taiwan, 2014. (In Chinese). [Google Scholar]
  28. Chen, C.-H.; Lin, C.-W.; Chen, M.-M.; Chang, W.-S.; Liu, S.-H. A landslide study by using multi-temporal satellite images: An example from Lao-Lung River watershed. J. Taiwan Disaster Prev. Soc. 2011, 3, 25–38. (In Chinese) [Google Scholar]
  29. Hung, Y.-W. The Engineering Geological Characteristics and Triggered Mechanism of Debris Flow in the Chishan River and Laonong River of Kaohsiung. Master’s Thesis, Department of Geosciences, National Taiwan University, Taipei, Taiwan, 2014. (In Chinese). [Google Scholar]
  30. Tseng, M.-C. Analysis of Topographic Signatures after Typhoon Morakot-Take Watershed of Southern Taiwan as Examples. Master’s Thesis, Department of Land Management and Development, Chang Jung Christian University, Tainan, Taiwan, 2012. (In Chinese). [Google Scholar]
  31. Chen, T.-C.; Wu, C.-C.; Weng, M.-C.; Hsieh, K.-H.; Wang, C.-C. Slope Failure of Lawnon Basin Induced by Typhoon Morakot. Sino Geotech. 2009, 122, 13–20. (In Chinese) [Google Scholar]
  32. Wei, C.-C.; Hsieh, P.-Y. Estimation of hourly rainfall during typhoons using radar mosaic-based convolutional neural networks. Remote Sens. 2020, 12, 896. [Google Scholar] [CrossRef] [Green Version]
  33. Xin, L.; Reuter, G.; Larochelle, B. Reflectivity-rain rate relationships for convective rain showers in Edmonton: Research note. Atmos. Ocean 1997, 35, 513–521. [Google Scholar] [CrossRef]
  34. Tang, Y.-S.; Chang, P.-L. QPESUMS development and customized services. In Proceedings of the Symposium on Weather Analysis and Forecasting, Central Weather Bureau, Taipei, Taiwan, 15–16 September 2015; pp. A6–A9. [Google Scholar]
  35. Lin, E.-J.; Liu, C.-C.; Chang, C.-H.; Cheng, I.-F.; Ko, M.-H. Using The FORMOSAT-2 High Spatial and Temporal Resolution Multispectral Image for Analysis and Interpretation Landslide Disasters in Taiwan. J. Photogramm. Remote Sens. 2013, 17, 31–51. [Google Scholar]
  36. Lin, S.-C.; Chuang, C.-W.; Ho, S.-H.; Lin, C.-Y. Effect of the vegetation index on the accuracy of image classification. J. Soil Water Conserv. 2008, 40, 181–193. [Google Scholar]
  37. Chang, K.; Chiang, S.-H.; Hsu, M.-L. Modeling typhoon- and earthquake-induced landslides in a mountainous watershed using logistic regression. Geomorphology 2007, 89, 335–347. [Google Scholar] [CrossRef]
  38. Agresti, A. Categorical Data Analysis, 2nd ed.; John Wiley: New York, NY, USA, 2002; 710 p. [Google Scholar]
  39. Wilson, J.P.; Gallant, J.C. Terrain Analysis: Principles and Applications; John Wiley & Sons: Hoboken, NJ, USA, 2000. [Google Scholar]
  40. Lillesand, T.; Kiefer, R.W.; Chipman, J. Remote Sensing and Image Interpretation; John Wiley and Sons: Hoboken, NJ, USA, 2015. [Google Scholar]
  41. Rouse, J.W.; Haas, H.R.; Schell, J.A.; Deering, D.W. Monitoring vegetation systems in the Great Plains with ERTS. In Proceedings of the Third ERTS Symposium, NASA SP-351 I, Washington, DC, USA, 10–14 December 1973; US Government Printing Office: Washington, DC, USA; pp. 309–317. [Google Scholar]
  42. Bosino, A.; Giordani, P.; Quénéhervé, G.; Maerker, M. Assessment of calanchi and rill–interrill erosion susceptibilities using terrain analysis and geostochastics: A case study in the Oltrepo Pavese, Northern Apennines, Italy. Earth Surf. Process. Landf. 2020, 45, 3025–3041. [Google Scholar] [CrossRef]
  43. Cama, M.; Schillaci, C.; Kropáček, J.; Hochschild, V.; Bosino, A.; Maerker, M. A Probabilistic Assessment of Soil Erosion Susceptibility in a Head Catchment of the Jemma Basin, Ethiopian Highlands. Geosciences 2020, 10, 248. [Google Scholar] [CrossRef]
  44. Keefer, D.K.; Wilson, R.C.; Mark, R.K.; Brabb, E.E.; Brown, W.M.; Ellen, S.D.; Harp, E.L.; Wieczorek, G.F.; Alger, C.S.; Zatkin, R.S. Real-time landslide warning during heavy rainfall. Science 1987, 238, 921–925. [Google Scholar] [CrossRef]
  45. Dai, F.; Lee, C. Frequency–volume relation and prediction of rainfall-induced landslides. Eng. Geol. 2001, 59, 253–266. [Google Scholar] [CrossRef]
  46. Wei, L.-W.; Huang, C.-M.; Chen, H.; Lee, C.-T.; Chi, C.-C.; Chiu, C.-L. Adopting the I3–R24 rainfall index and landslide susceptibility for the establishment of an early warning model for rainfall-induced shallow landslides. Nat. Hazards Earth Syst. Sci. 2018, 18, 1717–1733. [Google Scholar] [CrossRef] [Green Version]
  47. Szatten, D.; Habel, M. Effects of Land Cover Changes on Sediment and Nutrient Balance in the Catchment with Cascade-Dammed Waters. Remote Sens. 2020, 12, 3414. [Google Scholar] [CrossRef]
  48. David, W.; Hosmer, J.; Lemeshow, S.; Sturdivant, R.X. Applied Logistic Regression, 3rd ed.; John Wiley & Sons, Ltd.: Hoboken, NJ, USA, 2013. [Google Scholar]
  49. Swets, J.A. Measuring the accuracy of diagnostic systems. Science 1988, 240, 1285–1293. [Google Scholar] [CrossRef] [Green Version]
  50. Wang, S.-F.; Chen, Y.-C.; Song, C.-E. Integration of multi-scale Natural and administrative units for assessing the landslide hazard risk in Nantou County. J. Geogr. Sci. 2020, 96, 27–54. [Google Scholar]
  51. Tu, J.-Y.; Chou, C.; Chu, P.-S. The abrupt shift of typhoon activity in the vicinity of Taiwan and its association with western north pacific–east asian climate change. J. Clim. 2009, 22, 3617–3628. [Google Scholar] [CrossRef]
  52. Chi, C.-Z.; Tu, J.-Y. Summer heavy rainfall frequency changes associated with typhoon in Taiwan. J. Geogr. Sci. 2017, 85, 27–46. [Google Scholar] [CrossRef]
  53. Yu, C.-K.; Cheng, L.-W. Distribution and mechanisms of orographic precipitation associated with Typhoon Morakot (2009). J. Atmos. Sci. 2013, 70, 2894–2915. [Google Scholar] [CrossRef]
  54. Chen, Y.-C.; Chang, K.-T.; Wang, S.-F.; Huang, J.-C.; Yu, C.-K.; Tu, J.-Y.; Chu, H.-J.; Liu, C.-C. Controls of preferential orientation of earthquake- and rainfall-triggered landslides in Taiwan’s orogenic mountain belt. Earth Surf. Process. Landf. 2019, 44, 1661–1674. [Google Scholar] [CrossRef]
  55. Chang, K.; Chiang, S.-H.; Chen, Y.-C.; Mondini, A.C. Modeling the spatial occurrence of shallow landslides triggered by typhoons. Geomorphology 2014, 208, 137–148. [Google Scholar] [CrossRef]
Figure 1. Location of the Laonong River watershed in Taiwan. (a) Color-shaded map of 20 m digital elevation model. (b) The geological map of the study area.
Remotesensing 12 03855 g001
Figure 2. Schematic diagram for grid cells (Zi) within a 3 × 3 pixel, circular moving window, where Z0 is located at the center of the circle.
Remotesensing 12 03855 g002
Figure 3. Time series of the frequency of annual rainfall and heavy rain events in the Laonong River watershed: (a) annual rainfall, (b) events of daily rainfall up to 80 mm, and (c) events of daily rainfall up to 200 mm.
Remotesensing 12 03855 g003
Figure 4. Changes in the area and average area of total landslides over the years in the Laonong River watershed.
Remotesensing 12 03855 g004
Figure 5. Spatial distribution of mean annual rainfall in 2012–2017 in the Laonong River watershed.
Remotesensing 12 03855 g005
Figure 6. Spatial distribution of the top 1% of rainfall intensity in the Laonong River watershed: (a) hourly rainfall and (b) 3 h accumulated rainfall.
Remotesensing 12 03855 g006
Figure 7. Simulation results of landslide probability due to rainfall and critical rainfall derived from the 2005 model. (a) rainfall of 300 mm, (b) rainfall of 600 mm, (c) rainfall of 900 mm, (d) landslide probability of 50%, (e) landslide probability of 70%, (f)landslide probability of 90%.
Remotesensing 12 03855 g007aRemotesensing 12 03855 g007b
Figure 8. Simulation results of landslide probability due to rainfall and critical rainfall derived from the mixed model. (a) rainfall of 300 mm, (b) rainfall of 600 mm, (c) rainfall of 900 mm, (d) landslide probability of 50%, (e) landslide probability of 70%, (f) landslide probability of 90%.
Remotesensing 12 03855 g008aRemotesensing 12 03855 g008b
Table 1. Risk classification of landslide probabilities.
Probability of LandslideRisk Level
>0.8 Serious
0.6–0.8High
0.4–0.6Moderate
0.2–0.4Low
<0.2Slight
Table 2. Statistics of landslide sites over the years in the study area.
YearLandslide Area (ha)Proportion (%)CountAverage Landslide Area (ha)
2003842.490.6210630.78
20042155.561.5825600.84
20052661.701.9626940.98
20062677.861.9726081.02
20072600.721.9120201.28
20081266.000.9312810.98
20099472.676.9646152.05
20108467.196.2273371.09
20116946.505.1149981.38
20126069.764.4648611.24
20136177.934.5466850.88
20146352.234.6747171.34
20154786.043.5238551.24
20165401.573.9732481.66
20175890.224.3335271.67
20185951.464.3853600.85
Table 3. Statistic results derived from each model.
Tested ModelParametersβ valueS.E,WaldSig.Exp(β)
2005 Slope0.0400.003199.9110.0001.040
Aspect of sin0.5440.038209.6820.0001.724
Aspect of cosine−0.5410.038202.8040.0000.582
Topographic wetness index9.1360.01497.2860.0001.146
Distance to river−0.0010.000177.7060.0000.999
Previous NDVI−7.1080.1801561.5880.0000.001
Continuous maximum 24-hourly rainfall0.0010.00039.0430.0001.001
Geology 268.8170.000
Constant−0.2600.2820.8530.3560.771
2009Elevation−3.34 × 10−40.00064.0780.0001.000
Slope0.0320.002227.5510.0001.032
Aspect of sin0.7300.027745.4530.0002.075
Aspect of cosine−1.0190.0301162.4760.0000.361
Distance to river−0.0010.000140.0980.0000.999
Topographic wetness index0.2110.010443.1910.0001.235
Previous NDVI0.0020.00044.8480.0001.002
Continuous maximum 24 hourly rainfall−0.7280.11540.1420.0000.483
Geology 535.8790.000
Constant−3.2510.35086.2350.0000.039
MixedElevation−2.28 × 10−40.00038.0280.0001.000
Slope0.0490.005115.5880.0001.050
Terrain roughness−0.0080.0038.2450.0040.992
Aspect of sin−0.5710.025532.9840.0001.769
Aspect of cosine−0.9030.0271084.0460.0000.405
Distance to river−4.93 × 10−40.000120.7780.0001.000
Topographic wetness index0.1940.009435.9090.0001.214
Previous NDVI0.0000.0009.4000.0021.000
Continuous maximum of 24-hourly rainfall−2.2380.078815.9120.0000.107
Geology 484.5020.000
Constant−1.5940.19865.1370.0000.203
β value: coefficient; S.E.: standard error; Wald: Chi-square; Sig: significance (p-value); Exp(β): Odds Ratio.
Table 4. Prediction accuracy of each model.
2005 Tested Model
Observed valuePredicted value
Non-landslideLandslidePercent accuracy (%)
Non-landslide411488682.28
Landslide1336366473.28
Overall accuracy (%) 77.78
AUC for 2005 (calibration) 0.895
AUC for 2009 (validation) 0.619
2009 Tested Model
Observed valuePredicted value
Non-landslideLandslidePercent accuracy (%)
Non-landslide5479252168.49
Landslide1940606075.75
Overall accuracy (%) 72.12
AUC for 2005 (validation) 0.639
AUC for 2009 (calibration) 0.788
Mixed Tested Model
Observe valuePredicted value
Non-landslideLandslidePercent accuracy (%)
Non-landslide6280272069.78
Landslide2714628669.84
Overall accuracy (%) 69.81
AUC for 2005 (calibration) 0.811
AUC for 2009 (calibration) 0.772
AUC: area under the receiver operating characteristic curve.
Table 5. Results of landslide risk obtained by the 2005 tested model.
Risk Level300 mm600 mm900 mm
Area (m2)Ratio (%)Area (m2)Ratio (%)Area (m2)Ratio (%)
Slight114,693.90 84.32105,002.14 77.1990,025.42 66.18
Low121,30.90 8.9218,398.50 13.5328,030.10 20.61
Moderate3827.80 2.815725.76 4.218877.96 6.53
High2619.56 1.933202.48 2.354294.92 3.16
Serious2753.64 2.023696.92 2.724797.40 3.53
Table 6. Results of landslide risk obtained by the mixed tested model.
Risk Level300 mm600 mm900 mm
Area (m2)Ratio (%)Area (m2)Ratio (%)Area (m2)Ratio (%)
Slight62,596.74 46.0258,465.12 42.9854,292.16 39.91
Low47,089.60 34.6247,831.00 35.1648,456.60 35.62
Moderate20,203.90 14.8522,658.60 16.6625,081.60 18.44
High5127.64 3.775878.16 4.326785.92 4.99
Serious1007.92 0.741192.92 0.881409.52 1.04
Publisher’s Note: MDPI stays neutral with regard to jurisdictional claims in published maps and institutional affiliations.

