Mapping Forest Fire Risk—A Case Study in Galicia (Spain)

 ,
, 
 ,
,  , and
, and
Abstract

1. Introduction
- Investigate and determine the main factors affecting fire risk in the study area.
- Determine the weight for each factor influencing forest fire risk.
- Improve existing information about the generation of fuel and flammability models by LiDAR data analysis, generate vegetation continuity covers, and apply forest fire risk weather index based on the weather conditions in the area.
- Develop a methodology to automatically calculate main factors involved in forest fire risk map.
- Report on fire risks obtained and establish the recommendations to road managers focusing on mitigation measures or actions.
2. Materials and Methods
2.1. Area of Study
2.2. Materials
2.2.1. Satellite Imagery
2.2.2. Aerial LiDAR Data
2.3. Methodology
2.3.1. Topography
2.3.2. Vegetation
2.3.3. Fire Weather Index
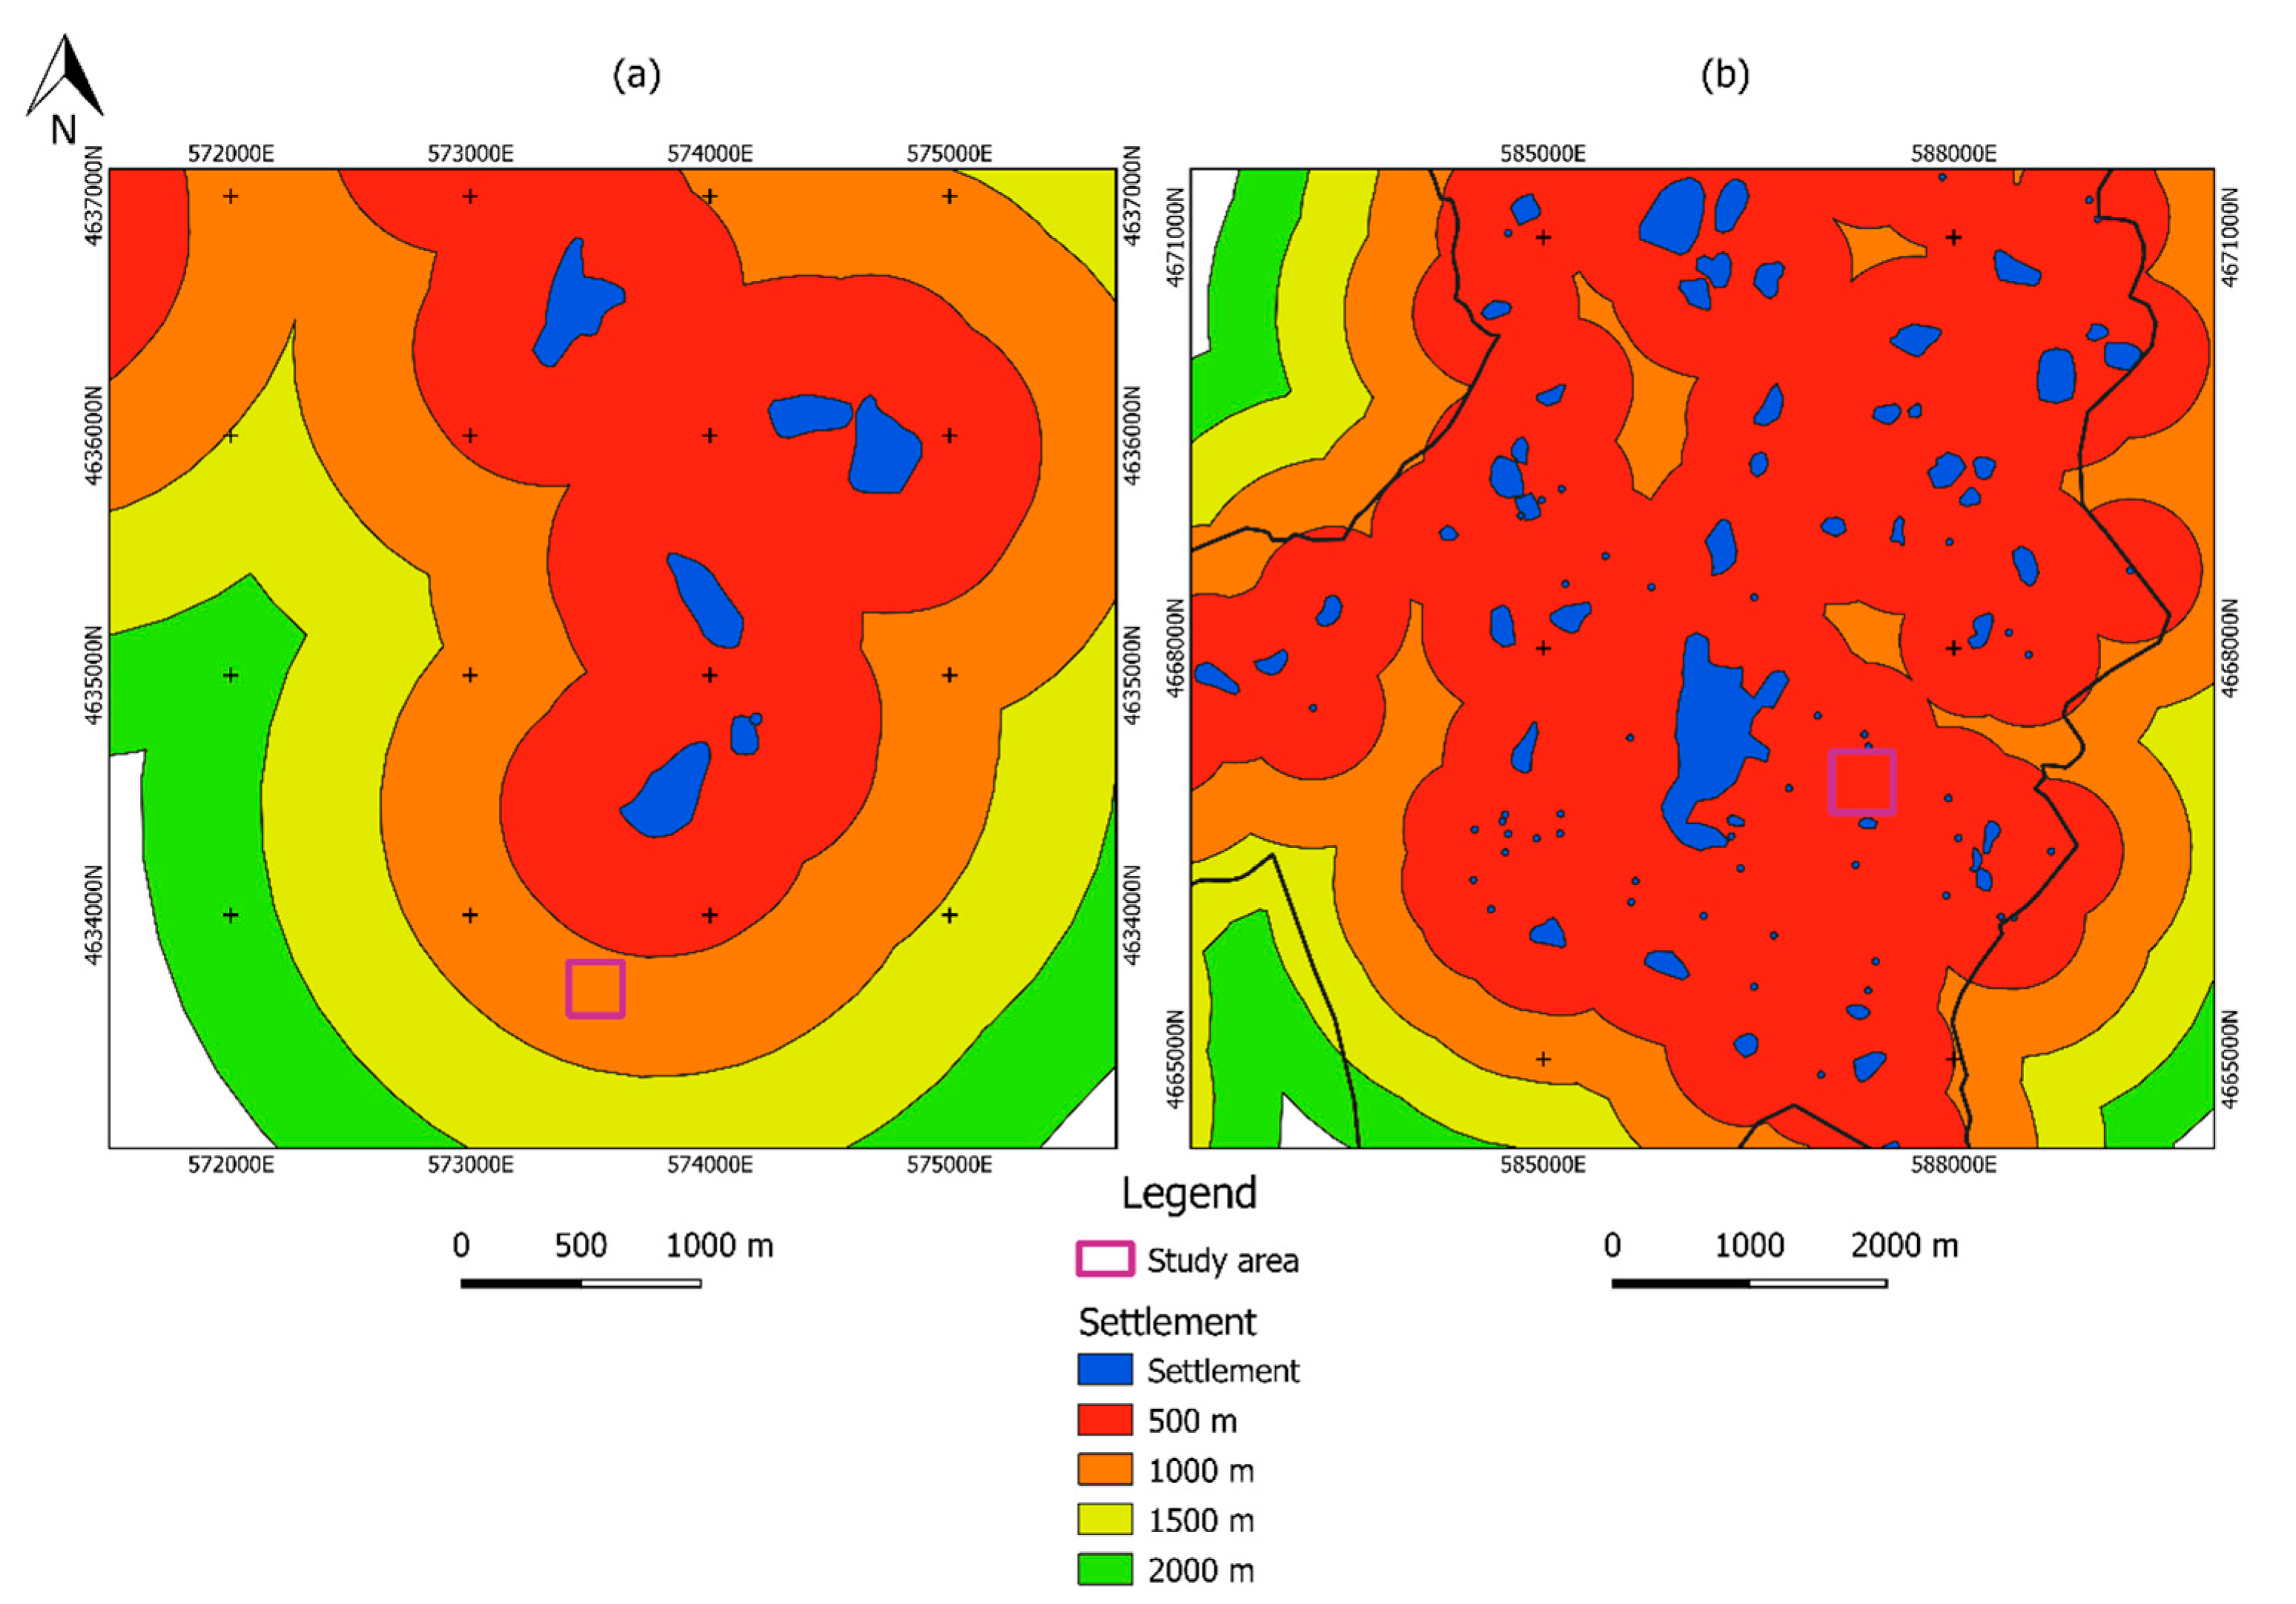
2.3.4. Anthropogenic Issues
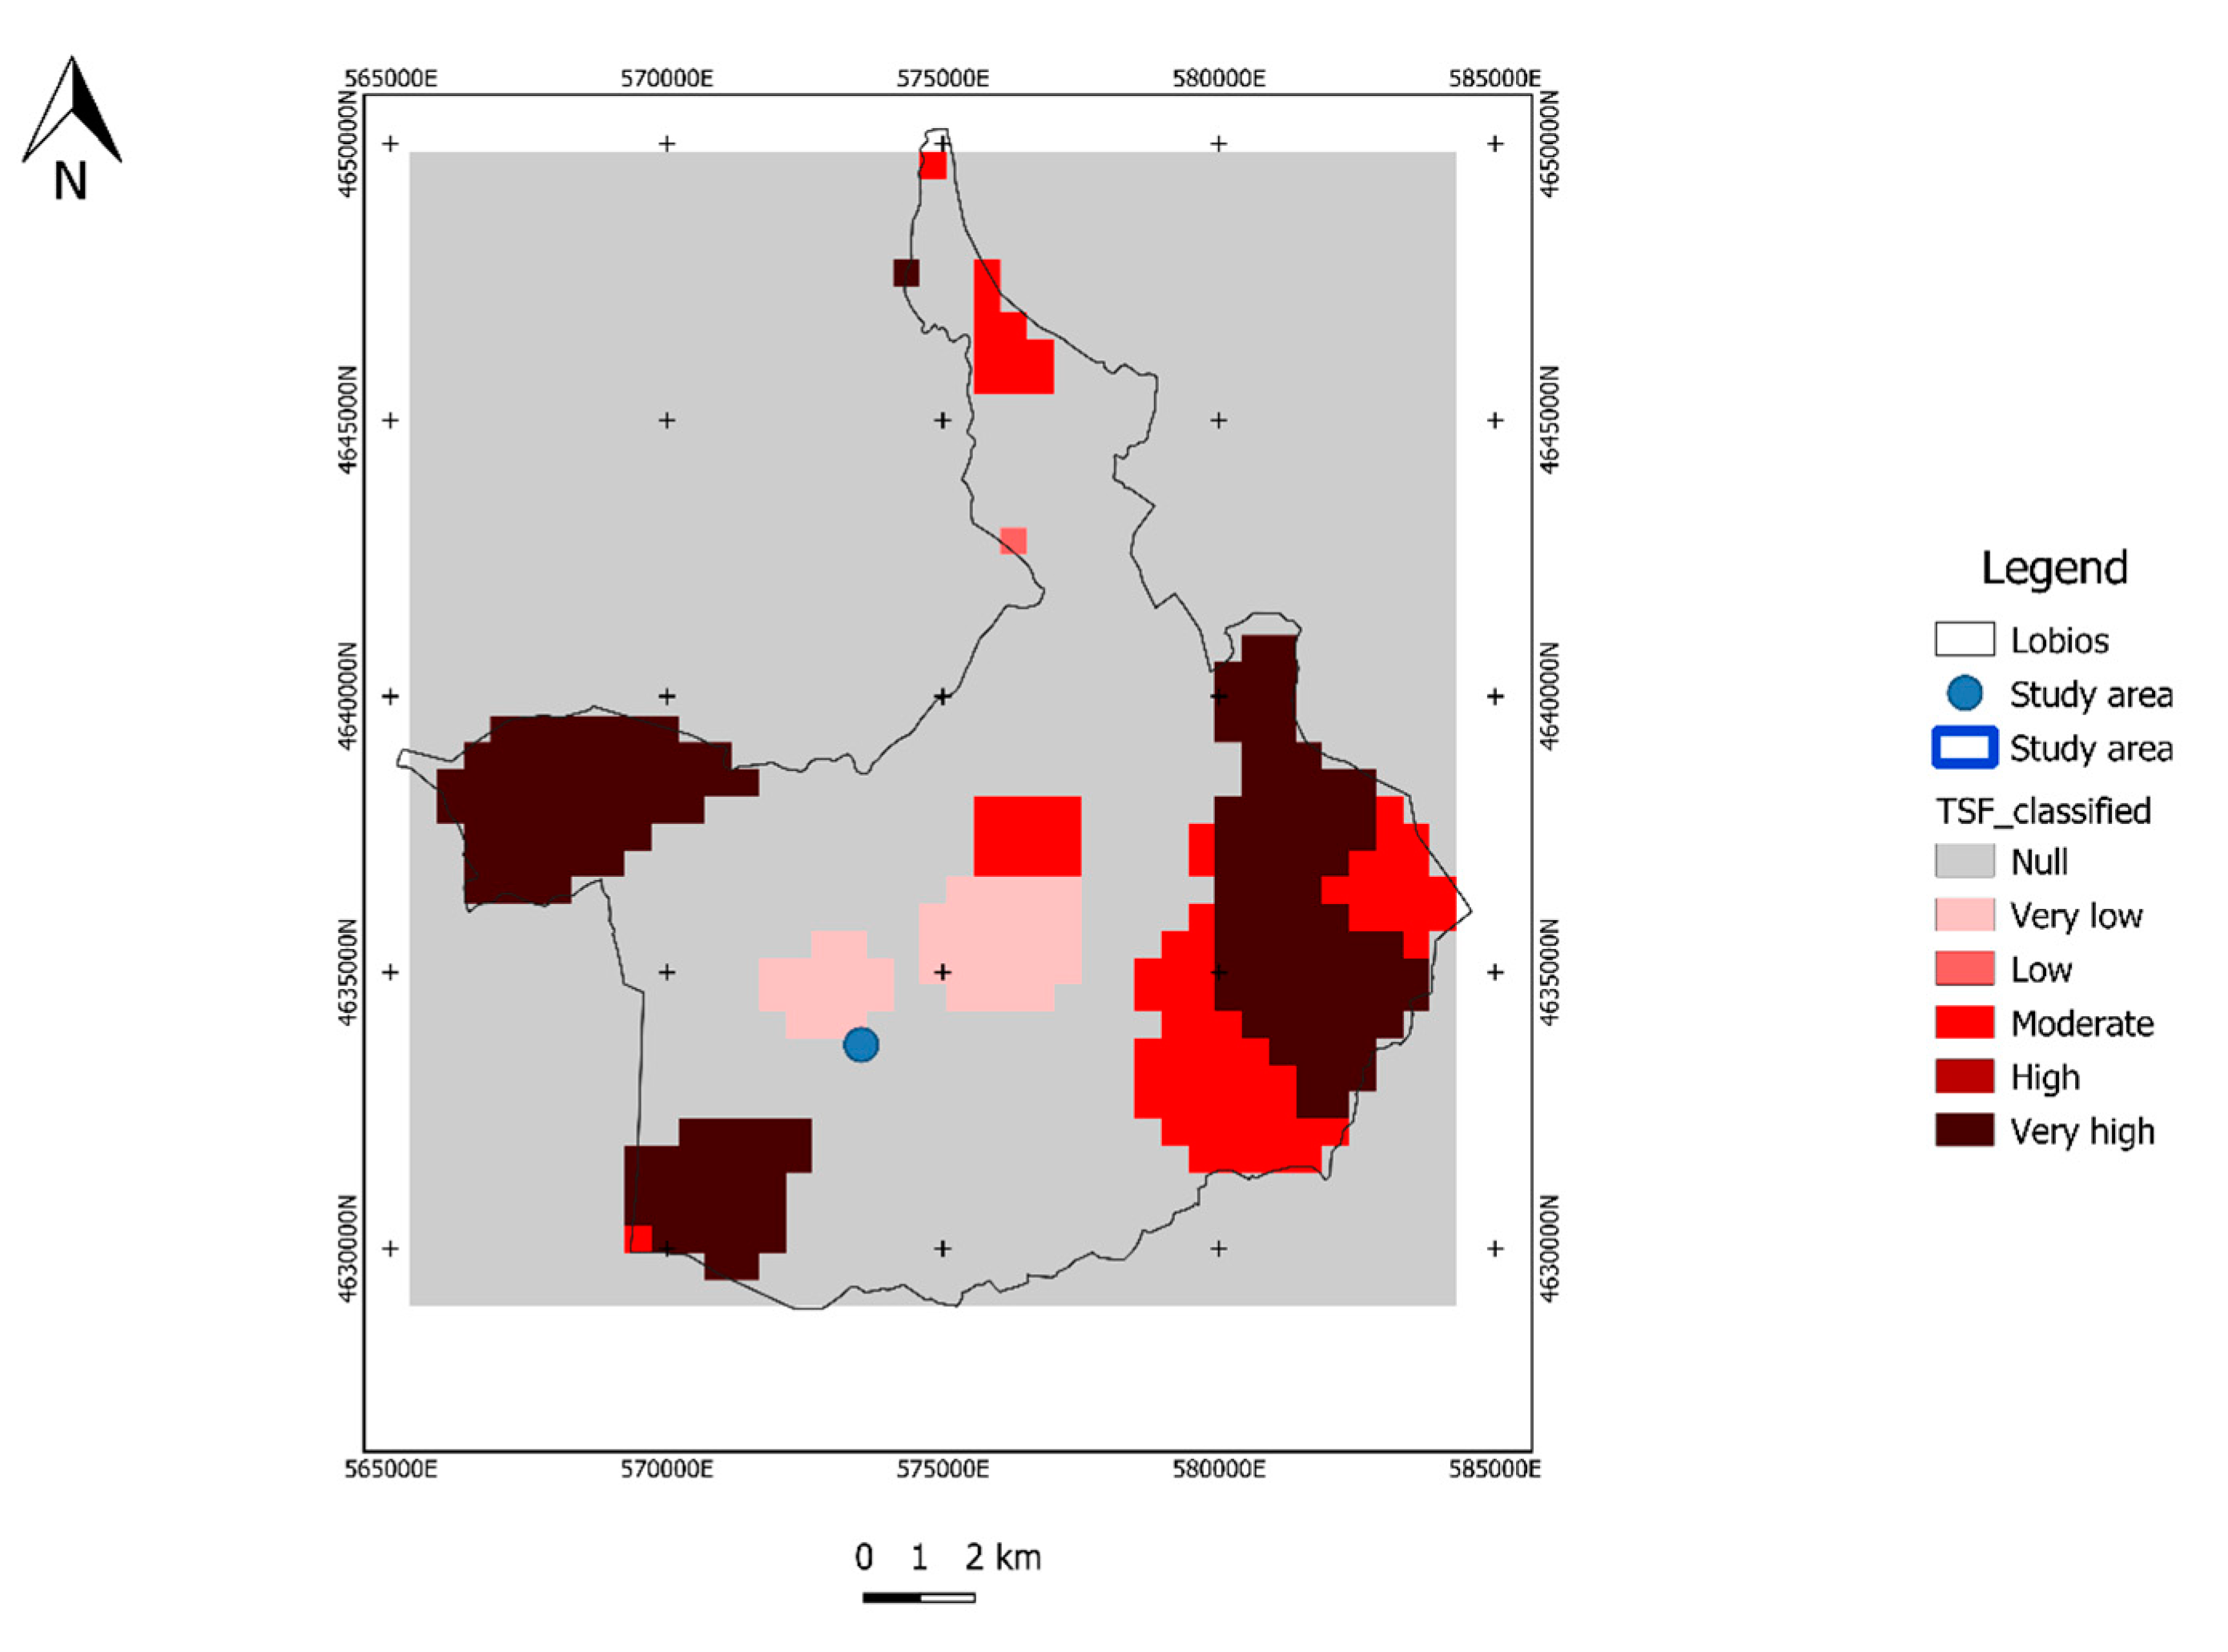
2.3.5. Historical Fire Regimes
2.4. Classification
2.5. Analytic Hierarchy Process (AHP)
3. Results
3.1. Base Layers
3.2. Forest Fire Risk Mapping
4. Discussion
5. Conclusions
Author Contributions
Funding
Acknowledgments
Conflicts of Interest
References
- Gobierno de España Ministerio de Agricultura, Pesca y Educacion. Available online: https://www.mapa.gob.es/es/desarrollo-rural/estadisticas/Incendios_default.aspx (accessed on 22 July 2020).
- Ricotta, C.; Bajocco, S.; Guglietta, D.; Conedera, M. Assessing the influence of roads on fire ignition: Does land cover matter? Fire 2018, 1, 24. [Google Scholar] [CrossRef]
- Ganteaume, A.; Camia, A.; Jappiot, M.; San-Miguel-Ayanz, J.; Long-Fournel, M.; Lampin, C. A review of the main driving factors of forest fire ignition over Europe. Environ. Manag. 2013, 51, 651–662. [Google Scholar] [CrossRef] [PubMed]
- Molina, J.R.; Lora, A.; Prades, C.; Silva, F.R. Roadside vegetation planning and conservation: New approach to prevent and mitigate wildfires based on fire ignition potential. For. Ecol. Manag. 2019, 444, 163–173. [Google Scholar] [CrossRef]
- de Galicia, X. Ley 3/2007, de 9 de Abril, de Prevención y Defensa Contra los Incendios Forestales de Galicia. Boletin Oficial del Estado 2007, 119, 21377–21394. [Google Scholar]
- Collins, K.M.; Price, O.F.; Penman, T.D. Suppression resource decisions are the dominant influence on containment of Australian forest and grass fires. J. Environ. Manag. 2018, 228, 373–382. [Google Scholar] [CrossRef]
- Vallejo-Villalta, I.; Rodríguez-Navas, E.; Márquez-Pérez, J. Mapping Forest Fire Risk at a Local Scale—A Case Study in Andalusia (Spain). Environments 2019, 6, 30. [Google Scholar] [CrossRef]
- Carrara, A.; Guzzetti, F. Geographical Information Systems in Assessing Natural Hazards; Springer Science & Business Media: Berlin/Heidelberg, Germany, 2013. [Google Scholar]
- Lin, H.; Liu, X.; Wang, X.; Liu, Y. A fuzzy inference and big data analysis algorithm for the prediction of forest fire based on rechargeable wireless sensor networks. Sustain. Comput. Informatics Syst. 2018, 18, 101–111. [Google Scholar] [CrossRef]
- Šturm, T.; Podobnikar, T. A probability model for long-term forest fire occurrence in the Karst forest management area of Slovenia. Int. J. Wildl. Fire 2017, 26, 399–412. [Google Scholar] [CrossRef]
- Wang, L.; Zhao, Q.; Wen, Z.; Qu, J. RAFFIA: Short-term forest fire danger rating prediction via multiclass logistic regression. Sustainability 2018, 10, 4620. [Google Scholar] [CrossRef]
- Meng, Y.; Deng, Y.; Shi, P. Mapping forest wildfire risk of the world. In World Atlas of Natural Disaster Risk; Springer: Berlin/Heidelberg, Germany, 2015; pp. 261–275. [Google Scholar]
- Modugno, S.; Balzter, H.; Cole, B.; Borrelli, P. Mapping regional patterns of large forest fires in Wildland—Urban Interface areas in Europe. J. Environ. Manag. 2016, 172, 112–126. [Google Scholar] [CrossRef]
- Schoennagel, T.; Balch, J.K.; Brenkert-Smith, H.; Dennison, P.E.; Harvey, B.J.; Krawchuk, M.A.; Mietkiewicz, N.; Morgan, P.; Moritz, M.A.; Rasker, R. Adapt to more wildfire in western North American forests as climate changes. Proc. Natl. Acad. Sci. USA 2017, 114, 4582–4590. [Google Scholar] [CrossRef] [PubMed]
- Yathish, H.; Athira, K.V.; Preethi, K.; Pruthviraj, U.; Shetty, A. A Comparative Analysis of Forest Fire Risk Zone Mapping Methods with Expert Knowledge. J. Indian Soc. Remote Sens. 2019, 47, 2047–2060. [Google Scholar] [CrossRef]
- Eskandari, S.; Chuvieco, E. Fire danger assessment in Iran based on geospatial information. Int. J. Appl. Earth Obs. Geoinf. 2015, 42, 57–64. [Google Scholar] [CrossRef]
- Yakubu, I.; Mireku-Gyimah, D.; Duker, A.A. Review of methods for modelling forest fire risk and hazard. Afr. J. Environ. Sci. Technol. 2015, 9, 155–165. [Google Scholar]
- Rasooli, S.B.; Bonyad, A.E.; Pir Bavaghar, M. Forest fire vulnerability map using remote sensing data, GIS and AHP analysis (Case study: Zarivar Lake surrounding area). Casp. J. Environ. Sci. 2018, 16, 369–377. [Google Scholar]
- Kayet, N.; Chakrabarty, A.; Pathak, K.; Sahoo, S.; Dutta, T.; Hatai, B.K. Comparative analysis of multi-criteria probabilistic FR and AHP models for forest fire risk (FFR) mapping in Melghat Tiger Reserve (MTR) forest. J. For. Res. 2020, 31, 565–579. [Google Scholar] [CrossRef]
- Pandey, K.; Ghosh, S.K. Modeling of parameters for forest fire risk zone mapping. Int. Arch. Photogramm. Remote Sens. Spatial. Inf. Sci. 2018, 5, 299–304. [Google Scholar] [CrossRef]
- Gheshlaghi, H.A. Using GIS to Develop a Model for Forest Fire Risk Mapping. J. Indian Soc. Remote Sens. 2019, 47, 1173–1185. [Google Scholar] [CrossRef]
- Adab, H.; Kanniah, K.D.; Solaimani, K. Modeling forest fire risk in the northeast of Iran using remote sensing and GIS techniques. Nat. Hazards 2013, 65, 1723–1743. [Google Scholar] [CrossRef]
- Abedi Gheshlaghi, H.; Feizizadeh, B.; Blaschke, T. GIS-based forest fire risk mapping using the analytical network process and fuzzy logic. J. Environ. Plan. Manag. 2020, 63, 481–499. [Google Scholar] [CrossRef]
- Varela, V.; Sfetsos, A.; Vlachogiannis, D.; Gounaris, N. Fire Weather Index (FWI) classification for fire danger assessment applied in Greece. Tethys 2018, 15, 31–40. [Google Scholar] [CrossRef]
- Zhang, Y.; Lim, S.; Sharples, J.J. Modelling spatial patterns of wildfire occurrence in South-Eastern Australia. Geomatics Nat. Hazards Risk 2016, 7, 1800–1815. [Google Scholar] [CrossRef]
- Bedia, J.; Herrera, S.; San Martín, D.; Koutsias, N.; Gutiérrez, J.M. Robust projections of Fire Weather Index in the Mediterranean using statistical downscaling. Clim. Chang. 2013, 120, 229–247. [Google Scholar] [CrossRef]
- Dimitrakopoulos, A.P.; Bemmerzouk, A.M.; Mitsopoulos, I.D. Evaluation of the Canadian fire weather index system in an eastern Mediterranean environment. Meteorol. Appl. 2011, 18, 83–93. [Google Scholar] [CrossRef]
- Inan, M.; Bilici, E.; Akay, A.E. Using airborne lidar data for assessment of forest fire fuel load potential. ISPRS Ann. Photogramm. Remote Sens. Spatial. Inf. Sci. 2017, 4, 255–258. [Google Scholar] [CrossRef]
- Huesca, M.; Riaño, D.; Ustin, S.L. Spectral mapping methods applied to LiDAR data: Application to fuel type mapping. Int. J. Appl. Earth Obs. Geoinf. 2019, 74, 159–168. [Google Scholar] [CrossRef]
- Chuvieco, E.; Wagtendonk, J.; Riaño, D.; Yebra, M.; Ustin, S.L. Estimation of fuel conditions for fire danger assessment. In Earth Observation of Wildland Fires in Mediterranean Ecosystems; Springer: Berlin/Heidelberg, Germany, 2009; pp. 83–96. [Google Scholar]
- Chuvieco, E.; Salas, J. Mapping the spatial distribution of forest fire danger using GIS. Int. J. Geogr. Inf. Sci. 1996, 10, 333–345. [Google Scholar] [CrossRef]
- Pradhan, B.; Mohd Dini Hairi, B.S.; Mohamad Arshad, B.A. Forest fire susceptibility and risk mapping using remote sensing and geographical information systems (GIS). Disaster Prev. Manag. 2007, 16, 344–352. [Google Scholar] [CrossRef]
- Chuvieco, E.; Congalton, R.G. Application of remote sensing and geographic information systems to forest fire hazard mapping. Remote Sens. Environ. 1989, 29, 147–159. [Google Scholar] [CrossRef]
- Jaiswal, R.K.; Mukherjee, S.; Raju, K.D.; Saxena, R. Forest fire risk zone mapping from satellite imagery and GIS. Int. J. Appl. Earth Obs. Geoinf. 2002, 4, 1–10. [Google Scholar] [CrossRef]
- Sachdeva, S.; Bhatia, T.; Verma, A.K. GIS-based evolutionary optimized Gradient Boosted Decision Trees for forest fire susceptibility mapping. Nat. Hazards 2018, 92, 1399–1418. [Google Scholar] [CrossRef]
- Eugenio, F.C.; dos Santos, A.R.; Fiedler, N.C.; Ribeiro, G.A.; da Silva, A.G.; dos Santos, Á.B.; Paneto, G.G.; Schettino, V.R. Applying GIS to develop a model for forest fire risk: A case study in Espírito Santo, Brazil. J. Environ. Manag. 2016, 173, 65–71. [Google Scholar] [CrossRef] [PubMed]
- Suryabhagavan, K.V.; Alemu, M.; Balakrishnan, M. GIS-based multi-criteria decision analysis for forest fire susceptibility mapping: A case study in Harenna forest, southwestern Ethiopia. Trop. Ecol. 2016, 57, 33–43. [Google Scholar]
- Deng, O.; Su, G.; Huang, Q.; Li, Y. Forest Fire Risk Mapping Based on Spatial Logistic Model of Northeastern China Forest Zone. In Proceedings of the International Conference on Geo-Informatics in Resource Management and Sustainable Ecosystem, Wuhan, China, 8–10 November 2013; pp. 181–192. [Google Scholar]
- Eskandari, S. A new approach for forest fire risk modeling using fuzzy AHP and GIS in Hyrcanian forests of Iran. Arab. J. Geosci. 2017, 10, 190. [Google Scholar] [CrossRef]
- Gigović, L.; Jakovljević, G.; Sekulović, D.; Regodić, M. GIS Multi-Criteria Analysis for Identifying and Mapping Forest Fire Hazard: Nevesinje, Bosnia and Herzegovina. Teh. Vjesn. 2018, 25, 891–897. [Google Scholar]
- Akay, A.E.; Erdoğan, A. GIS-based multi-criteria decision analysis for forest fire risk mapping. ISPRS Ann. Photogramm. Remote Sens. Spat. Inf. Sci. 2017, 4, 25. [Google Scholar] [CrossRef]
- Pourghasemi, H.R.; Beheshtirad, M.; Pradhan, B. A comparative assessment of prediction capabilities of modified analytical hierarchy process (M-AHP) and Mamdani fuzzy logic models using Netcad-GIS for forest fire susceptibility mapping. Geomat. Nat. Hazards Risk 2016, 7, 861–885. [Google Scholar] [CrossRef]
- Ghorbanzadeh, O.; Feizizadeh, B.; Blaschke, T. Multi-criteria risk evaluation by integrating an analytical network process approach into GIS-based sensitivity and uncertainty analyses. Geomat. Nat. Hazards Risk 2018, 9, 127–151. [Google Scholar] [CrossRef]
- Dutta, R.; Das, A.; Aryal, J. Big data integration shows Australian bush-fire frequency is increasing significantly. R. Soc. Open Sci. 2020, 3, 150241. [Google Scholar] [CrossRef]
- Kim, S.J.; Lim, C.H.; Kim, G.S.; Lee, J.; Geiger, T.; Rahmati, O.; Son, Y.; Lee, W.K. Multi-temporal analysis of forest fire probability using socio-economic and environmental variables. Remote Sens. 2019, 11, 86. [Google Scholar] [CrossRef]
- Pascual, C.; García-Abril, A.; García-Montero, L.G.; Martín-Fernández, S.; Cohen, W.B. Object-based semi-automatic approach for forest structure characterization using lidar data in heterogeneous Pinus sylvestris stands. For. Ecol. Manag. 2008, 255, 3677–3685. [Google Scholar] [CrossRef]
- Vadrevu, K.P.; Eaturu, A.; Badarinath, K. Fire risk evaluation using multicriteria analysis—A case study. Environ. Monit. Assess. 2010, 166, 223–239. [Google Scholar] [CrossRef] [PubMed]
- Tucker, C.J. Red and photographic infrared linear combinations for monitoring vegetation. Remote Sens. Environ. 1979, 8, 127–150. [Google Scholar] [CrossRef]
- Phoenix LiDAR Systems. Available online: https://www.phoenixlidar.com/ (accessed on 7 July 2020).
- QGIS. Available online: https://www.qgis.org/es/site/ (accessed on 17 June 2020).
- CNIG Centro Nacional de Información Geográfica 2019. Available online: https://www.cnig.es/home (accessed on 25 May 2020).
- European Comission. Management Techniques for Optimization of Suppression and Minimization of Wildfire Effects. System Validation; European Comission: Brussels, Belgium, 1999. [Google Scholar]
- Albini, F.A. Estimating Wildfire Behavior and Effects; Intermountain Forest and Range: Washington, DC, USA, 1976. [Google Scholar]
- Ruchay, A.N.; Dorofeev, K.A.; Kalschikov, V.V. Accuracy analysis of 3D object reconstruction using point cloud filtering algorithms. In Proceedings of the 5th International Conference on Information Technology and Nanotechnology 2019: Image Processing and Earth Remote Sensing, ITNT 2019, Samara, Russia, 21–24 May 2019; pp. 169–174. [Google Scholar]
- Novo, A.; Fariñas-Álvarez, N.; Martínez-Sánchez, J.; González-Jorge, H.; Lorenzo, H. Automatic Processing of Aerial LiDAR Data to Detect Vegetation Continuity in the Surroundings of Roads. Remote Sens. 2020, 12, 1677. [Google Scholar] [CrossRef]
- Price, O.F.; Gordon, C.E. The potential for LiDAR technology to map fire fuel hazard over large areas of Australian forest. J. Environ. Manag. 2016, 181, 663–673. [Google Scholar] [CrossRef]
- Rouse, J.W.; Haas, R.H.; Schell, J.A.; Deering, D.W. Monitoring vegetation systems in the great plains with ERTS, Paper A 20. In Proceedings of the Third Earth Resources Technology Satellite-1 Symposium, Washington, DC, USA, 10–14 December 1973; p. 309. [Google Scholar]
- Van Wagner, C.E. Equations and FORTRAN Program for the Canadian Forest Fire Weather Index System; Service Canadien des Forests, Gouvernement du Canada: Ottawa, ON, Canada, 1985. [Google Scholar]
- Meteogalicia. La Unidade de Observación e Predición Meteorolóxica de la Consellaría de Medio Ambiente, Territorio e Vivenda de la Xunta de Galicia, Comúnmente Conocida como MeteoGalicia, es un Organismo Público Creado en el año 2000 con el Objetivo de Operar y Mantener. Available online: https://www.meteogalicia.gal/web/initio.action (accessed on 22 April 2020).
- Avila-Flores, D.; Pompa-Garcia, M.; Antonio-Nemiga, X.; Rodriguez-Trejo, D.A.; Vargas-Perez, E.; Santillan-Perez, J. Driving factors for forest fire occurrence in Durango State of Mexico: A geospatial perspective. Chinese Geogr. Sci. 2010, 20, 491–497. [Google Scholar] [CrossRef]
- Regos, A. Cartografía de áreas queimadas en Galicia no século XXI: Presentación do produto e aplicación web mapping. NACC. Biol. 2018, 25, 45–53. [Google Scholar]
- Cartografía de Incendios Forestais en Galicia. Available online: https://www.arcgis.com/apps/MapSeries/index.html?appid=c66a1997501a441da3d31f6d8e5b5603 (accessed on 6 April 2020).
- Rasooli, S.B.; Bonyad, A.E. Evaluating the efficiency of the Dong model in determining fire vulnerability in Iran’s Zagros forests. J. For. Res. 2019, 30, 1447–1458. [Google Scholar] [CrossRef]
- Ghorbanzadeh, O.; Blaschke, T.; Gholamnia, K.; Aryal, J. Forest fire susceptibility and risk mapping using social/infrastructural vulnerability and environmental variables. Fire 2019, 2, 50. [Google Scholar] [CrossRef]
- Saaty, T.L.; Vargas, L.G. Models, Methods, Concepts & Applications of the Analytic Hierarchy Process; Springer Science & Business Media: Berlin/Heidelberg, Germany, 2012. [Google Scholar]
- Malczewski, J.; Rinner, C. Multicriteria Decision Analysis in Geographic Information Science; Springer: Berlin/Heidelberg, Germany, 2015. [Google Scholar]
- Giglio, L.; van der Werf, G.R.; Randerson, J.T.; Collatz, G.J.; Kasibhatla, P. Global estimation of burned area using MODIS active fire observations. Atmos. Chem. Phys. 2006, 6, 957–974. [Google Scholar] [CrossRef]


| Fuel Model Type | Presence (%) | Height (m) |
|---|---|---|
| Fuel model 1 | >60% grass | ≤0.4 m |
| Fuel model 2 | >60% shrubs and ≤50% trees | ≤0.6 m |
| Fuel model 3 | >60% shrubs and ≤50% trees | ≤2.0 m |
| Fuel model 4 | >60% shrubs and ≤50% trees | ≤4.0 m |
| Fuel model 5 | ≤30% shrubs and >50% trees | ≤4.0 m |
| Fuel model 6 | >30% shrubs and >50% trees | (h shrubs—h trees) >0.5m |
| Fuel model 7 | >30% shrubs and >50% trees | (h shrubs—h trees) ≤0.5m |
| Variables | Classes | Values | Relating Classes | |
|---|---|---|---|---|
| Topography | Elevation (m) | >800 | 1 | Very low |
| 600–800 | 2 | Low | ||
| 400–600 | 3 | Moderate | ||
| 200–400 | 4 | High | ||
| ≤200 | 5 | Very high | ||
| Aspect | South | 5 | Very high | |
| West | 3 | Moderate | ||
| East | 3 | Moderate | ||
| North | 1 | Very low | ||
| Flat | 1 | Very low | ||
| Northeast | 2 | Low | ||
| Northwest | 2 | Low | ||
| Southeast | 4 | High | ||
| Southwest | 5 | Very high | ||
| Slope (°) | >35 | 5 | Very high | |
| 25–35 | 4 | High | ||
| 15–25 | 3 | Moderate | ||
| 5–15 | 2 | Low | ||
| ≤5 | 1 | Very low | ||
| Vegetation | NDVI | >0.67 | 1 | Very low |
| 0.54–0.67 | 2 | Low | ||
| 0.40–0.54 | 3 | Moderate | ||
| 0.27–0.40 | 4 | High | ||
| ≤0.27 | 5 | Very high | ||
| Fuel type model | Fuel model 1 | 3 | Moderate | |
| Fuel model 2 | 1 | Very low | ||
| Fuel model 3 | 4 | High | ||
| Fuel model 4 | 5 | Very high | ||
| Fuel model 5 | 3 | Moderate | ||
| Fuel model 6 | 4 | High | ||
| Fuel model 7 | 5 | Very high | ||
| Meteorological | FWI | >28 | 5 | Very high |
| 23–28 | 4 | High | ||
| 13–23 | 3 | Moderate | ||
| 3–13 | 2 | Low | ||
| ≤3 | 1 | Very low | ||
| Anthropogenic issues | Road distance (m) | >1200 | 1 | Very low |
| 1200 | 2 | Low | ||
| 900 | 3 | Moderate | ||
| 600 | 4 | High | ||
| 300 | 5 | Very high | ||
| Settlement distance (m) | >2000 | 1 | Very low | |
| 2000 | 2 | Low | ||
| 1500 | 3 | Moderate | ||
| 1000 | 4 | High | ||
| 500 | 5 | Very high | ||
| Historical fires | Fire regimes (TSF-FR) | Fire regime 1 | 1 | Very Low |
| Fire regime 2 | 2 | Low | ||
| Fire regime 3 | 3 | Moderate | ||
| Fire regime 4 | 4 | High | ||
| Fire regime 5 | 5 | Very high |
| Variables | Study Area A | Study Area B |
|---|---|---|
| Temperature (°C) | 30.3 | 29.9 |
| Temperature previous day (°C) | 28.2 | 26.6 |
| Relative humidity (%) | 47.0 | 42.6 |
| Relative humidity previous day (%) | 56.4 | 58.0 |
| Absolute pressure (hPa) | 960.4 | 966.6 |
| Wind speed (km/h) | 11.1 | 9.5 |
| Wind direction (°) | 106.9 | 139.7 |
| Instantaneous rainfall (mm) | 0 | 0 |
| FFMC | 89.09 | 89.71 |
| ISI | 6.58 | 6.64 |
| DMC | 10.03 | 10.31 |
| DC | 21.40 | 21.33 |
| BUI | 9.96 | 10.22 |
| Fire Year | Burnt Area (ha) | Recurrence Year |
|---|---|---|
| 2001 | 1.717 | - |
| 2004 | 211 | - |
| 2005 | 362 | - |
| 2006 | 116 | - |
| 2007 | 16.04 | 2001, 2004 |
| 2009 | 292 | 2001, 2004, 2007 |
| 2010 | 524 | 2001 |
| 2011 | 3.108 | 2001, 2005, 2006 |
| 2016 | 1.276 | 2004 |
| 2017 | 2.672 | 2001, 2006, 2010, 2011 |
| Criteria | Criteria | Wi | ||
|---|---|---|---|---|
| Anthropogenic issues | Distance from roads | Distance from settlements | ||
| Distance from roads | 1 | 3 | 0.750 | |
| Distance from settlements | 1/3 | 1 | 0.250 | |
| Criteria: vegetation | NDVI | Fuel model type | Wi | |
| NDVI | 1 | 1/3 | 0.250 | |
| Fuel model type | 3 | 1 | 0.750 | |
| Criteria: topography | Aspect | Slope | Elevation | Wi |
| Aspect | 1 | 2 | 3 | 0.539 |
| Slope | 1/2 | 1 | 2 | 0.297 |
| Elevation | 1/3 | 1/2 | 1 | 0.164 |
| Vegetation | Topography | FWI | Socioeconomics | Fire Historical | Wi | |
|---|---|---|---|---|---|---|
| Vegetation | 1 | 3 | 2 | 2 | 5 | 0.359 |
| Topography | 1/3 | 1 | 1/3 | 1/3 | 3 | 0.108 |
| FWI | 1/2 | 3 | 1 | 3 | 5 | 0.298 |
| Anthropogenic issues | 1/2 | 3 | 1/3 | 1 | 3 | 0.180 |
| Fire historical | 1/5 | 1/3 | 1/5 | 1/3 | 1 | 0.055 |
Publisher’s Note: MDPI stays neutral with regard to jurisdictional claims in published maps and institutional affiliations. |
© 2020 by the authors. Licensee MDPI, Basel, Switzerland. This article is an open access article distributed under the terms and conditions of the Creative Commons Attribution (CC BY) license (http://creativecommons.org/licenses/by/4.0/).
Share and Cite
Novo, A.; Fariñas-Álvarez, N.; Martínez-Sánchez, J.; González-Jorge, H.; Fernández-Alonso, J.M.; Lorenzo, H. Mapping Forest Fire Risk—A Case Study in Galicia (Spain). Remote Sens. 2020, 12, 3705. https://doi.org/10.3390/rs12223705
Novo A, Fariñas-Álvarez N, Martínez-Sánchez J, González-Jorge H, Fernández-Alonso JM, Lorenzo H. Mapping Forest Fire Risk—A Case Study in Galicia (Spain). Remote Sensing. 2020; 12(22):3705. https://doi.org/10.3390/rs12223705
Chicago/Turabian StyleNovo, Ana, Noelia Fariñas-Álvarez, Joaquín Martínez-Sánchez, Higinio González-Jorge, José María Fernández-Alonso, and Henrique Lorenzo. 2020. "Mapping Forest Fire Risk—A Case Study in Galicia (Spain)" Remote Sensing 12, no. 22: 3705. https://doi.org/10.3390/rs12223705
APA StyleNovo, A., Fariñas-Álvarez, N., Martínez-Sánchez, J., González-Jorge, H., Fernández-Alonso, J. M., & Lorenzo, H. (2020). Mapping Forest Fire Risk—A Case Study in Galicia (Spain). Remote Sensing, 12(22), 3705. https://doi.org/10.3390/rs12223705