Article

Monitoring Wheat Leaf Rust and Stripe Rust in Winter Wheat Using High-Resolution UAV-Based Red-Green-Blue Imagery

1
TERRA Teaching and Research Centre, Gembloux Agro-Bio Tech, University of Liège, 5030 Gembloux, Belgium
2
Department of Environmental Sciences and Management, University of Liège, 6700 Arlon, Belgium
3
Centre for Applied Climate Sciences, University of Southern Queensland, West Street, Toowoomba, QLD 4350, Australia
4
Luxembourg Institute of Science and Technology, 41 Rue du Brill, L-4422 Belvaux, Luxembourg
*
Author to whom correspondence should be addressed.
Remote Sens. 2020, 12(22), 3696; https://doi.org/10.3390/rs12223696
Submission received: 28 September 2020 / Revised: 25 October 2020 / Accepted: 7 November 2020 / Published: 11 November 2020
(This article belongs to the Special Issue Remote and Proximal Sensing for Precision Agriculture and Viticulture)

Abstract

:
During the past decade, imagery data acquired from unmanned aerial vehicles (UAVs), thanks to their high spatial, spectral, and temporal resolutions, have attracted increasing attention for discriminating healthy from diseased plants and monitoring the progress of such plant diseases in fields. Despite the well-documented usage of UAV-based hyperspectral remote sensing for discriminating healthy and diseased plant areas, employing red-green-blue (RGB) imagery for a similar purpose has yet to be fully investigated. This study aims at evaluating UAV-based RGB imagery to discriminate healthy plants from those infected by stripe and wheat leaf rusts in winter wheat (Triticum aestivum L.), with a focus on implementing an expert system to assist growers in improved disease management. RGB images were acquired at four representative wheat-producing sites in the Grand Duchy of Luxembourg. Diseased leaf areas were determined based on the digital numbers (DNs) of green and red spectral bands for wheat stripe rust (WSR), and the combination of DNs of green, red, and blue spectral bands for wheat leaf rust (WLR). WSR and WLR caused alterations in the typical reflectance spectra of wheat plants between the green and red spectral channels. Overall, good agreements between UAV-based estimates and observations were found for canopy cover, WSR, and WLR severities, with statistically significant correlations (p-value (Kendall) < 0.0001). Correlation coefficients were 0.92, 0.96, and 0.86 for WSR severity, WLR severity, and canopy cover, respectively. While the estimation of canopy cover was most often less accurate (correlation coefficients < 0.20), WSR and WLR infected leaf areas were identified satisfactorily using the RGB imagery-derived indices during the critical period (i.e., stem elongation and booting stages) for efficacious fungicide application, while disease severities were also quantified accurately over the same period. Using such a UAV-based RGB imagery method for monitoring fungal foliar diseases throughout the cropping season can help to identify any new disease outbreak and efficaciously control its spread.

Graphical Abstract

1. Introduction

Wheat is among the most cultivated cereal worldwide, accounting for about 28% (732.4 million tons) of the global cereal production in 2018/2019 for a total estimated area of 215 million hectares [1,2]. Wheat leaf rust (WLR, caused by Puccinia triticina Eriks) and stripe rust (WSR, caused by P. striiformis f. sp. tritici) are among the most widespread and important fungal diseases which can cause substantial production and economic losses in wheat if uncontrolled [3,4,5,6,7,8,9]. In the Grand-Duchy of Luxembourg (GDL), protection against wheat rust epidemics largely relies growing resistant cultivars and timely fungicide applications (i.e., before the appearance of severe symptoms that cause higher monetary losses at the farm level compared with the costs of a fungicide spray) [7]. Enabling site-specific disease control can be achieved using decision support tools integrating disease risk models, which often rely on non-destructive disease detection and quantification [5,7,10]. Identifying a disease correctly under field conditions when it first appears, as well as during its progress, is crucial to efficient disease management [11].
Visual assessment of disease severity (area of plant tissue affected by the disease on a leaf or on the entire plant canopy) is often prone to subjectivity [12,13], is time-consuming and labor intensive. With the continuing advances in automated phenotyping systems through sophisticated sensors, high-throughput phenotyping platforms (e.g. unmanned aerial vehicle (UAV) technology, tractor-mounted equipment, field robots), and advanced data analytics, the automatic identification, classification (healthy versus diseased) and quantification of symptoms of plant diseases have the potential to address such hurdles [11,14,15,16,17,18,19]. However, such image-based disease identification and quantification is not always straightforward because of the potential changes in spectral response of diseased leaves. For instance, infections by pathogens result in necrotic or chlorotic lesions, which in turn lessen the chlorophyll content response in the visible (VIS) and red-edge regions of the spectrum (550 nm; 650–720 nm) [20]. Likewise, browning effects related to the senescence of infected plant tissues affect the VIS and near-infrared (NIR) (680–800 nm), as well as the short-wave infrared (SWIR) regions (1400–1600 nm and 1900–2100 nm) [21]. Other factors impacting on the efficiency of image-based disease identification and classification include prevailing weather conditions at the time of image acquisition, the disease symptom variations over time and between cultivars, complexity of foliage, non-uniform backgrounds, and changes in leaves reflectance due to nutrient stresses [14,17,22,23].
Various imaging and spectroscopic techniques, with different levels of complexity and data requirement, have been explored for detecting plant diseases under field conditions and monitor their progress (e.g., [14,15,17,19,21,23,24,25,26,27]). For instance, variations in spectral reflectance between healthy and diseased wheat plants were observed using spectrograph mounted at spray boom level at an early stage in the development of WSR with an accuracy of more than 90% [14]. Mahlein et al. [28] developed hyperspectral-based vegetation indices (involving the 450 nm to 950 nm wavelengths) for detecting sugar beet leaves infected by Cercospora leaf spot, sugar beet rust, and powdery mildew. A step-wise discriminate analysis showed hyperspectral-based vegetation indices such as plant senescence index (PSRI), pigment-specific simple ratio (PSSRb), and red-edge position are effective indices in monitoring rice bacterial leaf blight [29]. Photochemical reflectance index (PRI), derived from hyperspectral airborne images, exhibited a strong relationship (R2 in the order of 0.9) with WSR development in winter wheat (Triticum aestivum L.) [23]. Normalized difference vegetation index (NDVI), ratio vegetation index (RVI), and optimized soil adjusted vegetation index (OSAVI), were identified as strong vegetation indices in discriminating between healthy and yellow rust infected wheat plants through UAV-based multispectral imagery [21]. The robustness of using multispectral UAV-based OSAVI to differentiate healthy and WSR infected wheat plants in Belgium was demonstrated in a recent study [30]. The authors also denoted the potential for UAV-based RGB images to effectively help monitoring winter wheat crop health in combination with principal component analysis [30].
The researches listed above have all investigated the usage of hyperspectral and multispectral remotely sensed data for plant disease monitoring. Despite the increasing use of UAV-based hyperspectral and multispectral analyses over the past two decades for discriminating between healthy and diseased plant areas [19], employing UAV-based red-green-blue (RGB) imagery for a similar purpose has yet to be fully investigated. High-resolution RGB sensors mounted on UAV platforms can provide valuable information on crop performance and its health at the canopy level [30,31]. Moreover, the impacts associated with phenological crop growth stages on monitoring crop disease, as raised by Huang et al. [23], using remotely sensed derived information remains elusive. The objective of this study was to investigate the use of high-resolution UAV-based RGB imagery for discriminating healthy plant tissue from infected tissue by WLR and WSR in winter wheat, with an overarching goal of implementing an expert system to assist growers in improved disease management. Using such a method for monitoring plant diseases throughout the cropping season would help to identify any new disease outbreak in winter wheat fields and efficaciously control its spread.

2. Materials and Methods

2.1. Study Area and Disease Monitoring

Experiments were carried out in commercial winter wheat fields at four locations (Bettendorf, Bicherhaff, Koerich, and Weiswampach; Figure 1) in the GDL during the 2018–2019 cropping season. These sites were chosen as part of a large in-season disease monitoring program carried out in the GDL since 2004 [7,32]. Wheat was typically sown around mid-October at the majority of the sites (Table 1), while the sowing occurred during the last week of October only at Bettendorf. Crop management (sowing and harvest methods, fertilization and weed control) at the selected sites reflected the common wheat production practices in the GDL [7,32]. Agronomic details of the trials are presented (Table 1). The experimental design was a complete randomized block with four replicates (one replicate plot = 12 m2). Each fully randomized replicate block consisted of fungicide treated and non-treated (control) plots. The fungicide treatments included a single decision support system-based treatment (T1) [7], as well as a double (T2) and a triple (T3) spray treatment. The fungicides applied (Table 1) were commercially available and applied according to the manufacturer’s and official recommendations. All plots received 40–70 kg N ha−1 in form of ammonium nitrate at growth stage (GS) 25 [7], followed by 60–70 kg N ha−1 at GS32, and a final application of 65–95 kg N ha−1 at GS59.
WLR and WSR epidemics were monitored weekly between April and July 2019. Disease incidence (proportion of plants with disease symptoms) and severity (percent leaf area diseased) were assessed on the same 10 plants in each plot (40 plants in total per cultivar and per site) throughout the monitoring period. These 40 plants were randomly selected and marked at the start of the monitoring. Disease assessments were carried out in control (i.e., no fungicide applied) and fungicide-treated plots. Personnel were trained prior to disease assessments using standard area diagrams [33] and disease assessment software (DISTRAIN; [34]). Care was also taken to ensure the same rater assessed the same replicate during each of the monitoring weeks.

2.2. High-Resolution UAV Imagery

High-resolution images were acquired over the experimental plots at four representative Luxembourgish wheat-producing locations (Figure 1). UAV flights were executed under ambient lighting conditions on four different dates (Table 2) using the RGB sensor of DJI Phantom 4 Pro (DJI, Nanshan, Shenzhen, China). The UAV was flown at 10 m altitude above ground level (AGL) at nadir with a field of view (FOV) of 84°. The airspeed was set at 4 m s−1, with 85% front and 75% side image overlaps, resulting in a ground sampling distance (GSD) of 0.28 cm. Flight missions were planned using the Pix4D capture software (Pix4D S.A., Lausanne, Switzerland).
All UAV-based images were processed using the Pix4Dmapper photogrammetric software (Pix4D S.A., Lausanne, Switzerland). They were projected onto the WGS 1984 UTM Zone 32N geographic coordinate system in GeoTIFF format. Since there was no ground control point (GCP) across the study sites, the image-to-image registration tool was used in Quantum GIS software (QGIS, Open Source Geospatial Foundation, Chicago, IL, USA) to allow for time-series analyses at the pixel-to-pixel level.

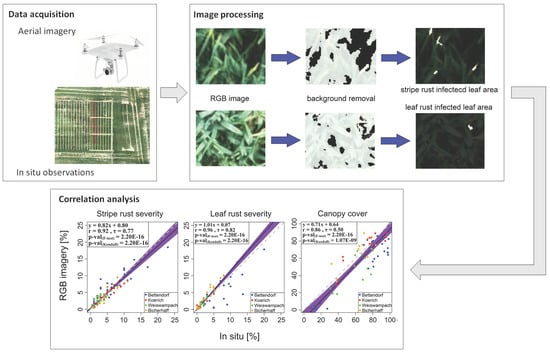
2.3. UAV-Based Estimation of Canopy Cover, Wheat Stripe Rust and Leaf Rust Severities

Canopy cover values were estimated following [31]:
α = DNgreen − DNblue and β = DNgreen − DNred
where DNgreen, DNblue, and DNred are the digital numbers (DNs) of the green, blue, and red channels of the visible spectrum, respectively.
Threshold values greater than 20 for both α and β allowed for a better characterization of canopy cover when visually comparing the preliminary estimates to corresponding RGB images. This threshold value was in line with previously reported finding [31].
We used a visual cryptography technique [36] to differentiate leaf areas diseased by WSR and WLR. The soil background effect was removed beforehand by applying the computed vegetation mask (Equation (1)) to RGB images (Figure 2). We hypothesized that the combination of the primary color components red, green, and blue could generate desired color codes, for example, in either additive or subtractive models. The elucidation of the mechanism underlying this color composite generation was previously addressed by Hou [36]. By mixing the red and green components with equal intensity in the additive model, the yellow color can be attained. Thus, the percentage of WSR severity was computed based on the additive combination of the red and green channels of the high-resolution RGB images as follows:
SRI = [(DNred + DNgreen)] > α
where SRI is the stripe rust index and DNgreen and DNred are the digital numbers (DNs) of the green and red spectral channels, corresponding to the yellow color. The outcome of the SRI was a virtual raster image with pixel values ranging from 0 DN to 500 DN. A visual inspection process was performed by comparing the preliminary SRI thresholding estimates to the corresponding RGB images. The boundaries of WSR-infected leaf areas detected based on SRI were first extracted. Likewise, the boundaries of the same WSR-infected leaf areas were extracted through the visual interpretation of original RGB images. Then, the two boundaries were overlaid in QGIS to compute the difference area. A threshold value of α = 400 was chosen since it provided the minimum difference area of WSR detected boundaries between the SRI thresholding and the original RGB images.
The percentage of WLR was estimated using the leaf rust index (LRI). LRI was calculated as a ratio between the dark brown and light brown color codes (Equation (3)). The dark brown color code was obtained by subtracting the red component from the green with double intensity on green. For the light brown color code, an additive combination of red and green components with double intensity was first calculated. Then, the blue component was subtracted from the resulting sum.
LRI = [(2 × DNgreen – DNred)/(2 × DNred + 2 × DNgreen – DNblue)] < α
where DNblue is the digital number (DN) of blue spectral channel. The outcome of the LRI was a virtual raster image with pixel values ranging from 0 DN to 1 DN. A visual inspection process similar to that applied for the SRI was carried out to find the best thresholding LRI result. A threshold value of α = 0.3 was selected in the study because it provided the minimum difference area of WLR detected boundaries between the LRI thresholding and the original RGB images.

2.4. Evaluating the RGB-Derived Indices Using Independent Datasets

The approach used to estimate WSR and WLR severities based on RGB imagery was further evaluated using slightly coarser spatial resolution RGB and multispectral data collected in a winter wheat field in central Belgium during the 2018–2019 cropping season. Winter wheat was sown in Luvisol soil type, characterized by century-old biochar patches, on 6 December 2018, with homogenous crop management practices across the field. A description of the management practices and environmental conditions during the 2018-2019 cropping season can be found in [30,31]. Higher spatial resolution could increase the image-classification accuracy of UAV collected datasets [37]. RGB images were captured using the same DJI Phantom 4 Pro. Multispectral images were collected using a MicaSense RedEdge-M camera (MicaSense, Seattle, WA, USA), mounted on a DJI Matrice 100. MicaSense RedEdge-M consists of five distinct imaging sensors in the Blue (465–485 nm), Green (550–570 nm), Red (663–673 nm), Red-edge (712–722 nm) and NIR (820–860 nm). The multispectral camera was equipped with a downwelling light sensor and a calibrated reflectance panel was captured before and after the flight for the radiometric processing in Pix4D mapper. UAVs were flown following the similar flight characteristics as described in Section 2.2. The only difference was the flying altitude, which was set at an AGL of 60 m and 65 m for RGB and multispectral flights, respectively. This setting resulted in coarser spatial resolutions with GSD of 1.8 cm and 3.7 cm for RGB and multispectral images, respectively.
WSR and WLR severities were computed based on the SRI (Equation (2)) and LRI (Equation (3)) from the RGB images. For each of disease, 20 random wheat samples (consisting of a 2 × 2 window of pixels in order to avoid the plausible uncertainty in the selection of one unique vegetation pixel) from the RGB images and presenting the disease symptoms were selected across the study site. Likewise, 20 random healthy wheat samples (2 × 2 window of pixels) were selected from pixels which did not present any disease symptoms. The multispectral reflectance spectra for healthy and WLR or WSR infected leaf areas were generated for the same wheat samples.
By conducting this effort, we investigated the plausible alterations in reflectance spectra as a consequence of WSR and WLR in comparison to the typical reflectance spectra for healthy wheat plants, which may improve the understanding of spectral responses to WSR and WLR through high-resolution remotely sensed images.

2.5. Data Analyses

For a given replicate (plot size = 12 m2), the observed disease severities for the 10 selected plants were averaged to represent the overall percentage disease severity. Such averaging method was based on previously reported methodologies [38,39]. To compare the UAV-derived diseased leaf areas against observed values throughout the cropping season, for growth stages between GS29-30 (stem elongation) and GS59 (ear emergence), we assumed that the area of all leaves (F−4 to F, F being the flag leaf) were visible from the top. That is, the uppermost leaves were fully visible and bottom leaf layers were visible between 50 to 90% of their total leaf area. Hence, the average diseased leaf area for all those leaves was considered to represent that of the whole plant. From GS59 onwards, with the cover of the three uppermost leaves (F-2 to F) being dominant (i.e., they were fully developed, and the image captured by the UAV reflected their combined area), the diseased leaf area was calculated as the average of these three leaves.
Comparisons between the observed and UAV-derived values were evaluated through correlation tests, with statistical significances being assessed using the non-parametric Kendall’s rank correlation tau (τ) test [40]. We also analyzed the relationships between the observed and UAV-derived values between the different crop growth stages since such results could help with highlighting the growth stages where the discrimination between healthy and diseased leaf areas is challenging.
We further investigated whether there was a difference in canopy surface temperature between healthy and diseased leaves. Analyses of thermal images were performed on the pure winter wheat pixels without the soil background effect. After removing the soil background effect, Equations (2) and (3) were applied to the thermal orthomosaics in order to retrieve the canopy surface temperature for WSR and WLR diseased plants, respectively. All data analyses were carried out using R [41].

3. Results and Discussion

3.1. Disease Levels During the 2018–2019 Cropping Season

First symptoms of WSR appeared early in the winter on Kerubino given the mild temperatures recorded in January 2019. During April and May 2019 favorable weather conditions were conducive to noticeable WSR disease levels on this cultivar in Bicherhaff, Koerich, and Bettendorf (Figure 3). In Weiswampach, however, traces of WSR were only recorded at the end of the season. WLR and WSR disease levels varied according to the sites and treatments, with statistically significant differences (p < 0.0001) found between sites and between treatments. The increase in WSR severity over time was statistically significant in control plots (p = 0.0042) and not significant in fungicide-treated plots (p = 0.1011) [32]. In Bettendorf and Bicherhaff, WLR and WSR were observed at the end of the season in fungicide-treated plots. In the former site particularly, where two cultivars were available (Table 1), WLR and WSR severities were statistically different between cultivars (p < 0.001). WLR and WSR have been recorded, sometimes at substantial levels (30 to 65%), in Luxembourg over these past years [5,18,42,43]. With weather patterns projected to change in the coming years in the GDL [44], it is expected that Luxembourgish wheat-growing areas may experience increased occurrences of WSR and WLR, which will require more efficient integrated disease management (e.g., informed decisions based on support tools or systems, use of resistant cultivars, etc.).

3.2. Variability of RGB Imagery-Derived Wheat Leaf Rust and Stripe Severities and Canopy Cover

Increasing proportions of WSR were estimated as the growth cycle progressed at all sites (Figure 4). The relatively highest variations of WSR severity were found on the last acquisition date (which corresponded to the final weeks of the cropping season) for all sites. WSR infection events based on favorable weather conditions (as described in [43]) were simulated as earlier as 31 March at all the experimental sites, though at different proportions (Figure 3). Infection events were generally estimated during the periods preceding the image acquisitions. Although there were no infection events simulated around 15 May 2019 (first image acquisition date; Table 2) at Bicheraff and Bettendorf, WSR was present at the latter site and was estimated to up to 5% based on the UAV-RBG imagery (Figure 4). The differences in WSR occurrences between these two sites can be related to local weather conditions (weather variables are typically retrieved from stations located within up to 5-km radius from the fields). Moreover, hot summers and dry weather conditions are the least conducive to infections by P. striiformis. Above 25 °C, the sporulation is halted and for temperatures greater than 29 °C the pathogen dies [43,46]. Although the threshold-based weather model satisfactorily predicts infection events by P. striiformis under Luxembourgish conditions (probabilities of detection ≥0.90; false alarm ratios ≤0.38 on average, and critical success indices ranging from 0.63 to 1) [43], the missed infection events indicate that additional ground truthing is needed for some locations. In such cases, including UAV-based monitoring can be explored as complementary means for improved fungal foliar disease management.
For WLR, UAV-derived estimates varied throughout the monitoring period and according to each of the sites (Figure 5). The highest WLR severities were found at Bettendorf. Such disease levels can be explained by favorable nighttime weather conditions in early June (WLR infection events are generally linked to conducive nighttime in the GDL [5,45] and the cultivars’ susceptibility to the disease (Table 1). At Bettendorf, there was a noticeable variability of estimated WLR severities during the final weeks of the cropping season (values ranged from 0 to 20.07%; Figure 5). At the remainder of the sites, the variability was high on the last date of image acquisition as well, though in different proportions according to the site. Such variabilities can be explained by the protection ensured by the fungicide applied (high disease severities observed in control plots; the opposite in fungicide-treated plots).
The variations of canopy cover estimated from the UAV-based RGB imagery during the monitoring period are presented (Figure 6). At Bettendorf and Weiswampach, the median estimated canopy covers increased up to 24 May 2019, before decreasing toward the end of the season. At Bicherhaff the median canopy cover value varied slightly between the second and third date of data acquisition, while at Koerich there was an increasing trend of the median canopy cover value from the first till the third image acquisition date (Figure 6). At all the sites, the canopy cover decreased towards the end of the cropping season as a result of leaf senescence. Moreover, the relatively highest variation of canopy cover within the experimental plots was observed on the last image acquisition date (3 July 2019) for all the four sites (Figure 6). This could be attributed, at least partly, to the fungicide treatments since well-protected leaves tended to stay green longer than diseased leaves [5,7]. Furthermore, some weeds stay green after crop senescence and can be partially contributed to canopy cover determination.

3.3. Relationships between Observations and RGB Imagery-Derived Values

Overall, good agreements between the UAV-based estimates and observed values were found for canopy cover, WSR and WLR severities, with statistically significant correlations (Figure 7). By fitting the deming regression line, correlation coefficient (r) values of 0.92, 0.96 and 0.86 for WSR severity, WLR severity, and canopy cover, respectively (Figure 7) were obtained. For WLR and WSR severity values, the Kendall’s τ coefficients were 0.82 and 0.77, respectively; the p-value (Kendall) for both diseases being 2.20 × 10⁻¹⁶. For canopy cover values, the correlation between UAV RGB-derived estimates and observed values was slightly lower (τ = 0.50; p-value (Kendall) = 1.07 × 10⁻⁹). Su et al. [21] pointed out the potential of assimilating UAV images into random forest classifiers for automated monitoring of wheat stripe rust. The results of this study can pave the way for future research focusing on the comparison of WSR and WLR severities derived from visual cryptography and automated machine learning techniques. As such, the combination of high-resolution remote sensing and machine learning techniques can ultimately improve the monitoring of fungal foliar disease in fields over large areas.
The relationships between the UAV-based estimates and observed values over four different growth stage intervals namely (i) GS32 to GS37, (ii) GS37 to GS42, (iii) GS45 to GS57, and (iv) GS77 to GS82, are presented (Figure 8, Table 3). For WSR severity, relatively strong and statistically significant relationships were found between the observed and estimated values between the defined phenological stages intervals. The r values were 0.76, 0.83, 0.89, and 0.91 for the GS45 to GS57, GS77 to GS82, GS45 to GS57, and GS77 to GS82 intervals, respectively. The corresponding Kendall’s τ coefficients were 0.71 (p-value (Kendall) = 6.54 × 10⁻⁴), 0.72 (p-value (Kendall) = 6.18 × 10⁻⁵), 0.66 (p-value (Kendall) = 3.29 × 10⁻⁴), and 0.75 (p-value (Kendall) = 2.20 × 10⁻¹⁶) (Table 3). Similar range of r values was observed for WLR severity: from 0.88 (GS37 to GS42 interval) to 0.99 (GS45 to GS57 interval), though there was no clear trend in strength of relationships over time from early to late growth stages (Figure 8). Regarding canopy cover, there was virtually no relationship between the estimated and observed values during the GS32 to GS37 and GS37 to GS42 intervals (r ≤ 0.15; p-value (Kendall) > 0.05). However, strong correlations were found as the cropping season progressed (i.e. during the late growth stages): r = 0.61 (p-value (Kendall) = 0.034) and 0.84 (p-value (Kendall) = 3.35 × 10⁻⁴) for GS45 to GS57 and GS77 to GS82 intervals, respectively (Table 3). Our results contrast with those of Huang et al. [23] where the relationships between the photochemical reflectance remotely sensed index and stripe rust severity remained unaffected over the crop development stages.
The three uppermost leaf layers contribute largely to the final grain yield in winter wheat [47]. Their symptomatic status is pivotal to the success of fungicide-based disease risk management since triggering fungicide application depends on a defined disease-level threshold on these three leaves as well as the prevailing weather conditions [47]. The accurate identification of the diseased leaf areas, together with good estimates of WSR and WLR severities early in the cropping season, indicated by strong and statistically significant correlation coefficients, suggests that the UAV-based RGB imagery is a useful tool for optimum and timely fungicide application in winter wheat fields in the GDL. The approach described in the study is potentially applicable to studies of other economically important foliar fungal diseases of other crops caused by biotrophic pathogens or in different geographical regions.

3.4. Evaluating the RGB Imagery-Derived Indices Using Independent Multispectral Data

The multispectral reflectance spectra of healthy wheat leaf areas were compared with those of WSR and WLR infected areas using the RGB-based YRI and BRI, respectively. There was a change in the typical form of the reflectance spectra (Figure 9). The multispectral reflectance spectra of healthy wheat leaf areas showed a downward slope (average gradient slope of 1.98%) from the green to red spectral band; whilst the slope was rather steady (average gradient slope of 0.15%) for the WSR infected areas over the same spectral bands (Figure 9). This can be explained by the senescence process induced by disease infections. As the proportion of senescent diseased leaves increased, the absorption of incident light by chlorophyll decreased accordingly [48], resulting in an increase in reflectance peak from the green towards the red spectral band. For WLR infected leaf areas, the observed downward slope flattened from the green to the red spectral band with an average gradient slope of 0.01% (Figure 9). Such differences of slopes between the various spectral bands as a result of varying WSR and WLR infections can be investigated in future research to develop robust remote sensing-derived indices to differentiate WSR and WLR in winter wheat.
When analyzing RGB reflectance spectra, that of healthy wheat leaf areas exhibited a downward slope from green to red with an average gradient slope of 2.97%. Like the multispectral reflectance spectra, the RGB reflectance spectra revealed a flattened slope from green to red spectral channels for WSR and WLR diseased wheat leaf areas (average gradient slope of 0.03% and 0.9%, respectively; Figure 9). The observed changes in the reflectance spectra from green to red spectral channels are in line with the observations of Adams et al. [48], who reported an alteration in shape of the reflectance spectra between the near 0.55 mm and the near 0.65 mm wavelengths, corresponding to the green and red spectral bands in the present study, respectively.
When using the SRI (Equation (2)) and LRI (Equation (3)) to determine the disease severity, the estimated WSR severity was 42.3% on average for patches enriched with century-old biochar (around 150 years ago) at the Belgian study site; whilst the estimated average WSR severity was 35.7% in the reference patches. For WLR severity, the estimated values were on average 22.8% in the century-old biochar patches and 26.4% in the reference patches. This result is in line with that of Heidarian Dehkordi et al. [30], who reported an average of 42.5% for healthy green canopy over the century-old biochar patches as compared to 39.4% in the adjacent reference soil patches of the same study field using multispectral UAV-based images.

4. Conclusions

We investigated the identification and quantification of symptoms of wheat leaf rust and stripe rust using RGB cameras at UAV scale and ground-based visual observations using data collected under ambient lighting conditions at four representative wheat-producing locations in the GDL during the 2018–2019 cropping season. High-resolution UAV imagery has the advantage of separating disease-related signals from a huge amount of natural biological, geometrical, and sensor-related variability within an RGB image of a crop canopy in the field. Leaf areas infected by wheat leaf rust and stripe rust were identified based on the combination of green, red, and blue spectral bands, and the combination of green and red spectral bands, respectively. The results showed that UAV-based RGB imagery captured the alterations in the typical reflectance spectra of wheat leaves between the green and the red spectral channels which resulted from infections by biotrophic pathogens causing the two foliar fungal diseases. Good agreements were found between the RGB imagery-derived values and observed disease severities at the study sites, with correlation coefficients greater than 0.90 for both stripe rust and leaf rust. Moreover, the accurate identification of diseased leaf areas and accurate estimations of disease severities early in the cropping season suggests that the UAV-based RGB imagery offers a useful tool for optimum and timely fungicide application to control wheat leaf rust and stripe rust in winter wheat fields in the GDL. Although the best way to control these foliar diseases is to grow resistant cultivars, for moderate to highly susceptible wheat cultivars, the methodology explored in the study can help to identify timely and spatially the initial infection foci and to monitor the disease spread across the field. Such an application can support the improved management of wheat leaf rust and stripe rust under field conditions. Additionally, the approach we present has the potential for assisting in the selection of rust resistant cultivars in winter wheat breeding programs. It can be readily applied to studies of other economically important foliar diseases of other crops caused by biotrophic pathogens or in different geographical regions.

Author Contributions

Conceptualization, R.H.D., M.E.J., and L.K.; data curation, R.H.D and M.E.J.; formal analysis, R.H.D., M.E.J., and L.K.; methodology, all.; supervision, M.E.J., L.K., J.M., and M.B.; visualization, R.H.D., M.E.J., and L.K.; writing—original draft preparation, R.H.D., M.E.J., and L.K.; writing—review and editing, all. All authors have read and agreed to the published version of the manuscript.

Funding

The present research was funded by the Services Techniques de l’Agriculture (ASTA) of Luxembourg through the project Sentinelle as well as by the French Community of Belgium through the ARC grant 17/21-03 for Concerted Research Actions within the framework of the CHAR project at the University of Liège.

Acknowledgments

The authors acknowledge all the people who helped us with realizing the field experiments and logistics. We thank Doriane Diane, Marine Pallez-Barthel, Mohammed Sallah Abdoulhamid, Malika Yazza, Fouad Zouhir, Marie Dufrasne, Mathieu Almeida, Chloé Dupuis, Martin Vanrykel for excellent technical assistance, Guy Reiland and Serge Heuschling for organizational support, and the Administration des Services Techniques de l’Agriculture of Luxembourg for financially supporting the project Sentinelle. Thanks also to Jean-Thomas Cornelis for supporting our research within the joint framework of CHAR-ARC project. We acknowledge the editor and the anonymous reviewers for their insightful comments which helped us to improve our research.

Conflicts of Interest

The authors declare no conflict of interest.

References

  1. FAO. World Food Situation—FAO Cereal Supply and Demand Brief (Release Date: 03/09/2020); Food and Agriculture Organization of the United Nations (FAO): Rome, Italy, 2020. [Google Scholar]
  2. USDA. World Agricultural Production. Circular Series WAP 9–20. Spetember 2020; United States Department of Agriculture (USDA) Foreign Agricultural Service, Gobal Market Analysis: Washington, DC, USA, 2020.
  3. Kolmer, J.A. Tracking wheat rust on a continental scale. Curr. Opin. Plant Biol. 2005, 8, 441–449. [Google Scholar] [CrossRef] [PubMed]
  4. Hovmøller, M.S.; Walter, S.; Justesen, A.F. Escalating threat of wheat rusts. Science 2010, 329, 369. [Google Scholar] [CrossRef] [PubMed] [Green Version]
  5. El Jarroudi, M.; Kouadio, L.; Giraud, F.; Delfosse, P.; Tychon, B. Brown rust disease control in winter wheat: II. Exploring the optimization of fungicide sprays through a decision support system. Environ. Sci. Pollut. Res. 2014, 21, 4809–4818. [Google Scholar] [CrossRef] [Green Version]
  6. Beddow, J.M.; Pardey, P.G.; Chai, Y.; Hurley, T.M.; Kriticos, D.J.; Braun, H.-J.; Park, R.F.; Cuddy, W.S.; Yonow, T. Research investment implications of shifts in the global geography of wheat stripe rust. Nat. Plants 2015, 1, 15132. [Google Scholar] [CrossRef] [PubMed]
  7. El Jarroudi, M.; Kouadio, L.; Beyer, M.; Junk, J.; Hoffmann, L.; Tychon, B.; Maraite, H.; Bock, C.H.; Delfosse, P. Economics of a decision–support system for managing the main fungal diseases of winter wheat in the Grand-Duchy of Luxembourg. Field Crops Res. 2015, 172, 32–41. [Google Scholar] [CrossRef] [Green Version]
  8. Ali, S.; Rodriguez-Algaba, J.; Thach, T.; Sørensen, C.K.; Hansen, J.G.; Lassen, P.; Nazari, K.; Hodson, D.P.; Justesen, A.F.; Hovmøller, M.S. Yellow rust epidemics worldwide were caused by pathogen races from divergent genetic lineages. Front. Plant Sci. 2017, 8, 1057. [Google Scholar] [CrossRef] [Green Version]
  9. Huerta-Espino, J.; Singh, R.P.; German, S.; McCallum, B.D.; Park, R.F.; Chen, W.; Bhardwaj, S.C.; Goyeau, H. Global status of wheat leaf rust caused by Puccinia triticina. Euphytica 2011, 179, 143–160. [Google Scholar]
  10. Freier, B.; Boller, E.F. Integrated Pest Management in Europe—History, Policy, Achievements and Implementation. In Integrated Pest Management: Dissemination and Impact; Peshin, R., Dhawan, A.K., Eds.; Springer: Dordrecht, The Netherlands, 2009; pp. 435–454. [Google Scholar]
  11. Mohanty, S.P.; Hughes, D.P.; Salathé, M. Using Deep Learning for Image-based plant disease detection. Front. Plant Sci. 2016, 7. [Google Scholar] [CrossRef] [Green Version]
  12. Bock, C.H.; Poole, G.H.; Parker, P.E.; Gottwald, T.R. Plant disease severity estimated visually, by digital photography and image analysis, and by hyperspectral imaging. Crit. Rev. Plant Sci. 2010, 29, 59–107. [Google Scholar] [CrossRef]
  13. El Jarroudi, M.; Kouadio, A.L.; Mackels, C.; Tychon, B.; Delfosse, P.; Bock, C.H. A comparison between visual estimates and image analysis measurements to determine Septoria leaf blotch severity in winter wheat. Plant Pathol. 2014, 355–364. [Google Scholar] [CrossRef]
  14. Moshou, D.; Bravo, C.; West, J.; Wahlen, S.; McCartney, A.; Ramon, H. Automatic detection of ‘yellow rust’ in wheat using reflectance measurements and neural networks. Comp. Electron. Agric. 2004, 44, 173–188. [Google Scholar] [CrossRef]
  15. Zhang, C.; Kovacs, J.M. The application of small unmanned aerial systems for precision agriculture: A review. Precision Agric. 2012, 13, 693–712. [Google Scholar] [CrossRef]
  16. Bohnenkamp, D.; Behmann, J.; Mahlein, A.-K. In-field detection of yellow rust in wheat on the ground canopy and UAV scale. Remote Sens. 2019, 11, 2495. [Google Scholar] [CrossRef] [Green Version]
  17. Boulent, J.; Foucher, S.; Théau, J.; St-Charles, P.-L. Convolutional Neural Networks for the automatic identification of plant diseases. Front. Plant Sci. 2019, 10. [Google Scholar] [CrossRef] [Green Version]
  18. Dang, L.M.; Wang, H.; Li, Y.; Min, K.; Kwak, J.T.; Lee, O.N.; Park, H.; Moon, H. Fusarium wilt of radish detection using RGB and near infrared images from Unmanned Aerial Vehicles. Remote Sens. 2020, 12, 2863. [Google Scholar] [CrossRef]
  19. Singh, A.; Jones, S.; Ganapathysubramanian, B.; Sarkar, S.; Mueller, D.; Sandhu, K.; Nagasubramanian, K. Challenges and opportunities in machine-augmented plant stress phenotyping. Trends Plant Sci. 2020. [Google Scholar] [CrossRef]
  20. Franke, J.; Menz, G.; Oerke, E.-C.; Rascher, U. Comparison of multi- and hyperspectral imaging data of leaf rust infected wheat plants. In Remote Sensing for Agriculture, Ecosystems, and Hydrology VII.; SPIE: Bellingham, WA, USA, 2005; Volume 5976. [Google Scholar] [CrossRef]
  21. Su, J.; Liu, C.; Coombes, M.; Hu, X.; Wang, C.; Xu, X.; Li, Q.; Guo, L.; Chen, W.-H. Wheat yellow rust monitoring by learning from multispectral UAV aerial imagery. Comp. Electron. Agric. 2018, 155, 157–166. [Google Scholar] [CrossRef]
  22. Moshou, D.; Bravo, C.; Wahlen, S.; West, J.; McCartney, A.; De Baerdemaeker, J.; Ramon, H. Simultaneous identification of plant stresses and diseases in arable crops using proximal optical sensing and self-organising maps. Precision Agric. 2006, 7, 149–164. [Google Scholar] [CrossRef]
  23. Huang, W.; Lamb, D.W.; Niu, Z.; Zhang, Y.; Liu, L.; Wang, J. Identification of yellow rust in wheat using in-situ spectral reflectance measurements and airborne hyperspectral imaging. Precision Agric. 2007, 8, 187–197. [Google Scholar] [CrossRef]
  24. Moshou, D.; Bravo, C.; Oberti, R.; West, J.; Bodria, L.; McCartney, A.; Ramon, H. Plant disease detection based on data fusion of hyper-spectral and multi-spectral fluorescence imaging using Kohonen maps. Real-Time Imaging 2005, 11, 75–83. [Google Scholar] [CrossRef]
  25. Sankaran, S.; Mishra, A.; Maja, J.M.; Ehsani, R. Visible-near infrared spectroscopy for detection of Huanglongbing in citrus orchards. Comp. Electron. Agric. 2011, 77, 127–134. [Google Scholar] [CrossRef]
  26. Bravo, C.; Moshou, D.; West, J.; McCartney, A.; Ramon, H. Early disease detection in wheat fields using spectral reflectance. Biosyst. Eng. 2003, 84, 137–145. [Google Scholar] [CrossRef]
  27. Whetton, R.L.; Waine, T.W.; Mouazen, A.M. Hyperspectral measurements of yellow rust and fusarium head blight in cereal crops: Part 2: On-line field measurement. Biosyst. Eng. 2018, 167, 144–158. [Google Scholar] [CrossRef] [Green Version]
  28. Mahlein, A.K.; Rumpf, T.; Welke, P.; Dehne, H.W.; Plümer, L.; Steiner, U.; Oerke, E.C. Development of spectral indices for detecting and identifying plant diseases. Remote Sens. Environ. 2013, 128, 21–30. [Google Scholar] [CrossRef]
  29. Das, P.K.; Laxman, B.; Rao, S.V.C.K.; Seshasai, M.V.R.; Dadhwal, V.K. Monitoring of bacterial leaf blight in rice using ground-based hyperspectral and LISS IV satellite data in Kurnool, Andhra Pradesh, India. Int. J. Pest Manag. 2015, 61, 359–368. [Google Scholar] [CrossRef]
  30. Heidarian Dehkordi, R.; Burgeon, V.; Fouche, J.; Placencia Gomez, E.; Cornelis, J.-T.; Nguyen, F.; Denis, A.; Meersmans, J. Using UAV collected RGB and multispectral images to evaluate winter wheat performance across a site characterized by century-old biochar patches in Belgium. Remote Sens. 2020, 12, 2504. [Google Scholar] [CrossRef]
  31. Heidarian Dehkordi, R.; Denis, A.; Fouche, J.; Burgeon, V.; Cornelis, J.T.; Tychon, B.; Placencia Gomez, E.; Meersmans, J. Remotely-sensed assessment of the impact of century-old biochar on chicory crop growth using high-resolution UAV-based imagery. Int. J. Appl. Earth. Obs. Geoinf. 2020, 91, 102147. [Google Scholar] [CrossRef]
  32. Dam, D.; Pallez-Barthel, M.; El Jarroudi, M.; Eickermann, M.; Beyer, M. The debate on a loss of biodiversity: Can we derive evidence from the monitoring of major plant pests and diseases in major crops? J. Plant Dis. Prot. 2020. [Google Scholar] [CrossRef]
  33. James, C.A. An illustrated series of assessment keys for plant diseases, their preparation and usage. Can. Plant Dis. Surv. 1971, 51, 39–65. [Google Scholar]
  34. Tomerlin, J.R.; Howell, A. DISTRAIN: A computer program for training people to estimate disease severity on cereal leaves. Plant Dis. 1988, 72, 455–459. [Google Scholar]
  35. BSA. Beschreibende Sortenliste 2018. Getreide, Mais, Ölfrüchte, Leguminosen (Großkörnig) Hackfrüchte (Außer Kartoffeln); Deutscher Landwirtschaftsverlag GmbH.: Hannover, Germany, 2016. [Google Scholar]
  36. Hou, Y.-C. Visual cryptography for color images. Pattern Recognit. 2003, 36, 1619–1629. [Google Scholar] [CrossRef]
  37. Liu, M.; Yu, T.; Gu, X.; Sun, Z.; Yang, J.; Zhang, Z.; Mi, X.; Cao, W.; Li, J. The impact of spatial resolution on the classification of vegetation types in highly fragmented planting areas based on unmanned aerial vehicle hyperspectral images. Remote Sens. 2020, 12, 146. [Google Scholar] [CrossRef] [Green Version]
  38. Lovell, D.J.; Parker, S.R.; Hunter, T.; Royle, D.J.; Coker, R.R. Influence of crop growth and structure on the risk of epidemics by Mycosphaerella graminicola (Septoria tritici) in winter wheat. Plant Pathol. 1997, 46, 126–138. [Google Scholar] [CrossRef]
  39. Lovell, D.J.; Parker, S.R.; Hunter, T.; Welham, S.J.; Nichols, A.R. Position of inoculum in the canopy affects the risk of septoria tritici blotch epidemics in winter wheat. Plant Pathol. 2004, 53, 11–21. [Google Scholar] [CrossRef] [Green Version]
  40. Kendall, M.G. Partial rank correlation. Biometrika 1942, 32, 277–283. [Google Scholar] [CrossRef]
  41. R Core Team. R: A Language and Environment for Statistical Computing; R Foundation for Statistical Computing: Vienna, Austria, 2020. [Google Scholar]
  42. El Jarroudi, M.; Kouadio, L.; Bertrand, M.; Curnel, Y.; Giraud, F.; Delfosse, P.; Hoffmann, L.; Oger, R.; Tychon, B. Integrating the impact of wheat fungal diseases in the Belgian crop yield forecasting system (B-CYFS). Eur. J. Agron. 2012, 40, 8–17. [Google Scholar] [CrossRef]
  43. El Jarroudi, M.; Kouadio, L.; Bock, C.H.; El Jarroudi, M.; Junk, J.; Pasquali, M.; Maraite, H.; Delfosse, P. A threshold-based weather model for predicting stripe rust infection in winter wheat. Plant Dis. 2017, 101, 693–703. [Google Scholar] [CrossRef] [Green Version]
  44. Junk, J.; Kouadio, L.; Delfosse, P.; El Jarroudi, M. Effects of regional climate change on brown rust disease in winter wheat. Clim. Chang. 2016, 135, 439–451. [Google Scholar] [CrossRef] [Green Version]
  45. El Jarroudi, M.; Kouadio, L.; Delfosse, P.; Tychon, B. Brown rust disease control in winter wheat: I. Exploring an approach for disease progression based on night weather conditions. Environ. Sci. Pollut. Res. 2014, 21, 4797–4808. [Google Scholar] [CrossRef] [Green Version]
  46. Rodríguez-Moreno, V.M.; Jiménez-Lagunes, A.; Estrada-Avalos, J.; Mauricio-Ruvalcaba, J.E.; Padilla-Ramírez, J.S. Weather-data-based model: An approach for forecasting leaf and stripe rust on winter wheat. Meteorol. Appl. 2020, 27, e1896. [Google Scholar] [CrossRef] [Green Version]
  47. Gooding, M.J.; Dimmock, J.P.R.E.; France, J.; Jones, S.A. Green leaf area decline of wheat flag leaves: The influence of fungicides and relationships with mean grain weight and grain yield. Ann. Appl. Biol. 2000, 136, 77–84. [Google Scholar] [CrossRef]
  48. Adams, M.L.; Philpot, W.D.; Norvell, W.A. Yellowness index: An application of spectral second derivatives to estimate chlorosis of leaves in stressed vegetation. Int. J. Remote Sens. 1999, 20, 3663–3675. [Google Scholar] [CrossRef]
Figure 1. Distribution of experimental plots (red boundaries) within four winter wheat sites in the Grand-Duchy of Luxembourg. Figures correspond to the Red-Green-Blue (RGB) orthomosaic captured by the unmanned aerial vehicle on 24 May 2019.
Remotesensing 12 03696 g001
Figure 2. The proposed approach to determine stripe rust and leaf rust infected pixels. Unmanned aerial vehicle based Red-Green-Blue (RGB) image (left), removing the background effect (classified as black color pixels) from the true vegetation (classified as gray color) pixels (middle), and estimation of pixels infected by stripe rust (identified as white color pixels) based on the stripe rust index (top right) as well as the pixels infected by leaf rust (identified as white color pixels) based on the leaf rust index (bottom right).
Remotesensing 12 03696 g002
Figure 3. Simulated infection events for wheat stripe rust (WSR) and wheat leaf rust (WLR) at the experimental sites during March and July 2019. Simulations for WSR and WLR were carried out using the threshold-based weather models described in El Jarroudi et al. [43] and El Jarroudi et al. [45], respectively.
Remotesensing 12 03696 g003
Figure 4. Variations of the Red-Green-Blue (RGB) imagery-based estimates of wheat stripe rust (WSR) during the monitoring period in 2019 at the experimental sites in the Grand-Duchy of Luxembourg. T1, T2, and T3 refer to single, double, and triple fungicide-treated plots (Table 1); Control refers to the non-fungicide treated plots. The horizontal line represents the median value, surrounded by box edges presenting the 25th and 75th percentiles. The whiskers are the two lines outside of the box that extend to the highest and lowest data values. No data is available at Bicherhaff on 15 May 2019 since the images were blurry due to high velocity wind during the unmanned aerial vehicle flight.
Remotesensing 12 03696 g004
Figure 5. Variations of the Red-Green-Blue (RGB) imagery-based estimates of wheat leaf rust (WLR) during the monitoring period in 2019 at the experimental sites in the Grand-Duchy of Luxembourg. T1, T2, and T3 refer to single, double, and triple fungicide-treated plots (Table 1); Control refers to the non-fungicide treated plots. The horizontal line represents the median value, surrounded by box edges presenting the 25th and 75th percentiles. The whiskers are the two lines outside of the box that extend to the highest and lowest data values. No data is available at Bicherhaff on 15 May 2019 since the images were blurry due to high velocity wind during the unmanned aerial vehicle flight.
Remotesensing 12 03696 g005
Figure 6. Estimated canopy cover during the monitoring period at the four experimental sites during the 2018-2019 growing season. Canopy cover values were calculated from unmanned aerial vehicle (UAV)-based Red-Green-Blue (RGB) imagery. T1, T2, and T3 refer to single, double, and triple fungicide-treated plots (Table 1); Control refers to the non-fungicide treated plots. The horizontal line represents the median value, surrounded by box edges presenting the 25th and 75th percentiles. The whiskers are the two lines outside of the box that extend to the highest and lowest data values. No data is available at Bicherhaff on 15 May 2019 since the images were blurry due to high velocity wind during the UAV flight.
Remotesensing 12 03696 g006
Figure 7. Scatterplots of Red-Green-Blue (RGB) imagery-derived estimates and observed values of wheat stripe rust severity (left), wheat leaf rust severity (middle), and canopy cover (right). Data from the four dates of image acquisition were pooled. The black and dashed-grey lines indicate the deming regression fit and 1:1 lines, respectively. The purple area is the 95% confidence interval of the deming regression fit. (Note the differences in scale for the canopy cover).
Remotesensing 12 03696 g007
Figure 8. Relationships between the Red-Green-Blue (RGB) imagery-derived estimates and observed values of wheat strip rust severity (top), wheat leaf rust severity (middle), and canopy cover (bottom) for four different growth stage (GS) intervals. Data from the four dates of image acquisition were pooled. The black and dashed-grey lines indicate the deming regression fit and 1:1 lines, respectively. The purple area is the 95% confidence interval of the deming regression fit (the latter is only shown when the number of observations is equal to or more than 20). The detailed results of the statistical tests are presented in Table 3. (Note the differences in scale for the canopy cover).
Remotesensing 12 03696 g008
Figure 9. Reflectance spectra generated for healthy (left), stripe rust (middle), and wheat leaf rust (right) infected wheat samples derived from multispectral (MSP; top) and Red-Green-Blue (RGB; bottom) sensors. Samples were selected according to the proposed stripe rust index (SRI) and leaf rust index (LRI) in this study. (Note the differences in scales.).
Remotesensing 12 03696 g009
Table 1. Agronomic details for winter wheat plots used at the experimental sites in the Grand-Duchy of Luxembourg for the 2018–2019 cropping season. The previous crop at all sites was oilseed rape (Brassica napus L.).
LocationCultivarsSowing DateDisease Susceptibility 1Treatment 2Growth Stage (GS) at Fungicide ApplicationFungicide Mixture 3
WSRWLR
BicherhaffKerubino18 October 201875Control no fungicide treatment
T1GS431.50 L ha−1 Swing Gold® + 1.00 L ha−1 Bravo®
T2GS370.75 L ha−1 Opus team® + 1.00 L ha−1 Bravo®
GS531.50 L ha−1 Swing Gold® + 1.00 L ha−1 Bravo®
T3GS370.75 L ha−1 Opus team® + 1.00 L ha−1 Bravo®
GS401.50 L ha−1 Fandango® + 1.00 L ha−1 Bravo®
GS531.50 L ha−1 Swing Gold® + 1.00 L ha−1 Bravo®
BettendorfDesamo Kerubino24 October 20182
7
2
5
Control no fungicide treatment
T1GS491.50 L ha−1 Swing Gold® + 1.00 L ha−1 Bravo®
T2GS320.75 L ha−1 Opus team® + 1.00 L ha−1 Bravo®
GS591.50 L ha−1 Swing Gold® + 1.00 L ha−1 Bravo®
T3GS320.75 L ha−1 Opus team® + 1.00 L ha−1 Bravo®
GS371.50 L ha−1 Fandango® + 1.00 L ha−1 Bravo®
GS651.50 L ha−1 Swing Gold® + 1.00 L ha−1 Bravo®
KoerichKerubino16 October 201875Control no fungicide treatment
T1GS501.50 L ha−1 Swing Gold® + 1.00 L ha−1 Bravo®
T2GS320.75 L ha−1 Opus team® + 1.00 L ha−1 Bravo®
GS531.50 L ha−1 Swing Gold® + 1.00 L ha−1 Bravo®
T3GS320.75 L ha−1 Opus team® + 1.00 L ha−1 Bravo®
GS371.50 L ha−1 Fandango® + 1.00 L ha−1 Bravo®
GS501.50 L ha−1 Swing Gold® + 1.00 L ha−1 Bravo®
WeiswampachKerubino12 October 201875Control no fungicide treatment
T1GS491.50 L ha−1 Swing Gold® + 1.00 L ha−1 Bravo®
T2GS320.75 L ha−1 Opus team® + 1.00 L ha−1 Bravo®
GS591.50 L ha−1 Swing Gold® + 1.00 L ha−1 Bravo®
T3GS320.75 l ha-1 Opus team® + 1.00 L ha−1 Bravo®
GS371.50 L ha−1 Fandango® + 1.00 L ha−1 Bravo®
GS591.50 L ha−1 Swing Gold® + 1.00 L ha−1 Bravo®
1 Scale of susceptibility for wheat stripe rust (WSR) and wheat leaf rust (WLR): 1 (low susceptibility) to 9 (high susceptibility) [35]. 2 T1, T2 and T3 refer to single, double and triple fungicide treatments, respectively. 3 The products Bravo®, Fandango®, Opus team®, and Swing Gold® contain the active ingredients chlorothalonil (500 g L−1), prothioconazole (100 g L−1) + fluoxastrobin (50 g L−1), epoxiconazole (84 g L−1) + fenpropimorph (250 g L−1), epoxiconazole (50 g L−1) + dimoxystrobin (133 g L−1), respectively.
Table 2. A comprehensive overview of the data acquisition at the different sites in 2019.
DateSiteLocal Times (start-end) at UAV Flight Plant Growth Stage 2Illumination Condition
15 MayBettendorf12:05–12:37GS37Sunny
Bicherhaff13:15–13:30 1GS37
Koerich14:17–14:35GS32
Weiswampach15:11–15:28GS32
24 MayBettendorf11:14–11:40GS42Sunny
Bicherhaff12:30–12:44GS39
Koerich13:22–13:36GS37
Weiswampach14:02–14:15GS39
5 JuneBettendorf12:15–12:48GS57Cloudy
Bicherhaff13:35–13:53GS55
Koerich14:33–14:53GS52
Weiswampach15:40–15:57GS45
3 JulyBettendorf12:07–12:41GS82Sunny
Bicherhaff13:22–13:40GS80
Koerich14:21–14:44GS77
Weiswampach15:15–15:32GS77
1 The acquired images were blurry due to high velocity wind during the unmanned aerial vehicle (UAV) flight, and hence, were removed from the analysis. 2 GS refers to plant growth stage.
Table 3. Statistics comparing the relationships between the Red-Green-Blue (RGB) imagery-based estimates and observed values. GS refers to the plant growth stage. The correlation coefficient (r), the p-value of the statistical F-test (p-value (F-test)), the non-parametric Kendall’s rank correlation tau (τ), and the p-value of Kendall’s rank correlation tau test (p-value (Kendall)) are presented.
StatisticsGS32–GS37GS32–GS37GS32–GS37GS32–GS37
Wheat Stripe Rustr0.760.830.890.91
p-value (F-test)0.001<0.0001<0.0001<0.0001
τ0.710.720.660.75
p-value (Kendall)<0.0001<0.0001<0.0001<0.0001
Wheat Leaf Rustr0.960.880.990.96
p-value (F-test)<0.0001<0.0001<0.0001<0.0001
τ0.860.860.830.79
p-value (Kendall)<0.0001<0.0001<0.0001<0.0001
Canopy Coverr0.010.150.610.84
p-value (F-test)0.6370.5510.009<0.0001
τ0.100.070.380.64
p-value (Kendall)0.5970.7150.034<0.0001
Publisher’s Note: MDPI stays neutral with regard to jurisdictional claims in published maps and institutional affiliations.

