Abstract
Transverse aeolian ridges (TARs) are unusual bedforms on the surface of Mars. TARs are common but sparse on Mars; TAR fields are small, rarely continuous, and scattered, making manual mapping impractical. There have been many efforts to automatically classify the Martian surface, but they have never explicitly located TARs successfully. Here, we present a simple adaptation of the off-the-shelf neural network RetinaNet that is designed to identify the presence of TARs at a 50-m scale. Once trained, the network was able to identify TARs with high precision (92.9%). Our model also shows promising results for applications to other surficial features like ripples and polygonal terrain. In the future, we hope to apply this model more broadly and generate a large database of TAR distributions on Mars.
1. Introduction
1.1. Transverse Aeolian Ridges
Transverse aeolian ridges (TARs), first identified in Mars Orbiter Camera (MOC) imagery, are bright relict linear aeolian features [1,2,3]. While TARs are common on Mars, their role in past Martian sediment cycles is poorly understood [2,3,4,5,6,7], and no exact proxy on Earth has been identified [8,9,10,11,12,13,14,15,16,17]. Improved understanding of TARs requires a significant amount of data on their distribution, morphologies, and development. However, collecting TAR data is currently time-consuming and inefficient because TARs are common but sparse: TARs can be found in many HiRISE images [18] but do not form large fields; rather, they are scattered and can be difficult to observe in images with large spatial coverage (i.e., at small map scales). This is an ideal problem for automation, as a single HiRISE image can contain hundreds of individual TAR fields, and there are currently >60,000 published HiRISE images.
1.2. Classifying Mars
There is a large body of work on automating Martian surface feature identification using a variety of methods for a range of purposes. For example, Golombek et al. developed a reliable methodology for identifying and quantifying boulder size–frequency distributions in both lander and HiRISE imagery [19,20,21,22,23] and Palafox et al. [24] demonstrated the potential for identifying volcanic rootless cones and TARs in HiRISE imagery using custom-designed convolutional neural networks (CNNs) by training their network on two HiRISE images and applying their CNN to those same HiRISE images [24]. However, while promising, these studies are limited in scope and have not been expanded for broader applications.
Wagstaff et al. used transfer learning [25,26,27,28,29,30,31] and an off-the-shelf neural network (AlexNet [32]) to identify craters, dark dunes, dark streaks, and bright dunes in HiRISE images. They also developed a second network to identify 21 different features of the Mars Science Laboratory (MSL) and three of the nearby areas (“drill hole”, “horizon”, and “ground”) using images captured by the MSL rover itself [25,33]. The results from both networks are also promising, but TARs are not among the labeled classes.
Rothrock et al. developed two networks using another off-the-shelf network (DeepLab [34]) for classifying terrain to help navigate the MSL. The first network (SPOC-H) incorporated HiRISE data classified terrain into 17 classes including regolith type (smooth, rough), outcrop type (smooth, fractured, rough), ripple type (solitary, sparse, moderate, dense, polygonal) and ridges, dunes, rock fields, and scarps. The second network used MSL Navcam imagery to classify the nearby terrain into “sand”, “small rocks”, “bedrock”, “large rocks”, “outcrop”, and “rover tracks”. It must be noted here that TARs were incorrectly labeled as ripples in SPOC-H, and true ripples seem to have been ignored. This mistake must be kept in mind when evaluating network output. More importantly, given the targeted application of this network (areas directly around Mars rovers or potential landing sites), the network operates on an amplification basis: each image requires “sparse” manual annotation labels, which the network then extrapolates into dense predictions; this approach requires manual input to classify an image.
Lastly, Bickel et al. used another off-the-shelf classifier (RetinaNet [35]) to identify rockfalls on Mars [36] in HiRISE imagery and previously used the same approach to identify lunar rockfalls using Lunar Reconnaissance Orbiter data [37,38]. Based on the promising results of these rockfall studies for the identification of uncommon features, RetinaNet was selected for this work. We further chose to use transfer learning based on the findings of Wagstaff et al. [25].
1.3. RetinaNet
A common flaw in many classification algorithms is class imbalance. For example, if a user is interested in identifying cats in random images, many images will not contain cats, and even the images that do contain cats may not be majority cat. In this case, the “foreground” object (cats) will be vastly outweighed by the “background” class (everything else) and a random sample of the training data might be 1% class “cat” and 99% class “no-cat”. Using most common loss functions (a function that measures how well a model represents a dataset and that is used to improve the model during training) risks developing a model that will be 99% correct simply because the model would guess “not-cat” on every image. Since TARs are sparse but common features on the surface of Mars, this presents a very similar “cat/no-cat” type problem: a random sampling of the Martian surface would be skewed towards “no-TARs” and “TARs” would be rare.
The standard remedy in such a case would be to oversample any minority classes or undersample the majority to equal proportions (i.e., 50% “cat” and 50% “no-cat”) before training the network [39,40,41,42]. However, the focal loss function in the simple dense detector RetinaNet [35] was developed for just such an application. Focal loss offers an alternative that does not require an equal number of samples per class and can solve the foreground–background imbalance [35]. RetinaNet is composed of two different networks: a Residual Network (ResNet) for deep feature extraction, and a feature pyramid network that builds rich scale-invariant convolutional feature pyramids [43]. Two additional sub-networks (an anchor classification network and an anchor regression network) fit bounding boxes around detected features [35]. These bounding boxes are used to determine accurate identifications and to visualize model results.
Residual Networks (ResNets) were originally developed to solve the vanishing gradient problem during network training (i.e., reaching a point where optimization gradients are so low that improvements to the network with additional training are essentially meaningless [44,45]), essentially enabling deeper networks that could sustain training. RetinaNet builds off this foundation and outperforms other off-the-shelf detectors in terms of both classification accuracy and speed [35]. RetinaNet is robust and well-characterized in the literature [46,47,48,49,50]. As such, focal loss and RetinaNet have become widely popular in the three years since their release. The original article has been cited over 4300 times and is used in a wide variety of fields including remote sensing, medicine, ecology, biology, chemistry, and autonomous driving [51,52,53,54,55,56,57,58,59,60,61,62].
1.4. This Study
Here, we developed a new custom dataset to test RetinaNet’s ability to detect TARs on Mars. We train a novel model (“PlaNet”) using transfer learning and test its ability to correctly detect TARs. Looking forward to broader future applications, we also apply PlaNet to a full test-case image.
2. Materials and Methods
2.1. Imagery
One hundred random map-projected HiRISE images were downloaded using the “random image” feature at https://www.uahirise.org/anazitisi.php. Map-projected images were resampled from their native non-map-projected format since the ultimate goal of this work was to examine spatial relationships between TARs and to examine their spatial distributions. Nine clearly corrupt/banded and/or irrelevant images (i.e., those very near the pole or dominated by ice) were ignored. See Supplementary Materials for a list of HiRISE images used in this study. HiRISE images were resampled as needed to a uniform 0.5 m/pixel resolution.
As above, RetinaNet typically draws bounding boxes around target features, but given the highly irregular shapes of TARs and their fuzzy boundaries, the problem was restricted to simply detecting TARs and/or partial TARs in an entire square tile. The HiRISE images were thus split into 100 × 100 tiles (50 × 50 m). Random samples (200) were taken from each of the 91 training images. Tiles that overlapped the edge of the HiRISE images (i.e., contained 0 or NaN values) were excluded from the sampling process. This sampling produced 18,200 tiles in total.
2.2. Classes and Data Labeling
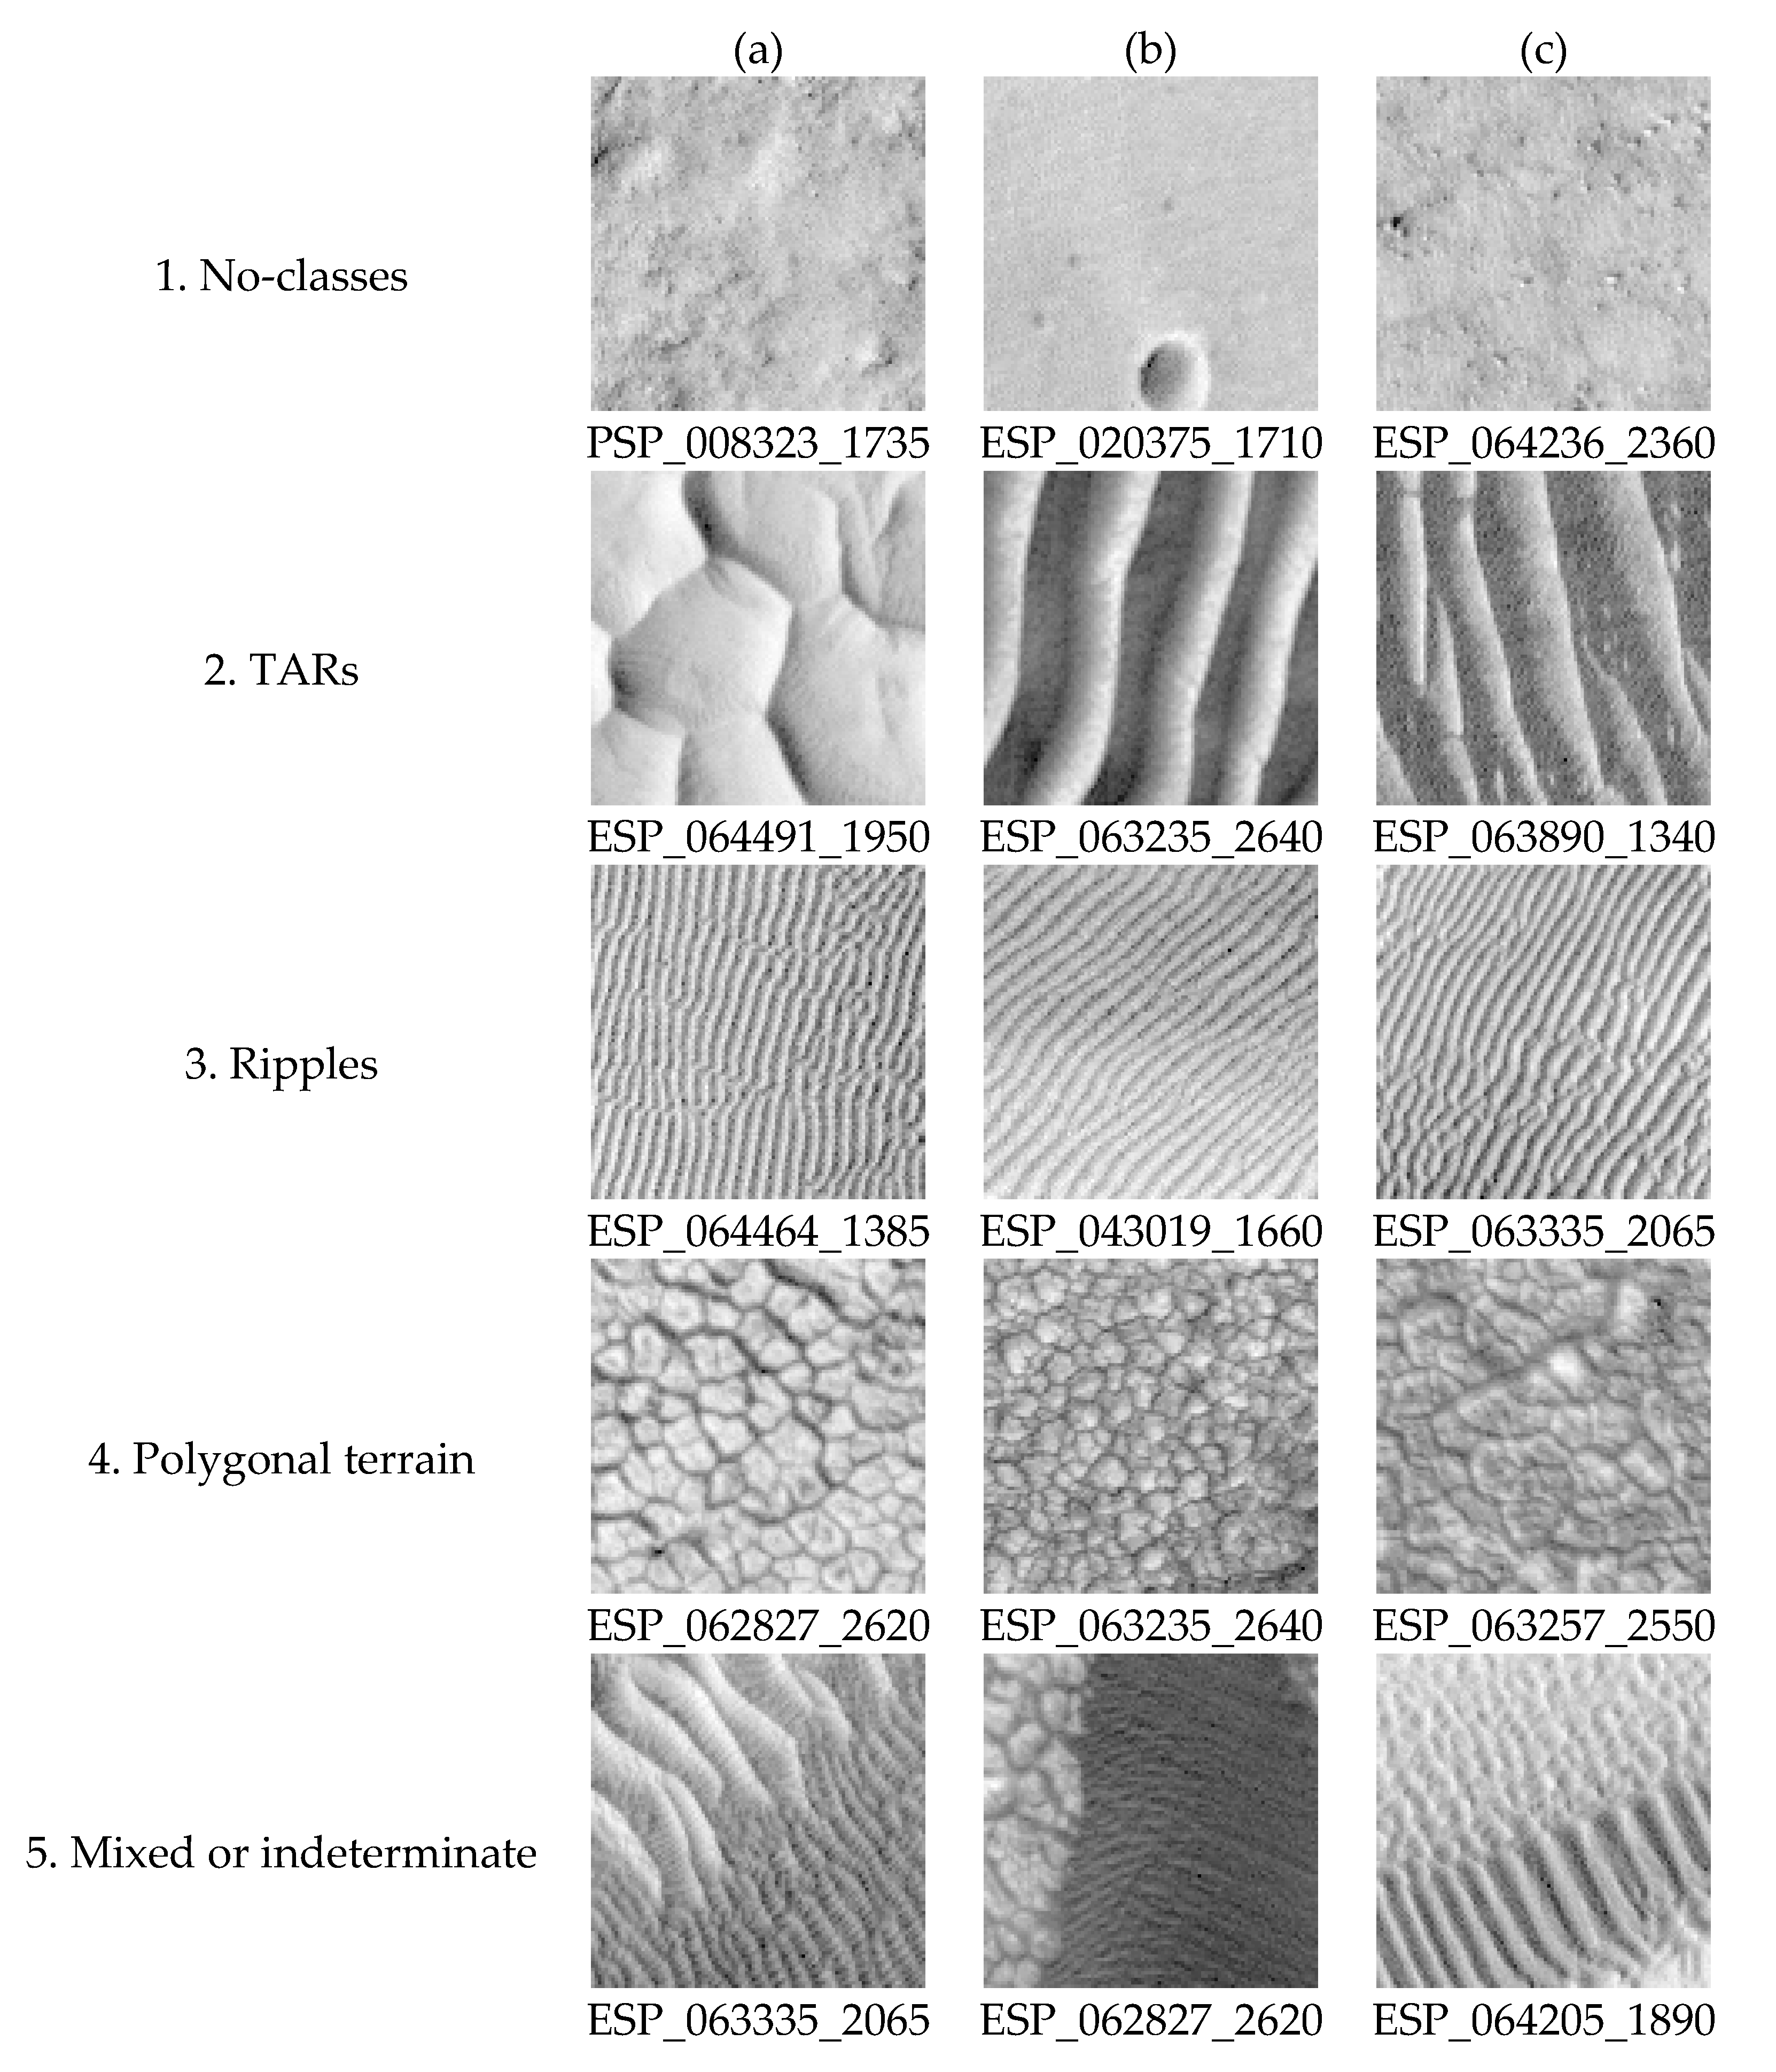
The initial approach to this problem was focused on simple binary identification: “TARs” or “not-TARs”. However, preliminary testing with RetinaNet showed some confusion between TARs and other surface features that appeared very similar to TARs such as ripples, polygonal terrain, and some bedrock ridges. To compensate, two additional “negative” classes were added: “ripples” and “polygonal terrain”. The bedrock ridges were much less likely to be confused, and after further testing, it was apparent that there was no need for an additional bedrock ridge class. In total, four mutually exclusive classes [63] were used: “No-classes” (Figure 1(1a–c)), “TARs” (Figure 1(2a–c)), “Ripples” (Figure 1(3a–c)), and “Polygonal terrain” (Figure 1(4a–c)). The addition of the negative classes (“ripples” and “polygonal terrain”) allowed the network to discriminate better between TARs and other very similar features. Samples with mixed or indeterminate classes (Figure 1(5a–c)) were not labeled.
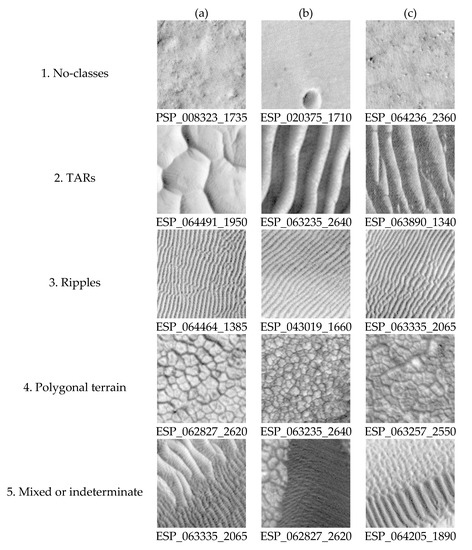
Figure 1.
A set of example tiles. All tiles are 100 × 100 pixels (50 × 50 m), north is up, and all images are illumined from the west. Note the difference in wavelength between TARs (2) and ripples (3). Note also the similarity between the more networked TARs in (2a) and the polygonal terrain (4). Mixed tiles (5) were excluded from labeling and training. (5a) contains TARs and dark ripples, (5b) contains dark ripples and polygonal terrain, and (5c) contains darker TARs and light ripples.
All of the tiles were manually labeled by a Martian geomorphologist (the first author) experienced with HiRISE imagery using an adapted version of click2label (https://github.com/gmorinan/click2label) [64]. The labeled tiles were reviewed by two additional Mars geomorphologists (the third author and a non-author PhD candidate) to ensure accuracy. “No-classes” tiles were the most common (44.4%), followed by “TARs” (32.5%), ripples (16.8%), and polygonal terrain (6.2%). Since mixed or indeterminate samples were excluded, the total number of samples was reduced from 18,200 to 15,311. After the tiles were reviewed for accuracy, the data were split into three datasets: train (75%, 11,483 samples), validation (10%, 1531), and test (15%, 2297 samples).
During training, the model updates its parameters based on the training dataset. After each pass through the training data (an epoch), the model is tested against the validation dataset, which provides an unbiased evaluation of the model’s performance against data it knows (training) versus new data (validation) and can help tune hyperparameters and improve model generalization. The model is never exposed to the test data while training and the test data are reserved until the model is finalized. The test data provide an unbiased assessment of the final model’s performance.
2.3. Model Training
This project used the Python implementation of Keras RetinaNet (https://github.com/fizyr/keras-retinanet) [65] and was trained on RetinaNet50 (using the shallowest ResNet with 50 layers) using transfer learning. The model used initial weights derived from a model trained for the 500 classes COCO dataset (https://cocodataset.org/#home) (resnet50_coco_best_v2.1.0.h5 from https://github.com/fizyr/keras-retinanet/releases), but the model’s backbone was left unfrozen. Freezing the backbone is an option that limits the number of parameters that can be adjusted by the model (from 3.6 × 10⁷ to 1.2 × 10⁷) in order to preserve some original characteristics of the initial model. In this case, leaving the parameters unfrozen gave the model a head start on image classification (since initial weights were optimized for image classification) and reduced training time but still allowed the model to adapt to recognizing TARs.
PlaNet was trained until the training loss and the validation loss converged, indicating that the model was equally well-fit to the training data and unknown data. Training beyond this point risks overfitting the model to the training data. The model was trained with an initial learning rate of 1 × 10⁻⁵. The learning rate represents the magnitude of updates to the network’s weights after each optimization step. Testing with other learning rates (e.g., 1 × 10⁻⁴ and 1 × 10⁻⁶) led to models that either overfit (i.e., converged after a single epoch) or that never converged (asymptotic out to 50 epochs).
In this case, training and validation loss converged at 15 epochs with a batch size of four. The 11,483 training samples were augmented after each epoch via the application of various affine transformations, including rotations, translations, shears, scaling, and flips, to help the model generalize. Due to this augmentation, the model was in effect trained on 172,245 labeled samples.
2.4. Training Hardware
PlaNet was trained on consumer-grade hardware: a NVIDIA GeForce GTX 1060 GPU (NVIDIA 2701 San Tomas Expressway Santa Clara, CA 95050 USA) with 6GB of VRAM and 1280 CUDA cores, an Intel i7-7700HQ CPU (2200 Mission College Blvd. Santa Clara CA 95052 USA), and 32 GB of 2667 MHz RAM (Crucial Technology 3475 E. Commercial Ct. Meridian ID 83642 USA). With this hardware, each epoch of the model took ~3700 s (62 min). In total, the final model trained in just over 16 h. The model was trained on a machine running Microsoft Windows 10.0.1.18363 (3800 148th Ave NE Redmond 98052 WA USA).
2.5. Test Case
To assess PlaNet’s efficacy in mapping the spatial distribution of TARs, an additional HiRISE image (not included in the 91 training images; ESP_050100_2110) was fully split into 100 × 100 pixel tiles, and the 55,597 tiles were fed through the final PlaNet model. The labels and scores were then combined into an overlay for the original HiRISE image.
3. Results
3.1. Feature Detection
RetinaNet provides three outputs for each identification: a label (predicted class), a score (how confident the model is of its label), and a bounding box around the feature. The user must select a minimum confidence threshold when evaluating the model, and an intersection-over-union value (IoU) (how much of the model’s bounding box must overlap with a labeled box to be counted as correct) to determine correct detections. For example, a confidence threshold of 0.4 and an IoU of 0.75 would only count detections that the network is 40% sure of and that overlap 75% by area with the target as a correct identification. In this case, and since the model was trained on tiles, every detected bounding box and labeled box were the full extent of each tile: 100 × 100 pixels.
PlaNet was evaluated with four different standard metrics: (1) precision, (2) recall, (3) F1-score, and (4) average precision [66,67]. These metrics are evaluated from three other quantities calculated during testing: (1) true positives (TPs, model correctly identified the target), false negatives (FNs, model missed the target), and (3) false positives (FPs, model incorrectly identified another object as a target).
None of these metrics is more important since each describes a different aspect of the network’s performance. However, when combined, they paint a full picture of the general network behavior. Recall is the overall fraction of the total targets detected (e.g., 23 out of 25 targets were detected, recall = 0.92). Precision describes the number of correct detections this network makes as a fraction of the network’s total detections and is thus a measure of the network’s reliability (e.g., of the network’s 80 detections, 68 were correct, precision = 0.85). In the best case, both values would both be 1.00, indicating that the model detected all of the targets (recall), and every detection was correct (precision). The F1 score is simply the harmonic mean of recall and precision and quantifies the relationship between the two and is especially useful when there are many FNs. Lastly, the average precision (AP) describes the overall stability of the relation between recall and precision across confidence thresholds.
For evaluation, the detection was reduced to a binary choice of “TARs” or “not-TARs” (combining “no-classes”, “ripples”, and “polygonal terrain”). The confidence threshold of 0.6 was selected as the most effective balance of precision and recall (Table 1). Thus, with a confidence threshold of 0.6 and an IoU of 0.5 (since the model is classifying entire tiles, each overlap should in theory be 1.0, but 0.5 leaves room for variation), the model had a precision of 0.929, recall of 0.357, and an F1-score of 0.516. This can be interpreted as the network missing many TARs (FNs are relatively common, 64% are undetected), but being very accurate when it does make a detection (FPs are very uncommon, only 7% of detections were incorrect). Overall, PlaNet had an AP of 0.602, which is more than double what would be expected from random selection among four classes: 0.25.

Table 1.
Model performance metrics.
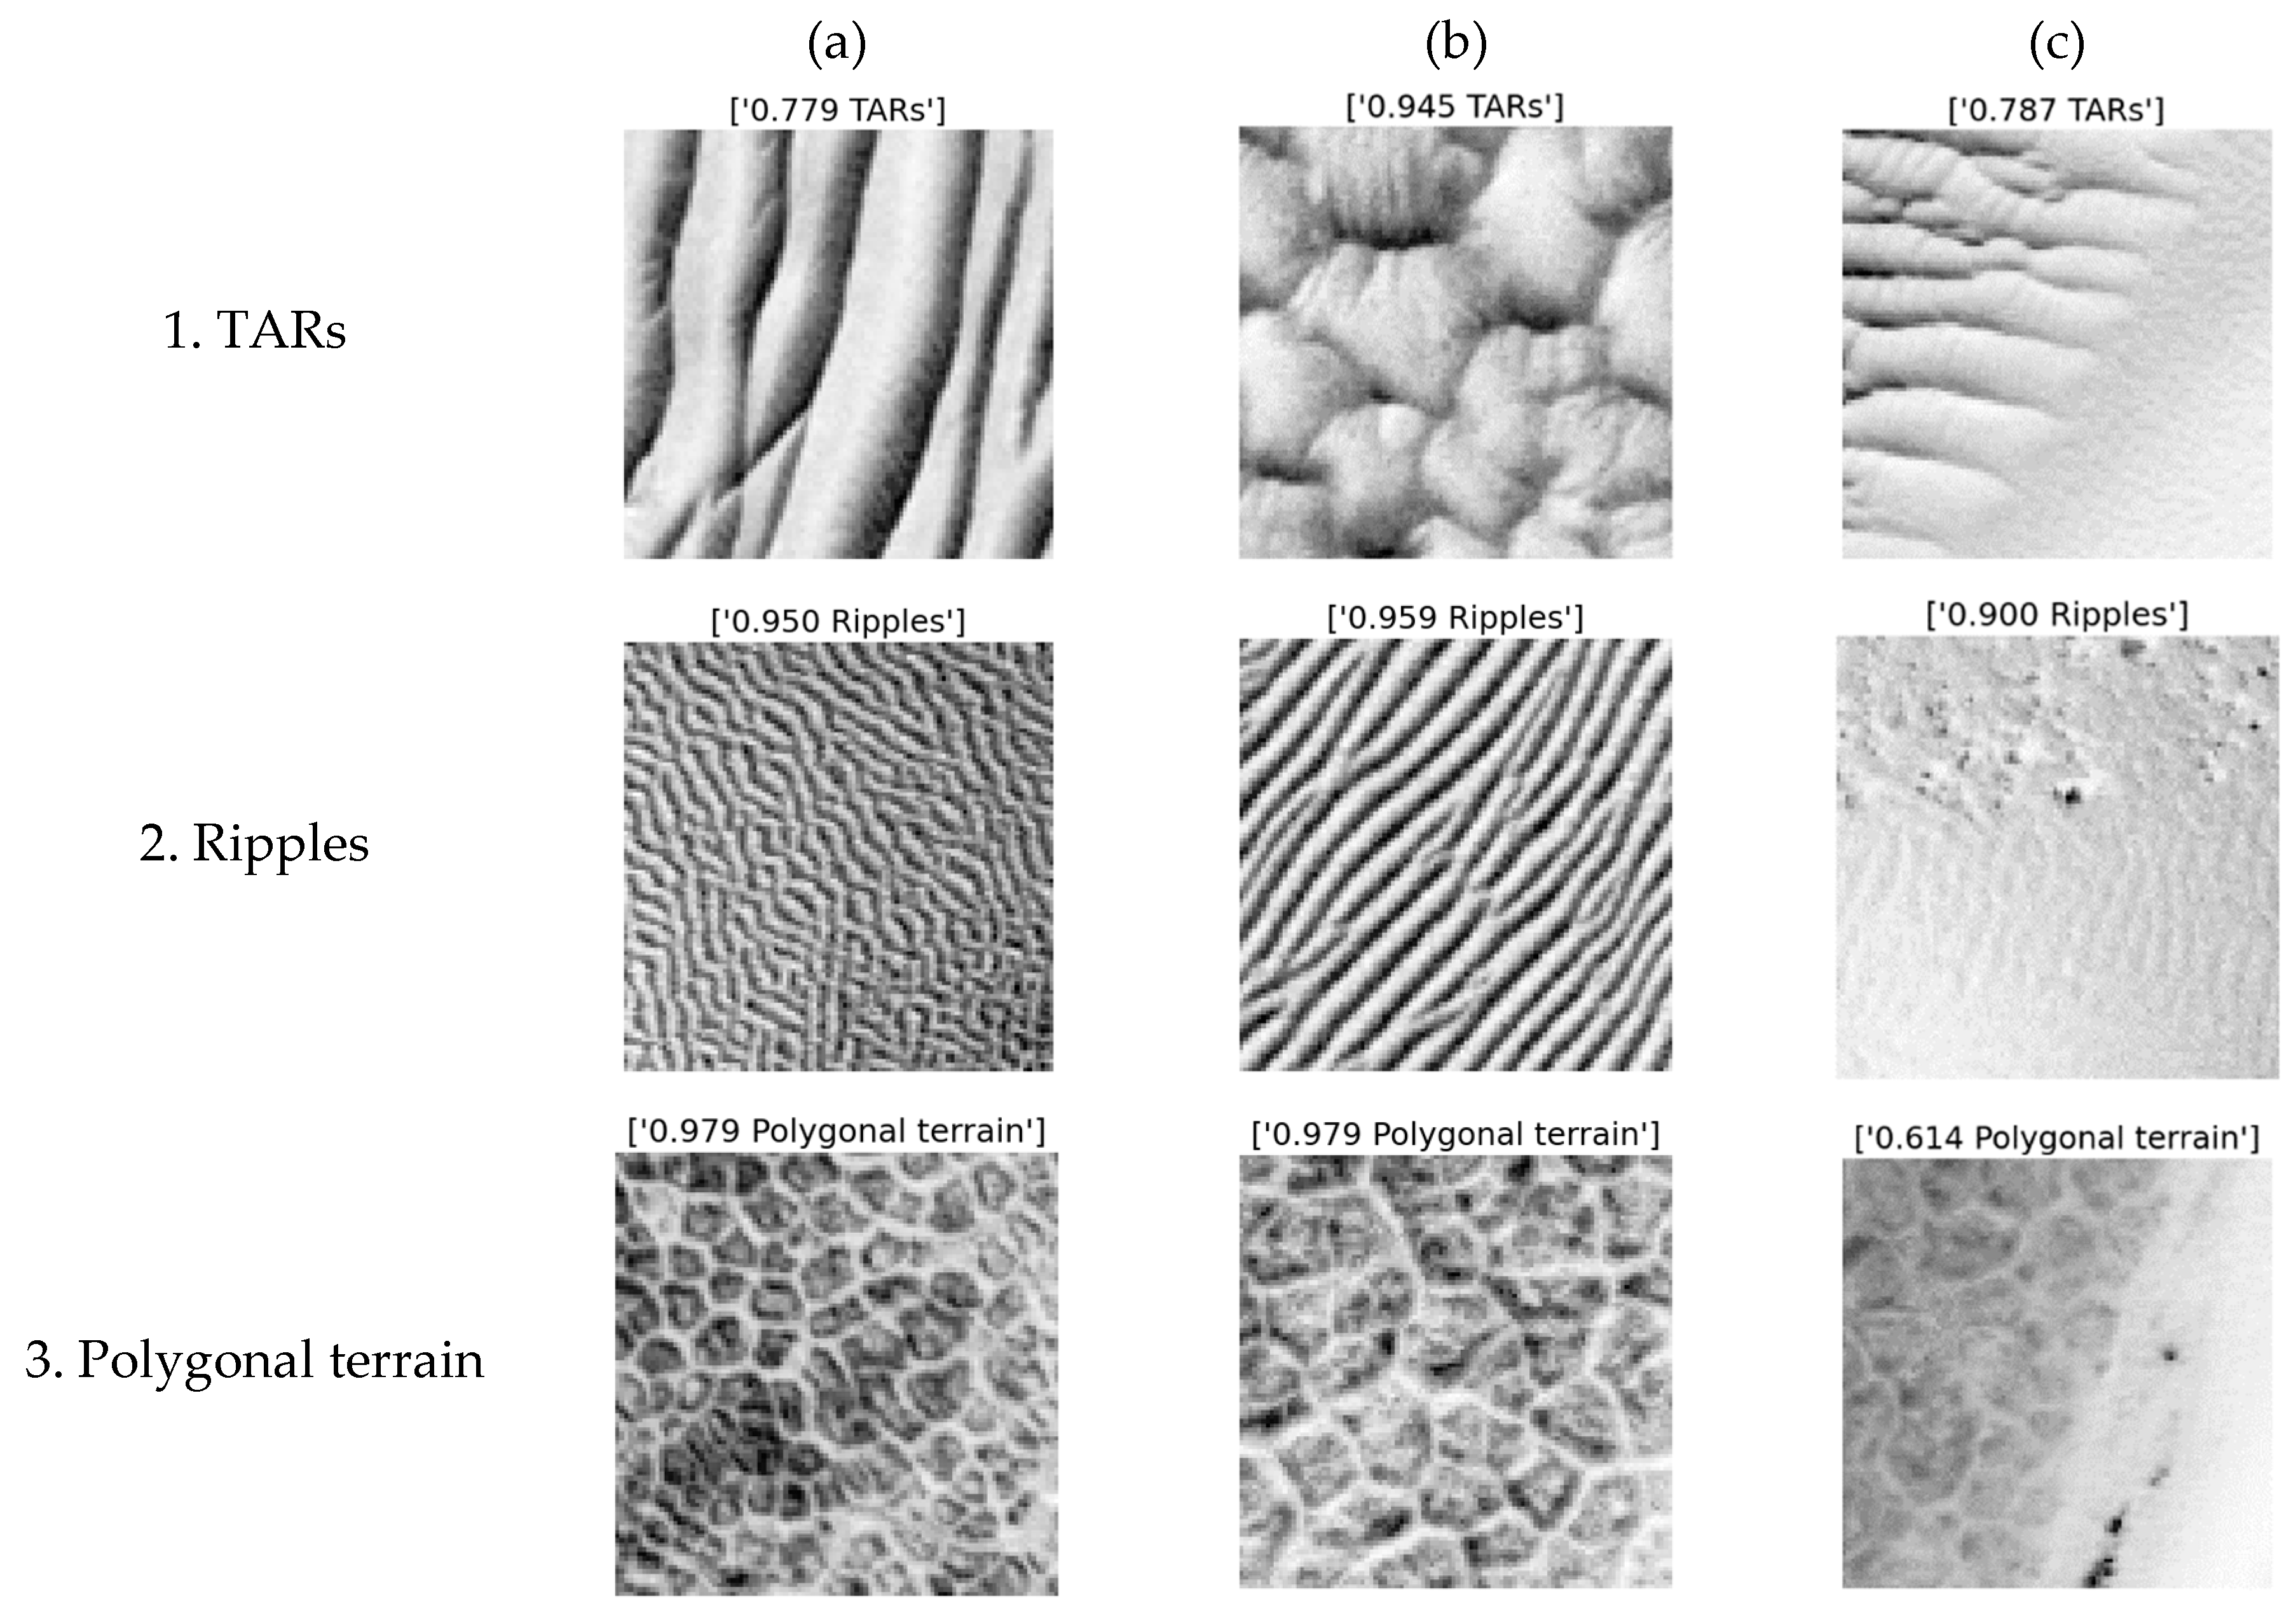
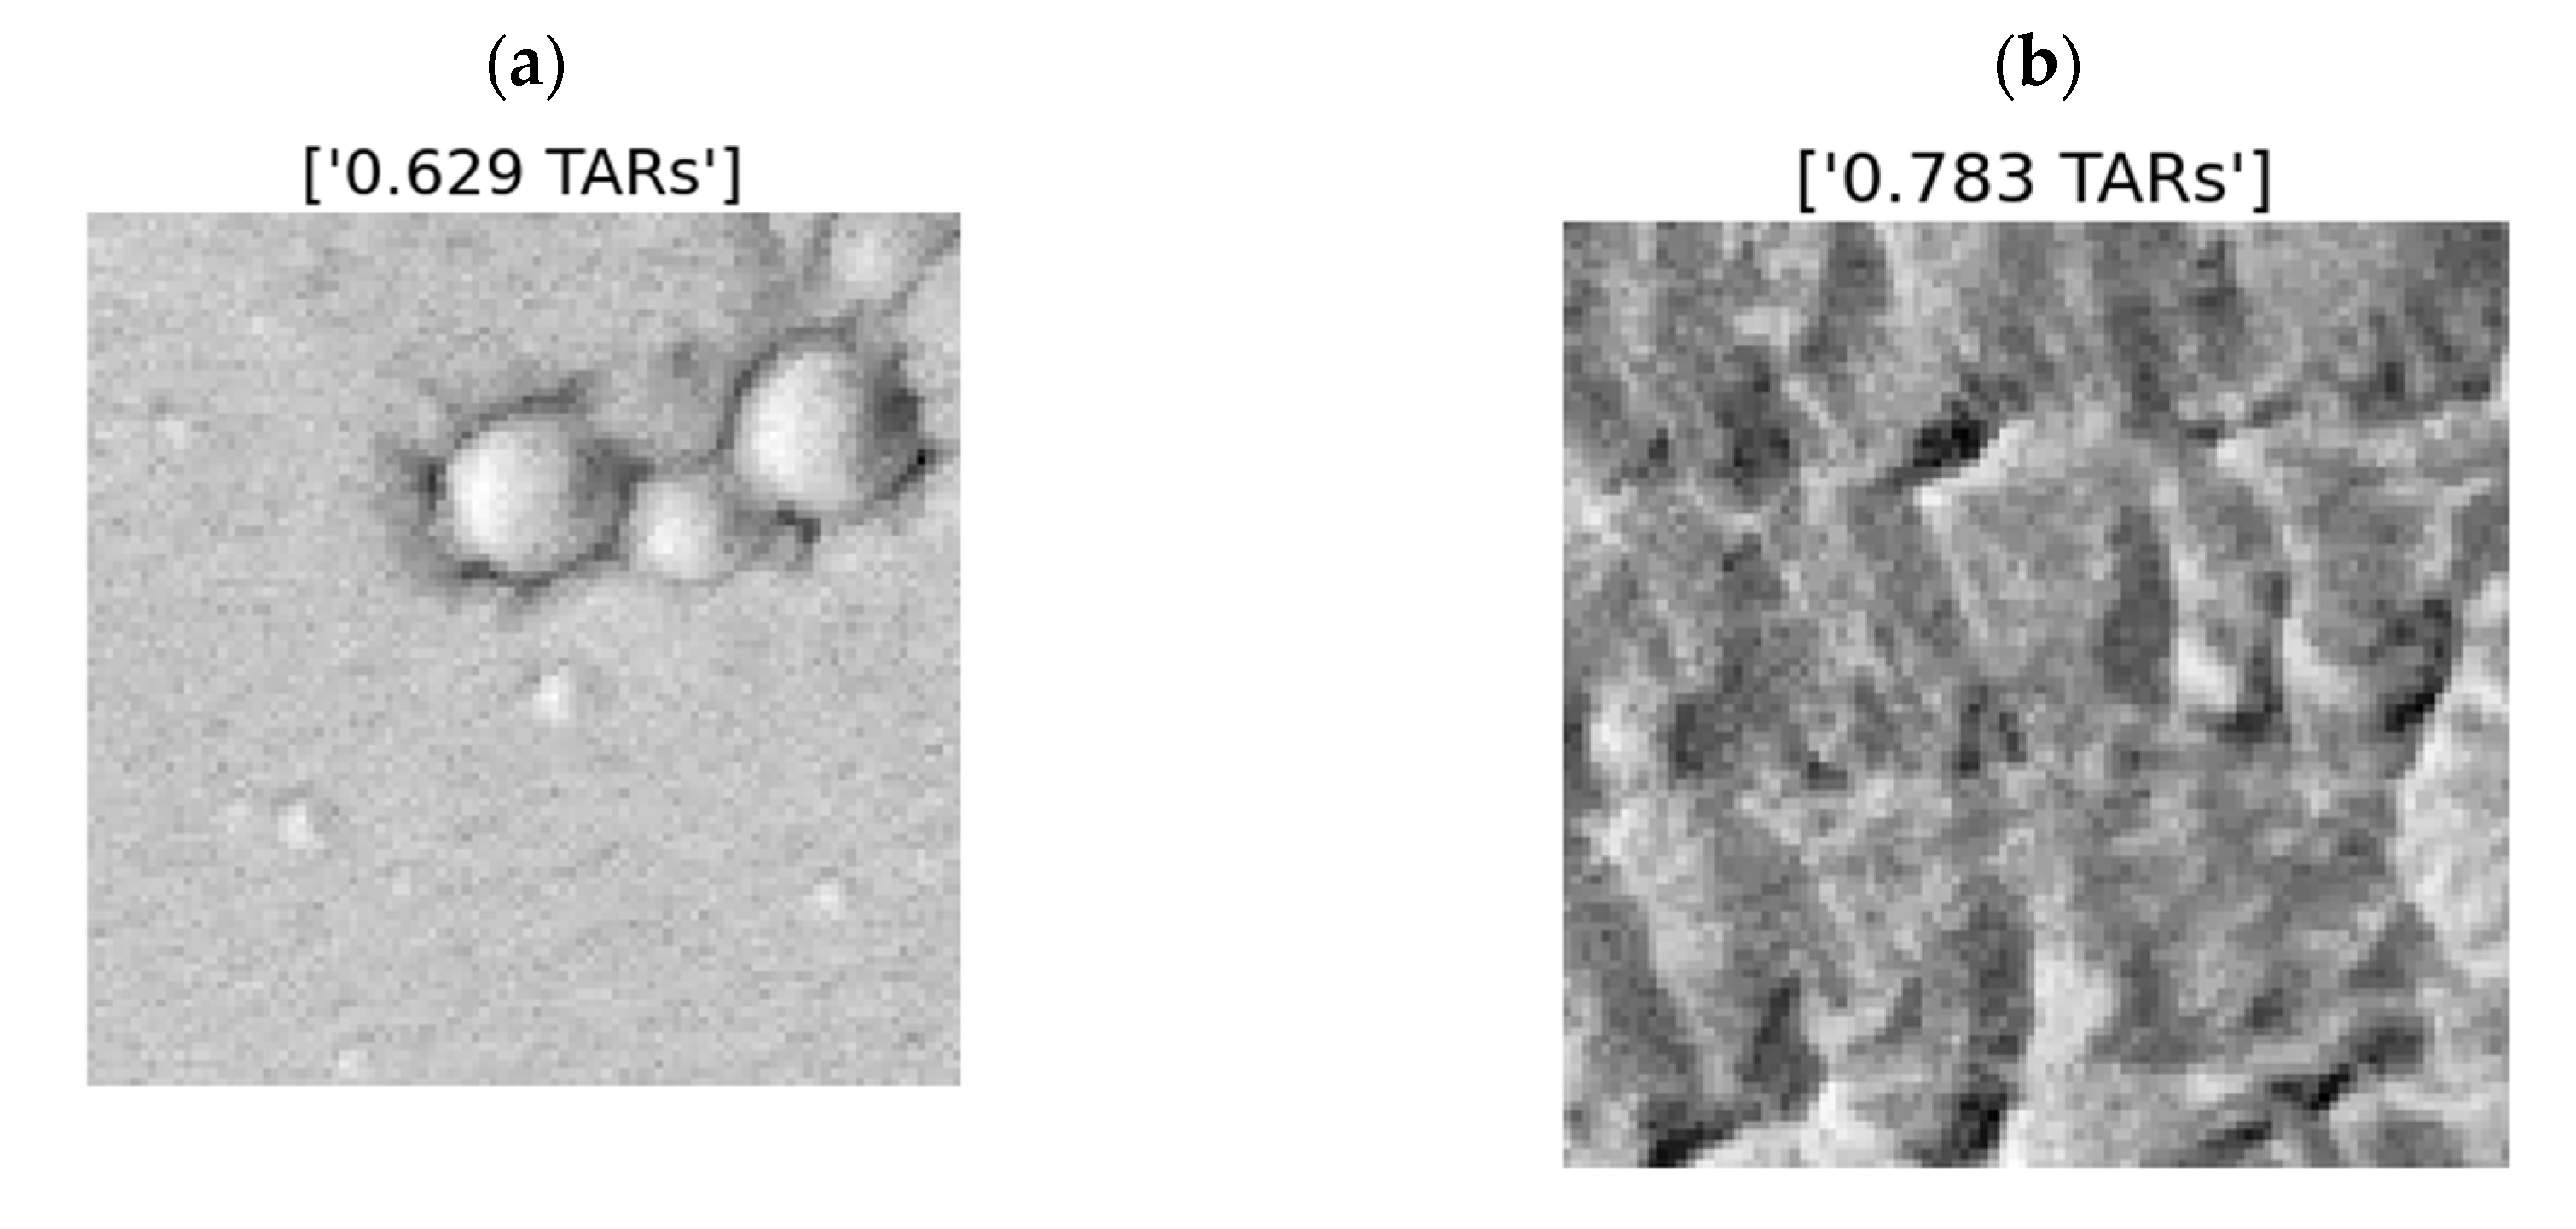
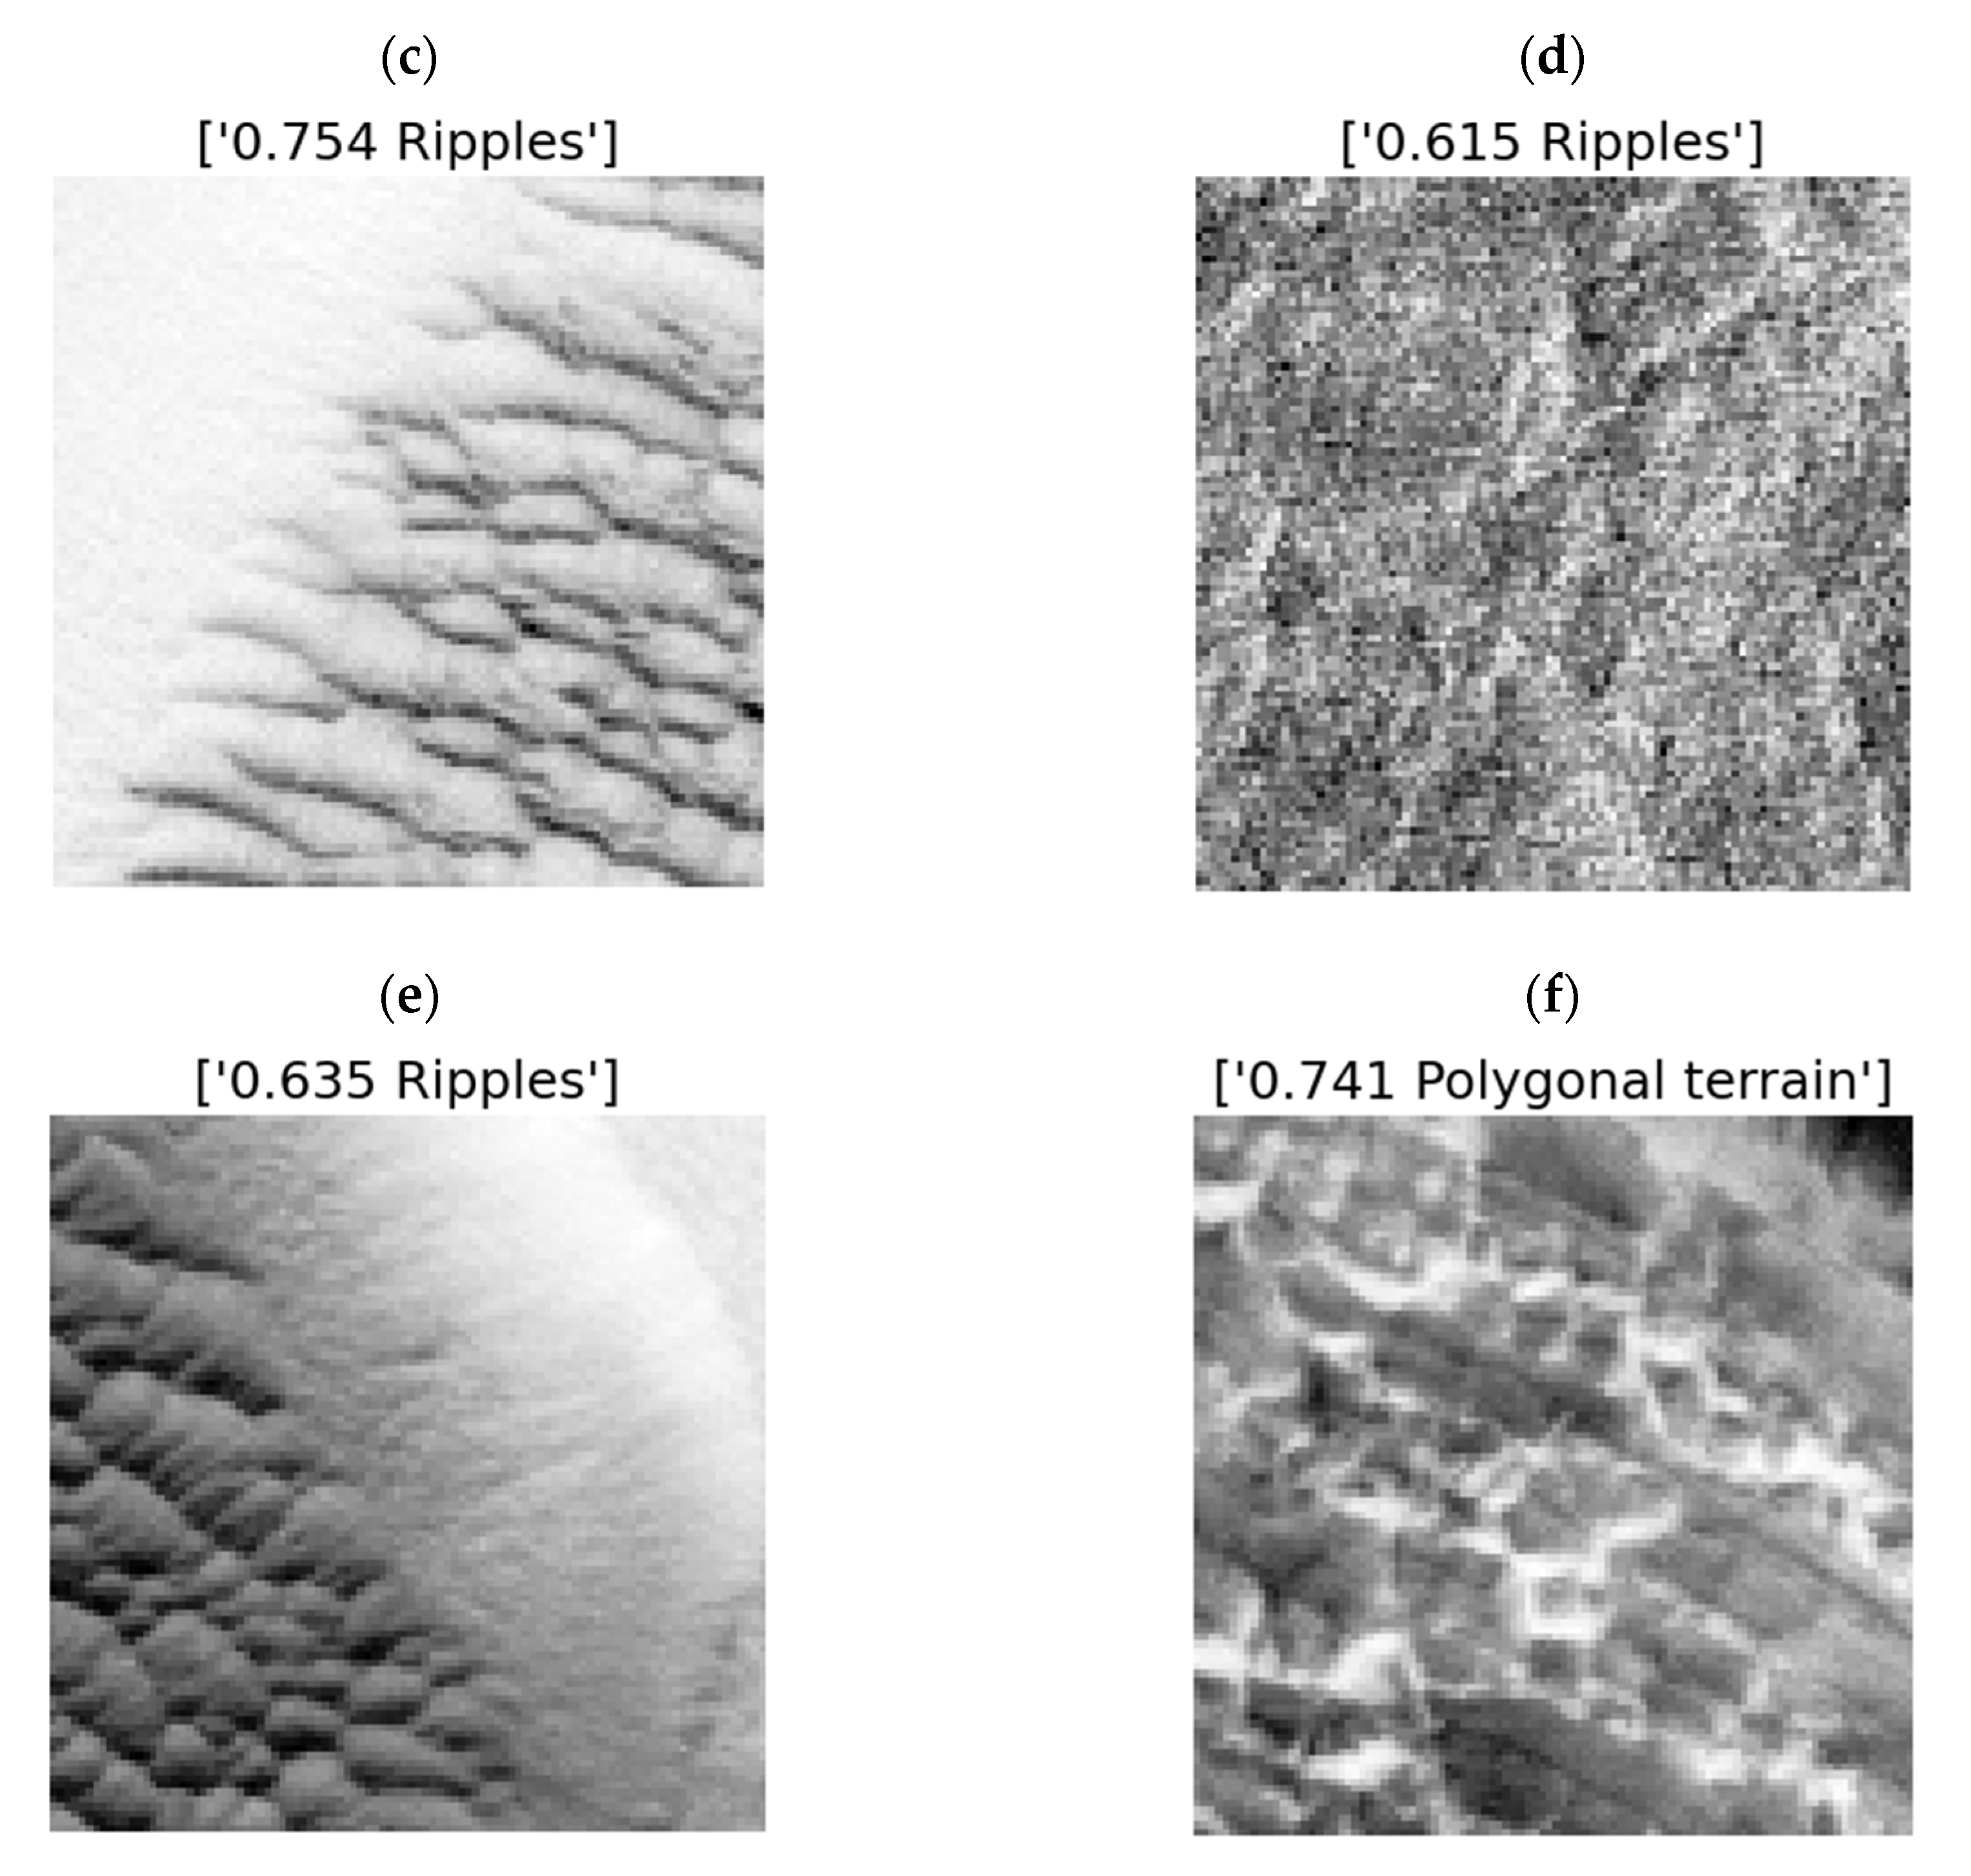
PlaNetwas also effective in identifying “ripples” and “polygonal terrain” despite their much more limited presence in the dataset (Figure 2). A confusion matrix was used to quantify misclassifications in the network’s detections (Table 2) (Figure 3). “No-classes” was the most common misclassification for each of the other classes (“TARs” 5.6%, “ripples” 4.6%, “polygonal terrain” 5%), but “ripples” were notably mistaken for “TARs” (3.8%).
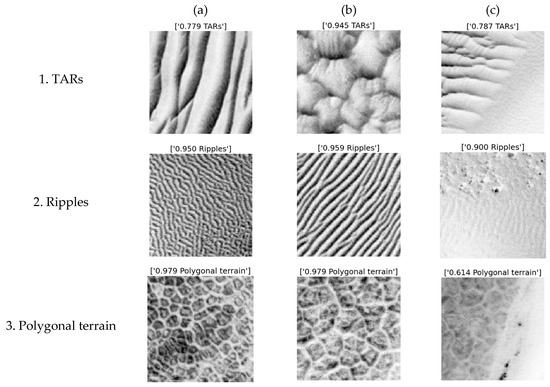
Figure 2.
Correct identifications. The text above each image is the model’s score and label. Note the range of TAR (row 1) and ripple (row 2) morphologies that were correctly identified, and the model’s performance on impure tiles (column c).

Table 2.
The normalized network confusion matrix.
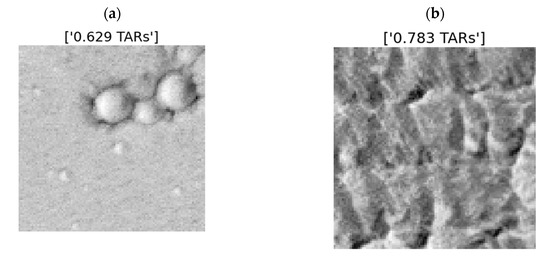
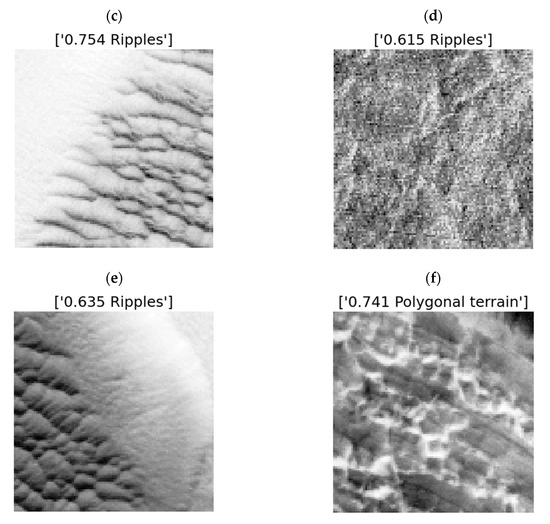
Figure 3.
Rare incorrect detections. The text above each image is the model’s score and label. (a) Craters likely misclassified as networked TARs. Note the similarity to Figure 3(1b). (b) Hummocky terrain misclassified as TARs. (c) Dark TARs misclassified as ripples. (d) No-class terrain misclassified as ripples. The regular roughly horizontal banding error in the image is a likely cause. (e) Dark TARs again misclassified as ripples. (f) Unusually illuminated terrain misclassified as polygonal.
3.2. Test Application
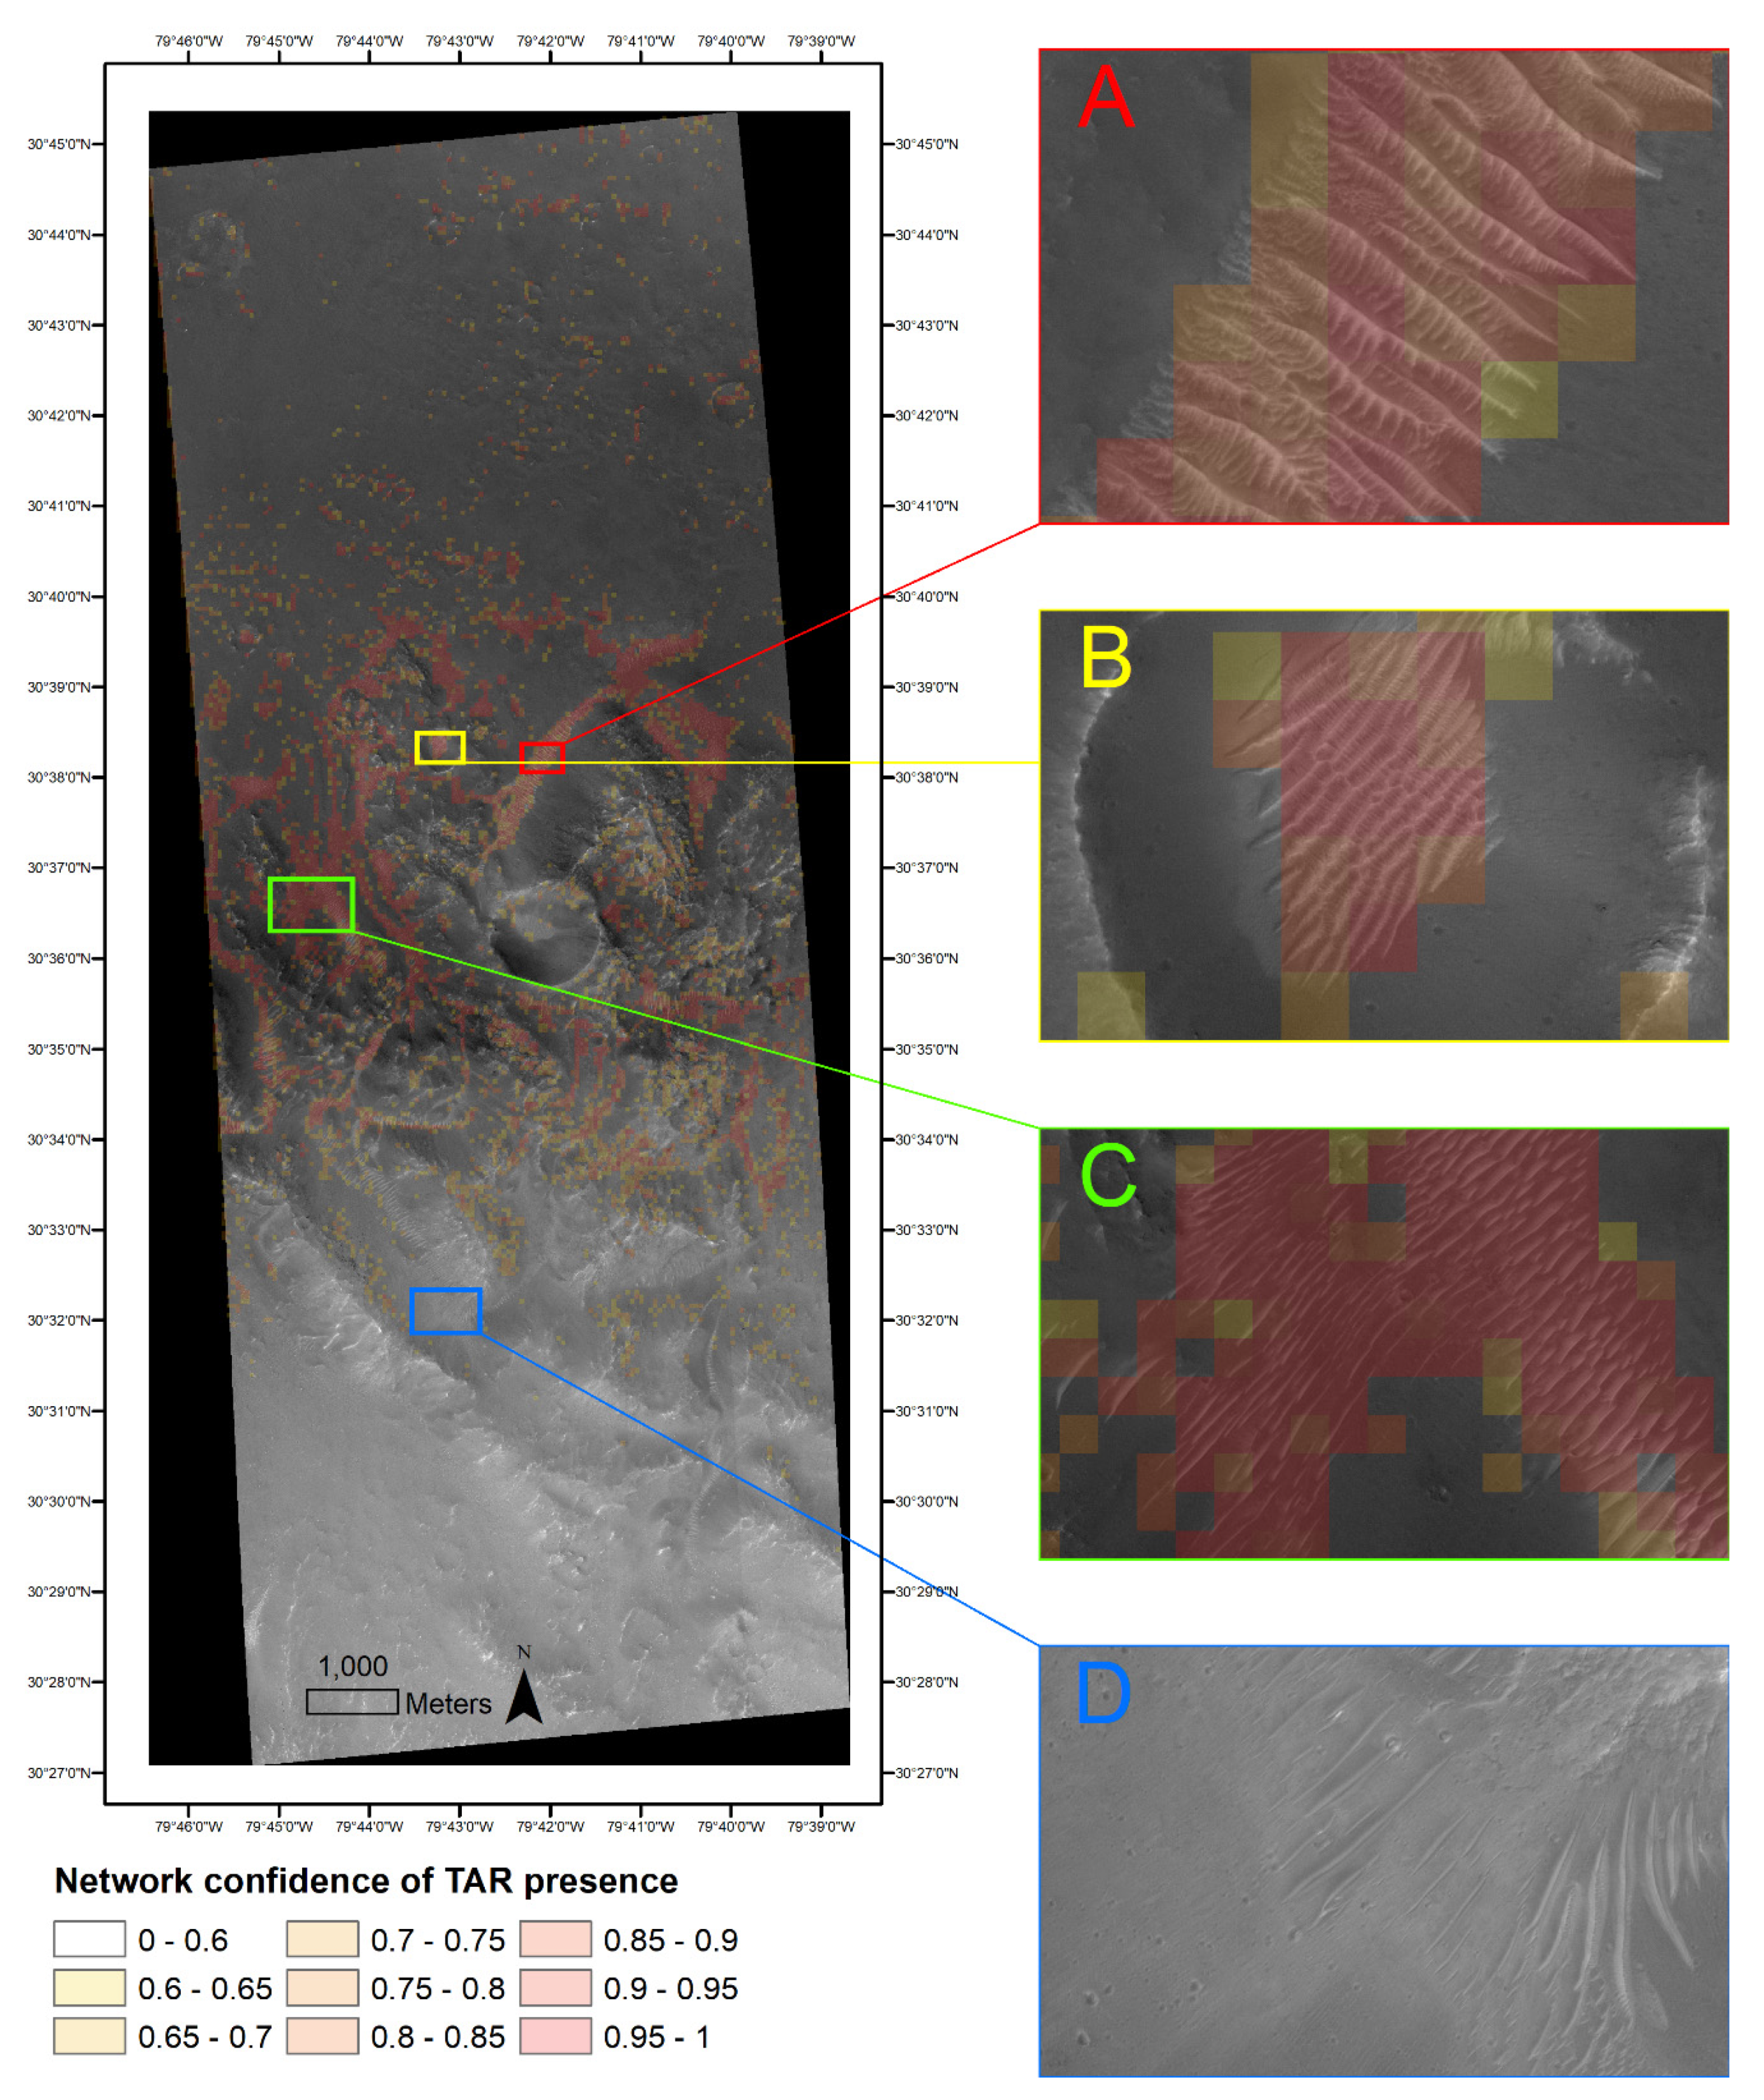
The time to process each tile through PlaNet was <0.25 s. However, since the entire image was composed of ~55,000 tiles, processing the entire image took over three hours. A transparent overlay was generated from the tile labels and scores and layered over the source image (Figure 4). At 50 × 50 m resolution, the overlay offers a rapid assessment of the number of TARs in the image and visualizes their distribution.
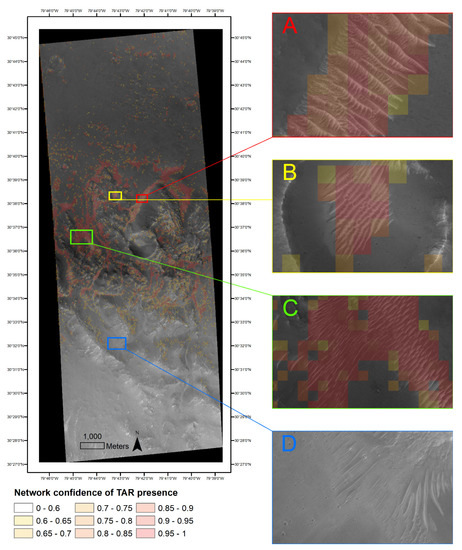
Figure 4.
The test image with network overlay. Warmer colors indicate greater confidence in the network’s label. Tiles below the confidence threshold of 60% are not labeled. The four insets (A–D) show detailed views of network detections and TAR morphologies.
4. Discussion
4.1. Detection and Class Confusion
The trend in recall values illustrated in Table 1 is interesting due to its stability at low confidence values. The inverse relationship between precision and recall is expected, but the plateauing of recall at around 0.4 suggests that the network is not confident enough to make any classification for most of the test tiles. This behavior suggests that the network either needs additional training to increase its confidence or a larger set of training samples to improve its generalization.
That said, PlaNet proved to be reliable (high precision: few FPs) at a confidence threshold of 0.6 (Table 1). This means that when the network makes a detection, it is usually right. The opposite (high recall: few FNs) would mean that the network makes many more detections but many of them might be wrong. In some cases, high recall is preferable. For example, for a self-driving car that automatically detects pedestrians, FNs must be minimized to prevent collisions and save lives; over-detection of pedestrian-like objects is better. However, since this network was designed to help Martian geomorphologists quickly identify TARs, high precision is preferred since forcing a human reviewer to sort through many FPs in order to locate TP TARs is only marginally better than having no machine assistance at all.
Due to the low-dimensionality of the HiRISE dataset, PlaNet is limited to classifications based on textural information. Fortunately, the textural appearance of the three classes identified here (“TARs”, “ripples”, and “polygonal terrain”) is relatively distinct from much of the Martian surface. However, TARs in particular have a wide range of possible appearances (see Figure 2(1a–c)) so the network’s ability to make correct detections across the different morphologies is very positive. The slightly higher confusion between some TARs and ripples is not surprising because RetinaNet is a scale-invariant detector (due to the feature pyramid network), and TARs and ripples can appear nearly identical, excluding size (compare Figure 2(1a,2b)). It is promising that these confusions were limited, and the network was capable of differentiating between the two in most cases. Similarly, more networked TARs (i.e., Figure 2(1b)) can appear very similar to craters (Figure 3a) or to polygonal terrain if inverted (Figure 2(3a–c)). Confusion between TARs and polygonal terrain was much more limited, but more testing should be aware of these potential confusions.
4.2. Test Application
The test application helps illustrate the strengths and weaknesses of PlaNet. The network made significantly more correct detections with high confidence values and successfully identified the largest TAR fields in the image. However, the network appears to perform better in higher contrast areas (see Figure 4A–C versus D). In the northern half of the image, where surface tones are darker, the detections are more frequent, have higher scores, and appear more accurate. This could be due to an unintentional bias in the training data against low-contrast images, or it could possibly be a by-product of convolutions and transformations which the network applies to make its detection. Further, the network is more confident in TAR detections in the middle of TAR fields, where tiles are entirely covered in TARs, than at field edges. This is not to say that detections at the edges of TAR fields are systematically less certain, but rather an observation that low-confidence values are almost never found surrounded by high confidence values, while the opposite is more common (notably Figure 4A,B). This effect could be because tiles with fewer TARs will have partial TARs that are less obviously TARs, or because the training data unintentionally underrepresented edge-field TARs. Both high-level observations of network behavior indicate points for future improvement, and more full-image testing could help identify further such examples.
The primary weakness of this and other networks [25] is generalization. HiRISE has taken more than 60,000 images, so even with 91 random training images, it is unlikely that the network would be able to characterize TARs over the entire surface of Mars, especially given the range of illumination and seasonal variability. More tests of generalization are required to assess how broadly the network can be applied without significant revision. However, test results from our application are promising, especially when applied to completely new images. At 60% confidence, the network appears to have high precision and low recall (few FPs, many FNs), similar to its performance on the labeled test data. However, a number of FPs with relatively low confidence values (i.e., <70%, yellow in Figure 4) were observed. Creating variable overlays with dynamic confidence levels could help with interpretation and improve model results.
Removing edge tiles from the training, validation, and test datasets did not have any obvious detrimental effects on the application of PlaNet to a real-world dataset. No systematic edge effect was present in the network’s output. There were a higher number of detections along the left side of the image (Figure 4) compared to the other sides, but upon closer inspection, most of those detections did correspond to TARs.
4.3. Method Novelty
PlaNet uses both a unique tile-based methodology and a unique object ontology among RetinaNet applications. RetinaNet was designed to locate (draw a box around) discrete objects in noisy backgrounds [35,43], but here, we have adapted RetinaNet to solve a fuzzy classification problem. Generally, TARs and ripples could be mapped in two ways: demarking the extent of TAR/ripple fields or by locating each component feature (i.e., TAR or ripple crests [68]). A standard RetinaNet could possibly be trained to bound individual ridges, but this is a secondary problem to locating TAR fields themselves. Further, it would be difficult to generalize a crest-based classification because individual ridges are often overlapping, hard to identify, and can have dissimilar appearances (i.e., Figure 2(1a versus 1b)). Thus, a feature-collective classification approach is more appropriate (e.g., identifying bird flocks not individual creatures). However, TAR fields have fuzzy boundaries (i.e., ambiguous and discontinuous) themselves and are not the type of discrete objects which RetinaNet was designed to locate (e.g., boulders [37], ships [61], manhole covers [69], etc.). For example, in Figure 4, it would be difficult to draw bounding boxes around the TAR fields in the raw imagery in an objective and repeatable manner.
PlaNet thus adapts the typical RetinaNet framework to a tile-based classifying function (rather than locating function) that produces maps where the spatial relationships between surface cover can be derived from classification scores. This is a new application of RetinaNet which has not been documented in the literature. PlaNet demonstrates that off-the-shelf deep convolutional networks can be readily adapted to different conceptualizations of “objects” and specifically that object-based identification can be adapted to fuzzy classifications. This innovation has implications beyond the application presented here. For example, the land cover conceptualization applied here could be used on Earth to map other fuzzy features like barchan dunes, mountain ranges, or cirques.
4.4. Implications for TAR Science
As has been widely noted in the TAR literature, understanding TAR formation and evolution will require a large amount of data to draw systematic correlations and conclusions [1,2,3,24]. Admirable manual surveys of TARs have been done [1,2,3] but have been limited in their scope, using visual estimates of TAR coverage in images taken from different pole-to-pole transects. PlaNet offers a more objective, quantitative, and repeatable methodology for mapping TARs that requires less human labor. Even if the network is only useful for highlighting areas of interest, reducing the areas that must be manually examined would greatly speed up manual surveys and would thus be a useful tool for surficial geomorphologists.
4.5. Further Applications
This study demonstrates that RetinaNet could easily be applied when classifying other categories of the Martian surface. For example, researchers interested in ripple dynamics could use RetinaNet to automatically locate areas with dense rippling, scientists interested in mass wasting and transport could locate areas with dense boulder fields, and those interested in the cryosphere could locate ice sublimation. Additionally, this method is not restricted to high-resolution imagery. It could easily be adapted to databases such as the Mars Orbiter Camera (MOC) [70] or Context Camera (CTX) [71], which are lower in resolution but much more comprehensive than HiRISE’s ~2% global coverage. Thus, PlaNet offers a new methodology that has the potential to map fuzzy features across Mars.
5. Conclusions
Here, we demonstrate the strong potential for using a simple off-the-shelf neural network for efficient identification of TARs in HiRISE imagery. RetinaNet was applied to this problem with minimum modification and showed that it could be used to correctly identify TARs and other surface features after a short amount of training. Our final model, PlaNet, trained in 15 epochs and validated the accessibility of off-the-shelf state-of-the-art detectors: no high-end hardware was required. The network already could already be useful for global surveys of TAR density, and we anticipate future development to improve our model’s utility. As a by-product of our classification and training methods, we found that our model was also good at identifying ripples and polygonal terrain, even though they were vastly underrepresented in the training data. Our results therefore have promising implications for helping to locate other surface features.
In the future, we hope to improve the PlaNet model by incorporating more training data as needed (i.e., including more low-contrast images), by augmenting the existing training data via the addition of random noise to the images, and by varying the overall contrast of the images. We further hope to implement and test additional RetinaNet backbones, as previous studies have sometimes found better performance using deeper backbones. These changes will require entirely retraining the network and comparing the results but have the potential to improve the already promising results presented here.
Supplementary Materials
The following are available online at http://dx.doi.org/10.5281/zenodo.4072270: Table S1: the list of images used to generated training data, File S2: the final model used in this study, and File S3: the training model if more training is desired.
Author Contributions
Conceptualization, T.N.-M.; Methodology, T.N.-M.; Validation, T.N.-M. and L.S.; Formal Analysis, T.N.-M.; Investigation, T.N.-M.; Resources, T.N.-M. and L.S.; Data Curation, T.N.-M.; Writing—Original Draft Preparation, T.N.-M.; Writing—Review and Editing, T.N.-M., T.M. and L.S.; Visualization, T.N.-M.; Supervision, T.M. and L.S.; Project Administration, L.S.; Funding Acquisition, T.N.-M. and L.S. All authors have read and agreed to the published version of the manuscript.
Funding
This project was supported by NASA Doctoral Fellowship 80NSSC19K1676.
Acknowledgments
The authors would like to thank: Kiri Wagstaff for her encouragement and advice at the start of this project; Christopher Lippitt for his input on the tiling methodology; both Maria Banks and David Hollibaugh Baker for their help along the way; Joshua Williams for reviewing the labeled tiles; and Nicholas Erickson for his review of an early draft of this manuscript. Further, the authors would like to thank the three anonymous reviewers who offered comments that greatly improved this manuscript. The authors would like to specifically thank Reviewer 2 for their suggestion of the model’s moniker.
Conflicts of Interest
The authors declare no conflict of interest.
References
- Wilson, S.A.; Zimbelman, J.R. Latitude-dependent nature and physical characteristics of transverse aeolian ridges on Mars. J. Geophys. Res. E Planets 2004, 109, 1–12. [Google Scholar] [CrossRef]
- Balme, M.; Berman, D.C.; Bourke, M.C.; Zimbelman, J.R. Transverse Aeolian Ridges (TARs) on Mars. Geomorphology 2008, 101, 703–720. [Google Scholar] [CrossRef]
- Berman, D.C.; Balme, M.R.; Rafkin, S.C.R.; Zimbelman, J.R. Transverse Aeolian Ridges (TARs) on Mars II: Distributions, orientations, and ages. Icarus 2011, 213, 116–130. [Google Scholar] [CrossRef]
- Chojnacki, M.; Hargitai, H.; Kereszturi, Á. Encyclopedia of Planetary Landforms; Springer: New York, NY, USA, 2015; pp. 1–6. [Google Scholar]
- Geissler, P.E.; Wilgus, J.T. The morphology of transverse aeolian ridges on Mars. Aeolian Res. 2017, 26, 63–71. [Google Scholar] [CrossRef]
- Geissler, P.E. The birth and death of TARs on mars. J. Geophys. Res. 2014, 2583–2599. [Google Scholar] [CrossRef]
- Bridges, N.T.; Bourke, M.C.; Geissler, P.E.; Banks, M.E.; Colon, C.; Diniega, S.; Golombek, M.P.; Hansen, C.J.; Mattson, S.; Mcewen, A.S.; et al. Planet-wide sand motion on mars. Geology 2012, 40, 31–34. [Google Scholar] [CrossRef]
- Hugenholtz, C.H.; Barchyn, T.E.; Favaro, E.A. Formation of periodic bedrock ridges on Earth. Aeolian Res. 2015, 18, 135–144. [Google Scholar] [CrossRef]
- de Silva, S.L.; Spagnuolo, M.G.; Bridges, N.T.; Zimbelman, J.R. Gravel-mantled megaripples of the Argentinean Puna: A model for their origin and growth with implications for Mars. Bull. Geol. Soc. Am. 2013, 125, 1912–1929. [Google Scholar] [CrossRef]
- Foroutan, M.; Zimbelman, J.R. Mega-ripples in Iran: A new analog for transverse aeolian ridges on Mars. Icarus 2016, 274, 99–105. [Google Scholar] [CrossRef]
- Foroutan, M.; Steinmetz, G.; Zimbelman, J.R.; Duguay, C.R. Megaripples at Wau-an-Namus, Libya: A new analog for similar features on Mars. Icarus 2019, 319, 840–851. [Google Scholar] [CrossRef]
- Zimbelman, J.R.; Scheidt, S.P. Precision topography of a reversing sand dune at Bruneau Dunes, Idaho, as an analog for Transverse Aeolian Ridges on Mars. Icarus 2014, 230, 29–37. [Google Scholar] [CrossRef]
- Vriend, N.M.; Jarvis, P.A. Between a ripple and a dune. Nat. Phys. 2018, 14, 741–742. [Google Scholar] [CrossRef]
- Sullivan, R.; Bridges, N.; Herkenhoff, K.; Hamilton, V.; Rubin, D. Transverse Aeolian ridges (TARs) as megaripples: Rover encounters at Meridiani Planum, Gusev, and gale. In Proceedings of the Eighth International Conference on Mars, Pasadena, CA, USA, 14–18 July 2014; Volume 1791, p. 1424. [Google Scholar]
- Zimbelman, J.R. The transition between sand ripples and megaripples on Mars. Icarus 2019, 333, 127–129. [Google Scholar] [CrossRef]
- Silvestro, S.; Chojnacki, M.; Vaz, D.A.; Cardinale, M.; Yizhaq, H.; Esposito, F. Megaripple Migration on Mars. J. Geophys. Res. Planets 2020, 125, e2020JE006446. [Google Scholar] [CrossRef]
- Hugenholtz, C.H.; Barchyn, T.E.; Boulding, A. Morphology of transverse aeolian ridges (TARs) on Mars from a large sample: Further evidence of a megaripple origin? Icarus 2017, 286, 193–201. [Google Scholar] [CrossRef]
- McEwen, A.S.; Eliason, E.M.; Bergstrom, J.W.; Bridges, N.T.; Hansen, C.J.; Delamere, W.A.; Grant, J.A.; Gulick, V.C.; Herkenhoff, K.E.; Keszthelyi, L.; et al. Mars reconnaissance orbiter’s high resolution imaging science experiment (HiRISE). J. Geophys. Res. E Planets 2007, 112, E05S02. [Google Scholar] [CrossRef]
- Grant, J.A.; Golombek, M.P.; Wilson, S.A.; Farley, K.A.; Williford, K.H.; Chen, A. The science process for selecting the landing site for the 2020 Mars rover. Planet. Space Sci. 2018, 164, 106–126. [Google Scholar] [CrossRef]
- Golombek, M.; Huertas, A.; Kipp, D.; Calef, F. Detection and Characterization of Rocks and Rock Size-Frequency Distributions at the Final Four Mars Science Laboratory Landing Sites. IJMSE 2012, 7, 1–22. [Google Scholar]
- Golombek, M.P.; Huertas, A.; Marlow, J.; McGrane, B.; Klein, C.; Martinez, M.; Arvidson, R.E.; Heet, T.; Barry, L.; Seelos, K.; et al. Size-frequency distributions of rocks on the northern plains of Mars with special reference to Phoenix landing surfaces. J. Geophys. Res. E Planets 2009, 114, 1–32. [Google Scholar] [CrossRef]
- Grant, J.A.; Wilson, S.A.; Ruff, S.W.; Golombek, M.P.; Koestler, D.L. Distribution of rocks on the Gusev Plains and on Husband Hill, Mars. Geophys. Res. Lett. 2006, 33. Available online: https://agupubs.onlinelibrary.wiley.com/doi/full/10.1029/2006GL026964 (accessed on 3 November 2020). [CrossRef]
- Golombek, M.P.; Haldemann, A.F.C.; Forsberg-Taylor, N.K.; DiMaggio, E.N.; Schroeder, R.D.; Jakosky, B.M.; Mello, M.T.; Matijevic, J.R. Rock size-frequency distributions on Mars and implications for Mars Exploration Rover landing safety and operations. J. Geophys. Res. E Planets 2003, 108. Available online: https://agupubs.onlinelibrary.wiley.com/doi/full/10.1029/2002JE002035%4010.1002/%28ISSN%292169-9100.ROVER1 (accessed on 3 November 2020). [CrossRef]
- Palafox, L.F.; Hamilton, C.W.; Scheidt, S.P.; Alvarez, A.M. Automated detection of geological landforms on Mars using Convolutional Neural Networks. Comput. Geosci. 2017, 101, 48–56. [Google Scholar] [CrossRef] [PubMed]
- Wagstaff, K.L.; Lu, Y.; Stanboli, A.; Grimes, K.; Gowda, T.; Padams, J. Deep Mars: CNN classification of Mars imagery for the PDS imaging atlas. In Proceedings of the 32nd AAAI Conference on Artificial Intelligence AAAI 2018, New Orleans, LA, USA, 2–7 February 2018; pp. 7867–7872. [Google Scholar]
- Weiss, K.; Khoshgoftaar, T.M.; Wang, D. A survey of transfer learning. J. Big Data 2016, 3, 9. [Google Scholar] [CrossRef]
- Bengio, Y. Deep learning of representations for unsupervised and transfer learning. In Proceedings of the ICML Workshop on Unsupervised and Transfer Learning, Bellevue, WA, USA, 2 July 2011; pp. 17–36. Available online: https://dl.acm.org/doi/10.5555/3045796.3045800 (accessed on 3 November 2020).
- Taylor, M.E.; Stone, P. Transfer learning for reinforcement learning domains: A survey. J. Mach. Learn. Res. 2009, 10, 1633–1685. [Google Scholar]
- Dai, W.; Yang, Q.; Xue, G.-R.; Yu, Y. Boosting for transfer learning. In Proceedings of the 24th International Conference on Machine Learning, Corvalis, OR, USA, 20–24 June 2007; pp. 193–200. Available online: https://dl.acm.org/doi/proceedings/10.1145/1273496 (accessed on 3 November 2020).
- Pan, S.J.; Yang, Q. A survey on transfer learning. IEEE Trans. Knowl. Data Eng. 2009, 22, 1345–1359. [Google Scholar] [CrossRef]
- Torrey, L.; Shavlik, J. Transfer learning. In Handbook of Research on Machine Learning Applications and Trends: Algorithms, Methods, and Techniques; IGI Global: Hershey, PA, USA, 2010; pp. 242–264. [Google Scholar]
- Krizhevsky, A.; Sutskever, I.; Hinton, G.E. ImageNet classification with deep convolutional neural networks. Commun. ACM 2017, 60, 84–90. [Google Scholar] [CrossRef]
- Wagstaff, K.L.; Panetta, J.; Ansar, A.; Greeley, R.; Hoffer, M.P.; Bunte, M.; Schörghofer, N. Dynamic landmarking for surface feature identification and change detection. ACM Trans. Intell. Syst. Technol. 2012, 3, 1–22. [Google Scholar] [CrossRef]
- Chen, L.C.; Papandreou, G.; Kokkinos, I.; Murphy, K.; Yuille, A.L. DeepLab: Semantic Image Segmentation with Deep Convolutional Nets, Atrous Convolution, and Fully Connected CRFs. IEEE Trans. Pattern Anal. Mach. Intell. 2018, 40, 834–848. [Google Scholar] [CrossRef] [PubMed]
- Lin, T.-Y.; Goyal, P.; Girshick, R.; He, K.; Dollár, P. Focal loss for dense object detection. In Proceedings of the IEEE International Conference on Computer Vision, Venice, Italy, 22–29 October 2017; pp. 2980–2988. Available online: https://arxiv.org/abs/1708.02002 (accessed on 3 November 2020).
- Bickel, V.T.; Conway, S.J.; Tesson, P.-A.; Manconi, A.; Loew, S.; Mall, U. Deep Learning-driven Detection and Mapping of Rockfalls on Mars. IEEE J. Sel. Top. Appl. Earth Obs. Remote Sens. 2020, 13, 2831–2841. [Google Scholar] [CrossRef]
- Bickel, V.T.; Lanaras, C.; Manconi, A.; Loew, S.; Mall, U. Automated Detection of Lunar Rockfalls Using a Convolutional Neural Network. IEEE Trans. Geosci. Remote Sens. 2019, 57, 3501–3511. [Google Scholar] [CrossRef]
- Bickel, V.T.; Aaron, J.; Manconi, A.; Loew, S.; Mall, U. Impacts drive lunar rockfalls over billions of years. Nat. Commun. 2020, 11, 2862. [Google Scholar] [CrossRef]
- Chawla, N.V.; Bowyer, K.W.; Hall, L.O.; Kegelmeyer, W.P. SMOTE: Synthetic minority over-sampling technique. J. Artif. Intell. Res. 2002, 16, 321–357. [Google Scholar] [CrossRef]
- Drummond, C.; Holte, R.C. C4.5, Class Imbalance, and Cost Sensitivity: Why Under-Sampling Beats Over-Sampling. In Proceedings of the Workshop on Learning from Imbalanced Datasets II, Washington, DC, USA, 21 August 2003; Volume 11, pp. 1–8. Available online: http://citeseerx.ist.psu.edu/viewdoc/download?doi=10.1.1.68.6858&rep=rep1&type=pdf (accessed on 3 November 2020).
- Abdi, L.; Hashemi, S. To combat multi-class imbalanced problems by means of over-sampling techniques. IEEE Trans. Knowl. Data Eng. 2015, 28, 238–251. [Google Scholar] [CrossRef]
- Sáez, J.A.; Krawczyk, B.; Woźniak, M. Analyzing the oversampling of different classes and types of examples in multi-class imbalanced datasets. Pattern Recognit. 2016, 57, 164–178. [Google Scholar] [CrossRef]
- Lin, T.-Y.; Dollár, P.; Girshick, R.; He, K.; Hariharan, B.; Belongie, S. Feature pyramid networks for object detection. In Proceedings of the IEEE Conference on Computer Vision and Pattern Recognition, Honolulu, HI, USA, 21–26 July 2017; pp. 2117–2125. Available online: https://ieeexplore.ieee.org/xpl/conhome/8097368/proceeding (accessed on 3 November 2020).
- Hochreiter, S. The vanishing gradient problem during learning recurrent neural nets and problem solutions. Int. J. Uncertain. Fuzziness Knowl. -Based Syst. 1998, 6, 107–116. [Google Scholar] [CrossRef]
- Hochreiter, S.; Schmidhuber, J. Long short-term memory. Neural Comput. 1997, 9, 1735–1780. [Google Scholar] [CrossRef]
- Xiang, C.; Shi, H.; Li, N.; Ding, M.; Zhou, H. Pedestrian Detection under Unmanned Aerial Vehicle an Improved Single-Stage Detector Based on RetinaNet. In Proceedings of the 2019 12th International Congress on Image and Signal Processing, BioMedical Engineering and Informatics (CISP-BMEI), Suzhou, China, 19–21 October 2019; pp. 1–6. Available online: http://www.cisp-bmei.cn/ (accessed on 3 November 2020).
- Mukhopadhyay, A.; Mukherjee, I.; Biswas, P.; Agarwal, A.; Mukherjee, I. Comparing CNNs for non-conventional traffic participants. In Proceedings of the 11th International Conference on Automotive User Interfaces and Interactive Vehicular Applications: Adjunct Proceedings, Utrecht, The Netherlands, 21–25 September 2019; pp. 171–175. Available online: https://dl.acm.org/doi/proceedings/10.1145/3349263 (accessed on 3 November 2020).
- Mandal, J.K.; Banerjee, S.; Kacprzyk, J. Intelligent Computing: Image Processing Based Applications; Springer: Berlin/Heidelberg, Germany, 2020; ISBN 9811542880. [Google Scholar]
- Mukhopadhyay, A.; Biswas, P.; Agarwal, A.; Mukherjee, I. Performance Comparison of Different CNN models for Indian Road Dataset. In Proceedings of the 2019 3rd International Conference on Graphics and Signal Processing, Hong Kong, China, 1–3 June 2019; pp. 29–33. Available online: https://dl.acm.org/doi/proceedings/10.1145/3338472 (accessed on 3 November 2020).
- Kapania, S.; Saini, D.; Goyal, S.; Thakur, N.; Jain, R.; Nagrath, P. Multi Object Tracking with UAVs using Deep SORT and YOLOv3 RetinaNet Detection Framework. In Proceedings of the 1st ACM Workshop on Autonomous and Intelligent Mobile Systems, New York, NY, USA, 10 January 2020; pp. 1–6. Available online: https://imobile.acm.org/aims/2020/ (accessed on 3 November 2020).
- Hoang, T.M.; Nguyen, P.H.; Truong, N.Q.; Lee, Y.W.; Park, K.R. Deep retinanet-based detection and classification of road markings by visible light camera sensors. Sensors 2019, 19, 281. [Google Scholar] [CrossRef]
- Ale, L.; Zhang, N.; Li, L. Road damage detection using RetinaNet. In Proceedings of the 2018 IEEE International Conference on Big Data (Big Data), Seattle, WA, USA, 10–13 December 2018; pp. 5197–5200. Available online: https://cci.drexel.edu/bigdata/bigdata2018/ (accessed on 3 November 2020).
- Pei, D.; Jing, M.; Liu, H.; Sun, F.; Jiang, L. A fast RetinaNet fusion framework for multi-spectral pedestrian detection. Infrared Phys. Technol. 2020, 105, 103178. [Google Scholar] [CrossRef]
- Afif, M.; Ayachi, R.; Said, Y.; Pissaloux, E.; Atri, M. An evaluation of retinanet on indoor object detection for blind and visually impaired persons assistance navigation. Neural Process. Lett. 2020, 51, 2265–2279. [Google Scholar] [CrossRef]
- Shepley, A.J.; Falzon, G.; Meek, P.; Kwan, P. Location Invariant Animal Recognition Using Mixed Source Datasets and Deep Learning. bioRxiv 2020. Available online: https://www.biorxiv.org/content/10.1101/2020.05.13.094896v1.abstract (accessed on 1 September 2020).
- Pho, K.; Amin, M.K.M.; Yoshitaka, A. Segmentation-driven retinanet for protozoa detection. In Proceedings of the 2018 IEEE International Symposium on Multimedia (ISM), Taichung, Taiwan, 10–12 December 2018; pp. 279–286. Available online: https://www.computer.org/csdl/proceedings/ism/2018/17D45VtKisa (accessed on 3 November 2020).
- Alon, A.S.; Festijo, E.D.; Juanico, D.E.O. Tree Detection using Genus-Specific RetinaNet from Orthophoto for Segmentation Access of Airborne LiDAR Data. In Proceedings of the 2019 IEEE 6th International Conference on Engineering Technologies and Applied Sciences (ICETAS), Kuala Lumpur, Malaysia, 20–21 December 2019; pp. 1–6. Available online: https://ieeexplore.ieee.org/xpl/conhome/9109368/proceeding (accessed on 3 November 2020).
- Liu, M.; Tan, Y.; Chen, L. Pneumonia detection based on deep neural network Retinanet. In Proceedings of the 2019 International Conference on Image and Video Processing, and Artificial Intelligence, Shanghai, China, 23–25 August 2019; Volume 11321, p. 113210F. Available online: http://www.proceedings.com/spie11321.html (accessed on 3 November 2020).
- Jaeger, P.F.; Kohl, S.A.A.; Bickelhaupt, S.; Isensee, F.; Kuder, T.A.; Schlemmer, H.-P.; Maier-Hein, K.H. Retina U-Net: Embarrassingly simple exploitation of segmentation supervision for medical object detection. In Proceedings of the Machine Learning for Health NeurIPS Workshop, 17 September 2020; pp. 171–183. Available online: http://proceedings.mlr.press/v116/jaeger20a (accessed on 1 September 2020).
- Yang, M.; Xiao, X.; Liu, Z.; Sun, L.; Guo, W.; Cui, L.; Sun, D.; Zhang, P.; Yang, G. Deep RetinaNet for Dynamic Left Ventricle Detection in Multiview Echocardiography Classification. Sci. Program. 2020, 2020, 7025403. [Google Scholar] [CrossRef]
- Wang, Y.; Wang, C.; Zhang, H.; Dong, Y.; Wei, S. Automatic ship detection based on RetinaNet using multi-resolution Gaofen-3 imagery. Remote Sens. 2019, 11, 531. [Google Scholar] [CrossRef]
- Manee, V.; Zhu, W.; Romagnoli, J.A. A Deep Learning Image-Based Sensor for Real-Time Crystal Size Distribution Characterization. Ind. Eng. Chem. Res. 2019, 58, 23175–23186. [Google Scholar] [CrossRef]
- Yang, L.; Maceachren, A.M.; Mitra, P.; Onorati, T. Visually-enabled active deep learning for (geo) text and image classification: A review. ISPRS Int. J. Geo-Inf. 2018, 7, 65. [Google Scholar] [CrossRef]
- Morinan, G. click2label 2020. Available online: https://github.com/gmorinan/click2label (accessed on 1 September 2020).
- Hgaiser Keras-Retinanet 2020. Available online: https://github.com/fizyr/keras-retinanet (accessed on 1 September 2020).
- Goutte, C.; Gaussier, E. A probabilistic interpretation of precision, recall and F-score, with implication for evaluation. In Proceedings of the European Conference on Information Retrieval, Santiago de Compostela, Spain, 21–23 March 2005; pp. 345–359. Available online: https://www.springer.com/gp/book/9783540252955 (accessed on 3 November 2020).
- Powers, D.M. Evaluation: From Precision, Recall and F-Measure to ROC, Informedness, Markedness and Correlation. 2011. Available online: https://dspace2.flinders.edu.au/xmlui/handle/2328/27165 (accessed on 1 September 2020).
- Scuderi, L.; Nagle-McNaughton, T.; Williams, J. Trace evidence from mars’ past: Fingerprinting Transverse Aeolian Ridges. Remote Sens. 2019, 11, 1060. [Google Scholar] [CrossRef]
- Santos, A.; Marcato Junior, J.; de Andrade Silva, J.; Pereira, R.; Matos, D.; Menezes, G.; Higa, L.; Eltner, A.; Ramos, A.P.; Osco, L.; et al. Storm-drain and manhole detection using the retinanet method. Sensors 2020, 20, 4450. [Google Scholar] [CrossRef]
- Malin, M.C.; Edgett, K.S. Mars global surveyor Mars orbiter camera: Interplanetary cruise through primary mission. J. Geophys. Res. Planets 2001, 106, 23429–23570. [Google Scholar] [CrossRef]
- Malin, M.C.; Bell, J.F.; Cantor, B.A.; Caplinger, M.A.; Calvin, W.M.; Clancy, R.T.; Edgett, K.S.; Edwards, L.; Haberle, R.M.; James, P.B.; et al. Context Camera Investigation on board the Mars Reconnaissance Orbiter. J. Geophys. Res. E Planets 2007, 112, 1–25. [Google Scholar] [CrossRef]
Publisher’s Note: MDPI stays neutral with regard to jurisdictional claims in published maps and institutional affiliations. |
© 2020 by the authors. Licensee MDPI, Basel, Switzerland. This article is an open access article distributed under the terms and conditions of the Creative Commons Attribution (CC BY) license (http://creativecommons.org/licenses/by/4.0/).

