Article

Response of Natural Vegetation to Climate in Dryland Ecosystems: A Comparative Study between Xinjiang and Arizona

1
College of Resources and Environment Science, Xinjiang University, Urumqi 830046, China
2
School of Sustainable Engineering and the Built Environment, Arizona State University, Tempe, AZ 85287, USA
3
Department of Earth System Science, Stanford University, Stanford, CA 94305, USA
*
Author to whom correspondence should be addressed.
These authors contributed equally to this work.
Remote Sens. 2020, 12(21), 3567; https://doi.org/10.3390/rs12213567
Submission received: 9 October 2020 / Revised: 24 October 2020 / Accepted: 29 October 2020 / Published: 31 October 2020

Abstract

:
As one of the most sensitive areas to climate change, drylands cover ~40% of the Earth’s terrestrial land surface and host more than 38% of the global population. Meanwhile, their response to climate change and variability carries large uncertainties as induced by background climate, topography, and land cover composition; but there is a lack of intercomparison of different dryland ecosystems. In this study, we compare the changing climate and corresponding responses of major natural vegetation cover types in Xinjiang and Arizona, two typical drylands with similar landscapes in Asia and North America. Long-term (2002–2019) quasi-8-day datasets of daily precipitation, daily mean temperature, and Normalized Difference Vegetation Index (NDVI) were constructed based on station observations and remote sensing products. We found that much of Xinjiang experienced warming and wetting trends (although not co-located) over the past 18 years. In contrast, Arizona was dominated by warming with insignificant wetting or drying trends. Significant greening trends were observed in most parts of both study areas, while the increasing rate of NDVI anomalies was relatively higher in Xinjiang, jointly contributed by its colder and drier conditions. Significant degradation of vegetation growth (especially for shrubland) was observed over 18.8% of Arizona due to warming. Our results suggest that responses of similar natural vegetation types under changing climate can be diversified, as controlled by temperature and moisture in areas with different aridity.

Graphical Abstract

1. Introduction

Drylands, such as deserts, grasslands, and savanna woodlands, are critical environments usually featuring scarce and unreliable precipitation, very high evaporation rate, and limited water resources [1]. These areas can be categorized into four subtypes: hyper-arid, arid, semi-arid, and dry subhumid drylands, all with the long-term ratio of mean annual precipitation to potential evapotranspiration (aridity index) below 0.65 [2]. Dryland ecosystems cover about 40% of the Earth’s land surface and account for ~40% of the global net primary productivity, playing a vital role in the global carbon cycle [3,4]. For instance, Ahlström et al. [5] found that the trend and interannual variability of the carbon sink (CO2 uptake by ecosystems) are dominated by semi-arid ecosystems. Via dust-cloud interactions, the large amount of mineral dust aerosols emitted from drylands (e.g., deserts) modify the energy balance and hydrological cycle, and can therefore either suppress or enhance precipitation [3,6]. Drylands are also home to some of the most diverse biomes of flora and fauna, providing an indispensable natural laboratory for studying the evolution and adaptation of species under extreme conditions and changing climate [7]. Moreover, drylands sustain more than 38% of the global population, with 90% of these dryland inhabitants living in developing countries [1,8]. The close interactions between dryland ecosystems and anthropogenic activities make drylands a critical component in improving human well-being and global sustainability.
Drylands are one of the most sensitive areas in response to climate change and human activities [9]. In general, the aridity over global drylands has increased since 1950, and this trend is projected to continue in this century, as shown in observations and numerical simulations [3,10,11]. The increasing aridity, along with the rapidly expanding dryland development, may result in dryland expansion and desertification. For example, Huang et al. [9] reported an increase of 11% in dryland area by the end of this century under RCP 4.5 when compared to 1961–1990. On the other hand, drylands exhibit strong local and regional variability in their responses to climate change, primarily due to differences in topography, climate type, soil types, etc. Such spatial variability also emerges in the phenological dynamics of dryland vegetation (such as growth, mortality, and responses to disturbances) via the coupled ecological, hydrological, and human systems [12,13]. Furthermore, even over the same dryland, different spatial and temporal patterns of temperature and precipitation can lead to diverse responses in dryland ecosystems [14,15]. These uncertainties pose great challenges to the sustainable planning of dryland development and the prediction of the future dryland ecosystems, necessitating comparisons of drylands located in different climate regions.
In recent decades, satellite remote sensing techniques have enormously contributed to the detection of dryland ecosystem changes (especially those with sparse in situ observations) as well as the comparisons among different drylands across multiple spatial scales. Various vegetation indices and parameters have been used in existing research to evaluate dryland vegetation dynamics; examples include simple ratio, normalized difference vegetation index (NDVI), enhanced vegetation index, leaf area index, and vegetation optical depth [16,17,18,19,20,21]. As the most widely used vegetation index, NDVI is sensitive to canopy structure, chemical content (e.g., green biomass and leaf area index), photosynthetic activities, and vegetation production in areas with sparse canopies (as in drylands) [17,22,23,24]. In particular, NDVI products based on the Advanced Very High Resolution Radiometer (AVHRR) sensor (since 1981) and the Moderate Resolution Imaging Spectroradiometer (MODIS) sensor (since 2000) have been developed, enabling consistent long-term evaluations over drylands [25,26,27]. It should be noted that for interannual or decadal dryland analysis, most existing studies are based on annual NDVI data (e.g., [15]), and there is a need for finer scale (monthly and sub-monthly) analysis to examine the intra-annual variability of vegetation dynamics [3].
In this study, we aim to fill these knowledge gaps by comparing sub-monthly (quasi-8-day scale) vegetation response to climate over two typical drylands in China and the United States (U.S.): Xinjiang and Arizona. Located in the northwestern China, Xinjiang is one of the driest regions in the world and has the largest area of dryland ecosystems in China. Arizona is in the southwestern U.S. with typical hot desert climate in its southern part. Although located in two continents with different climates (see Section 2.1 for details), these two regions feature very similar natural landscapes ranging from desert and shrubland to forests and wetlands (Figure 1), and even share some common species such as saltcedar (Tamarix chinensis). Both regions have also shown significant responses of vegetation dynamics to the changing climate in the past decades [28,29]. On the other hand, vegetation over similar landscapes or land cover types may exhibit distinct responses to similar climate change and variability. A systematic comparison of climate and vegetation growth in these two regions is therefore needed to reveal these similarities and differences and to inform global dryland management.
As the first step, we focus on the long-term changes in vegetation growth and climate as well as the vegetation-climate relationships in this study. Section 3.1 compares the spatial distribution of land cover types and aridity in Xinjiang and Arizona. Here, we select daily mean air temperature and daily precipitation as the climate indicators, and NDVI as the vegetation indicator. The construction of long-term (2002–2019) quasi-8-day time series of air temperature, precipitation, and NDVI based on observations and remote sensing techniques is detailed in Section 2.4 and Section 2.5. Section 3.2, Section 3.3 and Section 3.4 examine spatial and temporal climate change and variability as well as the response of natural vegetation based on regression analyses. Note that we limit all analyses to unchanged natural vegetation, so that the disturbances induced by (for example) land use and wildfires can be largely reduced. In Section 3.5, we select typical subregions across different climate types to examine various responses of natural vegetation over five major land cover types. Section 4 concludes the study with implications and plans for future research.

2. Methods and Data Sources
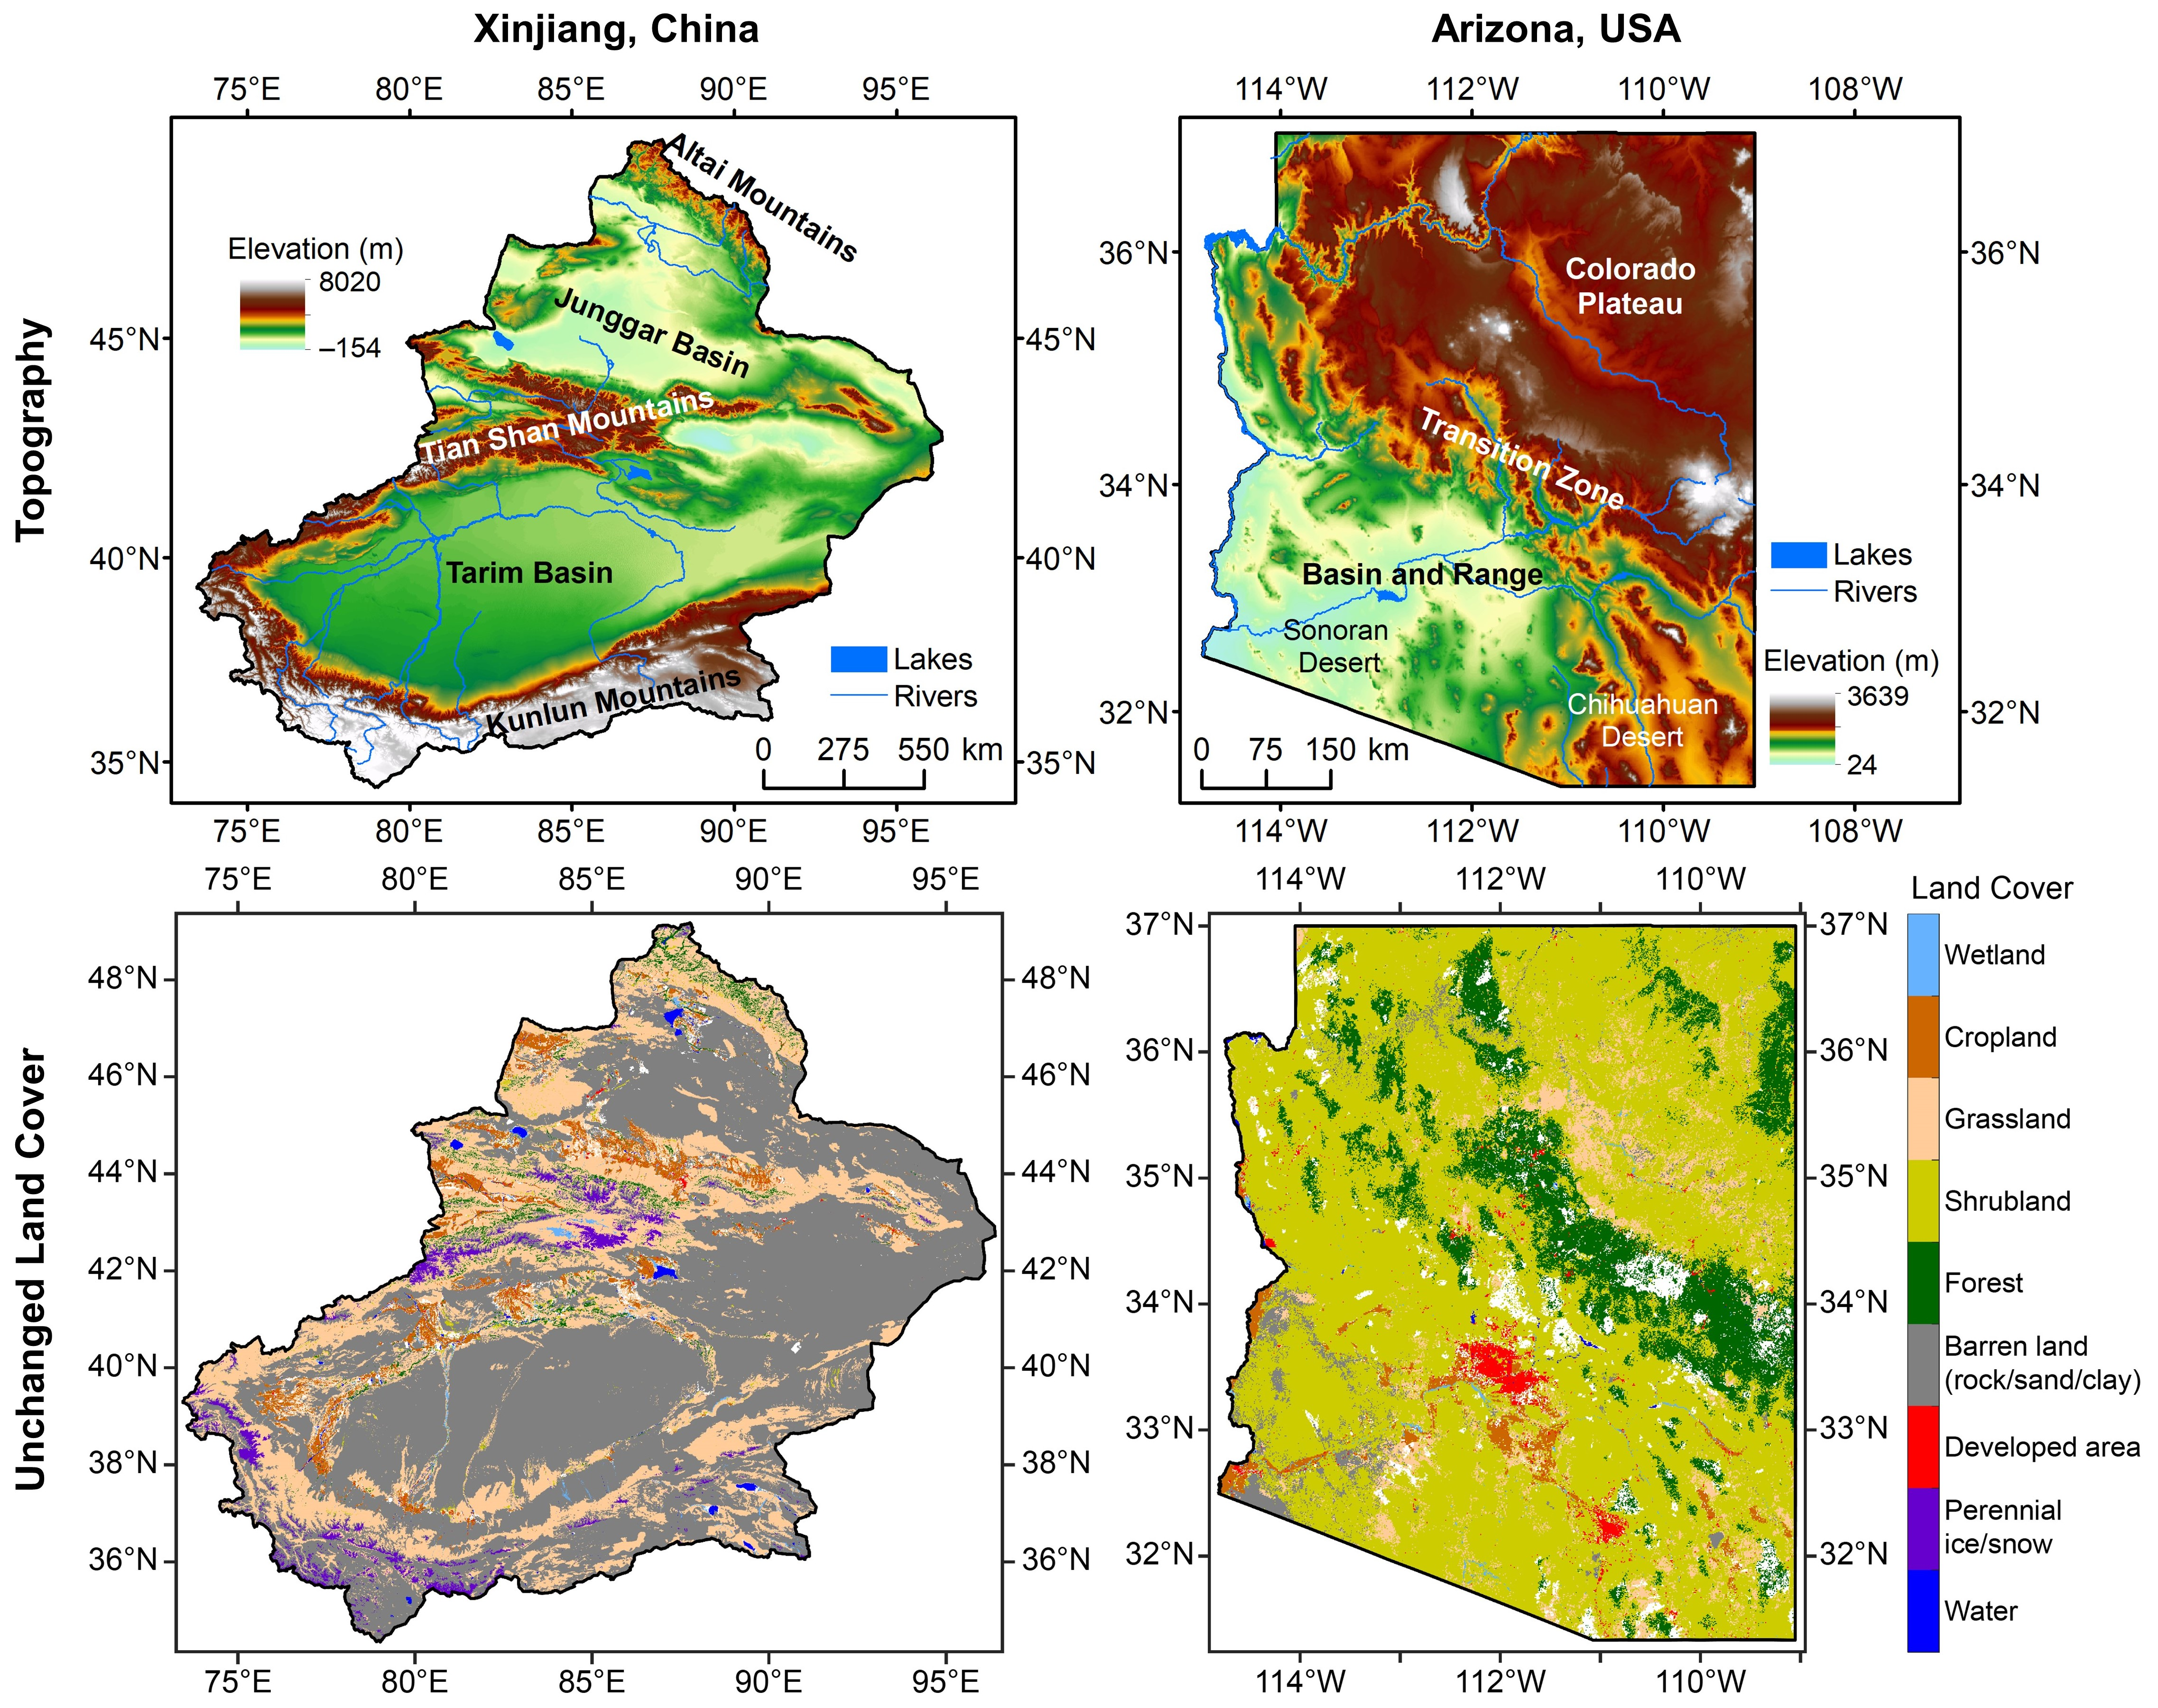
2.1. Study Areas

Xinjiang is the largest province-level division of China with an area of 1.66 million km2. Much of this inland region has very limited water resources. The typical geographic characteristic of Xinjiang is “two basins embedded in three mountain ranges” (see Figure 2a). Altai Mountains, Tian Shan Mountains, and Kunlun mountains are located from north to south, dividing Xinjiang into two major basins, i.e., Junggar Basin (in the north) and Tarim Basin (in the south) [30]. Xinjiang can also be broadly divided by Tian Shan Mountains as northern and southern Xinjiang subregions. Located in the rain shadow of several high mountain ranges, the center of the Tarim Basin is the Taklimakan Desert (the second largest shifting-sand desert in the world), and the center of the Junggar Basin is the Gurbantunggut Desert (the second largest desert in China). The mean temperatures in northern Xinjiang are −13 °C and 22 °C in winter and summer, respectively, and the mean annual precipitation is about 210 mm, while in southern Xinjiang, the mean temperatures in winter and summer are −5.7 °C and 24.4 °C, respectively, with the annual mean precipitation less than 100 mm [31]. According to the Köppen-Geiger climate classification system (1980–2016), the dominant climate types of drylands in Xinjiang are BWk (arid, desert, and cold) and BSk (arid, steppe, and cold) [32].
Arizona is located in the southwestern U.S. with an area of approximately 0.295 million km2. Arizona can be roughly divided into three parts based on its terrain (Figure 2b): the northeast is the high-altitude Colorado Plateau, the southwest is the low-elevation Basin and Range area mainly covered by Chihuahuan Desert and Sonoran Desert, and in between the Transition Zone as a narrow SE-NW diagonal band across central Arizona [33]. Note that such physiographic division is very similar to that of Xinjiang (Figure 2a). The Transition Zone has diverse topography, climate, and geology, and is characterized by extensive mountain ranges, basins, and steep canyons with elevations from nearly 2500 m (peaks) to as low as 450 m (valley floors) [34]. Mean annual precipitation amount in Arizona is 322 mm, and mean annual temperature is ~17 °C [35]. Climate types BWh (arid, desert, and hot) and BSh (arid, steppe, and hot) prevail in southwestern Arizona, while in Colorado Plateau, the dominant types are BWk (arid, desert, and cold) and BSk [32]. In contrast, the Transition Zone has multiple climate types such as Csa (temperate, dry and hot summer), Dsb (cold, dry and warm summer), and BSk.
Despite being on two different continents, Xinjiang and Arizona have similar characteristics of topography and ecosystems from plains to mountainous areas. Plants adaptive to droughts are mainly distributed in shrubland and grassland at low altitude, while coniferous forests and mixed coniferous forests dominate areas at high altitudes. Similar water scarcity issues also exist in both study areas, in which plant growth over drylands can be largely constrained when precipitation is limited. Continuous socioeconomic developments with population growth and urban expansion in these two regions during recent decades have further increased the demand for domestic and (irrigation-fed) agricultural water (usually withdrawn from rivers, lakes, and aquifers), worsening the water scarcity issue [36,37]. On the other hand, locally and regionally varied climate changes and variability further complicate dryland management (e.g., land use and restoration), calling for a better understanding of how natural plants respond to these natural and anthropogenic impacts.

2.2. Land Cover Datasets

In this study, we used quinquennial land cover datasets to identify areas with unchanged land cover types in the past two decades. For Xinjiang, we adopted four products of the 1-km China’s Multi-Period Land Use Land Cover Remote Sensing Monitoring Dataset (CNLUCC 2000, CNLUCC 2005, CNLUCC 2010, and CNLUCC 2015) downloaded from the Resource and Environment Data Cloud Platform, which is maintained by the Institute of Geographic Sciences and Natural Resources Research, Chinese Academy of Sciences (http://www.resdc.cn/Default.aspx). For Arizona, we retrieved four land cover products from the 30-m National Land Cover Database (NLCD 2001, NLCD 2006, NLCD 2011, and NLCD 2016) provided by the Multi-Resolution Land Characteristics Consortium, U.S. Geological Survey (https://www.mrlc.gov/data). These four NLCD products were then resampled to 1-km resolution.
We reclassified the land cover types in NLCD and CNLUCC datasets into nine new classes, and the criteria of the reclassification system are summarized in Table 1. As mentioned, this study focuses exclusively on natural vegetation covers over five unchanged (across all land cover datasets) land cover types, i.e., barren land (rock/sand/clay), forest, shrubland, grassland, and wetland, to minimize the possible disturbance induced by wildfires and anthropogenic activities such as reclamation, crop rotation, and afforestation during the past two decades.

2.3. Long-Term Aridity Index

To compare the aridity in two study areas, we calculated the annual aridity index (AI) as the ratio of annual precipitation to annual potential evapotranspiration from 2002 to 2018. We retrieved the monthly precipitation and potential evapotranspiration data from the ~4-km TerraClimate dataset [38]. TerraClimate is a global high-resolution gridded climate dataset produced based on multiple existing datasets [38]. It has been validated with observations from several station-based networks, such as the Global Historical Climatology Network, Snowpack Telemetry network, Remote Automated Weather Stations, and FLUXNET stations, showing improved accuracy as compared to coarser resolution gridded datasets. We aggregated the monthly TerraClimate data to annual scale and computed annual AI. Further averaging 17 annual AI datasets yields a long-term (2002–2018) mean AI dataset. Following the dryland subtypes defined by Cherlet et al. [2], drylands can be classified into four subtypes based on AI: hyper-arid (AI < 0.05), arid (0.05 ≤ AI < 0.20), semi-arid (0.20 ≤ AI < 0.50), and dry subhumid (0.50 ≤ AI < 0.65).

2.4. Quasi-8-Day Precipitation and Air Temperature

For the time series of precipitation and air temperature (maximum and minimum), observations from meteorological stations have been widely used in existing studies [15,39]. However, station-based observations are limited in spatial scale and usually require spatial interpolation with quality control when used in climate-vegetation assessments. Simple spatial interpolation methods without proper quality control procedures may induce large errors over areas where meteorological stations are sparse (e.g., in Tarim Basin). Instead, here we used the gridded Climate Prediction Center (CPC) Global Unified Gauge-based Analysis of Daily Precipitation and Global Daily Temperature datasets; both datasets are archived at the Earth System Research Laboratory and CPC, National Oceanic and Atmospheric Administration (https://www.esrl.noaa.gov/psd/data/gridded/). These two CPC datasets are observation-based and available since 1979 with a spatial resolution of 0.5°, and have been evaluated and used in various studies [9,40,41,42]. The CPC daily precipitation dataset uses the optimal interpolation objective analysis technique, with relatively high accuracy as suggested in cross-validation tests: for global land areas, the correlation with station measurements is 0.735 (bias = −0.349%), while for the U.S., the correlation is 0.811 (bias = −0.467%) [43]. The CPC daily temperature dataset is built upon a gridded climatology with orographic consideration and uses the Shepard algorithm, which is in general consistent with different observation and reanalysis datasets as shown in previous studies [41,44]. In this study, the daily (mean air) temperature is calculated as the arithmetic mean of daily maximum and minimum air temperatures.
Similar to the quasi-8-day NDVI dataset, we reconstructed the quasi-8-day precipitation and air temperature data products over the past 18 years (June 2002–October 2019; see Section 2.5). Following the acquisition dates of NDVI products, the 16-day precipitation and temperature averages (cf. best pixels for NDVI) were calculated 8 days out of phase (e.g., days 1–16 and days 9–24 are two consecutive quasi-8-day cycles). We also retrieved the long-term means of daily precipitation and air temperature data for years 1981–2010 and constructed the long-term means of quasi-8-day datasets. Precipitation and temperature anomalies were derived by subtracting the long-term means from the quasi-8-day time series. The seasonality is therefore removed from the time series of anomalies.

2.5. Quasi-8-Day Vegetation Index

To evaluate the vegetation dynamics and its response to climate, we retrieved 1-km NDVI for the past 18 years (June 2002–October 2019, or from day 177 in 2002 to day 304 in 2019) from MOD13A2 and MYD13A2 Version 6 products, derived from two MODIS sensors onboard Terra and Aqua satellite platforms, respectively [45,46]. These two products are composites of the best available pixels from each period of 16 consecutive days, and are processed 8 days out of phase, jointly providing a quasi-8-day time series. Existing research has also confirmed the consistency of original daily NDVI from Terra and Aqua (R2 = 0.977 for a central U.S. study area from 2003 to 2012) [47]. We used the quality layers to remove pixels with low reliability (e.g., covered by snow, ice, or cloud). Pixels with NDVI lower than 0.1 were also excluded following previous dryland studies [48,49].
We further derived the quasi-8-day times series of NDVI anomalies to remove the seasonal variability from trend analysis (see Section 3.3). The long-term (arithmetic) means of quasi-8-day NDVI from June 2002 to October 2019 were subtracted from the NDVI time series to yield the NDVI anomalies. For comparison, we also averaged available quasi-8-day NDVI data in 16 complete years (2003–2018) to derive the time series of annual NDVI.

3. Results and Discussion

3.1. Unchanged Land Cover Types and Aridity

The reclassified unchanged land cover in Xinjiang and Arizona is shown in Figure 3a,b. The five natural land cover types (barren land, forest, shrubland, grassland, and wetland) in the past 18 years (~two decades) accounted for 93.1% and 96.6% of the areas with unchanged land cover in Xinjiang and Arizona, respectively. Among the unchanged land cover pixels, 60.7% in Xinjiang were barren land (rock/sand/clay), much higher than that in Arizona (2.7%). It is noteworthy that areas classified as “barren land” can still be covered by annual and even perennial vegetation, as shown in Figure 1. Shrubland, grassland, forest, and wetland accounted for 0.6%, 29.5%, 1.9%, and 0.5%, respectively, in Xinjiang, and 72.4%, 6.9%, 14.1%, and 0.4%, respectively, in Arizona. It is clear that except for barren land, the dominant land cover type with natural vegetation in Xinjiang is grassland, and in Arizona shrubland. Forests in both study areas are mainly distributed in mountains.
The spatial distribution of long-term AI is shown in Figure 3c,d. The majority of northern Xinjiang was covered by arid and semi-arid drylands, while much of southern Xinjiang was much drier than its northern counterpart (arid and hyper-arid types). Semi-arid drylands were mainly distributed in the Ili River Valley and mountainous areas, mixed with few dry subhumid areas and even some non-drylands at high altitudes. In particular, hyper-arid areas almost spanned across the entire Taklimakan Desert, with the driest parts being the Kumtag Desert (in the eastern Tarim Basin) and a portion of the Turpan-Hami Depression (in the southern foothills of the East Tian Shan). In Arizona, the Colorado Plateau was dominated by arid and semi-arid drylands, while the Basin and Range mainly had arid and hyper-arid drylands. The driest part was in the southwestern Arizona along the state border. In contrast, Transition Zone and Chihuahuan Desert in the southeast corner were dominated by semi-arid drylands. Hyper-arid drylands only accounted for 3.9% of Arizona, while in Xinjiang they covered a much greater portion of land (37.3%). Arid drylands covered similar portions in both study areas (72.1% in Xinjiang and 61.5% in Arizona). Semi-arid drylands represented 37.8% of Arizona, much higher than in Xinjiang (16.9%). In general, most parts of Arizona had a lower level of aridity index than Xinjiang during the past two decades.

3.2. Climate Change and Variability

In this section, we use linear regression to estimate the trend of daily precipitation and temperature anomalies (based on quasi-8-day time series with seasonality removed, see Section 2.4) in the study areas. The coefficient of determination (R2) measures the fit of the regression model, and the p-value is calculated in the two-tailed test of significance for the slope in the model. The change and variability of precipitation and temperature in Xinjiang from June 2002 to October 2019 are shown in Figure 4, while the results for Arizona are shown in Figure 5. Despite their similarity in landscape, Xinjiang and Arizona have different climatology: Xinjiang, with a mean daily precipitation of 0.32 mm during the past two decades, is on average drier than Arizona, whereas Arizona is much hotter. The mean daily temperature was 16.50 °C in Arizona during 2002–2019, ~10 °C higher than in Xinjiang (6.97 °C). These contrasts can also manifest in climate change and variability, as well as the associated vegetation responses.
The presence of Tian Shan Mountains engenders relatively higher daily precipitation in northern Xinjiang than in southern Xinjiang (Figure 4a). Mean daily precipitation in most parts of southern Xinjiang was below 0.30 mm, lower than in most parts of northern Xinjiang (0.52 mm). The central part of Tian Shan Mountains received on average the highest mean daily precipitation (over 0.84 mm) with the strongest temporal variability, as suggested by standard deviations (Figure 4b). Approximately 24.2% of the entire Xinjiang showed statistically significant (p-value < 0.05; for simplicity hereafter referred to as “significant”) increase in daily precipitation anomalies (average rate: 0.008 mm year−1). These wetting areas were mainly distributed in the middle part of the Tian Shan Mountains and oases in the northern Tarim Basin (Figure 4c). Significantly decreasing trends of daily precipitation anomalies (average rate: −0.005 mm year−1) were observed in the Cheerchen River Basin near the northern foothills of Kunlun Mountains, although these drying pixels only accounted for about 5.8% of Xinjiang.
Mean daily temperature in the past 18 years in Junggar Basin was 7.94 °C, relatively lower than that in Tarim Basin (12.38 °C) (Figure 4d). A mean daily temperature of ~4.47 °C was observed in Tian Shan Mountains, while the central part of Tian Shan Mountains had mean daily temperature below 0 °C. The temporal variability of daily temperature in Xinjiang was generally weaker in the south and stronger in the north, while the strongest temporal variability was observed in Junggar Basin and Turpan-Hami Depression (Figure 4e). Significant increase in daily temperature anomalies (0.05 °C year−1) occurred in eastern Xinjiang. A warming stripe was observed running across the Tarim Basin in a north-south direction, with a significant increase rate of 0.03 °C year−1, relatively lower than that in eastern Xinjiang or the average rate in all warming areas (0.05 °C year−1). In contrast, daily temperature anomalies significantly decreased over the central part of the Tian Shan Mountains with an average rate of −0.06 °C year−1. Significant warming areas and cooling areas accounted for 41.5% and 13.5% of Xinjiang, respectively. In particular, major warming areas were not co-located with major wetting areas during the past two decades (Figure 4c,f).
It should be noted that the observed trends may inherit potential errors from the CPC datasets and can be limited by the original resolution (0.5° × 0.5°). Nevertheless, the warming and wetting trends in the quasi-8-day analysis herein are in general consistent with most existing studies based on annual or monthly datasets [31,50,51]. For example, Li et al. [31] estimated a rate of 0.03 °C year−1 for mean annual temperature increase in Xinjiang from 1961 to 2005, while Xu et al. [49] found that mean annual temperature increased by 0.04 °C year−1 and 0.05 °C year−1 in northern and southern Xinjiang, respectively. The magnitude of daily precipitation based on the quasi-8-day time series is smaller than those observed in annual datasets. Discrepancies in space also exist between our results (Figure 4) and previous ones. For instance, the cooling areas and drying parts observed here have not been well documented in station-based studies. Such discrepancies are due primarily to the mismatch in temporal and spatial resolutions as well as the selection of the study periods. The quasi-8-day time series constructed here have a much finer temporal resolution than existing annual and monthly time series, which bear stronger temporal variability, contributing to the observed differences in magnitude. In addition, the observed cooling and drying trends in Tarim Basin, where meteorological stations are very sparse, may not be well captured by existing studies based on station observations with relatively simple spatial interpolation techniques [31,50]. The trends of climate indicators depend on the length of study periods as well. As pointed out by Zhuang et al. [52], annual precipitation decreased during 1981–1997 but increased during 1998–2018, although the overall trend was wetting for the entire period (1981–2018).
Similar to Tian Shan Mountains in Xinjiang, the Transition Zone in Arizona featured on average the highest daily precipitation (1.10 mm) with the strongest temporal variability, while the areas in southern and northern parts of Arizona received less precipitation (Figure 5a,b). Sonoran Desert received very low mean daily precipitation (~0.50 mm), and the southwest corner of the state (Yuma County) had the least mean daily precipitation (cf. Tarim Basin in Xinjiang, see Figure 4). Located in the southeastern Arizona, Chihuahuan Desert had a relatively higher mean daily precipitation (0.98 mm) than Sonoran Desert in the past 18 years. No significant changes in precipitation anomalies were observed in more than 87% of Arizona (Figure 5c). Areas with significant increases in daily precipitation anomalies (5.9% of Arizona) were mainly located in northeast and southeast corners. A small portion of the northeastern Arizona saw significant decreases in daily precipitation anomalies, together with other drying portions along the Colorado River, accounting for 6.5% of the entire state.
Unlike high heterogeneity in Xinjiang (Figure 4d), a spatial transition from high temperatures in the southwest to low temperatures in the northeast was observed in Arizona, with a quite uniform distribution of temporal variability (Figure 5d,e). The highest mean daily temperature of over 22 °C was in southwestern Arizona (such as Yuma, Pima, Maricopa, and La Paz counties). In contrast, Colorado Plateau in the northeast on average featured low mean daily temperature (11.91 °C), and the mountainous areas had the lowest mean daily temperature of 8.15 °C across the entire Arizona. Much of Arizona (63.1%) was dominated by significant warming signals (Figure 4f). Daily temperature anomalies in northern Arizona increased relatively more rapidly (0.070 °C year−1) than in southern Arizona (0.037 °C year−1). The strongest warming trend (0.235 °C year−1) was observed near the central part of the Transition Zone and the southwestern edge of the Colorado Plateau (the Mogollon Rim). In contrast, a cooling area spanning across several counties (Graham, Greenlee, Gila, and southern parts of Navajo and Apache counties) was observed in the eastern part of the state (11.5% of Arizona), with temperature anomalies decreasing at a rate of 0.051 °C year−1.
In general, Arizona was dominated by warming trends with insignificant changes in daily precipitation anomalies during the past two decades. Despite the paucity of (historical) climate change studies focusing exclusively on the entire Arizona, the observed patterns are found in generally good agreement with many regional studies [53,54,55,56]. For example, Garfin et al. [54] pointed out that there was only little change in mean annual precipitation from 1901 to 2010; this was later confirmed by Chylek et al. [53], in which no statistically significant trend was observed in the western part of the U.S.

3.3. Vegetation Change and Variability

Here again, the linear regression is used to estimate the trend of NDVI anomalies (based on quasi-8-day time series with seasonality removed, see Section 2.5) and annual NDVI in two study areas. A threshold of 20% for each pixel was selected to avoid possible bias or error induced by small sample size [57]. For a complete quasi-8-day time series from June 2002 to October 2019 (n = 797), the threshold is 159.4, while for a complete annual NDVI time series from 2003 to 2018 (n = 16), it is 3.2. Pixels with sample size lower than these two thresholds were removed from the following analyses. We further removed pixels with unchanged cropland, developed area, perennial ice/snow, and water to limit our analyses to five unchanged natural land cover types (see Section 2.2).
The change and variability of quasi-8-day (June 2002–October 2019) and annual NDVI (2003–2018) in Xinjiang and Arizona are shown in Figure 6 and Figure 7, respectively. Note that the arithmetic averages are based on available data only. For the spatial coverage of available NDVI pixels, slight differences were observed between quasi-8-day and annual NDVI time series (Figure 6 and Figure 7), owing to the use of sample size threshold (20%). Despite small spatial discrepancies, the results of mean quasi-8-day NDVI and mean annual NDVI are nearly identical (Figure 6a,d for Xinjiang; Figure 7a,b for Arizona). However, the standard deviation of quasi-8-day NDVI during 2002–2019 was in general much higher than that of annual NDVI, suggesting stronger intra-annual variability than interannual variability (Figure 6b,e for Xinjiang; Figure 7b,e for Arizona).
For Xinjiang, places with the highest NDVI levels (> 0.5) were distributed over Tian Shan Mountains and Altai Mountains, mainly covered by forest (Figure 3a). These areas also had the strongest temporal variability in the quasi-8-day time series (Figure 6b). Major part of Tarim Basin had NDVI consistently below 0.10 during the past two decades. In contrast, NDVI in most areas of northern Xinjiang was greater than 0.10. It is noteworthy that although classified as barren land, much of Junggar Basin (including Gurbantunggut Desert, see Figure 1) had low but still detectable vegetation cover, as suggested by a mean quasi-8-day NDVI of 0.16 (mean annual NDVI was 0.15). Places with relatively low NDVI levels (0.20–0.40) were mainly distributed in mountainous areas as well as the oases next to or within Taklimakan Desert and Gurbantunggut Desert.
The spatial coverage of the areas with significant trend of quasi-8-day NDVI anomalies is relatively larger than that for annual NDVI (Figure 6c,f), but the spatial distributions of greening (increasing trend of NDVI) and browning (decreasing trend of NDVI) are consistent. Such comparison suggests potential limitations of using annual NDVI time series, for example, large areas with insignificant changes due to small sample size. During the past 18 years, 26.3% of the entire Xinjiang saw statistically significant increase in NDVI anomalies (Figure 6c), with a rate of 0.0021 year−1 on average. This rate is close to the one estimated based on mean annual NDVI times series (0.0033 year−1) for a shorter time period (2010–2018) in Zhuang et al. [52]. Significant decrease of NDVI (−0.0016 year−1 on average) was observed only in a small portion of Xinjiang (1.7%). These browning areas were mainly distributed in northern Xinjiang (e.g., in Ili River Valley) and a few oases along the northern edge of the Tarim Basin. The spatial distribution of NDVI and its trends observed here is generally in line with existing studies [28,58,59], with minor discrepancies attributable to the aforementioned scale mismatch and the selected study period.
Compared to that in Xinjiang, the proportion of areas in Arizona with mean NDVI higher than 0.1 was much greater (e.g., Figure 6a vs. Figure 7a). The mean NDVI in Arizona (0.232 for annual series) was also higher than in Xinjiang (0.201). The contrast is stronger over drylands, as drylands in Xinjiang are in general drier than in Arizona (see Figure 3c,d), leading to relatively lower level of aboveground biomass even for the same type of plant (e.g., [60]). For example, we found saltcedar, one of the most widely distributed species in Xinjiang, can grow over 5 m in Arizona, with crown width and height way higher than its common size in Xinjiang.
Areas with NDVI > 0.5 were mainly concentrated in the Transition Zone along the edge of the Colorado Plateau, with relatively higher temporal variability than the rest of Arizona (Figure 7a,b). In contrast, Sonoran Desert and the southern part of Colorado Plateau (to the north of the Transition Zone) featured low NDVI levels. The minimum NDVI levels across the entire state were present over the Colorado Plateau (0.10 for both quasi-8-day and annual NDVI). The mean levels of NDVI over different land cover types show general agreement when compared to results in local and regional scale studies [29,61].
Consistent with Xinjiang, Arizona was dominated by greening in the past two decades (Figure 7c). On quasi-8-day scale, 48.0% of the state observed significant increases in NDVI anomalies (average rate: 0.0014 year−1), while 18.8% of the state saw significantly decreasing NDVI anomalies with an average rate of −0.0014 year−1. Similarly, relatively smaller spatial extent of significant greening and browning was observed when using the annual NDVI time series (Figure 7f). Greening areas were mainly distributed in Transition Zone, Colorado Plateau, and Chihuahuan Desert, although the latter two were dominated by arid and semi-arid drylands. Browning areas were found in Sonoran Desert, Lower Colorado River Valley, and some areas scattered over the Colorado Plateau (Figure 7c), with relatively low NDVI (limited vegetation cover). The contrast is attributed in part to the differences in climate types, as observed across the aridity gradient of the southwest U.S. [62].

3.4. Response of Vegetation to Climate in Study Areas

In this section, we estimate the response of quasi-8-day NDVI to daily precipitation and temperature (from quasi-8-day time series) in Xinjiang and Arizona using simple linear regression model. Following Section 3.3, we filtered out pixels with small sample size using a threshold of 20%, and retained pixels with land cover among the five unchanged natural types (see Section 2.2). The sample size for each pixel and the results of regression analyses (slope and R2) are shown in Figure 8 and Figure 9 for Xinjiang and Arizona, respectively. Note that the mean sample sizes in the significant precipitation-NDVI and temperature-NDVI regression models (p-value < 0.05) for Xinjiang are 481.7 and 466.5, respectively (Figure 8c,f), while those for Arizona are 772.6 and 772.8, respectively (Figure 9c,f), primarily due to predominant clear sky conditions in Arizona. Pixels with relatively small sample size were mainly in mountainous areas due to snow or cloud cover, as well as areas covered by desert landscape with very low or even no vegetation during some seasons (NDVI < 0.10).
For pixels with significant precipitation-NDVI relationships in Xinjiang, the majority (99.6%) exhibited positive relationships during the past two decades, i.e., NDVI significantly improved with increasing daily precipitation (Figure 8a). On average, quasi-8-day NDVI increased by 0.0373 for every 1 mm increase in daily precipitation (slope or rate of 0.0373 mm−1). Areas with high rate of increase (0.2 mm−1 and beyond) were mainly covered by natural vegetation (such as forest and grassland) located along the Tian Shan Mountains, Saur Mountains (to the west of Junggar Bain), and some oases in Tarim Basin. Most of these areas also had relatively high values of R2 (>0.3) in the regression model (Figure 8b). In particular, the central part of the Tian Shan Mountains had the strongest (positive) precipitation-NDVI relationships across the entire Xinjiang, suggested by the highest values of R2 (>0.5). The consistency of trends in NDVI and precipitation can be attributable to daily precipitation increase coinciding with vegetation growing seasons [28].
In general, the dependence of NDVI on temperature change was stronger than that on precipitation in Xinjiang (Figure 8b,e), although the regression-based dependence can be suppressed by the inherent lag between temperature changes and ecosystem responses (see Section 3.5). Vegetation growth significantly improved with rising temperature in Xinjiang in the period 2002–2019, during which 98.7% of the significant pixels (in terms of temperature-NDVI relationships) showed positive relationships (Figure 8d). An increase of 0.0064 in NDVI was observed for every 1 °C rise in daily temperature on average (slope or rate of 0.0064 °C−1). Areas with the most significant improvement in NDVI as temperature rises (rate ≥ 0.03 °C−1) were in Tian Shan Mountains and Altai Mountains, indicating more sensitive responses of forests to warming as compared to other vegetation types. In contrast, a large part of Gurbantunggut Desert within Junggar Basin had relatively weak dependence of NDVI on temperature (R2 < 0.1).
Like in Xinjiang, almost all pixels in Arizona with significant precipitation-NDVI relationships (99.8%) had increasing trend of NDVI with enhanced precipitation (Figure 9a). On average, NDVI increased by 0.0086 for each 1 mm increase in daily precipitation in Arizona. The eastern part of Transition Zone (areas at high altitudes), Chihuahuan Desert, and the northeast corner of the state next to New Mexico experienced the highest rates of NDVI increase with daily precipitation rise (≥0.04 mm−1). The strongest (positive) precipitation-NDVI relationships were observed over the eastern Transition Zone and Chihuahuan Desert (R2 > 0.25, see Figure 9b). On the other hand, relatively weak precipitation-NDVI relationships were observed over the rest of Arizona, especially in areas affected by the North American monsoon system, mainly induced by the inconsistency between phenological cycles of dryland vegetation and variability of climate variables [61].
The dependence of NDVI on daily temperature exhibited strong spatial bimodality in Arizona (Figure 9d). As shown in Figure 9d and e, major parts of Colorado Plateau, eastern Transition Zone, Chihuahuan Desert, and areas along the rivers and wetlands in Basin and Range were dominated by greening trend with rising temperature (mean rate of increasing NDVI: 0.0019 °C−1; mean R2 = 0.10). In contrast, much of Basin and Range, western Arizona, and a few areas scattered over Colorado Plateau (including Grand Canyon) saw a browning trend with warming (NDVI decreasing at a mean rate of 0.0016 °C−1; mean R2 = 0.12). Areas with the highest R2 values were in wetlands along the rivers and the northeastern edge of Basin and Range surrounding the Phoenix Metropolitan Area.
Increases in the daily precipitation benefited vegetation growth in both Xinjiang and Arizona during the past two decades, while a higher rate of NDVI increase under wetting conditions was observed in Xinjiang. This suggests that the control of daily precipitation on vegetation also depends on the aridity: more severe aridity (Xinjiang) may lead to more sensitive response of vegetation to precipitation. Rising temperature contributed to improved NDVI in Xinjiang but limited vegetation growth in much of Arizona (46.1%). During the relatively short time period (2002–2019), changing climate (precipitation and temperature) has been more beneficial to enhance vegetation growth in Xinjiang (Figure 4, Figure 6 and Figure 8), while exacerbated warming with highly variable precipitation had led to potential ecosystem degradation in Arizona, as suggested by decreases in NDVI (Figure 5, Figure 7 and Figure 9).

3.5. Response of Vegetation to Climate in Typical Subregions

We further examine the change of vegetation (quasi-8-day NDVI anomalies) over time and the response of five types of natural vegetation covers to climate change and variability (NDVI, daily precipitation, and daily temperature, all at quasi-8-day scale) in detail by selecting three typical subregions (A, B, and C) in each study areas. We used five criteria for the selection: (1) the selected subregion should represent major geographical divisions (Figure 2); (2) the selected subregion should include all five types of natural vegetation covers (see Section 3.1), with composition similar to that of the entire study area; (3) the selected subregion should be dominated by unchanged natural vegetation covers to minimize possible disturbance; (4) within the selected subregion, each type of natural vegetation cover should represent a relatively large area (i.e., large number of pixels, see Table 2), with a sufficiently large sample size (number of available images, n in Table 3 and Table 4) in regression analyses; and (5) the select subregion should have relatively significant NDVI change in response to climate (see Section 3.3 and Section 3.4).
The selected three subregions in Xinjiang cover the foothills of Altai Mountains and the northern part of Junggar Basin (subregion A), the central part of Tian Shan Mountains (subregion B), and the oases in the northern part of Taklimakan Desert (C). For Arizona, the selected three subregions cover a part of Colorado Plateau in northern Arizona (subregion A), the central part of Transition Zone (subregion B), and the transition area from Sonoran Desert to Chihuahuan Desert in the Basin and Range (subregion C). The selected subregions as well as their vegetation cover types are shown in Figure 10, and the land cover compositions are summarized in Table 2.
Different from in Section 3.3 and Section 3.4, NDVI (anomalies), daily precipitation, and daily temperature values of each quasi-8-day cycle are arithmetic averages of all available data over pixels with the same land cover type. Three sets of simple linear regression analyses performed in this section are time-NDVI anomaly, precipitation-NDVI, and temperature-NDVI. The first set shows the change of vegetation over time, while the other two measure the dependence of NDVI on climate change and variability. Figure 11 and Table 3 show the results of regression analyses for Xinjiang, while Figure 12 and Table 4 are for Arizona.
Significant positive dependence (p-value < 0.001) of NDVI on precipitation and temperature during the past two decades was found for all five natural vegetation cover types of three subregions in Xinjiang (Figure 11 and Table 3). The strongest precipitation-NDVI relationships were observed in Xinjiang subregion B (Figure 11 and Table 3), consistent with Figure 8a,b. Different from subregions A and C, precipitation and temperatures were almost equally important to vegetation growth in subregion B. Precipitation-NDVI relationships in subregion A had the lowest R2 values, much lower than in temperature-NDVI relationships, suggesting that plants in this subregion were less affected by precipitation than by temperature. One possible reason is that this subregion is frequently governed by cold waves induced by the Siberian High during spring and fall seasons, and vegetation growth is more constrained by temperature. Similar weak precipitation-NDVI relationships also existed in Xinjiang subregion C (weaker than B but stronger than A), primarily due to the inherent lag among growing seasons, precipitation, and temperature. The linear dependence of NDVI on temperature was consistently stronger than on precipitation (Table 3). The strongest and weakest temperature-NDVI relationships were found in the coldest and warmest subregions (B and C), respectively, echoing the nonlinear response of vegetation dynamics (e.g., net CO2 assimilation) to temperature observed in previous studies [63].
The trend of NDVI anomalies over time was significant (p-value < 0.001) for most land cover types in three subregions in Xinjiang, except for shrubland in subregion B, in which slightly decreasing, although insignificant, was observed (Table 3). As the driest subregion, C saw the strongest greening trend when compared to A and B, likely because it experienced both significantly increasing precipitation and temperature during the past 18 years (Figure 4c,f). The enhanced vegetation growth driven by higher precipitation was even clearer for shrubland grown in subregion C, with the highest increasing rate and R2 among five land cover types. In contrast, greening in subregion A was mainly controlled by warming (Figure 4f), leading to a higher rate of greening than in subregion B, but still lower than in subregion C. The weakest greening trend in Tian Shan Mountains (subregion B) resulted from the interplay of wetting and cooling (Figure 4c,f). Plant enhancements brought by increasing precipitation can be partially counterbalanced by rising stress due to decreasing temperature; such interplay even led to browning over shrubland in subregion B (Table 3).
The dependence of NDVI on precipitation was very weak (R2 < 0.1) in all three subregions in Arizona (Figure 12 and Table 4). This weak relationship was mainly due to the delayed response of vegetation growth to precipitation and the bimodality of rainfall within a year (summers and winters) [61]. For example, vegetation growth can be largely limited by excessive heat during summers, although with high precipitation brought by monsoons. Temperature-NDVI relationships in Arizona were much more complicated than in Xinjiang. Significant positive dependence of NDVI on temperature (p-value < 0.0001) was observed in all land cover types except forests in Arizona subregion A. Wetlands with relatively sufficient water supply in subregion A showed the strongest dependence on temperature (R2 = 0.40) among five land cover types, suggesting vegetation in this region was controlled by both available water and temperature (Figure 3d). Similar trends were also observed in wetlands located in subregions B and C (Table 4). No significant relationship between temperature and NDVI was observed over forest and grassland in subregion B and barren land in C. Vegetation grown in barren land is already well adaptive to high temperature, possibly leading to the observed insensitivity to temperature in subregion C. We found negative temperature-NDVI relationships for shrubland and grassland in subregion C, consistent with results shown in Figure 9d.
In general, increasing NDVI anomalies were found for all five land cover types in three subregions of Arizona, although some are statistically insignificant (p-value > 0.001). Vegetation grown in subregion A on average showed no significant greening or browning trend during the past two decades, suggesting the high uncertainties induced by climate change and variability. In contrast, clear greening was observed in subregions B and C, especially for barren land and forest in B and forest in C (Figure 12 and Table 4). In particular, forest grown in subregion C was enhanced by both wetting and warming trends, while other vegetation types in the same subregion responded differently to such trends. It is noteworthy that much of Arizona was governed by warming trends (Figure 5f). The spatial discrepancies in NDVI trends highlight the important role water plays in vegetation dynamics.
The colder and drier conditions in Xinjiang, as compared to Arizona, jointly contribute to more sensitive response of vegetation growth under changing climate. As a result, every 1 mm increase in daily precipitation or 1 °C increase in daily temperature led to a much greater increase in NDVI anomalies in Xinjiang than in Arizona (Table 3). This is particularly true for barren land in the driest subregions (C) in both study areas: warming contributed to enhanced barren land vegetation in subregion C of Xinjiang but had only marginal impacts in subregion C of Arizona. Temperature is particularly important for vegetation at high altitudes. For example, plants grown in barren land, forest, and shrubland showed enhanced NDVI in subregion B of Arizona but not in subregion B of Xinjiang. This is because subregion B in Arizona experienced warming, while the latter one went through cooling process during the past 18 years (Table 3 and Table 4).
It should be noted that relationships between climate variables and NDVI cannot be fully described by simple linear regression models used here. For areas at high altitudes (subregion B in both study areas), vegetation growth enhanced by increasing precipitation can be limited when temperature is low. Such phenomenon did manifest in Xinjiang subregion B: strong positive relationship between precipitation and NDVI only existed when daily precipitation was below ~1.3 mm, but such relationship disappeared with further increase in precipitation, leading to plateaued NDVI in the high precipitation regime (Figure 11, cf. Figure 12). The response of NDVI to temperature can also be nonlinear in some subregions. Vegetation growth can be significantly suppressed at very low temperature. For subregions A and B in Xinjiang, the positive influence of precipitation on NDVI substantially diminished when daily precipitation was below ~0–5 °C (Figure 11). This is also the case for forest in subregion A of Arizona (Figure 12). The temperature threshold was relatively higher in subregion C of Xinjiang (~15 °C), in which we observed strong hysteresis of NDVI cycle in response to temperature change for all five vegetation types. NDVI stayed very low (~0.1) during the warming period in springs and increased with rising temperature only when temperature was above 15 °C. During the cooling period in falls, NDVI linearly decreased along a path above the original on in the warming period, with a relatively lower slope (Figure 11). These nonlinear processes are co-determined by the intricate interplay of several factors, including not only the inconsistency between climate and growing season (e.g., the onset of greening), but soil nutrient availability and composition of plants as well [64]. Nevertheless, as the first step for the comparison of these two dryland ecosystems, nonlinear analyses are beyond the scope of this study.

4. Concluding Remarks

Drylands are one of the most sensitive areas susceptible to global climate changes. Numerous uncertainties such as inherent variability in climate change, background climate conditions, topography, and land cover composition further complicate how natural vegetation in drylands changes under climate change and variability. In this study, we intercompare the response of natural vegetation to climate change and variability in two typical and similar dryland environments in Asia and North America, i.e., Xinjiang and Arizona. Both study areas were covered by five major natural (unchanged) land cover types (barren land, forest, shrubland, grassland, and wetland) and dominated by drylands during the past two decades. We constructed quasi-8-day datasets of daily precipitation, daily mean temperature, and NDVI based on observations and remote sensing products for the period from June 2000 to October 2019. Areas with statistically significant changes in climate and vegetation were classified using linear regression. Large fraction of Xinjiang experienced warming and wetting, although warming and wetting parts were not co-located. In contrast, Arizona was governed by warming trends with insignificant changes in daily precipitation anomalies.
For areas with natural vegetation, much of both study areas saw significant greening trends, while the increasing rate of NDVI anomalies was relatively higher in Xinjiang. In particular, warming and wetting climate enhanced vegetation growth in Xinjiang, but rising temperature significantly threatened dryland ecosystems in southwestern Arizona. On average, every 1 mm increase in daily precipitation or 1 °C increase in daily temperature resulted in greater increase in NDVI anomalies in Xinjiang than in Arizona. Such more sensitive response of vegetation growth was jointly contributed by colder and drier conditions in Xinjiang. Three typical subregions were further identified in each study area based on geographical division, natural vegetation types, and vegetation changes in response to climate. Subregional analyses reveal diverse responses of similar natural vegetation under climate change, highlighting that moisture plays a pivotal role in regulating dryland vegetation dynamics. In contrast, temperature is of critical importance for vegetation growth at high altitudes.
It should be caveated that the results in this study are by no means fully descriptive of the dynamic responses of vegetation to precipitation and temperature. Based on the constructed long-term quasi-8-day datasets and the identified typical subregions, our next steps will disentangle how seasonal precipitation with different intensity, duration, and frequency, seasonal temperature, and change of climate extremes have affected dryland vegetation phenology. Instead of using the entire 8-day series, we will examine the growing season with a focus on the onset and end of the greening period, peak of NDVI, and lagging responses to precipitation and temperature. Beyond the single vegetation index used here, we will leverage several newly released datasets (e.g., evapotranspiration, net primary productivity, and gross primary productivity) to better identify the growing seasons of different plants. More complex models such as multiple linear regression models and generalized additive models will then be used to include additional variables such as elevation and aridity index. Nevertheless, this work provides a solid ground for the following research. The comparison of two drylands sheds new light on how similar dryland ecosystems with different climate conditions, topography, etc., can lead to distinct trends of plant growth. The observed patterns and contrasts are informative for understanding the potential evolution of dryland ecosystems in Xinjiang and Arizona. Furthermore, such comparisons can also foster locally adaptive policy making processes targeting better dryland ecosystem management to enhance food security, biodiversity, and sustainability under changing climate conditions.

Author Contributions

Conceptualization, F.Z., C.W., and Z.-H.W.; methodology, F.Z., C.W., and Z.-H.W.; software, F.Z. and C.W.; validation, F.Z. and C.W.; formal analysis, F.Z. and C.W.; investigation, F.Z., C.W., and Z.-H.W.; resources, Z.-H.W.; data curation, F.Z. and C.W.; writing—original draft preparation, F.Z. and C.W.; writing—review and editing, F.Z., C.W., and Z.-H.W.; visualization, C.W.; supervision, Z.-H.W.; project administration, Z.-H.W.; funding acquisition, Z.F. and Z.-H.W. All authors have read and agreed to the published version of the manuscript.

Funding

This research was funded by China National Natural Science Foundation (CNSFC) under grant #41761041, U.S. National Science Foundation (NSF) under grant #AGS-1930629, and China Scholarship Council (CSC).

Acknowledgments

We thank Peiyuan Li for taking photos of the Arizona natural landscape in Figure 1. We also thank the handling editor and four anonymous reviewers for their constructive feedback and help in improving the quality of the manuscript.

Conflicts of Interest

The authors declare no conflict of interest.

References

  1. Middleton, N.J.; Sternberg, T. Climate hazards in drylands: A review. Earth Sci. Rev. 2013, 126, 48–57. [Google Scholar] [CrossRef]
  2. Cherlet, M.; Hutchinson, C.; Reynolds, J.; Hill, J.; Sommer, S.; von Maltitz, G. World Atlas of Desertification, 3rd ed.; Publication Office of the European Union: Luxembourg, 2018. [Google Scholar]
  3. Huang, J.; Li, Y.; Fu, C.; Chen, F.; Fu, Q.; Dai, A.; Shinoda, M.; Ma, Z.; Guo, W.; Li, Z.; et al. Dryland climate change: Recent progress and challenges. Rev. Geophys. 2017, 55, 719–778. [Google Scholar] [CrossRef]
  4. Wang, L.; D’Odorico, P.; Evans, J.P.; Eldridge, D.J.; McCabe, M.F.; Caylor, K.K.; King, E.G. Dryland ecohydrology and climate change: Critical issues and technical advances. Hydrol. Earth Syst. Sci. 2012, 16, 2585–2603. [Google Scholar] [CrossRef] [Green Version]
  5. Ahlström, A.; Raupach, M.R.; Schurgers, G.; Smith, B.; Arneth, A.; Jung, M.; Reichstein, M.; Canadell, J.G.; Friedlingstein, P.; Jain, A.K.; et al. The dominant role of semi-arid ecosystems in the trend and variability of the land CO2 sink. Science 2015, 348, 895–899. [Google Scholar] [CrossRef] [Green Version]
  6. Vinoj, V.; Rasch, P.J.; Wang, H.; Yoon, J.-H.; Ma, P.-L.; Landu, K.; Singh, B. Short-term modulation of Indian summer monsoon rainfall by West Asian dust. Nat. Geosci. 2014, 7, 308–313. [Google Scholar] [CrossRef]
  7. Ward, D. The Biology of Deserts; Oxford University Press: New York, NY, USA, 2009. [Google Scholar]
  8. Reynolds, J.F.; Smith, D.M.S.; Lambin, E.F.; Turner, B.L.; Mortimore, M.; Batterbury, S.P.J.; Downing, T.E.; Dowlatabadi, H.; Fernández, R.J.; Herrick, J.E.; et al. Global desertification: Building a science for dryland development. Science 2007, 316, 847–851. [Google Scholar] [CrossRef] [Green Version]
  9. Huang, J.; Yu, H.; Guan, X.; Wang, G.; Guo, R. Accelerated dryland expansion under climate change. Nat. Clim. Chang. 2016, 6, 166–171. [Google Scholar] [CrossRef]
  10. Huang, J.; Ji, M.; Xie, Y.; Wang, S.; He, Y.; Ran, J. Global semi-arid climate change over last 60 years. Clim. Dyn. 2016, 46, 1131–1150. [Google Scholar] [CrossRef] [Green Version]
  11. Zhao, T.; Dai, A. The magnitude and causes of global drought changes in the twenty-first century under a low–moderate emissions scenario. J. Clim. 2015, 28, 4490–4512. [Google Scholar] [CrossRef]
  12. Piao, S.; Yin, G.; Tan, J.; Cheng, L.; Huang, M.; Li, Y.; Liu, R.; Mao, J.; Myneni, R.B.; Peng, S.; et al. Detection and attribution of vegetation greening trend in China over the last 30 years. Glob. Chang. Biol. 2015, 21, 1601–1609. [Google Scholar] [CrossRef]
  13. Zhao, J.; Zhang, H.; Zhang, Z.; Guo, X.; Li, X.; Chen, C. Spatial and temporal changes in vegetation phenology at middle and high latitudes of the Northern Hemisphere over the past three decades. Remote Sens. 2015, 7, 10973–10995. [Google Scholar] [CrossRef] [Green Version]
  14. Wang, X.; Piao, S.; Ciais, P.; Li, J.; Friedlingstein, P.; Koven, C.; Chen, A. Spring temperature change and its implication in the change of vegetation growth in North America from 1982 to 2006. Proc. Natl. Acad. Sci. USA 2011, 108, 1240–1245. [Google Scholar] [CrossRef] [Green Version]
  15. Zhao, X.; Tan, K.; Zhao, S.; Fang, J. Changing climate affects vegetation growth in the arid region of the northwestern China. J. Arid Environ. 2011, 75, 946–952. [Google Scholar] [CrossRef]
  16. Sjöström, M.; Ardö, J.; Arneth, A.; Boulain, N.; Cappelaere, B.; Eklundh, L.; de Grandcourt, A.; Kutsch, W.L.; Merbold, L.; Nouvellon, Y.; et al. Exploring the potential of MODIS EVI for modeling gross primary production across African ecosystems. Remote Sens. Environ. 2011, 115, 1081–1089. [Google Scholar] [CrossRef]
  17. Tian, F.; Brandt, M.; Liu, Y.Y.; Verger, A.; Tagesson, T.; Diouf, A.A.; Rasmussen, K.; Mbow, C.; Wang, Y.; Fensholt, R. Remote sensing of vegetation dynamics in drylands: Evaluating vegetation optical depth (VOD) using AVHRR NDVI and in situ green biomass data over West African Sahel. Remote Sens. Environ. 2016, 177, 265–276. [Google Scholar] [CrossRef] [Green Version]
  18. Yang, J.; Weisberg, P.J.; Bristow, N.A. Landsat remote sensing approaches for monitoring long-term tree cover dynamics in semi-arid woodlands: Comparison of vegetation indices and spectral mixture analysis. Remote Sens. Environ. 2012, 119, 62–71. [Google Scholar] [CrossRef]
  19. Chen, J.; Yan, F.; Lu, Q. Spatiotemporal variation of vegetation on the Qinghai–Tibet Plateau and the influence of climatic factors and human activities on vegetation trend (2000–2019). Remote Sens. 2020, 12, 3150. [Google Scholar] [CrossRef]
  20. Fan, Z.; Li, S.; Fang, H. Explicitly identifying the desertification change in CMREC area based on multisource remote data. Remote Sens. 2020, 12, 3170. [Google Scholar] [CrossRef]
  21. Misra, G.; Cawkwell, F.; Wingler, A. Status of phenological research using Sentinel-2 data: A review. Remote Sens. 2020, 12, 2760. [Google Scholar] [CrossRef]
  22. Anderson, G.L.; Hanson, J.D.; Haas, R.H. Evaluating landsat thematic mapper derived vegetation indices for estimating above-ground biomass on semiarid rangelands. Remote Sens. Environ. 1993, 45, 165–175. [Google Scholar] [CrossRef]
  23. Gamon, J.A.; Field, C.B.; Goulden, M.L.; Griffin, K.L.; Hartley, A.E.; Joel, G.; Penuelas, J.; Valentini, R. Relationships between NDVI, canopy structure, and photosynthesis in three Californian vegetation types. Ecol. Appl. 1995, 5, 28–41. [Google Scholar] [CrossRef] [Green Version]
  24. Wessels, K.J.; Prince, S.D.; Zambatis, N.; MacFadyen, S.; Frost, P.E.; Zyl, D.V. Relationship between herbaceous biomass and 1-km2 Advanced Very High Resolution Radiometer (AVHRR) NDVI in Kruger National Park, South Africa. Int. J. Remote Sens. 2006, 27, 951–973. [Google Scholar] [CrossRef]
  25. Anyamba, A.; Tucker, C.J. Analysis of Sahelian vegetation dynamics using NOAA-AVHRR NDVI data from 1981–2003. J. Arid Environ. 2005, 63, 596–614. [Google Scholar] [CrossRef]
  26. Eckert, S.; Hüsler, F.; Liniger, H.; Hodel, E. Trend analysis of MODIS NDVI time series for detecting land degradation and regeneration in Mongolia. J. Arid Environ. 2015, 113, 16–28. [Google Scholar] [CrossRef]
  27. Gallo, K.; Ji, L.; Reed, B.; Eidenshink, J.; Dwyer, J. Multi-platform comparisons of MODIS and AVHRR normalized difference vegetation index data. Remote Sens. Environ. 2005, 99, 221–231. [Google Scholar] [CrossRef] [Green Version]
  28. Jiapaer, G.; Liang, S.; Yi, Q.; Liu, J. Vegetation dynamics and responses to recent climate change in Xinjiang using leaf area index as an indicator. Ecol. Indic. 2015, 58, 64–76. [Google Scholar] [CrossRef]
  29. Kim, Y. Drought and elevation effects on MODIS vegetation indices in northern Arizona ecosystems. Int. J. Remote Sens. 2013, 34, 4889–4899. [Google Scholar] [CrossRef]
  30. Zhang, Q.; Li, J.; Singh, V.P.; Bai, Y. SPI-based evaluation of drought events in Xinjiang, China. Nat. Hazards 2012, 64, 481–492. [Google Scholar] [CrossRef]
  31. Li, Q.; Chen, Y.; Shen, Y.; Li, X.; Xu, J. Spatial and temporal trends of climate change in Xinjiang, China. J. Geogr. Sci. 2011, 21, 1007–1018. [Google Scholar] [CrossRef]
  32. Beck, H.E.; Zimmermann, N.E.; McVicar, T.R.; Vergopolan, N.; Berg, A.; Wood, E.F. Present and future Köppen-Geiger climate classification maps at 1-km resolution. Sci. Data 2018, 5, 180214. [Google Scholar] [CrossRef] [Green Version]
  33. Peirce, H.W. The Mogollon Escarpment. Fieldnotes Ariz. Bur. Geol. Miner. Technol. 1984, 14, 8–11. [Google Scholar]
  34. Hendricks, J.D.; Plescia, J.B. A review of the regional geophysics of the Arizona Transition Zone. J. Geophys. Res. Solid Earth 1991, 96, 12351–12373. [Google Scholar] [CrossRef]
  35. Sheppard, P.R.; Comrie, A.C.; Packin, G.D.; Angersbach, K.; Hughes, M.K. The Climate of the Southwest; Institute for the Study of Planet Earth, The University of Arizona: Tucson, AZ, USA, 1999. [Google Scholar]
  36. Wang, C.; Wang, Z.-H. Projecting population growth as a dynamic measure of regional urban warming. Sustain. Cities Soc. 2017, 32, 357–365. [Google Scholar] [CrossRef] [Green Version]
  37. Zhang, P.; Deng, M.; Long, A.; Deng, X.; Wang, H.; Hai, Y.; Wang, J.; Liu, Y. Coupling analysis of social-economic water consumption and its effects on the arid environments in Xinjiang of China based on the water and ecological footprints. J. Arid Land 2020, 12, 73–89. [Google Scholar] [CrossRef] [Green Version]
  38. Abatzoglou, J.T.; Dobrowski, S.Z.; Parks, S.A.; Hegewisch, K.C. TerraClimate, a high-resolution global dataset of monthly climate and climatic water balance from 1958–2015. Sci. Data 2018, 5, 170191. [Google Scholar] [CrossRef] [Green Version]
  39. Shi, Y.; Shen, Y.; Kang, E.; Li, D.; Ding, Y.; Zhang, G.; Hu, R. Recent and future climate change in Northwest China. Clim. Chang. 2007, 80, 379–393. [Google Scholar] [CrossRef]
  40. Feng, S.; Fu, Q. Expansion of global drylands under a warming climate. Atmos. Chem. Phys. 2013, 13, 10081–10094. [Google Scholar] [CrossRef] [Green Version]
  41. Li, D.; Zhou, T.; Zou, L.; Zhang, W.; Zhang, L. Extreme high-temperature events over East Asia in 1.5 °C and 2 °C warmer futures: Analysis of NCAR CESM low-warming experiments. Geophys. Res. Lett. 2018, 45, 1541–1550. [Google Scholar] [CrossRef] [Green Version]
  42. Nashwan, M.S.; Shahid, S.; Chung, E.-S. Development of high-resolution daily gridded temperature datasets for the central north region of Egypt. Sci. Data 2019, 6, 138. [Google Scholar] [CrossRef] [Green Version]
  43. Chen, M.; Shi, W.; Xie, P.; Silva, V.B.S.; Kousky, V.E.; Higgins, R.W.; Janowiak, J.E. Assessing objective techniques for gauge-based analyses of global daily precipitation. J. Geophys. Res. Atmos. 2008, 113, D04110. [Google Scholar] [CrossRef]
  44. Nashwan, M.S.; Shahid, S. Symmetrical uncertainty and random forest for the evaluation of gridded precipitation and temperature data. Atmos. Res. 2019, 230, 104632. [Google Scholar] [CrossRef]
  45. Didan, K. MOD13A2 MODIS/Terra Vegetation Indices 16-Day L3 Global 1km SIN Grid V006. NASA EOSDIS Land Process. DAAC 2015. [Google Scholar] [CrossRef]
  46. Didan, K. MYD13A2 MODIS/Aqua Vegetation Indices 16-Day L3 Global 1km SIN Grid V006. NASA EOSDIS Land Process. DAAC 2015. [Google Scholar] [CrossRef]
  47. Brown, J.F.; Howard, D.; Wylie, B.; Frieze, A.; Ji, L.; Gacke, C. Application-ready expedited MODIS data for operational land surface monitoring of vegetation condition. Remote Sens. 2015, 7, 16226–16240. [Google Scholar] [CrossRef] [Green Version]
  48. Du, Z.; Zhang, X.; Xu, X.; Zhang, H.; Wu, Z.; Pang, J. Quantifying influences of physiographic factors on temperate dryland vegetation, Northwest China. Sci. Rep. 2017, 7, 40092. [Google Scholar] [CrossRef]
  49. Xu, Y.; Yang, J.; Chen, Y. NDVI-based vegetation responses to climate change in an arid area of China. Theor. Appl. Climatol. 2016, 126, 213–222. [Google Scholar] [CrossRef]
  50. Jiang, Y.-A.; Chen, Y.; Zhao, Y.-Z.; Chen, P.-X.; Yu, X.-J.; Fan, J.; Bai, S.-Q. Analysis on changes of basic climatic elements and extreme events in Xinjiang, China during 1961–2010. Adv. Clim. Chang. Res. 2013, 4, 20–29. [Google Scholar] [CrossRef]
  51. Xu, C.; Chen, Y.; Yang, Y.; Hao, X.; Shen, Y. Hydrology and water resources variation and its response to regional climate change in Xinjiang. J. Geogr. Sci. 2010, 20, 599–612. [Google Scholar] [CrossRef]
  52. Zhuang, Q.; Wu, S.; Feng, X.; Niu, Y. Analysis and prediction of vegetation dynamics under the background of climate change in Xinjiang, China. PeerJ 2020, 8, e8282. [Google Scholar] [CrossRef]
  53. Chylek, P.; Dubey, M.K.; Hengartner, N.; Klett, J.D. Observed and projected precipitation changes over the nine US climate regions. Atmosphere 2017, 8, 207. [Google Scholar] [CrossRef] [Green Version]
  54. Garfin, G.; Jardine, A.; Merideth, R.; Black, M.; LeRoy, S. Assessment of Climate Change in the Southwest United States: A Report Prepared for the National Climate Assessment; Island Press: Washington, DC, USA, 2013. [Google Scholar]
  55. Gutzler, D.S.; Robbins, T.O. Climate variability and projected change in the western United States: Regional downscaling and drought statistics. Clim. Dyn. 2011, 37, 835–849. [Google Scholar] [CrossRef]
  56. MacDonald, G.M. Water, climate change, and sustainability in the southwest. Proc. Natl. Acad. Sci. USA 2010, 107, 21256–21262. [Google Scholar] [CrossRef] [PubMed] [Green Version]
  57. Wang, C.; Wang, Z.-H.; Wang, C.Y.; Myint, S.W. Environmental cooling provided by urban trees under extreme heat and cold waves in U.S. cities. Remote Sens. Environ. 2019, 227, 28–43. [Google Scholar] [CrossRef]
  58. Cao, X.; Chen, X.; Bao, A.; Wang, Q. Response of vegetation to temperature and precipitation in Xinjiang during the period of 1998-2009. J. Arid Land 2011, 3, 94–103. [Google Scholar] [CrossRef] [Green Version]
  59. Yao, J.; Chen, Y.; Zhao, Y.; Mao, W.; Xu, X.; Liu, Y.; Yang, Q. Response of vegetation NDVI to climatic extremes in the arid region of Central Asia: A case study in Xinjiang, China. Theor. Appl. Climatol. 2018, 131, 1503–1515. [Google Scholar] [CrossRef]
  60. van Hees, A. Growth and morphology of pedunculate oak (Quercus robur L) and beech (Fagus sylvatica L) seedlings in relation to shading and drought. Ann. For. Sci. 1997, 54, 9–18. [Google Scholar] [CrossRef]
  61. Forzieri, G.; Castelli, F.; Vivoni, E.R. Vegetation dynamics within the North American monsoon region. J. Clim. 2011, 24, 1763–1783. [Google Scholar] [CrossRef]
  62. Sohoulande Djebou, D.C.; Singh, V.P.; Frauenfeld, O.W. Vegetation response to precipitation across the aridity gradient of the southwestern united states. J. Arid Environ. 2015, 115, 35–43. [Google Scholar] [CrossRef]
  63. Sage, R.F.; Kubien, D.S. The temperature response of C3 and C4 photosynthesis. Plant Cell Environ. 2007, 30, 1086–1106. [Google Scholar] [CrossRef]
  64. Frank, D.; Reichstein, M.; Bahn, M.; Thonicke, K.; Frank, D.; Mahecha, M.D.; Smith, P.; van der Velde, M.; Vicca, S.; Babst, F.; et al. Effects of climate extremes on the terrestrial carbon cycle: Concepts, processes and potential future impacts. Glob. Chang. Biol. 2015, 21, 2861–2880. [Google Scholar] [CrossRef] [Green Version]
Figure 1. Typical natural landscapes (desert, forest, shrubland, grassland, and wetland) in Xinjiang and Arizona. Photo credit: Fang Zhang and Peiyuan Li.
Remotesensing 12 03567 g001
Figure 2. Geographical divisions, major rivers, and major lakes in (a) Xinjiang and (b) Arizona, overlaid on the topographic map (Global Multi-resolution Terrain Elevation Data 2010; GMTED2010).
Remotesensing 12 03567 g002
Figure 3. Unchanged land cover in (a) Xinjiang and (b) Arizona, and long-term (2002–2018) aridity index in (c) Xinjiang and (d) Arizona.
Remotesensing 12 03567 g003
Figure 4. Statistics of daily precipitation and mean temperature in Xinjiang (2002–2019) based on quasi-8-day averages: (a) mean daily precipitation (mm), (b) standard deviation of daily precipitation (mm), (c) trend of daily precipitation anomalies (mm year−1, p-value < 0.05), (d) mean daily temperature (°C), (e) standard deviation of daily temperature (°C), and (f) trend of daily temperature anomalies (°C year−1, p-value < 0.05).
Remotesensing 12 03567 g004
Figure 5. Statistics of daily precipitation and mean temperature in Arizona (2002–2019) based on quasi-8-day averages: (a) mean daily precipitation (mm), (b) standard deviation of daily precipitation (mm), (c) trend of daily precipitation anomalies (mm year−1, p-value < 0.05), (d) mean daily temperature (°C), (e) standard deviation of daily temperature (°C), and (f) trend of daily temperature anomalies (°C year−1, p-value < 0.05).
Remotesensing 12 03567 g005
Figure 6. Statistics of quasi-8-day and annual NDVI in Xinjiang: (a) mean quasi-8-day NDVI, (b) standard deviation of quasi-8-day NDVI, (c) trend of quasi-8-day NDVI anomalies (year−1, p-value < 0.05), (d) mean annual NDVI, (e) standard deviation of annual NDVI, and (f) trend of annual NDVI (year−1, p-value < 0.05).
Remotesensing 12 03567 g006
Figure 7. Statistics of quasi-8-day and annual NDVI in Arizona: (a) mean quasi-8-day NDVI, (b) standard deviation of quasi-8-day NDVI, (c) trend of quasi-8-day NDVI anomalies (year−1, p-value < 0.05), (d) mean annual NDVI, (e) standard deviation of annual NDVI, and (f) trend of annual NDVI (year−1, p-value < 0.05).
Remotesensing 12 03567 g007
Figure 8. Response of quasi-8-day NDVI to (ac) daily precipitation and (df) daily temperature in Xinjiang using simple linear regression model: (a) slope (mm−1, p-value < 0.05), (b) R2, and (c) sample size of the precipitation-NDVI regression models; (d) slope (°C−1, p-value < 0.05), (e) R2, and (f) sample size of the temperature-NDVI regression models. Note that both daily precipitation and temperature are from the quasi-8-day time series.
Remotesensing 12 03567 g008
Figure 9. Response of quasi-8-day NDVI to (ac) daily precipitation and (df) daily temperature in Arizona using simple linear regression model: (a) slope (mm−1, p-value < 0.05), (b) R2, and (c) sample size of the precipitation-NDVI regression models; (d) slope (°C−1, p-value < 0.05), (e) R2, and (f) sample size of the temperature-NDVI regression models. Note that both daily precipitation and temperature are from the quasi-8-day time series.
Remotesensing 12 03567 g009
Figure 10. Geographical locations of the selected subregions in (a) Xinjiang and (b) Arizona, overlaid on the World Imagery by Environmental Systems Research Institute, Inc. (Esri): (c) Xinjiang subregion A, (d) Xinjiang subregion B, (e) Xinjiang subregion C, (f) Arizona subregion A, (g) Arizona subregion B, and (h) Arizona subregion C, with five natural vegetation land cover types.
Remotesensing 12 03567 g010
Figure 11. Change of NDVI anomalies over time and the response of NDVI to daily precipitation and daily temperature (quasi-8-day scale) for five natural vegetation cover types in three subregions in Xinjiang (2002–2019).
Remotesensing 12 03567 g011
Figure 12. Change of NDVI anomalies over time and the response of NDVI to daily precipitation and daily temperature (quasi-8-day scale) for five natural vegetation cover types in three subregions in Arizona (2002–2019).
Remotesensing 12 03567 g012
Table 1. Land cover reclassification system based on CNLUCC and NLCD classification systems. Note that the values are class numbers in the original classification systems.
ReclassificationCNLUCCNLCD
Water41: river and canal
42: lake
43: reservoir and pond
11: open water
Perennial ice/snow44: perennial ice/snow12: perennial ice/snow
Developed area51: urban land
52: rural settlement
53: other developed lands
21: developed, open space
22: developed, low intensity
23: developed, medium intensity
24: developed, high intensity
Barren land (rock/sand/clay)61: sand
62: Gobi
63: saline-alkali land
65: barren land
66: rock and gravel
67: other unused lands (e.g., alpine desert and tundra)
31: barren land (rock/sand/clay)
Forest21: dense forest
23: sparse forest
24: other forests
41: deciduous forest
42: evergreen forest
43: mixed forest
Shrubland22: dwarf scrub and shrub51: dwarf scrub
52: shrub/scrub
Grassland (herbaceous)31: grassland, high coverage
32: grassland, medium coverage
33: grassland, low coverage
71: grassland/herbaceous
72: sedge/herbaceous
73: lichens
74: moss
Cropland11: paddy field
12: dry field
81: pasture/hay
82: cultivated crops
Wetland45: intertidal zone
46: shoal
64: swampland
90: woody wetlands
95: emergent herbaceous wetlands
Table 2. The composition of five natural vegetation land cover types in the selected subregions (number of pixels).
Subregions in XinjiangSubregions in Arizona
SubregionABCABC
Barren land21,650490622,1597110174
Forest1701331635423564745303
Shrubland530344136615,42612,58415,312
Grassland10,50524,985697819066991094
Wetland4661197762494095
Total (five land cover types)34,85234,74831,61919,80818,07816,978
Fraction of subregion (%)86.386.078.399.690.985.4
Table 3. The dependence of quasi 8-day NDVI on time, quasi 8-day precipitation, and quasi 8-day temperature in three subregions in Xinjiang. Note that n is sample size.
Barren landForestShrublandGrasslandWetland
Xinjiang subregion A
Time-NDVI anomalySlope (year−1)1.13 × 10−31.54 × 10−31.50 × 10−31.64 × 10−31.51 × 10⁻³
R20.170.040.090.090.13
p-value<0.0001<0.0001<0.0001<0.0001<0.0001
Precipitation-NDVISlope (mm−1)0.00920.05240.03260.01770.0396
R20.050.030.030.020.03
p-value<0.0001<0.00010.00010.00030.0001
Temperature-NDVISlope (°C−1)0.00090.01040.00880.00420.0075
R20.270.630.770.560.57
p-value<0.0001<0.0001<0.0001<0.0001<0.0001
n625619598626606
Xinjiang subregion B
Time-NDVI anomalySlope (year−1)0.82 × 10−30.98 × 10−3−0.30 × 10−31.13 × 10−31.31 × 10⁻³
R20.030.010.000.030.06
p-value<0.00010.00060.4090<0.0001<0.0001
Precipitation-NDVISlope (mm−1)0.07200.15440.15840.15260.1320
R20.570.570.510.620.55
p-value<0.0001<0.0001<0.0001<0.0001<0.0001
Temperature-NDVISlope (°C−1)0.00470.01280.01340.01120.0116
R20.440.760.720.750.60
p-value<0.0001<0.0001<0.0001<0.0001<0.0001
n792797691797714
Xinjiang subregion C
Time-NDVI anomalySlope (year−1)1.49 × 10−32.07 × 10−34.09 × 10−31.91 × 10−31.75 × 10⁻³
R20.410.310.490.450.37
p-value<0.0001<0.0001<0.0001<0.0001<0.0001
Precipitation-NDVISlope (mm−1)0.05120.12420.08510.07700.0749
R20.190.260.220.210.22
p-value<0.0001<0.0001<0.0001<0.0001<0.0001
Temperature-NDVISlope (°C−1)0.00230.00520.00330.00330.0033
R20.450.530.390.480.50
p-value<0.0001<0.0001<0.0001<0.0001<0.0001
n797794795797791
Table 4. The dependence of quasi 8-day NDVI on time, quasi 8-day precipitation, and quasi 8-day temperature in three subregions in Arizona. Note that n is sample size.
Barren landForestShrublandGrasslandWetland
Arizona subregion A
Time-NDVI anomalySlope (year−1)0.31 × 10−30.57 × 10−30.32 × 10−30.37 × 10−30.15 × 10⁻³
R20.030.010.010.01<0.01
p-value<0.00010.00140.00310.00170.2078
Precipitation-NDVISlope (mm−1)0.00280.00800.00540.00550.0076
R20.040.050.050.040.05
p-value<0.0001<0.0001<0.0001<0.0001<0.0001
Temperature-NDVISlope (°C−1)0.00040.00030.00070.00080.0018
R20.130.010.110.140.40
p-value<0.00010.0275<0.0001<0.0001<0.0001
n795795796796796
Arizona subregion B
Time-NDVI anomalySlope (year−1)2.26 × 10−32.06 × 10−30.91 × 10−30.04 × 10−31.03 × 10⁻³
R20.140.170.02<0.010.03
p-value<0.0001<0.0001<0.00010.8827<0.0001
Precipitation-NDVISlope (mm−1)0.00410.00550.00490.00630.0043
R20.020.040.040.030.02
p-value<0.0001<0.0001<0.0001<0.0001<0.0001
Temperature-NDVISlope (°C−1)0.00130.0002-0.00050.00010.0025
R20.07<0.010.01<0.010.21
p-value<0.00010.30240.00100.5033<0.0001
n797797797797797
Arizona subregion C
Time-NDVI anomalySlope (year−1)0.88 × 10−34.62 × 10−30.90 × 10−30.23 × 10−31.78 × 10⁻³
R20.090.410.03<0.010.07
p-value<0.0001<0.0001<0.00010.2350<0.0001
Precipitation-NDVISlope (mm−1)0.00430.01260.00570.00640.0052
R20.060.080.030.030.01
p-value<0.0001<0.0001<0.0001<0.00010.0006
Temperature-NDVISlope (°C−1)0.00010.0014−0.0008−0.00070.0015
R2<0.010.040.040.030.07
p-value0.2320<0.0001<0.0001<0.0001<0.0001
n797797797797797
Publisher’s Note: MDPI stays neutral with regard to jurisdictional claims in published maps and institutional affiliations.

