Abstract
Digital Elevation Models (DEMs) of Greenland provide the basic data for studying the Greenland ice sheet (GrIS), but little research quantitatively evaluates and compares the accuracy of various Greenland DEMs. This study uses IceBridge elevation data to evaluate the accuracies of the the Greenland Ice Map Project (GIMP)1 DEM, GIMP2 DEM, TanDEM-X, and ArcticDEM in their corresponding time ranges. This study also analyzes the impact of DEM accuracy and resolution on the accuracy of river network extraction. The results show that (1) within the time range covered by each DEM, TanDEM-X with an RMSE of 5.60 m has higher accuracy than the other DEMs in terms of absolute height accuracy, while GIMP1 has the lowest accuracy among the four Greenland DEMs, with an RMSE of 14.34 m. (2) Greenland DEMs are affected by regional errors and interannual changes. The accuracy in areas with elevations above 2000 m is higher than that in areas with elevations below 2000 m, and better accuracy is observed in the north than in the south. The stability of the ArcticDEM product is higher than those of the other three DEM products, and its RMSE standard deviation over multiple years is only 0.14 m. Therefore, the errors caused by the applications of DEMs with longer time spans are smaller. GIMP1 performs in an opposite manner, with a standard deviation of 2.39 m. (3) The river network extracted from TanDEM-X is close to the real river network digitized from remote sensing images, with an accuracy of 50.78%. The river network extracted from GIMP1 exhibits the largest errors, with an accuracy of only 8.83%. This study calculates and compares the accuracy of four Greenland DEMs and indicates that TanDEM-X has the highest accuracy, adding quantitative studies on the accuracy evaluation of various Greenland DEMs. This study also compares the results of different DEM river network extractions, verifies the impact of DEM accuracy on the accuracy of the river network extraction results, and provides an explorable direction for the hydrological analysis of Greenland as a whole.
1. Introduction
The Greenland ice sheet (GrIS) is the second largest continental ice sheet in the world. It is an important component of the cryosphere and has a significant impact on global climate change. If all the ice melts, the sea level will rise by approximately 7.3 m [1]. Therefore, it is very important to survey the GrIS and estimate ice loss accurately. The mass loss of the GrIS is revealed to make an accelerated contribution to global sea level rise. At present, research on the mass balance of the GrIS mainly uses the flux method, elevation change measurements, and gravity satellite measurements [2,3,4]. Surface ablation and ice outflow are the two main methods of ice sheet mass loss. The mass loss caused by the outflow of ice has been widely studied. As a result that the surface ablation is affected by the terrain and complicated dynamic processes, the acquisition of surface ablation data is difficult, so its study started later [5]. Some studies show that surface ablation is a nonnegligible scientific problem in the mass balance estimate for Greenland and that the mass loss caused by surface ablation is increasing [6,7]. Therefore, research on the hydrological system formed by surface ablation on the GrIS is crucial.
In recent years, surface ablation and its effect on the mass balance of the ice sheet have become a popular topic in the study of the Greenland ice sheet and have received widespread attention [8,9,10]. Many researchers have used remote sensing data to focus their research on river networks formed by surface ablation. The methods involved include digital, semiautomated, and automated extraction of river networks [11,12,13]. A method was proposed by Yang, K., and Smith, L.C., for extracting river networks using spectral and pattern information to depict river networks in high-resolution images [14]. The feasibility of performing spectral-based depth retrieval from high spatial resolution commercial satellite images of glacial lakes and rivers on the GrIS was proven for the first time by Legleiter, C.J. Therefore, optical remote sensing technology can be used to accurately estimate the volume of water stored in not only large lakes but also small melt ponds that might go undetected by sensors with coarser resolution [15]. Landsat images were used for the first time to evaluate the spatial-temporal distribution of the summer meltwater channel in the Jakobshavn area during the summer of 2007 and its relationship with supraglacial lakes on the ice sheet by Lampkin and VanderBerg [16]. According to Chu et al., WorldView-2 remote sensing images, the GIMP DEM, and related parameters were used to estimate river network flow through a GIS modeling framework [17]. As stated by Yang et al., a DEM is indeed useful for the large-scale extraction of river networks on the surface of Greenland, but the setting of depression-filling thresholds has a great impact on river network extraction, and it is not appropriate to use the DEM to obtain the locations of moulins [18]. Chen et al. used DEMs with different resolutions to extract river networks and found that the optimal extraction threshold for high resolution is greater than that for low resolution. At the same time, the river network extracted by the high-resolution DEM has a higher fitting degree with the real river network than the low-resolution DEM [19]. However, because images with high resolution are expensive and the processing of a large amount of high-resolution image data is time consuming, it is difficult to accurately obtain the whole river network distribution in Greenland. However, Greenland river network information can be obtained through the application of DEMs in hydrology. Since the accuracy of using DEMs to extract river networks is highly dependent on the accuracy of the DEM, the selection of a DEM is important for river network extraction.
At present, there are four main types of DEMs that can be applied to Greenland river network extraction, but how to choose a DEM to extract river networks is the focus of this research. The DEM accuracy has a great impact on the practical application of DEMs, so DEM accuracy evaluation is critical. In recent years, there has been little research on quantitatively evaluating the accuracy of different Greenland DEMs. Therefore, this research aimed to evaluate the accuracy of the four existing DEMs. Through the quantitative evaluation of accuracy, the quality of DEMs can be compared, which provides a data reference for selecting the DEM for the extraction of river networks. Finally, based on the accuracy evaluation data, the influence of DEM accuracy on the accuracy of river network extraction can be quantitatively verified. As a result that the Arctic presents some of the most severe climatic conditions, remote sensing is an effective technique to obtain data. The data used to generate DEM products can be obtained through aerial photogrammetry, some satellite scanning systems such as the Multi-Spectral Scanner (MSS) and Thematic Mapper (TM) sensors on Landsat satellites [20] and stereo scanners on Satellite Pour l’Observation de la Terre (SPOT) satellites [21], GPS and total station measurements, pressure altimetry, geological surveys, gravity surveys [22], interferometric radar, radar altimeter (CryoSat), laser altimeter (ICESat), and airborne topographic mapper (ATM). Among them, the application of terrain elevation information is the most common method, so the evaluation of elevation accuracy is very important for DEM applications [23]. Common elevation accuracy evaluation methods include the profile method [22], reference DEM comparison [24], checkpoint method, and DEM error model [25].
In summary, the objectives of this study are (1) to evaluate the accuracy of four Greenland DEMs using the elevation data from IceBridge, calculate the errors in different regions, use the interannual data to calculate the fluctuation of the DEM accuracy, and verify the stability of products within the data acquisition time; (2) to select the DEM with the highest accuracy to extract the Greenland river network; and (3) to assess the river networks extracted from different DEMs and analyze the impact of DEM accuracy on the extraction results.
2. Materials and Methods
2.1. Data
This study uses IceBridge data as verification data to evaluate the accuracy of the four DEMs, compares the river networks extracted from the DEMs, and evaluates the accuracy and feasibility of the river network with color infrared composite Landsat images. The information about the data is as follows.
2.1.1. GIMP DEM
The DEM is the data result of the Greenland Ice Mapping Project (GIMP). The dataset was downloaded from the National Snow and Ice Data Center (NSIDC). The GIMP1 DEM was constructed using the global digital elevation model (GDEM), the SPOT 5 stereoscopic survey of Polar Ice: Reference Images and Topographies (SPIRIT) DEM, and the Bamber DEM enhanced by using AVHRR photoclinometry (PEB DEM). The data were calibrated to an average of Geoscience Laser Altimeter System (GLAS) data from 2003 to 2009. The time scale of the data source is from 2003 to 2009. The ASTER sensor was launched on February 23, 2000, for high-resolution land and vegetation observations. There are 14 bands with resolutions of 15 m, 30 m, and 90 m. The SPOT-5 satellite was launched on May 4, 2002, and ceased to operate on March 27, 2015. The satellite is equipped with four sensors, and its main mission is land observations. Among them, the tasks of the Haute Résolution Géométrique (HRG) and Haute Résolution Stéréoscopique (HRS) instruments are high-resolution land vegetation observation and stereo pair observation for acquiring DEMs, respectively. HRG has 4 multispectral and 1 panchromatic band, and the resolution of the panchromatic band is 5 m; HRS has a single band, with a resolution of 10 m. The GIMP DEM achieves high resolution and accuracy by merging the PEB DEM with topographic maps from high-quality photogrammetry at the edges and recording all land elevations to ICESat laser altimetry data.
The GIMP2 elevation dataset is produced using submeter panchromatic stereoscopic images of the GeoEye-1, WorldView-1, WorldView-2, and WorldView-3 satellites. The time scale of the images is from 2009 to 2015. The GeoEye-1 satellite was launched and began operation on September 6, 2008. The satellite is equipped with a sensor named the GeoEye imaging system (GIS). It has 5 bands, among which the data used for DEM production are panchromatic images with a resolution of 0.41 m. The three WorldView series satellites were launched in 2007, 2009, and 2014. Their mission is to obtain high-resolution terrestrial images. Among them, the sensor carried by the WorldView-1 satellite is WV60, which has only one panchromatic band with a resolution of 0.5 m. The sensors carried by both the WorldView-2 and WorldView-3 satellites is WV110, which has 1 panchromatic band and 8 multispectral bands with a resolution of 0.46 m. The WorldView satellites acquire terrestrial DEMs with stereo image pairs. Using the SETSM software based on the TIN extracted surface, DEMs were produced on high performance computing (HPC) systems at the Ohio Supercomputer Center. According to the point density extraction and filtering of the grid DEM with a resolution of 8 m, the surface errors caused by clouds, water, severe shadows, and other source errors were eliminated. Finally, the iterative slope regression equations of Nuth and Kaab [26] were used to mosaic the images filtered into the original DEM product. The study used the DEM with 30 m resolution provided by NSIDC.
2.1.2. TanDEM-X DEM
The TanDEM-X DEM is a global DEM with resolutions of 12 m, 30 m, and 90 m provided by the Earth Observation Center (EOC) of the German Aerospace Center (DLR). It covers all lands, including the land-based ice sheets in the Arctic and Antarctica. TanDEM-X is an Earth observation radar mission. It is an extension of the TerraSAR-X mission for digital elevation measurement [27], and the first single-range Synthetic Aperture Radar (SAR) interferometer in space, enabling high-precision InSAR acquisition without repeated accuracy limitations caused by universal interferometry [28]. The two satellites acquire data used to produce a global DEM through a typical separation between 120 m and 500 m. The main goal of the TanDEM-X mission is to obtain an accurate three-dimensional map of the Earth’s land surface. Data collection was completed in January 2015, and DEM products were completed in September 2016. Both satellites are equipped with synthetic aperture radar (SAR) and integrated GPS occultation receiver (IGOR) sensors. The center frequency of their radar is 9.65 GHz, and the polarization modes are horizontal and vertical. SAR is a high resolution, all weather and multifunction imager of ocean, land and ice. The altimetry data are obtained from parameters including the baseline length, the incident angle of the image, and the distance from the ground to different SAR sensors between the two satellites. Therefore, the main factors affecting the accuracy of the altimetry are the satellite slope, the baseline length, and the platform height. The accuracy is not affected by Greenland’s special geographic location because of the X band, and its data are more accurate and sufficient. This study used the TanDEM-X DEM with a 90 m resolution. The temporal coverage of the TanDEM data source is from 2011 to 2014.
2.1.3. ArcticDEM
The Greenland ArcticDEM is the seventh release of the V3.0 Pan-Arctic provided by the Polar Geospatial Center (PGC) of the University of Minnesota. The center provides DEMs with resolutions of 2 m, 10 m, 30 m, 100 m, 500 m, and 1000 m. The data source used to produce the ArcticDEM is the same as that used for the GIMP2 DEM, as shown in Table 1. However, the temporal coverages of the two DEMs are different. The temporal coverage of the ArcticDEM project is from 2015 to 2018. The stereo autocorrelation technology was applied to the overlapping image pairs of high-resolution optical satellite images, and the stereo image pairs were processed using computer resources provided by the Blue Waters supercomputer located at the National Center for Supercomputing Applications at the University of Illinois at Urbana-Champaign to generate the ArcticDEM datasets in 100 km × 100 km grids covering the ArcticDEM production range. For the consideration of file size and distribution, each 100 km × 100 km grid is further divided into four 50 km × 50 km subtiles. Finally, the filtered ICESat elevation data are used to improve the accuracy of the strip and mosaic DEM. The data selected in this study have a 100 m resolution.

Table 1.
Four Greenland DEMs used in this study.
2.1.4. IceBridge
The IceBridge Project is the largest polar aviation survey activity ever initiated by the United States to fill the data gap between ICESat-1 and ICESat-2. The aircraft is equipped with multisource sensors, including an ATM, a digital mapping system (DMS) and a Ku-band radar altimeter. The plan conducts annual multi-instrument observations on the rapidly changing characteristics of the Greenland and Antarctic ice sheets, ice shelves and sea ice in the polar regions. IceBridge is scheduled to fly over the Arctic from March to May and over Antarctica from October to November. Since 1993, the ATM has been used for flight surveys in Greenland almost every year, so in addition to the IceBridge dataset, it contains the pre-IceBridge dataset from 1993 to 2009. The topographic measurement of the ATM instrument is a sequence of scanning points along the orbit of the aircraft, with a sampling frequency of 5 kHz. The distance of the points is approximately 30 m along the flight track at the survey speed of the aircraft. In this study, the dataset used was IceBridge ATM L2 Icessn Elevation, Slope, and Roughness, Version 2, released by NSIDC, which contained thousands of data files. Table 2 is the time information table of IceBridge data used for the accuracy evaluation of DEM products.

Table 2.
The acquisition period of the IceBridge data used in relation to each DEM dataset. *The IceBridge data exclude the year 2004 because the data in 2004 were inconsistent with other years.
2.1.5. Landsat
In this study, Landsat satellite images were used as verification data for the extraction of river network. The data were downloaded from the U.S. Geological Survey (USGS) website (https://earthexplorer.usgs.gov/). The data in this study are from 2003 to 2018, so Landsat-7 and Landsat-8 data met the needs of this study. This study used Landsat-7 data products from 2003 to 2012 and Landsat-8 data products from 2013 to 2018. The combined results of the green, red and near-infrared bands can improve the display of the river network characteristics, which was used to assess the extracted river network. For images with insignificant features, enhanced methods were used to increase the river network details. Table 3 shows the image list used in this study.

Table 3.
Landsat image list used in this study.
2.2. Methods
This study used the checkpoint method, and the sampled IceBridge elevation data were used to evaluate the accuracy of the four DEMs by the medium error model. The confluence accumulations of the four DEMs were obtained by hydrological analysis functions, and the river network was extracted by the threshold method. Finally, color infrared composite Landsat images were combined to visually evaluate the accuracy and applicability of the river network extracted from the DEMs.
During the DEM evaluation process, the time interval of the selected IceBridge data was consistent with that of the data used to generate the DEM. Then, the area was divided according to elevation and watershed, and the regional error of the DEM was analyzed. According to the current international basin division method, the Greenland region is divided into seven basins, as shown in Figure 1: North (NO), Northwest (NW), Northeast (NE), Midwest (CW), Southwest (SW), and Southeast (SE) [29]. Finally, the special geographic location of Greenland makes it difficult to obtain GPS data, and the dramatic elevation changes have a great impact on the accuracy of the DEM. Considering the elevation changes in Greenland in different years, IceBridge data from different years were used to evaluate the accuracy of the DEM and analyze the stability of DEM products during the data acquisition time.
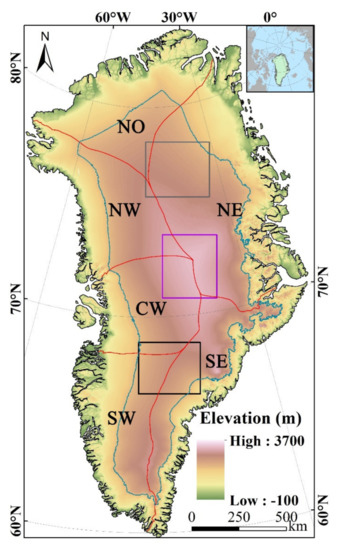
Figure 1.
The TanDEM-X DEM of Greenland. The red lines mark the basin boundaries. The blue line indicates an elevation of 2000 m. NO and others are the names of basins. The black frame is region 1, the purple frame is region 2, and the gray frame is region 3.
2.2.1. Sampling Point Selection
IceBridge contains dense point data with hundreds of millions of points. The resolutions of the DEMs are 30 m, 90 m, and 100 m. There are multiple points in the same DEM pixel, which affects the accuracy evaluation and reduces the difficulty of data processing, so the points need to be selected randomly, and the method must ensure that there is only one point in each DEM pixel.
To achieve the above purpose, based on the storage method of IceBridge data, points are randomly selected from each data file and combined to obtain DEM verification data. It is necessary to set a data extraction threshold for the data. The sampling point selection followed two criteria. (1) When evaluating the DEM accuracy, the data in each file were extracted according to a threshold. The distance between two points extracted by this threshold was far greater than 100 m, which met the purpose that the sampling points were not in the same pixel. For example, four points were extracted from a file containing hundreds of thousands of points, with tens of thousands of points between them. (2) When using interannual data to evaluate the stability of the DEM, to avoid errors caused by the difference in the number of sampling points, it was necessary for the number of sampling points in different years to be similar. The distance between each pair of sampling points was more than 100 m. Therefore, according to the number of files in different years and the amount of data acquired by IceBridge, the extraction threshold was determined to ensure that the numbers of sampling points were similar. Finally, the sampling points were combined to obtain the evaluation data. After sampling points were extracted by year, the number of points extracted from each file increased, so the distance between the sampling points in the edge area was less than 100 m, and it was necessary to remove these points manually.
Since there are several points in the same grid, it is necessary to verify the relationship of the values in the same grid to ensure that the points in the same grid can be randomly selected. Within a reasonable error range, the feasibility of the method is guaranteed. The standard of reasonable error is that the difference between the three points is at the centimeter level. Randomly selecting a point does not cause a large error in the DEM accuracy evaluation. Table 4 shows the standard deviations of sampling points in the same grid in three regions (Figure 1), which are used to evaluate whether sampling point removal is reasonable. As shown in Table 4, the minimum standard deviation is 0.41 cm, the maximum is 7.25 cm, and the mean standard deviation of the twelve regions in total in the four DEMs is 3.76 cm. According to the standard deviation, the fluctuation of the values in the same grid is very small, so any point can be randomly selected, and the error is within a reasonable range. Due to technical limitations, there are more sampling points at the edges than in the central area. However, it can be seen from Figure 2 that wide ranges of sampling points are distributed in the interior of Greenland, and sufficient internal elevation data can be obtained.

Table 4.
The standard deviations of the sampling points in the same grid.
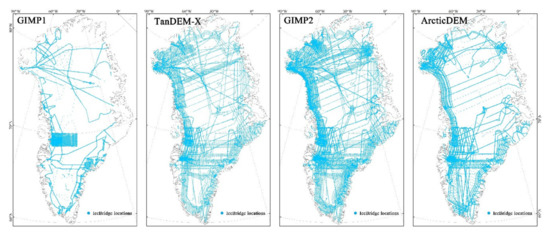
Figure 2.
The distribution of sampling points of the four DEMs.
After the sampling selection, the sampling points of the IceBridge data used for this study were obtained. Then, a DEM elevation value was extracted for each sampling point, and all outliers that exceeded three times the standard deviation were eliminated, as seen in Table 5. The data rejection rates were close among TanDEM-X, GIMP2, and ArcticDEM.

Table 5.
Outlier removal from the sampling points.
2.2.2. Accuracy Evaluation of the DEMs
Due to the special geographical location of the study area and the extreme climatic conditions, field measurement data are extremely limited in Greenland. Therefore, this study used the checkpoint method. The airborne measurement data (IceBridge) with higher accuracy than the satellite measurements were used as the true values of the checkpoints. The elevation values of the corresponding points were extracted from the GIMP1 DEM, TanDEM-X, GIMP2 DEM, and ArcticDEM. The medium error model was established, and the accuracy of the different DEMs was evaluated. The average error model formula is:
The standard deviation model formula is:
The root mean square error model formula is:
The median absolute deviation model formula is:
The normalized median absolute deviation model formula is:
where hi is the airborne measured elevation from IceBridge, hi’ represents the elevation data obtained from the DEM, n is the number of sampling points, Δhj is the height difference between the measured and true values, and mΔh is the median of Δhj. The RMSE is a widely used DEM accuracy evaluation model. This parameter reflects the degree of dispersion between the measured and true values at the DEM sampling points. The smaller the degree of dispersion is, the higher the accuracy of the DEM. The MAD refers to the median of the absolute difference between the error and the median error. The processing of outliers in a dataset is more flexible with MAD than with standard deviation, which greatly reduces the impact of outliers on the data set. The NMAD refers to the estimated standard deviation, and its value is proportional to the MAD. The STD assumes that the data have a normal distribution and refers to the standard deviation of the difference between the true values and measured values; NMAD can tolerate the deviation of multiple values from the normal distribution. All the deviating values do not affect the NMAD. Therefore, the greater the difference between NMAD and STD is, the greater the deviation between the DEM and the true values.
2.2.3. River Network Extraction
In this study, algorithm functions of hydrological elements provided by the integrated hydrological analysis toolbox in ArcGIS 10.5 were used for the extraction of the river network. In a DEM, a depression refers to a grid unit whose elevation is lower than those of other surrounding grid units. It is necessary to fill small and sporadic depressions to prevent them from affecting the extraction of the river network [30]. The flow direction map is generated according to the maximum slope between the DEM pixel and its eight adjacent pixels. The confluence accumulation of each grid is calculated based on the flow direction map. The grid pixels are extracted by setting an accumulation threshold; finally, the river network is generated. The extraction threshold is applied to extract the cells of the confluence accumulation above a certain value, which are used to generate the final river network. The technical process of river network extraction is shown in Figure 3. As a result that the river network in Greenland is completely frozen or even covered with snow in winter, which is similar to the surrounding environment, the river network disappears seasonally. In summer, the river network distribution on the images is obvious and quite different from the surrounding environment, and the information of the river network can be obtained clearly. Therefore, images from summer were selected to assess the river network extraction results.
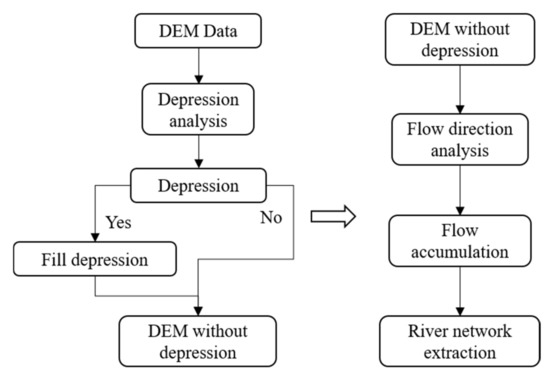
Figure 3.
The workflow of river network extraction.
In this study, the fitting relationship between the extraction threshold and the change rate of the number of river networks was used to determine the river network extraction threshold. Figure 4 shows the change rate of the number of river networks extracted by the four DEMs according to different thresholds. The rate of change on the y-axis refers to the rate of decrease in the number of river networks for every increase of 1000 in the threshold. Figure 4 shows that as the extraction threshold increases, the number of river networks decreases, and the rate of change tends to become flat. The selection criteria of the extraction threshold in this study are as follows: as the threshold increases, the rate of decrease in the number of river networks reaches a low level and tends to flatten. At this time, the threshold is the theoretical extraction threshold of the river network. It can be seen from Figure 4 that when the threshold is 25,000, the number of extraction results from GIMP1, TanDEM-X, and ArcticDEM have the smallest rates of change. When the threshold continues to increase, the rate of change tends to remain the same, so the three DEMs are extracted using a threshold of 25,000. While the resolution of GIMP2 is higher (refer to Table 1), the accumulated volume is much larger than those of other DEM products, so the extraction threshold for GIMP2 is 250,000, as shown in Figure 4. The Greenland river network was extracted based on these thresholds in this study.
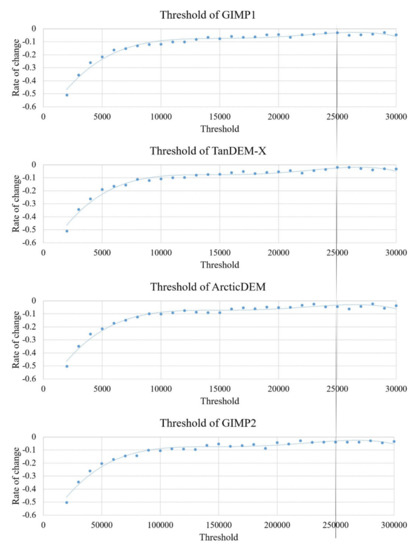
Figure 4.
The fitting relationships between the extraction threshold and the rate of change in the number of extracted river networks.
This study calculates the accuracy between the river network extraction results from the DEM and the digitized river network results from the remote sensing images to estimate the accuracy of the river network extracted from the DEMs. With the rasterization tool in ArcGIS, both the vector files obtained from the DEM extraction results and the digitized river network are rasterized. Then, the pixels where the two rasterization results completely overlap are obtained to calculate the percentage of the overlapping pixels to the pixels extracted from the DEM, which represents the accuracy of river networks extracted from the DEM. Therefore, the higher the accuracy is, the more accurate the DEM extraction result.
3. Results
3.1. DEM Accuracy
3.1.1. Accuracy Evaluation of the DEMs
Figure 5 shows the distributions of the difference between IceBridge and DEM products, and Table 6 summarizes the results of evaluating the DEM parameters. Figure 5 illustrates the distributions of the difference in elevation between IceBridge and the four DEMs. From the definition of the distribution and the standard deviation in Table 6, it can be found that the smaller the standard deviation is, the more concentrated the distribution of elevation differences. The STD used to measure the number of outliers in the four DEMs are 40.71 m, 12.12 m, 81.54 m, and 60.40 m. It can be seen that the TanDEM has fewer outliers in elevation differences, and the quality of this DEM product is higher. The estimated standard deviations NMAD of the four DEMs are 5.74 m, 2.43 m, 3.68 m, and 2.26 m, respectively. Compared with both, they found that the smaller the difference, the less affected by outliers. Therefore, TanDEM has fewer outliers, and the quality of the DEM product is higher. Then, by calculating the RMSE for DEM accuracy evaluation for points with three standard deviations removed (as shown in Section 2.2.1), it is found that the RMSE used to represent the accuracies of the four DEMs are 14.34 m, 5.60 m, 6.98 m, and 6.02 m. Therefore, from the RMSE, the accuracy of GIMP1 is obviously inferior to those of the other three DEMs. TanDEM-X is slightly better than GIMP2 and ArcticDEM. By calculating the MAD and NMAD of the four DEMs, it is found that GIMP2 shows the largest difference between NMAD and STD, and TanDEM-X has the smallest; thus, the outliers have the largest impact on GIMP2 and the least impact on TanDEM-X, indicating that the differences between the products of TanDEM-X and the true values are less and that its accuracy is higher.
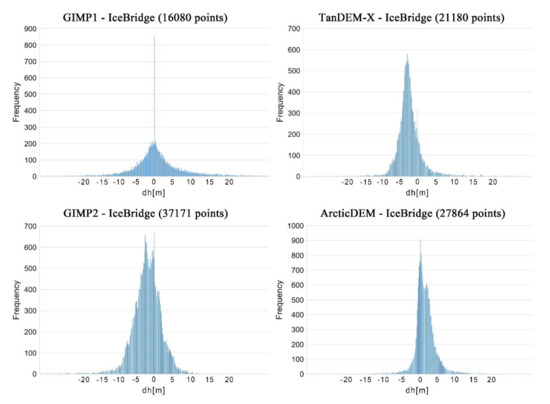
Figure 5.
Histogram plots of height differences for DEM minus IceBridge.

Table 6.
Analysis of sampling points among Greenland Ice Map Project (GIMP)1, TanDEM-X, GIMP2, and ArcticDEM.
3.1.2. Regional Error Analysis of the DEMs
The regional error analysis of a DEM includes two aspects: elevations and basins, as shown in Figure 1.
The Greenland area is divided into areas that are below 2000 m and above 2000 m, and the accuracy of different areas is verified for the four types of DEMs. The results are shown in Table 7. Except for GIMP1, the area above 2000 m in the DEMs has higher accuracy than the area below 2000 m. GIMP1 has the opposite result. Comparing the MAD and NMAD values of areas with different elevations on the same DEM, it can be found that the number of outliers of the three DEMs except for GIMP1 is lower in high elevation areas than in low elevation areas, which may be related to the method to produce GIMP1. An obvious trend can be found from the values of ME and NMAD: ArcticDEM is more accurate in high altitude areas (ME = 0.30 m, NMAD = 1.04 m), while TanDEM-X is affected by the penetration of SAR signals into dry snow in high altitude areas. The values of ME and NMAD are larger, respectively, -4.19 m and 2.01 m. In contrast, TanDEM improves, and ArcticDEM worsens. Both seem to be equivalent at lower altitudes.

Table 7.
Error analysis of GIMP1, TanDEM-X, GIMP2, and ArcticDEM at different altitude ranges.
The accuracy of the six basins is evaluated as shown in Table 8. It is found that the RMSE value in northern Greenland is small. The RMSE in southern Greenland is larger than those in other regions. From this result, we know that the product accuracy of the DEM in northern Greenland is better than that in the southern region. For the analysis of outliers in different basins, it can be seen that the differences between the NMAD value and the actual standard deviation in the northern basins are smaller than those in the south, indicating that the outliers are mostly distributed in the southern Greenland basins. Elevation changes in Greenland may be the cause of anomalies in RMSE and standard deviation. Every summer, the response of elevation change to temperature in the southern region is much faster than that in the northern region. The time scale of the DEM product data source is relatively large, which causes obvious interannual and seasonal changes in the elevations across Greenland. This may be the main reason why there are more outliers in the southern region, which results in significant regional error differences.

Table 8.
Error analysis of GIMP1, TanDEM-X, GIMP2, and ArcticDEM in basin areas.
3.1.3. Impact of Interannual Data on DEM Accuracy
In this study, the interannual data are used to calculate the fluctuations in DEM accuracy to verify the stability of the DEM during the data acquisition time. According to the time range covered by the DEM, the stability of DEM products can be verified using interannual data, and whether the DEM can well represent the topography in this time range can be explored. Then, the IceBridge data for different years are used to calculate the accuracy of the corresponding DEM, and the stability of the DEM is verified by analyzing the STD in accuracy results. RMSE_STD is the standard deviation of the RMSE in different years and is used to measure the stability of DEM products. NMAD_STD is the standard deviation of the STD minus NMAD in different years. Compared with the actual standard deviation, this parameter reveals the influence of the outliers on the evaluation results.
In Table 9, the standard deviation of the RMSE for different years is calculated for the same DEM, and the results are STDArcticDEM < STDTanDEM-X < STDGIMP2 < STDGIMP1. As seen from Table 9, ArcticDEM is the least affected by interannual fluctuations and is best over the time scale; thus, it can best represent the elevation model in the data acquisition time, while GIMP1 is the most affected by interannual fluctuations and its data quality is the worst. By comparing STD and NMAD, the standard deviation of the difference between them is calculated. The results show NMAD_STDTanDEM-X < NMAD_STDGIMP1 < NMAD_STDArcticDEM < NMAD_STDGIMP2 (Table 9). This result is consistent with the difference between STD and NMAD shown in Table 6; the outliers of TanDEM-X have the smallest effect, while those of GIMP2 have the largest effect. In summary, combined with the analysis of the two parameters, the product quality of TanDEM-X is better. Since the DEMs are produced using data from different years, it is impossible to know for which year the DEM of a certain region was generated. When selecting verification data, the regional and time errors have certain impacts on the results. However, when the stability is verified, data from the same year are used as the criterion to reduce the impacts of time and regional effects.

Table 9.
Analysis of the interannual changes in the four DEMs.
3.2. River Network Extraction
3.2.1. The Selection of Threshold
As shown in Figure 6a, TanDEM-X has the highest accuracy, so the extraction results for TanDEM-X are selected for comparison with Landsat-8 remote sensing image data acquired on August 6, 2014, as shown in Table 3. It is found that the threshold extraction result selected by the river network number method is less than the actual river network. Considering the peculiarity of Greenland, this method is not applicable. Decreasing the threshold and comparing the extraction results of river networks with different thresholds, it is found that as the threshold decreases, the river network distribution becomes denser and the result is more similar to the image. When the threshold is continuously decreased, the results of the extracted river network begin to appear redundant, as shown by the red and blue lines in Figure 6e,f. Redundancy means that when the river network extracted from the DEM is compared with the actual river network digitized on the image, the extracted river network appears in an area where there is no actual river network. Therefore, the criterion for evaluating the redundancy is whether there is a real river network at the location where a river network is extracted. The thresholds selected for the extraction results at this time are 300 and 100. To prevent the extraction results from appearing redundant, the actual river network should be relatively matched. Finally, 500 is selected as the threshold to extract the river network by comparing the extraction results for different thresholds with the digitized river network. Affected by the resolution, the threshold of GIMP2 is 4500.
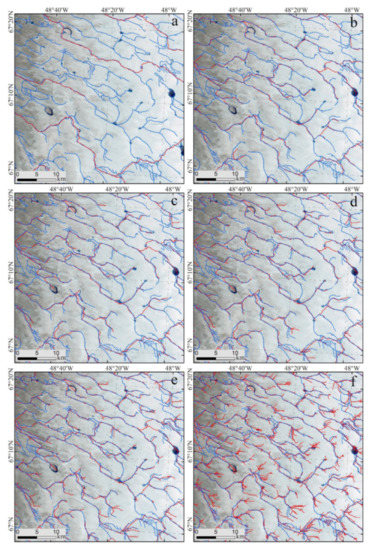
Figure 6.
(a) River extraction results with a threshold of 25,000, (b) river extraction results with a threshold of 2000, (c) river extraction results with a threshold of 1000, (d) river extraction results with a threshold of 500, (e) river extraction results with a threshold of 300, (f) river extraction results with a threshold of 100. The background image is from Landsat-8, and the acquisition time of the image is August 6, 2014. The blue lines represent the river network digitized based on the Landsat image. The red lines indicate the river network extracted from TanDEM-X.
3.2.2. Effect of Image Selection on Verification of Extraction Results
When verifying the DEM river network extraction results, it was difficult to use all the images for verification. Only one or several images could be selected as the verification data. However, due to the special topography of the ice sheet, there might be differences in the river network in different years; further, the time span of producing the DEMs was large, and it was impossible to judge whether the selection of one or several images was reasonable. To ensure the feasibility of selecting any images as verification data in the DEM time scale, it was necessary to investigate whether the selection of images in different years had a significant impact on the verification of the river network extraction results. Taking TanDEM-X as an example, a remote sensing image with no clouds during this DEM time scale was selected as the verification data. Since there was no suitable image in 2011, the data from 2016 were selected as a supplement, and the specific information can be found in Table 3. The threshold for extraction of the river network was 500. The actual digitized river network of the image acquired at a certain time is compared with the extraction result. To prevent the images of different years from affecting the results, the images of different years are selected to verify the extracted river network. As shown in Figure 7, the blue areas in the image represent the supraglacial rivers and the lakes. It can be seen that the river network extracted by the TanDEM-X product is similar to the remote sensing images for different years, while some details were not extracted. This result shows that the main supraglacial river does not change with time; only some small river may change, and the time span of the DEM has little effect on the extraction results of the river network. Therefore, when verifying the extraction results of the river network, it is not necessary to consider the impact of the image acquisition time on the verification results. An image within the DEM time scale can be randomly selected to verify the river network extraction results.
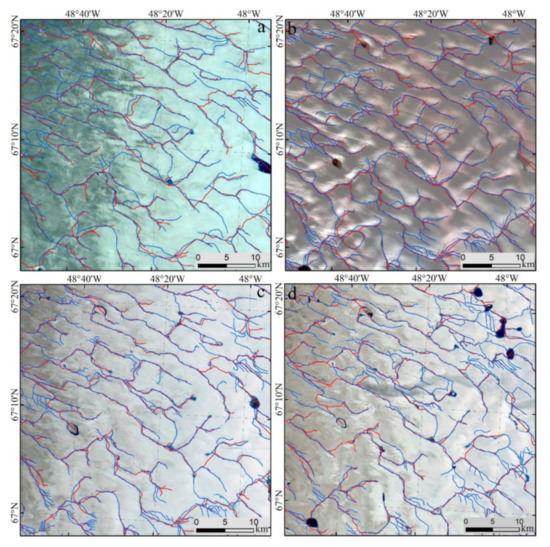
Figure 7.
Comparison of remote sensing images and river network results in different years. The background images in (a–d) are from Landsat-8, and the acquisition dates are July 16, 2012; August 19, 2013; August 6, 2014; and July 10, 2016, respectively. The blue line is the river network digitized based on the Landsat images. The red lines in (a–c) are the river networks extracted from TanDEM-X. The red line in (d) is from ArcticDEM.
3.2.3. Analysis of River Network Extraction Results of Different DEMs
Due to the large study area, it is difficult to analyze the extraction results for the entire Greenland river network. Taking the Southwest Greenland Basin as an example, the Greenland river network is extracted from the DEM using a threshold of 500, and the Landsat image is used to assess the extraction result. The selected image information is shown in Table 3. To display the river network more clearly, the fusion image of the green, red, and near infrared bands is selected (as shown in Figure 8a, Figure 9a, Figure 10a, Figure 11a). The blue lines and areas in the figures represent the supraglacial rivers and lakes formed after melting. Figure 8 is the result of GIMP1 river network extraction, and the image is partially enlarged (see Figure 8b). Compared with Figure 8a, the river network results do not match the actual river network digitized on the image in many places. Only a small number of results follow the actual river network trend.
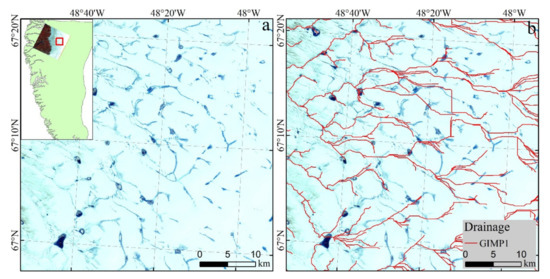
Figure 8.
Verification of the GIMP1 river network extraction result. The basin name of the inset map is the Southwest basin. Panel (a) is the distribution of the actual river network, and panel (b) is the river network extraction result from the GIMP1 product. The background image is from Landsat-7 and was acquired on July 20, 2005.
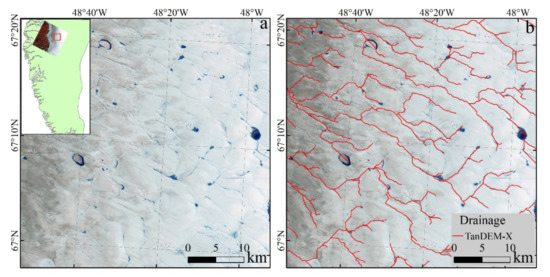
Figure 9.
Verification of the TanDEM-X river network extraction result. The basin name of the inset map is the Southwest basin. Panel (a) is the distribution of the actual river network, and panel (b) is the river network extraction result for the TanDEM-X product. The background image is from Landsat-8 and was acquired on August 6, 2014. River network information on the fused image is not obvious, so the fused image is enhanced.
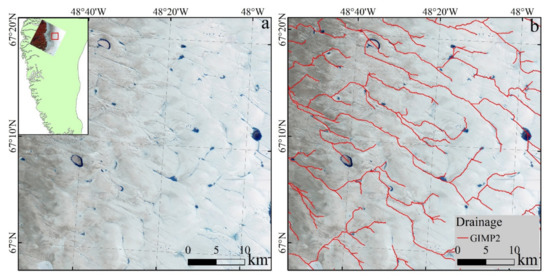
Figure 10.
Verification of the GIMP2 river network extraction result. The basin name of the inset map is the southwest basin. Panel (a) is the distribution of the actual river network, and panel (b) is the river network extraction result for the GIMP2 product. The background image is from Landsat-8 and was acquired on August 6, 2014. River network information on the fused image is not obvious, so the fused image is enhanced.
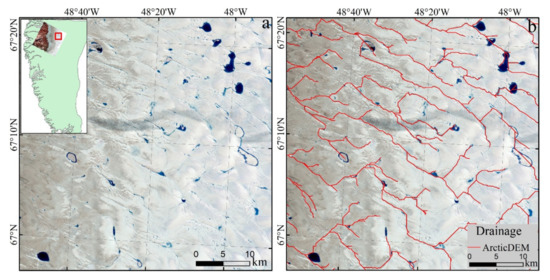
Figure 11.
Verification of the ArcticDEM river network extraction result. The basin name of the inset map is the Southwest basin. Panel (a) is the distribution of the actual river network, and panel (b) is the river network extraction result for the ArcticDEM product. The background image is from Landsat-8 and was acquired on July 10, 2016.
Using the same threshold value to extract the river network from the TanDEM-X product, the result is shown in Figure 9. The comparison between Figure 9a and Figure 9b shows that the extracted river network matches the actual river network digitized on the remote sensing image, but the extraction results are unsatisfactory for the small river networks, which may be due to the coarse DEM resolution.
Since the resolution of GIMP2 is 30 m, the extraction threshold for GIMP2 is 4500. Figure 10 shows the river network extracted from the GIMP2 product. The comparison between Figure 10a and Figure 10b shows that the extracted river network matches the actual digitized river network on the remote sensing image. The result is similar to the extraction result for TanDEM-X shown in Figure 9.
The ArcticDEM product was processed in the same way. After comparison, it is found that the extracted results are consistent with the actual situation. This product is similar to TanDEM-X in that it is inadequate for extracting small rivers. Comparing Figure 9b and Figure 10b, there is a small difference in their results, but the results are similar. Combining the accuracy evaluation results of the four DEMs (Table 6), the results of TanDEM-X, GIMP2, and ArcticDEM are close and better than that of GIMP1. Therefore, using DEM products to extract the river network in Greenland is affected by the DEM accuracy. The higher the DEM accuracy is, the more realistic the extraction results, but the details may be insufficient due to the influence of resolution.
To show the difference between the DEM river network extraction results and the actual digitized river network more clearly, the remote sensing images were visually interpreted and digitized to obtain the actual river network maps, as shown in Figure 12. The blue lines in the figure represent the actual river network based on the digitization of Landsat images, while the red lines mark the river network extraction result for the DEM. Compared with the actual network, GIMP1 clearly shows very chaotic results that do not match. Even the trends of the river network are different. The extraction results for TanDEM-X, GIMP2, and ArcticDEM are compared with the actual network, and the overall river network trend is the same. The common shortcoming of the three results is still the extraction of small river networks. Then, the quantitative analysis of the extraction results for the four DEMs reveals that the length difference and accuracy of the extraction results of TanDEM-X are slightly better than those of GIMP2 and ArcticDEM and far better than those of GIMP1, with an accuracy of 50.78% (Table 10). Since there is a certain displacement error between the extraction result and the digitized result, even if they seem to overlap on the map, this error cannot be included in the accuracy calculation, which means that the overall accuracy is not high. Comparing the accuracy evaluation results in Table 6, it is found that the higher the accuracy of the DEM is, the better the extraction of the river network. However, due to the special climatic environment of the study area, the river network easily changes, and there are many small rivers. Therefore, the method of extracting river networks with high-precision DEM products has application value and can be tried.
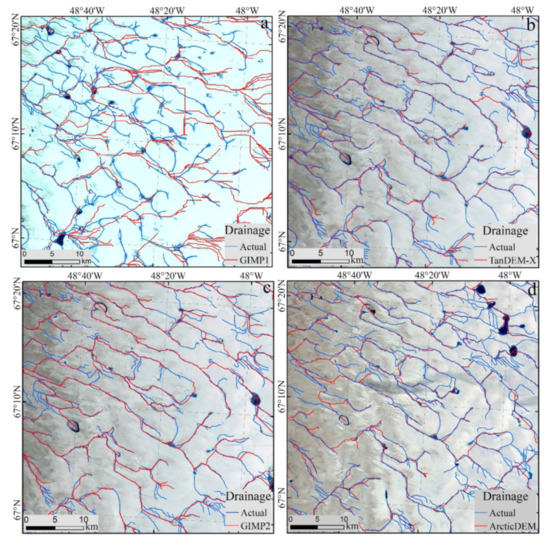
Figure 12.
(a) The river network extraction results for GIMP1 are compared with the actual digitized river network. The background image is from Landsat-7 and was acquired on July 20, 2005. (b) The river network extraction results for TanDEM-X compared with the actual digitized river network. (c) The river network extraction results for GIMP2 compared with the actual digitized river network. The background image for (b,c) are from Landsat-8 and was acquired on August 06, 2014. (d) The river network extraction results of ArcticDEM are compared with the actual river network digitized. The background image is from Landsat-8, and acquired on July 10, 2016.

Table 10.
Quantitative results of the river network extraction for three DEMs.
4. Discussion
In this study, the geographic location of Greenland, the choice of data and the method of pre-processing will have a non-negligible impact on the evaluation of DEM accuracy and river network extraction results, so the following points need to be noted.
4.1. Data Source Differences of DEM Dataset
GIMP2 and ArcticDEM are produced by the stereo pairs of WorldView-1, WorldView-2, WorldView-3, and a small number of GeoEye-1. TanDEM-X is produced from high-precision InSAR radar data acquired by TanDEM-X and TerraSAR-X. Since GIMP2 and ArcticDEM are derived from optical data, atmospheric factors such as clouds, fog, and shadows may blur ground data, and it is difficult to extract terrain, resulting in large errors. Optical data cannot penetrate ice and snow, so generating Greenland DEM from optical images may cause elevation to be higher than true elevation. TanDEM-X is derived from the radar data obtained by InSAR, and the SAR signal has the characteristics of penetrating snow, and the different properties (density, dielectric properties, etc.) of the snow itself will lead to different penetration [31]. Therefore, the production of TanDEM-X will be affected by the penetration of snow, and the DEM elevation may be lower than the actual elevation. Abdullahi. S. et al. verified the influence of snow characteristics on the accuracy of TanDEM-X and found that at the edge of Greenland, snow characteristics change significantly and frequently, so the DEM error in the offshore area is greater [32]. This may also be one of the reasons why the different DEM datasets are quite different in the nearshore areas.
4.2. Radar Signal Penetration of TanDEM-X
According to the study of Abdullahi S and others, there is almost no penetration on the hard rocks and bare ice of the coast. The steep slope of the glacier outlet at the coast and the open water can produce a deviation of more than -9 m, and moving inward, it was found that the permeability deviation in the percolation zone was only -2 m to -3 m. The study also showed that the transition from the percolation zone to the high-altitude dry snow area increased the penetration deviation from -4 m to -10 m [32]. This shows that the impact of radar signal penetration of TanDEM-X on DEM production cannot be ignored. This is also a characteristic that is obviously different from the optical data, and is an important factor that causes the difference between DEMs. It can explain the phenomenon that the elevation of TanDEM-X is lower than that of ArcticDEM as a whole.
4.3. Geographical Impact
Compared with the accuracy evaluation of TanDEM-X global DEM products by Birgit Wessel, the RMSE of all continents except Antarctica and Greenland is less than 1.5 m [33], the DEM accuracy in this study area is low. The geographical location and environmental factors of Greenland may cause the interannual and seasonal changes in elevation to be more obvious. In summer, the snow and ice on the GrIS will form large and small rivers after melting. The river network at different periods may have different details. Therefore, the threshold selection method of conventional watersheds is not suitable for Greenland. A more suitable threshold can be selected by comparing the extraction results of different thresholds.
4.4. Time Selection of IceBridge data
Greenland is affected by geographical and environmental factors, and the ice sheet elevation may change with time. Therefore, in order to reduce the error as much as possible, the time of IceBridge data needs to be the same as the time of data which was used to produce DEM. For example, the TanDEM-X DEM is produced from 2011 to 2014, then the IceBridge data also needs to be from 2011 to 2014 to ensure the time consistency.
This study reduced the errors caused by geographic location, data, and methods as much as possible, filled the blank of DEM accuracy evaluation in Greenland, and evaluated the applicability of using DEM to extract the Greenland river network on a large scale.
5. Conclusions
In this study, the IceBridge ATM data were used to evaluate the accuracy of the four Greenland DEMs. Then, the Greenland river network was extracted using the most accurate products, and the extracted river networks from different DEMs were compared. The following conclusions are obtained.
The accuracy evaluation of the four DEMs using IceBridge data shows that the RMSE of TanDEM-X is 5.60 m, which is slightly higher than those of ArcticDEM and GIMP2. The RMSE of GIMP1 is as high as 14.34 m, and its accuracy is significantly lower. The difference between STD and NMAD indicates the influence of outliers on the accuracy of DEM. By comparison, it is found that TanDEM-X is least affected by outliers. In summary, among the four DEMs, the accuracy of TanDEM-X is highest.
Regional error and stability analysis of the four DEMs shows that the accuracy in the areas with high elevations is greater than that in the areas with low elevations. GIMP1 performs the opposite compared to other DEMs, which may be due to different production methods. The accuracy in the north is higher than that in the south. Considering the stability of DEM, a comprehensive analysis of two indicators including RMSE_STD and NMAD_STD found that the standard deviation of the RMSE of ArcticDEM in different years is only 0.14 m, but the NMAD_STD is 5.50 m, which is greatly affected by outliers. The standard deviation of RMSE of TanDEM-X in different years is 0.46 m, but the NMAD_STD is 2.40 m, which is the least affected by outliers. Therefore, TanDEM-X is more stable.
Comparing the results for the river networks extracted from different DEMs shows that the extraction result from TanDEM-X has the highest overlap with the digital river network, with an accuracy of 50.78%. This result is slightly better than those of GIMP2 and ArcticDEM. The accuracy of the GIMP1 extraction result is only 8.85%. There is a large error, and the extracted network does not match the actual river network. Therefore, the higher the accuracy of the DEM is, the better the extraction result.
In summary, this study compares and analyzes the accuracy of four Greenland DEMs, and provides data support for the related application research of DEM in Greenland. Choosing a more accurate DEM has a great significance for reducing the error of DEM application research. At the same time, by verifying the impact of DEM accuracy in hydrological applications, this paper not only further proves the importance of DEM accuracy for its application, but also provides an explorable direction for the hydrological research of Greenland as a whole.
Author Contributions
Z.X. and F.H. discussed and designed the experiment; Z.X. processed and analyzed the data and wrote the manuscript; Z.C. and S.C. discussed the results and revised the manuscript; Y.Y. and H.H. investigated the results and revised the manuscript; F.H. and X.C. investigated the results, revised the manuscript, and supervised the study. All authors have read and agreed to the published version of the manuscript.
Funding
This research was funded by the Strategic Priority Research Program of Chinese Academy of Sciences (XDA19070202), the National Key Research and Development Program of China (2018YFC1407103) and the National Natural Science Foundation of China (41976214).
Acknowledgments
We greatly thank the NSIDC for providing the IceBridge, GIMP1 and GIMP2 datasets, the University of Minnesota of America for providing the ArcticDEM, the EOC of DLR for providing the TanDEM-X dataset, and the USGS for providing the Landsat images.
Conflicts of Interest
The authors declare no conflict of interest.
References
- Alley, R.B.; Andrews, J.T.; Brigham-Grette, J.; Clarke, G.K.C.; Cuffey, K.M.; Fitzpatrick, J.J.; Funder, S.; Marshall, S.J.; Miller, G.H.; Mitrovica, J.X.; et al. History of the Greenland Ice Sheet Paleoclimatic insights. Quat. Sci. Rev. 2010, 29, 1728–1756. [Google Scholar] [CrossRef]
- Hanna, E.; Navarro, F.J.; Pattyn, F.; Domingues, C.M.; Fettweis, X.; Ivins, E.R.; Nicholls, R.J.; Ritz, C.; Smith, B.; Tulaczyk, S. Ice sheet mass balance and climate change. Nature 2013, 498, 51–59. [Google Scholar] [CrossRef] [PubMed]
- Rignot, E.; Thomas, R.H. Mass Balance of Polar Ice Sheets. Science 2002, 297, 1502–1506. [Google Scholar] [CrossRef] [PubMed]
- Dowdeswell, J.A. The Greenland Ice Sheet and Global Sea-Level Rise. Science 2006, 311, 963–964. [Google Scholar] [CrossRef] [PubMed]
- IPCC. Climate Change 2007: The Physical Science Basis. Contribution of Working Group I to the Fourth Assessment Report of the Intergovernmental Panel on Climate Change; Cambridge University Press: Cambridge, UK, 2007. [Google Scholar]
- Enderlin, E.M.; Howat, I.M.; Jeong, S.; Noh, M.-J.; van Angelen, J.H.; van den Broeke, M.R. An improved mass budget for the Greenland ice sheet. Geophys. Res. Lett. 2014, 41, 866–872. [Google Scholar] [CrossRef]
- Van den Broeke, M.; Bamber, J.; Ettema, J.; Rignot, E.; Schrama, E.; van de Berg, W.J.; van Meijgaard, E.; Velicogna, I.; Wouters, B. Partitioning Recent Greenland Mass Loss. Science 2009, 326, 984–986. [Google Scholar] [CrossRef]
- Luthcke, S.B.; Zwally, H.J.; Abdalati, W.; Rowlands, D.D.; Ray, R.D.; Nerem, R.S.; Lemoine, F.G.; McCarthy, J.J.; Chinn, D.S. Recent Greenland Ice Mass Loss by Drainage System from Satellite Gravity Observations. Science 2006, 314, 1286–1289. [Google Scholar] [CrossRef]
- Schoof, C. Ice-sheet acceleration driven by melt supply variability. Nature 2010, 468, 803–806. [Google Scholar] [CrossRef]
- Sundal, A.V.; Shepherd, A.; Nienow, P.; Hanna, E.; Palmer, S.; Huybrechts, P. Melt-induced speed-up of Greenland ice sheet offset by efficient subglacial drainage. Nature 2011, 469, 521–524. [Google Scholar] [CrossRef]
- Joughin, I.; Das, S.B.; Flowers, G.E.; Behn, M.D.; Alley, R.B.; King, M.A.; Smith, B.E.; Bamber, J.L.; van den Broeke, M.R.; van Angelen, J.H. Influence of ice-sheet geometry and supraglacial lakes on seasonal ice-flow variability. Cryosphere 2013, 7, 1185–1192. [Google Scholar] [CrossRef]
- Dillabaugh, C.R.; Niemann, K.O.; Richardson, D. Semi-Automated Extraction of Rivers from Digital Imagery. GeoInformatica 2002, 6, 263–284. [Google Scholar] [CrossRef]
- Merwade, V.M. An Automated GIS Procedure for Delineating River and Lake Boundaries. Trans. GIS 2007, 11, 213–231. [Google Scholar] [CrossRef]
- Yang, K.; Smith, L.C. Supraglacial Streams on the Greenland Ice Sheet Delineated from Combined Spectral–Shape Information in High-Resolution Satellite Imagery. IEEE Geosci. Remote Sens. Lett. 2013, 10, 801–805. [Google Scholar] [CrossRef]
- Legleiter, C.J.; Tedesco, M.; Smith, L.C.; Behar, A.E.; Overstreet, B.T. Mapping the bathymetry of supraglacial lakes and streams on the Greenland ice sheet using field measurements and high-resolution satellite images. Cryosphere 2014, 8, 215–228. [Google Scholar] [CrossRef]
- Lampkin, D.J.; VanderBerg, J. Supraglacial melt channel networks in the Jakobshavn Isbrae region during the 2007 melt season. Hydrol. Process. 2014, 28, 6038–6053. [Google Scholar] [CrossRef]
- Chu, V.W.; Smith, L.C.; Yang, K.; Gleason, C.J.; Rennermalm, A.K.; Pitcher, L.H.; Legleiter, C.J.; Forster, R.R. Remote Estimation of Greenland Ice Sheet Supraglacial River Discharge using GIS Modeling and WorldView-2 Satellite Imagery. In Proceedings of the Agu Fall Meeting, San Francisco, CA, USA, 1 December 2014. [Google Scholar]
- Yang, K.; Smith, L.C.; Chu, V.W.; Gleason, C.J.; Li, M. A Caution on the Use of Surface Digital Elevation Models to Simulate Supraglacial Hydrology of the Greenland Ice Sheet. IEEE J. Sel. Top. Appl. Earth Obs. Remote Sens. 2015, 8, 5212–5224. [Google Scholar] [CrossRef]
- Chen, L.; Yuan, Y.; Yuan, X.; Yang, X.; Huang, J.; Yu, Y. Threshold Selection of River Network Extraction Based on Different DEM Scales Using ATRIC Algorithm. IOP Conf. Ser. Mater. Sci. Eng. 2018, 322, 47–52. [Google Scholar] [CrossRef]
- Chander, G.; Markham, B.L.; Helder, D.L. Summary of current radiometric calibration coefficients for Landsat MSS, TM, ETM+, and EO-1 ALI sensors. Remote Sens. Environ. 2009, 113, 893–903. [Google Scholar] [CrossRef]
- Toutin, T. Generation of DSMs from SPOT-5 in-track HRS and across-track HRG stereo data using spatiotriangulation and autocalibration. ISPRS J. Photogramm. Remote Sens. 2006, 60, 170–181. [Google Scholar] [CrossRef]
- Li, Z.; Zhu, Q. Digital Elevation Model, 1st ed.; Wuhan Technical University of Surveying and Mapping Press: Wuhan, China, 2000; pp. 12–15. [Google Scholar]
- Endreny, T.; Wood, E.F.; Lettenmaier, D. Satellite-derived digital elevation model accuracy: Hydrological modelling requirements. Hydrol. Process. 2000, 14, 177–194. [Google Scholar] [CrossRef]
- Miliaresis, G.C.; Paraschou, C.V.E. Vertical accuracy of the SRTM DTED level 1 of Crete. Int. J. Appl. Earth Obs. 2005, 7, 49–59. [Google Scholar] [CrossRef]
- Tang, G.; Li, F.; Liu, X. Digital Elevation Model Course, 3rd ed.; Science Press: Beijing, China, 2016; pp. 126–127. [Google Scholar]
- Nuth, C.; Kääb, A. Co-registration and bias corrections of satellite elevation data sets for quantifying glacier thickness change. Cryosphere 2011, 5, 271–290. [Google Scholar] [CrossRef]
- Zink, M.; Bachmann, M.; Brautigam, B.; Fritz, T.; Hajnsek, I.; Moreira, A.; Wessel, B.; Krieger, G. TanDEM-X: The New Global DEM Takes Shape. IEEE Geosci. Remote Sens. Mag. 2014, 2, 8–23. [Google Scholar] [CrossRef]
- Krieger, G.; Zink, M.; Bachmann, M.; Brutigam, B.; Moreira, A. Tandem-X: A Radar Interferometer with Two Formation Flying Satellites. Acta Astronautica 2013, 89, 83–98. [Google Scholar] [CrossRef]
- Rignot, E.; Mouginot, J. Ice flow in Greenland for the International Polar Year 2008–2009. Geophys. Res. Lett. 2012, 39, L11501. [Google Scholar] [CrossRef]
- Tao, X.; Guangdao, H. Some problems of automatic extraction of water system based on digital elevation model. Geogr. Geogr. Inf. Sci. 2004, 20, 11–14. [Google Scholar]
- Rignot, E.; Jezek, K.; Van Zyl, J.; Drinkwater, M.R.; Lou, Y. Radar scattering from snow facies of the Greenland ice sheet: Results from the AIRSAR 1991 campaign. In Proceedings of the IGARSS’93-IEEE International Geoscience and Remote Sensing Symposium, Tokyo, Japan, 18–21 August 1993; pp. 1270–1272. [Google Scholar]
- Abdullahi, S.; Wessel, B.; Huber, M.; Wendleder, A.; Kuenzer, C. Estimating Penetration-Related X-Band InSAR Elevation Bias: A Study over the Greenland Ice Sheet. Remote. Sens. 2019, 11, 2903. [Google Scholar] [CrossRef]
- Wessel, B.; Huber, M.; Wohlfart, C.; Marschalk, U.; Kosmann, D.; Roth, A. Accuracy assessment of the global TanDEM-X Digital Elevation Model with GPS data. ISPRS J. Photogramm. 2018, 139, 171–182. [Google Scholar] [CrossRef]
Publisher’s Note: MDPI stays neutral with regard to jurisdictional claims in published maps and institutional affiliations. |
© 2020 by the authors. Licensee MDPI, Basel, Switzerland. This article is an open access article distributed under the terms and conditions of the Creative Commons Attribution (CC BY) license (http://creativecommons.org/licenses/by/4.0/).