1. Introduction
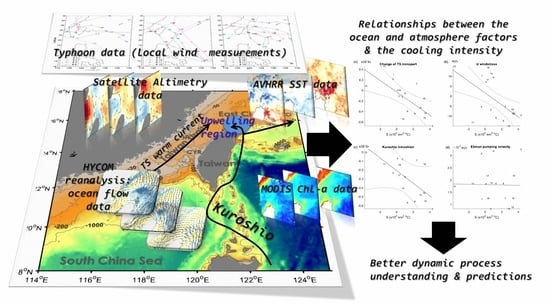
The Kuroshio Current flows northward along the east coast of Taiwan, with its principal stream turning northeast along the continental shelf of the East China Sea (ECS) after leaving the coast (
Figure 1). Hydrographic observations and current measurements have confirmed the presence of subsurface Kuroshio waters off northeastern Taiwan [
1]. Persistent upwelling off this area is associated with weak local cyclonic circulation and the intrusion of Kuroshio waters interacting with the ocean topography [
2]. The upwelling brings cold and saline Kuroshio waters to the ECS continental shelf, forming a cold dome region. Higher concentrations of nutrients can be found in the upwelled waters, thus, the cold dome is a major fishing ground and its physical properties, along with its spatial and temporal variations, have been widely studied [
1,
2,
3,
4,
5,
6,
7,
8,
9].
Shen et al. [
3] attributed the summertime Kuroshio intrusion to a shoreward force, similar to the centrifugal force caused by the Kuroshio as it follows (approximately) the curvature of the isobaths off northeastern Taiwan. The cold dome is modulated by local current circulation. To the west of Taiwan, the Taiwan Strait (TS)’s warm currents flow northward to join the ECS. TS outflow is related to the strength of the cold dome. Stronger (weaker) TS currents often accompany a weaker (stronger) Kuroshio intrusion because of changes in the pressure field. The circulation off northern Taiwan is also strongly modulated by East Asian monsoons. The Kuroshio current east of Taiwan is farther offshore during summer, and thus, intrusion to the ECS continental shelf is weaker than in winter. The mechanism of the upwelling is complicated, which means the temporal and spatial scales of the cold dome vary. The radius of the cold dome is approximately 50 km, and variations in the shape of cooling area are large [
2].
Typhoons frequently occur over the tropical western Pacific and pass near the southern ECS. They can trigger phytoplankton blooms and increase primary production by inducing vertical mixing and upwelling near their paths and around Taiwan [
10,
11]. In an open ocean, a typhoon can induce significant upper ocean cooling, the primary process of which depends on the ratio of the typhoon’s moving speed to its radius. One major process is Ekman pumping induced by wind stress curl, and another is the vertical mixing or entrainment that accompanies typhoon-induced inertial oscillations [
12,
13]. However, the presence of the solid boundary, shoaling topography, and the coastal current in the continental shelf region means that a typhoon-induced ocean response is more complicated and unique. Studies have observed significant typhoon-enhanced cooling (4–8 °C) [
9,
10,
14] in the cold dome region. Using hydrographic data, Tsai et al. [
14] concluded that typhoon-induced cooling in the cold dome region is due to the Kuroshio being driven by strong typhoon winds onto the continental shelf north of Taiwan. Morimoto et al. [
15] further investigated the fluctuations and mechanism of Kuroshio axis movement using sea surface current data. They proposed that the continuous blowing of southerly winds may push the Kuroshio axis onto the shelf and persist for a period of time after a typhoon has passed. Chang et al. [
10] suggested that a drop in sea surface temperature (SST) might be caused by the Ekman pumping induced by typhoons.
Although the mechanism of enhanced cooling associated with Kuroshio upwelling in the southern ECS has been investigated in numerous studies, these have primarily been case studies. Moreover, the enhanced cooling in the cold dome region that is associated with a typhoon is not limited to a particular type of track [
14]. A more comprehensive study on typhoon-induced cooling off northeastern Taiwan, one that determines the different intensities and tracks of a typhoon, would be helpful in predicting typhoon-induced physical and biological responses in the cold dome region. To achieve this, high-resolution SST monitoring images are required to identify the pattern of SST changes associated with a typhoon.
This study, therefore, investigated enhanced cooling off the northeastern coast of Taiwan after the passing of various typhoons. We used Advanced Very High-Resolution Radiometer (AVHRR) SST data to identify areas of cooling. However, clear daily images were unavailable due to cloud cover, therefore, one-week composite images were used. Upwelling intensity was determined according to the SST difference between the mean location (25.25–25.75°N, 122–122.5°E) of the cold dome and the Kuroshio region southeast of the dome (24.5–25.0°N, 122.0–122.5°E) off eastern Taiwan. Higher contrast between the SST of the cold dome and the surrounding Kuroshio region was associated with stronger upwelling in the cold dome. We found that the strength and duration of southeasterly wind stress and the change in water transport in the TS were significantly correlated with upwelling intensity. The remainder of this paper is organized as follows.
Section 2 presents the data sources and the index calculation of factors,
Section 3 presents the results, and
Section 4 presents the discussion and conclusions.
2. Methods
AVHRR SST level 2 data of cloud and land masking from June 2009 to August 2013 were collected from series National Oceanic and Atmospheric Administration satellite (NOAA 16~18) produced by regional High Resolution Picture Transmission (HRPT) data library at National Taiwan Ocean University. Navigation and cloud-detection techniques developed by Sakaida and Kawamura [
16] were then employed. The multichannel SST (MCSST) algorithm [
17] was used to produce pass SST data at a spatial resolution of 1.1 km, all passes in both daytime and nighttime were then composited into daily average images. Lee et al. [
18] validated the SST algorithm by comparing 1998–2002 AVHRR-based MCSSTs with in situ data. The MCSSTs exhibited a small bias of 0.009 °C, with Root Mean Square Deviation (RMSD) of 0.64 °C. Weekly composite SST data were generated by arithmetically averaging all the available scenes in each month on a pixel-by-pixel basis (excluding missing data and clouds). The ocean color level 2 products with 1.1 km resolution of MODIS (Moderate Resolution Imaging Spectroradiometer) onboard both Aqua and Terra satellites were collected from Ocean Color Web (
https://oceancolor.gsfc.nasa.gov/) of NASA (National Aeronautics and Space Administration). Because the activated coverage was low, weekly mean maps are composed before and after the typhoon passage.
The best track data were obtained from the Digital Typhoon website (
http://agora.ex.nii.ac.jp/digital-typhoon/) operated by Japan’s National Institute of Informatics. These provided access to SST images of 18 typhoons that passed through the study area from 2009 to 2013. Weekly mean maps were composed before and after each typhoon had passed.
The 18 typhoon tracks are plotted in
Figure 2. The typhoon season lasts from May to September. Most of the 18 typhoon tracks headed northwest and came from the east of Taiwan. Three typhoons headed northeast, passing east of Taiwan. Most typhoons passed north to the cold dome region, six typhoons passed south to the cold dome region, and four typhoons passed east to Taiwan.
The cooling area is defined as A
c = ∑A
i, where A
i is the unit of area (1 × 1 km) in which
>
, where
is the SST difference derived from the prestorm one-week prestorm composite image compared with the one-week poststorm image. Upwelling intensity is defined as I
c = T
k − T
c, where T
k is the average SST in the cold dome region (24.5–25.0°N, 122.0–122.5°E;
Figure 1), which represents the temperature in the Kuroshio region off northeastern Taiwan. T
c is the average SST in a box region (25.25–25.75°N, 122.0–122.5°E), which represents the temperature in the cold dome region off northeastern Taiwan. Higher contrast between the SST of the cold dome and its surrounding Kuroshio region is related to stronger upwelling in the former. To estimate the potential influence of upwelling associated with total heat loss, we defined S
c = ∑ ∆
i × A
i.
The factors associated with upwelling intensity are wind speed, wind stress curl (inducing Ekman pumping), the TS current, and Kuroshio velocity. The existence of various types of typhoon tracks means that the direction of major wind forcing in the study region varied among cases. To synthesize wind forcing, wind stress was decomposed into U+ (eastward direction), U− (westward direction), V+ (northward direction), and V− (southward direction) components. We used hourly wind data from Taiwan’s Central Weather Bureau to investigate variations in wind speed during typhoon periods in the Pengjiayu Islands (25°37’31”N 122°04’32”E) and over the upwelling region. A typical time scale for a storm moving across Taiwan or its vicinity is approximately three days. Morimoto et al. [
13] also observed an approximate three-day lag between wind and maximum cooling. We thus chose a three-day average wind speed during the typhoon forcing period, with average wind forcing defined by an hourly wind speed larger than 10 m/s. The wind field was obtained from blended sea wind data produced by NOAA (
http://www.ncdc.noaa.gov/oa/rsad/air-sea/seawinds.html#data). To measure the Ekman pumping velocity, the wind stress vector T was calculated using the bulk transfer formula
is the drag coefficient. For moderate and strong wind, the following observations showed that the coefficient increased with the increase of the wind speed and the linear relation was established between the drag coefficient and the mean wind speed [
19,
20,
21,
22] (e.g., Large and Pond, 1981; Guan and Xie, 2004; Smith, 1980; Wu, 1980). In the present study, we use the Cd determined by Large and Pond [
19] such that
The local inertial period was approximately 26 hours. We thus used one-day mean wind speed to calculate maximum daily local Ekman pumping:
. To evaluate the change in water transport in the TS and the Kuroshio region off eastern Taiwan, we used data from a daily 1/12°-resolution global ocean reanalysis produced by the Hybrid Coordinate Ocean Model (HYCOM;
https://www.hycom.org/hycom). Transport in the upper 10 m and along a 25°N transect in the TS was chosen to represent TS outflow. For the Kuroshio intrusion, westward transport along the transect 122.0–122.25°E, 25°N (0–10 m in depth) was calculated. Northward Kuroshio transport along the transect 122.0–122.25°E, 24.5°N (0–10 m in depth) was chosen to represent the Kuroshio velocity off eastern Taiwan. For each current transport, the three-day average before and after the encounter with each typhoon was calculated.
3. Results
Monthly climatological SSTs are shown in
Figure 3. The SST gradient in the study area is weaker in summer than in winter. SSTs ranged from 24 °C (May) to 26.5 °C (August). The cold dome appeared in monthly SST images from May to September. The circular cold region is less distinct in October. This is due to a larger portion of the Kuroshio flowing onto the continental shelf, weakening the SST front [
2].
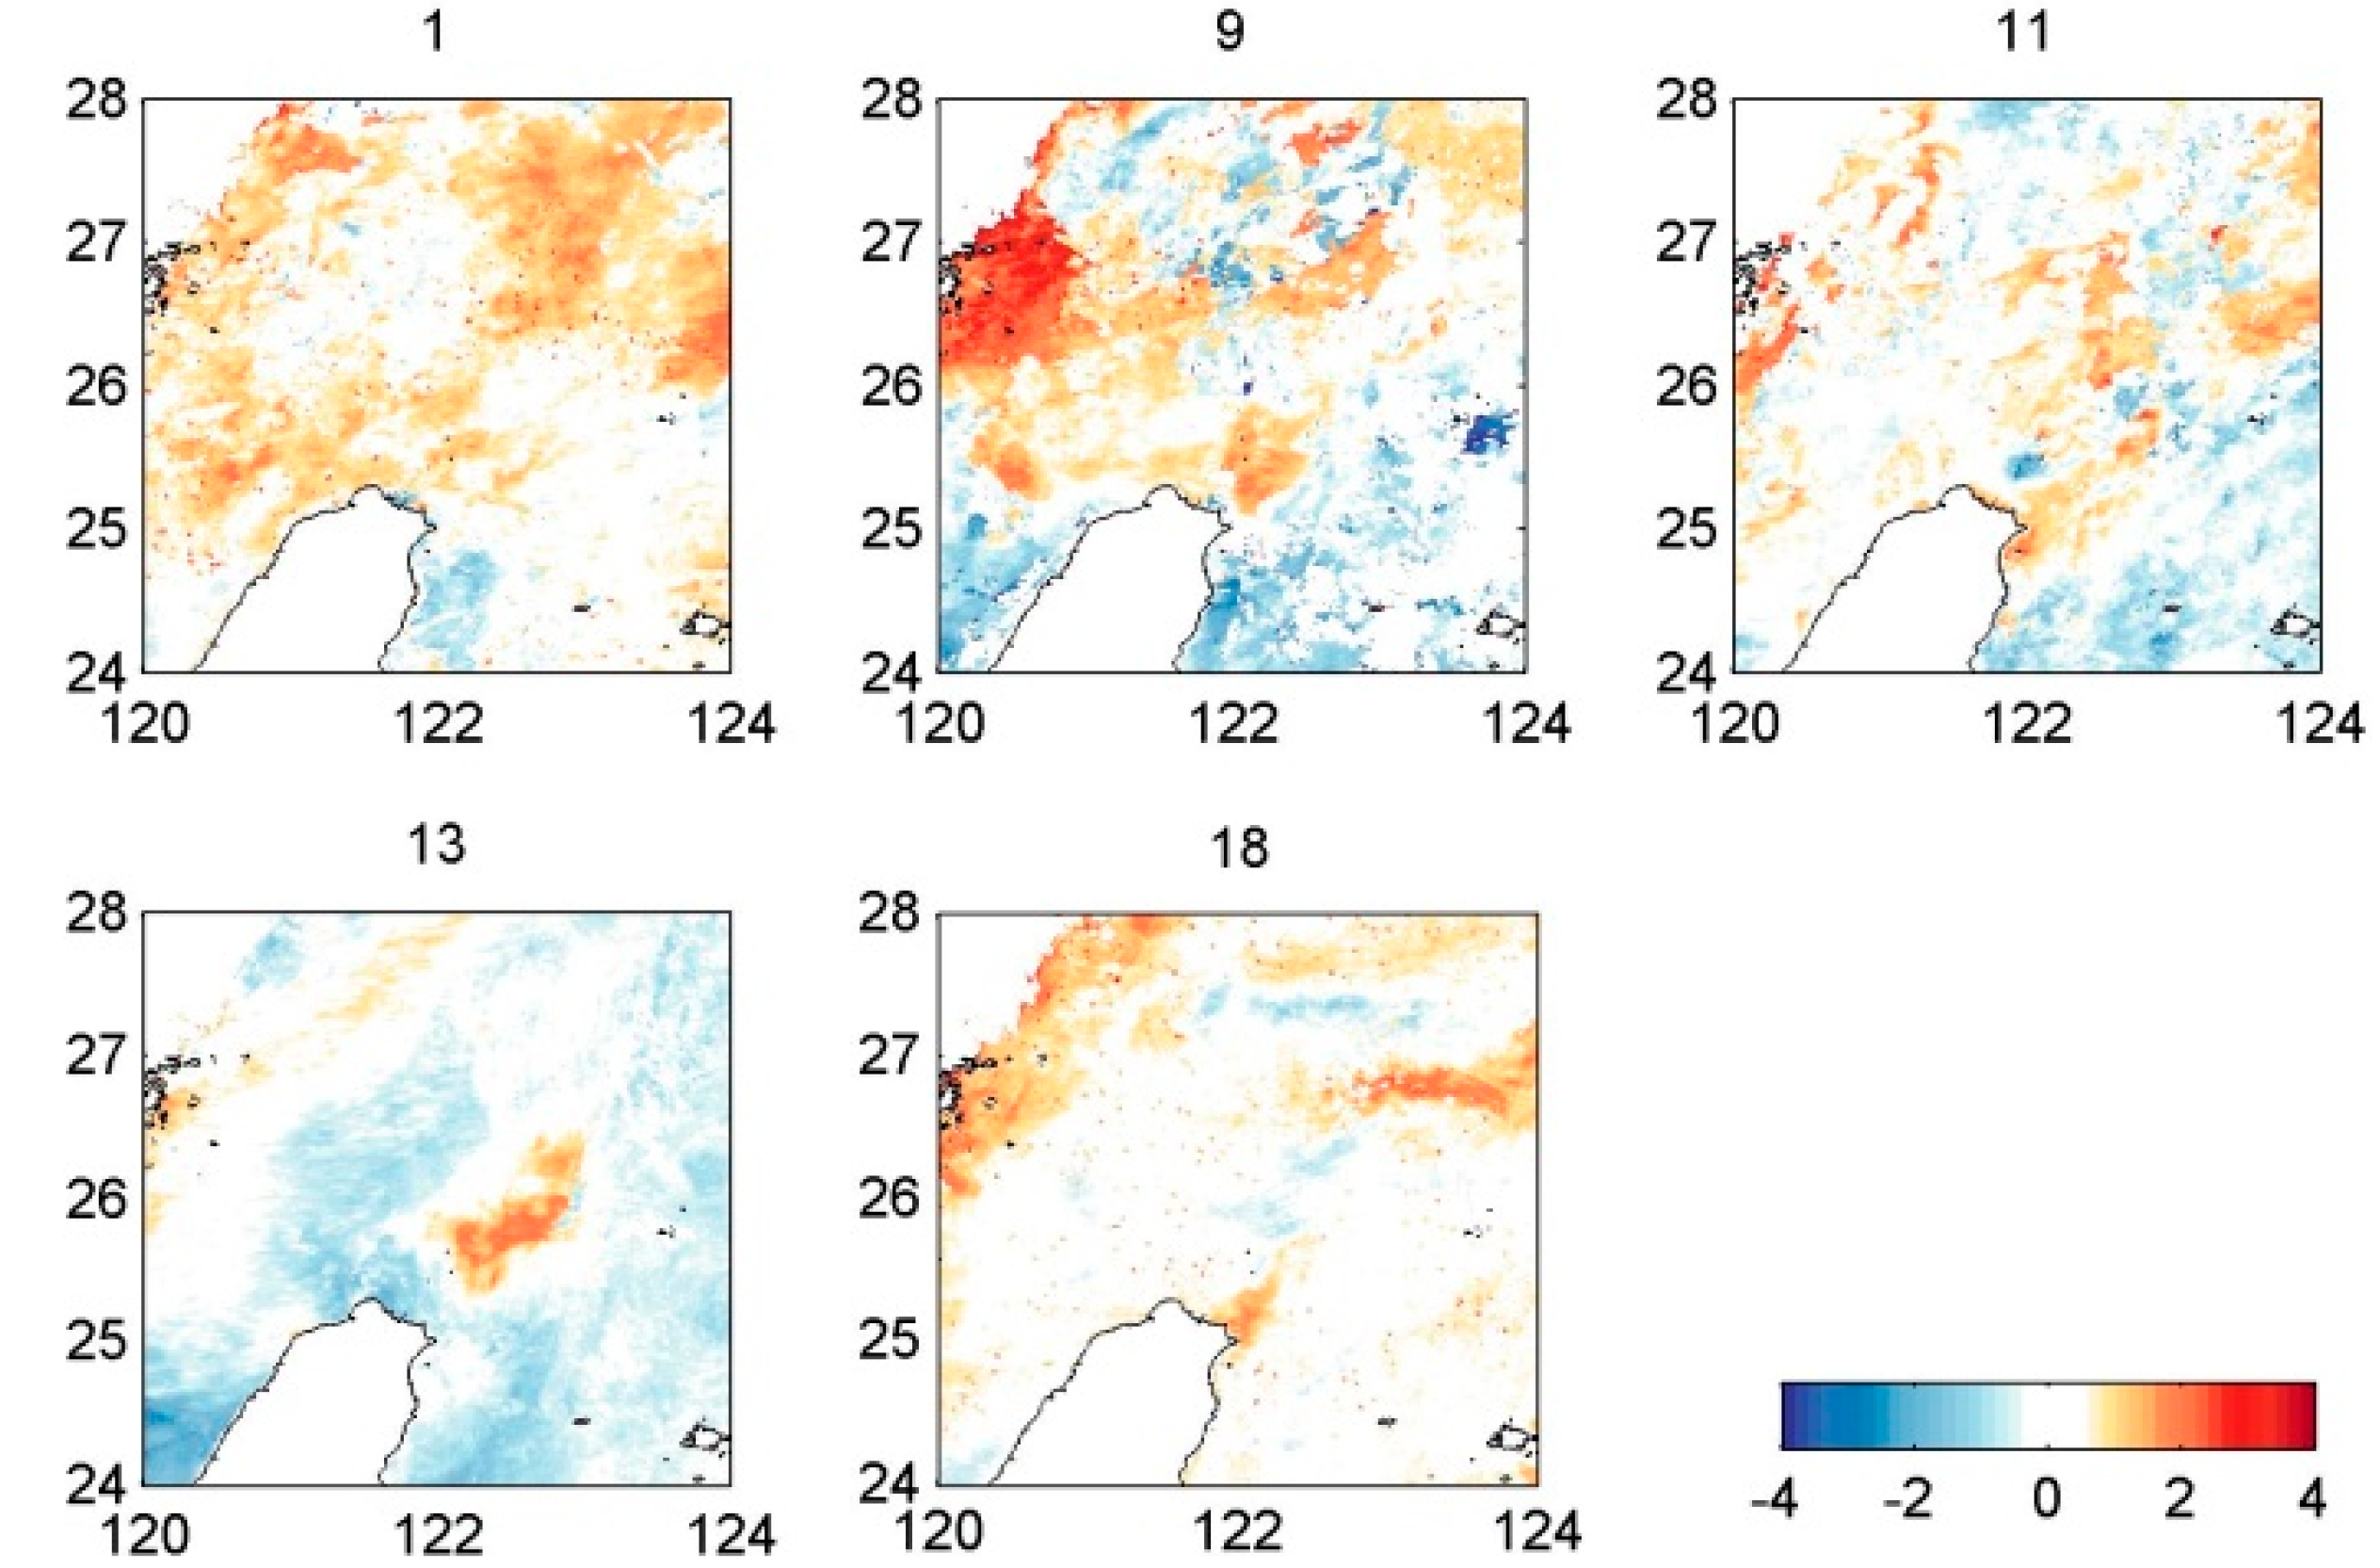
Figure 4 depicts the difference between prestorm and poststorm SSTs (one-week composite images) for the 18 typhoons. Most typhoons induced significant cooling off northeastern Taiwan at a magnitude of approximately 2–4 °C. However, five cases of warming also occurred (Typhoons 1, 9, 11, 13, and 18). Notably, significant warming of up to 3 °C appeared in the study region for Typhoon 13. This raises the question of whether SST changes after typhoons are part of normal seasonal variations in the region. To clarify these warming anomalies, the SST differences from 10-year climatological means are depicted (
Figure 5). These indicate that warming still occurred in these five cases. The SST standard deviation from the climatological mean exceeded 1.5 °C in Typhoons 9 and 13. We concluded that the warming phenomena off northeastern Taiwan are associated with typhoon events.
Figure 6 displays climatological mean (2009–2013) of monthly Chl-a concentration and the prestorm Chl-a concentration for the 18 typhoons. The variation of the Chl-a spatial pattern during May–September is not obvious. The Chl-a generally decreased off shore. The prestorm Chl-a concentration in the cold dome area is higher than the climatological mean in Typhoon 2, 5, 6, 7, and 17 cases. This is due to the shorter duration between the previous and present typhoons. The differences between prestorm and poststorm Chl-a concentration are shown in
Figure 7. The weekly maps of Chl-a concentration revealed that Chl-a generally increased between 0.5 and 2 mg/m
3. The strongest increase occurred in Typhoon 3. The high Chl-a patches match with the sea surface cooling in terms of location (
Figure 4 and
Figure 7). The colder and nutrient-rich water in the coastal region of Taiwan is probably originated from the Kuroshio subsurface water. The increased Chl-a anomaly is most likely a phytoplankton bloom due to the new nutrients supplied by the uplifted deep water, this phenomenon is supported by field observations [
23]. In some cases, the difference of Chl-a concentration is negative, i.e., Typhoon 5, 6, 7, 14 and 17. Most of their prestorm states have higher Chl-a concentration than the climatological mean, except in Typhoon 14. The typhoon-induced turbulent mixing decreased the local concentration of Chl-a. Note that for some sea surface warming cases (Typhoons 1 and 18), the Chl-a concentration still increased. This indicates that besides upwelling, the source of the higher Chl-a concentration could come from the China coastal region under the typhoon wind.
Weekly merged altimetry data obtained from the AVISO database (
http://aviso.altimetry.fr) show the corresponding changes in sea surface height (SSH;
Figure 8). Ocean surface cooling (warming) was related to a decreased (increased) SSH caused by hydrostatic equilibrium. This indicates that a fall in SST is accompanied by a cooler water column underneath, which results from the upwelling phenomenon. The SSH anomaly (SSHA) also indicates a longer time scale for the cooling state, and the shapes of the SSHAs are different from those of SSTs. The geostrophic current derived from SSH (retrieved from
https://www.aviso.altimetry.fr/en/data.html) is also shown in
Figure 8. The spreading of cooler (warmer) surface water had not reached a geostrophic balance, and therefore, surface flow varied with time. In addition, the resolution of SSH and SST images also differs.
Table 1 presents the correlations between upwelling intensity (I
c), the cooling area (A
c), and the wind and current factors. These show that east–west wind speed and Kuroshio intrusion velocity during the forced period significantly correlate with the upwelling intensity of the cold dome. TS transport, wind speed, and wind duration significantly correlate with the cooling area. The relationship between the intensity of cooling and the change in current field is discussed in
Section 3.
3.1. Change in Current Field
The Kuroshio intrusion anomaly was positively correlated with upwelling intensity, which is represented by the difference between SSTs in the cold dome region and the Kuroshio region to the east of Taiwan (
Table 1). When the intrusion was stronger, the upwelling intensity increased. This result is consistent with previous research [
12] that concluded that the Kuroshio intrusion is the primary cause of enhanced cooling in the cold dome area. This situation was reversed in warming cases (Typhoons 1, 9, 11, 13, and 18), where the eastward flow anomaly in the region off northeastern Taiwan was associated with the warming event. The variation in TS transport correlated highly with the cooling area (A
c). Larger typhoon-induced southward TS transport was related to a broader cooling region off northeastern Taiwan. Furthermore, the upwelling intensity was negatively correlated with flow transport in the TS, hence, decreased (increased) TS flow during the forced period corresponded to a positive (negative) intensity (nonsignificant) and area (significant). The variations in TS transport were negatively correlated with the Kuroshio intrusion (correlation coefficient of 0.59). This result indicates that the often-stronger Kuroshio intruding onto the ECS continental shelf was accompanied by a smaller TS northward flow. Chern and Wang (1992) proposed that the TS outflow controls the intensity of the Kuroshio intrusion, with a stronger TS flow during the summer. The relationship between the intrusion of the Kuroshio and the retreat of the TS current is consistent with the hydrographic observations and current measurements of Tang et al. [
1].
Figure 8 does not display the opposite direction of the geostrophic velocity anomaly between the Kuroshio east of Taiwan and the TS current. Modification of the circulation pattern occurred during the typhoon forced period, with the Kuroshio intruding onto the ECS continental shelf off northeastern Taiwan. During the poststorm period, the Kuroshio began to return to its normal status.
Morimoto et al. [
15] suggested that the Kuroshio intrusion is aided by a stronger typhoon-induced Kuroshio Current to the east of Taiwan. There is a positive correlation, albeit weak, between upwelling intensity and the northward Kuroshio velocity east of Taiwan (122.0–122.4°E, 24°N).
Figure 9a,b shows the linear relationship between the change in TS transport and S
c (defined in
Section 2) and the Kuroshio intrusion and S
c, respectively. The shape of the cold SST in the cold dome region changed from the typhoon forced period to the poststorm period, and therefore, the S
c calculated from the composite image might only be approximate. Nevertheless, the R
2 in
Figure 9a,b was 0.46 and 0.44, respectively.
3.2. Relationship between Cooling and Typhoon Winds
The U-wind correlated highly with the upwelling intensity (a correlation coefficient of 0.72). This indicates that stronger westward wind stress was related to stronger ocean surface cooling in the cold dome region and was caused by the Kuroshio intrusion. In addition, ocean surface warming accompanied larger eastward wind stress during the storm forced period.
Figure 9c,d shows the linear relationship between east–west wind stress and S
c and the Ekman pumping velocity and S, respectively. The R
2 in
Figure 9c,d reached 0.33 and 0.02, respectively.
The north–south wind stress did not display a significant correlation with the upwelling intensity (a correlation coefficient of −0.4). In general, southerly wind stress might relate to stronger ocean surface cooling in the cold dome region. Southerly winds thus strengthen the pressure gradient in the Kuroshio region off eastern Taiwan by inducing the eastward Ekman drift. Enhanced northward transport of the Kuroshio to the east of Taiwan favors the intrusion process, however, southerly winds might not be a critical factor for cooling in the cold dome region. The relationship between A
c and wind stress was similar to that of I
c and wind stress, although the correlation was less significant. Overall, strong easterly winds played a major role in the intrusion of subsurface Kuroshio water onto the ECS continental shelf. During the typhoon forced period, the wind direction often rotated between the front half and rear half of a typhoon on a westward track, the wind-induced ocean current would then change accordingly. However, the rotating wind stress continued to inject energy into the ocean. This energy flux is most efficient for a wind–current resonant case [
24]. Wind-induced turbulent mixing continued during the strong-wind period. We calculated the strong-wind (daily mean >10 m/s) duration for each typhoon case. The result indicated a nonsignificant correlation with the I
c and A
c. We, therefore, infer that local wind-induced mixing did not exert a dominant effect on the SST response to the typhoon. Wind stress curl, related to Ekman pumping, did not correlate highly with the ocean surface cooling. The numerical model developed by Tsai et al. [
25] showed a negative wind curl associated with downward Ekman pumping velocity occurring off northeastern Taiwan during the entire Morakot forced period, however, cooling in the cold dome region was significant.
4. Discussion
Significant SST variations in the cold dome region were found to be associated with typhoons passing through the vicinity of Taiwan. The location and direction of the storm tracks were, however, very different. The difference in SST between the cold dome area and the Kuroshio region (Ic) was chosen to represent the cooling induced by the upwelling associated with the Kuroshio intrusion. The result suggests that the path of a typhoon might be associated with an enhanced or weakened intrusion of the Kuroshio Current off northeastern Taiwan. We found that the east–west wind stress of the storm was significantly correlated with the difference of Ic from the poststorm to prestorm period. Ocean surface cooling tended to be associated with larger average easterly winds, such as those in Typhoons 3, 5, 10, 12, 15, and 16, which were able to drive the Kuroshio intrusion onto the shelf. In these cases, the path went westward or northwestward through Taiwan. The strong easterly winds over Taiwan were accompanied by northerly (or northeasterly) winds over the TS. The reduced TS outflow created a condition that promoted the Kuroshio intrusion. In the cases of Typhoons 3, 12, and 16, the northerly wind in the front half of the typhoon during the forced period caused a strong southward flow anomaly in the TS. This caused a smaller pressure gradient on the western side of the cold dome area and promoted the expansion of the cold water region. Conversely, Typhoons 1, 4, 9, 13, 17, and 18, which decreased Ic, tended to be associated with larger westerly winds.
The association between increasing SST in the cold dome region and typhoons had not previously been studied because typhoon-induced ocean cooling is more frequent and can affect the ecosystem through biochemical responses associated with upwelling. However, warming is an intriguing phenomenon because it is an abnormal typhoon-induced ocean response. Moreover, increased SSTs that accompany an increased SSHA might cause a different air–sea interaction. The ocean response to Typhoon Haikui exhibited the strongest warming and SSHA change. We thus chose the Haikui case to examine a possible variation in ocean circulation, causing ocean surface warming events. The Morakot case was chosen to represent a typical drop in typhoon-induced SST in the cold dome area.
Figure 10a shows the daily surface temperature and velocity deviating from the day before Typhoon Morakot (06/08/2009). Daily mean model data were provided by the HYCOM GLBa0.08 experiment. The typhoon caused a strong southward current during the front half of the wind field (August 7 to 8). A significant drop in SST occurred in the cold dome area, accompanied by an enhanced Kuroshio intrusion. The flow anomaly turned northward behind the rear half of the typhoon. The cold water created by the Kuroshio intrusion then spread northward. The ocean response and dynamic process of the cold dome variability induced by Morakot have been detailed in several studies (i.e., [
26]).
Figure 10b shows the daily temperature and velocity anomaly field during Typhoon Haikui. During the forced period (August 7 to 8), ocean surface cooling occurred in the cold dome area. Due to the different relative locations of the TS and the typhoon, compared with the Morakot case, the flow in the TS did not turn southward in the forced period daily-mean pattern. The wind-induced strong eastward flow hindered the Kuroshio intrusion on the ECS continental shelf. Following the storm forced period, ocean surface warming occurred in the cold dome area. The SST rose even higher than under the prestorm conditions. Wind stress favored the eastward spreading of the Taiwan Current during Typhoon Haikui. The warming may have been associated with downwelling due to flow convergence driven by the strong wind. This downwelling reduced the baroclinity of the Kuroshio Current off the northeastern coast of Taiwan, spreading the warm surface water in the Kuroshio region toward the ECS continental shelf. As the typhoon moved through the ECS continental shelf, flow divergence occurred in the upper layer along with convergence between ECS and Kuroshio waters off northeastern Taiwan, as evident in the August 7 daily-mean pattern (
Figure 10). When studying typhoon-induced ocean response, the daily-mean pattern might be insufficient for observing essential features with a time scale smaller than one day. Further investigation is needed to detail the dynamic process.


