Abstract
In recent years, the rapid development of unmanned aerial vehicle (UAV) technologies has made data acquisition increasingly convenient, and three-dimensional (3D) reconstruction has emerged as a popular subject of research in this context. These 3D models have many advantages, such as the ability to represent realistic scenes and a large amount of information. However, traditional 3D reconstruction methods are expensive, and require long and complex processing. As a result, they cannot rapidly respond when used in time-sensitive applications, e.g., those for such natural disasters as earthquakes, debris flow, etc. Computer vision-based simultaneous localization and mapping (SLAM) along with hardware development based on embedded systems, can provide a solution to this problem. Based on an analysis of the principle and implementation of the visual SLAM algorithm, this study proposes a fast method to quickly reconstruct a dense 3D point cloud model on a UAV platform combined with an embedded graphics processing unit (GPU). The main contributions are as follows: (1) to resolve the contradiction between the resource limitations and the computational complexity of visual SLAM on UAV platforms, the technologies needed to compute resource allocation, communication between nodes, and data transmission and visualization in an embedded environment were investigated to achieve real-time data acquisition and processing. Visual monitoring to this end is also designed and implemented. (2) To solve the problem of time-consuming algorithmic processing, a corresponding parallel algorithm was designed and implemented based on the parallel programming framework of the compute unified device architecture (CUDA). (3) The visual odometer and methods of 3D “map” reconstruction were designed using under a monocular vision sensor to implement the prototype of the fast 3D reconstruction system. Based on preliminary results of the 3D modeling, the following was noted: (1) the proposed method was feasible. By combining UAV, SLAM, and parallel computing, a simple and efficient 3D reconstruction model of an unknown area was obtained for specific applications. (2) The parallel SLAM algorithm used in this method improved the efficiency of the SLAM algorithm. On the one hand, the SLAM algorithm required 1/6 of the time taken by the structure-from-motion algorithm. On the other hand, the speedup obtained using the parallel SLAM algorithm based on the embedded GPU on our test platform was 7.55 × that of the serial algorithm. (3) The depth map results show that the effective pixel with an error less than 15cm is close to 60%.
1. Introduction
Earthquakes, landslides, debris flows, and other natural disasters have occurred more frequently in recent years and have caused greater damage than before. When natural disasters occur, rapid emergency response and rescue are critical. However, it is often difficult for rescuers to access disaster areas because routes leading to them may be damaged or hindered. Unmanned aerial vehicles (UAVs) have been widely used in earthquake relief and other rescue efforts because of their flexibility, low cost, and small constraints related to the terrain. With their rapid response capability, UAVs have played a significant role in emergency rescue work [1,2,3]. Moreover, to obtain three-dimensional (3D) topographic information of disaster areas, UAVs can be used in dangerous areas in place of surveyors and mapping personnel. They can cruise below clouds and obtain high-resolution images that can be used for 3D model reconstruction through some processing, e.g., the computation of stereo vision [4]. Based on the acquired 3D model, the degree of damage caused in the disaster areas can be estimated, and decision-makers can use the spatial information to quickly formulate rescue plans and routes.
With the development of computing technologies, 3D model reconstruction has emerged as a popular subject of research. Microsoft has developed Kinect Fusion based on Kinect, which scans the environment by letting users move with the device in hand and reconstructs a 3D model of the scanned environment based on the scanned data (https://www.microsoft.com/en-us/research/projects/surfacecon). However, Kinect is sensitive to distance and its effective range is limited. As a result, it can reconstruct the environment only over a small range of 3D “maps” (in this paper, a “map” means the visual scene of the 3D point cloud obtained by 3D dense reconstruction, and is equivalent to a 3D model). Structure from motion (SfM) is a method of 3D reconstruction in computer vision that is not constrained by many assumptions in photogrammetry theory and has good versatility. Notable achievements have been made using this method, such as the bundler-based incremental 3D reconstruction of SfM methods by Agarwal et al. [5]. Schonberger et al. proposed an improved SfM algorithm that can overcome challenges associated with the robustness, accuracy, completeness, and scalability of incremental reconstruction systems. This was a big step up toward a general purpose SfM system, COLMAP (https://colmap.github.io/index.html) [6,7]. Moreover, some researchers have reconstructed a few ancient buildings based on UAV images and analyzed the damage to them over time [8,9]. Others have studied 3D reconstruction based on the SfM algorithm [10,11,12,13].
Traditional methods of 3D model construction are based on image data at different viewing angles for 3D geometric reconstruction. However, the cycle of production is long, the cost is high, and the process is cumbersome. In specific application scenarios, such as natural disasters, people are in urgent need of help, the environment is unknown, and rescue operations need to be as fast as possible. Thus, 3D maps need to be generated quickly or even in real time. Traditional methods cannot solve this problem due to three shortcomings.
(1) Many preparatory steps are needed before data acquisition that require highly accurate data.
(2) In most of the process of 3D reconstruction, the UAV is used only as a tool for data acquisition. The data can be processed only once they have been acquired, and the 3D information cannot be fed back in real time. Thus, the convenience of the UAV platform cannot be fully exploited for 3D model reconstruction in a timely manner.
(3) In processing UAV images, traditional methods take a long time for calculations due to the complexity of the algorithm. It is thus difficult to quickly complete the process from image sequencing to 3D model generation.
Vision-based SLAM (simultaneous localization and mapping) is a 3D “map-building” technology that estimates the trajectory of motion and then constructs the 3D information of the environment during the motion of the sensor [14,15,16,17]. Early implementation of SLAM for monocular vision was achieved using filters [18,19]. Chekhlov et al. [20] and Martinez-Cantin et al. [21] introduced the unscented Kalman filter (UKF) to improve the robustness of the Kalman filter algorithm but increased its computational complexity. In recent years, SLAM has been adapted rapidly to underwater robots, land robots, and UAVs [22,23,24,25,26], and significant advances have been made in algorithm structure and data association problems [27,28,29,30]. Visual SLAM uses cameras as data acquisition sensors. It significantly enhances the capability of embedded systems to process a large amount of information due to its flexibility, low cost, efficiency, and ease of use. Classical SLAM algorithms include the extended Kalman filter (EKF) [31], extended information filter (EIF) [32], and particle filter (PF) [33]. However, these methods cannot solve the problem in the reconstruction of large-scale 3D “maps” [34,35,36].
With significant improvements in hardware performance, the development of parallel computing technology, and the emergence of efficient solutions, keyframe-based monocular vision SLAM [37,38,39,40] has advanced, and graph-based optimization has become popular in SLAM research [41,42,43,44,45,46,47,48,49,50]. In dense SLAM reconstruction, Engel et al. constructed a semi-dense “map” in which the camera pose was calculated by dense image matching, and the depth of pixels with prominent gradient changes in the image is estimated [51]. Stühmer et al. estimated the camera pose using every pixel of a given image and constructed a dense 3D model based on it [52]. Progress has also been made [53,54] in improving the robustness of SLAM by predicting the depths of pixels and extracting image blocks. The large-scale direct monocular SLAM (LSD-SLAM) algorithm proposed by Engel et al. [55] improved the accuracy of camera pose estimation and creates semi-dense, large-scale environmental “maps”. Based on visual SLAM, Liu et al. proposed a 3D modeling technology using UAV monocular video that relies only on the visual mode and does not need additional hardware equipment to assist in the construction of the 3D “map” of the shooting area in the video [56]. The experimental evaluation of the algorithm’s construction results verified its feasibility. Elena et al. proposed a 3D reconstruction method based on LSD-SLAM [57]. By analyzing video data and extracting keyframes, they generated 3D point cloud data and panoramic images. Finally, the 3D “map” was reconstructed by the fusion of the 3D point cloud and the panoramic image.
Despite the technical advancements mentioned above, SLAM is computationally intensive and takes too long for it to be used in applications. With progress in parallel computing technology and improvement in hardware performance, SLAM can now be quickly executed. For example, based on the FastSLAM algorithm, Zhang examined the resampling process and landmark estimation process [58]. Based on the parallel computing framework of the compute unified device architecture (CUDA), he made full use of resources of the CPU and graphics processing unit (GPU) to accelerate SLAM. Zhu et al. proposed a parallel optimization method for the GPU based on a particle filter and the SLAM algorithm [59]. The GPU has many processing cores and powerful floating-point computing capability. It is mainly used in data-intensive computing and is particularly suitable for the processing of 3D mapping algorithms based on visual SLAM, which requires a large amount of computation, independent calculation, and fast real-time performance. Therefore, combining the GPU with SLAM on a UAV platform for certain application scenarios has important research value. Such applications include emergency management in case of natural disasters, e.g., earthquakes, debris flows, or complex battlefield environments, in which the state of the environment is unknown and terrain-related information needs to be obtained quickly. To the best of our knowledge, ours is the first team to investigate this application.
The main contributions of this paper are as follows.
(1) The characteristics of the distributed robot operating system (ROS) computing architecture and multi-node distributed computing were used. The strategies of communication were designed in combination with the visual SLAM algorithm.
(2) An ROS network was built for the real-time monitoring of the operational status of the ROS nodes, images, and 3D information based on visualization tools.
(3) The CUDA parallel programming model was used to analyze the proposed algorithms for 3D model reconstruction. A parallel algorithm was designed and implemented on an embedded GPU platform to improve performance.
(4) Based on the distributed ROS computing framework, we designed and implemented a prototype for a multi-process reconstruction system for processing 3D point clouds of visual SLAM.
The remainder of this paper is organized as follows: Section 2 briefly introduces the proposed methodology and key technologies used in this study. Section 3 describes the design and implementation of the software and hardware systems for the fast reconstruction of the 3D model based on UAV images with visual SLAM from the aspects of system structure, algorithm flow, and parallel computing. Section 4 describes the experimental aims, design, and data. Section 5 introduces the results mainly from the perspectives of the visual effect of the reconstruction of the 3D point cloud and a preliminary quantitative analysis of the dense point cloud obtained using this method. Section 6 offers the conclusions of this study and suggests future directions of research.
2. Proposed Method and Key Technologies
2.1. Proposed Methodology and Framework
To simplify the cumbersome process of the traditional method of reconstruction of 3D models, this study proposes a process for the reconstructions based on the dense visual SLAM method that simultaneously estimates pose. The proposed process constructs the model by using sensor motion under the condition that the visual sensor used has been calibrated. Early SLAM was dominated by laser scanners, and 3D environmental “maps” were used for path planning. After visual-based SLAM became mainstream, “maps” created from 3D point clouds were used to provide richer 3D spatial information. The process is shown in Figure 1.

Figure 1.
Three-dimensional (3D) reconstruction process of visual simultaneous localization and mapping (SLAM).
Compared with SfM, visual SLAM does not process a point cloud once it is ready but directly takes the point cloud model as result. As generating a model that can represent 3D information is not sufficient, the depth of as many non-feature point pixels as possible needs to be estimated in the image to build a dense 3D point cloud “map”.
In response to the lagging in data processing in the reconstruction of the 3D model on UAV platforms, this study used the distributed and embedded computing framework based on the robot operating system (ROS). With its peer-to-peer (P2P) design and technologies based on service and node management, ROS balanced the computing load in real-time while performing communication and messaging passing. On the contrary, to speed-up the time-consuming reconstruction of the 3D dense model, this study introduced parallel GPU computing technology for rapid image processing for the real-time acquisition of UAV image data. The overview framework of the design of the GPU-enabled UAV platform is shown in Figure 2.
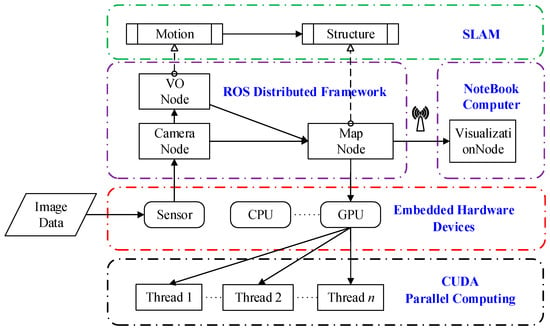
Figure 2.
The framework of the graphics processing unit (GPU)-enabled unmanned aerial vehicle (UAV) platform.
As shown in Figure 2, the distributed computing framework of ROS and GPU parallel computing technology used in this study addressed the following four key issues:
(1) The ROS implementation of the underlying management and abstract description of the hardware provided the operating environment for the algorithm without directly communicating with the hardware. That is, the process to obtain data from the visual sensor in real-time and deliver it for image processing was handled by ROS.
(2) The P2P design and services as well as the node management mechanisms made it possible for the algorithm to be distributed into the computing nodes that was deployed to different devices. For instance, the processes that needed to call the sensor and GPU was deployed in separate nodes to balance the load.
(3) Based on GPU-based parallel computing technology, the parallel algorithm for the compute-intensive nodes was designed and implemented by utilizing data parallelism because the estimation of the depth of each pixel in dense reconstruction was independent. The parallel algorithm significantly improved image processing performance in real-time.
(4) Based on the communication and messaging mechanisms in ROS, several algorithmic nodes were coupled to achieve 3D model reconstruction. Using the visualization tools of the ROS to obtain the intermediate output processed by the algorithm, our implementation achieved real-time monitoring of incremental 3D reconstruction.
2.2. Components and Advantages of the Methodology
The hardware of the research system for this study is shown in Figure 3, and consisted of UAV, vision sensors, an NVIDIA Jetson TX2 (TX2 for short) development kit, antennas, and related accessories.
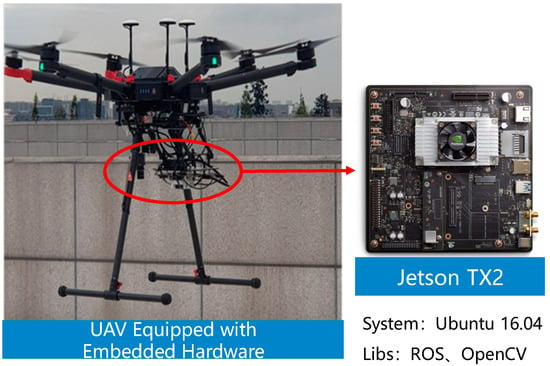
Figure 3.
The hardware composition of the research system.
The UAV shown in Figure 3 was DJI M600 pro, the embedded device was the TX2, and the operating system was Ubuntu 16.04 with some dependency libraries such as ROS and OpenCV. The UAV was used as a carrier for embedded computing devices to provide a viewing angle for 3D “map” reconstruction while powering the devices. The antennas were used to establish a wireless local area network with the ground end, and to ensure the efficiency and quality of the communication system. The visual sensors were the main data acquisition devices and were connected directly to the TX2 via a CSI (CMOS Sensor Interface) or a USB (Universal Serial Bus) connection. Before the experiment began, the visual sensors were calibrated. The camera calibration technology proposed by Zhang [60] was used for this. The processing node invoked the visual sensors and image processing through drivers provided by ROS. TX2 was the core computing device in the system, and all processes other than the visualization process ran on it. While TX2 obtained the data and processed it, the results of the incremental reconstruction of the 3D model were observed in real-time on remote computers.
Compared with the method for 3D model reconstruction using UAVs, this method had three advantages:
2.2.1. Fast Processing
The proposed method accelerated the reconstruction at the algorithmic and technical levels. In case of the former, using dense 3D point clouds instead of the presentation of models saved a considerable amount of time in triangulation and texture mapping, model rendering, and other processes. The dense 3D point cloud also provided a good representation of 3D spatial information. At the technical level, the entire process from data acquisition to dense 3D point cloud generation was executed in real time, and was accelerated through parallel computing and other means. The process of incremental generation of the 3D model was visualized through message passing based on the distributed ROS computing framework.
2.2.2. Loose Coupling of the Algorithm
Based on the ROS framework, the algorithm was encapsulated into several modules, and communication between modules was achieved through message passing. When optimizing the algorithm, there was no need for major changes to the code, and only the corresponding modules needed to be modified. Such a modular design made subsequent development, debugging, and optimization easier.
2.2.3. Extensible System
ROS provided good support for various types of sensors required by the UAV platform. Based on ROS, our platform implemented vision-based 3D reconstruction algorithms and provided the mechanism to enable multi-sensor fusion. By releasing a variety of sensor-related information in the built ROS network, such as inertial measurement units (IMU) and global positioning systems (GPS), the system easily extended to handle more complex environments.
2.3. Related Key Technologies
2.3.1. Hardware Layer Abstraction
ROS was originally designed to construct large sensor networks for large real-time robot systems to provide the information needed for such devices as the IMU, lasers, cameras, sonar, infrared cameras, and collision sensors.
Any type of data in ROS needed to be encapsulated as a message before it can be transmitted over the ROS network. Because ROS was designed on the P2P architecture, a correlation between the sender and the receiver needed to be established for messaging. This was usually established with subscriptions and publications to topics. By publishing a message to a topic, one can deliver a message, and subscribing to the topic on which the message depends is needed to accept it. In this process, the publisher did not have to attend to whether there was a recipient, and the recipient received data only if the topic of subscription had a message.
After successfully acquiring sensor data, ROS provided camera calibration, distortion correction, color decoding, and other underlying operations in the image pipeline. The data structures of RAW messages and compressed messages were inconsistent with that defined in OpenCV. Thus, for complex image processing tasks, the OpenCV, cv-bridge, and image-transport libraries were used to convert messages and process images topics that were published or subscribed to. On the contrary, when OpenCV processed images, its cv::Mat image could not be published directly on ROS, and it was necessary to convert it to an ROS Image message to publish it. The process of calling OpenCV in ROS is shown in Figure 4.
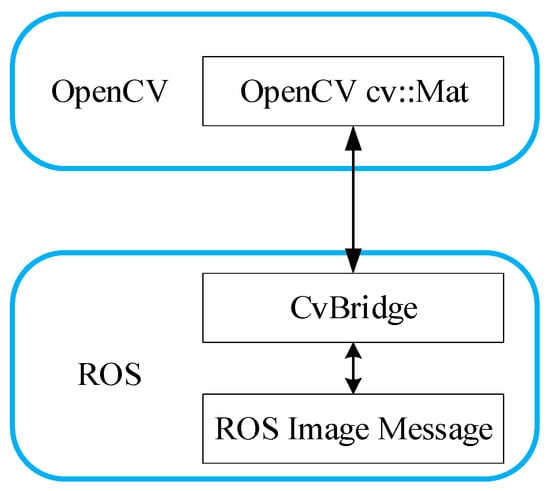
Figure 4.
Calling OpenCV in robot operating system (ROS).
2.3.2. Algorithm Decoupling and Distributed Computing
In the framework of distributed ROS computing, a program was divided into nodes of several function modules that communicated according to the requirements. For the construction of large real-time systems, each node was usually responsible for only one or a few functions and the system was composed of as many nodes as possible to ensure robustness. This ensured that the entire system did not crash because of a failed node, such as an abnormal condition of a sensor.
Having one device per node resulted in a waste of resources of the computing device. Thus, in practice, as shown in Figure 5, three nodes ran data acquisition, position estimation, and 3D point cloud reconstruction at an embedded GPU platform. A visualization node was run at the observation end.
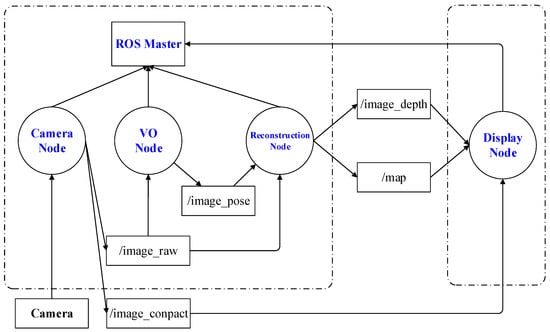
Figure 5.
Functions and process nodes in this study.
The system built on top of ROS was modular, that is, the code of each node was compiled separately. The CMake tool was used for compilation and made node deployment convenient.
2.3.3. Parallel Computing Based on Graphics Processing Unit (GPU)
To fully explore the computing capability of the embedded equipment on the UAV platform and achieve real-time data processing in the course of UAV flight, by comparing several products available in the market, we selected the TX2 embedded development module as a processing platform for the experiment. Its core module size was only 50 mm × 87 mm. Because depth estimation tasks on pixels were independent of one another, the computation tasks for each pixel were simply assigned to a single thread (see Figure 6). In the CUDA architecture, a warp consisting of 32 threads was the smallest unit executed by a CUDA program. The number of threads in each block should be set to a multiple of 32 to achieve the best performance.
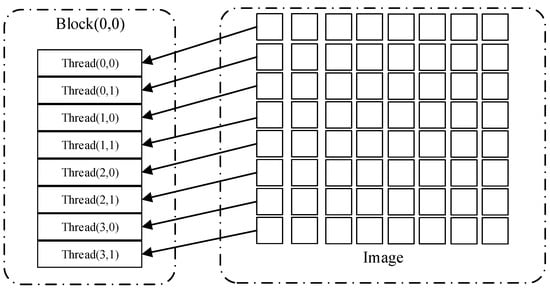
Figure 6.
The relationship between image pixels and threads.
The keyframe and referenced frame data were copied from the CPU memory to the GPU memory using the cudaMemcpy function, to copy data from the host memory to the global memory on the GPU and initialize the depth image matrix. The kernel function was then called to operate on each pixel of the keyframe stored in GPU memory. When the data were transferred to the global memory of the GPU, the host launched the kernel function on it. The distribution of the pixels was based on the segmentation of the image described in the previous section, and the pseudocode for the process is shown in Appendix A.
Each kernel thread calculated its own depth estimate through the block index and the thread index, and once the kernel was called, control was immediately passed back to the host so that it executed other functions when the kernel function is running on the GPU. Finally, the calculated pixel depth data are written to the depth plot matrix and transferred back to CPU memory from GPU memory. When the kernel completed all processing on the GPU, the results were stored in the global memory on it and copied back to the host using the cudaMemcpy function. Finally, cudaFree was called to free the global memory on the GPU.
2.3.4. Communication and Messaging
Communication between algorithmic process nodes in this study was implemented based on the topic communication mechanism of ROS. The design of subscription and publication for the topic is shown in Figure 7 (the blue marking part).
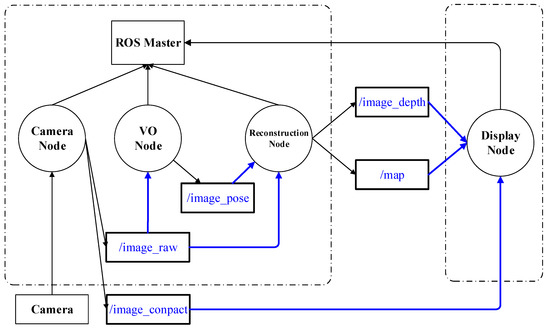
Figure 7.
Topic communication design implemented in this study.
As shown in Figure 7, the camera node published the acquired sensor data to the topics /image_raw and /image_compact, where /image_raw consisted of original image data subscribed to by visual odometry (VO) node and the reconstruction node. The visual node, which did not require the original image, subscribed to the topic /image_compact to save communication overhead.
The VO node carried out pose estimation with the /image_raw data and published the results to the topic /image_pose, which was subscribed to by the reconstruction node. With /image_raw and /image_pose as input data, the reconstruction node calculated the pixel depth of the image and maps it to the 3D model. The results were published to the /image_depth and /map topics. The visual node was subscribed based on the relevant needs to incrementally reconstruct the model in real time.
3. Design and Implementation of Proposed Methodology
According to the above research methodology and key technologies of the solution, this section discusses the design and implementation of the GUP-enabled UAV system.
3.1. Overall Design
3.1.1. Overall System Architecture
The primary objective of this research was to speed up the reconstruction of the 3D model and validate the proposed methodology. To this end, image data were first acquired and then processed based on the visual SLAM algorithm. The processed results were presented in visual form. An overview of system the architecture is shown in Figure 8.
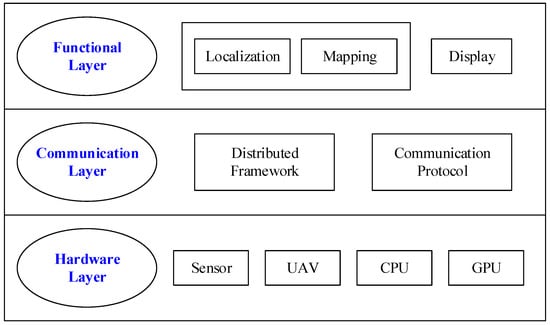
Figure 8.
Overview of system architecture.
Based on the functionalities of its different parts, this system contained hardware and software components. The former included vision sensors, the UAV, embedded processors, and a GPU, and the latter consisted of programs to execute the core algorithm of visual SLAM. All components were connected by a distributed framework and a communication protocol to form a complete hardware and software system. The entire layout consisted of three layers, i.e., hardware layer, communication layer, and functional layer (illustrated in Figure 8).
3.1.2. System Workflow
Based on the overall design described above the process of operation of the integrated hardware and software system in this study is shown in Figure 9. The entire process was as follows.
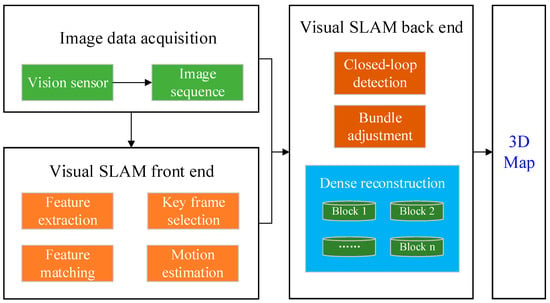
Figure 9.
The flowchart of system processes.
(1) The embedded visual sensors of the UAV obtained a real-time image sequence.
(2) The image sequence was transmitted to the front and back ends, respectively.
(3) With feature extraction and matching, keyframe selection, and localization, the front end provided the initial location value for the back end.
(4) The back end carried out closed-loop detection with the image sequence from step (2) and optimizes the location value received from step (3).
(5) The back end was densely reconstructed based on the image.
(6) Real-time monitoring was carried out using the VO end through the ROS visualization tool.
To reduce the complexity of the system, the tasks and tests of the front and back ends were separated so that the algorithmic components of the system were divided into visual SLAM front end (also called the VO front end), and the visual SLAM back end (also called backend of reconstruction). This allowed the two ends to work relatively independently and reduces the coupling in code for the two, which made it easy to optimize or replace it. The VO front end primarily handled feature extraction and matching, motion estimation, and keyframe selection. The back end handled closed-loop detection, pose optimization, and dense reconstruction. The specific functions and design ideas of each section are described as follows:
(1) Feature extraction and matching: the main function of this module was to establish data correlation among adjacent images. Because the system was not assisted by positioning methods other than visual, it was necessary to determine the same observation point in adjacent images. The accuracy of the module directly affected the reliability of pose estimation.
(2) Motion estimation: the main function of this module was to use the results of the feature extraction and matching module. Several feature points of the same name were in their respective pixel positions in different images, and the motion of the camera was calculated by solving a set of epipolar constraint equations.
(3) Keyframe extraction: the main function of this module was to eliminate redundant and invalid images and filter out enough data to achieve dense reconstruction. It significantly reduced the amount of computation required and improved the robustness of the algorithm.
(4) Closed-loop detection: the main function of this module was to detect whether the UAV had returned to a previous position. It provided constraints on pose optimization and was implemented with the open-source library BoW3.
(5) Position optimization: the main function of this module was to optimize the poses of all keyframes by bundle adjustment once the closed ring was detected. This module helped reduce the cumulative error caused by estimating the motion of adjacent frames independently and was implemented with the open-source library g2o.
(6) Dense reconstruction: the main function of this module was based on keyframes and their pose data. By estimating the spatial position of each pixel in the keyframe, the results were directly fed back to the reconstructed 3D model.
3.1.3. Algorithmic Process
As mentioned previously, the visual SLAM algorithm was computationally intensive. The front end of feature-based visual SLAM has long been regarded as the mainstream method of VO. It is stable, sensitive to light, and dynamic objects, and has gradually matured. The front-end algorithm of the VO as designed in this article is shown in Figure 10.
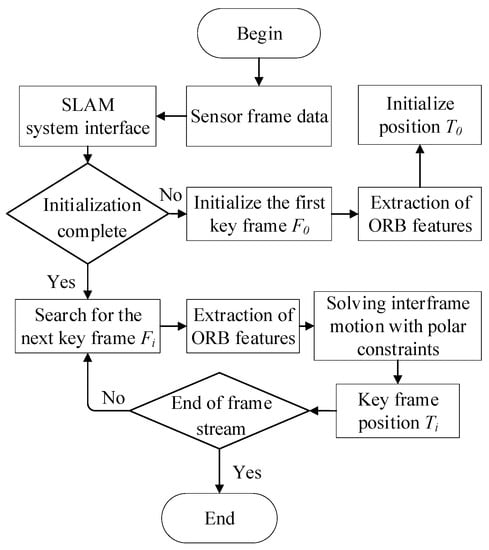
Figure 10.
Flowchart of the front end of visual SLAM.
As shown in Figure 10, the process of the front-end algorithm of visual SLAM was as follows.
(1) The SLAM system provided an interface to receive a continuous sequence of images obtained by the sensors and pass it to the VO side.
(2) Determine whether the SLAM system has been successfully initialized. If not, go to step (3); otherwise, go to step (4).
(3) Initialize the first keyframe, and initialize the pose T0.
(4) Continuously extract the Oriented FAST and rotated BRIEF (ORB) features of the image sequence and select the next keyframe Fi (i>=1).
(5) Match the ORB characteristics of Fi and Fi-1 and select a reliable match.
(6) Based on a reliable feature point pair, the pose Ti of the keyframe is calculated by solving a set of epipolar constraint equations to calculate the motion between frames.
(7) Stop if the frame stream ends; otherwise, return to step (4).
In dense reconstruction, one needs to know the distance between most pixels in the captured image data. In case of a monocular camera, the distance between pixels was estimated by triangulation measurement. The reconstruction algorithm for the dense 3D model designed in this paper updated the depth map of the keyframes until it converged through multiple iterations, and the process of each iteration is shown in Figure 11.
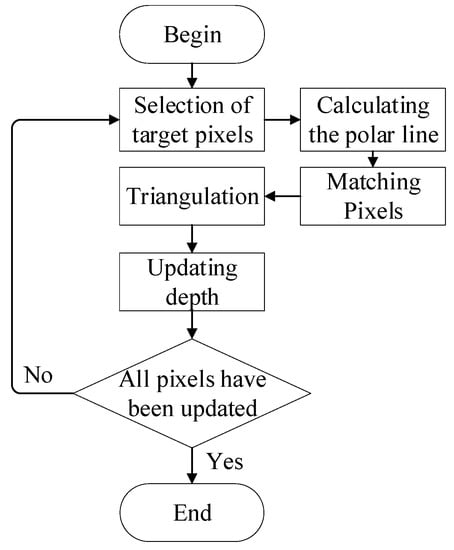
Figure 11.
Flowchart of the reconstruction module of the visual SLAM algorithm.
The procedure of the reconstruction algorithm in Figure 11 was as follows.
(1) Select the target pixel p whose depth needs to be calculated.
(2) Based on the motion of the camera, that is, the panning vector of the camera’s optical center, and the vector connecting the camera’s optical center and p, construct a plane. The plane intersected with the new keyframe at the polar line, which was calculated.
(3) Traversing the polar line, search for points that match with p.
(4) The spatial position of p was calculated by triangulation.
(5) Update the depth information of the pixel.
3.1.4. Simultaneous Localization and Mapping (SLAM) Front End
Design of Feature Extraction and Matching Method
This research was based on extraction and matching the oriented brief (ORB) feature. As mentioned above, this was composed of two parts. The key point was Oriented FAST and the descriptor was BRIEF. The process of extraction of the feature points was as follows.
Pixel p was selected in the image and its brightness was assumed to be Ip. A threshold value T was then set. Taking pixel p as the center, 16 pixels on a circle with a radius of three pixels were selected. If there were N consecutive points on the selected circle with brightness was greater than Ip+T or less than Ip-T, pixel p was considered a feature point. The above steps were iterated to perform the same operation on each pixel until the entire image had been traversed.
Then, an image pyramid was constructed, and the corner points were detected in each layer of it to solve the problem of the weak scale of the fast corner. The rotational property of the feature points was realized using the intensity centroid method. The implementation was as follows: (1) the moment of a small image block B was defined. (2) The centroid C of the image block was found through the image moment. (3) A direction vector OC was obtained by connecting the geometric center O with the centroid C of the image block. Thus, the direction of the feature points was also defined.
Finally, after traversing each pixel of the image to obtain all ORB features, the feature points with the same name were matched. The process of feature extraction and matching is shown in Figure 12.
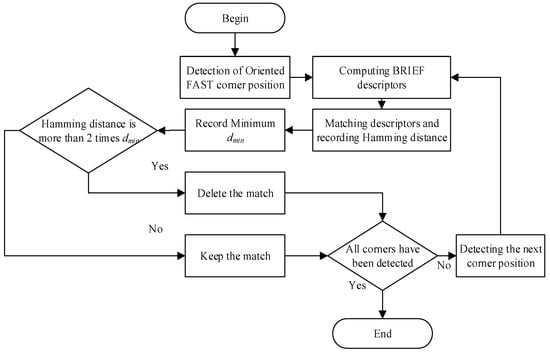
Figure 12.
Feature extraction and matching process.
From above, the Oriented FAST corner was first located, and its BRIEF description was calculated accordingly. BRIEF descriptions in two images were matched to record their Hamming distance, i.e., the number of individuals in different digits of the binary string. The minimum dmin of all matches was recorded; if the Hamming distance between the descriptions was greater than two times the value of dmin, the match was deleted and was otherwise retained.
The method of removing mismatches here was heuristic. Figure 13 is an unrejected mismatched result based on ORB characteristics. Many mismatches were produced in the ORB feature matching process of the two images.
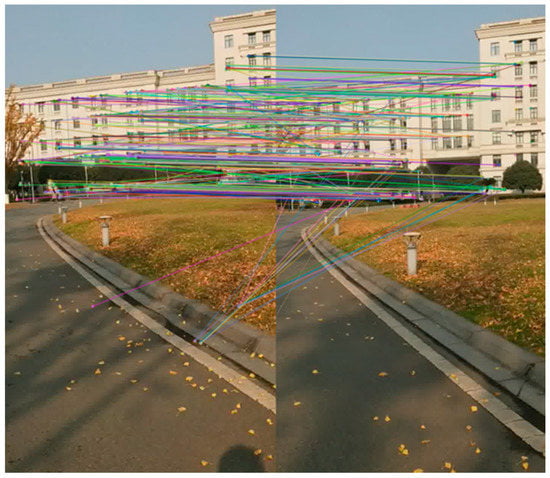
Figure 13.
An example of ORB feature matching (no rejection of mismatch).
By removing pairs of descriptions with Hamming distances greater than two times dmin, the remaining matches are shown in Figure 14, where the match was accurate when there were prominent textural characteristics.
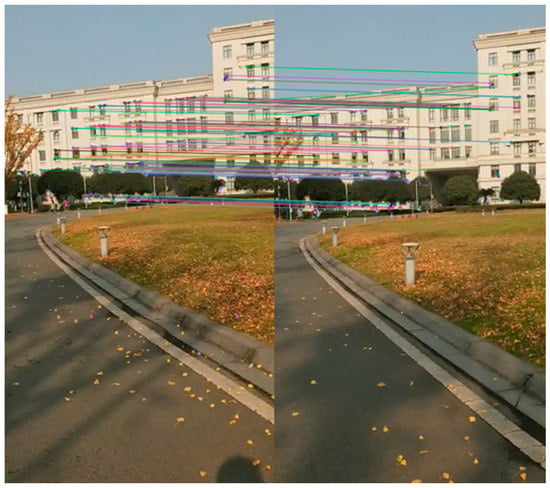
Figure 14.
An example of ORB feature matching (rejected by error).
We have obtained data association between adjacent frames of the image sequence, that is, the different pixel positions of feature points with the same characteristics in the image. The position of the characteristic point was consistent in space, was mapped to several pairs of two planes, and was assigned to the motion estimation module for position and attitude estimation.
Design of Keyframe Extraction
Before position estimation, note that the visual sensor needed to collect data at tens of frames per second for the UAV platform to use visual SLAM for 3D reconstruction. However, owing to limited computing resources, we could not send all frame data obtained by the sensor into the SLAM system for processing. The image data obtained also contained many redundant and invalid frames, and thus, there was no need to use all frame data to calculate position. Therefore, we needed to extract representative keyframes from the image sequence, calculate their positions, and use them as a reference to estimate relatively reliable pixel depths over a local range. The strategy we follow to extract keyframes is shown in Figure 15.
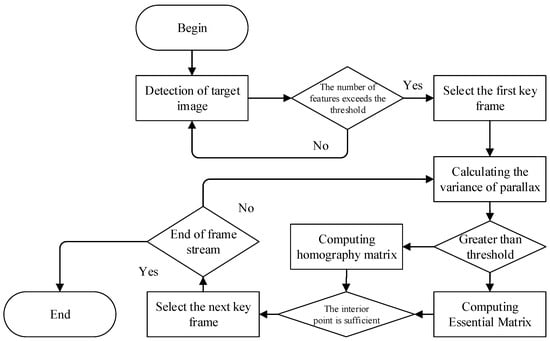
Figure 15.
Keyframe extraction process.
The first image was processed. The FAST feature point and edge features were first detected. If the number of feature points in the middle of the image exceeded a preset threshold, the image was used as the first keyframe and the first continuous image was processed to continuously track the feature point. When the number of matching points was greater than the threshold, if the median of the parallax was greater than the threshold, the essence matrix E was calculated; otherwise, the matrix H was calculated. If there were enough inner points after the calculation of H or E, they were used as a keyframe.
Estimating Camera Motion
The motion of the camera was estimated to calculate the translation vector t and rotation matrix R between adjacent keyframes, and they were be obtained by decomposing the essential matrix E. When the keyframe of the camera rotated only without translation, the epipolar constraints were not established, and the base matrix was a zero matrix. In this case, the homography matrix H needed to be decomposed. The method of decomposition was singular value decomposition (SVD) [61]:
where U and V were third-order orthogonal matrices, and D was a diagonal matrix . Decomposition resulted in the characteristic values of the diagonal matrix. Two of the three were positive with the identical value, whereas the third was zero. During the decomposition process, four sets of solutions were obtained corresponding to the four relative positions of the keyframe, as shown in Figure 16.
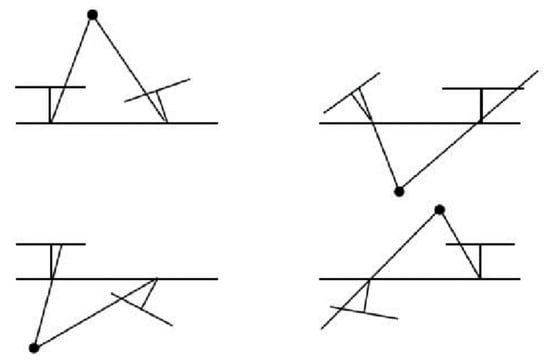
Figure 16.
Relative poses of the keyframes corresponding to four sets of solutions.
As shown in Figure 16, only the first of the four sets of solutions had practical physical significance, i.e., the scene depth corresponding to keyframes was positive, while the remaining three sets of solutions were only theoretical, and could not be used to obtain the correct camera motion. In summary, the correct set of solutions was determined by the depth of the field.
3.1.5. SLAM Back End
Design of Closed-Loop Detection
The closed-loop detection module constrained adjacent keyframes. When the camera obtained data over a long interval but containing similar images, similarity detection was carried out. If the two adjacent keyframes were detected in the same region, constraints were formulated between them. To provide conditions for back-end pose optimization and obtain a more globally consistent estimation. The closed-loop detection module in this study was based on the bag-of-words (BoW) model. The steps were as follows.
(1) Determine “words,” and construct their set as a “dictionary.”
(2) The “words” appearing in the image were determined and the image was transformed into a vector.
(3) Compare the similarity among vectors. Assuming two vectors a and b, similarity was calculated as follows,
where l was the norm and W was the number dimensions of the vector. The value of s(a,b) was one when the vectors was completely consistent and was otherwise zero. The threshold value Tlc was set when closed-loop detection was carried out.
The “dictionary” was composed of many “words.” Different from feature points, the “words” were not extracted from a single image but a combination of features. In other words, “dictionary” generation was a clustering problem. In this study, a tree dictionary was constructed based on the k-tree algorithm.
Design of Pose Optimization Module
Graph optimization using the camera pose and spatial points is called bundle adjustment (BA). It refers to the process of extracting the optimal 3D model and parameters of the camera from the visual reconstruction, following which several beams of light are reflected from each feature point. Once the camera posture and the spatial positions of the feature points have been adjusted to be optimal, the process is called the BA. It can be used to solve large-scale positioning and mapping problems.
When the state of the camera was initialized, the homography matrix H and the essential matrix E between the first and second frames were solved, and the 3D positions of the matching points of the frames were obtained by triangulation. The global BA algorithm was then used for pose optimization. This process is a common BA optimization process.
In the process of local mapping, local BA optimization was needed. This involves finding local keyframes nearby using the keyframes in hand. The local mapping points and keyframes that were used to observe them, but were not local keyframes, were used as fixed keys. By fixing the nearby keyframes, we uniformly optimized the pose of the local keyframes and the available keyframes. If the local keyframes were empty, they were not adjusted. This process was described as follows.
(1) A local keyframe list was constructed.
(2) Construct the list of local “map” points observed in the local keyframes.
(3) A fixed keyframe list was constructed to view the local “map” points.
(4) Set the vertex.
(5) Five iterative optimizations were carried out.
(6) Check the value of the optimized points, exclude abnormal points, and optimize 10 more times.
Note that in each instance of pose optimization, pose optimization was carried out and the reprojection error was optimized by the BA every time the mapping points were projected onto the given plane.
Dense Reconstruction
By designing the front end of visual SLAM as above, we efficiently and reliably estimated the spatial position and pose direction of each keyframe. Based on them, as well as keyframe data, we inversely derived the spatial position of any pixel, i.e., predict its depth.
This study introduced the polar line search and the block matching algorithm in constructing the dense 3D point cloud “map” to estimate the depth information of most pixels in the image. Because the brightness of a single pixel was not differentiated, one may consider comparing the similarity of pixel blocks, i.e., taking a small piece of w around pixel p1, and traversing points on the pole to match the small pieces of w around it. The assumption of the algorithm changed from the grayscale invariance of pixels to that of the image block.
To match two small pieces, their normalized intercorrelations (normalized cross-correlation, NCC) were calculated as follows,
where and represent the grayscale of the pixel at position of small pieces of size w × w of A and B, respectively. Once each similarity measure had been calculated on the pole, an NCC distribution along the pole, i.e., the probability distribution of pixel p1, appeared in the second frame. The higher the value of the NCC, the higher the probability of p1 having the same characteristic. However, there was some uncertainty in calculating the depth value of a pixel by using only two images. Thus, more than one image needed to be estimated. We assumed that the depth d of a pixel obeyed the Gaussian distribution:
Whenever new data arrived, the depth of observation was also a Gaussian distribution.
Updating the depth of the observation point p1 became an information fusion problem, and the fusion depth satisfies the following formula.
After multiple iterations, the peak of the probability distribution of p1 at the polar line on the second frame was closer to its true position. Thus, the complete steps for dense reconstruction were as follows.
(1) Assume that the depth of all pixels satisfied an initial Gaussian distribution.
(2) When new data were generated, the location of the projection point was determined by polar line search and block matching.
(3) The depth and uncertainty after triangulation were calculated according to geometry.
(4) The given observation was incorporated into the previous estimation. If the results converge, stopped the calculation; otherwise, return to step (2).
3.2. Design and Implementation of Parallel Algorithms
3.2.1. Implementation and Testing of Serial Algorithms
Through epipolar search and block matching technology, we estimated the depth of many non-characteristic pixels in the image after motion estimation. However, for the UAV platform using visual SLAM, the computational complexity of the above-mentioned methods was very large. Consider an image of size 640 × 480 as an example. Each depth estimation needed to compute about 300,000 pixels. Therefore, it needed to use parallel computing to obtain the corresponding optimization algorithm to meet the requirement of fast real-time performance.
Before parallelizing the dense reconstruction module in the SLAM system, we needed to choose the appropriate parallelization mode and formulate a reasonable parallelization strategy to lay a good theoretical foundation for the next parallelization. We then analyzed the idea of parallelization based on the principle of dense reconstruction, the characteristics of embedded GPU platform, and common parallelization methods.
It was clear from the above that dense reconstruction needed several iterations. It was assumed that the depths of all pixels satisfied an initial Gauss distribution. When the new data were generated, the projection point was determined by polar search and block matching. Then, the depth and uncertainty of triangulation were calculated according to the geometric relationship. Finally, the given observation was fused with the result. In the final estimation, either the convergence was stopped or the projection point was redetermined. The entire procedure was described with the pseudocode in Appendix B.
For fast and efficient 3D reconstruction, such parameters as the NCC threshold and the number of frames per iteration must be determined before dense reconstruction. For this reason, 50 keyframes were used to calculate the depth of the reference frame iteratively. When the values of the NCC were set to 0.85, 0.90, and 0.95, the number of pixels and computing time of each iteration were calculated. Think Pad T470p was chosen as the experimental platform in this study. Its processor was Intel i7 7700HQ and its running memory was 16 GB. The data used were from the REMODE dataset acquired by a UAV, and the image size was 640 × 480 pixels. The experimental results are shown in Figure 17 and Figure 18.
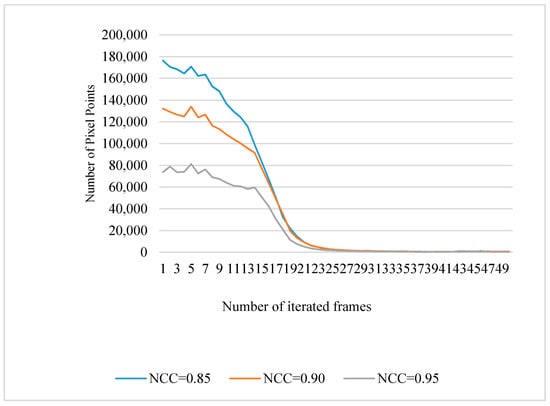
Figure 17.
The number of iterated keyframes versus the number of pixels per iteration.
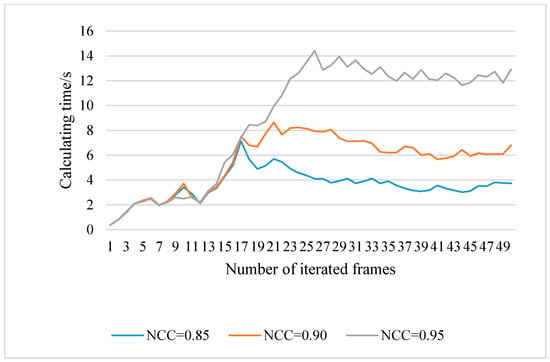
Figure 18.
The relationship between the number of iterated keyframes and the computing time of each iteration.
Figure 17 shows that when the number of keyframes was close to 20 frames, the number of pixels updated in each iteration was much smaller than the total number of pixels in the image. On the contrary, the larger the value of the NCC was, the smaller the number of pixels updated was each time. However, the lower the value of the NCC was, the more pixels were updated each time. This is consistent with the theory that the easier pixels were updated when the matching threshold decreased. The higher the value of the NCC was, the higher the reliability of dense reconstruction was, but the sparser was the result.
Figure 18 shows that the value of the NCC also affected the time needed for dense reconstruction. After about 20 frames, the time needed for each iteration tended to be stable. The higher the value of the NCC was, the longer was the time needed for each iteration.
Considering the dense requirement of the point cloud, the reliability of the reconstruction results, and the need for fast implementation, NCC = 0.9 was selected. The iterative results of 1, 5, 10, 15, and 25 frames are shown in Figure 19. When the depth map was iterated to 15 frames, it tended to be stable.
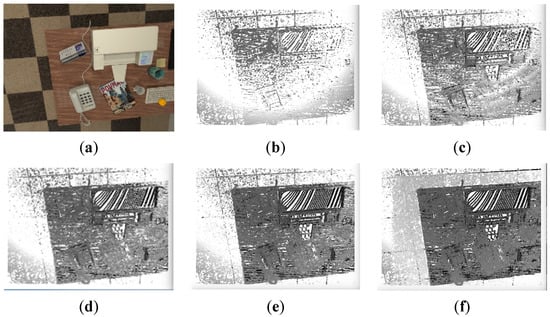
Figure 19.
Reconstruction results when NCC = 0.9 ((a) depth maps of the original image, (b–f) iteration for one frame, five frames, 10 frames, 15 frames, and 25 frames, respectively).
3.2.2. Parallel Strategy and Implementation
In experiments, the estimation of the dense depth map was very time consuming because the estimated points for each image changed from hundreds of feature points to hundreds of thousands, or even millions of pixels. In this circumstance, even advanced CPUs could not make so many computations in real time. However, the process of dense reconstruction had another property; the depth estimation of these hundreds of thousands of pixels was independent of each other, which made parallel computing useful.
As shown in the pseudocode in Appendix C, a double loop was used to traverse each pixel of the image and epipolar search was carried out on each pixel. When using the CPU, the process was serial, that is, when the last pixel had been calculated, the next pixel followed. However, there was no clear connection between the next pixel and the previous one, and thus, no need to wait for the results of the calculation of the latter. Therefore, the CPU of TX2 was responsible for reading the keyframe and initializing the depth map and variance matrix, and the GPU was responsible for the depth estimation of each pixel. When the GPU updated the pixels, the CPU copied the data to the host memory.
This process was suitable for parallel design, according to the principle of data parallelism. That is, we could map different pixel data to different work items of the processors to perform iterations of depth estimation on them. The data allocation strategy used a continuous data allocation method, according to which we could ensure that the number of pixels directly allocated to work items was not more than one, thus maintaining the consistency of the number of work item processing tasks.
According to the above allocation method, the data allocation of work items of the computing device was completed. Each work item read the image pixel data to be processed from the global memory space in turn and placed it into the private memory space for the iteration. Once the processing had been completed, the results of processing in the private memory were returned to the global memory space, where all work items waited for them. After processing the allocated pixel data, the host copied the result from the global memory space to the host memory for the final output of the matrix data of the depth map.
The host program designed in this paper was the ROS node and was responsible for the initialization and parameter setting of the program. When the node ran to iterate the depth map of the keyframe, it called the kernel function that was executed by the GPU, and its pseudocode is shown in Appendix C.
3.3. Node Communication and Its Implementation
3.3.1. Node Implementation
In this research, data acquisition, pose estimation, dense reconstruction, and visualization in the reconstruction of visual SLAM were executed by four computing nodes, each of which performed its own functions. The sensor captured the data, and the original data were published as topic/sensor_msgs connected directly by the visual sensor and Jetson TX2. The stream data were converted into image sequence data messages and re-published as topic/usb_cam.
The VO node subscribed to /usb_cam, and carried out pose estimation, published the results, rebuilt the node subscribing to /usb_cam and pose data at the same time, and published the processed depth map data and point cloud data to the ROS network. The visual node subscribed to implement the visualization function of the construction of the incremental “map” of the system.
The front end of SLAM, i.e., the VO node, subscribed to topic /usb_cam at the same time as the back end reconstruction node. The VO node resolved the data published by the /usb_cam node through the interface of the front end library of SLAM and then published it as information subscribed to by the reconstruction node of the back end of SLAM. That is, the reconstruction node subscribed to frame data and position data at the same time. The pseudocode of the VO node’s main function is shown in Appendix D.
When the VO node ran, its calculated pose was the input to the back end reconstruction. The pseudocode of the VO node’s main function is shown in Appendix E.
3.3.2. Three-Dimensional (3D) Point Cloud Visualization
The method and process adopted in this research to visualize the results of 3D “map” reconstruction in real-time was described as follows.
(1) When the depth map of the selected reference frame converged, the results were published to the topic.
(2) Visualized nodes acquired the posture/pose published by the VO nodes according to the referenced frame and its timestamp.
(3) Based on the initialization results, the spatial position of the center of light of the referenced frame and its normal direction were calculated.
(4) Pixel-by-pixel construction of point clouds based on depth maps was carried out.
The pseudocodes for visualizing and constructing the point clouds are described in Appendix F, and Appendix G respectively.
3.4. System Environment, Deployment, and Operation
3.4.1. Robot Operating System (ROS) Network
The distributed ROS computing system in this paper consisted of the airborne TX2 and a portable PC through a wireless local area network. Before the two computers communicated, their hosts file in the /etc directory were modified respectively to bind the IPs of the devices to their host names. The goal was to enable the underlying ROS layer to resolve the host names. After this modification, the network was restarted on both devices.
When running each node of the SLAM system, it was necessary to select the node manager first and start the ROS core process by input rose core from the device terminal where the node manager was located. When the device needed to run other processes, it opened the node directly through rosrun or roslaunch. In this paper, the node manager ran on the airborne TX2.
To enable a portable PC to join the ROS network, it was necessary to configure ROS_MASTER_URI on the PC and the input at its terminal: export ROS_MASTER_URI = http://tx2:11311.
Because of the distributed operating characteristics of ROS, the system built for this study needed to control multiple process nodes when it ran. The unmanned carrier could not be directly controlled, because of which SSH was needed for remote connection. When the airborne device TX2 was in the same LAN as the PC used for control, the control of the node was realized by a successful connection through instructions or by running scripts.
3.4.2. Arithmetic Deployment and Operation
Because both VO nodes and reconstruction nodes subscribed to messages published by sensor nodes, there was a large communication overhead between them but the TX2 had enough computational power to support them at the same time. Thus, the authors ran the two nodes on the TX2, and the PC on the ground side used the rviz visualization tool to observe real-time weight. A 3D model was built.
As in the design and implementation in the previous section, the system needed to open four nodes and a ROS core process at the same time. The sensor nodes involved the internal parameters of the camera. Because the internal parameters of each camera were not consistent, they needed to be calibrated before using the sensors. Once the sensors’ internal parameter matrices had been obtained, it was easy to reuse them later. Therefore, a ROS startup script was created in which the camera’s internal parameters were omitted. Once the ROS core process had been started, the script was run to open the sensor node.
To facilitate observation, after starting the sensor node, the rviz visualization process was started at the far end. The startup instruction of rviz was “rosrun rviz”, and the interface after opening was as follows: When the process registered with ROS MASTER ran, it was visualized by rviz to, for instance, observe input frames, select keyframes, and create depth maps based on keyframes in the SLAM system.
ROS needed some initialization parameters when running, such as the length, width, and channel of the image. If they ran directly, they needed to input longer instructions. Therefore, the authors used the launch file to write the parameters of the node’s operation, and its implementation allowed the process nodes to run with parameters. It could also call the camera’s internal parameters and other data. The start-up process of the system is shown in Figure 20.
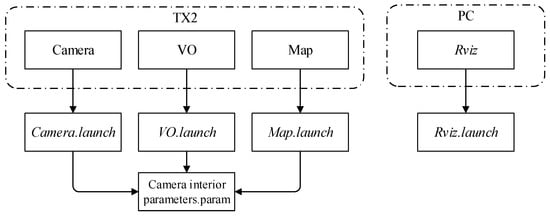
Figure 20.
Schematic diagram of running nodes through the launch file.
This section provides a concise and precise description of the experimental results, their interpretation, and the experimental conclusions that can be drawn.
4. Description of the Experiments
4.1. Experimental Platform and Configuration
The developed prototype system for pose estimation and 3D model reconstruction based on the visual SLAM algorithm was tested and validated. Details of configurations of the airborne UAV embedded computing device are shown in Table 1.

Table 1.
Experimental hardware and software configurations.
4.2. Experimental Design
4.2.1. Experiment 1: Visual Effect of 3D Point Cloud Reconstruction
In this experiment, the entire methodology and corresponding dense reconstruction algorithm were tested on the TX2 platform using sensor image data from the UAV. The generated 3D point cloud model was saved as a point cloud file (pcd for short) and visualized by a point cloud library (PCL).
The TX2 platform ran VO node and reconstruction node at the same time. Through the rviz visualization tool, the 3D “map” based on UAV image reconstruction was observed, compared, and analyzed. The experimental steps for testing the rapid reconstruction of 3D model on the TX2 platform were as follows.
(1) Jetson TX2 started the ROS core process roscore.
(2) The notebook for observation and TX2 were configured in the same wireless local area network (WLAN), and ROS_MASTER_URI was designated as the 11311 port of TX2 at the observation end.
(3) The VO nodes and reconstruction nodes were run on TX2, and the rviz visualization tools are run at the observer’s end.
(4) Experimental data were obtained through sensors on the TX2.
(5) The 3D model reconstruction based on UAV vision sensor data was observed at the observation end.
4.2.2. Experiment 2: Time and Accuracy Evaluation of the Dense Point Cloud
To quantitatively evaluate the time and accuracy of the reconstruction process, a reconstruction time evaluation experiment was used to compare the running time of the serial algorithm with that of the parallel algorithm, and the reconstruction time of the Smart3D software (with the SfM algorithm) with that of the system proposed here. The experiment to test the accuracy of reconstruction involved drawing a variance curve between the effective pixel and error by comparing the reference frame and the corresponding true depth map in the reconstruction process.
4.3. Experimental Data
4.3.1. Data for Experiment #1
To verify the feasibility and usability of the proposed method and the visual effect of 3D reconstruction on buildings, single-view data of the Innovation Center of the Qingshuihe Campus of the University of Electronic Science and Technology of China (UESTC) were obtained by a UAV. A reference frame is shown in Figure 21, below.
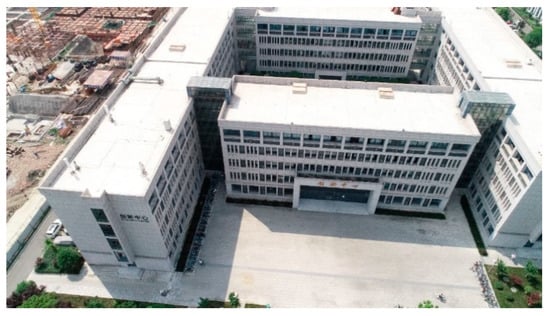
Figure 21.
Innovation Center Building of Qingshuihe Campus, UESTC, from the perspective of UAV.
4.3.2. Data for Experiment #2
The data selected for the experiment on the reconstruction process were from the REMODE dataset, and the dataset provided in Ref. [62] was selected to assess the accuracy of reconstruction. It consisted of views generated by the ray-tracing of a 3D composite model, and each view had a precise camera pose and depth map. Thus, the referenced dataset allowed us to quantitatively calculate the accuracy of each pixel in the results of reconstruction, and to evaluate the accuracy of reconstruction of the entire 3D model (the data was downloaded from http://www.doc.ic.ac.uk/~ahanda/HighFrameRateTracking/). Some information on the dataset is shown in Table 2.

Table 2.
Information on the dataset.
5. Experimental Results and Analysis
5.1. Experimental Results of Experiment #1 and Their Analysis
The results of the reconstruction of the experiment are shown in Figure 22.
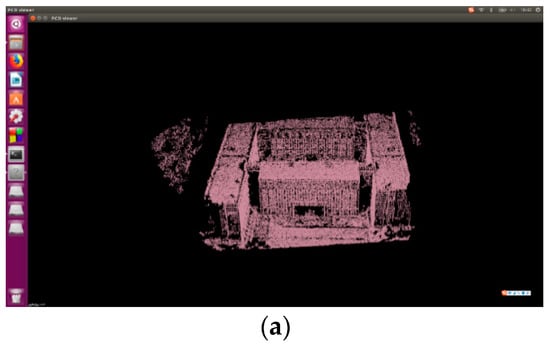
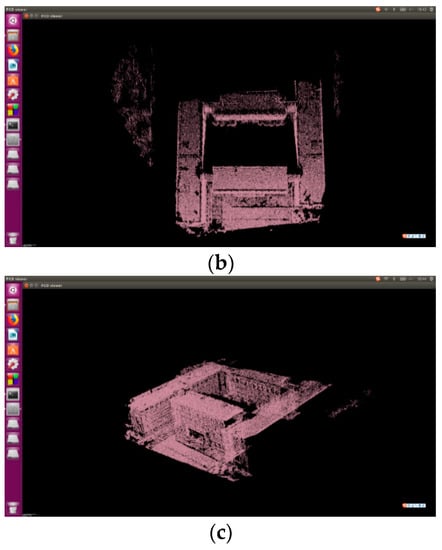
Figure 22.
Resulting map of the 3D point cloud reconstruction experiment based on UAV platform. (a) Front view (b) Vertical view (c) Right-side view.
Figure 22a–c show the results of 3D point cloud reconstruction in the experiment from the front view, vertical, and right-side views. The storage format was pcd, expressed in 3D point clouds space by the pcl_viewer software.
Through the experiments on known scenes, we found that the proposed methodology is feasible, and the point cloud model obtained was consistent with the actual scene. That is, the algorithm guaranteed the optimal results for 3D model reconstruction, and the dense 3D point cloud reflected the spatial 3D information of the surveyed area. For regions with rich textures, the effect of the reconstruction was better and had more detail, but for glass and other reflective surfaces, the results showed missing point clouds and holes. Moreover, the average power consumption of the UAV was less than 7.5 W. The results showed that the prototype system achieved good experimental results in an embedded environment where both the memory and power supply were highly constrained.
5.2. Experimental Results of Experiment #2 and Their Analysis
The running time of the serial algorithm was compared with that of the parallel algorithm, and the reconstruction time of the Smart3D software (with the SfM algorithm) was compared with that of the proposed system. Table 3 shows the time needed for reconstruction by the parallel SLAM algorithm compared with the serial SLAM algorithm when the number of keyframes was 20. Table 4 shows the time taken by the parallel SLAM algorithm compared with the traditional reconstruction algorithm (SfM) when the number of keyframes was 50.

Table 3.
Evaluation results in terms of reconstruction time (parallel and serial SLAM algorithm).

Table 4.
Evaluation results in terms of time needed for reconstruction (different reconstruction algorithms).
The experiment on the accuracy of reconstruction involved drawing the variance curve between the effective pixels and error by comparing the reference frame with the corresponding true depth map in the reconstruction process. When the error in depth map estimation was within the range of 5 cm to 15 cm, the relationship between the percentage of effective pixels and error variance is shown as the green and the light-blue lines, respectively, in Figure 23. The formula for calculating variance is as follows:
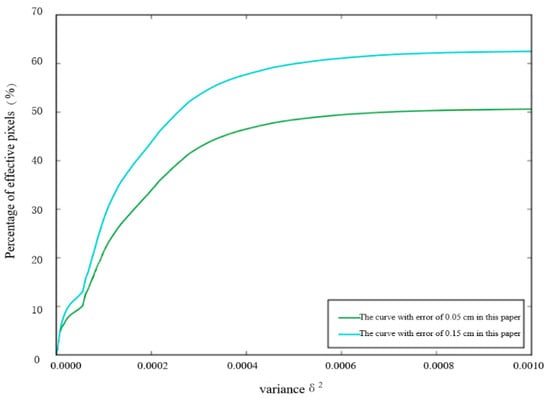
Figure 23.
The evaluation results in terms of reconstruction accuracy.
In the above, is the width of the image, is its height, is the estimated value of the ith pixel, is the standard value of the pixel, is the number of effective pixels within the allowable range of error, and is the range of error. For each pixel, the error between the estimated depth and the real depth was calculated. If the error was within the allowable range (err), the variance calculated by substituting the pixel into Formula (7) conformed to the given range of variance range (), then the pixel was considered an effective pixel. The ratio of the number of effective pixels to all pixels was the effective pixel ratio.
From the above, the proposed parallel algorithm had a better acceleration ratio than the serial algorithm at run time and provided a better real-time guarantee for the rapid reconstruction of the 3D model based on UAV data. Furthermore, compared with the Smart3D software based on the SfM algorithm, the time needed for construction was significantly reduced.
The accuracy of the 3D “map” reconstruction of the method proposed here depended largely on the accuracy of depth map estimation. The quantitative experiment here led to the following conclusions: (1) on the one hand, the error of dense reconstruction of the depth map was smaller than 5 cm, and the proportion of effective pixels to the total number of pixels was almost 50%. (2) On the other hand, the ratio of effective pixels with errors smaller than 15 cm to the total number of pixels was as high as 60%. The results were satisfactory and can provide a good reference value for the visualization of 3D models.
6. Conclusions and Future Work
In this paper, using a distributed ROS computing framework and parallel computing through a GPU, the authors proposed a fast method for 3D “map” reconstruction based on visual SLAM for the UAV platform. Based on key technologies, e.g., real-time data acquisition and fast processing in embedded environments, a prototype of the fast 3D reconstruction system based on a UAV was implemented. However, we conducted only preliminary research in this direction, and the prototype system was not sophisticated enough in some respects. There is room for improvement in the proposed method. Specifically, the following issues are worth further investigation:
(1) A systematic test, evaluation, and comparisons of the prototype system should be carried out. This is also the most important task in future work in the area.
(2) Although the proposed method achieved good results in terms of performance, it did not consider the scale-to-scale relationship between the constructed 3D “map” and real objects, and lacked a precise geospatial reference system for such a comparison and reference. In follow-up work, GPS and other technical means like the ground control point (GCP) should be added to the proposed method to assist in this respect. The corresponding relationship between the 3D “map” and real 3D objects as well as the controllable accuracy of the ground sample distance (GSD) should also be strengthened.
(3) Because of the distributed ROS computing framework, the reconstruction method designed in this paper communicated only with different functional nodes of the same device through message transmission, where the transmission of messages containing large amounts of data, such as images, consumed a large amount of system resources and thus required processors or data transmission parts. The proposed system was equipped with hardware equipment at the UAV’s onboard terminal that ensured high level performance to solve this problem, but this increased costs. Follow-up research can be carried out on real-time data transmission of the UAV at low cost.
(4) The 3D UAV model used in this research was a dense point cloud “map” that can provide only visually intuitive 3D information but did not study the implementation of its processing and reprocessing functions. In follow-up work, based on this study, the triangulation and texture mapping of 3D point cloud “maps” can be studied to better use them.
Author Contributions
Conceptualization, F.H. and S.P. (Siyuan Peng); methodology, F.H. and X.T.; software, H.Y., S.P. (Shuying Peng) and S.P. (Siyuan Peng); validation, F.H. and X.T.; formal analysis, H.Y., S.P. (Siyuan Peng); investigation, H.Y.; resources, F.H.; data curation, S.P. (Siyuan Peng); writing—original draft preparation, F.H., H.Y., S.P. (Siyuan Peng); writing—review and editing, X.T. and J.T.; visualization, S.P. (Shuying Peng); supervision, F.H.; project administration, F.H.; funding acquisition, X.T. All authors have read and agreed to the published version of the manuscript.
Funding
This study was supported by the National Key R&D Program of China (Grant No. 2017YFB0503905), the National Science Foundation of China (NSFC) (Grant ID: 41871312), and the Fundamental Research Funds for the Central Universities (Grant Nos. ZYGX2019J069, ZYGX2019J072, and 2042019KF0226).
Conflicts of Interest
The authors declare that there is no conflict of interest regarding the publication of this paper.
Appendix A
|
Appendix B
| 1. bool update( ) // Update the entire depth graph |
| 2. { |
| 3. for (pixel (x, y) from (0, 0) to (width-1, height-1) ) |
| 4. { // Traverse each pixel |
| 5. if (Convergence or Divergence) // Convergence or divergence of depth graph |
| 6. continue; |
| 7. bool ret ← epipolarSearch ( ); // Search for (x, y) matches on the polar line |
| 8. updateDepth ( ); // If matched successfully, update the depth map |
| 9. } |
| 10. } |
| 11. bool epipolarSearch( ) // Polar search |
| 12. { |
| 13. Vector3d P_ref; // Vector P of referenced frame |
| 14. Vector2d epipolar_line; // Polar line (segment form) |
| 15. Vector2d epipolar_direction ; // Polar line direction |
| 16. for (epipolar){ // Calculating NCC along the polar line |
| 17. Vector2d px_curr; // Matching points |
| 18. double ncc ← NCC(); // Computing NCC of the matched points and reference frames |
| 19. if ( best_ncc < N ) return false // Accept only highly matching NCC values |
| 20. } |
| 21. } |
Appendix C
| 1. __global__ void EpipolarMatchKernel( ) |
| 2. { // Assign the computing tasks through blockIdx and threadIdx |
| 3. int x ← blockIdx.x * blockDim.x + threadIdx.x; |
| 4. int y ← blockIdx.y * blockDim.y + threadIdx.y; |
| 5. double xx ← x+0.5f; |
| 6. double yy ← y+0.5f; |
| 7. double mu ← tex2D( ); // Retrieving the estimated depth |
| 8. const float sum_templ ← tex2D(sum_templ_tex, xx, yy); // Retrieving NCC matching statistics |
| 9. |
| 10. for ( every match on the polar line) // Search along the polar line |
| 11. if (the match succeeds) |
| 12. updateDepth ( ); // Update the depth graph |
| 13. double ncc ← ncc_numerator * rsqrtf(ncc_denominator + FLT_MIN); // Calculate value of NCC |
| 14. } |
Appendix D
|
Appendix E
| 1. cv::Mat img_8uC1; // Initialize the depth graph matrix |
| 2. cv_bridge::toCvShare( ); // Transform the message with the image and via cv_bridge |
| 3. slam::SE3<float> T_world_curr(dense_input->pose.orientation.w,); //Acquire pose information |
| 4. case State::TAKE_REFERENCE_FRAME: // Select the reference frame |
| 5. case State::UPDATE: // Update the depth graph |
| 6. PublishResults(); // Publish the processed results to talk |
Appendix F
| 1. uint64_t timestamp; // Define timestamps |
| 2. pcl_conversions::toPCL(ros::Time::now(), timestamp); |
| 3. timestamp ← ros::Time::now(); // Time stamp |
| 4. pc_->header.frame_id ← "/world"; // Obtain the coordinates of the center of light in the world coordinate system |
| 5. pc_->header.stamp ← timestamp; // Time stamp corresponding to reference frame point cloud |
| 6. pub_pc_.publish(pc_); // Mapping point clouds into space |
| 7. print out pc_->size() as number of Output point clouds; |
Appendix G
| 1. for(int y from 0 to depth.rows-1){ // Row-by-row traversal of pixels with reference frames. |
| 2. for(int x from 0 to depth.cols -1){ // Traverse the pixels column by column with reference frame |
| 3. const float3 xyz ← T_world_ref * ( f * depth.at<float>(y, x) ); // Reduction in point cloud position due to world coordinates, depth, and internal parameters of camera |
| 4. if( slam::convergence.at<int>(y, x) ) // If the depth of the pixel converges |
| 5. { |
| 6. PointType p; // Define the point cloud |
| 7. p.inten ← ref_img.at<uint8_t>(y, x); // The gray value of the pixel position in the reference frame |
| 8. pc_->push_back(p); // Save this point |
| 9. } |
| 10. } |
| 11. } |
References
- Ma, Y.; Wu, A.; Du, C. Vision Based Localization Algorithm for Unmanned Aerial Vehicles in Flight. Electron. Opt. Control 2013, 20, 42–46. [Google Scholar]
- Li, D.; Li, M. Research Advance and Application Prospect of Unmanned Aerial Vehicle Remote Sensing System. Geomat. Inf. Sci. Wuhan Univ. 2014, 39, 505–513. [Google Scholar]
- Wang, B.; Sun, Y.; Liu, D.; Nguyen, H.M.; Duong, T.Q. Social-Aware UAV-Assisted Mobile Crowd Sensing in Stochastic and Dynamic Environments for Disaster Relief Networks. IEEE Trans. Veh. Technol. 2019, 69, 1070–1074. [Google Scholar] [CrossRef]
- Stefanik, K.V.; Gassaway, J.C.; Kochersberger, K.; Abbott, A. UAV-Based Stereo Vision for Rapid Aerial Terrain Mapping. GISci. Remote. Sens. 2011, 48, 24–49. [Google Scholar] [CrossRef]
- Agarwal, S.; Snavely, N.; Simon, I.; Seitz, S.M.; Szeliski, R. Building Rome in a day. In Proceedings of the 2009 IEEE 12th International Conference on Computer Vision, Kyoto, Japan, 27 September–4 October 2009. [Google Scholar]
- Schönberger, J.L. Robust Methods for Accurate and Efficient 3D Modeling from Unstructured Imagery. Ph.D. Thesis, ETH Zurich, Zürich, Switzerland, 2016. [Google Scholar]
- Schonberger, J.L.; Frahm, J.M. Structure-from-motion revisited. In Proceedings of the 29th IEEE Conference on Computer Vision and Pattern Recognition, Las Vegas, NV, USA, 26 June–1 July 2016; pp. 4104–4113. [Google Scholar]
- Kersten, T.P.; Lindstaedt, M. Automatic 3D Object Reconstruction from Multiple Images for Architectural, Cultural Heritage and Archaeological Applications Using Open-Source Software and Web Services. Photogramm. Fernerkund. Geoinf. 2012, 2012, 727–740. [Google Scholar] [CrossRef]
- Nesbit, P.; Hugenholtz, C.H. Enhancing UAV–SfM 3D Model Accuracy in High-Relief Landscapes by Incorporating Oblique Images. Remote Sens. 2019, 11, 239. [Google Scholar] [CrossRef]
- Shum, H.-Y.; Ke, Q.; Zhang, Z. Efficient bundle adjustment with virtual key frames: A hierarchical approach to multi-frame structure from motion. In Proceedings of the 1999 IEEE Computer Society Conference on Computer Vision and Pattern Recognition, Fort Collins, CO, USA, 23–25 June 1999. [Google Scholar]
- Gherardi, R.; Farenzena, M.; Fusiello, A. Improving the efficiency of hierarchical structure-and-motion. In Proceedings of the 2010 IEEE Computer Society Conference on Computer Vision and Pattern Recognition, San Francisco, CA, USA, 13–18 June 2010. [Google Scholar]
- Guerra-Hernandez, J.; Cosenza, D.N.; Rodriguez, L.C.E.; Silva, M.; Tomé, M.; Díaz-Varela, R.A.; González-Ferreiro, E. Comparison of ALS- and UAV (SfM)-derived high-density point clouds for individual tree detection in Eucalyptus plantations. Int. J. Remote Sens. 2018, 39, 5211–5235. [Google Scholar] [CrossRef]
- Torres-Sánchez, J.; De Castro, A.-I.; Peña, J.M.; Jiménez-Brenes, F.M.; Arquero, O.; Lovera, M.; López-Granados, F. Mapping the 3D structure of almond trees using UAV acquired photogrammetric point clouds and object-based image analysis. Biosyst. Eng. 2018, 176, 172–184. [Google Scholar] [CrossRef]
- Ayache, N.; Faugeras, O.D. Building, Registrating, and Fusing Noisy Visual Maps. Int. J. Robot. Res. 1988, 7, 45–65. [Google Scholar] [CrossRef]
- Smith, R.C.; Self, M.; Cheeseman, P. Estimating Uncertain Spatial Relationships in Robotics. In Proceedings of the 2003 IEEE International Conference on Robotics and Automation, Taipei, Taiwan, 14–19 September 2003; pp. 435–461. [Google Scholar]
- Sofonia, J.J.; Shendryk, Y.; Phinn, S.; Roelfsema, C.; Kendoul, F.; Skocaj, D. Monitoring sugarcane growth response to varying nitrogen application rates: A comparison of UAV SLAM LiDAR and photogrammetry. Int. J. Appl. Earth Obs. Geoinf. 2019, 82, 101878. [Google Scholar] [CrossRef]
- Wang, H.; Zhang, C.; Song, Y.; Pang, B.; Zhang, G. Three-Dimensional Reconstruction Based on Visual SLAM of Mobile Robot in Search and Rescue Disaster Scenarios. Robotica 2020, 38, 350–373. [Google Scholar] [CrossRef]
- Civera, J.; Davison, A.J.; Montiel, J.M.M. Inverse Depth Parametrization for Monocular SLAM. IEEE Trans. Robot. 2008, 24, 932–945. [Google Scholar] [CrossRef]
- Davison, A.J. Real-time simultaneous localisation and mapping with a single camera. In Proceedings of the Proceedings Ninth IEEE International Conference on Computer Vision, Nice, France, 13–16 October 2003; p. 1403. [Google Scholar]
- Chekhlov, D.; Pupilli, M.; Mayol-Cuevas, W.; Calway, A. Real-Time and Robust Monocular SLAM Using Predictive Multi-resolution Descriptors. In Proceedings of the 12th International Symposium on Visual Computing, Las Vegas, NV, USA, 12–14 December 2006; pp. 276–285. [Google Scholar]
- Martinez-Cantin, R.; Castellanos, J. Unscented SLAM for large-scale outdoor environments. In Proceedings of the 2005 IEEE/RSJ International Conference on Intelligent Robots and Systems, Edmonton, AB, Canada, 2–6 August 2005; pp. 3427–3432. [Google Scholar]
- Thrun, S.; Burgard, W.; Fox, D. A Probabilistic Approach to Concurrent Mapping and Localization for Mobile Robots. Auton. Robot. 1998, 31, 29–53. [Google Scholar]
- Dissanayake, G.; Durrant-Whyte, H.; Bailey, T. A computationally efficient solution to the simultaneous localisation and map building (SLAM) problem. In Proceedings of the 2000 IEEE International Conference on Robotics and Automation, San Francisco, CA, USA, 24–28 April 2000. [Google Scholar]
- Williams, S.; Dissanayake, G.; Durrant-Whyte, H. Towards terrain-aided navigation for underwater robotics. Adv. Robot. 2001, 15, 533–549. [Google Scholar] [CrossRef]
- Zhu, D.; Sun, X.; Liu, S.; Guo, P. A SLAM method to improve the safety performance of mine robot. Saf. Sci. 2019, 120, 422–427. [Google Scholar] [CrossRef]
- Hong, S.; Kim, J. Three-dimensional Visual Mapping of Underwater Ship Hull Surface Using Piecewise-planar SLAM. Int. J. Control. Autom. Syst. 2020, 18, 564–574. [Google Scholar] [CrossRef]
- Guivant, J.E.; Nebot, E.M. Optimization of the simultaneous localization and map-building algorithm for real-time implementation. IEEE Trans. Robot. Autom. 2001, 17, 242–257. [Google Scholar] [CrossRef]
- Guivant, J.; Nebot, E. Improving computational and memory requirements of simultaneous localization and map building algorithms. In Proceedings of the 2002 IEEE International Conference on Robotics and Automation, Washington, DC, USA, 11–15 May 2002; pp. 2731–2736. [Google Scholar]
- Williams, S.; Dissanayake, G.; Durrant-Whyte, H. An efficient approach to the simultaneous localisation and mapping problem. In Proceedings of the 2002 IEEE International Conference on Robotics and Automation, Washington, DC, USA, 11–15 May 2002; pp. 406–411. [Google Scholar]
- Kuschk, G.; Bozic, A.; Cremers, D. Real-time variational stereo reconstruction with applications to large-scale dense SLAM. In Proceedings of the 2017 IEEE Intelligent Vehicles Symposium (IV), Los Angeles, CA, USA, 11–17 June 2017; pp. 1348–1355. [Google Scholar]
- Smith, R.C.; Cheeseman, P. On the representation and estimation of spatial uncertainly. Int. J. Robot. Res. 1986, 5, 56–68. [Google Scholar] [CrossRef]
- Thrun, S.; Liu, Y.; Koller, D.; Ng, A.Y.; Ghahramani, Z.; Durrant-Whyte, H. Simultaneous Localization and Mapping with Sparse Extended Information Filters. Int. J. Robot. Res. 2004, 23, 693–716. [Google Scholar] [CrossRef]
- Montemerlo, M.S. Fastslam: A factored solution to the simultaneous localization and mapping problem with unknown data association. In Proceedings of the Eighteenth AAAI National Conference on Artificial Intelligence, Edmonton, AB, Canada, 28 July–1 August 2002; pp. 593–598. [Google Scholar]
- Thrun, S. Probabilistic robotics. Commun. ACM 2002, 45, 52–57. [Google Scholar] [CrossRef]
- Huang, S.; Dissanayake, G. Convergence and Consistency Analysis for Extended Kalman Filter Based SLAM. IEEE Trans. Robot. 2007, 23, 1036–1049. [Google Scholar] [CrossRef]
- Geneva, P.; Maley, J.; Huang, G. An Efficient Schmidt-EKF for 3D Visual-Inertial SLAM. In Proceedings of the 2019 IEEE Conference on Computer Vision and Pattern Recognition, Long Beach, CA, USA, 16–20 June 2019; pp. 12105–12115. [Google Scholar]
- Klein, G.; Murray, D. Parallel Tracking and Mapping for Small AR Workspaces. In Proceedings of the 2007 6th IEEE and ACM International Symposium on Mixed and Augmented Reality, Nara, Japan, 13–16 November 2007; pp. 225–234. [Google Scholar]
- Klein, G.; Murray, D. Improving the Agility of Keyframe-Based SLAM. In Proceedings of the 10th European Conference on Computer Vision, Marseille, France, 12–18 October 2008; pp. 802–815. [Google Scholar]
- Mur-Artal, R.; Montiel, J.M.M.; Tardos, J.D. ORB-SLAM: A Versatile and Accurate Monocular SLAM System. IEEE Trans. Robot. 2015, 31, 1147–1163. [Google Scholar] [CrossRef]
- Mur-Artal, R.; Tardos, J.D. Fast relocalisation and loop closing in keyframe-based SLAM. In Proceedings of the 2014 IEEE International Conference on Robotics and Automation (ICRA 2014), Hong Kong, China, 31 May–7 June 2014; pp. 846–853. [Google Scholar]
- Olson, E.; Leonard, J.; Teller, S. Fast iterative alignment of pose graphs with poor initial estimates. In Proceedings of the 2006 IEEE International Conference on Robotics and Automation, Orlando, FL, USA, 15–19 May 2006; pp. 2262–2269. [Google Scholar]
- Burgard, W.; Brock, O.; Stachniss, C. A Tree Parameterization for Efficiently Computing Maximum Likelihood Maps using Gradient Descent. In Proceedings of the 3rd Robotics: Science and Systems, Atlanta, GA, USA, 27–30 June 2007; p. 352. [Google Scholar]
- Kaess, M.; Ranganathan, A.; Dellaert, F. iSAM: Fast Incremental Smoothing and Mapping with Efficient Data Association. In Proceedings of the 2007 IEEE International Conference on Robotics and Automation, Roma, Italy, 10–14 April 2007; pp. 1365–1378. [Google Scholar]
- Konolige, K.; Agrawal, M. FrameSLAM: From Bundle Adjustment to Real-Time Visual Mapping. IEEE Trans. Robot. 2008, 24, 1066–1077. [Google Scholar] [CrossRef]
- Johannsson, H.; Kaess, M.; Fallon, M.; Leonard, J.J. Temporally scalable visual SLAM using a reduced pose graph. In Proceedings of the 2013 IEEE International Conference on Robotics and Automation, Karlsruhe, Germany, 6–10 May 2013; pp. 54–61. [Google Scholar]
- Kummerle, R.; Grisetti, G.; Strasdat, H.; Konolige, K.; Burgard, W. G2o: A general framework for graph optimization. In Proceedings of the 2011 IEEE International Conference on Robotics and Automation, Shanghai, China, 9–13 May 2011; pp. 3607–3613. [Google Scholar]
- Sunderhauf, N.; Protzel, P. Towards a robust back-end for pose graph SLAM. In Proceedings of the 2012 IEEE International Conference on Robotics and Automation, Saint Paul, MN, USA, 14–18 May 2012; pp. 1254–1261. [Google Scholar]
- Wilbers, D.; Merfels, C.; Stachniss, C. A Comparison of Particle Filter and Graph-Based Optimization for Localization with Landmarks in Automated Vehicles. In Proceedings of the 2019 Third IEEE International Conference on Robotic Computing (IRC), Naples, Italy, 25–27 February 2019; pp. 220–225. [Google Scholar]
- Ko, N.Y.; Chung, J.H.; Jeon, D.B. The Implementation of Graph-based SLAM Using General Graph Optimization. J. Korea Inst. Electron. Commun. Sci. 2019, 14, 637–644. [Google Scholar]
- Li, B.; Wang, Y.; Zhang, Y.; Zhao, W.; Ruan, J.; Li, P. GP-SLAM: Laser-based SLAM approach based on regionalized Gaussian process map reconstruction. Auton. Robot. 2020, 44, 947–967. [Google Scholar] [CrossRef]
- Engel, J.; Sturm, J.; Cremers, D. Semi-dense Visual Odometry for a Monocular Camera. In Proceedings of the 2013 IEEE International Conference on Computer Vision, Sydney, Australia, 1–8 December 2013; pp. 1449–1456. [Google Scholar]
- Stühmer, J.; Gumhold, S.; Cremers, D. Real-Time Dense Geometry from a Handheld Camera. In Proceedings of the 32nd DAGM Symposium, Darmstadt, Germany, 22–24 September 2010; pp. 11–20. [Google Scholar]
- Newcombe, R.A.; Lovegrove, S.J.; Davison, A.J. DTAM: Dense tracking and mapping in real-time. In Proceedings of the 2011 International Conference on Computer Vision, Barcelona, Spain, 6–13 November 2011; pp. 2320–2327. [Google Scholar]
- Forster, C.; Pizzoli, M.; Scaramuzza, D. SVO: Fast semi-direct monocular visual odometry. In Proceedings of the 2014 IEEE International Conference on Robotics and Automation (ICRA), Hong Kong, China, 31 May–7 June 2014; pp. 15–22. [Google Scholar]
- Engel, J.; Schöps, T.; Cremers, D. LSD-SLAM: Large-Scale Direct Monocular SLAM. In Proceedings of the 13th European Conference of Computer Vision, Zürich, Switzerland, 6–12 September 2014; pp. 834–849. [Google Scholar]
- Liu, R.; Li, B.B.; Luo, T. Three dimensional terrain modeling based on monocular UAV image sequences. Comput. Eng. Des. 2017, 38, 160–164. [Google Scholar]
- López, E.; García, S.; Barea, R.; Bergasa, L.M.; Molinos, E.J.; Arroyo, R.; Romera, E.; Pardo, S. A Multi-Sensorial Simultaneous Localization and Mapping (SLAM) System for Low-Cost Micro Aerial Vehicles in GPS-Denied Environments. Sensors 2017, 17, 802. [Google Scholar] [CrossRef]
- Zhang, X.-L. The Research of Parallel Fastslam Algorithm Based on Cuda. Ph.D. Thesis, East China Jiaotong University, Nanchang, China, 2016. [Google Scholar]
- Zhu, F.-L.; Zeng, B.; Cao, J. Parallel optimization and implementation of SLAM algorithm based on particle filter. J. Guangdong Univ. Technol. 2017, 34, 94–98. [Google Scholar]
- Zhang, Z. A flexible new technique for camera calibration. IEEE Trans. Pattern Anal. Mach. Intell. 2000, 22, 1330–1334. [Google Scholar] [CrossRef]
- Faugeras, O.; Lustman, F. Motion and structure from motion in a piecewise planar environment. Int. J. Pattern Recognit. Artif. Intell. 1988, 2, 485–508. [Google Scholar] [CrossRef]
- Handa, A.; Newcombe, R.A.; Angeli, A.; Davison, A.J. Real-Time Camera Tracking: When is High Frame-Rate Best? In Proceedings of the 12th European Conference on Computer Vision, Florence, Italy, 7–13 October 2012; Volume 7578, pp. 222–235. [Google Scholar]
© 2020 by the authors. Licensee MDPI, Basel, Switzerland. This article is an open access article distributed under the terms and conditions of the Creative Commons Attribution (CC BY) license (http://creativecommons.org/licenses/by/4.0/).