Abstract
Buildings are vulnerable to collapse incidents. We adopt a workflow to detect unusual vertical surface motions before building collapses based on PS-InSAR time series analysis and spatiotemporal data mining techniques. Sentinel-1 ascending and descending data are integrated to decompose vertical deformation in the city of Alexandria, Egypt. Collapsed building data were collected from official sources, and overlayed on PS-InSAR vertical deformation results. Time series deformation residuals are used to create a space–time cube in the ArcGIS software environment and analyzed by emerging hot spot analysis to extract spatiotemporal patterns for vertical deformation around collapsed buildings. Our results show two spatiotemporal patterns of new cold spot or new hot spot before the incidents in 66 out of 68 collapsed buildings between May 2015 and December 2018. The method was validated in detail on four collapsed buildings between January and May 2019, proving the applicability of this workflow to create a temporal vulnerability map for building collapse monitoring. This study is a step forward to create a PS-InSAR based model for building collapse prediction in the city.
1. Introduction
Urban areas are often expanding into vulnerable areas and buildings become under risk of collapse due to many reasons in different parts of the world. Therefore, it is essential to monitor surface deformation in cities for abnormal motion. This helps in evacuation before the collapse, to save lives and important properties. Traditionally, building movements are observed by installing equipment such as settlement extensometers into the building structures. Recently, Global Navigation Satellite Systems (GNSS) are another choice to measure building deformation. But, both measurements are limited to a few selected buildings and relatively expensive [1,2].
Now, the wide coverage of remote sensing gives scientists the capability to monitor changes in urban areas rapidly and effectively. Interferometric Synthetic Aperture Radar (SAR) techniques were successfully utilized to detect surface deformation in a millimeter-scale with wide coverage [3], with the capability to create a time series for deformation using permanent scatterers interferometric SAR (PS-InSAR) technique [4]. PS-InSAR is efficient in monitoring slow motion related geohazards. It succeeded in estimating surface motion in regional scales up to country-wide dimensions [5]; in addition, locally the technique can reach down to building scale [6]. Results of PS-InSAR were validated for building deformation monitoring and found to have similar millimeter-level accuracy as traditional leveling technique [7].
In this study, we use PS-InSAR time series results within known collapsed buildings in the city of Alexandria, Egypt, to detect spatiotemporal patterns of vertical deformation right before collapse incidents. Our hypothesis is that the land surface surrounding a collapsed building shows a spatiotemporal pattern of deformation before the collapse. Such patterns would allow for a collapse prediction and therefore a warning system. The patterns detected in this study are tested for the possibility of using as one of the inputs for a building collapse prediction model for collapsed buildings in known vertical deformation regions.
Early on, Ferretti et al. [8] used PS-InSAR to study surface motion within a building before its collapse incident. This was followed by studies interested in building deformation monitoring using InSAR techniques in many countries, including Italy [2,6], France [8,9], Poland and Russia [10], China [7,11,12], and South Korea [1]. However, very few have been applied to already collapsed buildings as the earliest paper, to test the connection of collapse incidents to surface instability [10]. Most of those studies focused on a limited number of buildings and very small areas of interest, except for [1,2,6].
The high resolution and relative short revisit time of X-band, for example, four days for COSMO-SkyMed (CSK), makes it very useful to use in building motion monitoring [1,7,9,12]. C-band has also taken its share in this application [2,6,8,10,11], especially, with the availability of Sentinel-1 data offering global coverage. The literature reveals the higher applicability of SAR X-band data in building damage monitoring studies because of its higher resolution and shorter wavelength, which allows detection of more PS points per building [9]. In this study, the data availability was the reason to use C-band SAR data, as Sentinel-1 open-data coverage over the city of Alexandria is relatively good.
Previous studies depended only on InSAR measurements to evaluate building stability without any additional spatial analysis or modeling approach. Only Ezquerro et al. [2] took the PS-InSAR results to a second level by applying statistical analysis of fragility curve to map damage probability assessment for a part of Pistoia, Italy. Here, we took the analysis to a higher level by applying spatiotemporal analysis for time series measurements surrounding collapsed buildings before the incident. Spatiotemporal analysis discovers interesting and previously unknown patterns from large spatial and spatiotemporal databases, which are potentially useful to understand phenomena [13]. Spatiotemporal pattern analysis was successfully applied in different applications, including climate science, neuroscience, environmental science, precision agriculture, epidemiology and health care, social media, traffic dynamics, heliophysics, criminology, and location-based services [14,15,16]. To the best of our knowledge, however, it was not used in surface deformation analysis, especially, with PS-InSAR in any previous research. This might be due to the applicability of the PS-InSAR time series results in most applied research.
In a PS-InSAR building collapse application, time series results are sufficient when vertical and horizontal LOS (line-of-sight) deformations are integrated into a building collapse causality model, similar to landslide areas where cumulative displacement is the only significant reason for building cracks and collapse incident [17]. However, when horizontal deformation does not exist, or is very small in an area of interest like Alexandria [18], vertical displacement in a large spatial distribution cannot be taken as a sole reason for the collapse, because the whole building is subjected to subsidence at the same rate. Therefore, the detection of specific spatiotemporal patterns surrounding collapsed buildings before the incident in the city might be helpful in future building collapse prediction.
Alexandria, Egypt, was selected as a case study due to the recently increasing number of building collapse incidents in the city. Alexandria is constructed on a carbonate coastal ridge of Pleistocene age covered by a thin layer of Holocene sediments at the western margin of the Nile delta. Historically, it was susceptible to high rates of subsidence due to short-term catastrophic events of powerful earthquakes and tsunamis, the continuous subsidence of the Quaternary water-saturated substrate, destructive winter wave surges, and anthropogenic influences, such as the load of city constructions [19]. Official records attribute collapse incidents in the city to violations of building specifications, illegal extensions, lax oversight, aging, poor maintenance, and very few incidents to land subsidence [20]. However, this study does not focus on the reason behind the collapse incident, because whatever the reason for the collapse, the effect of all causes are mostly the same [12].
2. Materials and Methods
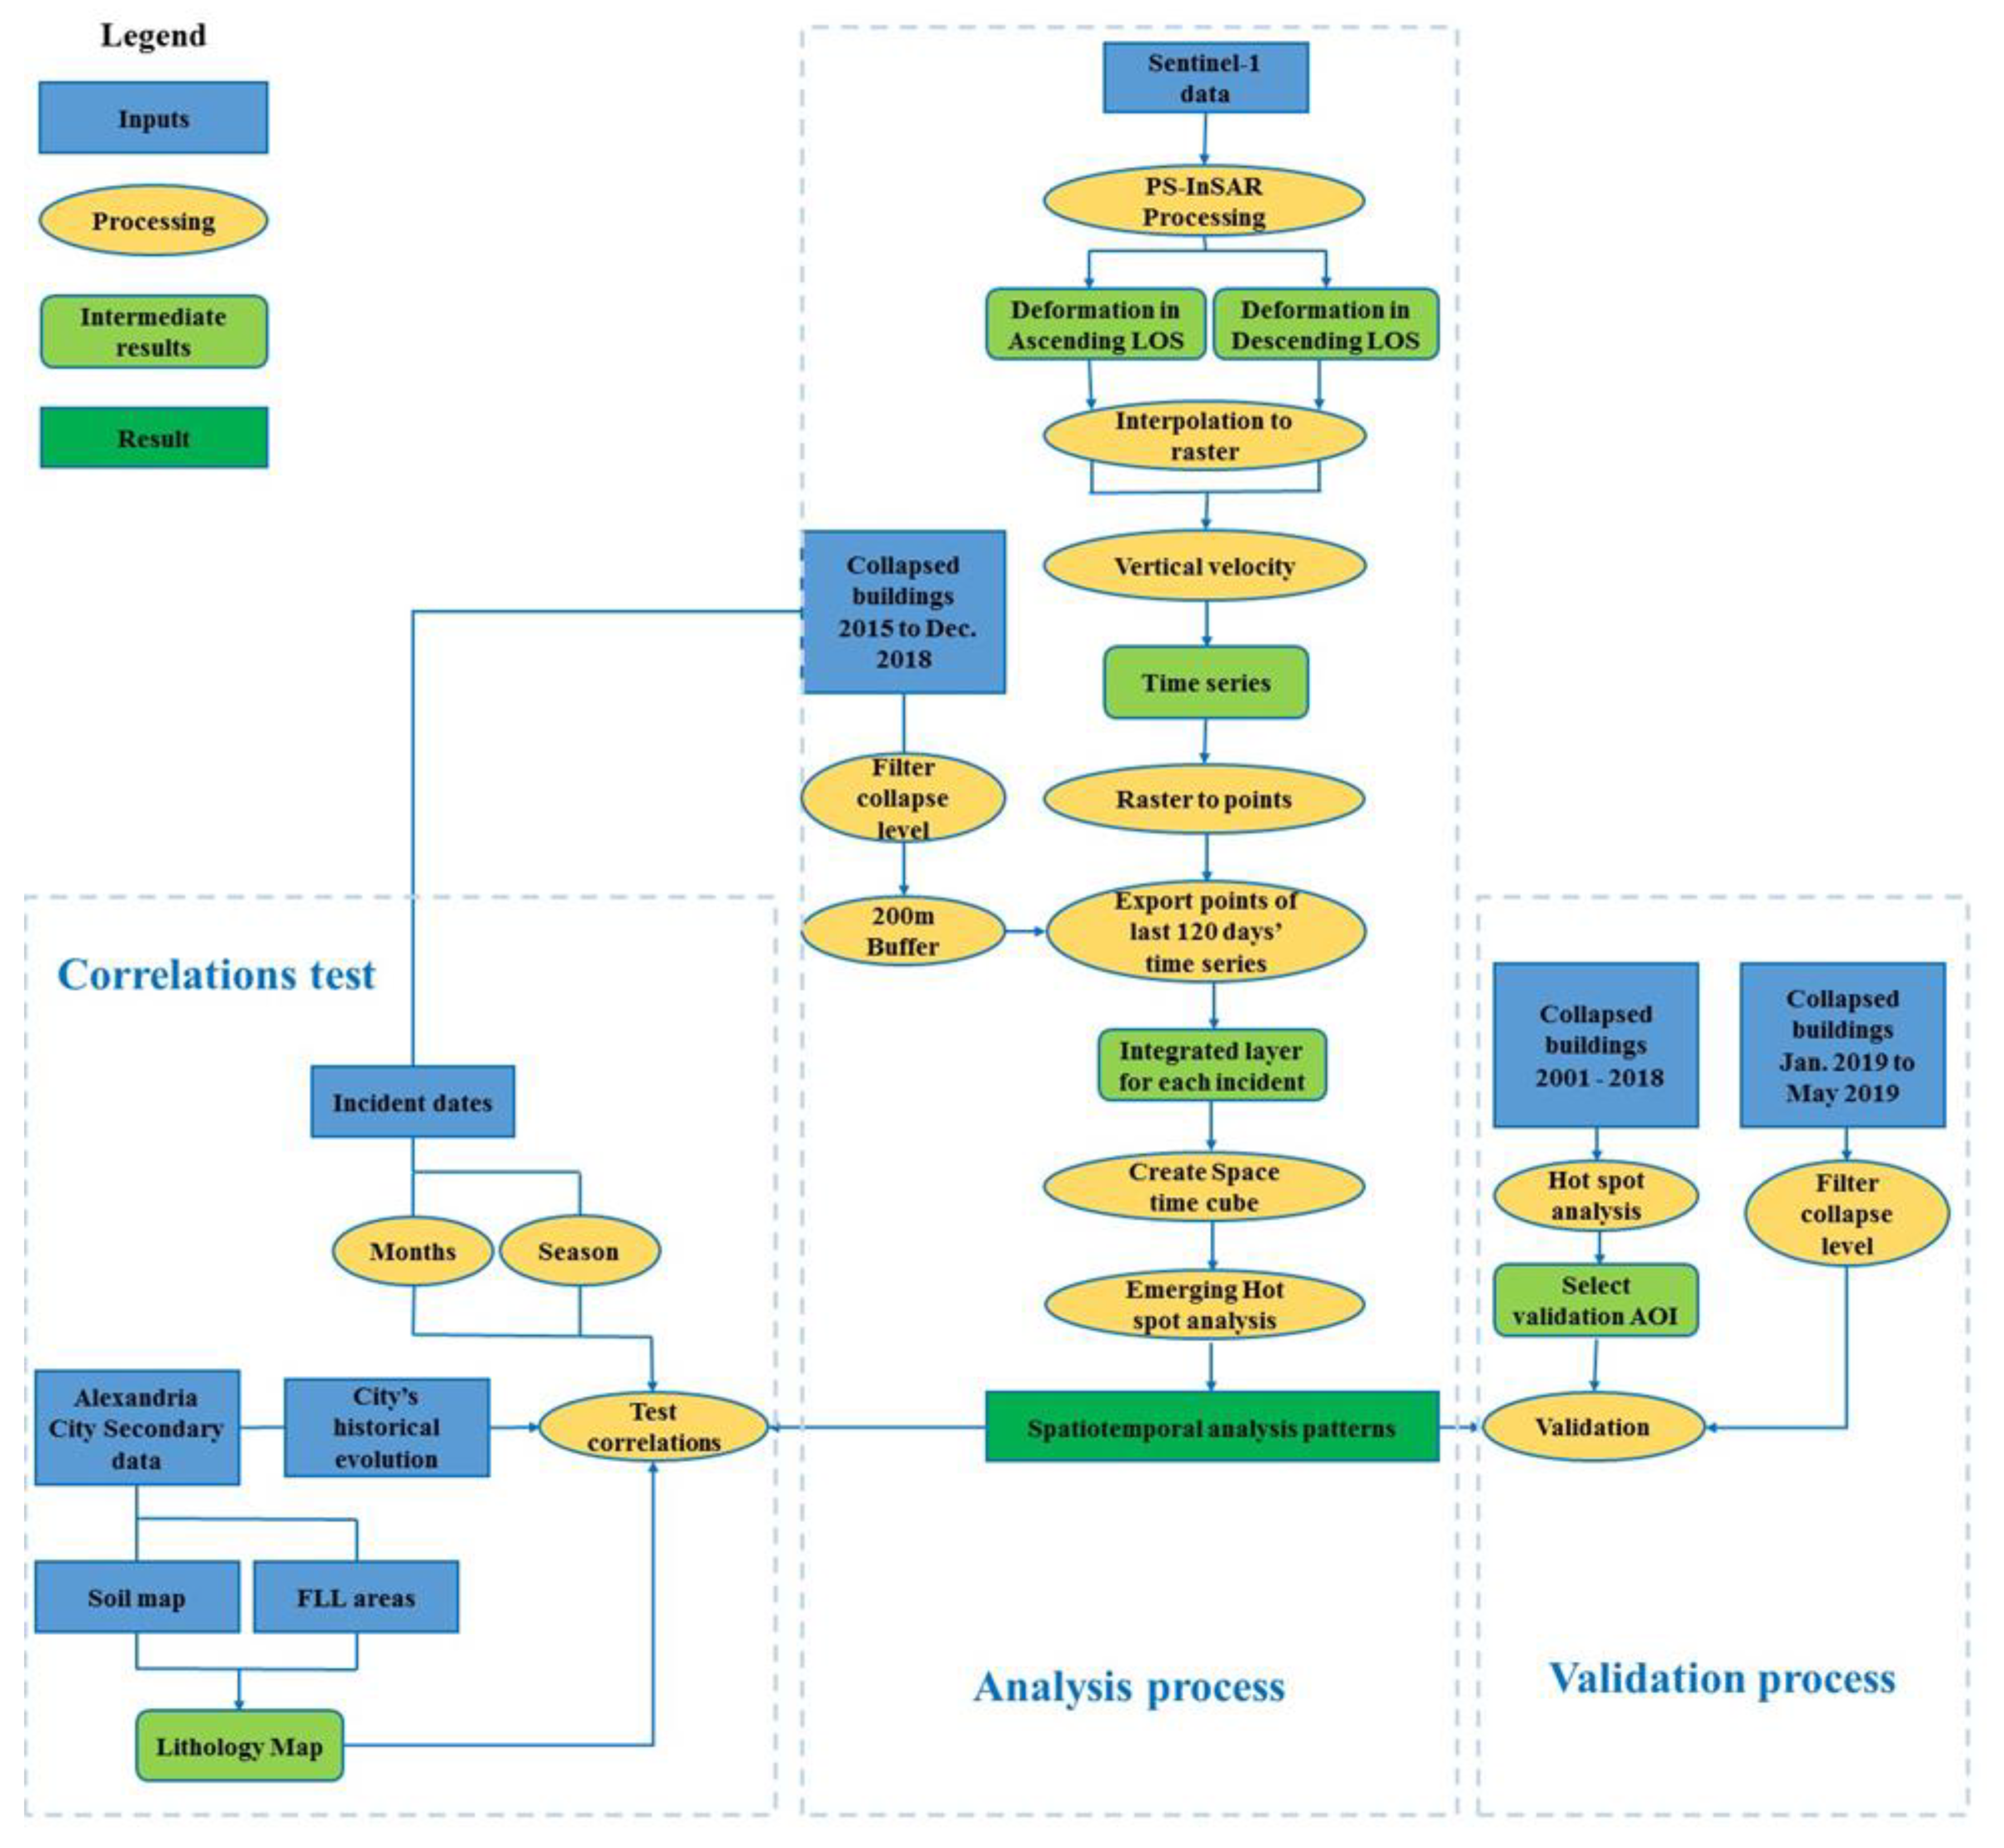
We tested vertical deformation surrounding collapsed buildings of Alexandria, Egypt, between May 2015 and December 2018 to extract common spatiotemporal patterns before the incident. Figure 1 shows the workflow of this study. The workflow consists of three parts: spatiotemporal analysis process, correlation tests, and validation process. The main process in the workflow shown in the middle, correlation, and validation of the analysis of the spatiotemporal patterns are on the left and right of the main process, respectively. Data collection, PS-InSAR processing, spatiotemporal data preparation, and pattern extraction are presented in Section 2.1, Section 2.2, and Section 2.3; Section 2.4 and Section 2.5 discuss correlation test and validation processing.
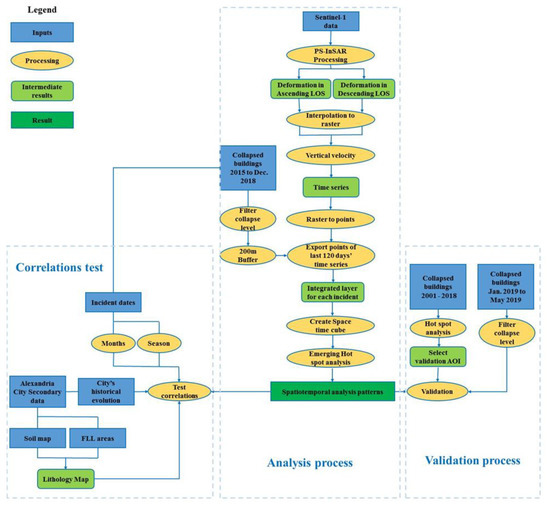
Figure 1.
Study workflow. LOS refers to the line-of-sight, FLL is the former lakes and lagoons in the study area, and AOI means the area of interest.
2.1. Collected Data
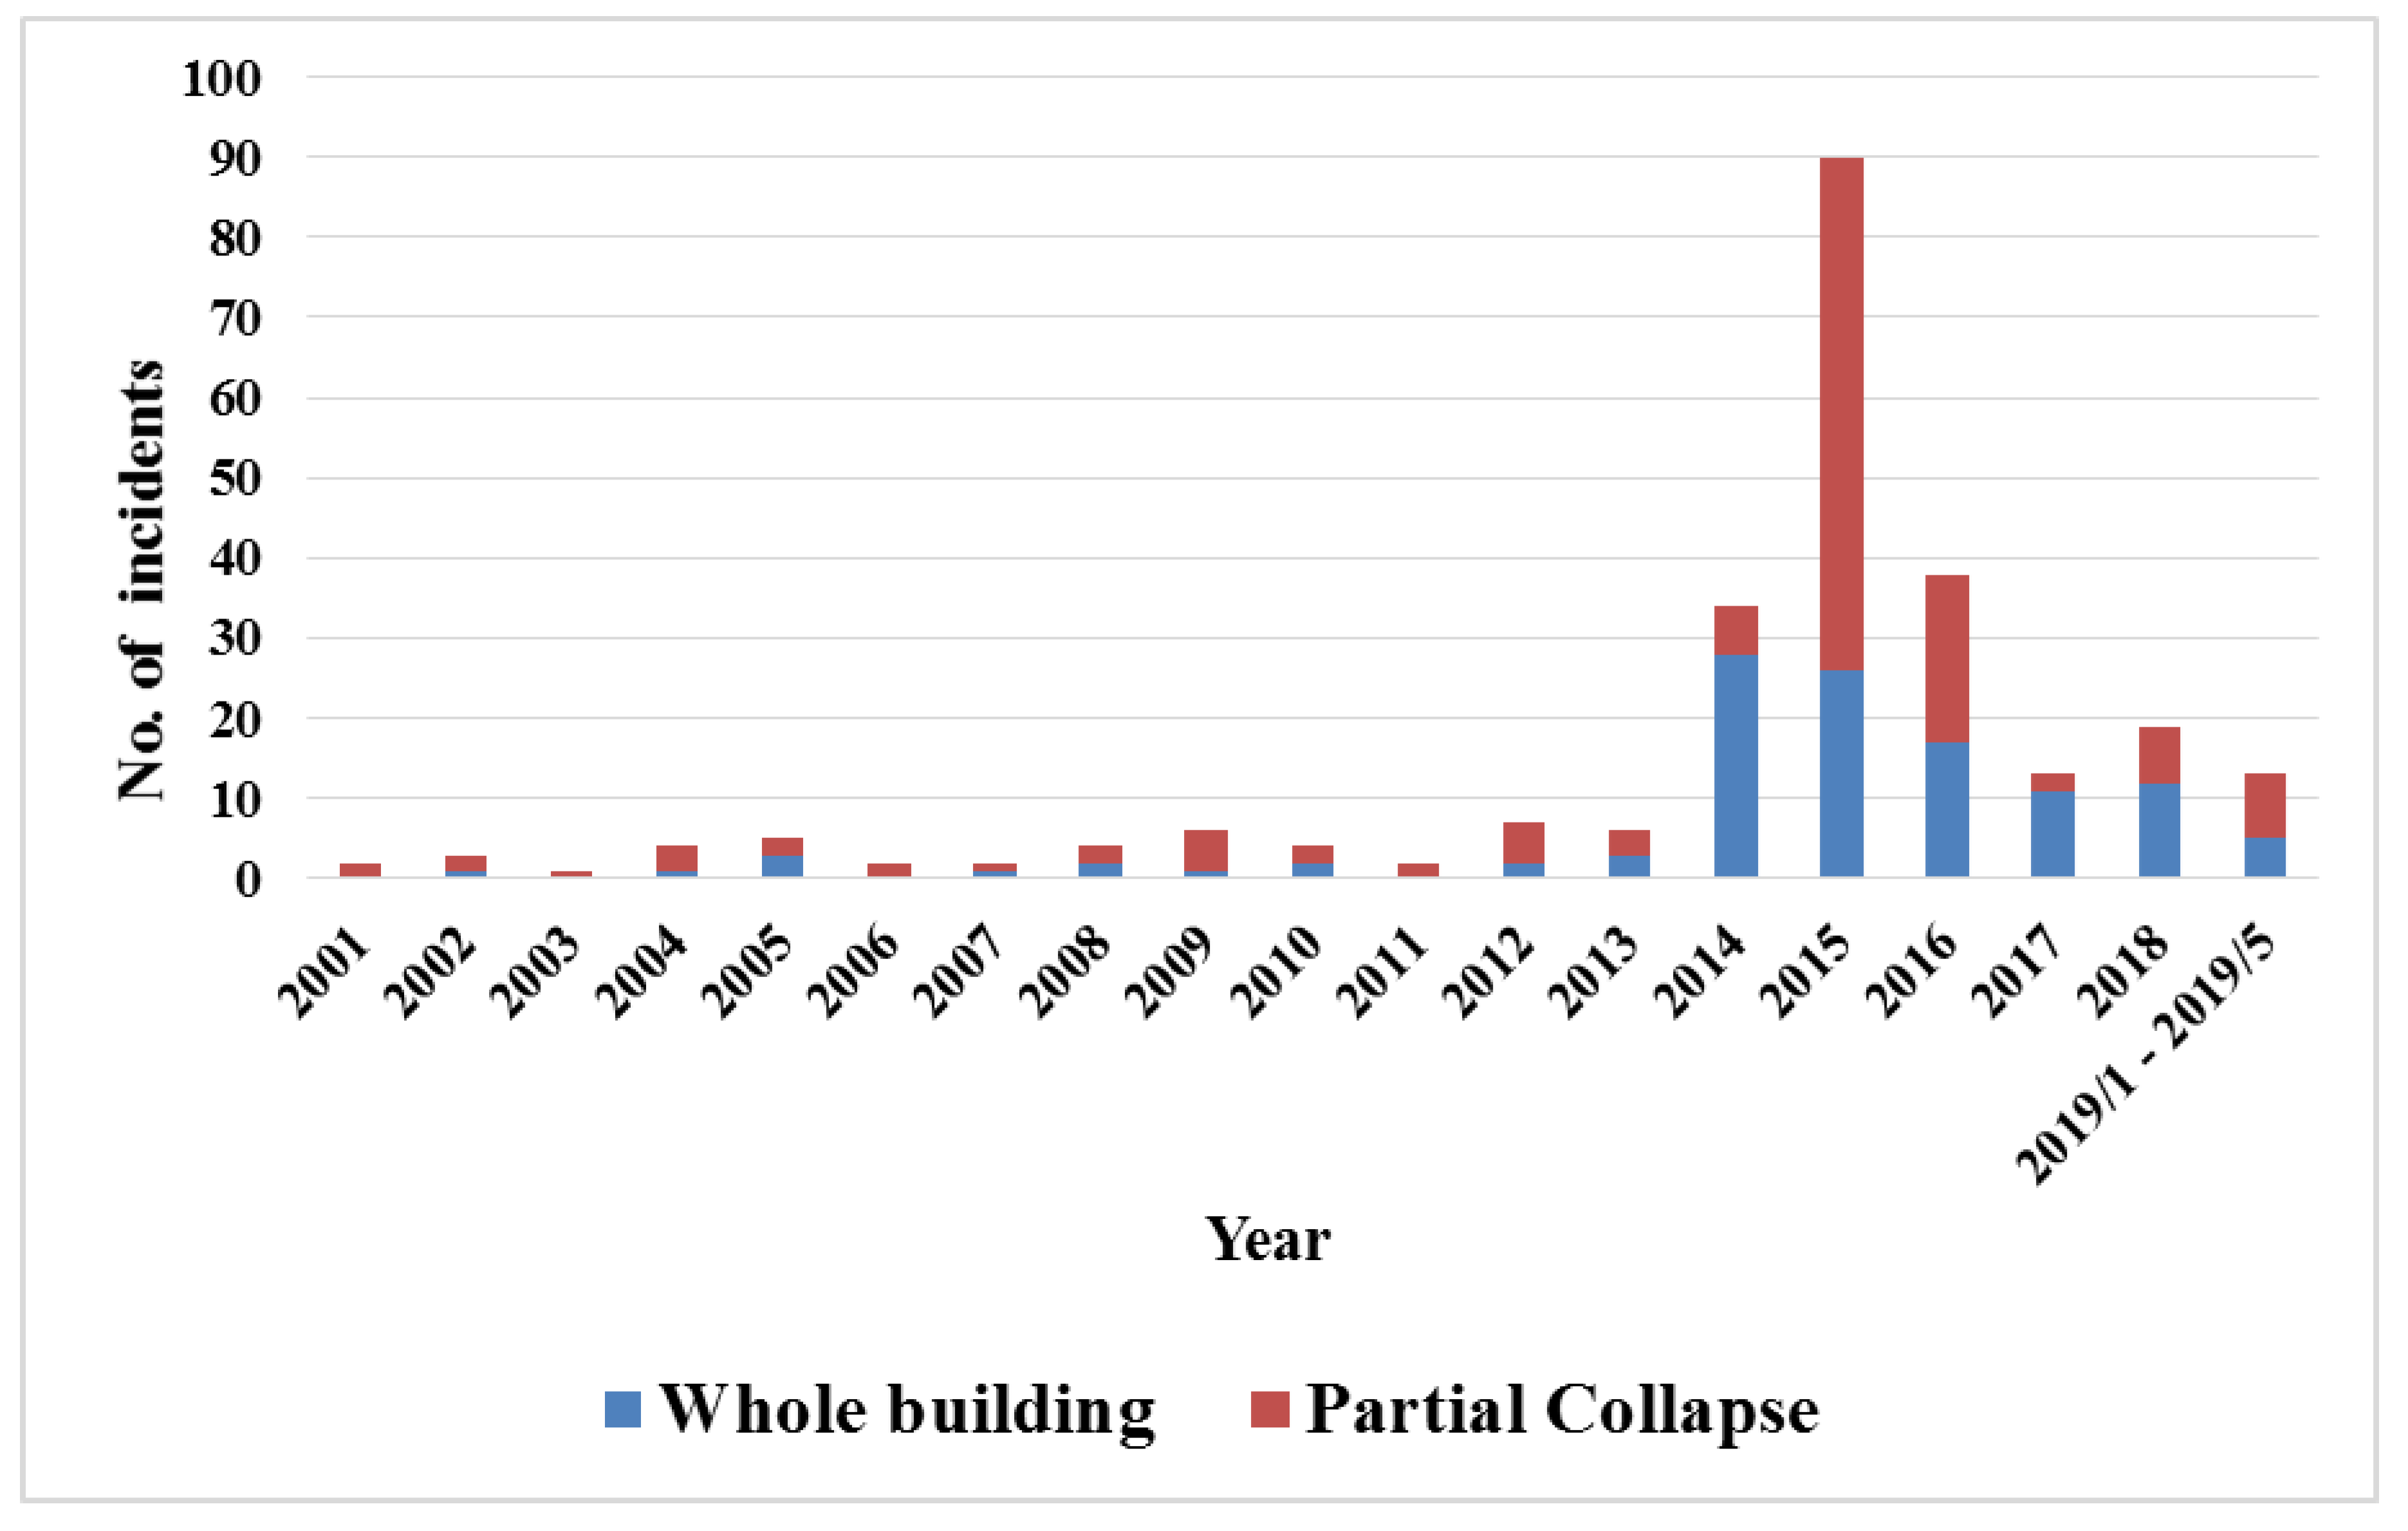
The local governorate of Alexandria started to record building collapse data in 2001, as a result of the increasing number of collapsed buildings over time. We collected all collapsed buildings recorded between the January 2001 and May 2019 from local district governmental offices. A total of 255 buildings collapsed during this period, as shown in Figure 2. Recorded data have only a descriptive location based on the street names and building numbers without available x and y coordinates provided in the governmental records. Hence, we used a hand-held Garmin GPSMAP 78 with three meters precision to collect the location of each collapsed building based on their recorded address. We have to address some difficulties that may affect the precision of our GPS points of collapsed buildings, such as narrow streets with high buildings, inaccessible areas for safety, and security reasons that forced us to sometimes read locations a short distance from the incident place.
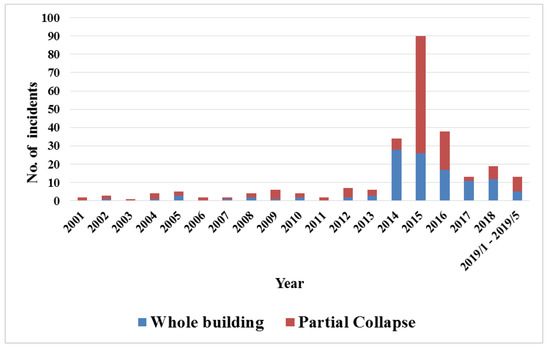
Figure 2.
Annual distribution of collapsed buildings in Alexandria between January 2001 and May 2019.
A total of 115 buildings completely collapsed, while 140 buildings partially collapsed, varying from a whole side collapse to a wall or balcony collapse. The dramatic increase in collapse incidents conditions, starting from 2014, was interpreted from the recorded data to weather conditions, old buildings’ rooftop additions, and several fire and explosion incidents. We excluded ten collapsed buildings from our study processing, because they collapsed due to fire, explosion, and car accidents. Then, incidents were classified based on the collapse degree. Whole building collapse was classified as the highest collapse level of 4. Buildings that have the main vertical collapsed part of it as a whole side of a building were given the second severe level of 3. Level 2 was given for a building with several collapsed parts or inner collapse, such as the stairs of the building. The lowest level of building collapse of 1 was for small collapse parts of the building that are within a room ceiling, balcony, or a wall. Buildings with collapse level 1 were excluded from our analysis, and the remaining collapsed buildings for the analysis were 68, in the period between May 2015 and December 2018.
Sentinel-1 is a C-band two-satellite constellation radar sensor; Sentinel-1A and 1B were launched in 2014 and 2016, respectively. Sentinel-1 data are provided as open-access data with global coverage. It has a geometric resolution of approximately 5 m in range and 20 m in azimuth [21]. In comparison to high-resolution X-band sensor data, the longer wavelength and the moderate geometric resolution result in fewer PS points on each building. However, the density of PS points we found is enough for our study to reach a conclusion on the spatiotemporal patterns related to building collapse incidents in the city. We used the same dataset of Sentinel-1 (S1) Single Look Complex (SLC) of our previous study [18] for the PS-InSAR processing in Alexandria. This dataset consists of 124 ascending images and 129 descending images with an average temporal baseline of 12 days, acquired in the period between January 2015 and May 2019. Additionally, secondary data of a soil map, areas of former lakes and lagoon (FLL), and the historical evolution of the city extent were collected for correlation test purposes.
2.2. PS-InSAR Processing and Vertical Velocity Decomposition
With a deformation estimation of millimeter precision, PS-InSAR allows for detecting miniature surface deformation surrounding collapsed buildings before the incident. The PS-InSAR technique relies on the identification of objects smaller than the resolution cell that remained coherent and highly scattered in all the stack’s images. The processing of PS-InSAR overcomes temporal decorrelation and phase unwrapping problems by forming a network to separate signals of the atmospheric phase screen (APS), topographic errors, and deformation by spatiotemporal filtering [4].
In this study, we used the SAR PROcessing tool by periZ (SARPROZ) [22]. The process started by selecting an appropriate master image. In this step, we avoid any extreme weather conditions and select a master image with the smallest possible normal baseline. After extracting slave images based on the master one, the coregistration process started. We used a standard PS-InSAR approach, with a threshold of 0.2 for the amplitude stability index, but with a flowered tree graph connection for APS estimation. The estimation of the linear trend was limited between ±160 mm and the estimation of the residual topographic error between ±220 m. We selected the reference point in a stable area based on our background knowledge of the study area, and based on estimated parameter graphs during APS extraction. We also tried to select close reference points for LOS deformation estimation for an effective vertical velocity decomposition process. Finally, to define stable PS points in our study, we selected those points with a temporal coherence of 0.7 or higher.
We used the residual LOS velocity of each image in ascending and descending orbits to decompose a vertical deformation time series. Decomposing vertical velocity by integrating two cross-heading orbits avoids the limitation of the LOS measurements and gives a chance to distinguish vertical and horizontal motion effectively [23]. Each image of an orbit was integrated into its closest image in the other orbit. The time difference was four days in the case of the same S1 sensor (S-1A or S-1B) and two days when using both sensors. The LOS residual velocity of image points were used to interpolate the residual LOS velocity in the city area on that day based on a grid with a pixel size of five meters, which produced a detailed surface of deformation for the city, then integrated to the closest interpolated LOS residual velocity of the other orbit to decompose vertical velocity by using the matrix presented in Equations (1) and (2) [24].
where
d is the deformation along LOS for ascending and descending , is the vertical velocity, is the projection of horizontal deformation in descending azimuth look direction, θ is the incident angle, and ∆α is the satellite heading difference between ascending and descending mode.
2.3. Spatiotemporal Analysis of Collapsed Buildings
With the increasing number of sensors and geospatial data availability worldwide, spatiotemporal data mining becomes an important method to extract new interesting and useful patterns from geographical data [15,16]. However, extracting meaningful spatiotemporal patterns is more difficult than extracting regular patterns from traditional numeric and categorical data. The complexity of spatiotemporal data types and relationships results in challenges in data storage, management, analysis, and knowledge discovery [13,16]. Data storage in a space–time cube is one of the most effective ways to manage and analyze spatiotemporal patterns. Points are aggregated into so-called bins, based on their location and time, where each bin has a specific location. All bins within the same time create a time step (or slice), and time data of each bin creates a bin time series. Each bin has input points based on its location within the bin size and the time step interval. The oldest time step is at the bottom of the cube while the upper time step represents the most recent time data [25].
In this study, we converted the vertical velocity maps of Alexandria for the last 120 days before the collapse incident to points with their corresponding dates. A buffer of 200 meters from the collapsed building was created for processed points to reduce the processing time of each incident. A netCDF data structure cube was then created with a bin size of ten meters and a time step interval of twelve days. The bin size was selected as twice the size of the previously processed vertical velocity maps for Alexandria (5 m). Furthermore, the time step interval value was selected based on the average of Sentinel-1 data availability average over the city during the study period. In case of no data availability for a specific time step, we decided to spatially and temporally interpolate bin values of the slice based on the mean of space–time neighbors.
A Mann–Kendall trend test [26,27] was calculated during the space–time cube creation to investigate the time series trend of each bin. It simply compares the bin value to the previous one. If it is smaller, its result is –1, if it is larger, its result is +1, and if the two bins are equal, then the result is 0. The results of all pairs in the space–time cube are then summed for each bin. If the sum is zero, then it means no trend over time was detected. The other bins are compared to the no-trend ones based on the variance for the values in the bin time series, the number of ties, and the number of time steps to measure its statistical significance based on z-score and p-value with confidence levels. The p-value of a bin indicates whether it is statistically significant or not, while the z-score shows if the trend is positive or negative based on the increase or decrease of bin values, respectively [28,29].
We used the netCDF space–time cube to extract spatiotemporal patterns of vertical velocity surrounding collapsed buildings by using emerging hot spot analysis. It is a regular hot spot analysis with the addition of time as a third dimension [28]. Emerging hot spot analysis [30,31] calculates the Getis–Ord Gi* statistic based on the neighborhood in space (bins in the same time step), and time (bins in different time steps) [32]. A simple form of the Gi* statistic as defined by Getis and Ord [31]:
where Gi* is a statistic that describes the spatial dependency of the incident i over all n events, is the magnitude of variable x at incident location j over all n (j may equal i), and is a weight value between event i and j that represents their spatial interrelationship.
In this study, we kept the default value of neighborhood distance, which was about 30 meters, and selected one neighborhood time step for the emerging hot spot analysis. The emerging hot spot analysis adds a hot spot classification to all bins in the cube. Trends of hot and cold spots over time are estimated using the Mann–Kendall trend test. The spatiotemporal patterns are then evaluated based on z-score and p-value that previously estimated during the space–time cube processing, and the hot spot z-score and p-value that processed in the emerging hot spot analysis. Patterns with their statistical significance interpretation are presented in Table 1.

Table 1.
Patterns resulted from emerging hot spot analysis [31].
Spatiotemporal patterns of vertical motion within a distance of 200 m from collapsed buildings were defined. We focused on similar patterns within 50 m of collapsed buildings for our final results. The knowledge of similar spatiotemporal patterns of vertical motion in collapsed buildings areas of 2015 and 2016 was then used to define temporal building collapse vulnerability ranks between January 2017 and May 2019. However, due to the large area of the city, we decided to decrease the vulnerability mapping area of interest based on historical building collapse incidents in the city between 2001 and 2016.
2.4. Correlation Tests
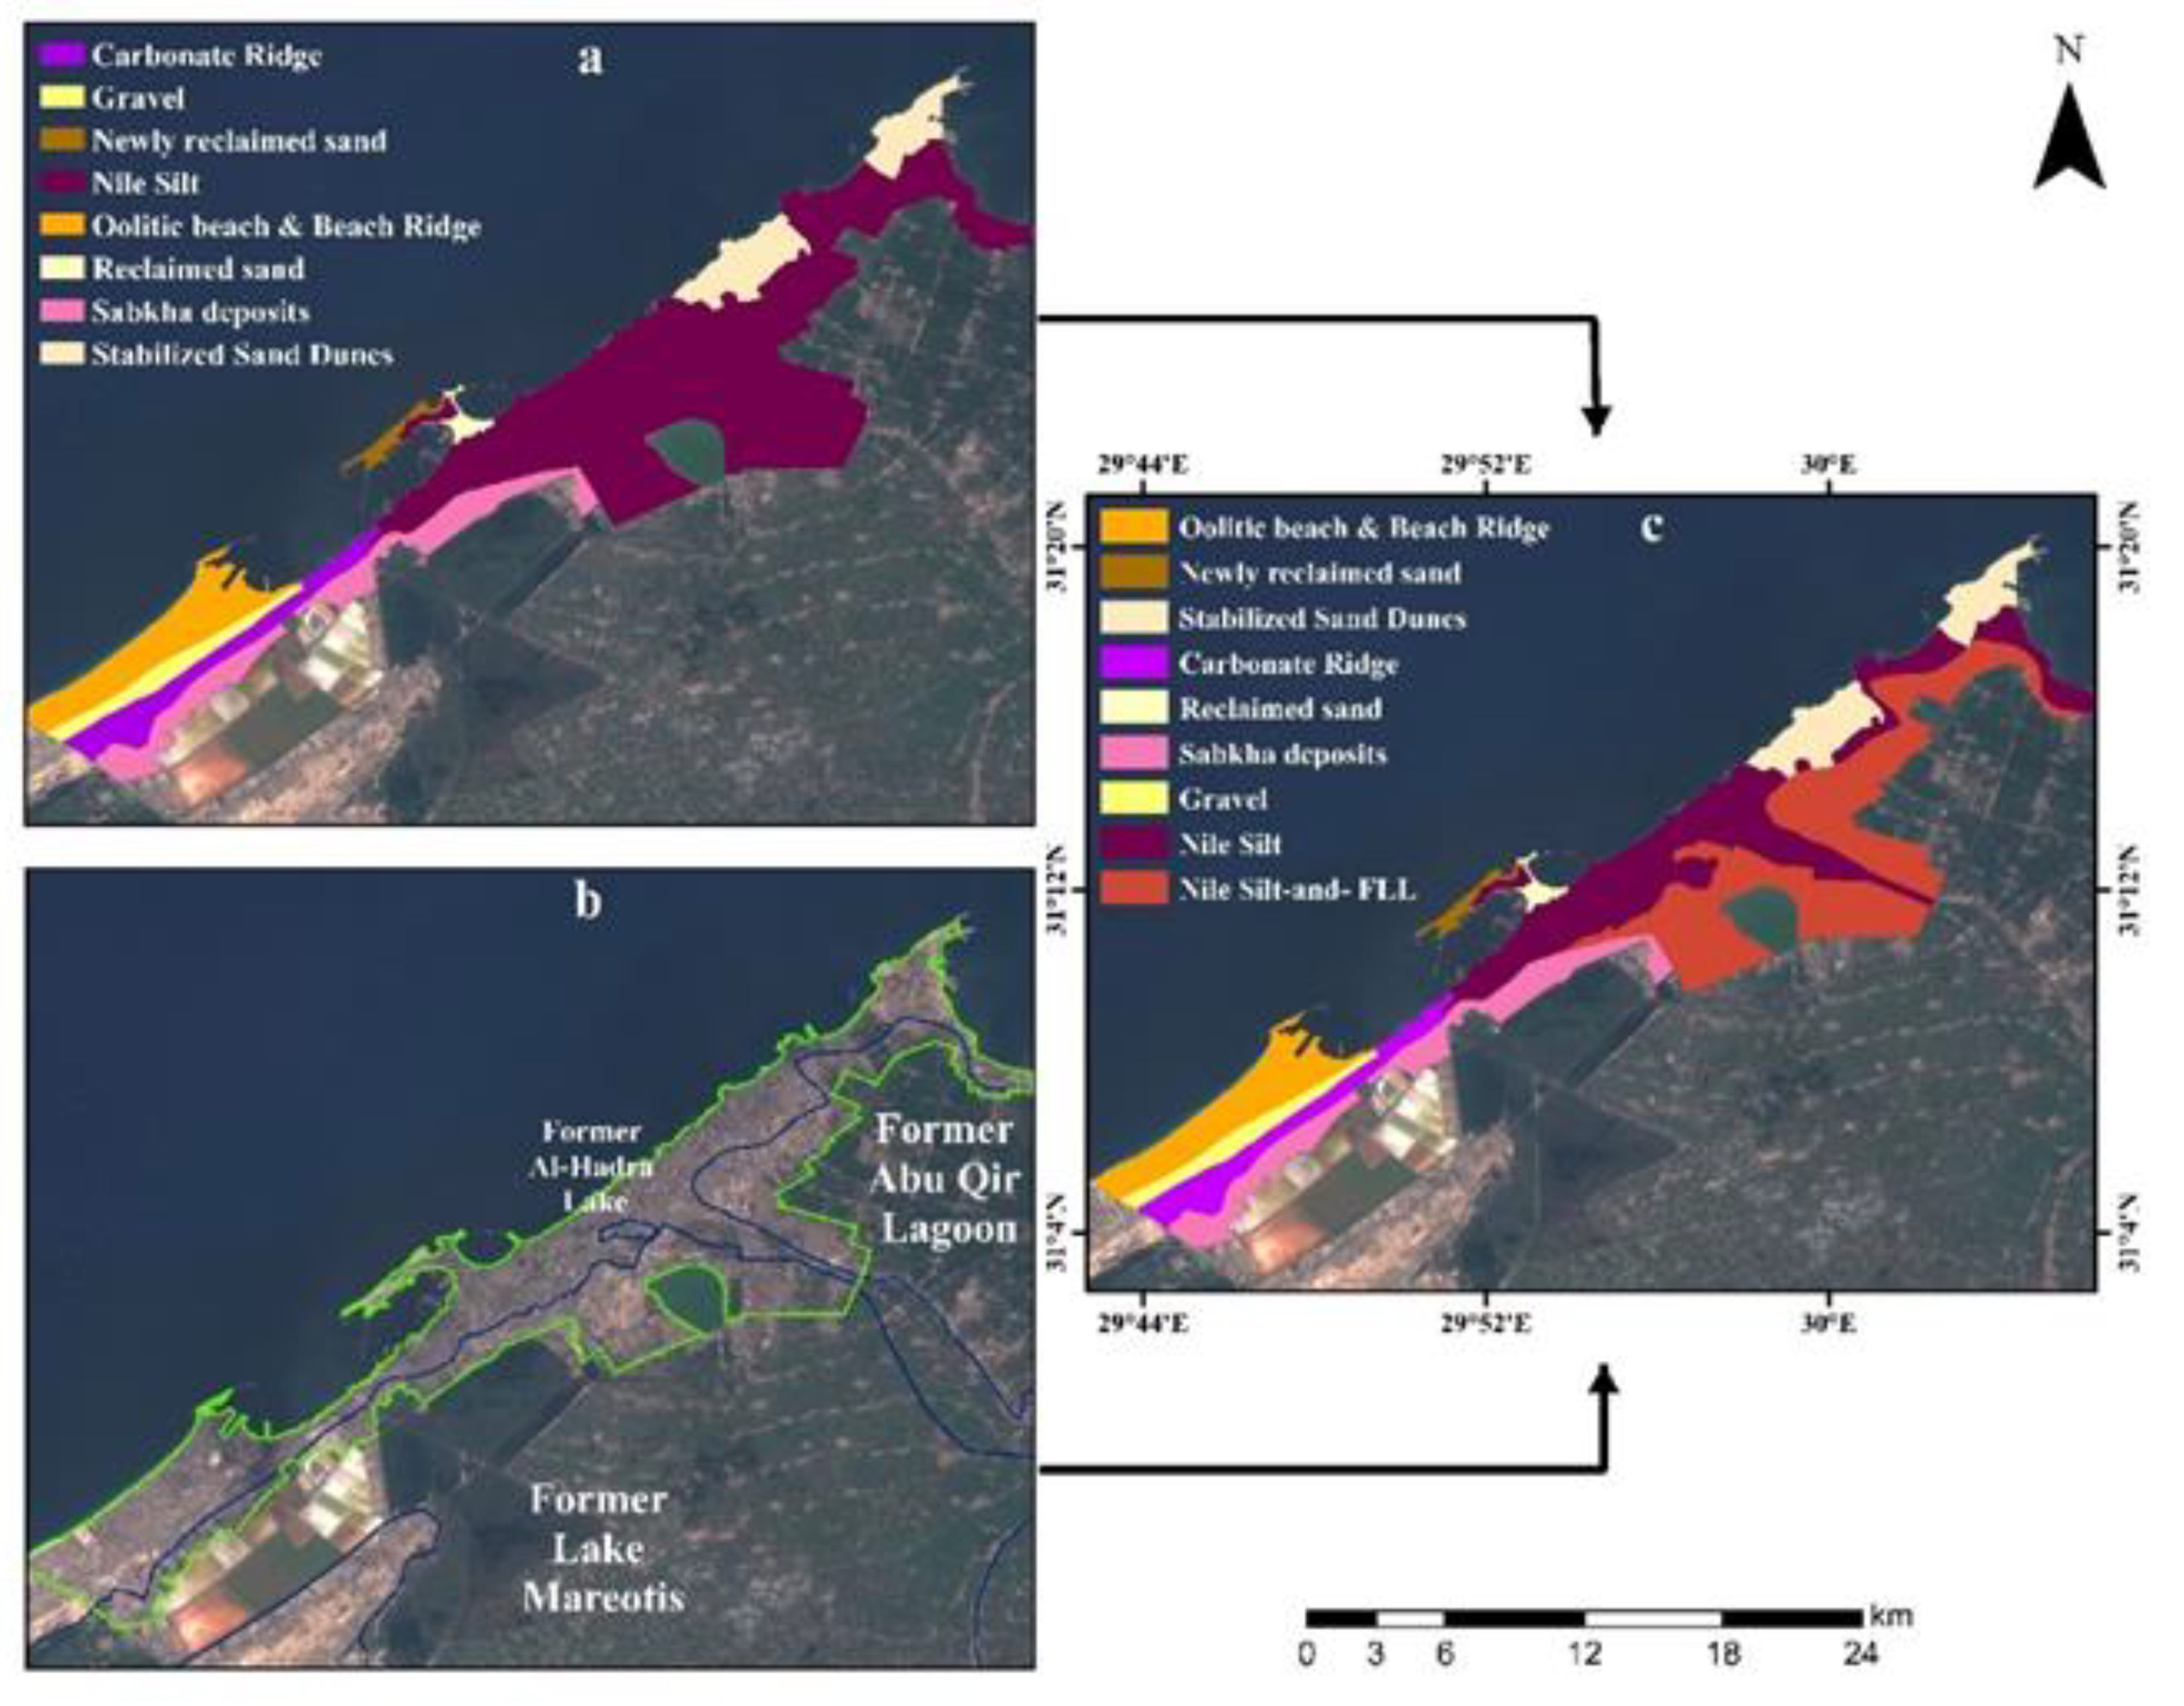
Secondary data sources were used to test our results’ correlation to some spatial features in the city: the lithology map and the historical extent of the city since its establishment. The lithology map was produced by integrating the city soil map and the formal lakes and lagoon map. For more information on secondary data sources, please refer to Mohamadi et al. [18]. Figure 3 presents the integration process of soil map and FLL map to present the lithology map of Alexandria City.
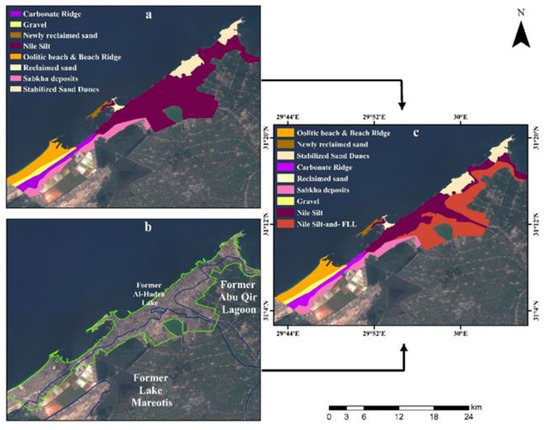
Figure 3.
Lithology map integration for Alexandria City: (a) soil map, (b) former lakes and lagoon distribution, and (c) lithology map.
The soil map, FLL map, and resulting lithology map of Alexandria are illustrated in Figure 3a–c. The main change in the lithology map from the soil map can be found in the Nile Silt soil. It was divided into two parts: Nile silt soil with and without former lakes and lagoon. Additionally, we classified building collapse incidents based on dates to months and seasons, and test the correlation between these two time-data types and our spatiotemporal pattern results.
2.5. Validation
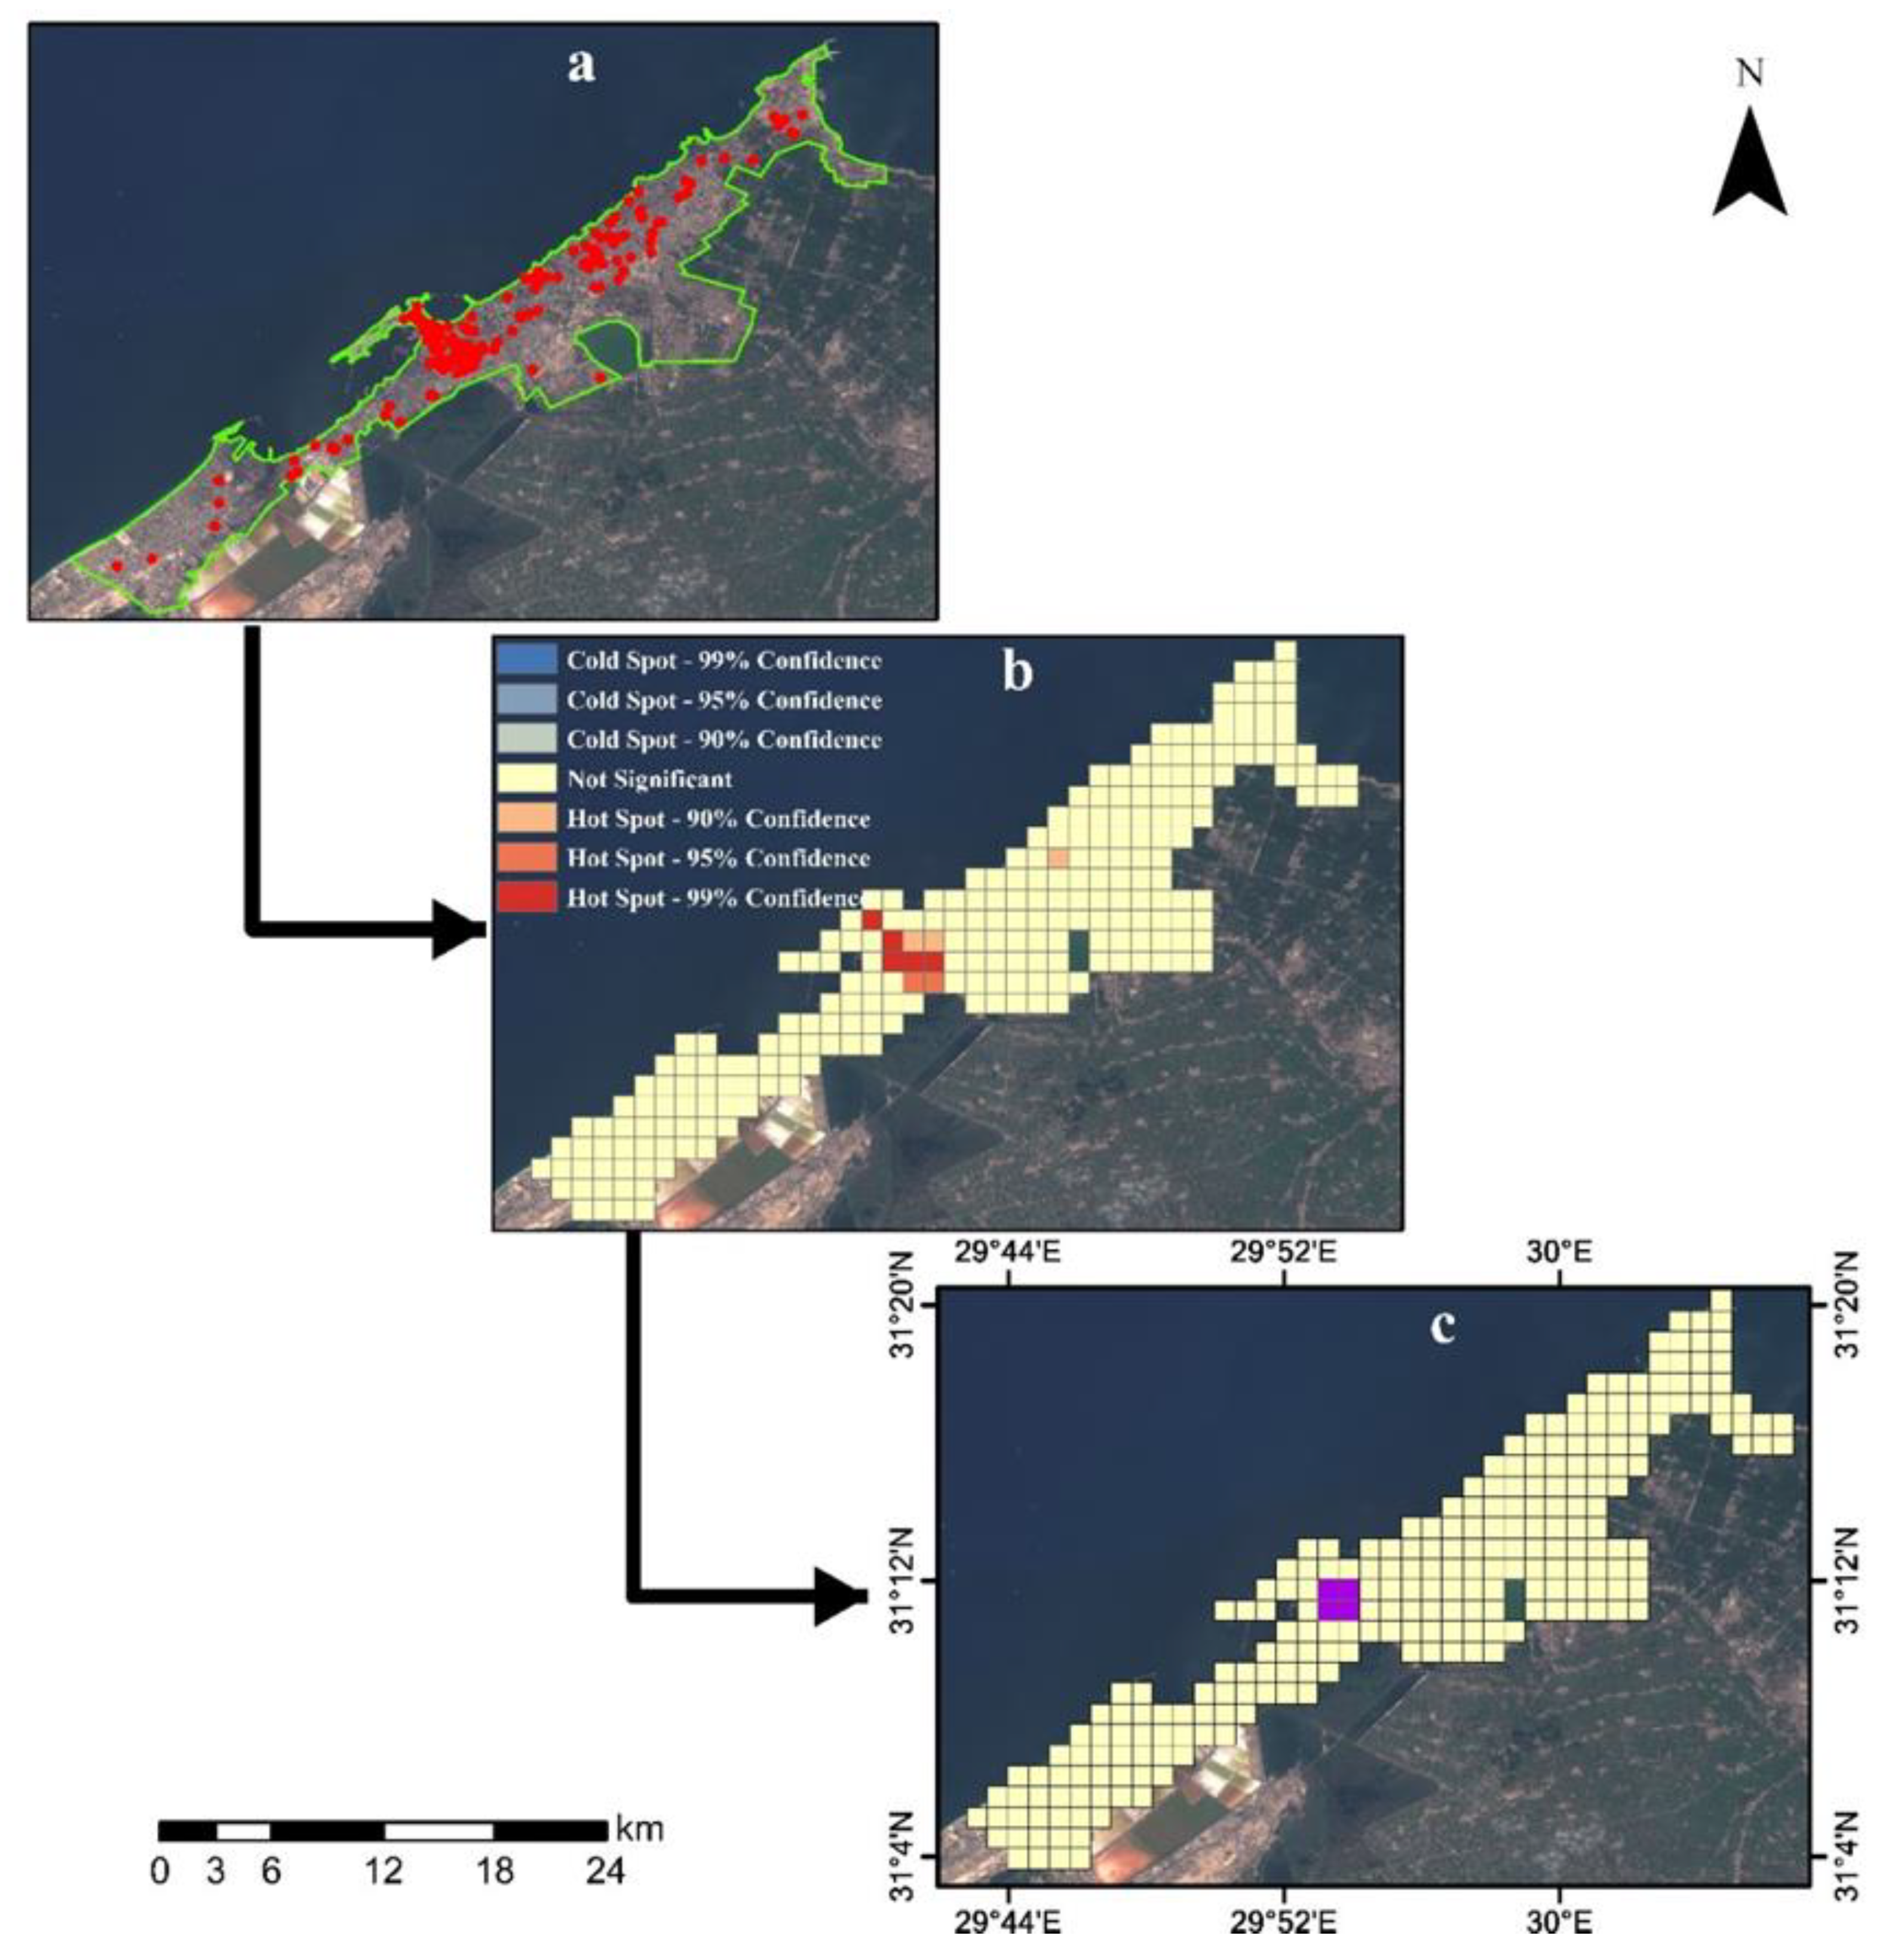
A one square kilometer grid was created for the city, used for the collected building collapse data between 2001 and 2018 to count incidents in each square kilometer, and produced a hot spot map of building collapse in Alexandria during this period. We then selected a four square kilometer area-of-interest (AOI) based on the hot spot analysis for the validation process. Distribution of collapsed buildings and hot spot analysis results are shown in Figure 4a,b.
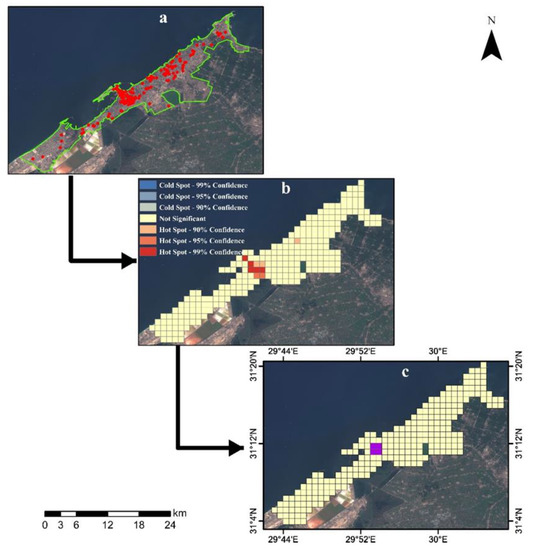
Figure 4.
Selection procedure validating the area of interest (AOI): (a) distribution of historical building collapse incidents from January 2001 to December 2018, (b) the hot spot analysis for collapsed building incidents between 2001 and 2018, and (c) validation AOI.
We depended on collapsed buildings in the period between January and May 2019 for the study validation. In addition to the previous step of selecting an AOI for validation, we also filtered incidents within the AOI based on their collapse level. Only level 4 of collapsed buildings that refer to a whole collapsed building was selected for the validation. This filtering was used to limit the number of incidents for better and more detailed discussion of the study results. After filtering, the four remaining collapsed buildings were used for validation of our study results.
3. Results
Our working hypothesis is that spatiotemporal patterns close to collapsed areas show sudden subsidence that led the building to collapse. By applying this hypothesis to our results, the expected pattern to find a collapsed building is the “new cold spot” pattern (NCS) in the proximity of collapsed buildings. We created multibuffers of 30, 60, and 90 m around GPS points of the collapsed building, and searched for this pattern from an in-to-out direction. In general, results revealed this pattern in 32 buildings out of the 68 buildings in this study, while interpretation resulted in the existence of a “new hot spot” pattern (NHS), surrounding 34 other buildings in the study. None of these two patterns existed in only the two collapsed buildings of the study.
3.1. New Cold Spot Pattern
Table 2 presents the results of all 32 collapsed buildings with the temporal pattern of the new cold spot. Among the 68 studied collapsed buildings, about 47.1% of them have the NCS spatiotemporal pattern within the surrounding area. Fifteen of them show previous statistically hot spot bins while five have no significant hot or cold spot bins during the ten time steps tested. Other NCS temporal patterns were also detected during the 3D temporal interpretation; some collapsed buildings had NCS in the ninth time step, as seen in collapsed buildings with serial numbers between 21 and 25 in the table. Some bins continued in a significant cold spot in the last bin and some others showed a nonsignificant last bin. Two other temporal patterns were found during the interpretation: first was an NCS within the last five or six bins only, and second, an earlier NCS found in the seventh time step and continued as a significant cold spot until the tenth time step.

Table 2.
Results of collapsed buildings with a new cold spot pattern.
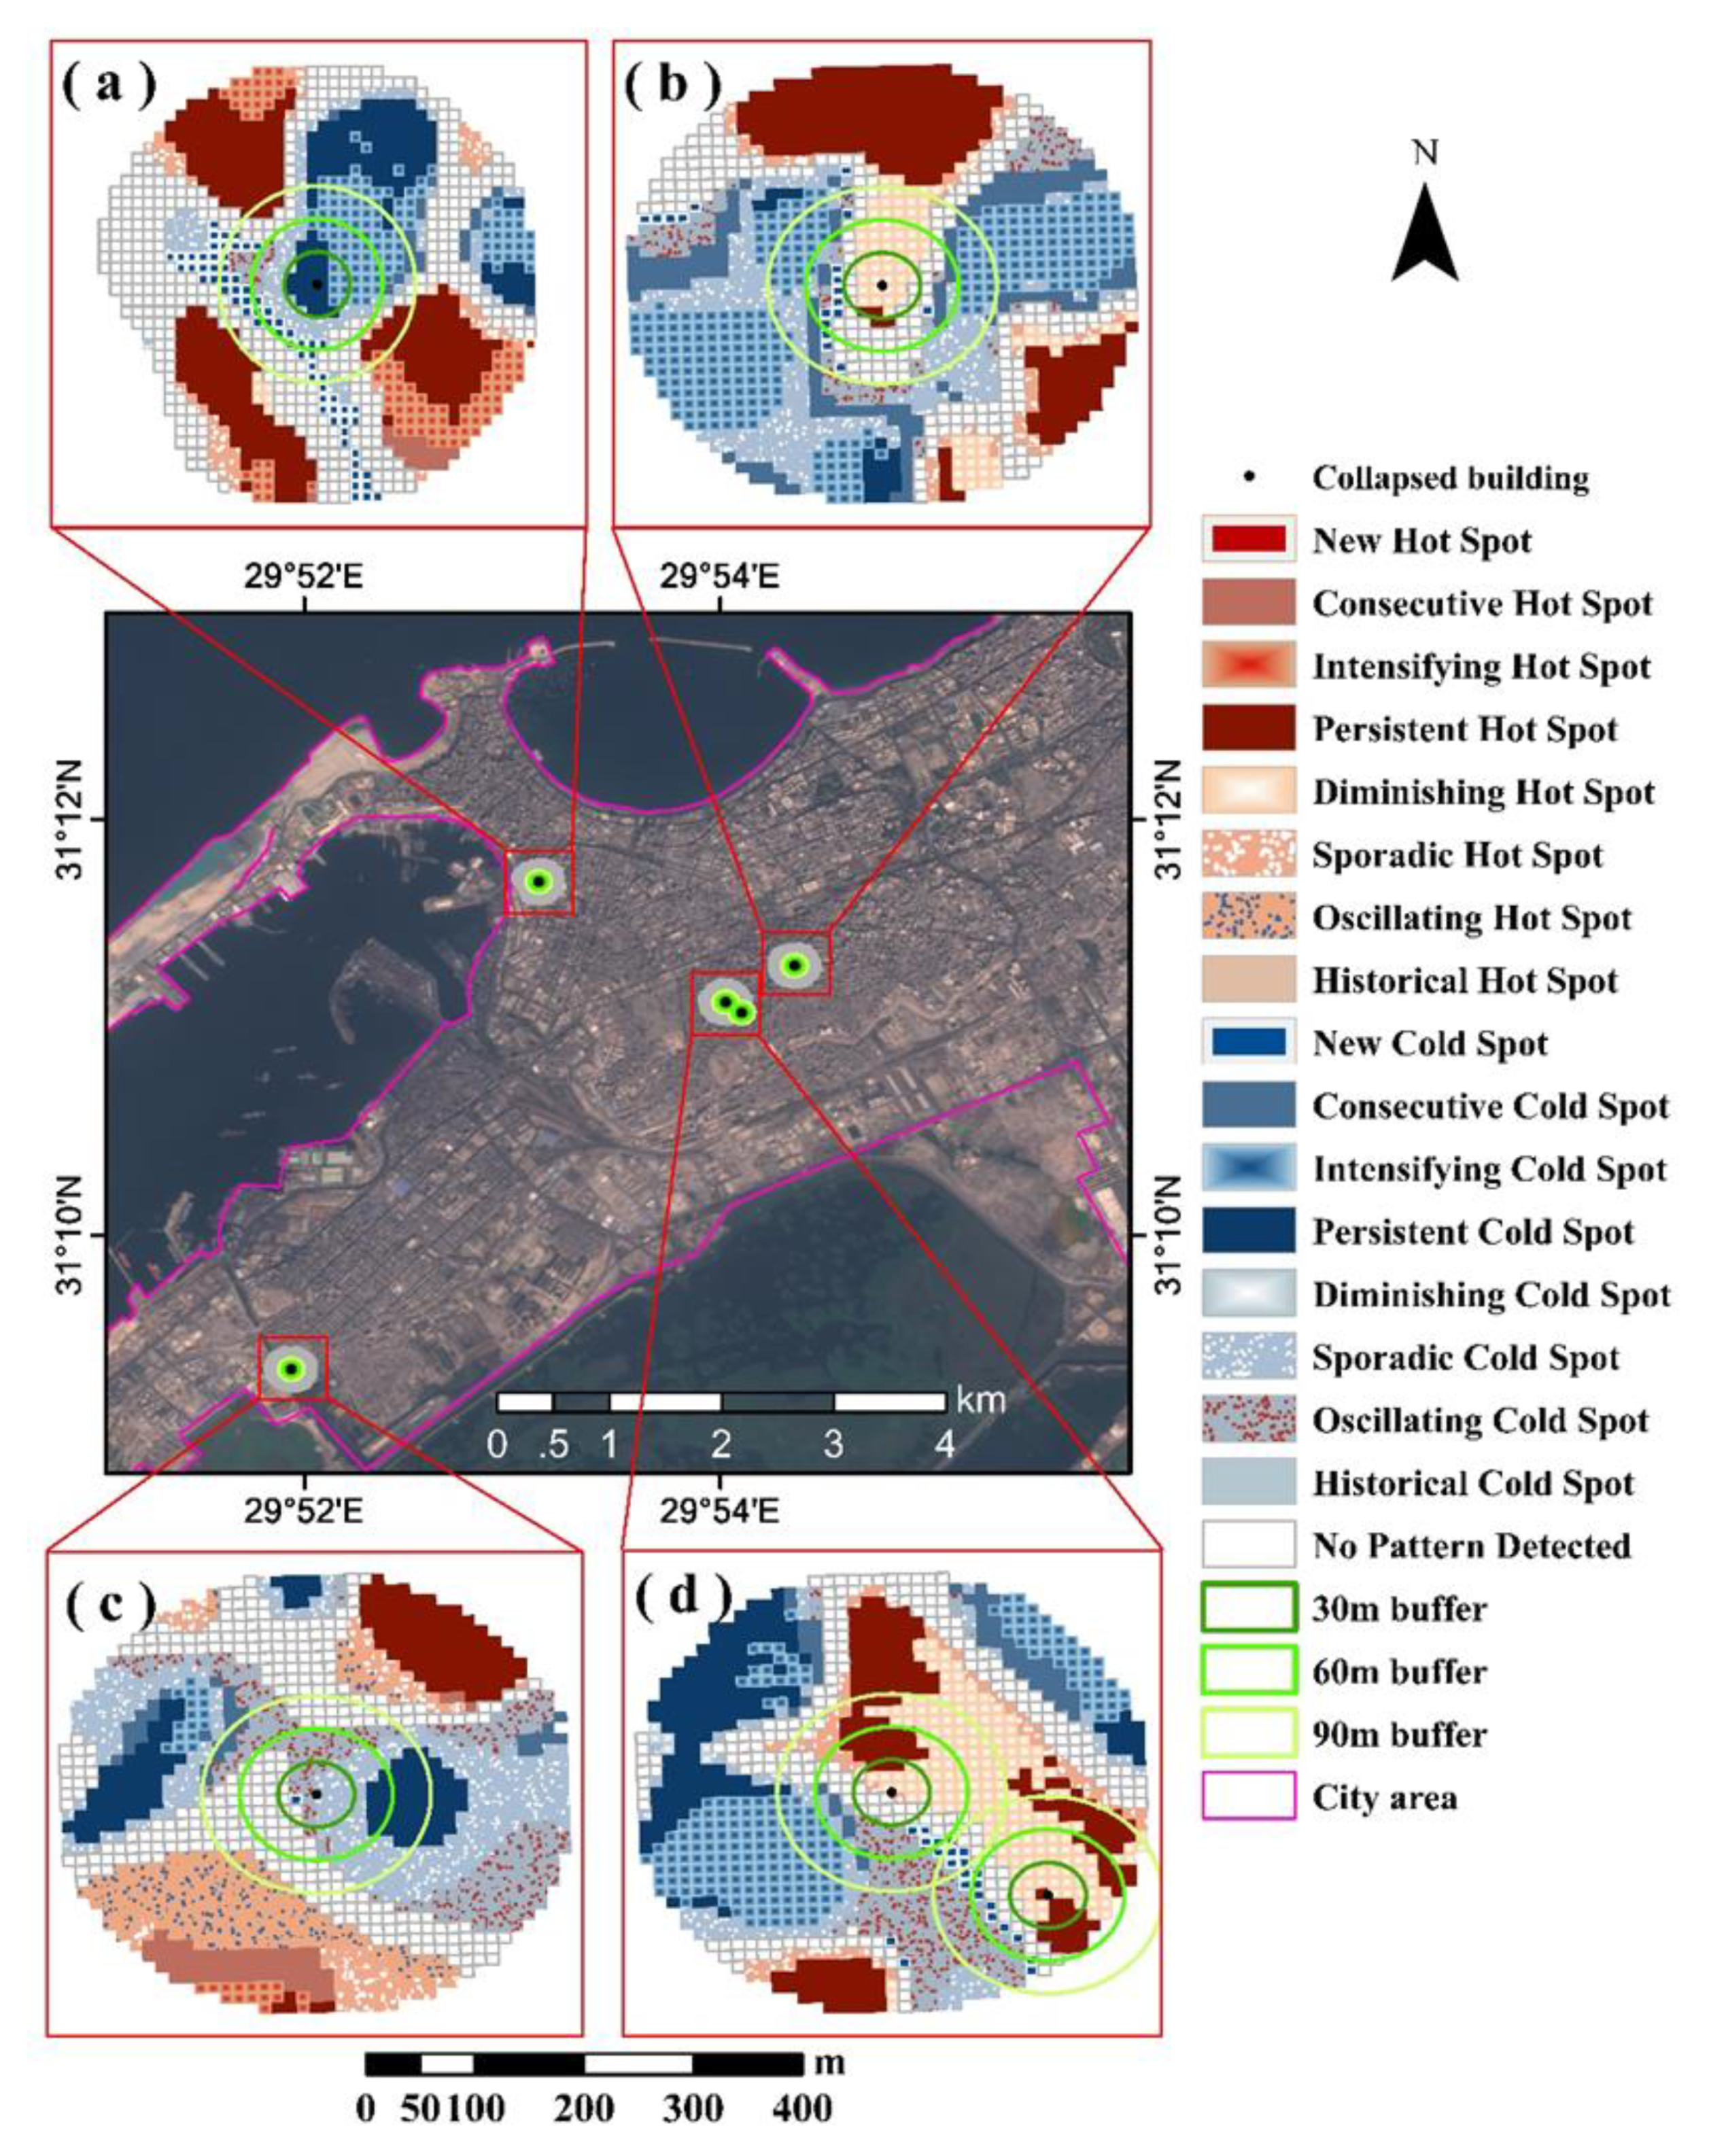
In most collapsed buildings, the NCS was found within the closest buffer of 30 m while seven collapsed buildings had the closest NCS within the second buffer of 60 m, and only four collapsed buildings had NCS in the third buffer of 90m. Additionally, the collapse level presents the severity of NCS distance to the collapsed building as nineteen of collapsed buildings in 4 and 3 collapse levels are located within 30 m of the collapsed buildings. Whereas, six of eight buildings with a collapse level 2 are out of the closest buffer of 30 m. Figure 5 presents some samples of collapsed buildings that have NCS spatiotemporal pattern before their collapse.
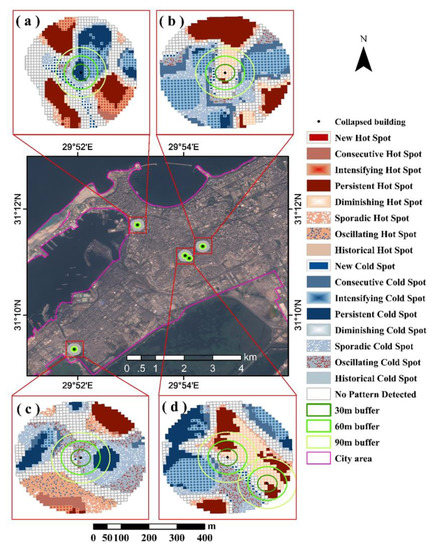
Figure 5.
Samples of collapsed buildings that have an NCS spatiotemporal pattern before their collapse. The main map shows the location of the five collapsed buildings on a true color Sentinel-2 image acquired on 24 October 2018: (a) shows the spatiotemporal analysis for a 200 m buffer of a whole building collapse on 8 August 2018, (b) is the result of a partially collapsed building on 6 November 2015, (c) illustrates the analysis result of a whole building collapse on 19 February 2016, and (d) shows results of two partial collapsed buildings on 26 December 2015 for the middle one, and 27 December 2015 for the southeastern point in the figure.
A whole building collapse on 8 August 2018 is presented in Figure 5a. Spatiotemporal analysis of the area surrounding this building shows many NCS in a linear shape two days before the incident. Figure 5b shows the analysis result for a partial building collapse on 6 November 2015. NCS are distributed on the western side of the GPS point, which matches exactly the geographic description of the collapsed part of the building in the recorded data for this incident. A single NCS that rarely exists in our results was found close to a whole building collapse on 19 February 2016; this is presented in Figure 5c. Figure 5d illustrates the results of the spatiotemporal analysis for vertical deformation surround two partial collapsed buildings; the middle one collapsed on 26 December 2015 and followed by another building collapse during the next day. The geographic description of the collapsed part of the building matches with the location of NCS, as the southern part of the building is the collapsed part. The two collapsed buildings of 6 November 2015 and 26 December 2015 are among very few collapse incidents that have a geographic description for the collapsed part. These two buildings with their geographic description of collapsed parts support the accuracy of our findings for the other buildings in this study. The other building in Figure 5d had a partial collapse in the front part of the building, which, in our opinion, is in the western part of the building, based on the geographical linear distribution of the NCS in the spatiotemporal analysis result.
3.2. New Hot Spot Pattern
Results revealed at least one NHS cell close to the collapsed building in 34 incidents before the collapse, as shown in Table 3. Cold spot bins were revealed in the temporal analysis of fourteen incidents before turning to a hot spot in the last bin prior to the collapse; while three incidents had no previous significant hot or cold spots before the final significant hot spot prior to the incident. In some cases, we found a significant hot spot bin for the first time in the ninth bin with a nonsignificant last bin. Additionally, twelve incidents of the 34 NHS had previous hot spot bins during the temporal analysis presented from incident 23 to incident 34, shown in Table 3. Some of these had earlier hot spot bins turn to significant cold spots, and ended with a significant NHS in the last five, six, and seven time steps. Others had mixed significant hot spots and nonsignificant bins, while ending with significant hot spots.

Table 3.
Results of collapsed buildings with a new hot spot pattern.
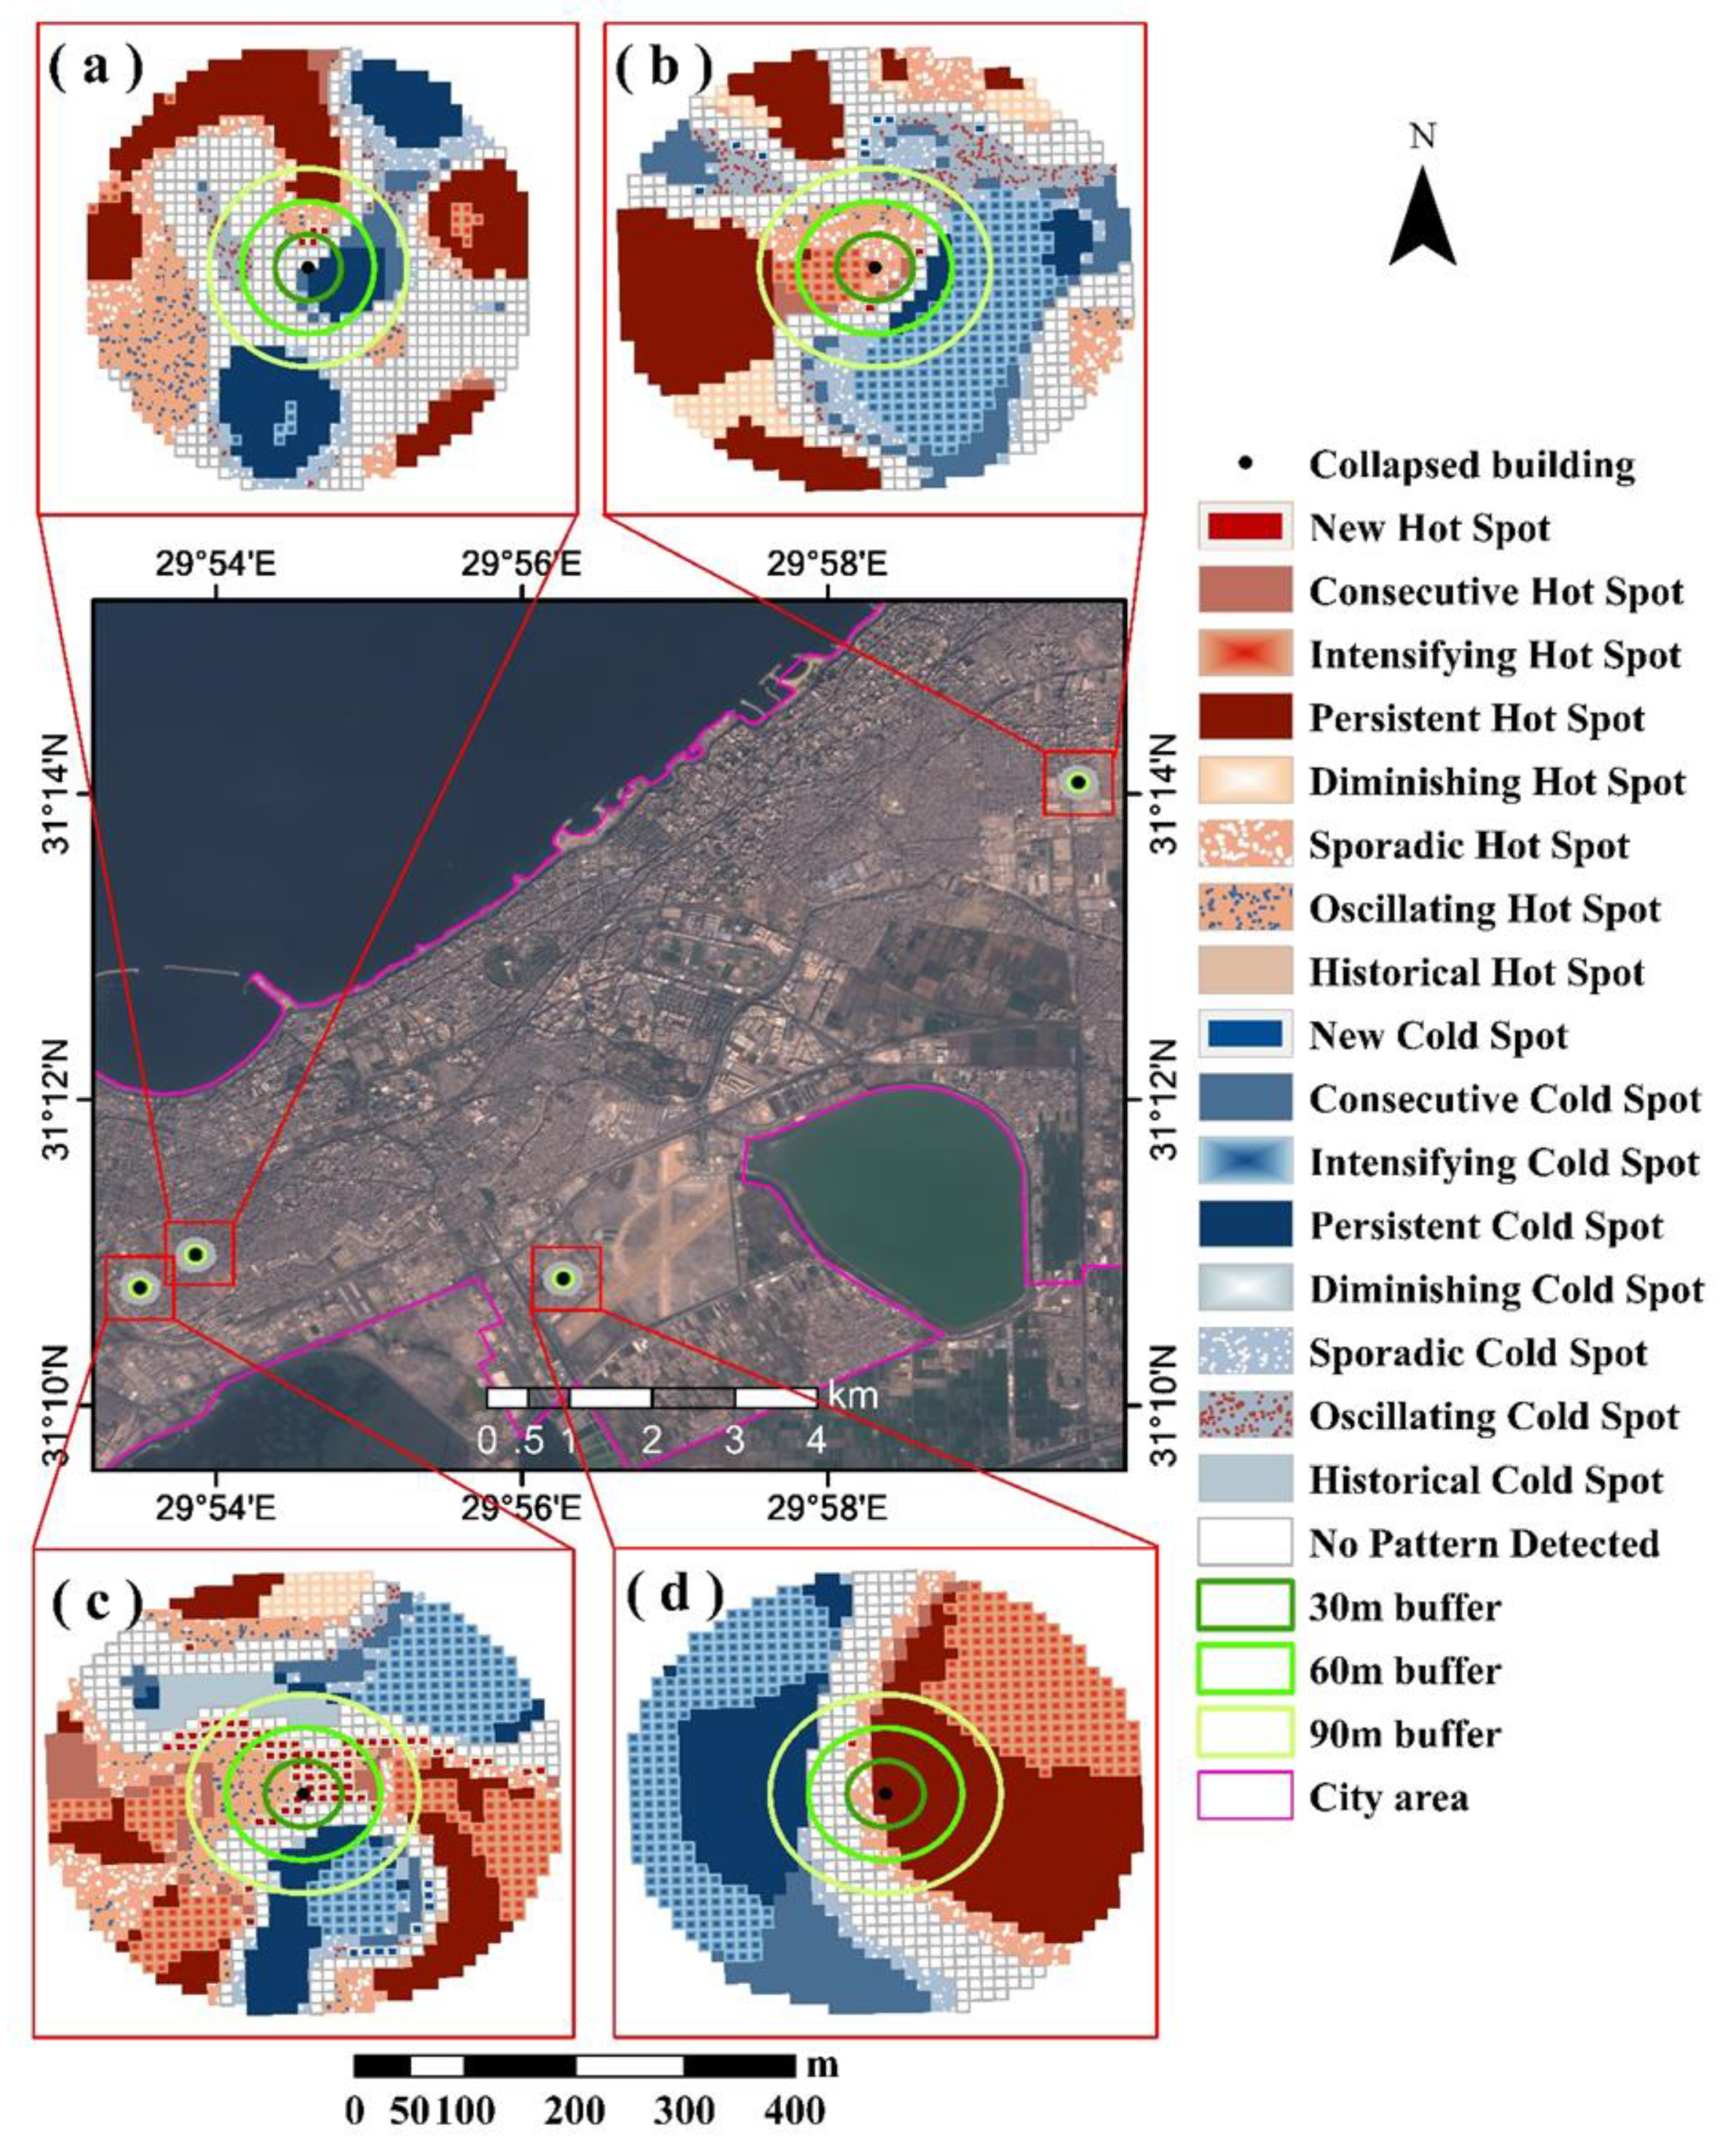
Table 3 shows a higher number of incidents of whole building collapse (level 4) that had new hot spots before the collapse in comparison to those that have new cold spots, whereas the number of buildings with collapse level 2 is half of those, which have new cold spots. This suggests a higher severity of the new hot spot pattern before the building collapse in comparison to NCS. Figure 6 illustrates some examples of new hot spot spatiotemporal patterns surround collapsed buildings before the incident.
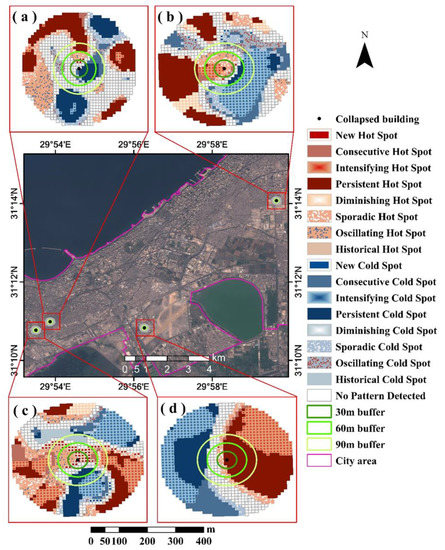
Figure 6.
Samples of collapsed buildings that have an NHS spatiotemporal pattern before their collapse. The main map shows the location of the four collapsed buildings on a true color Sentinel-2 image acquired on 24 October 2018: (a) shows the spatiotemporal analysis for a 200 m buffer of a whole building collapse on 15 August 2016, (b) is the result of a whole collapsed building on 1 May 2016, (c) illustrates the analysis result of a partial building collapse on 14 July 2016, and (d) shows the result of a whole building collapse on 22 January 2017.
Three of the buildings in Figure 6 were completely collapsed, as shown in Figure 6a for a building collapse on 15 August 2016, Figure 6b for an incident on 1 May 2016, and Figure 6d for a collapsed building on 22 January 2017, and one building with a collapsed front part on 14 July 2016 (Figure 6c). Collapsed buildings were subjected to aging except the building presented in Figure 6d, which was subjected to sudden subsidence resulting in building tilt and collapse. This building was one of five other collapsed buildings have official recorded reason of subsidence, and found to have a new hotspot pattern before the incident in our spatio-temporal pattern analysis. As the subsidence was obvious in those collapsed buildings sites, that suggesting NHS may represent severe surface motion in the study area in comparison to NCS that may represent relatively gentle vertical surface motion.
3.3. Correlation Tests
We tested our results for statistical correlation to lithology, historical evolution extent of the city, season, and month of incidents by the chi-square method. None of all tested correlations were statistically significant with the two spatiotemporal patterns of our results, as shown in Table 4. However, the only potential correlation was obtained in the lithology test.

Table 4.
Correlation results.
All incidents that occurred within the stabilized sand dune soil had new hot spots in the vertical motion before the building collapse, while five of six collapsed buildings in the reclaimed sand area in the old city also had new hot spots of vertical motion before the incident. The sandy nature of those two soil types may illustrate a correlation that could be helpful in predicting building collapse. Nevertheless, this potential correlation needs further investigation for better validation.
3.4. Validation of Study Results
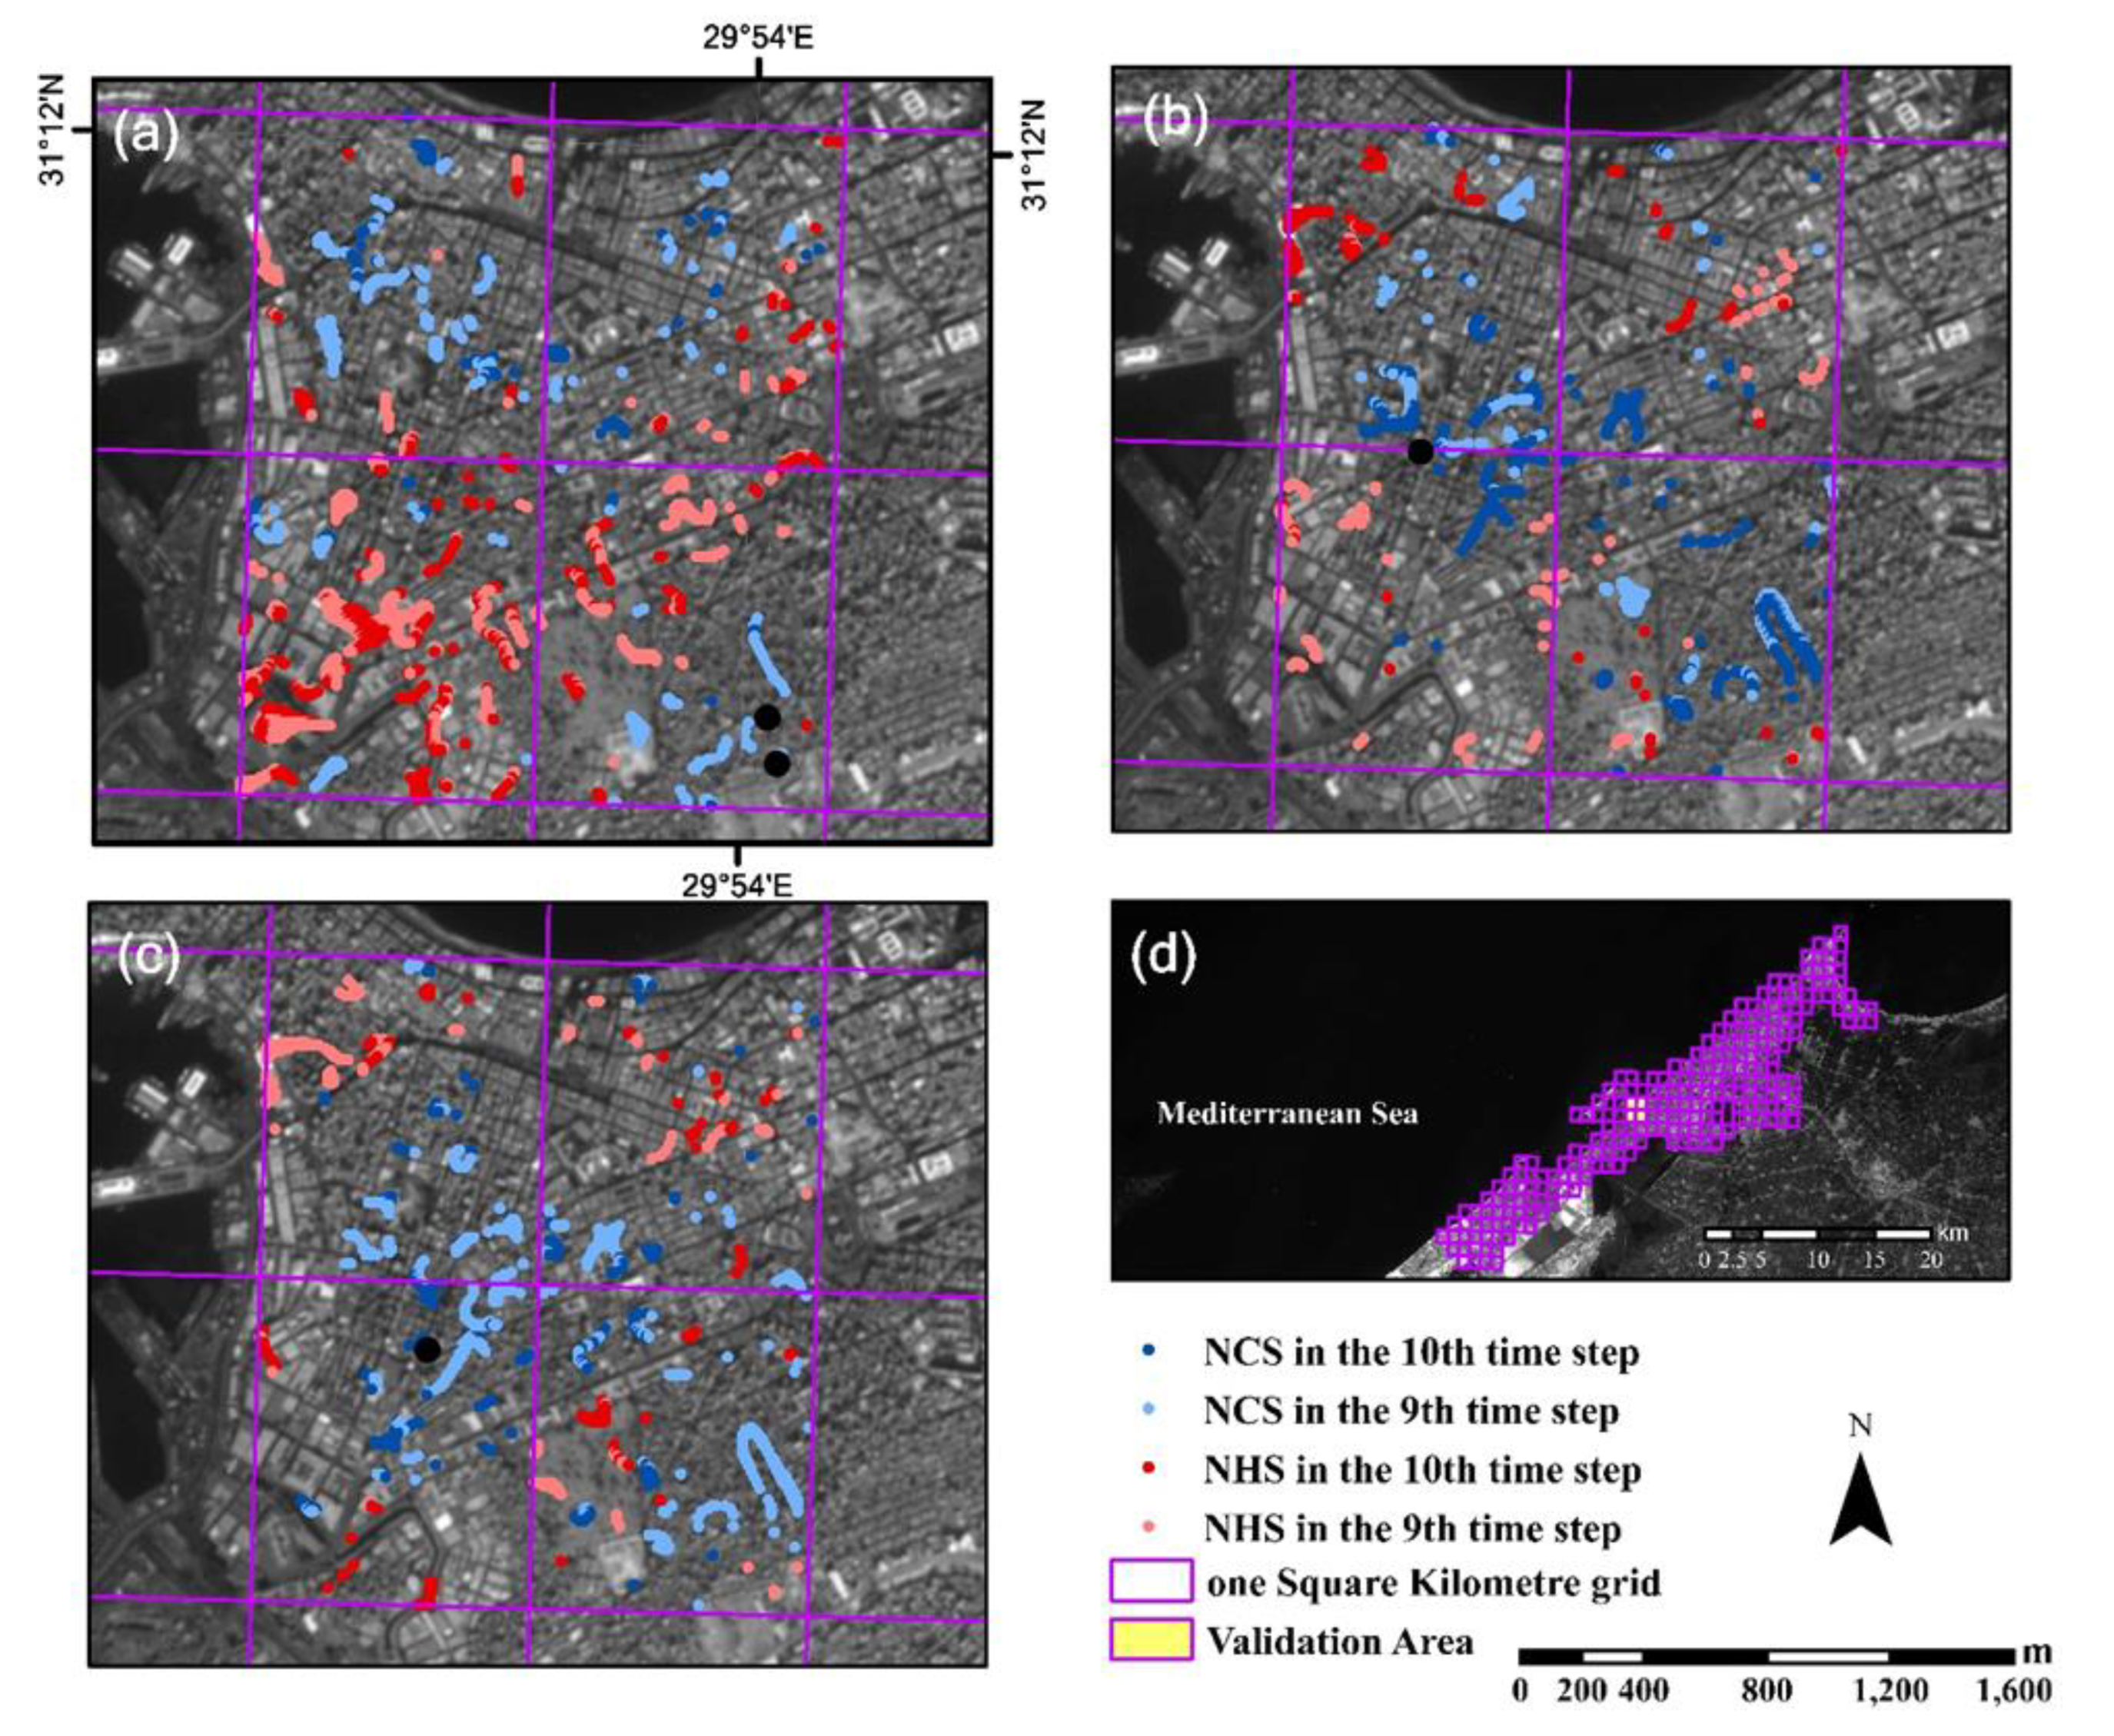
We validated our results by generating a map for points of new cold spots and hot spots in the tenth and ninth time steps for four whole collapsed buildings in 2019, as illustrated in Figure 7. These lie within an area of high collapse incidence rate in the city. The GPS points for the four buildings used in the validation process were found to be close to at least one NCS or NHS point, with distances that varied from 38 m for a collapsed building on 18 February 2019 (Figure 7a) to 75 m for a collapsed building on 22 March 2019 (Figure 7b).
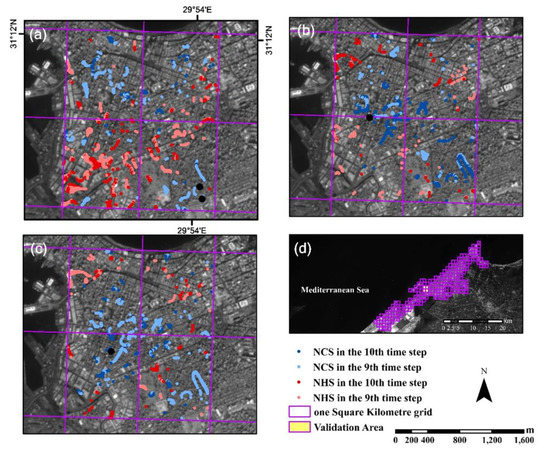
Figure 7.
Validation of the study results. Maps are presented in a stretch Sentinel-2 image acquired on 24 October 2018: (a) presents the validation test of two whole building collapses on 18 February 2019, (b) the validation result of a whole collapsed building on 22 March 2019, (c) illustrates the validation result of a whole building collapse on 1 April 2019, and (d) shows the one square kilometer grid of Alexandria, highlighting the validation area.
The two collapsed buildings of 18 February 2019 were close to new cold spots in the ninth time step, whereas the other two incidents of 22 March 2019 and 1 April 2019, presented in Figure 7c, were close to NCSs of the tenth time step. This result validated the study results since all collapsed buildings’ GPS points were within the same distance of our three buffers: 38 and 65 m for the two 18 February 2019 incidents, 41 m for the 1 April 2019 building collapse, and 75 m for the collapsed building on 22 March 2019.
4. Discussion
Building damage is one of the frequently occurring geohazards in subsidence zones [1,11]. This study attempts to understand surface vertical motion surrounding collapsed buildings before the incident. The PS-InSAR technique is used to measure the deformation time series, and spatiotemporal data analysis is used to extract surface motion patterns before the collapse. Results show that new cold spot and new hot spot are the two common spatiotemporal patterns shown before 66 buildings collapsed between May 2015 and December 2018, out of a total of 68 buildings that were studied.
Besides the high percentage of collapse incidents having at least one of these two spatiotemporal patterns close in proximity, which is 97% of the studied buildings, the rare distribution of the two spatiotemporal patterns gives confidence to the correlation obtained in this study between building collapse incidents in the city and the NCS and NHS patterns. Table 5 shows the percentage of NCS and NHS in the ninth and tenth time steps among the seventeen spatiotemporal patterns in the 4 km2 area used for the validation process presented in Section 3.4.

Table 5.
Distribution percentage of NCS and NHS patterns in the validation area.
The distribution average of NCS and NHS, including the ninth and tenth time step before collapse incident dates, is 2.6% of all spatiotemporal patterns in the four square kilometer of the validation area. The highest distribution of the two patterns was before the 18 February 2019 collapse (3.5% of the validation area), while the lowest distribution obtained was before the collapse incident on 22 March 2019 (2.1%).
The result of the existing new cold spot close to the collapsed building was expected, as it represents sudden subsidence in a very limited space in comparison to the overall velocity of the surrounding area. Although it is also representing a sudden deformation in the surrounding area of the collapsed building, results of the new hot spot pattern was unexpected. Many new hot spots related to collapsed buildings were observed in the winter of 2015, which raised the idea of surface uplift due to the accumulation of underground water and seawater surges during the rainy season of that year. This could be one reason for a new hot spot pattern surrounding collapsed buildings during that period. However, the existence of a new hot spot pattern in the dry season of summer suggested another technical explanation of related collapses. This might be a sudden relative failure on the surface that was higher than the applicability of PS-InSAR slow surface motion detection, which resulted in unwrapping error in this area, and presents the deformation at that time as uplift. However, a sudden failure in the surface cannot be detected due to its high velocity. Regardless, building collapse due to surface alternation between drought–flood seasons might be a reason for a high building collapse ratio [11] in a city like Alexandria.
Ferretti et al. analyzed the deformation time series of PS points close to collapsed buildings in Camaiore, Italy, and found clear subsidence in eight points before the collapse, which returned to random velocity after the incident. The deformation was affected by clay soil erosion and subsequent formation of cavities. In comparison, Perski et al. [10] utilized relatively more images to detect deformation before two collapse incidents in Katowice, Poland, and Moscow, Russia. However, results found no significant deformation in the time series before the collapse. Time series in [8] might include vertical and horizontal motion, which resulted in clear deformation before the collapse. While the result of deformation surrounds the two buildings in [10], it was not clear, which supports the need for further spatial analysis like what has been done in our study.
The existence of subsidence and instability of buildings on clay deposit soils is well known in similar areas [11]. However, our results revealed no correlation between extracted spatiotemporal patterns and lithology. The interaction of lithology and spatiotemporal pattern result needs more investigation in future studies for better preparation of maps showing building collapse hazard.
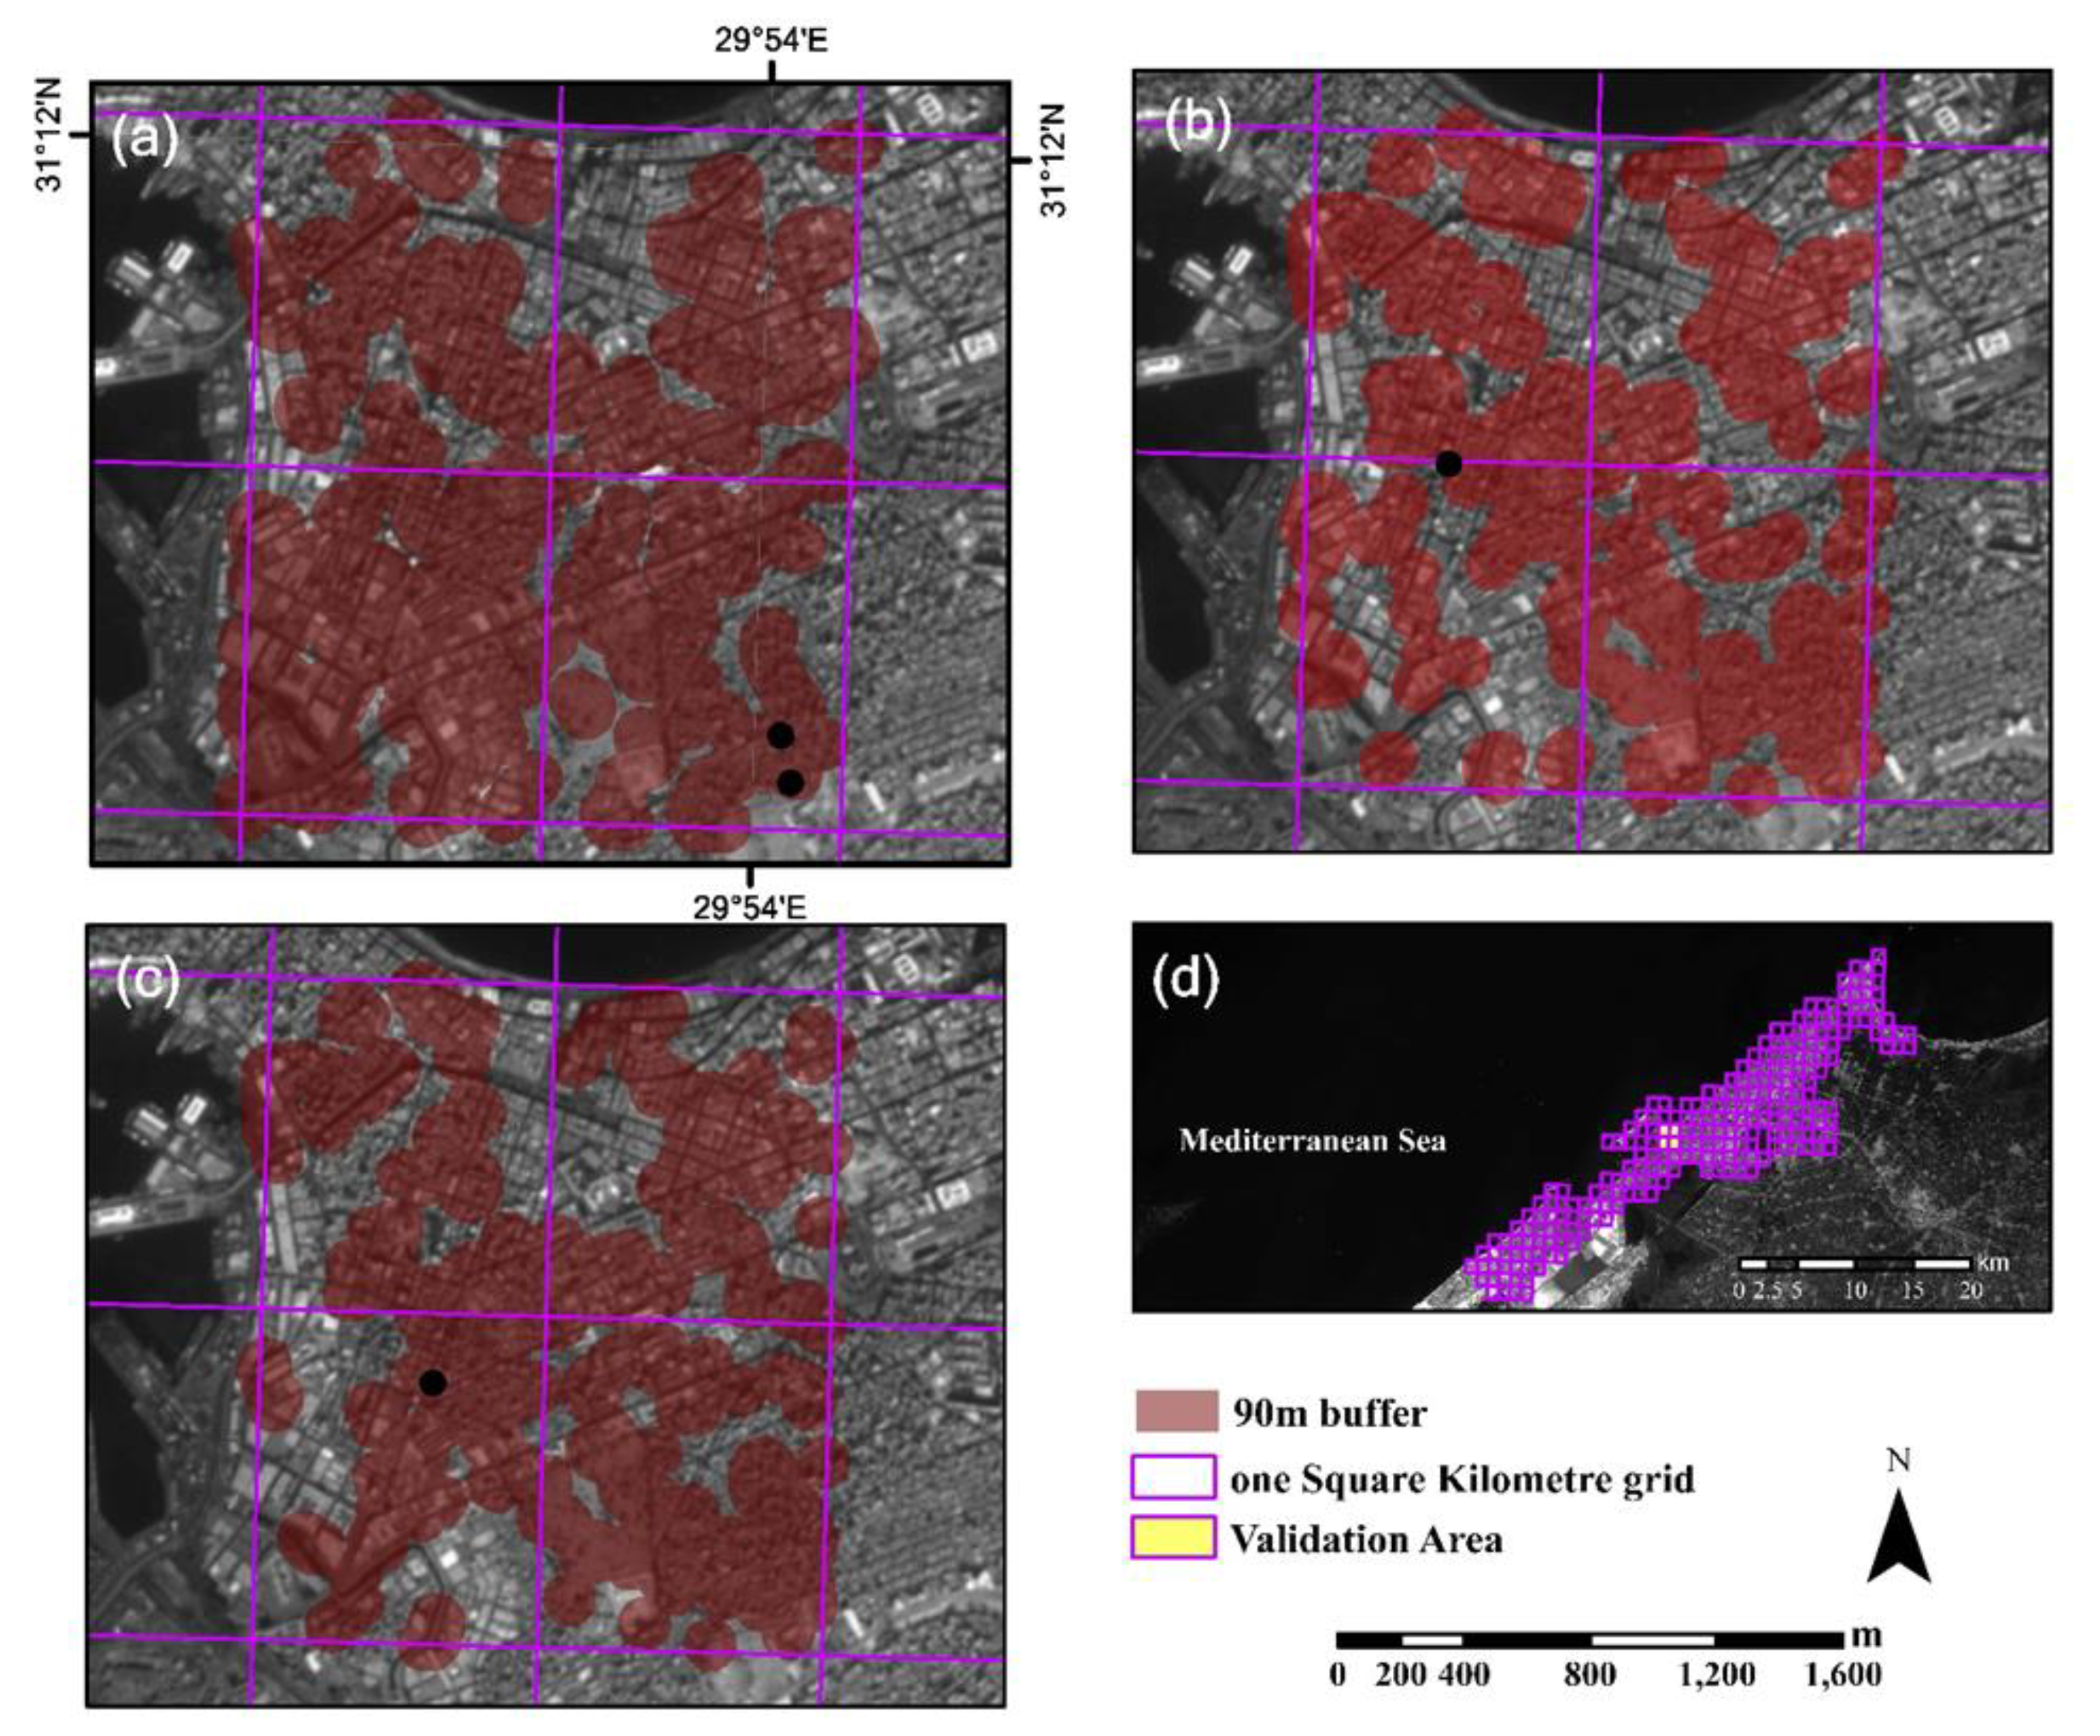
Although leveling measurement is costly and has limited time and space measurements, those measurements are still the main method to monitor building deformation [7]. The applicability of InSAR measurements to monitor building stability was confirmed in many previous studies. Here, with the help of spatiotemporal analysis, our study shows two common vertical deformations based on spatiotemporal patterns that could be used as inputs for modeling building collapse hazard. To confirm the applicability of those two patterns to initially predict collapse incidents, we applied a buffer of 90 m for new cold/hot spot points, presented in Figure 7, to check how this input layer would look. Figure 8 shows the temporal vulnerability maps of the four validation buildings that could be used as input layers for a temporal building collapse hazard model.
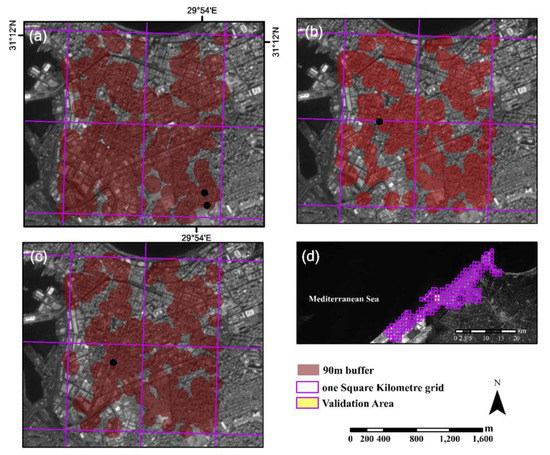
Figure 8.
Potential input layer for a building collapse hazard model. Maps are presented in a stretch Sentinel-2 image acquired on 24 October 2018: (a) building collapse vulnerability map for 18 February 2019 incidents, (b) building collapse vulnerability map for the 22 March 2019 incident, (c) illustrates building collapse vulnerability map for the 1 April 2019 incident, and (d) shows the one square kilometer grid of Alexandria with the validation area highlighted.
The four collapsed buildings were located within the temporal vulnerability map of the area, as shown in Figure 8. However, the three vulnerability map results cover more than 50% of the study area in all cases, which shows a need to further improve the prediction accuracy. Hence, more investigations and correlation tests are needed to reduce the area of vulnerability maps to their minimum distribution. Additionally, land classification would be useful to eliminate unimportant land use and land cover types from our interest, such as the large cemetery area in the mid-south of the AOI of this test. Generally, we believe this study is a step towards a comprehensive building collapse risk assessment model based on PS-InSAR deformation measurement.
5. Conclusions
This study was designed to understand the spatiotemporal patterns of vertical deformation surrounding a building before its collapse. We used the PS-InSAR technique to measure surface deformation in the LOS. Then, we decomposed vertical deformation to analyze spatiotemporal patterns around buildings before the collapse incidents. From the results two patterns could be seen before collapse—new cold spot and new hot spot patterns. The finite distribution of these two spatiotemporal patterns in only 2.6% of the area, on average, and their existence in 97% of the studied collapsed buildings, build a confidence in the relationship between building collapse and these two spatiotemporal patterns of surface vertical deformation in the city of Alexandria. Although the distribution of these two patterns is limited in number, the diffusion of the NCS and NHS in space is relatively higher. The workflow in this study succeeded in relating detection between the two patterns and building collapse, but failed to define the reason why those buildings collapsed while other buildings that have the same spatiotemporal pattern at the same time were not. We think the reason may be the situation and structure of the building itself, such as aging, violations of building specifications, and illegal extensions. However, we cannot scientifically confirm this, due to the lack of appropriate data to do that kind of analysis. To build a powerful building collapse prediction model, however, these kinds of data are necessary. Thus, this will soon be our aim to collect this type of data, analyze land use and land cover of the study area, and test more correlations to produce a model for the city of Alexandria, and test its applicability in other cities. We suggest application of our workflow in other similar areas that have high rates of building collapse incidents in subsiding areas. To find out if NCS and NHS patterns are distributed in a global, regional, or local scale, it is important to confirm the existence of these two patterns in areas surrounding buildings before their collapse.
Author Contributions
Conceptualization, B.M.; methodology, B.M.; validation, B.M. and A.Y.; formal analysis, B.M.; investigation, A.Y.; resources, T.B.; data curation, B.M.; writing—original draft preparation, B.M.; writing—review and editing, T.B.; visualization, B.M.; supervision, T.B.; project administration, T.B.; funding acquisition, T.B. All authors have read and agreed to the published version of the manuscript.
Funding
This work was supported by LIESMARS Special Research Funding.
Conflicts of Interest
The authors declare no conflict of interest.
References
- Kim, S.-W.; Choi, J.-H.; Hong, S.-H.; Lee, J.-H.; Cho, J.; Lee, M.-J. Monitoring the risk of large building collapse using persistent scatterer interferometry and GIS. Terr. Atmos. Ocean. Sci. 2018, 29, 535–545. [Google Scholar] [CrossRef]
- Ezquerro, P.; Del Soldato, M.; Solari, L.; Tomás, R.; Raspini, F.; Ceccatelli, M.; Fernández-Merodo, J.A.; Casagli, N.; Herrera, G. Vulnerability assessment of buildings due to land subsidence using InSAR data in the ancient historical city of Pistoia (Italy). Sensors 2020, 20, 2749. [Google Scholar] [CrossRef]
- Nolesini, T.; Frodella, W.; Bianchini, S.; Casagli, N. Detecting slope and urban potential unstable areas by means of multi-platform remote sensing techniques: The Volterra (Italy) case study. Remote Sens. 2016, 8, 746. [Google Scholar] [CrossRef]
- Ferretti, A.; Prati, C.; Rocca, F. Permanent scatterers in SAR interferometry. IEEE Trans. Geosci. Remote. Sens. 2001, 39, 8–20. [Google Scholar] [CrossRef]
- Novellino, A.; Cigna, F.; Brahmi, M.; Marsh, S.; Bateson, L.; Marsh, S. Assessing the feasibility of a national InSAR ground deformation map of great Britain with Sentinel-1. Geoscience 2017, 7, 19. [Google Scholar] [CrossRef]
- Comerci, V.; Vittori, E.; Cipolloni, C.; Di Manna, P.; Guerrieri, L.; Nisio, S.; Succhiarelli, C.; Ciuffreda, M.; Bertoletti, E. Geohazards monitoring in Roma from InSAR and in situ data: Outcomes of the PanGeo project. Pure Appl. Geophys. 2015, 172, 2997–3028. [Google Scholar] [CrossRef]
- Yang, K.; Yan, L.; Huang, G.; Chen, C.; Wu, Z. Monitoring building deformation with InSAR: Experiments and validation. Sensors 2016, 16, 2182. [Google Scholar] [CrossRef]
- Ferretti, A.; Ferrucci, F.; Prati, C.; Rocca, F. SAR analysis of building collapse by means of the permanent scatterers technique. In Proceedings of the IGARSS 2000. IEEE 2000 International Geoscience and Remote Sensing Symposium. Taking the Pulse of the Planet: The Role of Remote Sensing in Managing the Environment. Proceedings (Cat. No.00CH37120), Honolulu, HI, USA, 24–28 July 2002; Volume 7, pp. 3219–3221. [Google Scholar]
- Weissgerber, F.; Koeniguer, E.C.; Nicolas, J.-M.; Trouvé, N. 3D monitoring of buildings using TerraSAR-X InSAR, DInSAR and PolSAR capacities. Remote Sens. 2017, 9, 1010. [Google Scholar] [CrossRef]
- Perski, Z.; van Leijen, F.; Hanssen, R. Applicability of PS-InSAR for building hazard identification. Study of the 29 January 2006 Katowice exhibition hall collapse and the 24 February 2006 Moscow basmanny market collapse. In Proceedings of the ESA ENVISAT Symposium, Montreux, Switzerland, 23–27 April 2006. [Google Scholar]
- Chen, F.; Lin, H.; Zhang, Y.; Lu, Z. Ground subsidence geo-hazards induced by rapid urbanization: Implications from InSAR observation and geological analysis. Nat. Hazards Earth Syst. Sci. 2012, 12, 935–942. [Google Scholar] [CrossRef]
- Wu, W.; Cui, H.; Hu, J.; Yao, L. Detection and 3D visualization of deformations for high-rise buildings in Shenzhen, China from high-resolution TerraSAR-X datasets. Appl. Sci. 2019, 9, 3818. [Google Scholar] [CrossRef]
- Shekhar, S.; Jiang, Z.; Ali, R.Y.; Eftelioglu, E.; Tang, X.; Gunturi, V.M.V.; Zhou, X. Spatiotemporal data mining: A computational perspective. ISPRS Int. J. Geo-Inf. 2015, 4, 2306–2338. [Google Scholar] [CrossRef]
- Atluri, G.; Karpatne, A.; Kumar, V. Spatio-temporal data mining: A survey of problems and methods. ACM Comput. Surv. 2018, 51, 1–41. [Google Scholar] [CrossRef]
- He, Z.; Deng, M.; Cai, J.; Xie, Z.; Guan, Q.; Yang, C. Mining spatiotemporal association patterns from complex geographic phenomena. Int. J. Geogr. Inf. Sci. 2019, 34, 1162–1187. [Google Scholar] [CrossRef]
- Ansari, M.Y.; Ahmad, A.; Khan, S.S.; Bhushan, G. Mainuddin Spatiotemporal clustering: A review. Artif. Intell. Rev. 2019, 53, 2381–2423. [Google Scholar] [CrossRef]
- Beladam, O.; Balz, T.; Mohamadi, B.; Abdalhak, M. Using PS-InSAR with Sentinel-1 images for deformation monitoring in Northeast Algeria. Geoscience 2019, 9, 315. [Google Scholar] [CrossRef]
- Mohamadi, B.; Balz, T.; Younes, A. A model for complex subsidence causality interpretation based on PS-InSAR cross-heading orbits analysis. Remote Sens. 2019, 11, 2014. [Google Scholar] [CrossRef]
- Stanley, J.D.; Toscano, M.A. Ancient archaeological sites buried and submerged along Egypt’s Nile delta coast: Gauges of Holocene delta margin subsidence. J. Coast. Res. 2009, 25, 158–170. [Google Scholar] [CrossRef]
- Ahram Online. Building Collapse in Alexandria. Available online: http://english.ahram.org.eg (accessed on 8 August 2018).
- Torres, R.; Snoeij, P.; Geudtner, D.; Bibby, D.; Davidson, M.; Attema, E.; Potin, P.; Rommen, B.; Floury, N.; Brown, M.; et al. GMES Sentinel-1 mission. Remote Sens. Environ. 2012, 120, 9–24. [Google Scholar] [CrossRef]
- Perissin, D.; Wang, Z.; Wang, T. The SARPROZ InSAR tool for urban subsidence/manmade structure stability monitoring in China. In Proceedings of the ISRSE, Sidney, Australia, 10–15 April 2011; Volume 1015. [Google Scholar]
- Crosetto, M.; Monserrat, O.; Cuevas-González, M.; Devanthéry, N.; Crippa, B. Persistent Scatterer Interferometry: A review. ISPRS J. Photogramm. Remote Sens. 2016, 115, 78–89. [Google Scholar] [CrossRef]
- Samieie-Esfahany, S.; Hanssen, R.; van Thienen-Visser, K.; Muntendam-Bos, A. On the effect of horizontal deformation on InSAR subsidence estimates. In Proceedings of the Fringe 2009 Workshop, Frascati, Italy, 30 November–4 December 2009; Volume 30. [Google Scholar]
- ESRI. Create Space Time Cube by Aggregating Points. Available online: https://desktop.arcgis.com/en/arcmap/latest/tools/space-time-pattern-mining-toolbox/create-space-time-cube.htm (accessed on 21 April 2020).
- Kendall, M.; Gibbons, J.D. Rank Correlation Methods, 5th ed.; Griffin: London, UK, 1990. [Google Scholar]
- Mann, H. BNonparametric tests against trend. Econometrica. J. Econom. Soc. 1945, 13, 245–259. [Google Scholar] [CrossRef]
- Harris, N.L.; Goldman, E.; Gabris, C.; Nordling, J.; Minnemeyer, S.; Ansari, S.; Lippmann, M.; Bennett, L.; Raad, M.; Hansen, M.; et al. Using spatial statistics to identify emerging hot spots of forest loss. Environ. Res. Lett. 2017, 12, 024012. [Google Scholar] [CrossRef]
- ESRI. How Create Space Time Cube by Aggregating Points works. Available online: https://desktop.arcgis.com/en/arcmap/latest/tools/space-time-pattern-mining-toolbox/learnmorecreatecube.htm#ESRI_SECTION1_F1EA94A3BA8940E0B56AB08A302D1C08 (accessed on 22 April 2020).
- Ord, J.K.; Getis, A. Local spatial autocorrelation statistics: Distributional issues and an application. Geogr. Anal. 1995, 27, 286–306. [Google Scholar] [CrossRef]
- Getis, A.; Ord, J.K. The analysis of spatial association by use of distance statistics. In Perspectives on Spatial Data Analysis; Springer: Berlin/Heidelberg, Germany, 2010; pp. 127–145. [Google Scholar]
- ESRI. How Emerging Hot Spot Analysis Works. Available online: https://desktop.arcgis.com/en/arcmap/latest/tools/space-time-pattern-mining-toolbox/learnmoreemerging.htm (accessed on 22 April 2020).
© 2020 by the authors. Licensee MDPI, Basel, Switzerland. This article is an open access article distributed under the terms and conditions of the Creative Commons Attribution (CC BY) license (http://creativecommons.org/licenses/by/4.0/).

