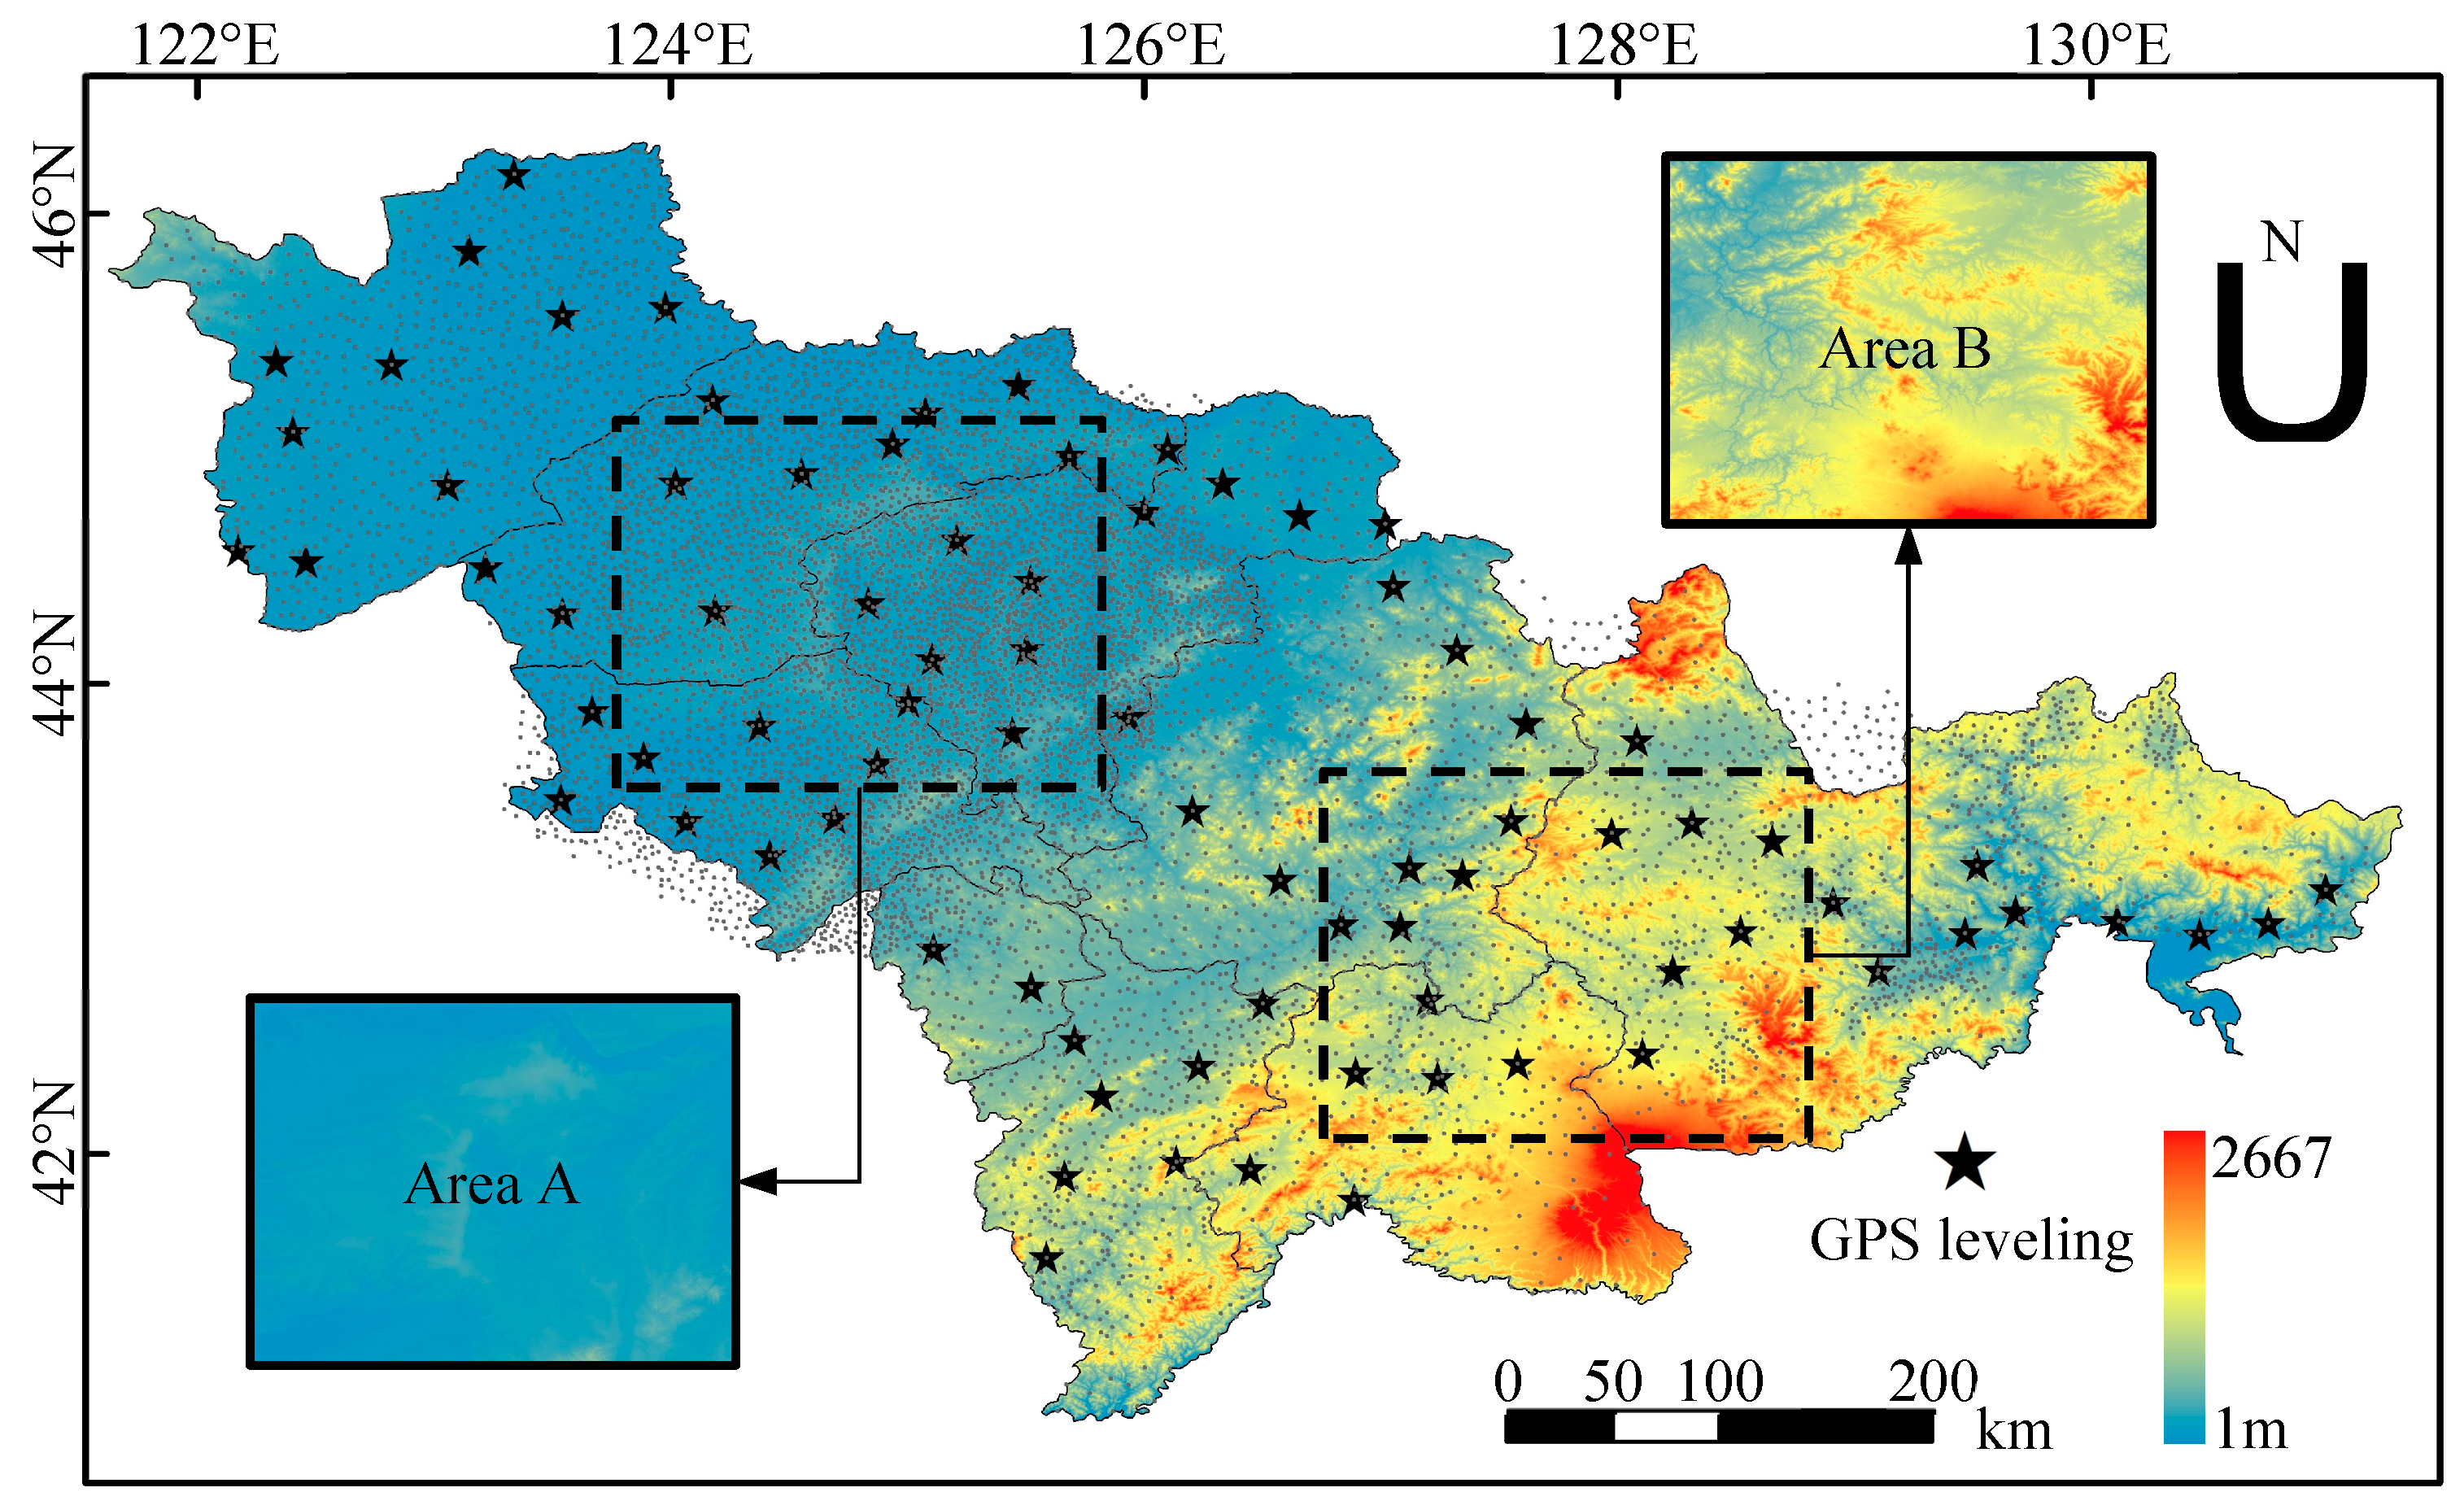
Figure 1.
Distribution of GPS-leveling benchmarks and gravity data in Jilin Province, China.
Figure 1.
Distribution of GPS-leveling benchmarks and gravity data in Jilin Province, China.
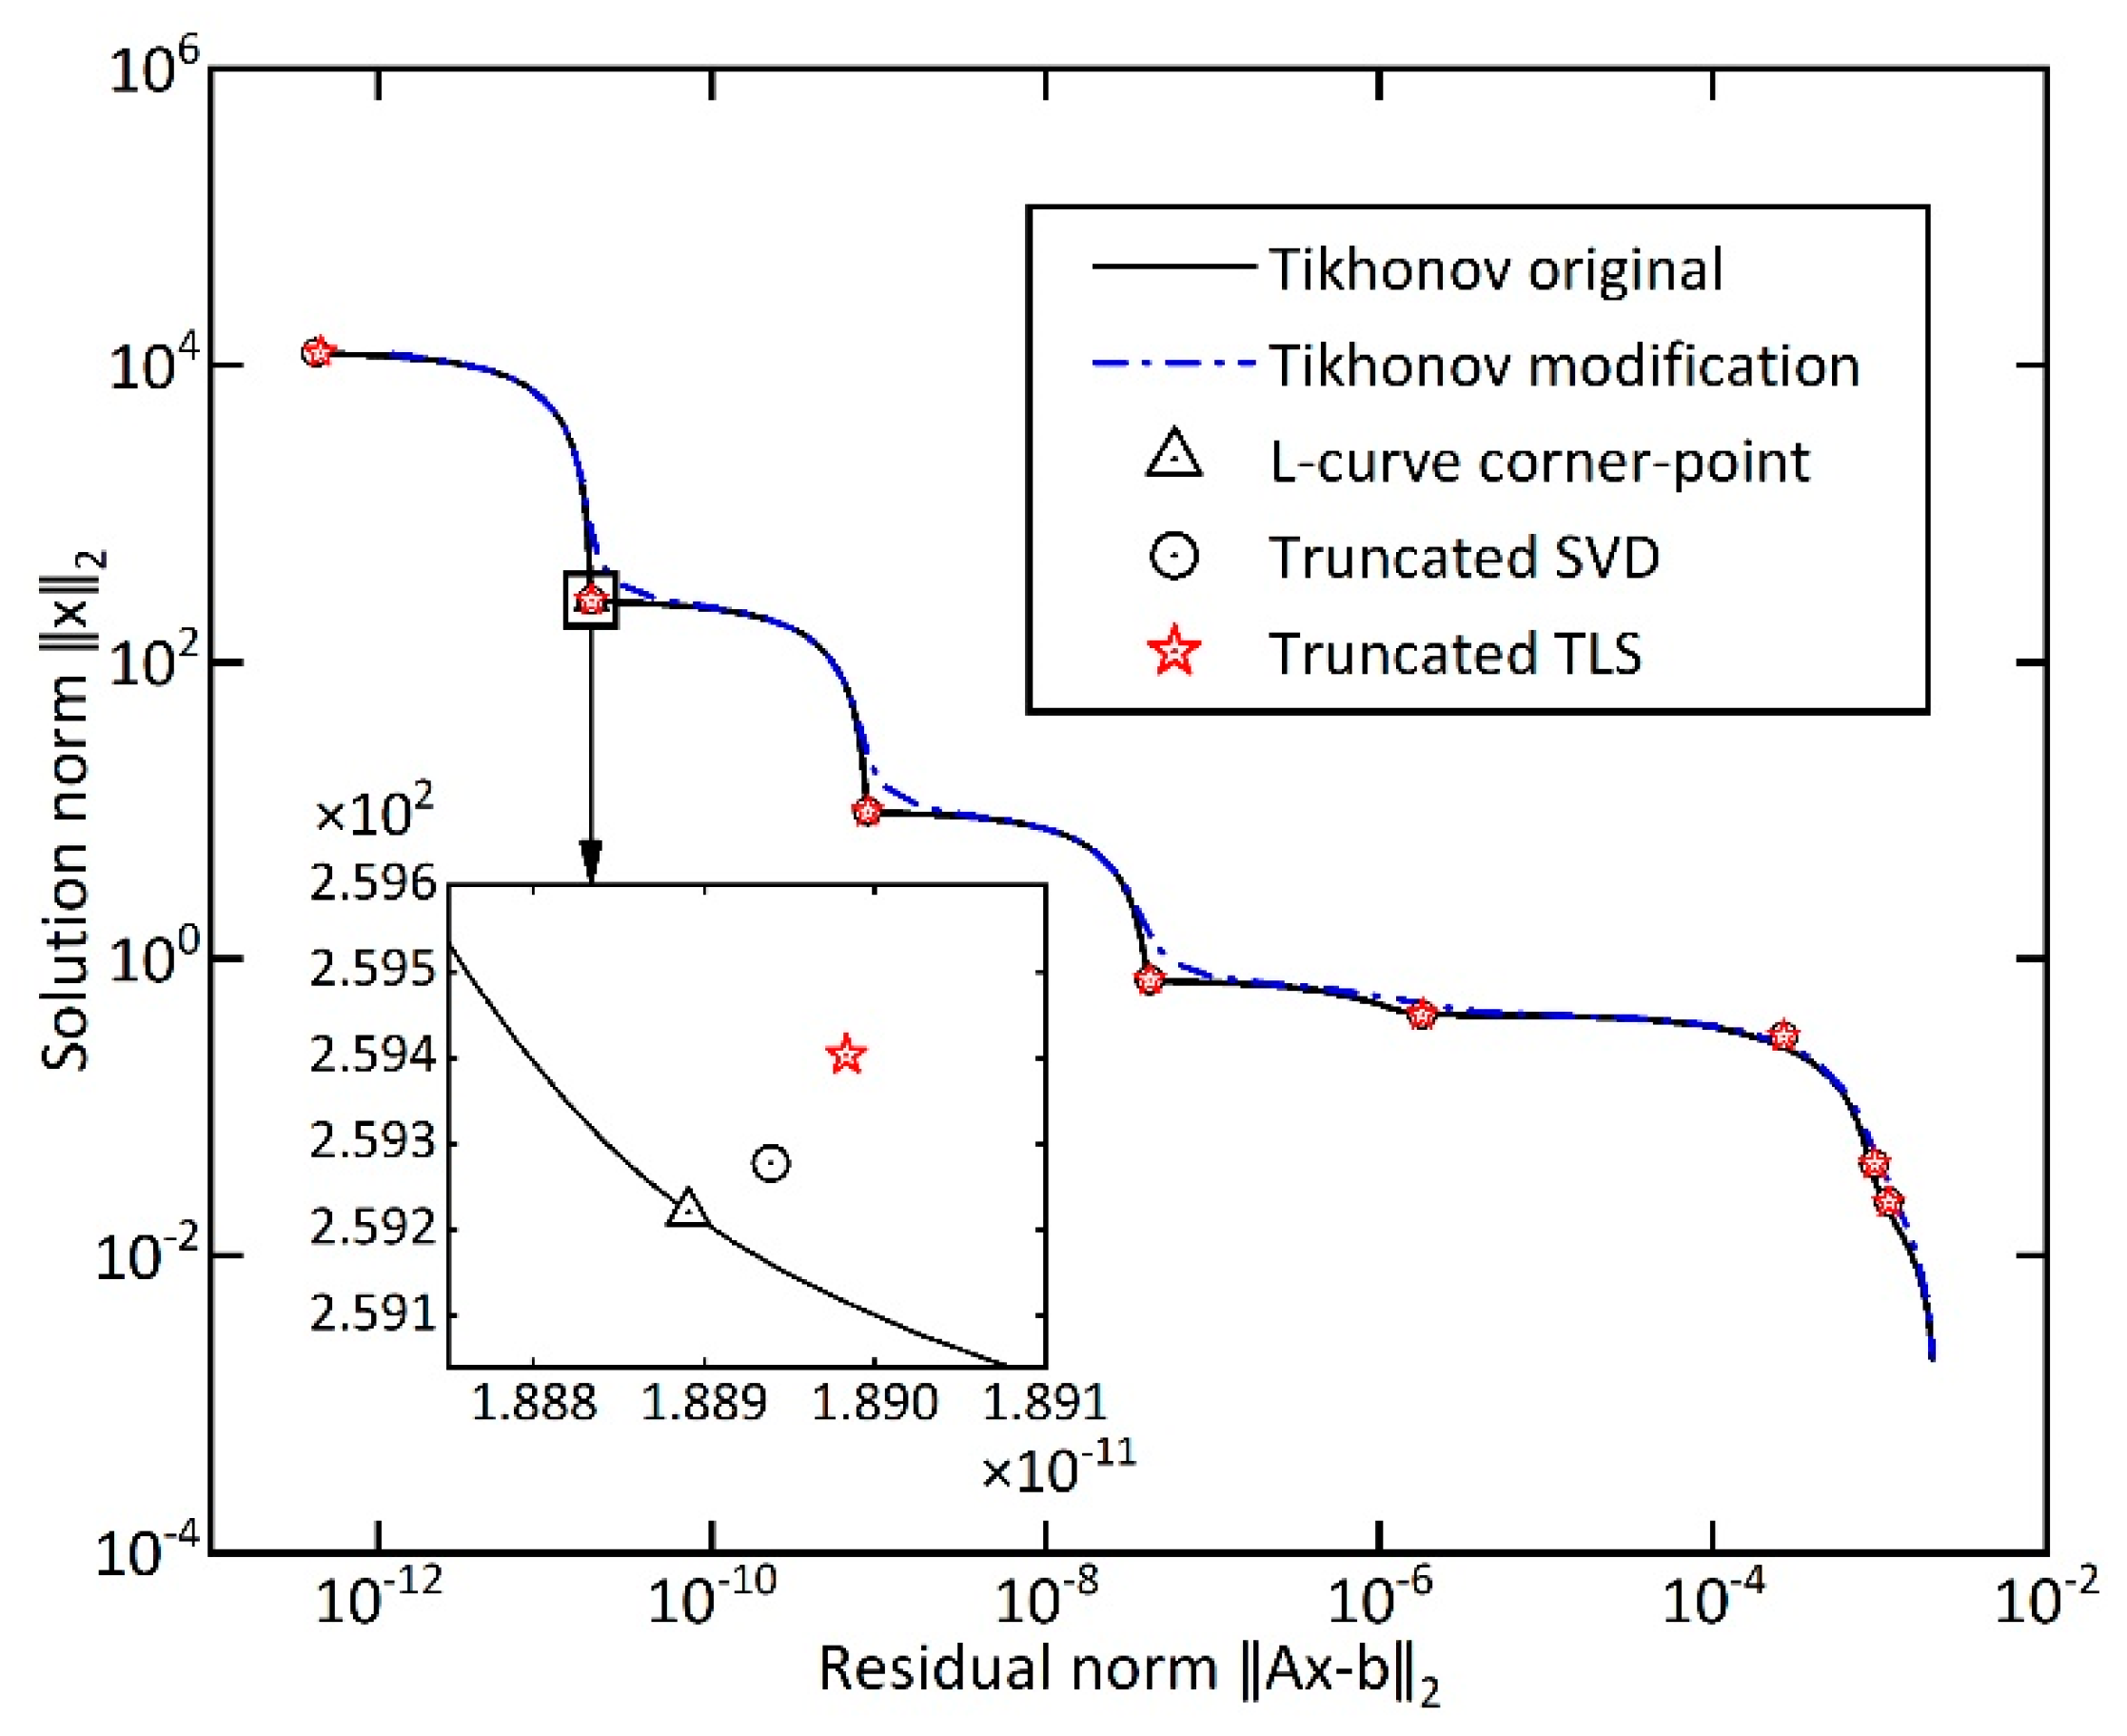
Figure 2.
Numerical difference of least square parameters using different regularization methods.
Figure 2.
Numerical difference of least square parameters using different regularization methods.
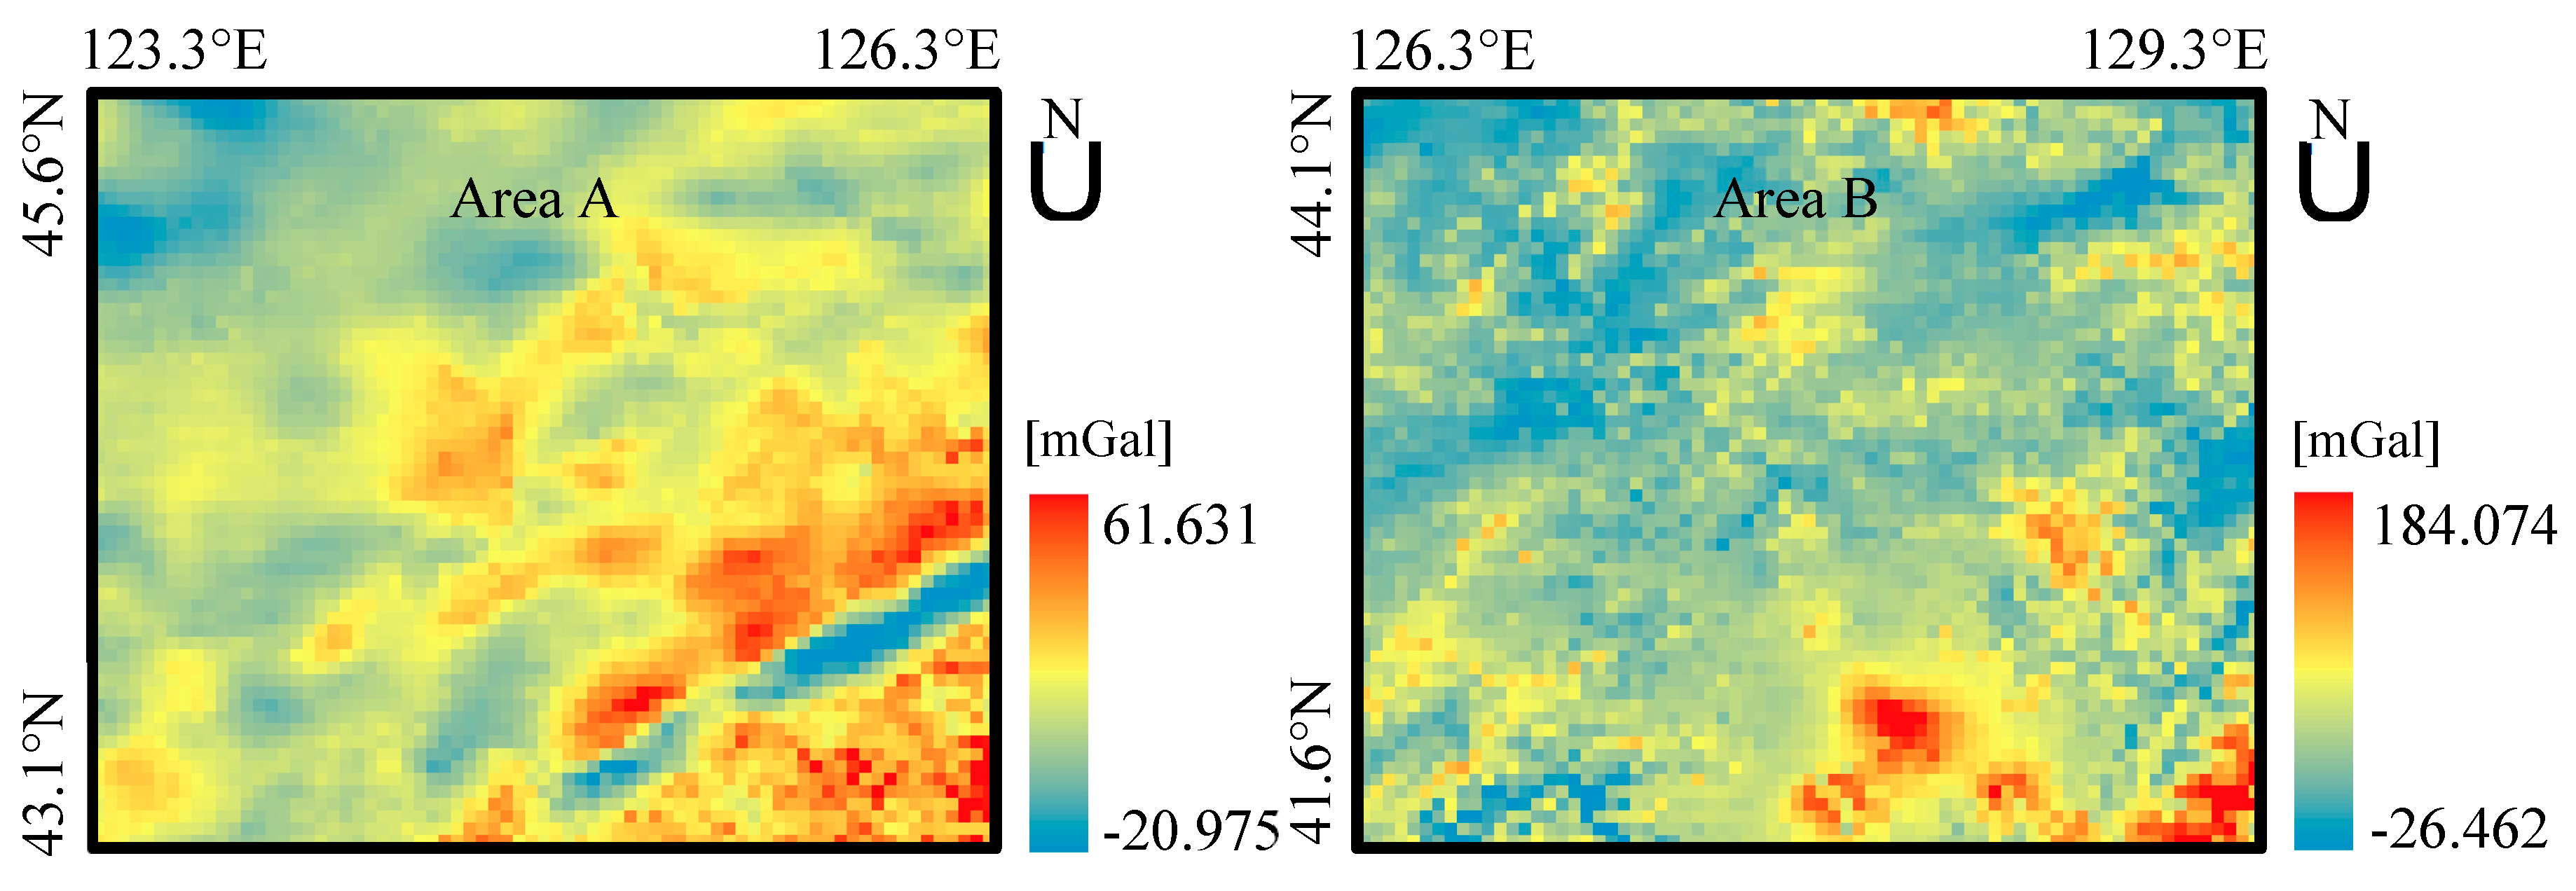
Figure 3.
The gridded free-air gravity anomalies in Area A and B.
Figure 3.
The gridded free-air gravity anomalies in Area A and B.
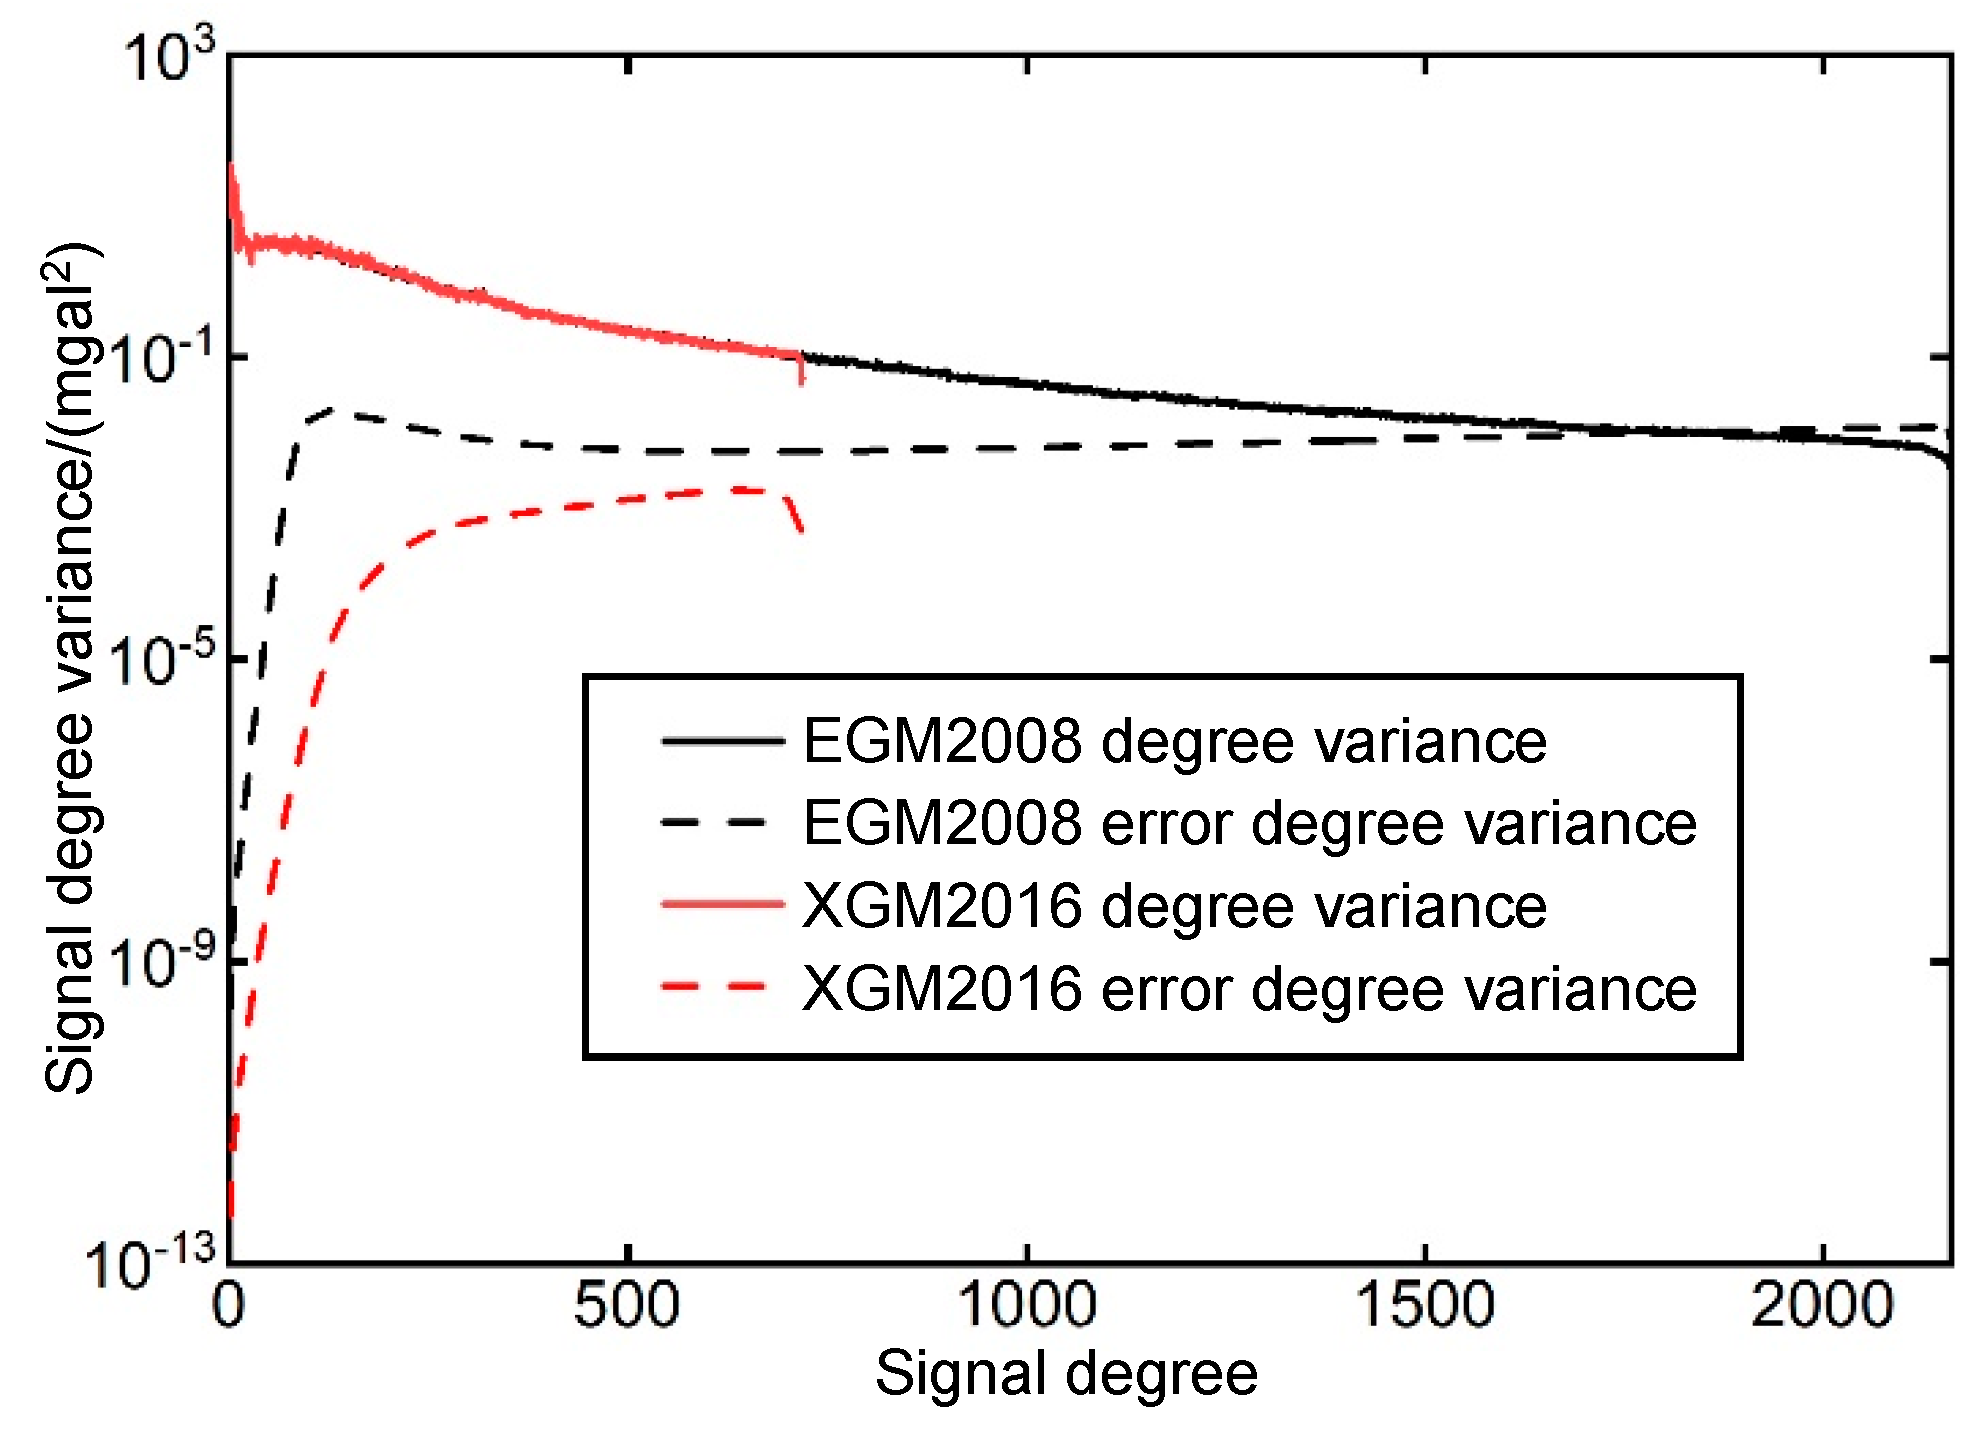
Figure 4.
Signal degree variance of EGM2008 and XGM2016.
Figure 4.
Signal degree variance of EGM2008 and XGM2016.
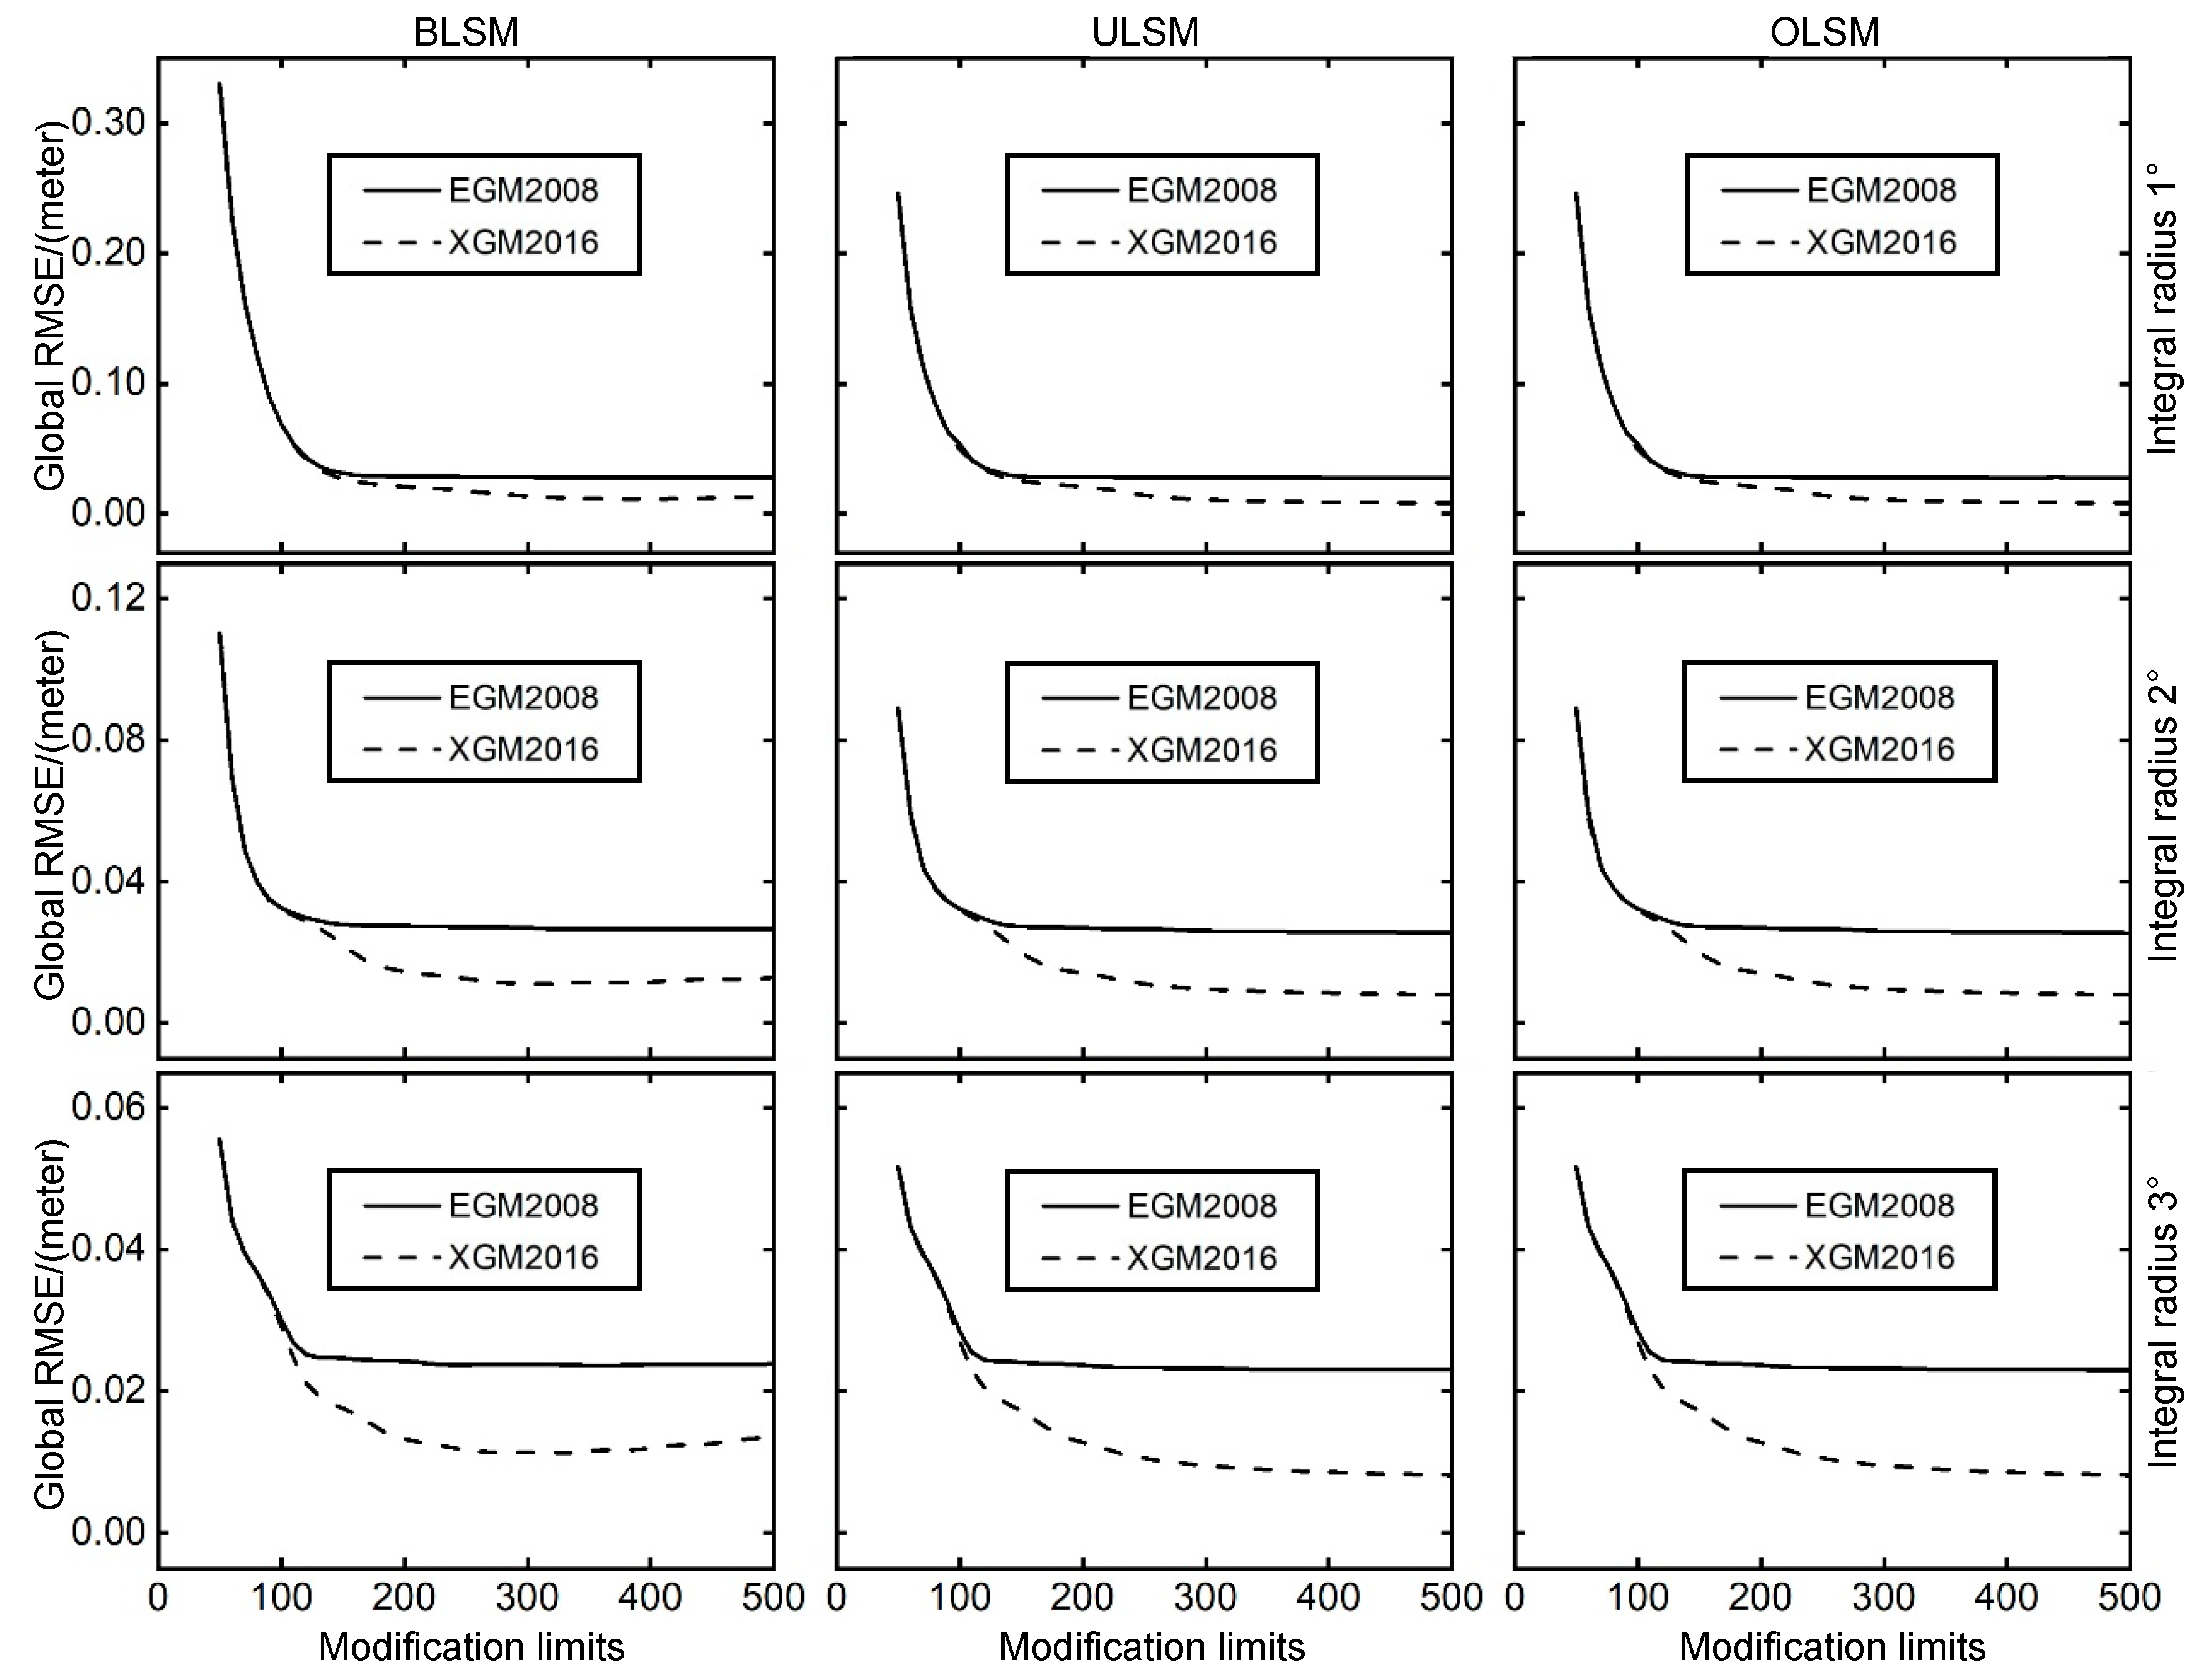
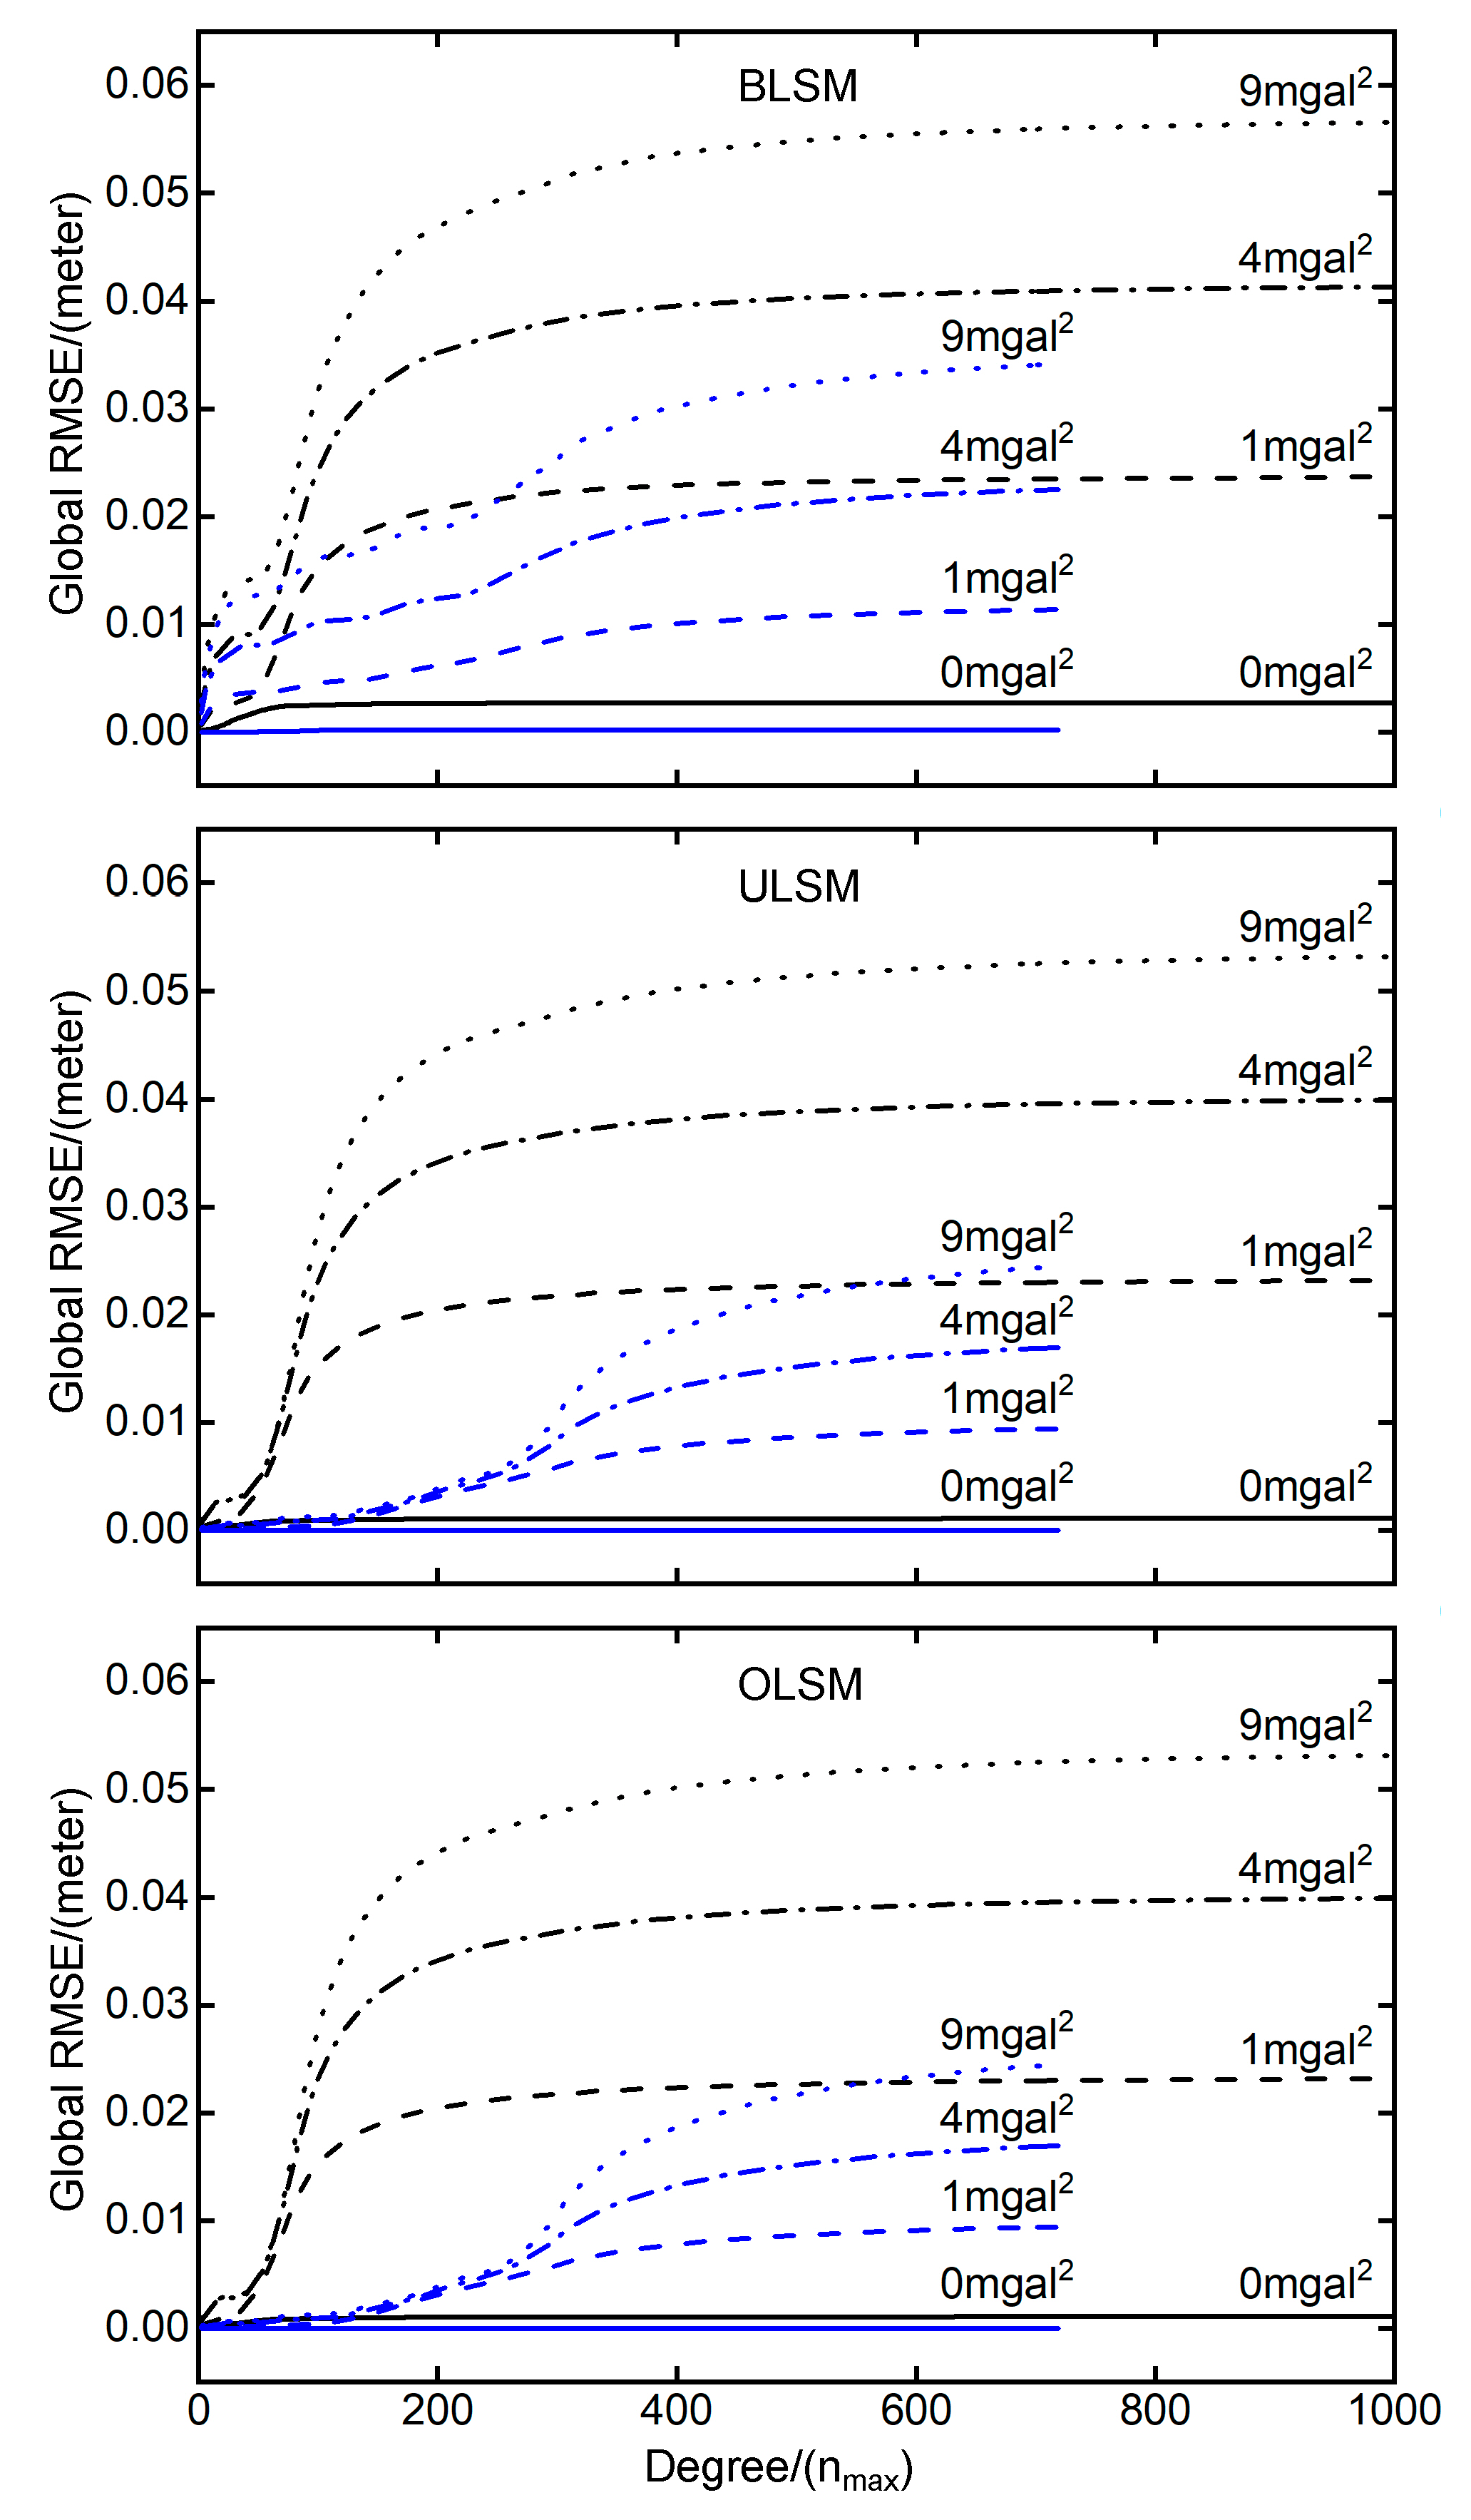
Figure 5.
The global Root Mean Squared Error (RMSE) obtained by different modification limits. The horizontal and vertical axes represent the modification limits [0, 500] and global RMSE, respectively. Each row corresponds to a fixed integral radius, and each column corresponds to a fixed stochastic model.
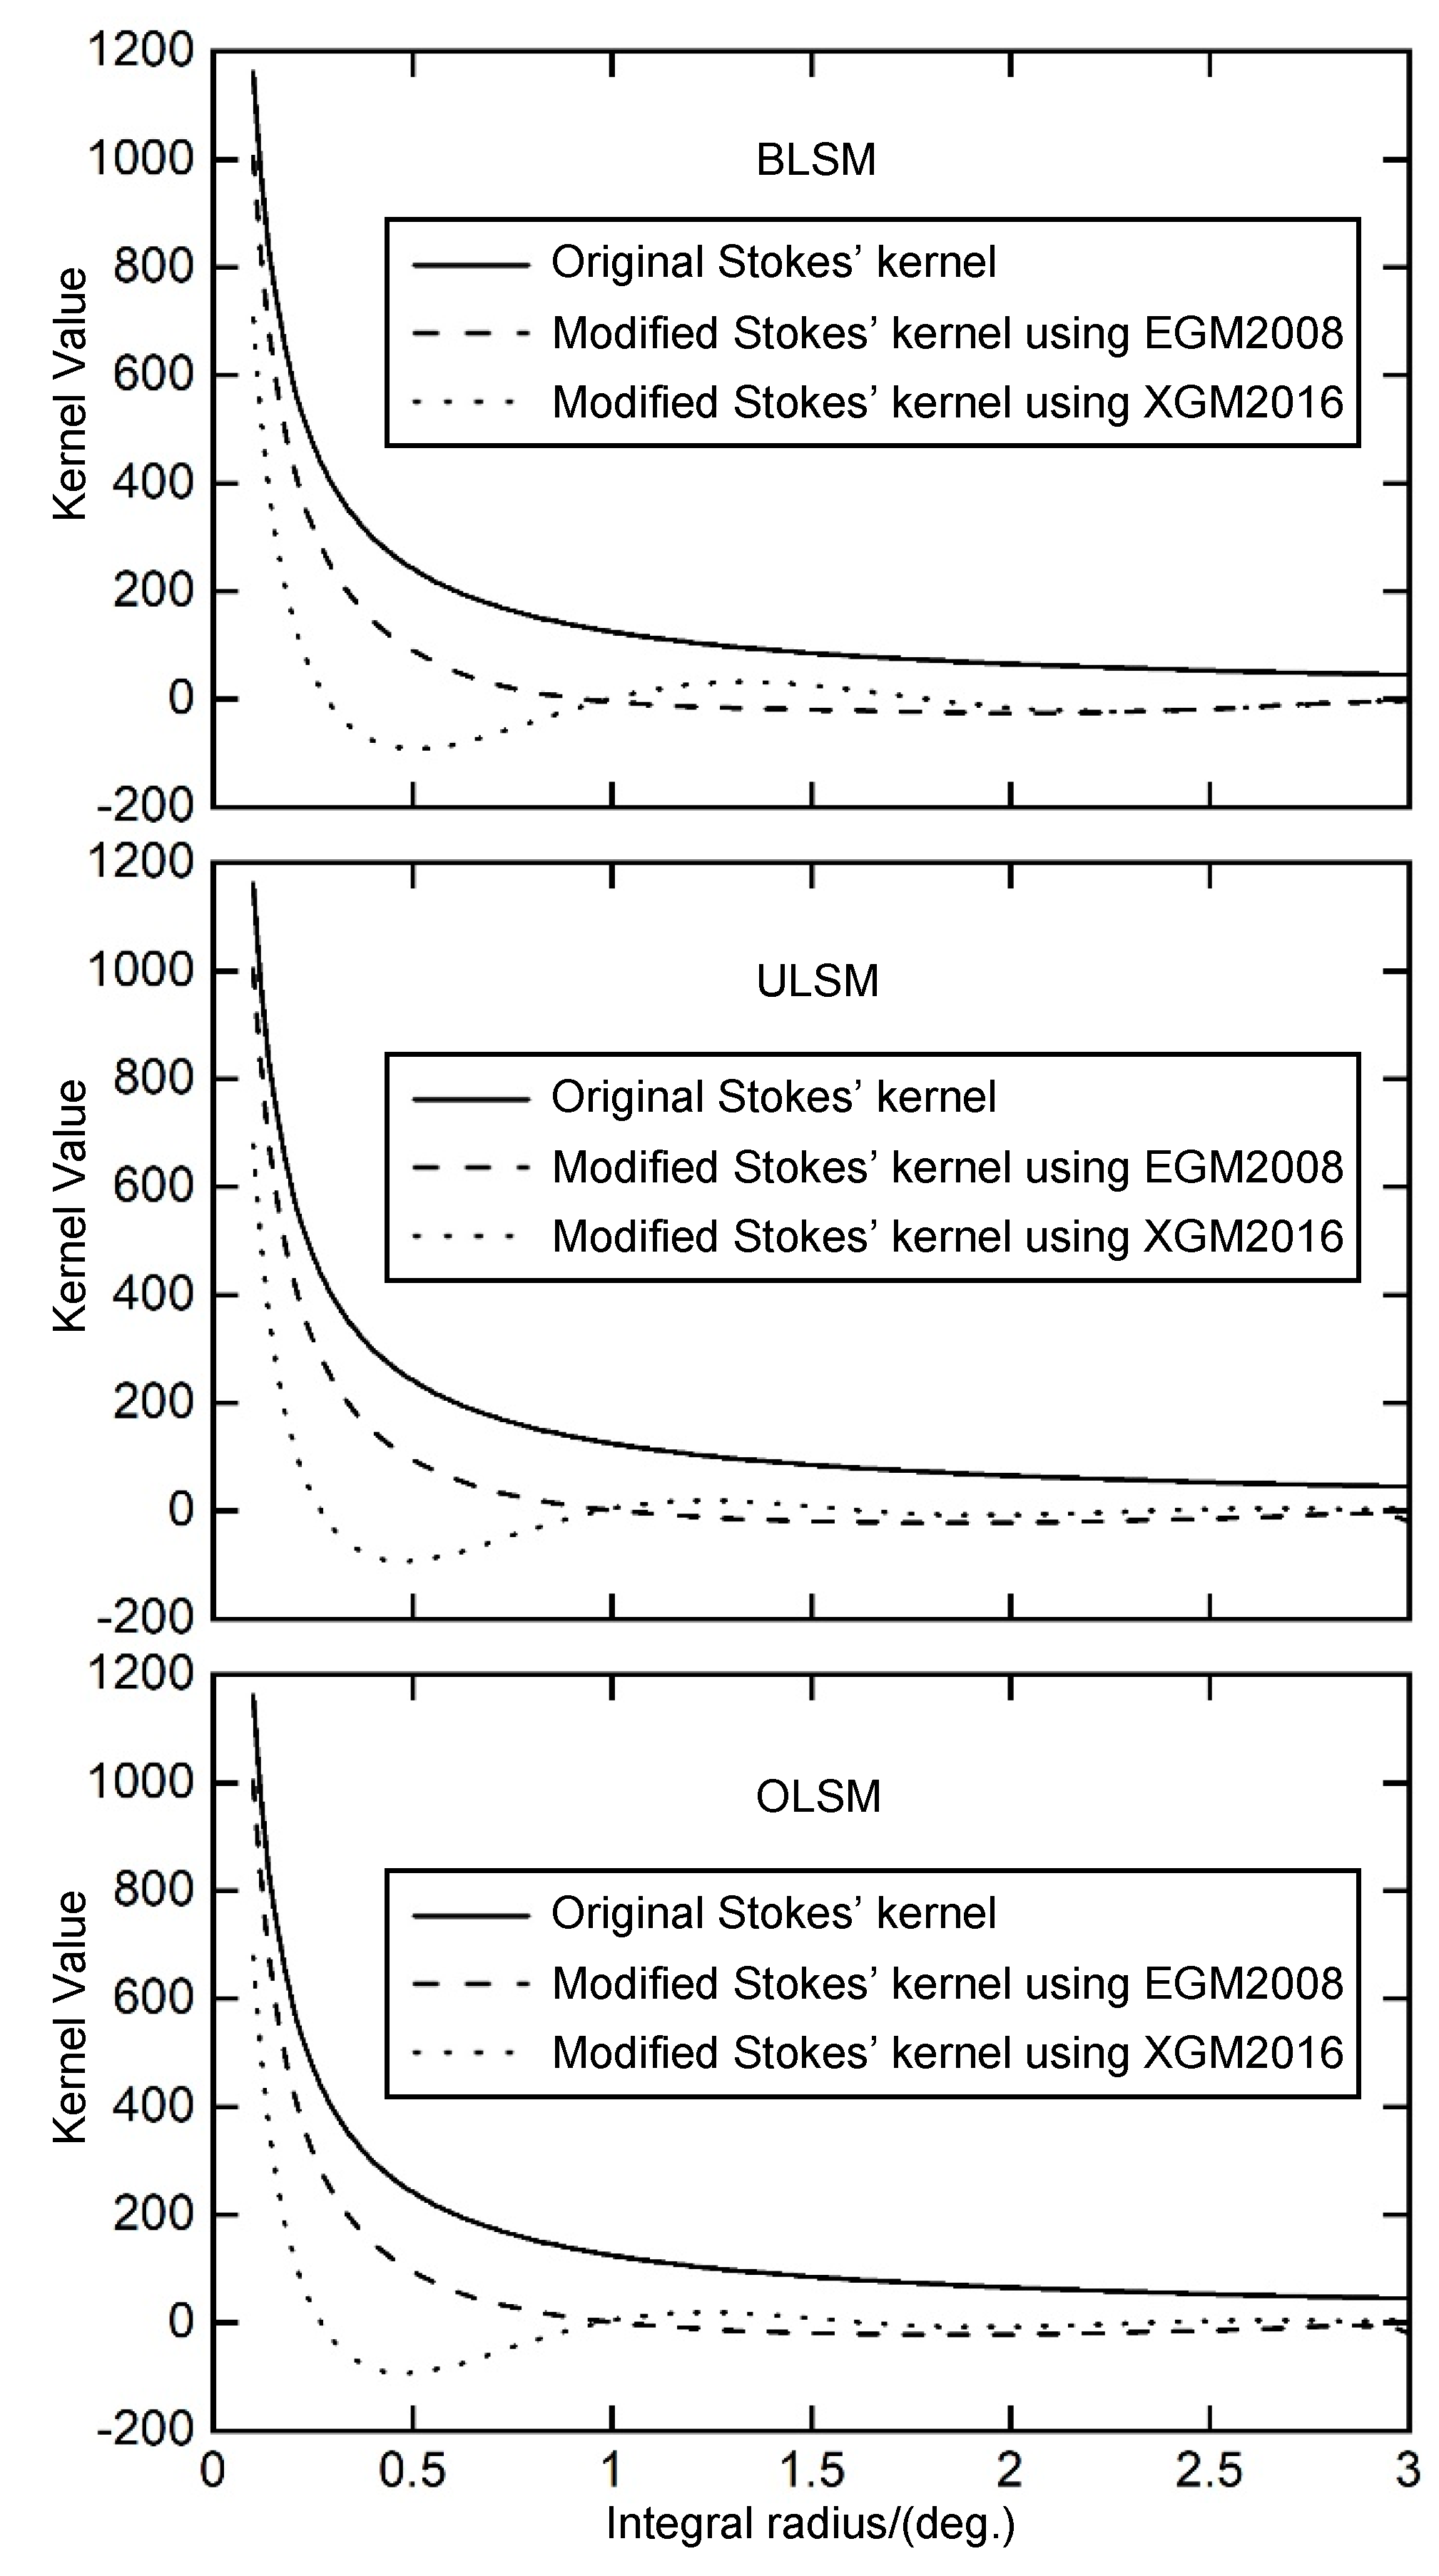
Figure 6.
Difference between original Stokes’ kernel and modified Stokes’ kernel. The horizontal and vertical axes represent the integral radius [0, 3] and value of Stokes kernel, respectively.
Figure 6.
Difference between original Stokes’ kernel and modified Stokes’ kernel. The horizontal and vertical axes represent the integral radius [0, 3] and value of Stokes kernel, respectively.
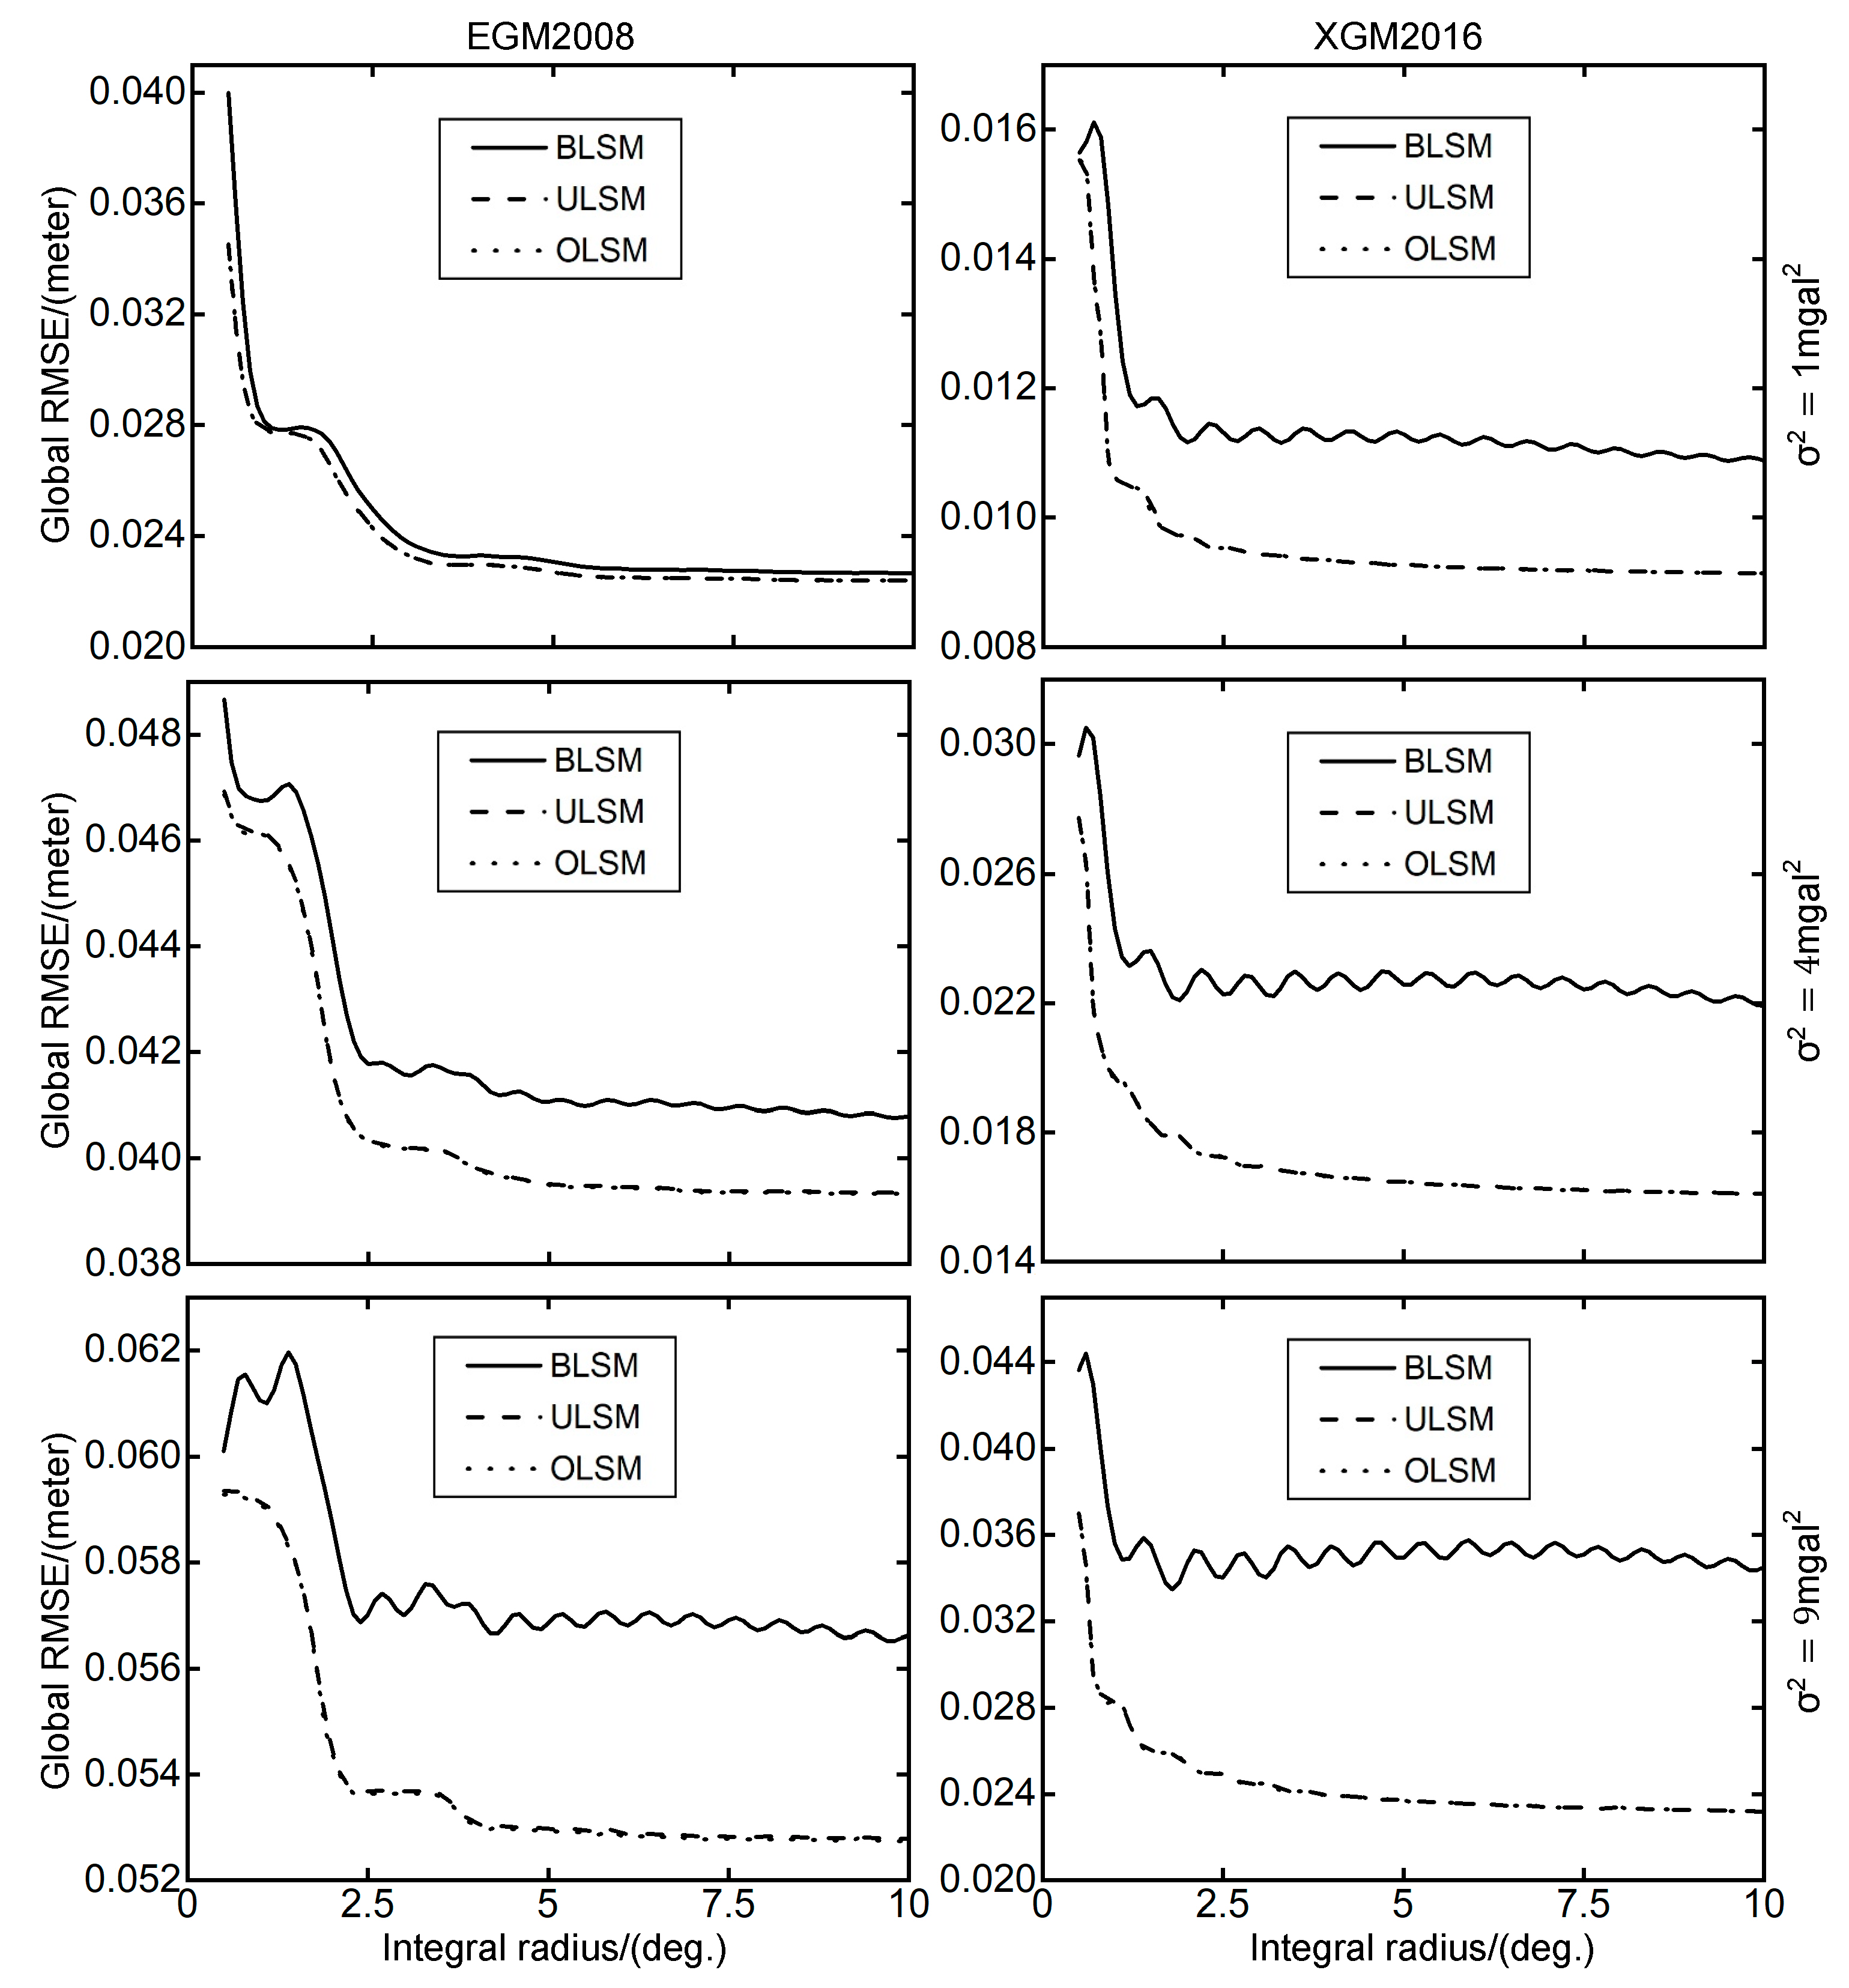
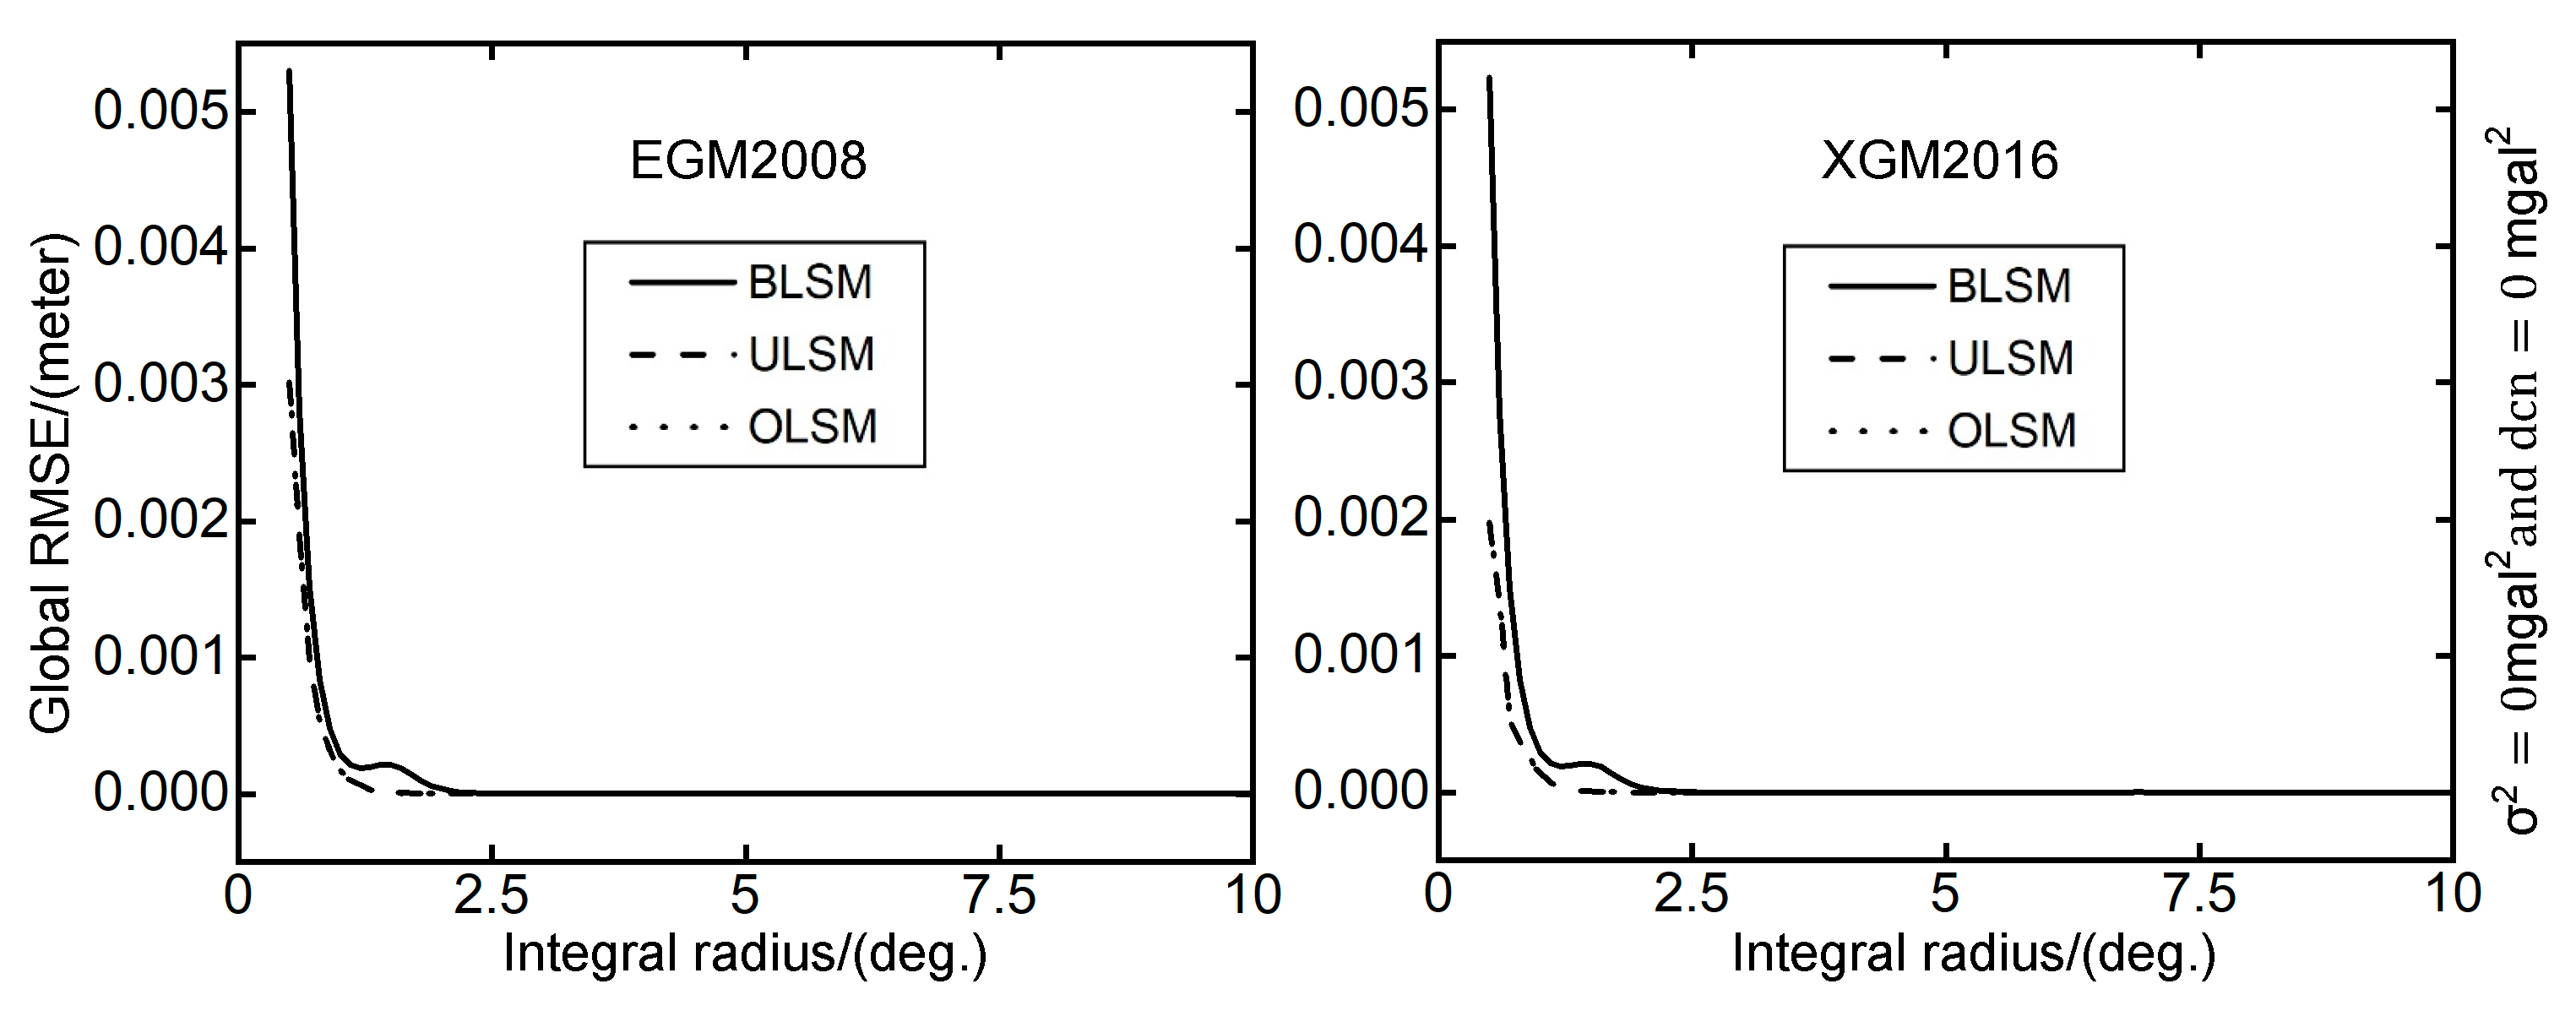
Figure 7.
The global RMSE obtained by different integral radius. The horizontal and vertical axes represent the integral radius [0, 10] and global RMSE, respectively.
Figure 7.
The global RMSE obtained by different integral radius. The horizontal and vertical axes represent the integral radius [0, 10] and global RMSE, respectively.
Figure 8.
The global RMSE obtained by different integral radius (). The horizontal and vertical axes represent the integral radius [0, 10] and global RMSE, respectively.
Figure 8.
The global RMSE obtained by different integral radius (). The horizontal and vertical axes represent the integral radius [0, 10] and global RMSE, respectively.
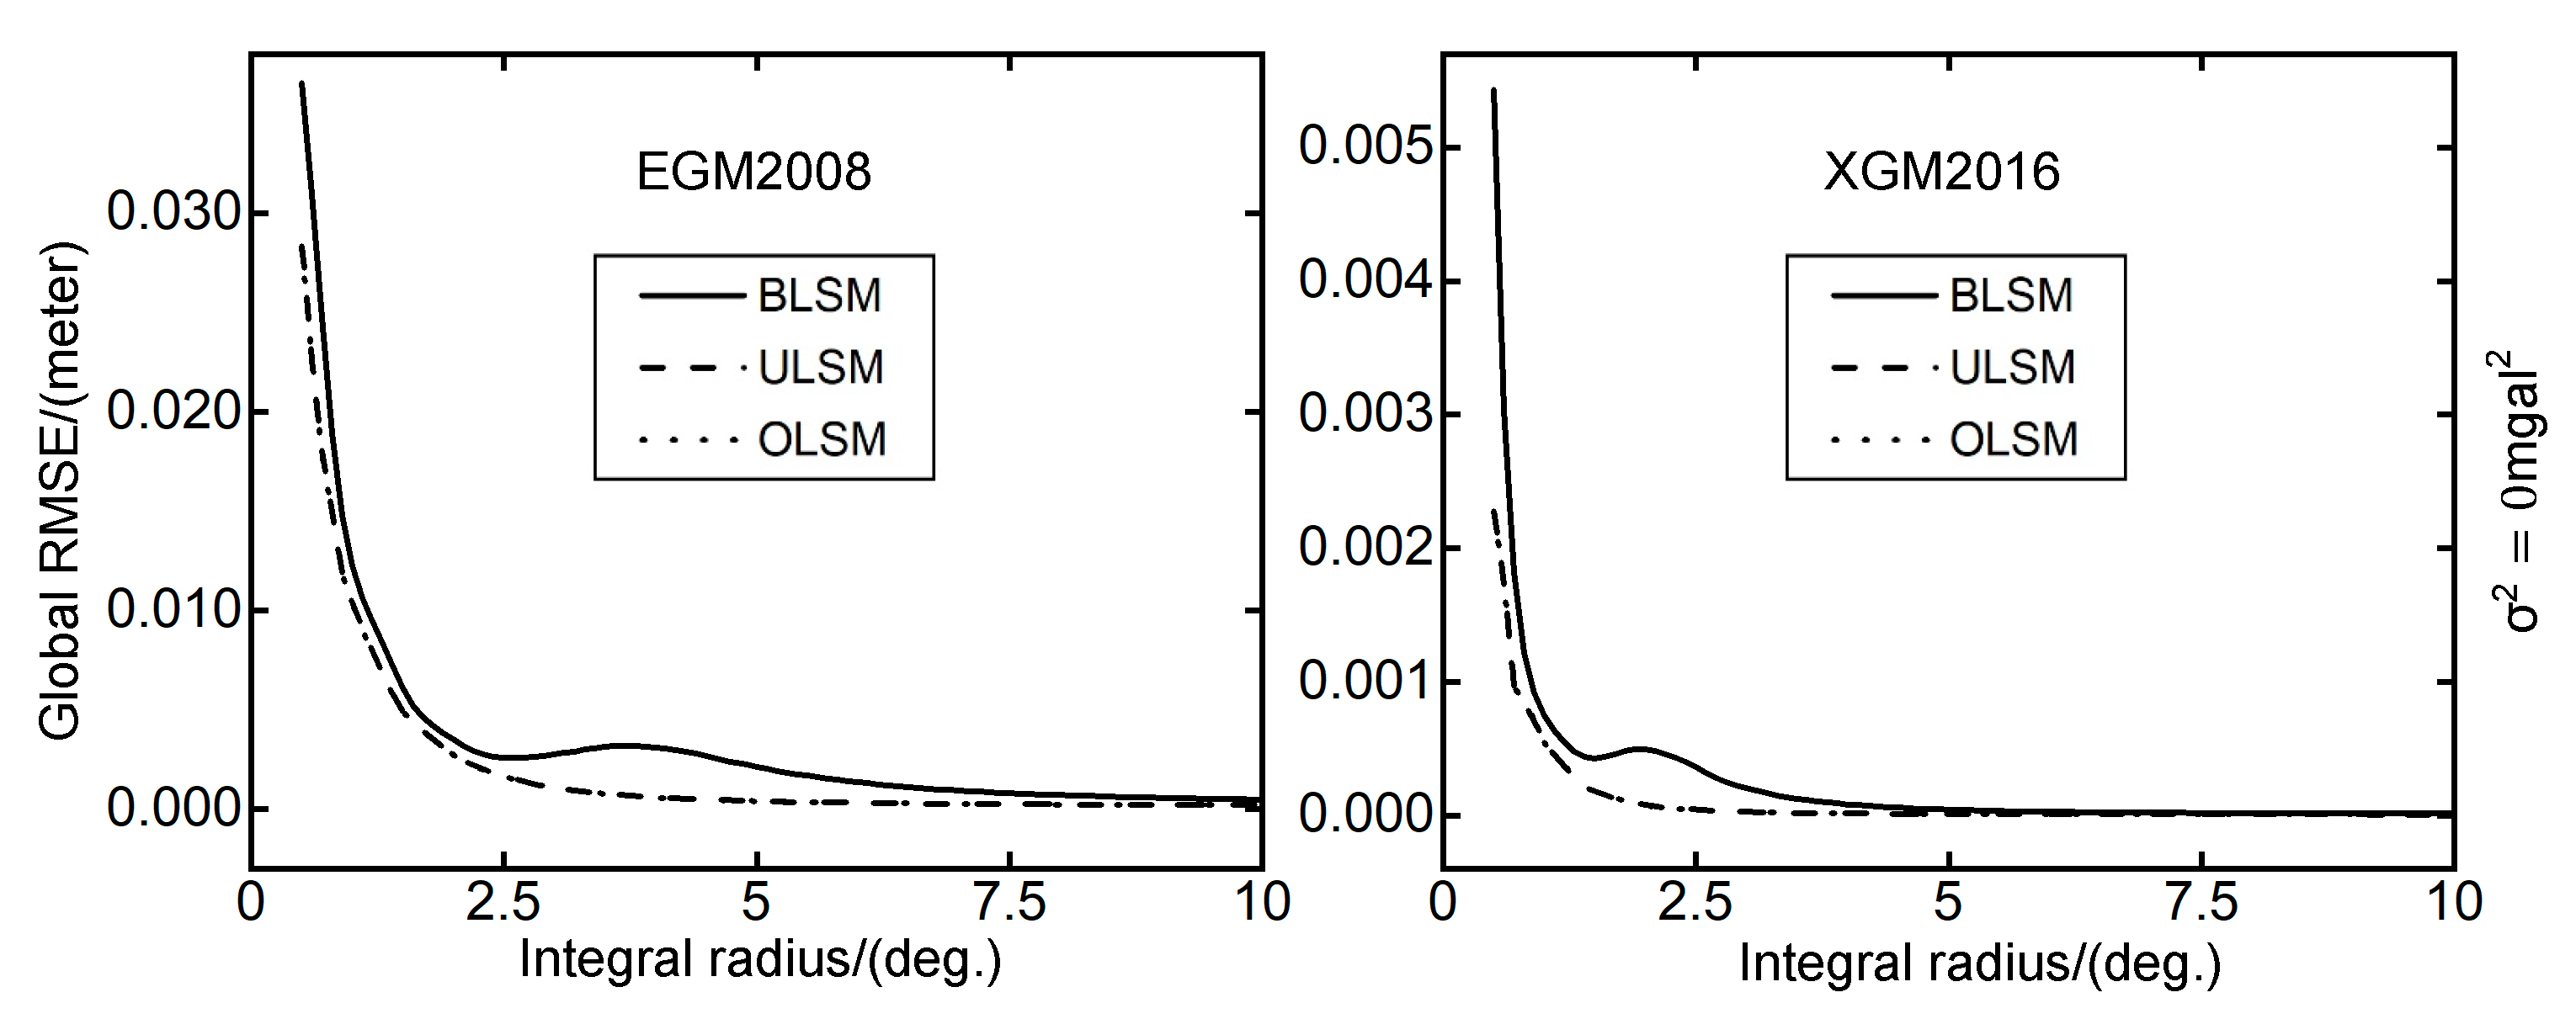
Figure 9.
The global RMSE obtained by different integral radius ( and ). The horizontal and vertical axes represent the integral radius [0, 10] and global RMSE, respectively.
Figure 9.
The global RMSE obtained by different integral radius ( and ). The horizontal and vertical axes represent the integral radius [0, 10] and global RMSE, respectively.
Figure 10.
Cumulative sum of terrestrial gravity data errors in the global RMSE (black line: EGM2008; blue line: XGM2016).
Figure 10.
Cumulative sum of terrestrial gravity data errors in the global RMSE (black line: EGM2008; blue line: XGM2016).
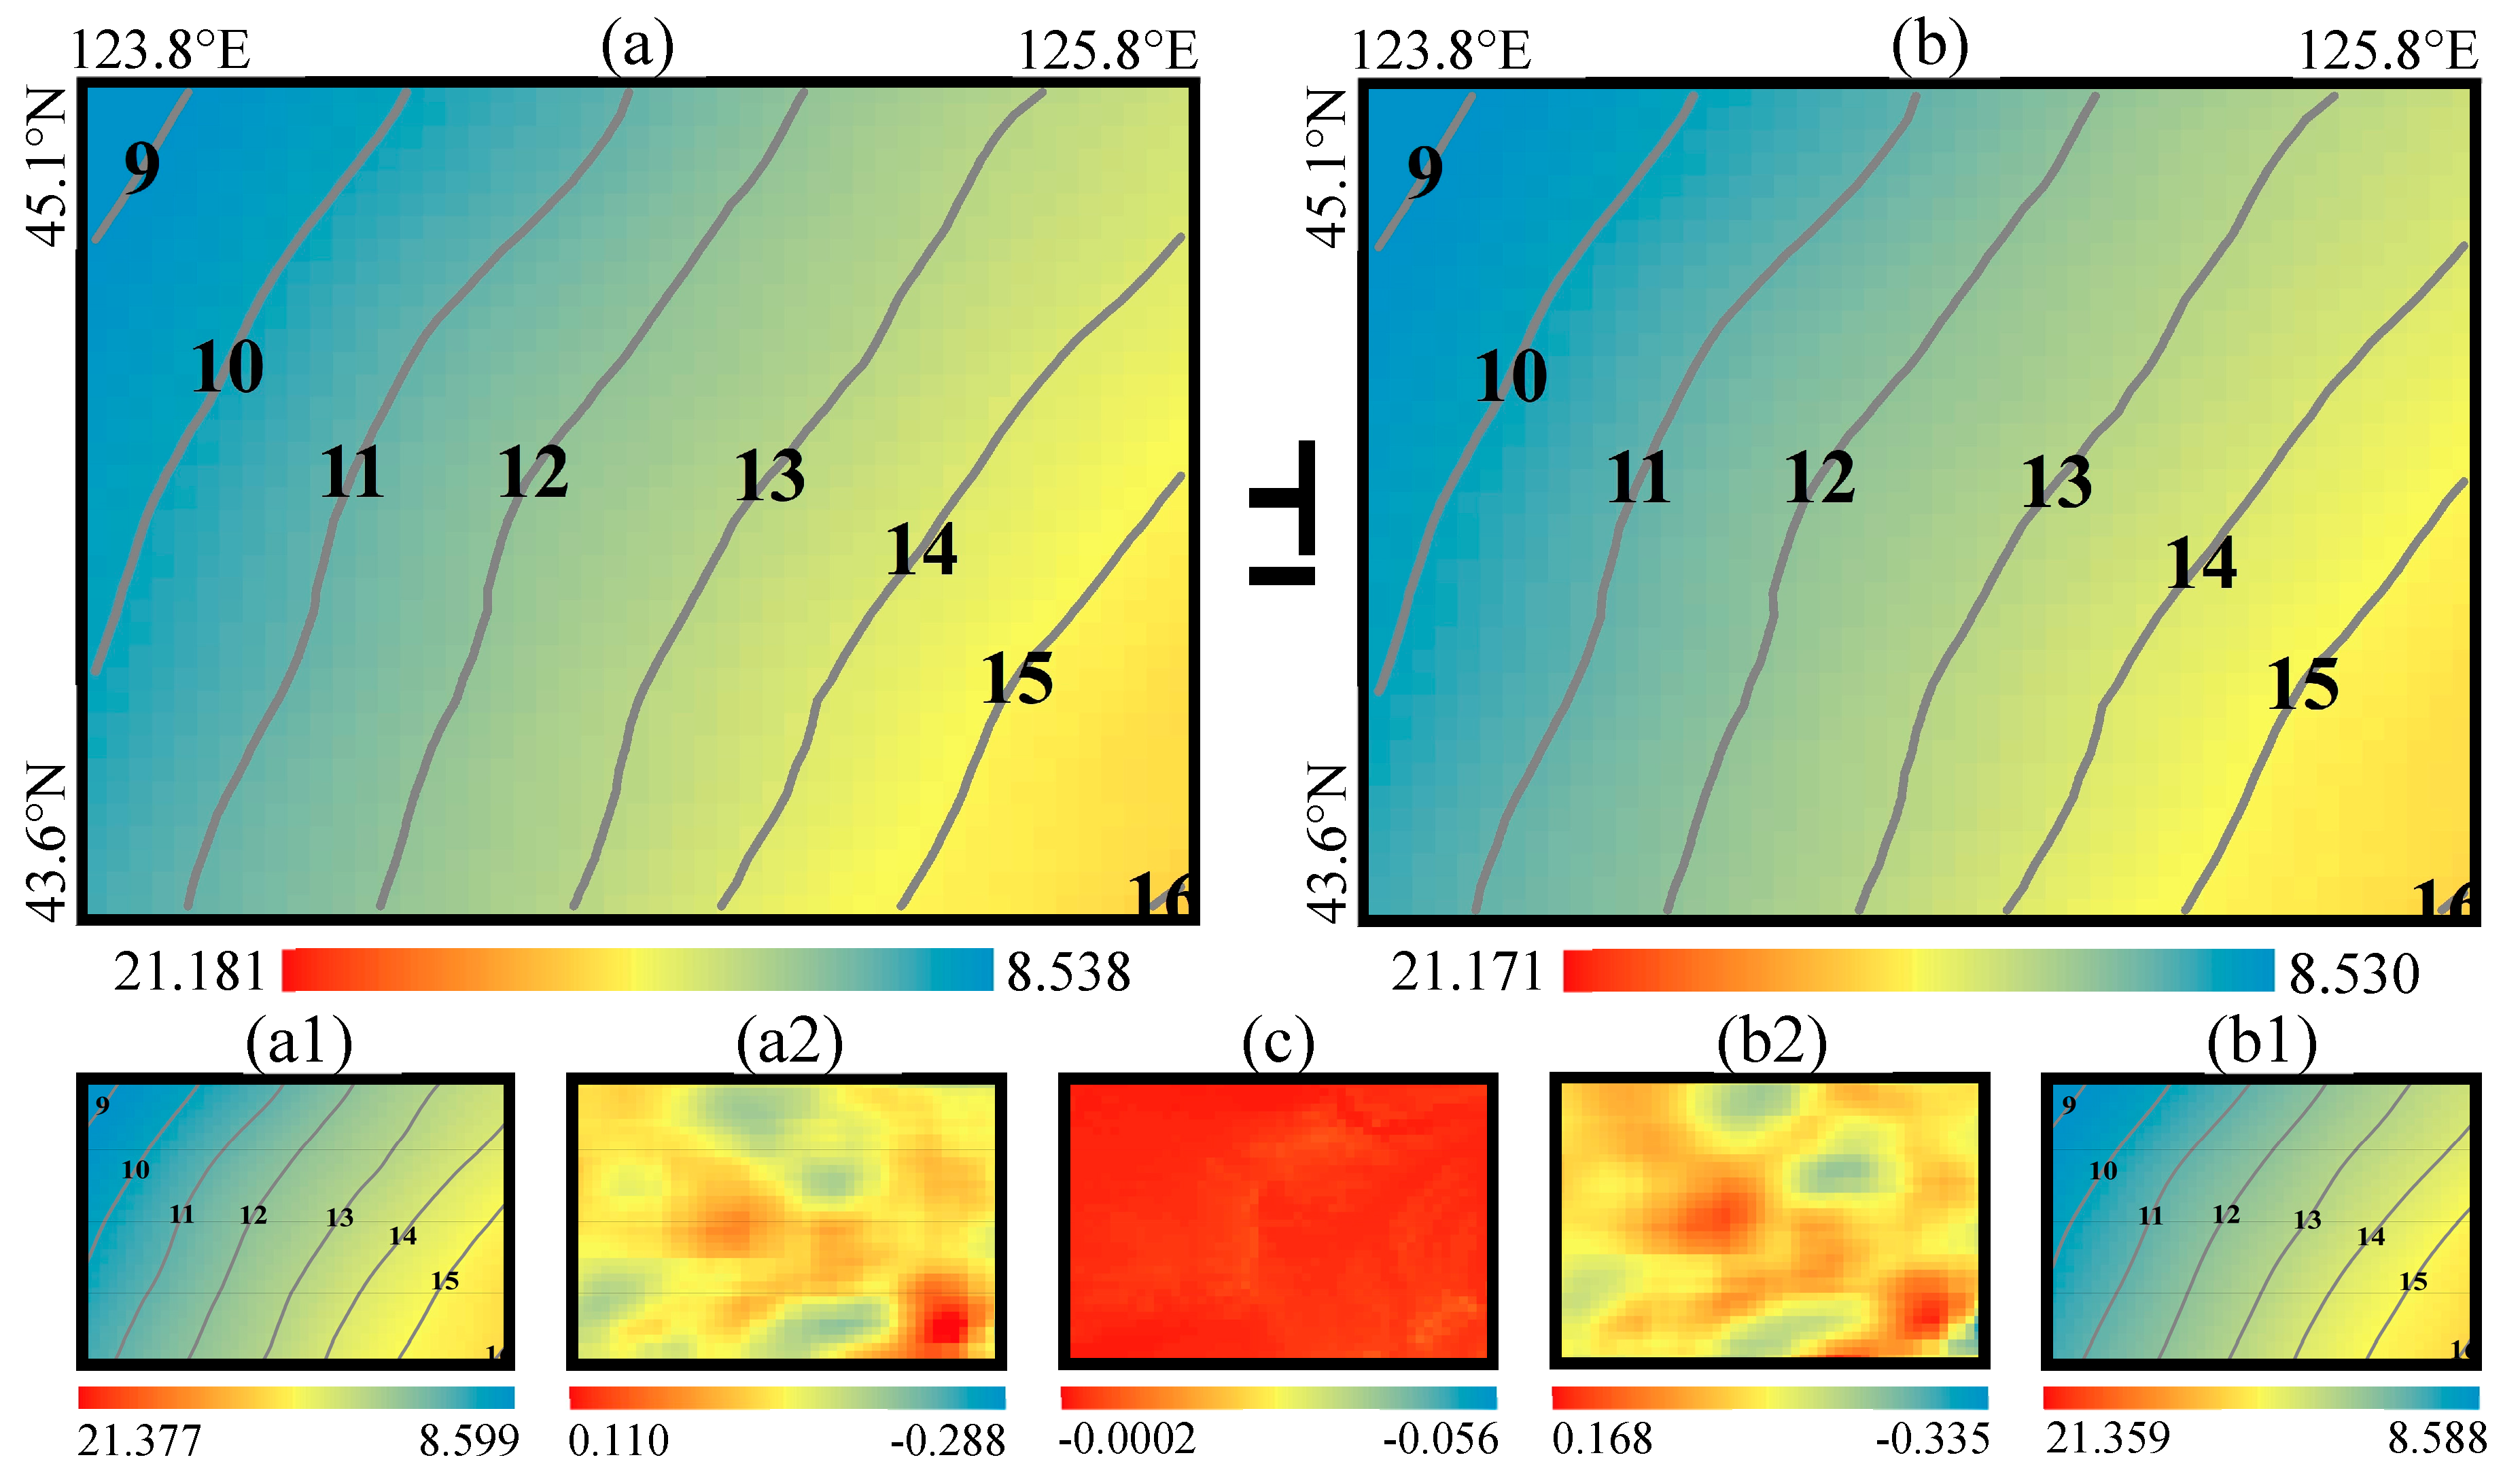
Figure 11.
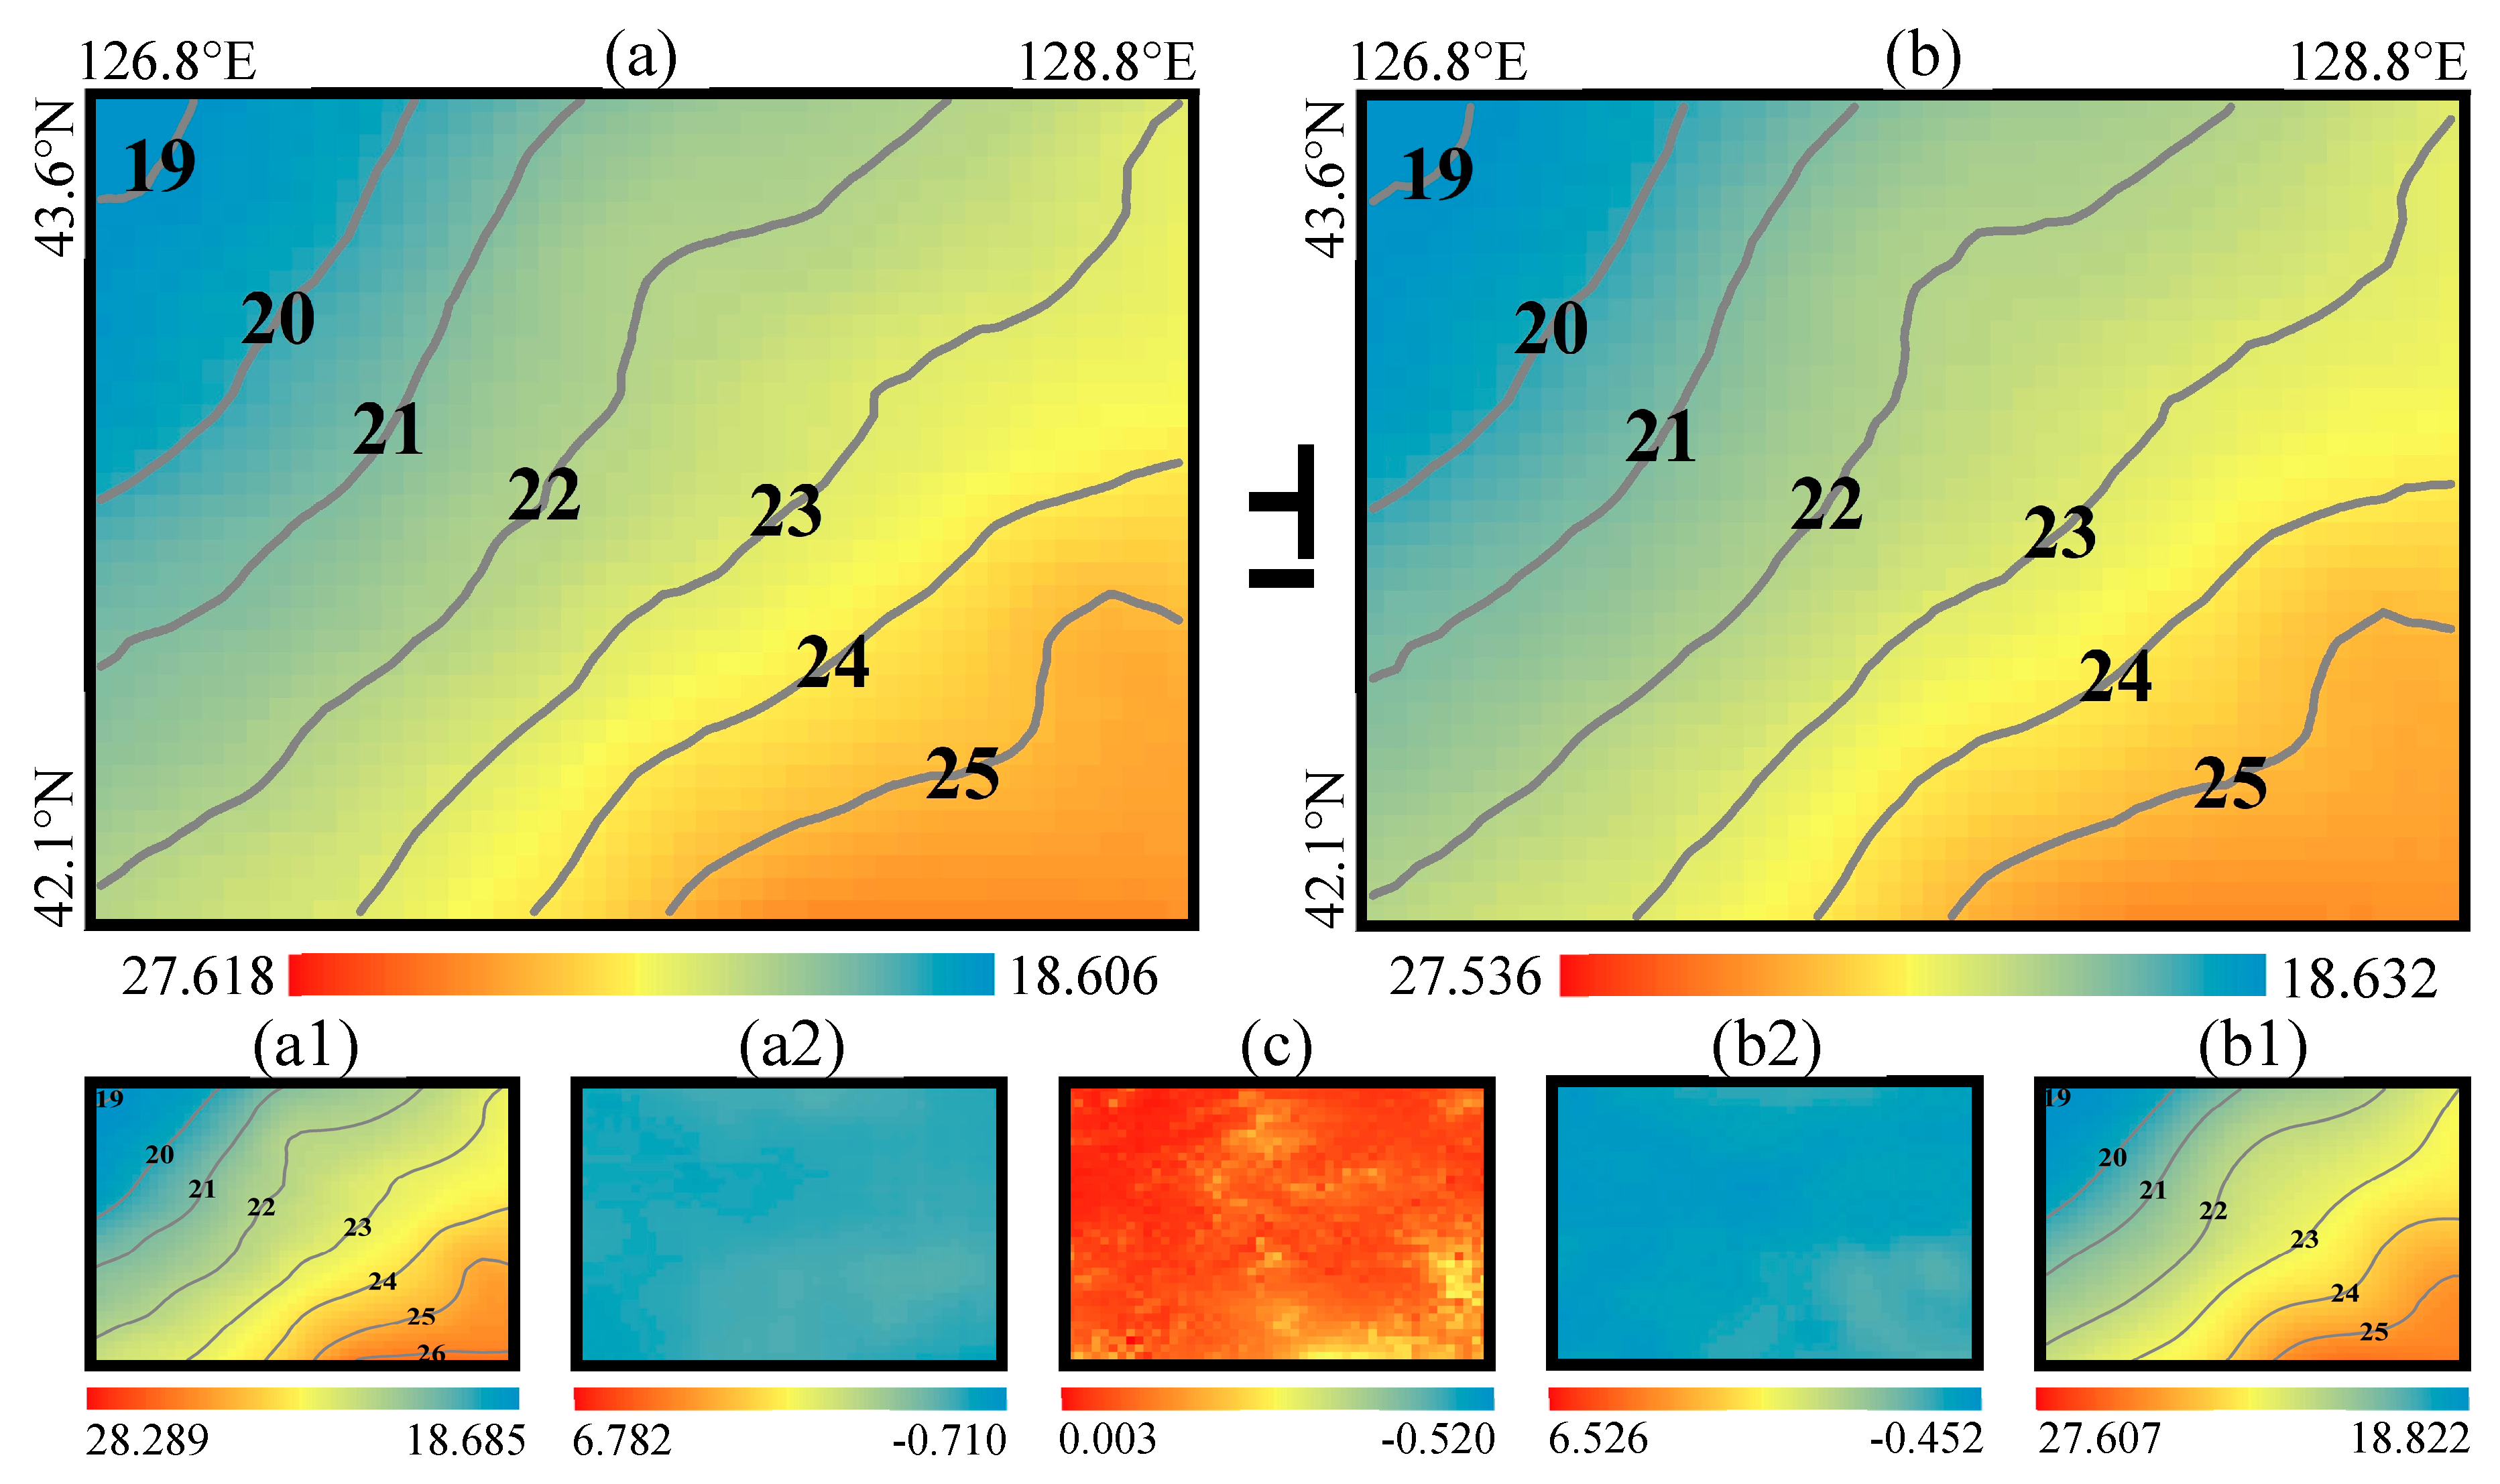
RCR-refined geoid and its constituents in Area A. (a) Geoid heights of the RCR08-A: (a1) Contribution of the EGM2008 , (a2) Residual geoid height ; (b) Geoid heights of the RCR16-A: (b1) Contribution of the XGM2016 , (b2) Residual geoid height , (c) Indirect effect on geoid height . Unit: meter.
Figure 11.
RCR-refined geoid and its constituents in Area A. (a) Geoid heights of the RCR08-A: (a1) Contribution of the EGM2008 , (a2) Residual geoid height ; (b) Geoid heights of the RCR16-A: (b1) Contribution of the XGM2016 , (b2) Residual geoid height , (c) Indirect effect on geoid height . Unit: meter.
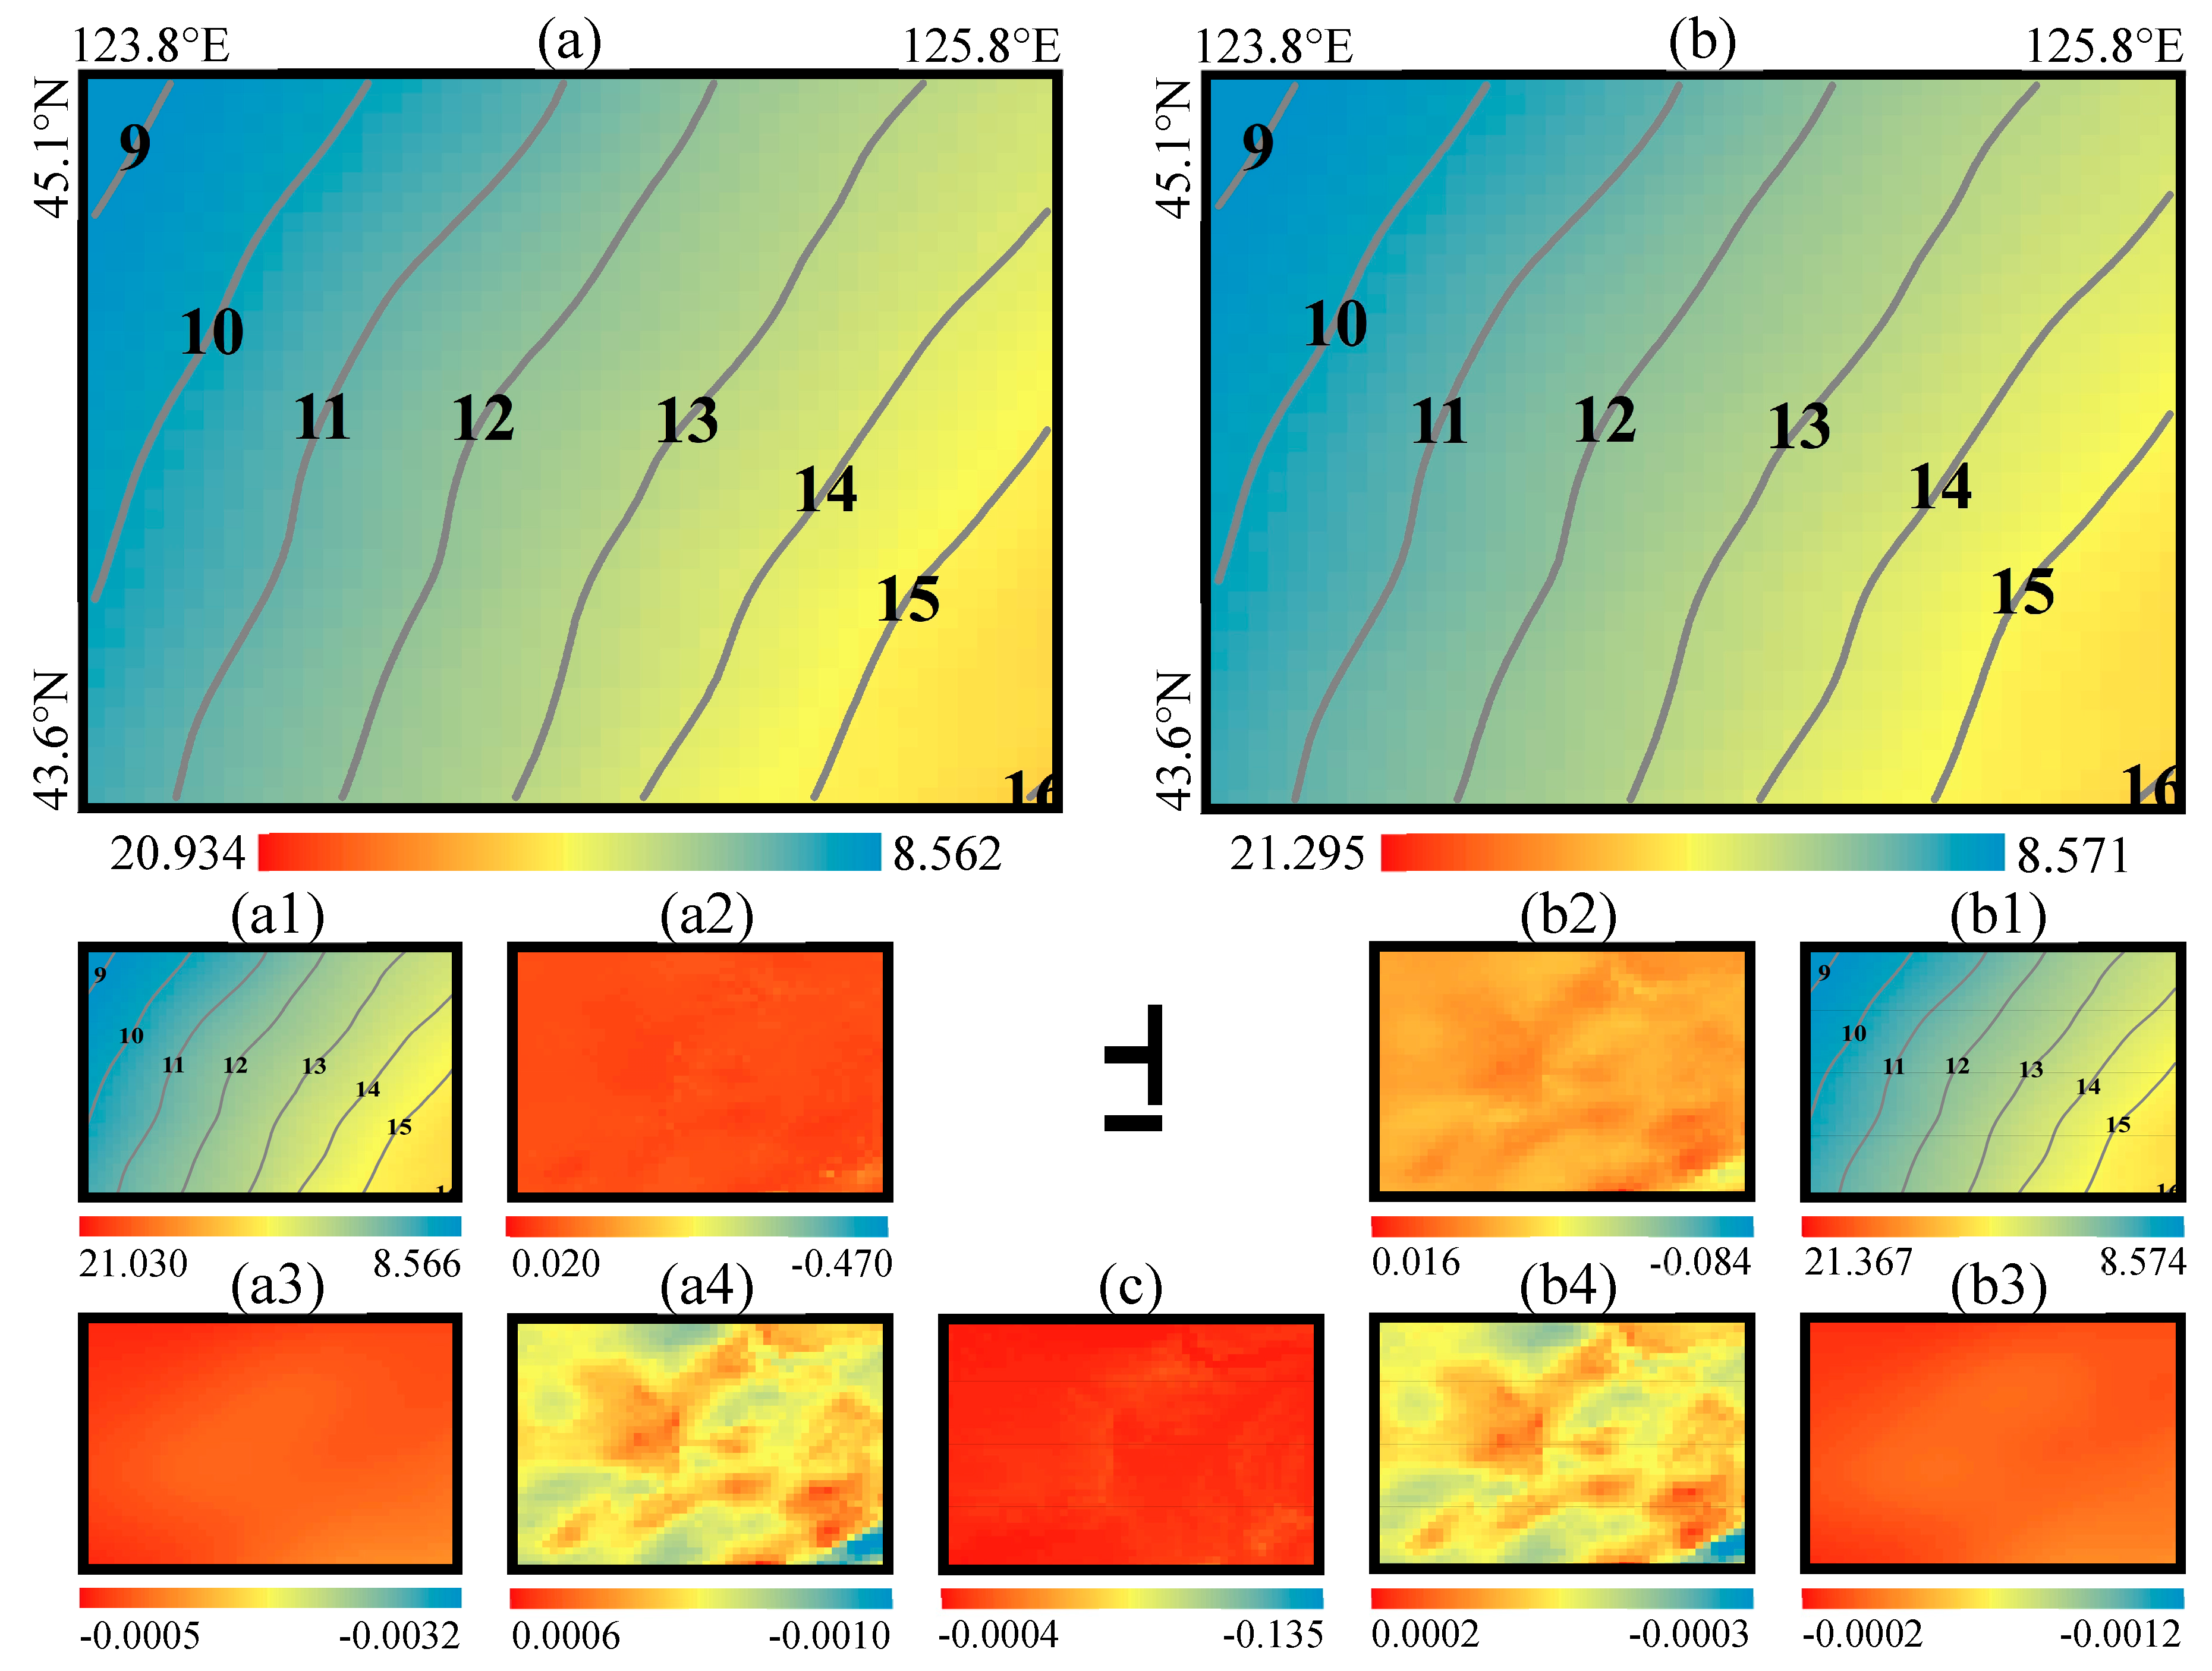
Figure 12.
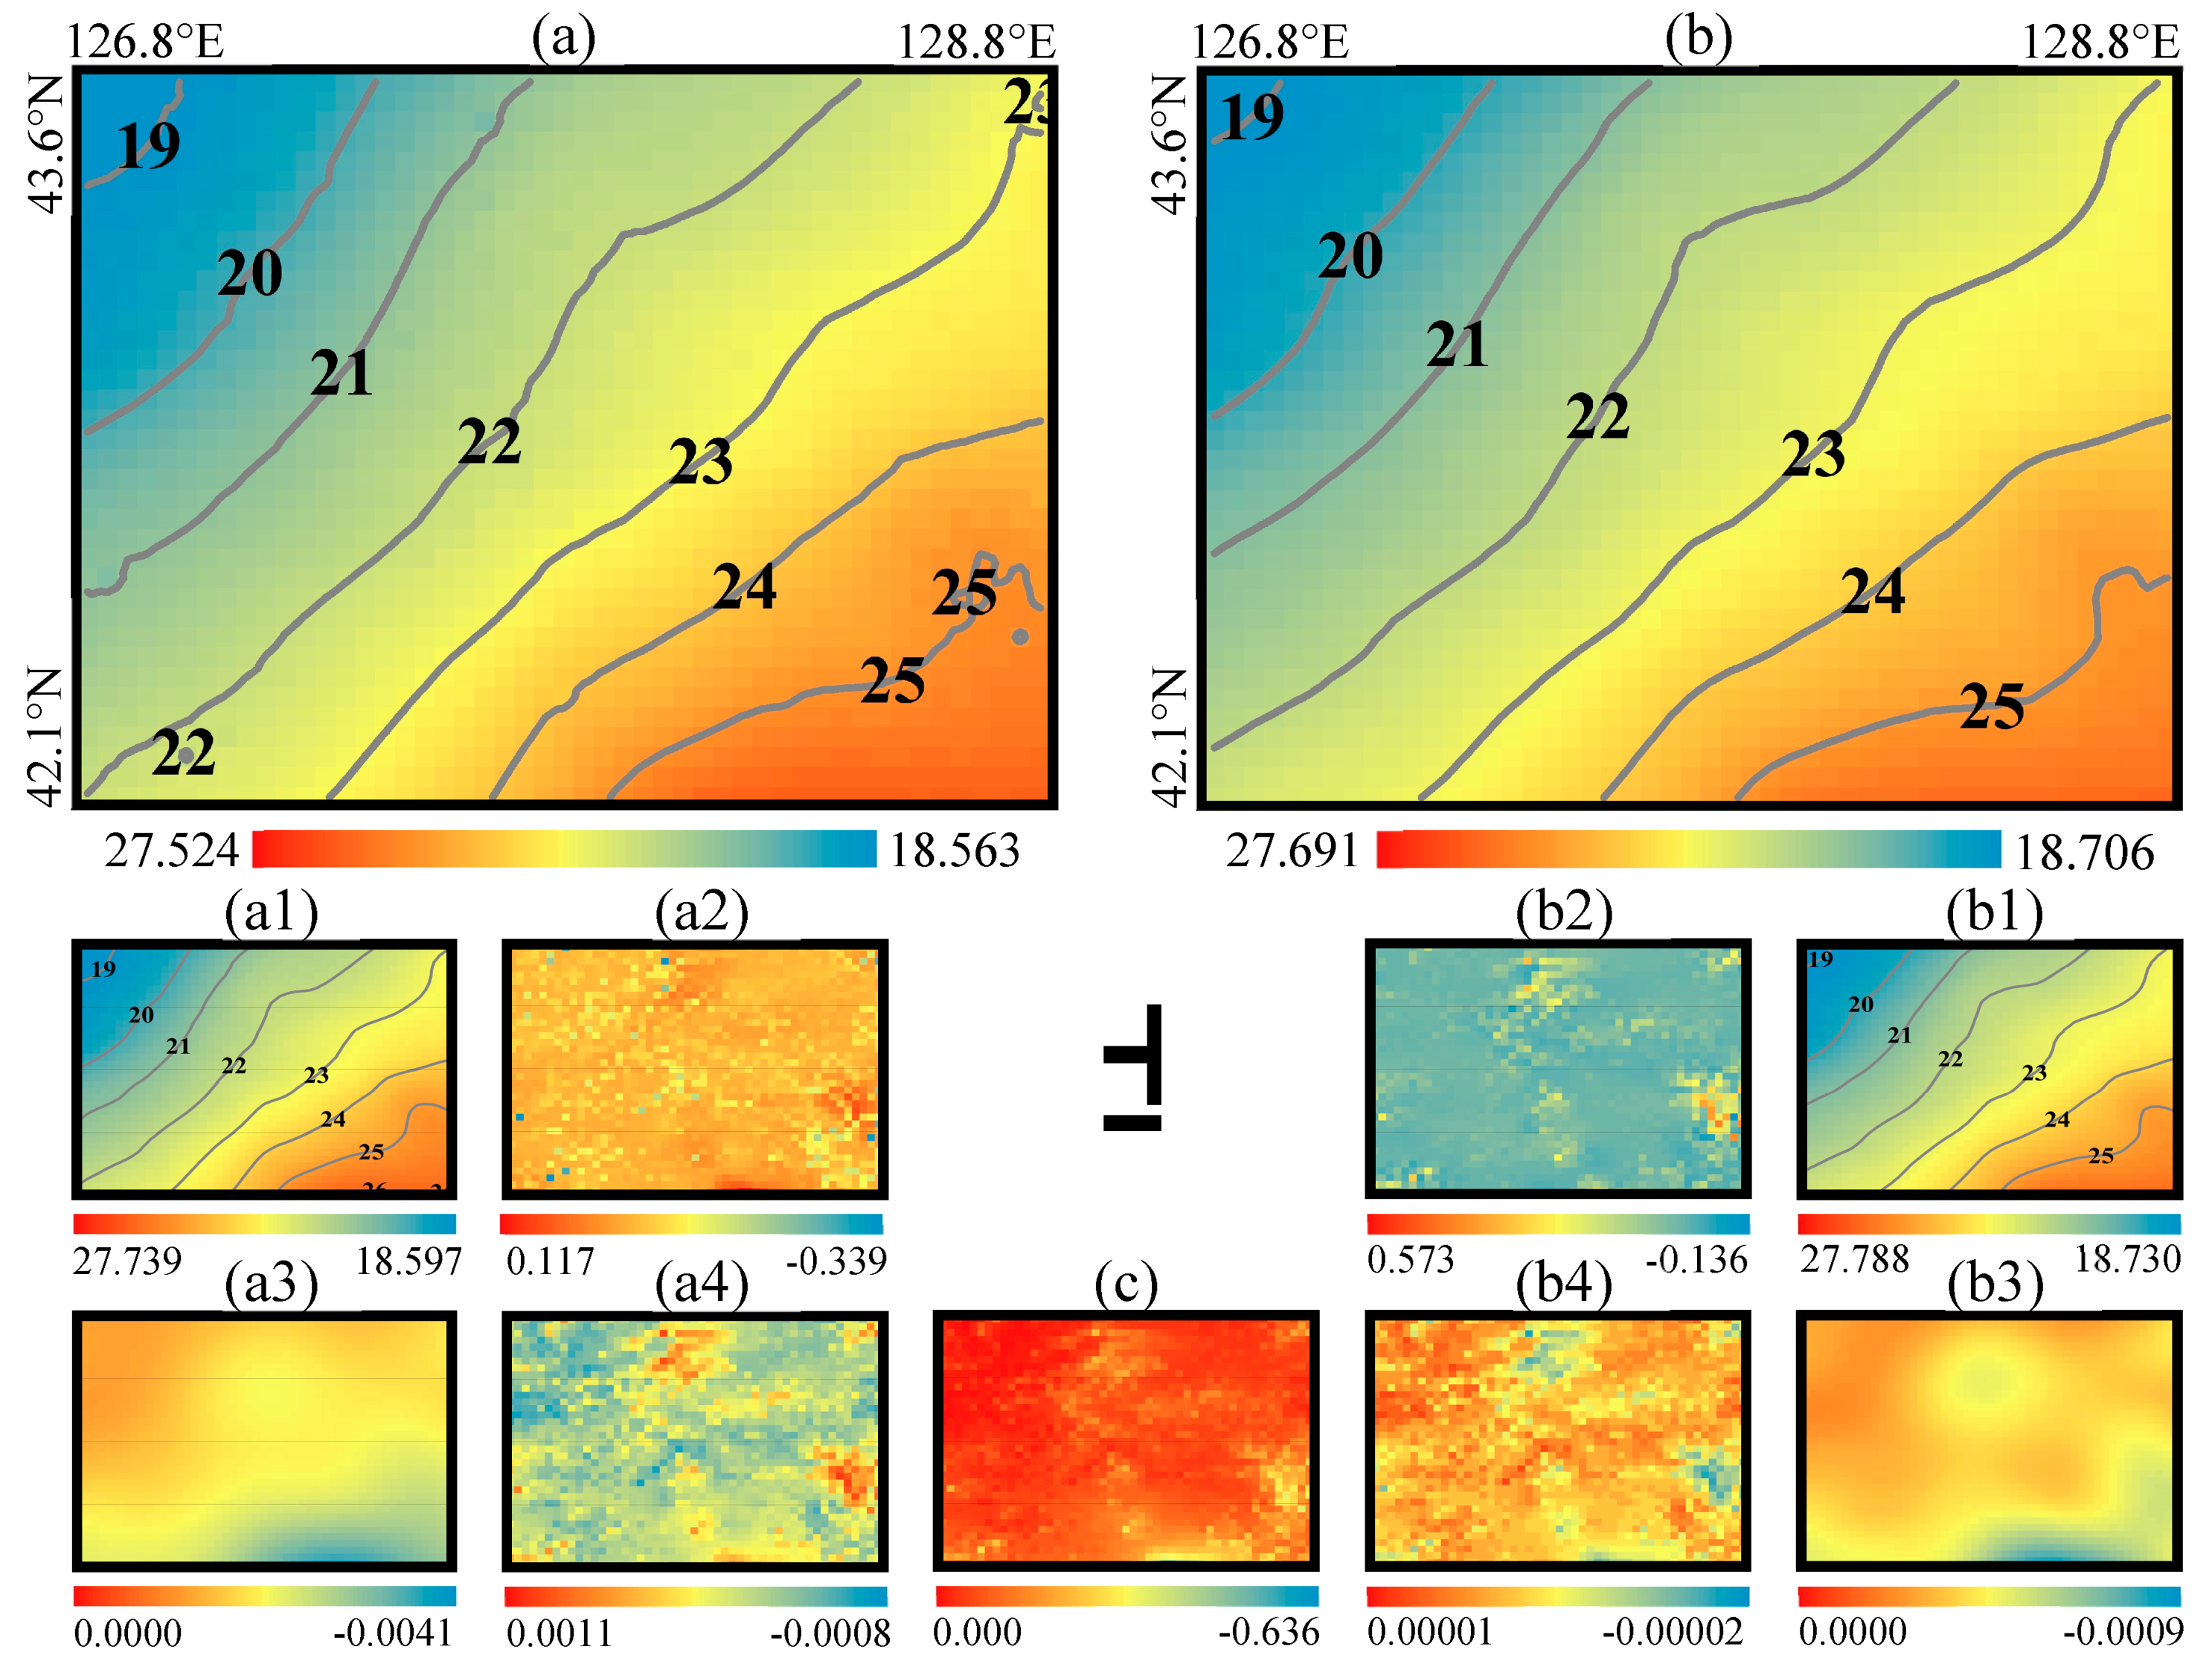
KTH-refined geoid and its corrections in Area A. (a) Geoid heights of the KTH08-A, (a1) approximate geoid undulation , (a2) Downward continuation correction , (a3) Combined atmospheric correction , (a4) Ellipsoidal correction ; (b) Geoid heights of the KTH16-A, (b1) The approximate geoid undulation , (b2) Downward continuation correction , (b3) Combined atmospheric correction , (b4) Ellipsoidal correction ; (c) Combined topographic correction . Unit: meter.
Figure 12.
KTH-refined geoid and its corrections in Area A. (a) Geoid heights of the KTH08-A, (a1) approximate geoid undulation , (a2) Downward continuation correction , (a3) Combined atmospheric correction , (a4) Ellipsoidal correction ; (b) Geoid heights of the KTH16-A, (b1) The approximate geoid undulation , (b2) Downward continuation correction , (b3) Combined atmospheric correction , (b4) Ellipsoidal correction ; (c) Combined topographic correction . Unit: meter.
Figure 13.
RCR-refined geoid and its constituents in Area B. (a) Geoid heights of RCR08-B, (a1) Contribution of the EGM2008 , (a2) Residual geoid height ; (b) Geoid heights of the RCR16-B, (b1) Contribution of the XGM2016 , (b2) Residual geoid height ; (c) Indirect effect on geoid height . Unit: meter.
Figure 14.
KTH-refined geoid and its corrections in Area B. (a) Geoid heights of the KTH08-B, (a1) The approximate geoid undulation , (a2) Downward continuation correction , (a3) Combined atmospheric correction , (a4) Ellipsoidal correction ; (b) Geoid heights of the KTH16-B, (b1) The approximate geoid undulation , (b2) Downward continuation correction , (b3) Combined atmospheric correction , (b4) Ellipsoidal correction ; (c) Combined topographic correction . Unit: meter.
Table 1.
Determination of stochastic modification parameters .
Table 1.
Determination of stochastic modification parameters .
| Parameters | Biased | Unbiased | Optimum |
|---|
| | | |
Table 2.
Comparison of EGM2008 and XGM2016 geoid heights with GPS/leveling derived ones in Jilin Province (cm).
Table 2.
Comparison of EGM2008 and XGM2016 geoid heights with GPS/leveling derived ones in Jilin Province (cm).
| | Jilin Province | Area A | Area B |
|---|
| Model | EGM2008 | XGM2016 | EGM2008 | XGM2016 | EGM2008 | XGM2016 |
|---|
| Max | 41.4 | 49.7 | 41.4 | 37.5 | 37.9 | 49.7 |
| Min | 12.6 | 14.0 | 14.3 | 14.0 | 12.6 | 18.0 |
| Range | 28.8 | 35.7 | 27.1 | 23.5 | 25.3 | 31.7 |
| Mean | 27.2 | 28.9 | 27.7 | 26.8 | 26.2 | 32.9 |
| STD | ±5.9 | ±6.9 | ±5.8 | ±5.5 | ±5.9 | ±7.3 |
Table 3.
Statistics of the gravity anomalies and the reduced ones (mGal).
Table 3.
Statistics of the gravity anomalies and the reduced ones (mGal).
| | Max | Min | Mean | STD |
|---|
| Area A-Original | 61.631 | −20.975. | 8.029 | ±9.651 |
| Minus EGM2008 | 22.643 | −28.856 | −1.514 | ±5.137 |
| Minus XGM2016 | 32.475 | −35.151 | −1.355 | ±6.319 |
| Minus EGM2008 and Helmert | 26.097 | −28.706 | −1.306 | ±5.247 |
| Minus XGM2016 and Helmert | 33.622 | −35.070 | −1.147 | ±6.437 |
| Area B-Original | 184.074 | −26.463 | 30.301 | ±25.256 |
| Minus EGM2008 | 46.053 | −92.712 | −3.575 | ±13.151 |
| Minus XGM2016 | 72.404 | −68.694 | −2.468 | ±15.934 |
| Minus EGM2008 and Helmert | 50.046 | −80.184 | −1.152 | ±12.874 |
| Minus XGM2016 and Helmert | 86.398 | −60.151 | −0.045 | ±16.340 |
Table 4.
Comparison of EGM2008 and XGM2016 RCR-geoid heights with GPS/leveling derived ones in Area A (cm).
Table 4.
Comparison of EGM2008 and XGM2016 RCR-geoid heights with GPS/leveling derived ones in Area A (cm).
| Area A | Before Fit | Four-Parameter Fit | Seven-Parameter Fit |
|---|
| Model | RCR08-A | RCR16-A | RCR08-A | RCR16-A | RCR08-A | RCR16-A |
|---|
| Max | 28.3 | 27.0 | 5.9 | 6.0 | 6.6 | 7.2 |
| Min | 14.4 | 12.3 | −7.8 | −8.4 | −5.6 | −6.4 |
| Range | 13.9 | 14.7 | 13.7 | 14.4 | 12.2 | 13.6 |
| Mean | 22.1 | 20.9 | 0.0 | 0.0 | 0.0 | 0.0 |
| STD | ±3.1 | ±3.2 | ±2.9 | ±3.0 | ±2.5 | ±2.8 |
Table 5.
Comparison of EGM2008 and XGM2016 KTH-geoid heights with GPS/leveling derived ones in Area A (cm).
Table 5.
Comparison of EGM2008 and XGM2016 KTH-geoid heights with GPS/leveling derived ones in Area A (cm).
| Area A | Before Fit | Four-Parameter Fit | Seven-Parameter Fit |
|---|
| Model | KTH08-A | KTH16-A | KTH08-A | KTH16-A | KTH08-A | KTH16-A |
|---|
| Max | 26.7 | 31.1 | 6.7 | 5.1 | 6.4 | 5.4 |
| Min | 12.7 | 17.8 | −7.9 | −7.6 | −5.6 | −6.2 |
| Range | 14.0 | 13.3 | 14.6 | 12.7 | 12.0 | 11.6 |
| Mean | 20.1 | 27.9 | 0.0 | 0.0 | 0.0 | 0.0 |
| STD | ±3.6 | ±2.8 | ±3.3 | ±2.6 | ±2.0 | ±2.4 |
Table 6.
Comparison of EGM2008 and XGM2016 RCR-geoid heights with GPS/leveling derived ones in Area B (cm).
Table 6.
Comparison of EGM2008 and XGM2016 RCR-geoid heights with GPS/leveling derived ones in Area B (cm).
| Area B | Before Fit | Four-Parameter Fit | Seven-Parameter Fit |
|---|
| Model | RCR08-B | RCR16-B | RCR08-B | RCR16-B | RCR08-B | RCR16-B |
|---|
| Max | 28.4 | 29.2 | 7.6 | 8.5 | 6.0 | 7.4 |
| Min | 14.8 | 13.3 | −4.8 | −7.6 | −5.4 | −5.2 |
| Range | 13.6 | 15.9 | 12.4 | 16.1 | 11.4 | 12.6 |
| Mean | 21.1 | 21.9 | 0.0 | 0.0 | 0.0 | 0.0 |
| STD | ±4.4 | ±4.6 | ±4.0 | ±4.5 | ±2.9 | ±3.5 |
Table 7.
Comparison of EGM2008 and XGM2016 KTH-geoid heights with GPS/leveling derived ones in Area B (cm).
Table 7.
Comparison of EGM2008 and XGM2016 KTH-geoid heights with GPS/leveling derived ones in Area B (cm).
| Area B | Before Fit | Four-Parameter Fit | Seven-Parameter Fit |
|---|
| Model | KTH08-B | KTH16-B | KTH08-B | KTH16-B | KTH08-B | KTH16-B |
|---|
| Max | 24.1 | 39.6 | 6.0 | 7.2 | 6.3 | 7.6 |
| Min | 9.3 | 26.2 | −6.1 | −5.7 | −5.0 | −6.3 |
| Range | 14.8 | 13.4 | 12.1 | 12.9 | 11.3 | 13.9 |
| Mean | 16.1 | 32.6 | 0.0 | 0.0 | 0.0 | 0.0 |
| STD | ±4.0 | ±4.1 | ±3.4 | ±3.8 | ±2.4 | ±3.7 |


