Article

Radar Interferometry as a Comprehensive Tool for Monitoring the Fault Activity in the Vicinity of Underground Gas Storage Facilities

1
Department of Geoinformatics, Faculty of Mining and Geology, VŠB–Technical University of Ostrava, 17. listopadu 2172/15, 708 00 Ostrava–Poruba, Czech Republic
2
IT4Innovations National Supercomputing Center, VŠB–Technical University of Ostrava, 17. listopadu 2172/15, 708 00 Ostrava–Poruba, Czech Republic
*
Author to whom correspondence should be addressed.
Remote Sens. 2020, 12(2), 271; https://doi.org/10.3390/rs12020271
Submission received: 27 November 2019 / Revised: 6 January 2020 / Accepted: 12 January 2020 / Published: 14 January 2020

Abstract

:
Underground gas storage facilities are an important element of the natural gas supply system. They compensate for seasonal fluctuations in natural gas consumption. Their expected lifetime is in tens of years. Continuous monitoring of underground gas storage is therefore very important to ensure its longevity. Periodic injection and withdrawal of natural gas can cause, among other things, vertical movements of the terrain surface. Radar interferometry is a commonly used method for tracking changes in the terrain height. It can register even relatively small height changes (mm/year). The primary aim of our research was to verify whether terrain behavior above a relatively deep underground gas storage can be monitored by this method and to assess the possibility of detecting the occurrence of anomalous terrain behavior in an underground gas storage area such as reactivation of faults in the area. The results show a high correlation between periodic injection and withdrawal of natural gas into/from the underground reservoir and periodic changes in terrain height above it (the amplitude of the height changes is in centimeters), which may allow the detection of anomalous phenomena. We documented special behavior of storage structures in the Vienna Basin: the areas adjacent to the underground gas storages show exactly the opposite phase of vertical movements, i.e., while the terrain above the underground reservoirs rises as natural gas is injected, the adjacent areas subside, and vice versa. Based on the analysis of geological conditions, we tend to conclude that this behavior is conditioned by the tectonic fault structure of the studied area.

Graphical Abstract

1. Introduction

Underground gas storage (UGS) facilities represent an important element of the energy system (natural gas supply) not only at national but also at the international level. They compensate for seasonal fluctuations in natural gas consumption. At the end of 2017, at about 671 UGSs were used for this purpose in the world, with working capacity 417 bcm (billion cubic metres). Other 142 UGSs were under construction at that time with a planned working capacity about 101 bcm [1]. Very often they are built in geological structures of depleted oil or natural gas reservoirs, in aquifers or caverns (most often built in salt domes or crystalline rocks) [2,3]. These are elements of the gas supply system whose expected lifetime is decades. Due to the periodicity of stress of the geological structure during injection and withdrawal of natural gas (changes in pore pressure in the storage layer typically reach 2–10 MPa [4]), over time, the underground technical equipment (injection/withdrawal wells) may be damaged and the geological structures themselves can deteriorate. Continuous monitoring of underground gas storage is therefore very important to ensure its longevity.
The activity of any UGS can be manifested by vertical movements of the Earth’s surface above the UGS area [5], which reflect cyclic injection and withdrawal of gas from the reservoir – see Figure 1. Injection pressure typically ranges from units of MPa to the first tens of MPa ([5,6], Table 1). The induced vertical terrain movement above the UGS is quite small, from millimetres to the first centimetres [4,7]).
In our research, we focused on the possibility to study the behavior of geological storage structure used as a UGS using satellite radar interferometry methods, namely to study the latent activity of tectonic faults in the vicinity of the UGS, which can potentially influence the lifetime of the UGS or its safety.
The vertical movements of the terrain can be tracked by contact methods (such as usual geodetic measurements, or global navigation satellite systems (GNSS) measurements) or contactless methods (especially satellite radar interferometry, InSAR).
The contact methods require costly equipment, human resources, time and workmanship, with a relatively long data collection period (months or more) and a low spatial density of data collection. Contactless methods, especially InSAR, allow monitoring larger areas with the possibility of detecting the occurrence of different behavior of UGS sites, especially in specific objects such as wells or special corner reflectors that keep InSAR signal coherent. Such coherent points can be analyzed by InSAR methods that take advantage of multitemporal datasets, particularly by Permanent Scatterers (PS) InSAR method [8]. The wells are burden with cyclic pressure changes that may cause their damage. Monitoring of the heads of the wells using contactless methods has the potential to identify emerging failures and can be often a significantly cheaper solution, e.g., an application of some of the InSAR methods on data from Copernicus Sentinel-1 system [9] that are offered in the open and free data policy.
InSAR data are acquired by satellites usually with temporal sampling in the range of days to weeks, the current interval between Sentinel-1 acquisitions from the same satellite orbital track is 6 days in Europe. This allows for reliable datasets where the velocity of displacements of observable objects above the UGS can be monitored by PS InSAR technique with the sensitivity to the nearest millimetre per year in the generally vertical direction [10]. Depending on the local environment, the spatial variation of points analyzed by multitemporal InSAR methods can reach a high density suitable for interpretation on the UGS influence on the terrain. Investigation of the estimated time series of displacements may bring new information related to seasonal variability of terrain deformations. However various factors degrade the measurement quality of InSAR, e.g., a signal decorrelation due to the presence of vegetation, snow etc. Such factors cause processing difficulties and may drop the reliability of the results, e.g., by the increased standard deviation of estimated velocity.
Due to the assumed amplitude of altitude changes ranging from millimetres to centimetres and the areal size of any UGS, the use of non-contact methods, namely satellite InSAR methods, seems to be very suitable. Yet the monitoring of the UGSs by InSAR methods is not quite common, or at least its results are not commonly published. Only a few authors deal with the use of InSAR for UGSs monitoring systematically. E.g., Mosconi et al. [11] strongly recommend the use of InSAR for the UGS monitoring after summarizing the experience of 10 years of research in this field. The Teatiny et al. [4] deal with general geomechanical aspects of UGS operations, which are divided into subsurface and surface. In the subsurface, damage of the storage layer due to cyclic stresses occurring during natural gas injection or withdrawal is of particular concern to the UGS operations, as well as damage to the overlying sealing layer due to cracks, and reactivation of potential faults in the UGS area.
Surface impacts relate to a potential violation of above-ground and subsurface infrastructure due to cyclic vertical movements of the Earth’s surface.
The presented study confirmed the ability of the PS InSAR method to monitor cyclic vertical changes in terrain relief with injection/withdrawal of natural gas into a UGS built in the depleted gas reservoir. Similar results are reported by [12]. It also shows, among other things, that the data obtained by the PS InSAR method precisely calibrates and verifies the geomechanical model of the UGS built in the depleted gas reservoirs. These results are further elaborated in [13]. Haghighi and Motagh [7] then demonstrate the usability of Sentinel–1 satellite data to monitor ground surface movement over the UGS built in salt pillows north of Berlin. Lubitz et al. [14] deal with tracking terrain movements due to CO2 geosequestration into an underground structure. They show a strong correlation between the pressure at the heel of the injection wells and the change in terrain height. Qiao et al. [15] show a strong correlation between changes in terrain height and gas pressure in the UGS. Loesch and Vasit [16] deal with the impact of oil and gas extraction and the simultaneous injection of wastewater on the seismicity of the area. They show, inter alia, that areas showing vertical movements can be bounded by tectonic faults.
Our research aim is to verify the possibility of using the monitoring of cyclic surface deformation above a UGS to detect anomalous storage structure behavior. Periodic pressure changes in the collector, also transmitted to the surrounding rocks, may lead to a decrease in the permeability of collector rocks and thus to a decrease in the operational capacity and the rate of gas withdrawal from the UGS, furthermore may lead to leakage in cap rocks due to cracks and may reactivate faults in the area. In our research, we focused on the detection of fault activity in a UGS neighborhood, based on the assumed different development of vertical terrain movements in the vicinity of the fault. Practical testing was performed on the UGSs operated in the east of the Czech Republic and the west of Slovakia (Figure 11). Also, we included one UGS located in an adjacent area in eastern Austria. We have shown that in the case of the UGSs built in depleted natural gas reservoirs in a Neogene sedimentary Vienna Basin, it is possible to detect movements along the Neogene faults located in the UGS neighborhood from the PS InSAR data.

2. Materials and Methods

2.1. Satellite SAR for Non-Linear Displacements Monitoring

Satellite Synthetic Aperture Radar (SAR) interferometry (InSAR) is an established technology used for monitoring large-scale land deformations [17] as well as local infrastructure displacements [18]. The basis of the technique lies in an interferometric combination of SAR images in cases of SAR satellites that keep enough stability and orbital tube to preserve interferometrically coherent phase signal, i.e., a measured average portion of a retro-reflected SAR carrier wave [19]. Considering wavelength of ~5.5 cm in case of common C–band missions (e.g., Sentinel–1), the sensitivity of InSAR measurements of displacements in the SAR line of sight (~20–50° from nadir) goes down to around a millimetre. The measurements are affected by numerous error sources, including height phase induction, the variability of electromagnetic wave delay through passing atmosphere, signal decorrelation etc. [20]. Many of these errors are reduced using correction models (e.g., digital elevation models or meteorological models) or numerically by a combination of a larger number of SAR images within some multitemporal InSAR technique.
PS multitemporal InSAR technique is preparing differential interferograms in combination with a common reference image [8]. It is claimed to achieve ~1 mm/year accuracy of the satellite-based measurements [21]. The technique works accurately for urban, bare rock or similar scatterers, while the displacements signal is lost due to a temporal decorrelation in case of natural areas. The reported limit of displacements is maximally a quarter of radar wavelength between SAR measurements [20]. The stated accuracy of PS InSAR was well-evaluated and confirmed [10].

2.2. Our Approach to InSAR Monitoring

We have applied an open-source implementation of a modified PS technique, known as the Stanford Method for Persistent Scatterers (StaMPS) [22] on a relatively large Sentinel–1 dataset (October 2014–May 2019) covering almost five full cycles of natural gas injection/withdrawal, ensuring the stability of evaluated InSAR parameters in case of non-linear displacements [23]. Sentinel–1 data were specifically processed using open-source InSAR Scientific Computing Environment (ISCE) interferometric SAR processor [24] in a custom strategy reflected in open-source IT4S1 implementation of HPC-ready data production chain [25].
Here, standard Sentinel–1 interferometric wide swath (IWS) data are pre-processed into a set of interferometric analysis-ready data (IARD) that are coregistered and corrected for spectral diversity [26] and topography [27]. For topography removal, a 1 arc-second Shuttle Radar Topography Mission Digital Elevation Model (SRTM DEM) has been used [28]. The IARD data are stored in units called bursts. Burst size differs based on current Sentinel–1 track configuration during burst acquisition—bursts over our selected UGS areas were of around ~120 × 30 km. We have selected all bursts overlapping UGSs, performed an initial crop (keeping at least 1 km buffer zone around the areas of interest) and applied multitemporal InSAR processing routine using optimized StaMPS codes. To keep the reliability of results, we have used only PS InSAR outputs for further analysis. After the processing, the outputs were exported to a GIS format and merged before further post-processing.

2.3. Method of Processing the PS InSAR Method Outputs

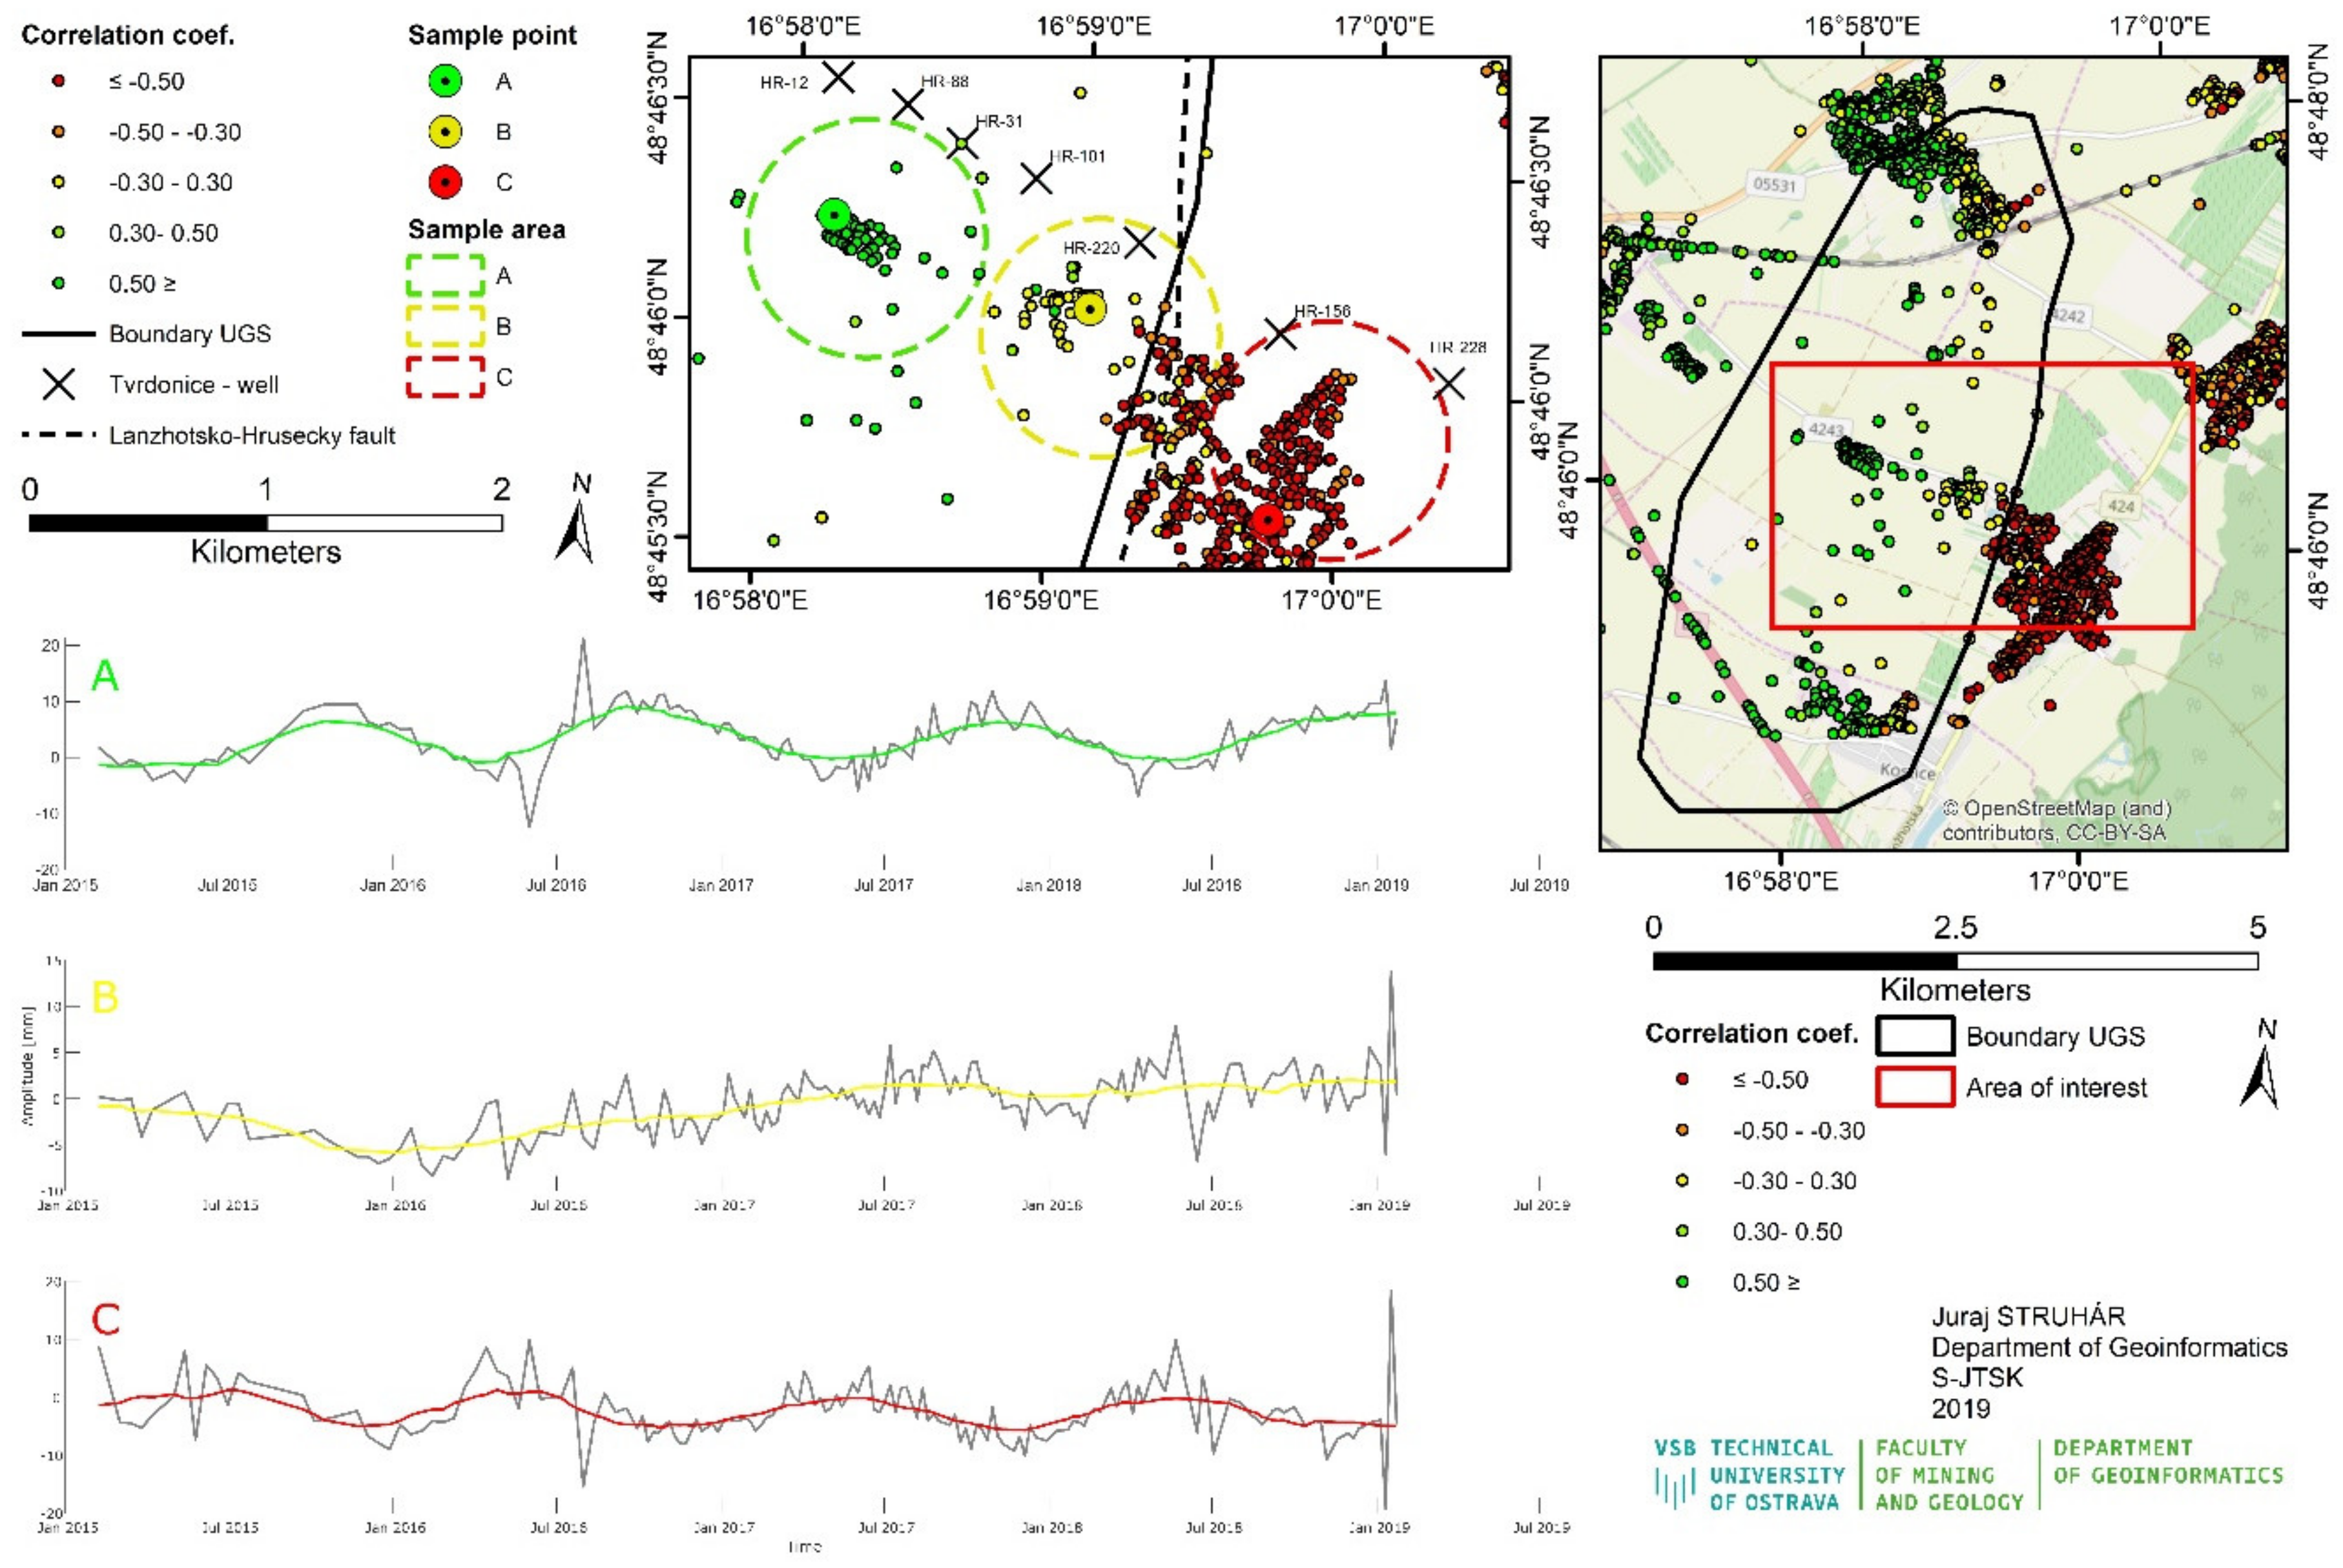
The output of radar data processing by the PS InSAR method is a text file containing spatial changes (mainly in altitude) of PS points in the monitored area that represent stably reflecting objects with fairly strong radar back-scatter. The processed files contain about 4000 to 10,000 PS points, for which, the position is recorded in geographical coordinates, height changes for the monitored period, coherence and other data, which are the output of PS InSAR method. Figure 2 shows examples of height changes for three PS points selected from areas A, B and C at the Tvrdonice UGS (see later in Figure 8). Figures 4 and 9 show distribution of the PS points over some of the studied UGSs and UGS areas.
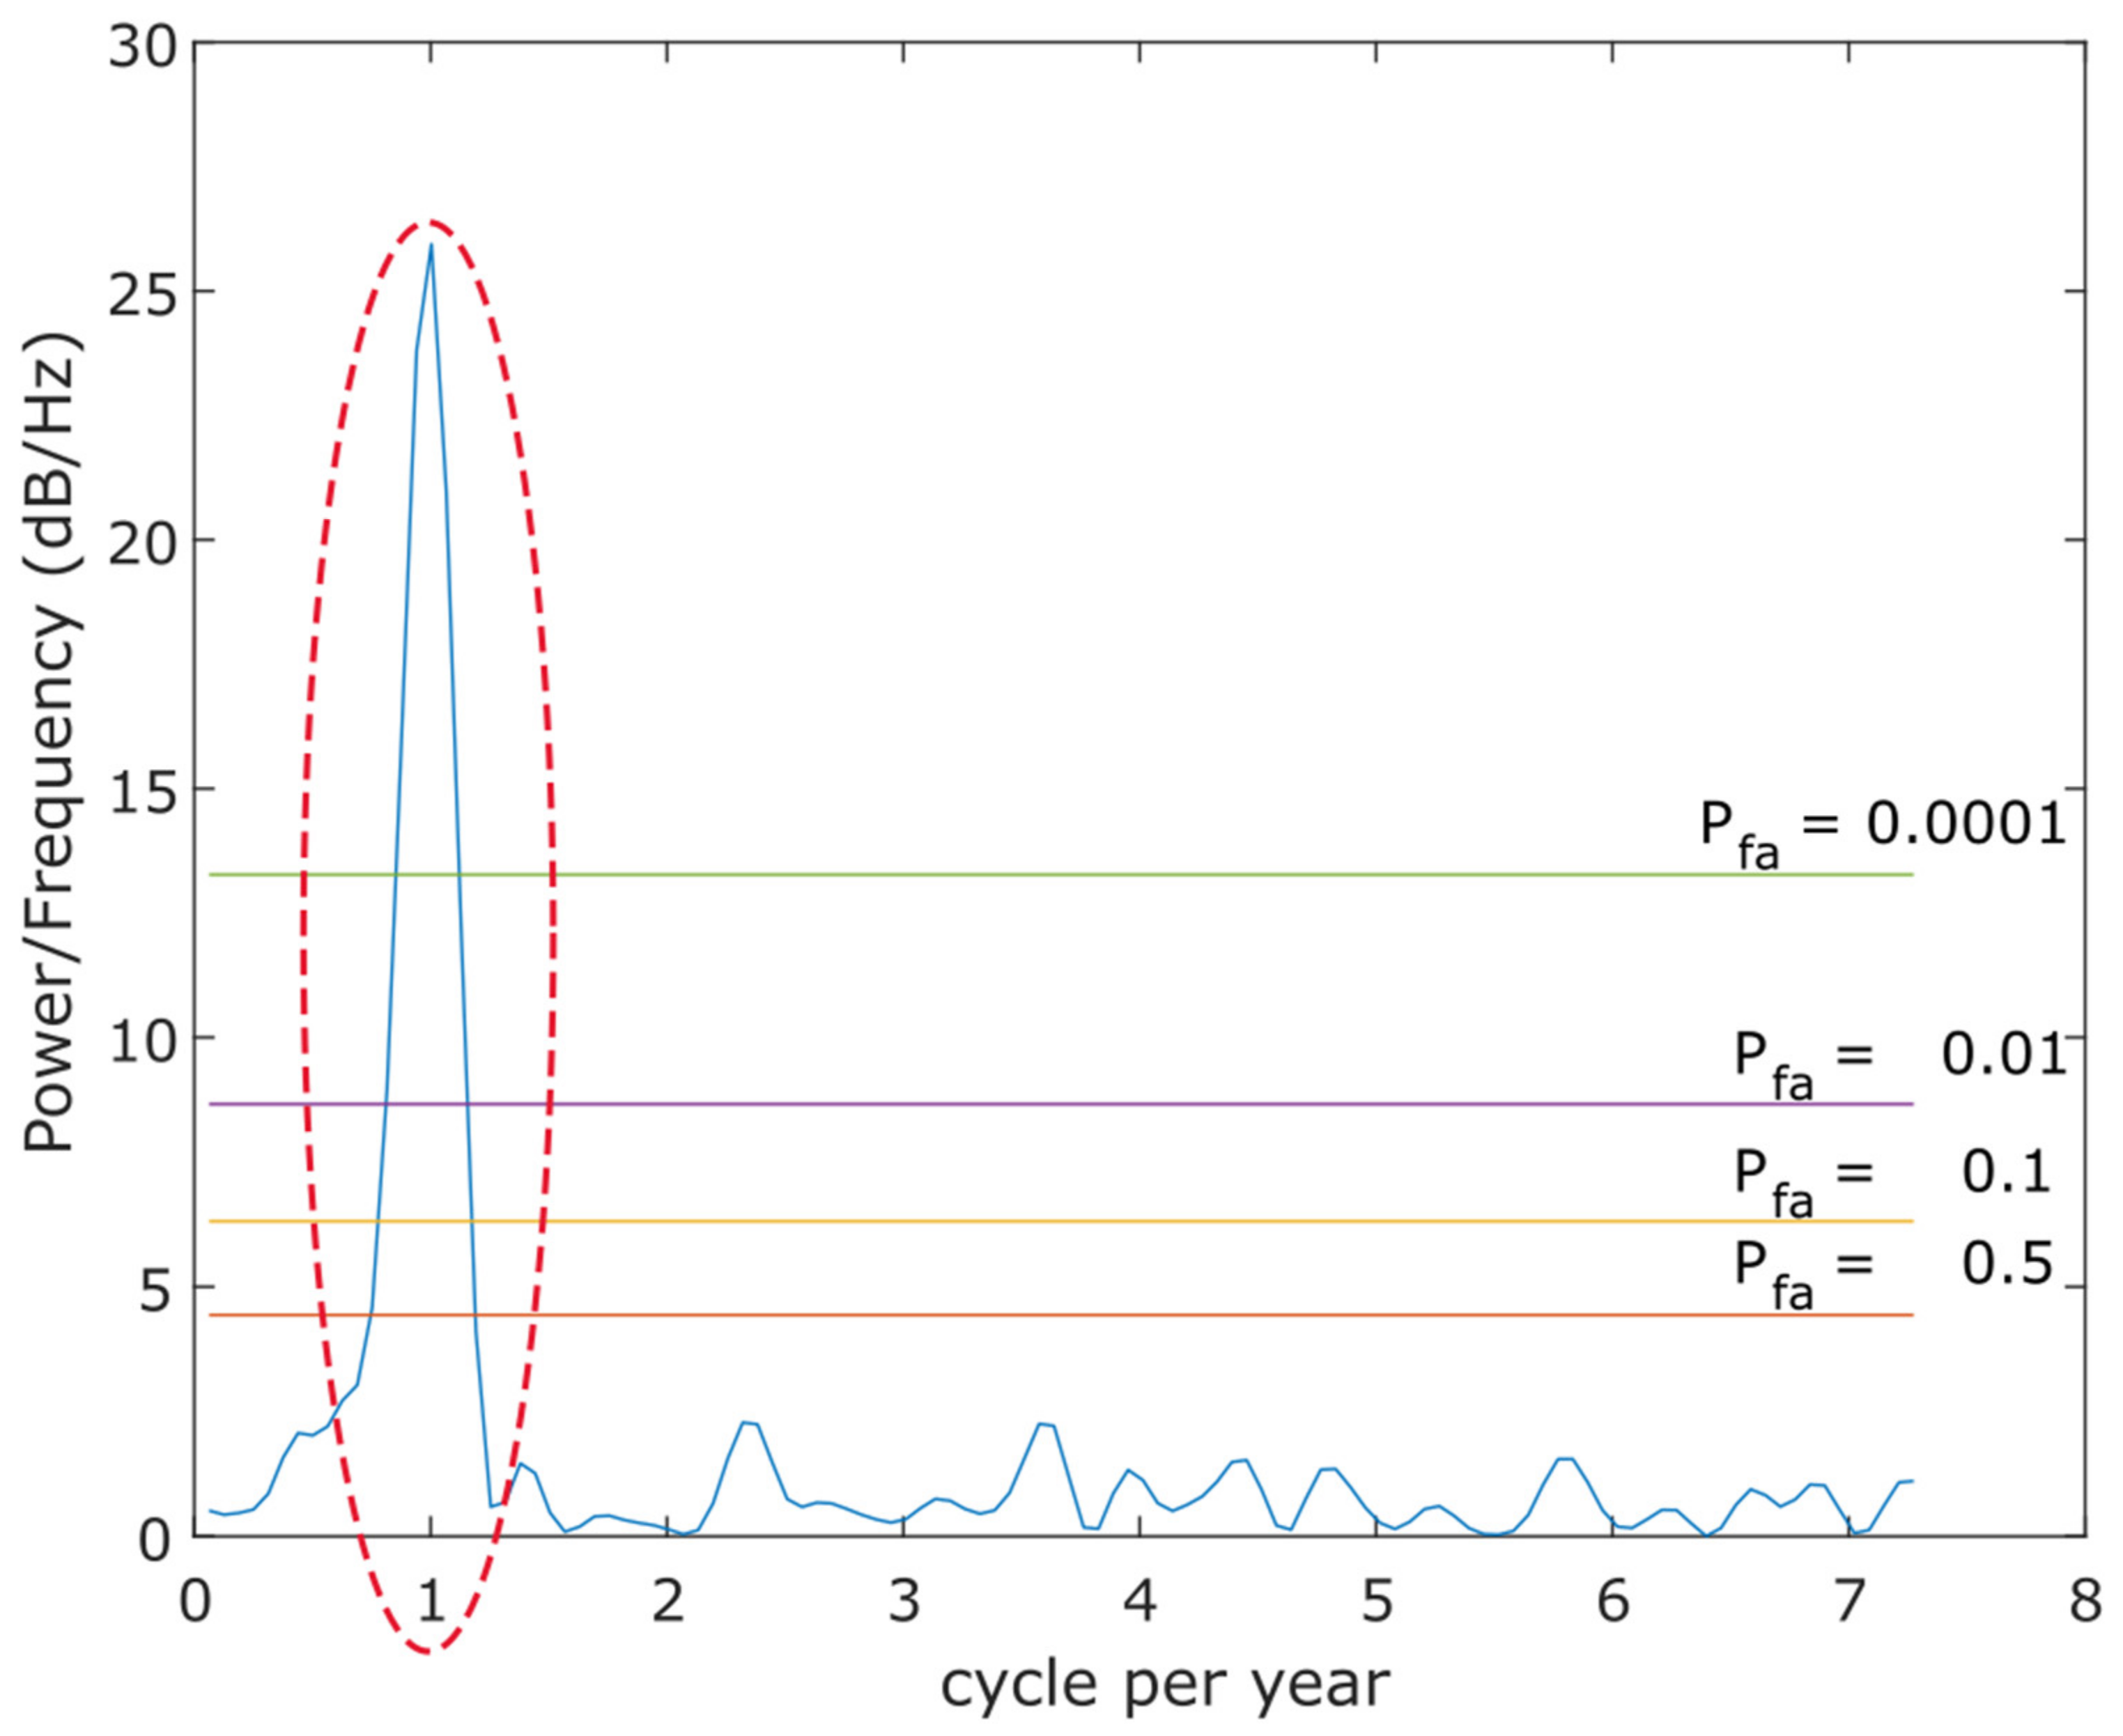
When processing the outputs from the PS InSAR method, we focused primarily on verifying that the obtained data contain a regular annual period of PS height change in the UGS area and, therefore, that the PS height and the terrain itself is influenced by the UGS activity. For this purpose, we used the Lomb–Scargle periodogram [29]. This is a well-known algorithm used to detect periodic signals in irregularly sampled data. Using it, we generated a periodogram for each PS point. By analysing these points we have verified that the data related to points lying in the area of the UGS contain an annual period and can, therefore, be used for studying the UGS behavior (see Figure 3).
Since we want to calculate the correlation between the theoretical terrain movement curve and the actual measurements in a later step, we decided to smooth out the measured data. To smooth out the data, we used a moving average with a 180–day window (this is half of a UGS injection/withdrawal cycle period) and a calculation of the smoothed value to the middle of the interval. We shifted this window by 6–day steps, corresponding to the rate of regular sampling. The results are demonstrated in Figure 2.
The next step is to determine the reference periodic curve representing the expected vertical terrain movement during the gas injection/withdrawal cycle. The first step was to determine the amplitude of the height change A. Amplitude A was calculated from the data for the Tvrdonice UGS at 5.35 mm. The same value was used for other UGSs as the changes in terrain height detected for them were in a similar range. The frequency f was then selected, which corresponds to 1/365, i.e., the length of the period equals one year. The last parameter is the phase shift ϕ between the beginning of the data series (February) and the beginning of the natural gas withdrawal from a UGS (November), so ϕ = π/2. As a result, the reference periodic curve reached a minimum at the turn of April and May (the UGS is empty, terrain height is minimal—see Figure 1) and maximum in the turn of October and November (the UGS is full, terrain height is maximum—see Figure 1). Subsequently, the values were calculated as rpc for each sampling time (in 6-day increments) according to the relation:
r p c = A c o s 2 π f x + φ ,
Here x represents the number of days from the beginning of the processed time interval. We used this model for all evaluated UGSs. It could be changed if there will be different begin of injection or withdrawal of natural gas from UGS. Then parameter φ will change.
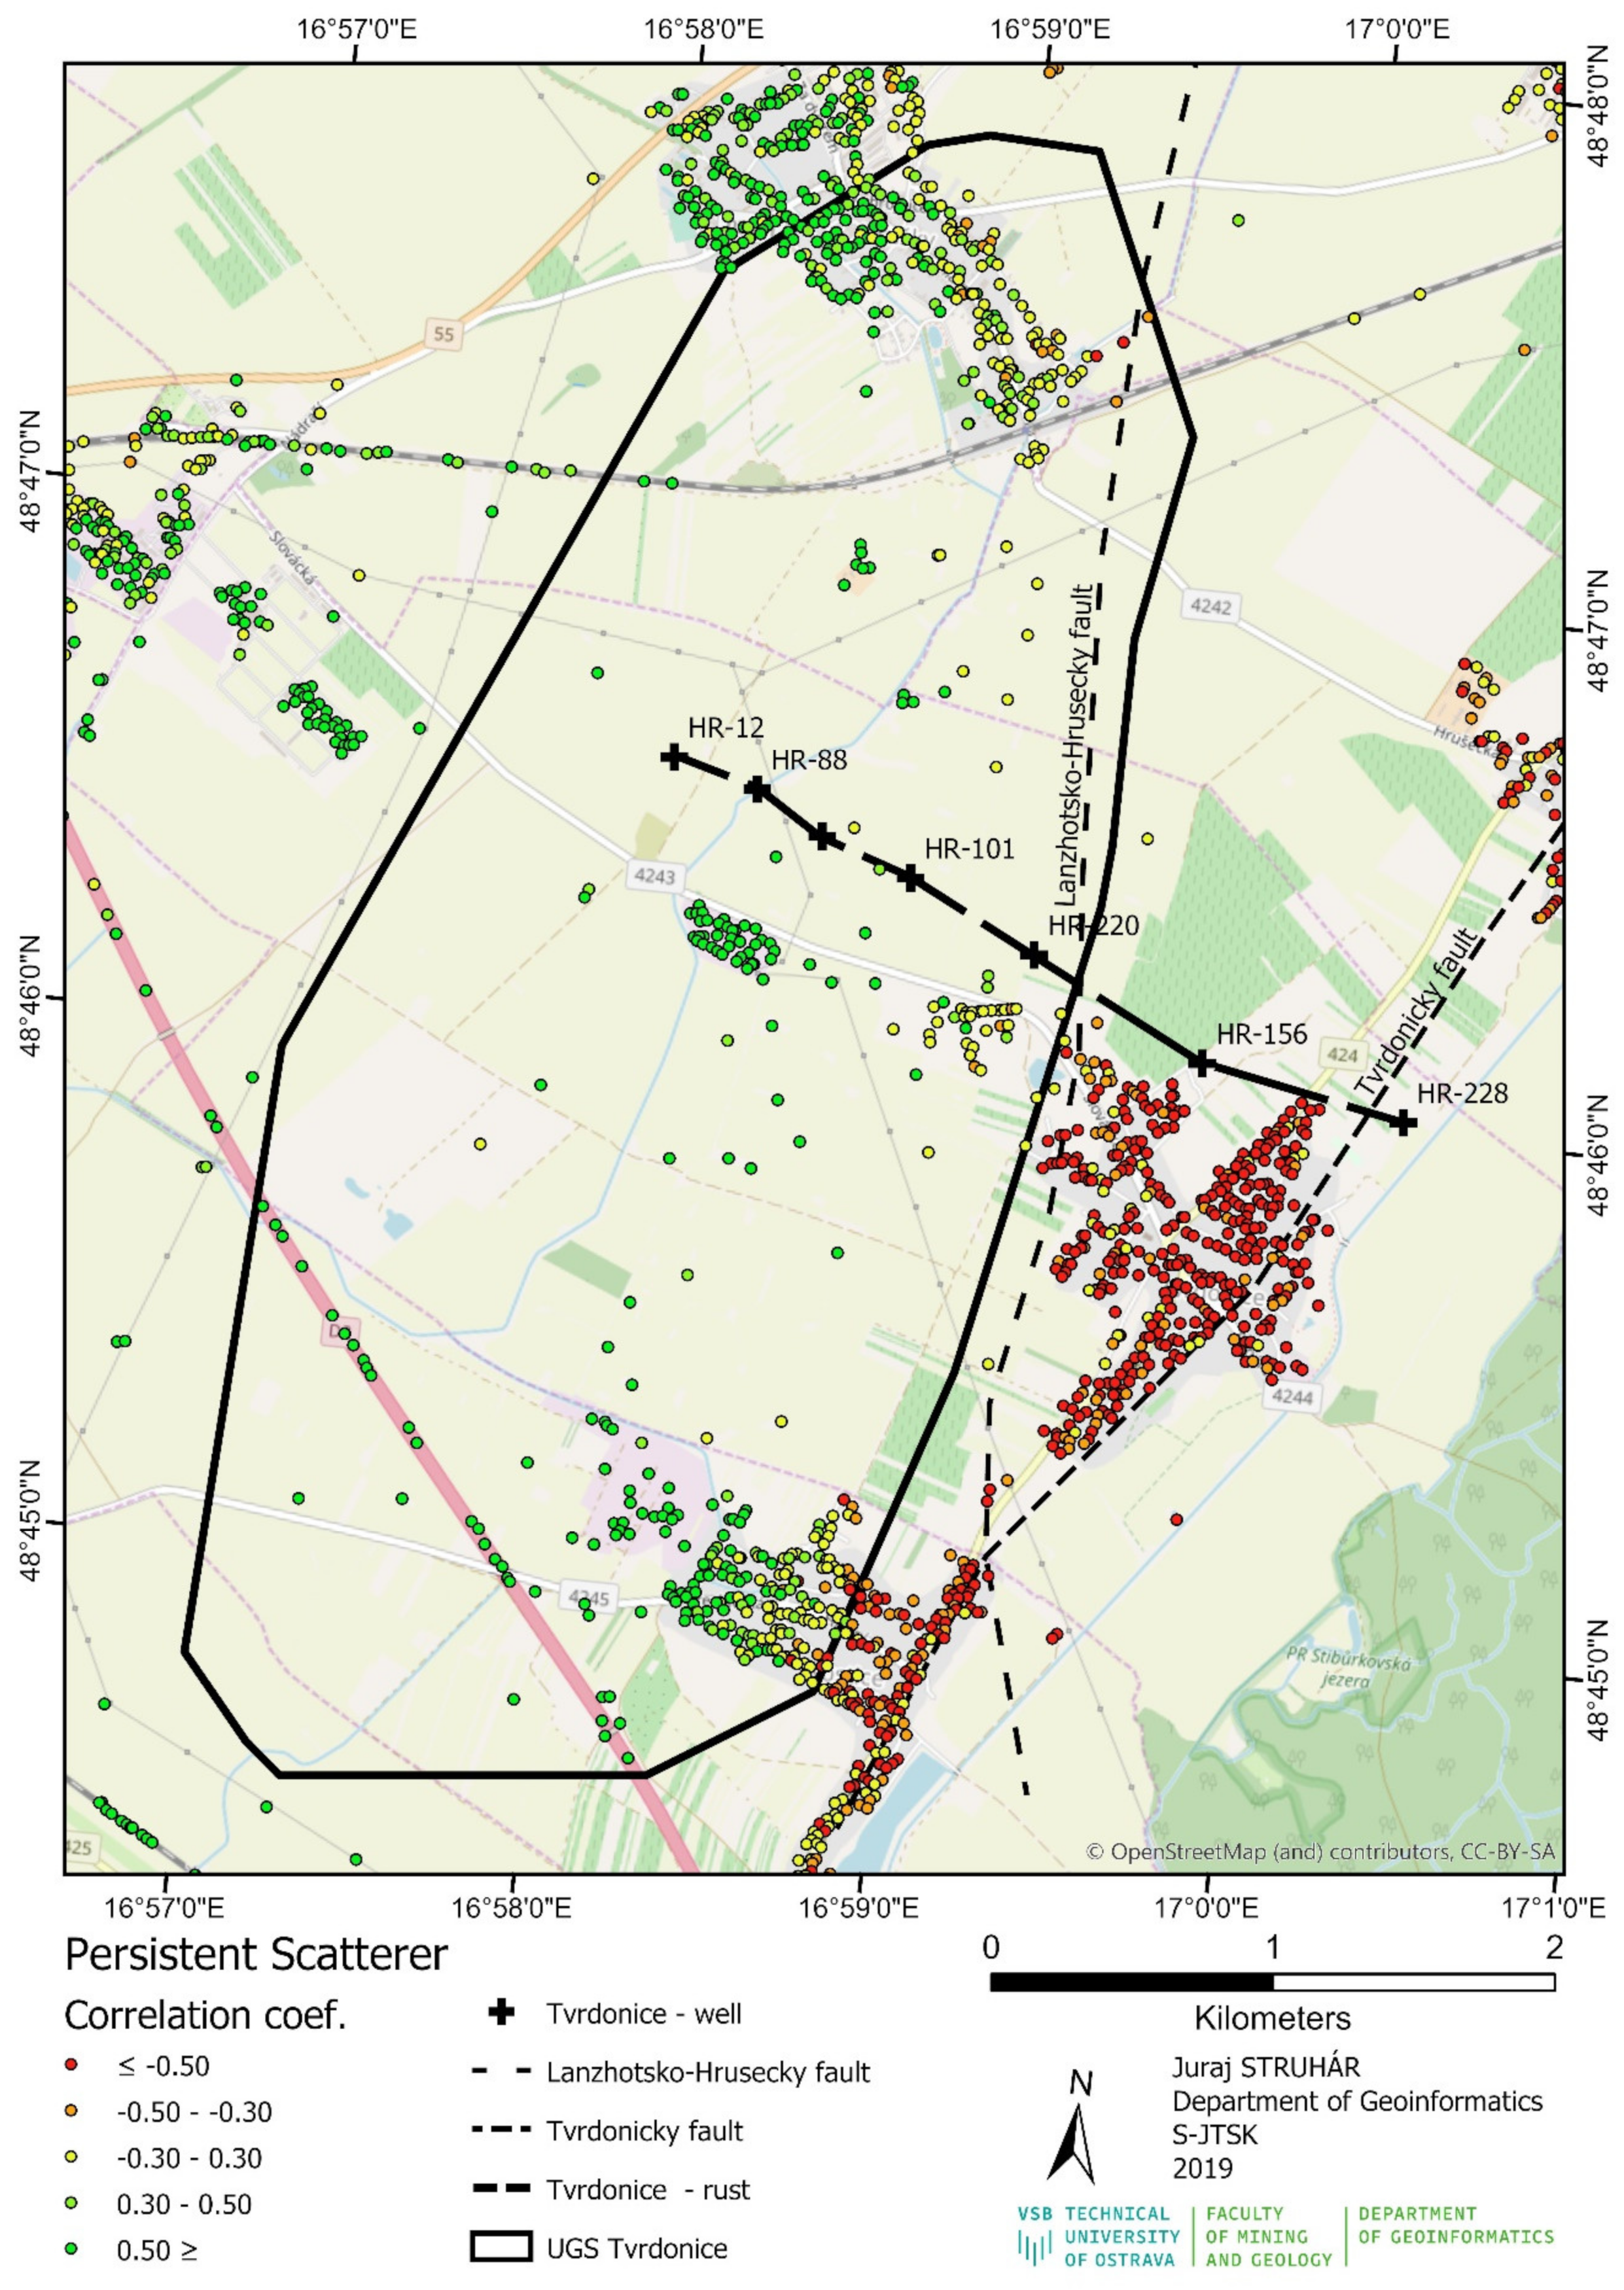
After all, the correlation between the reference periodic curve and the smoothed curves created for every PS point was calculated. The correlation coefficient r value has been assigned to each PS point. An example of the distribution of correlation coefficient values in space is given in Figure 4.
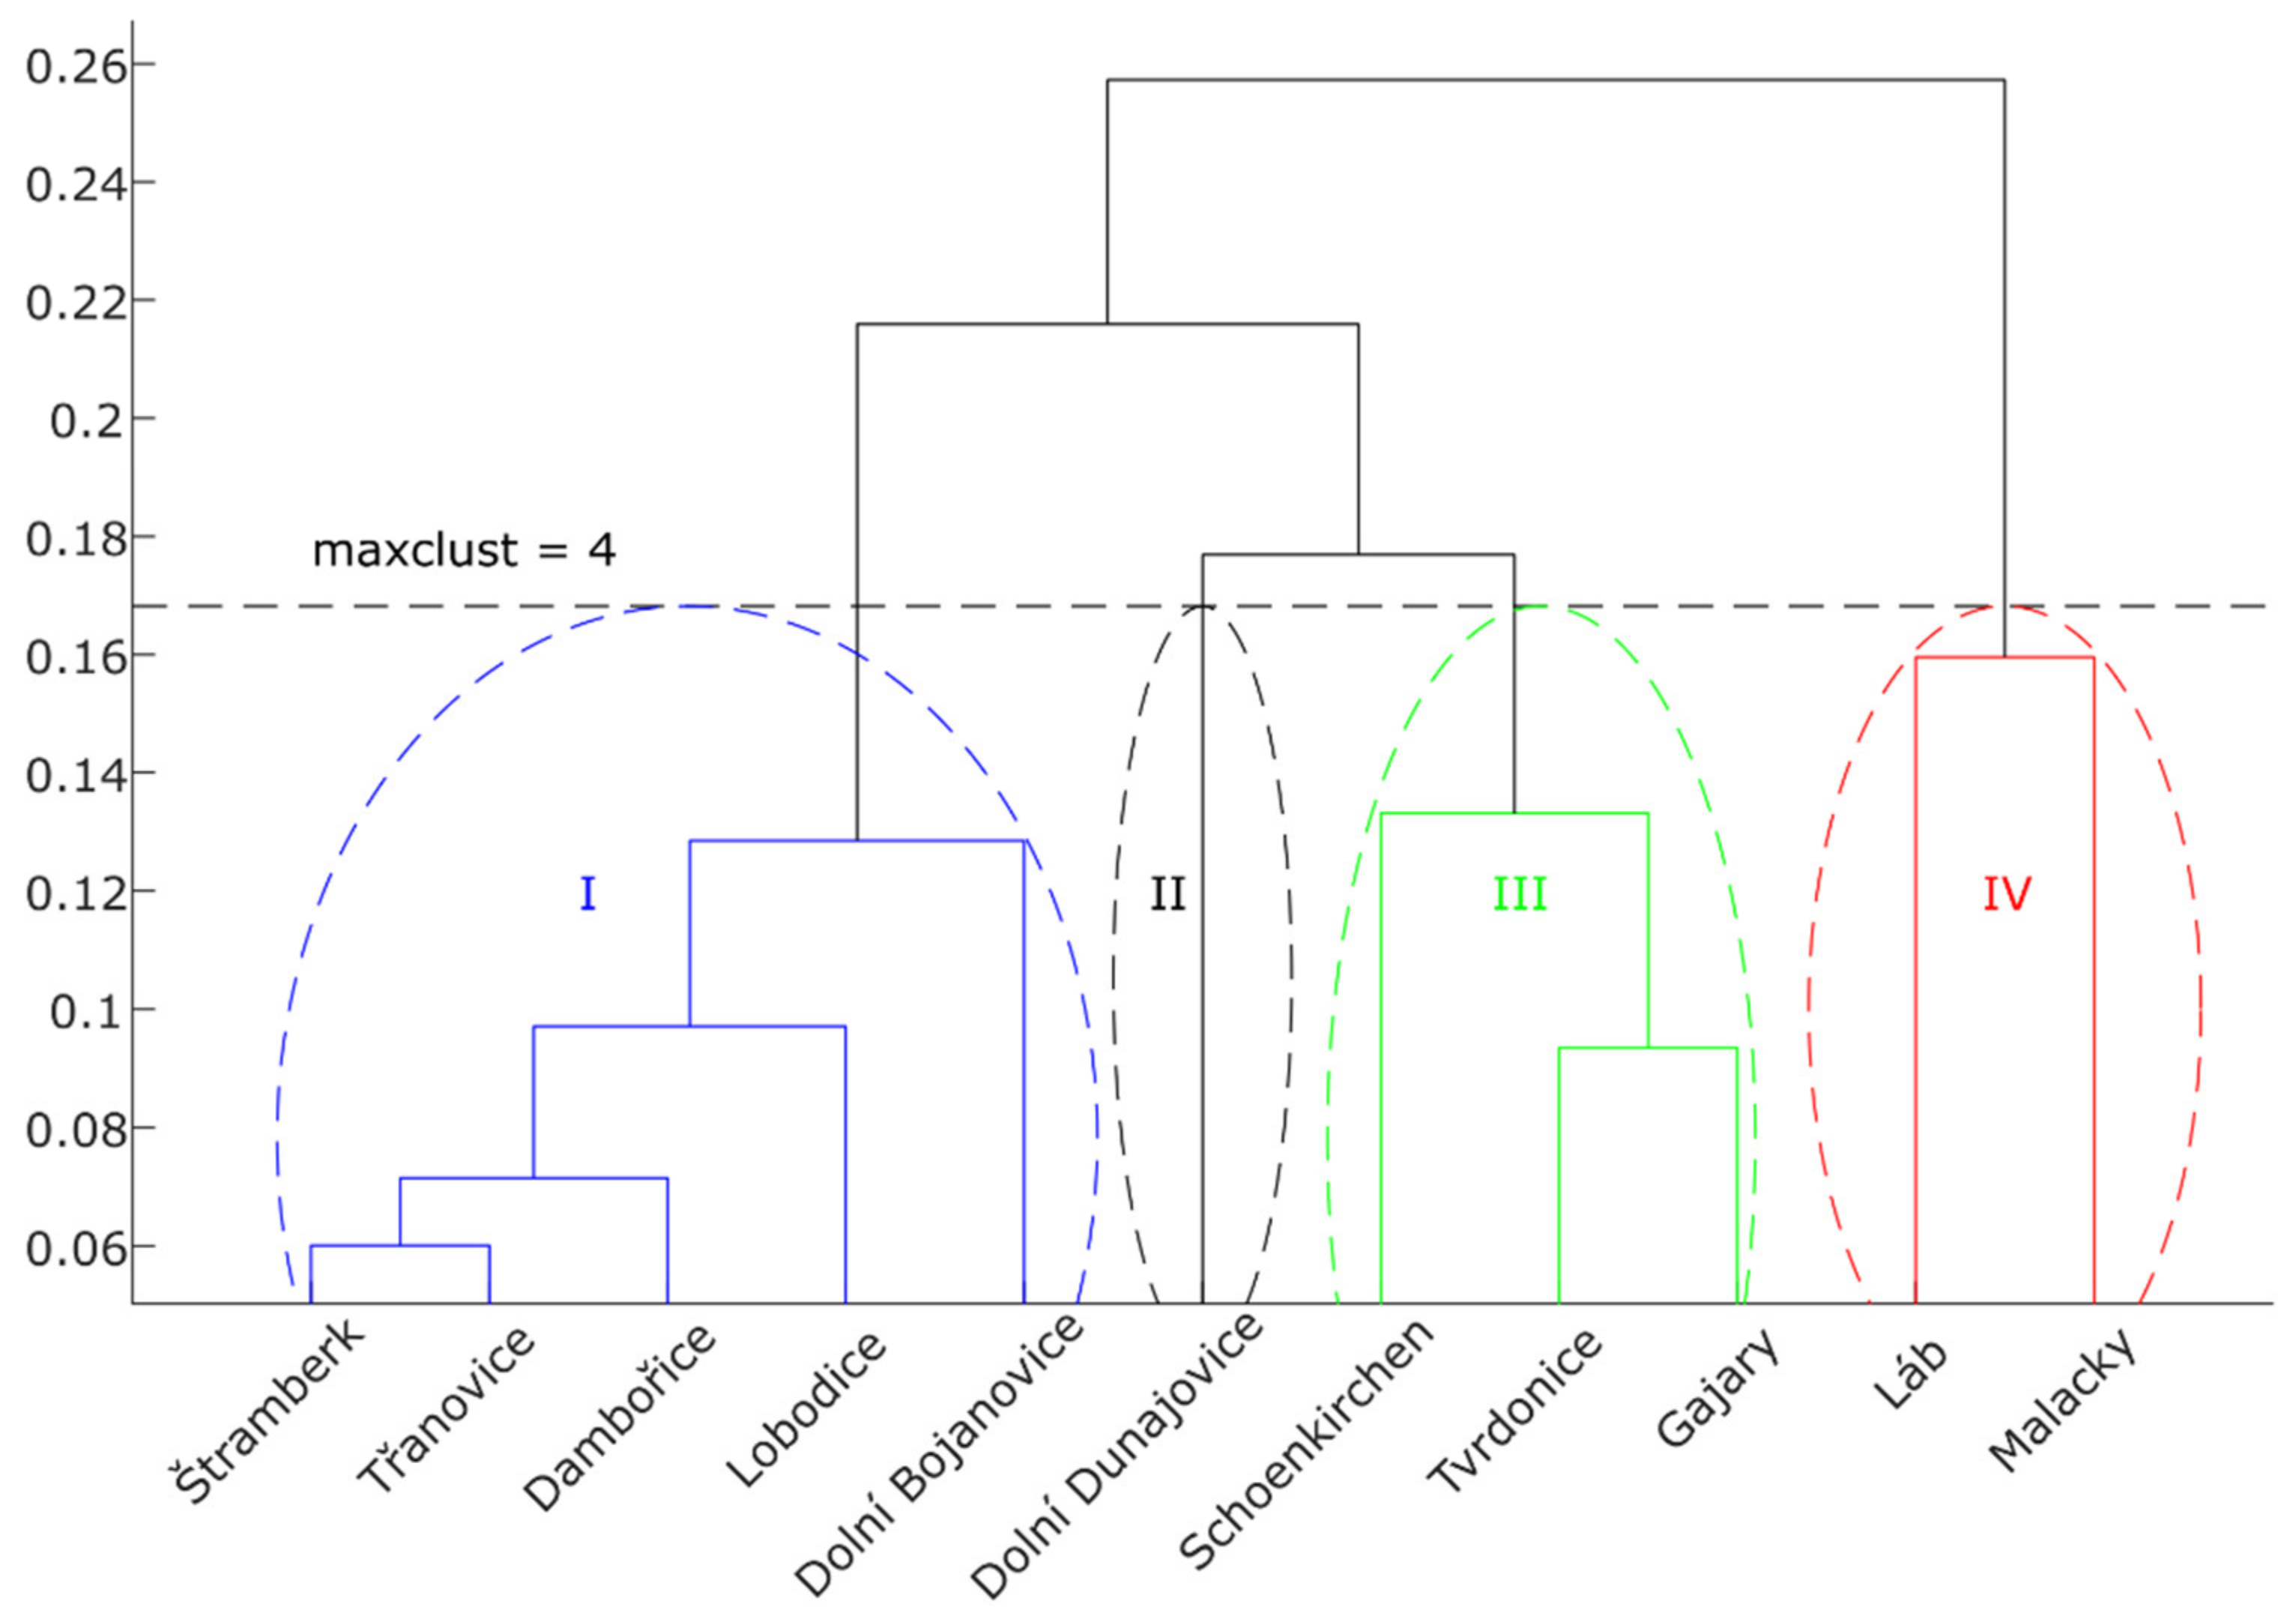
The last tool we used to analyze the data was hierarchical clustering of histograms. The aim was to find the UGSs that exhibit similar behavior and to find its interpretation. For each UGS, we selected points located in and around the UGS within 3 km (this value was chosen based on the assumption that vertical terrain changes caused by injection/extraction of natural gas up to this distance from the UGS boundary will disappear) and generated a histogram of standardized correlation coefficient r. Then we applied hierarchical clustering [30] to the obtained histograms and displayed the result in the form of a dendrogram. The dissimilarity measure metric implemented in [31] was used to build the clustering.
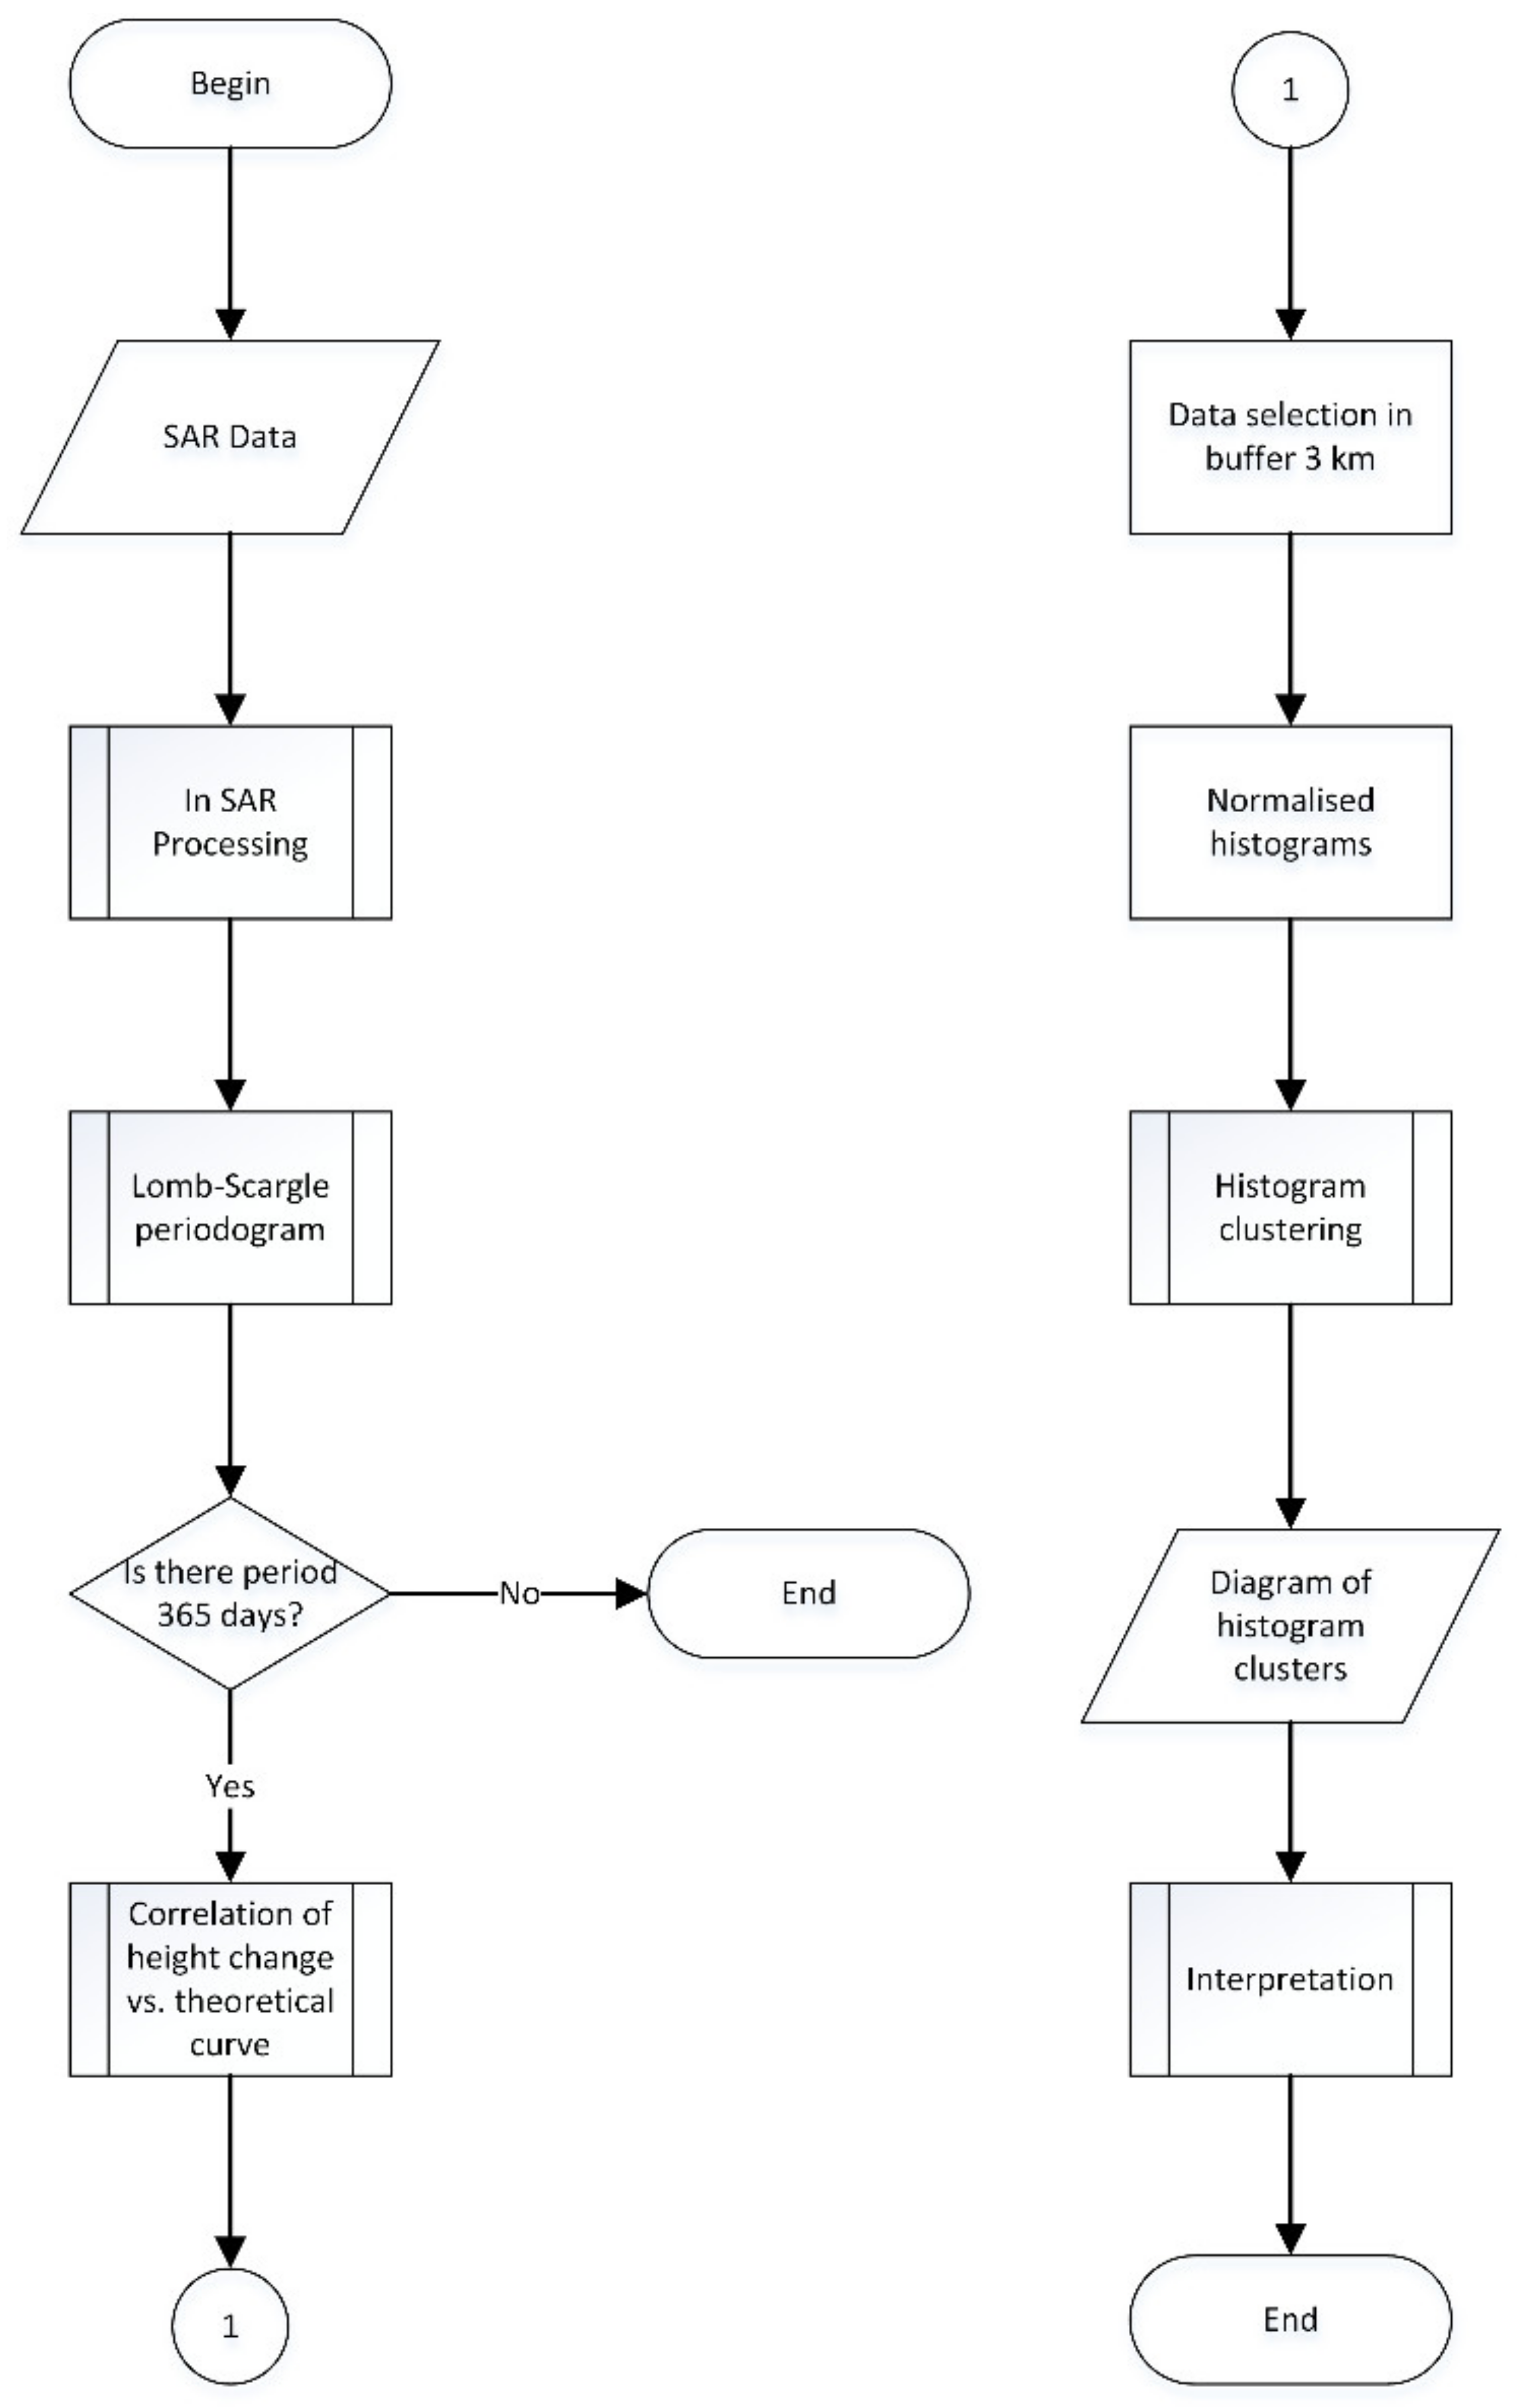
The whole procedure is clearly shown graphically in Figure 5.

2.4. Data Used

For the analysis, we used data from Sentinel–1 satellite system from 7th February 2015 to 23rd January 2019, i.e., almost four years. In the period from 7th February 2015 to 29th September 2016, we had only Sentinel–1A satellite data (Sentinel–1B satellite was not active at that time).
The acquisitions were taken in 12–day increments by Sentinel-1A satellite before 29th September 2016 when data from the newly active Sentinel–1B satellite become available as well, decreasing the temporal step to 6 days. Unfortunately, the data shows gaps at certain time intervals where the data was not available or not successfully processed by the IT4S1 processing chain. Temporal steps of 6 and 12 days are most represented; the longest data gap is 60 days. A total number of 161 acquisitions was used within the analysis. The temporal distribution of the acquisitions is visible from the time series for the three points (coarse curves) in Figure 2.

3. Results

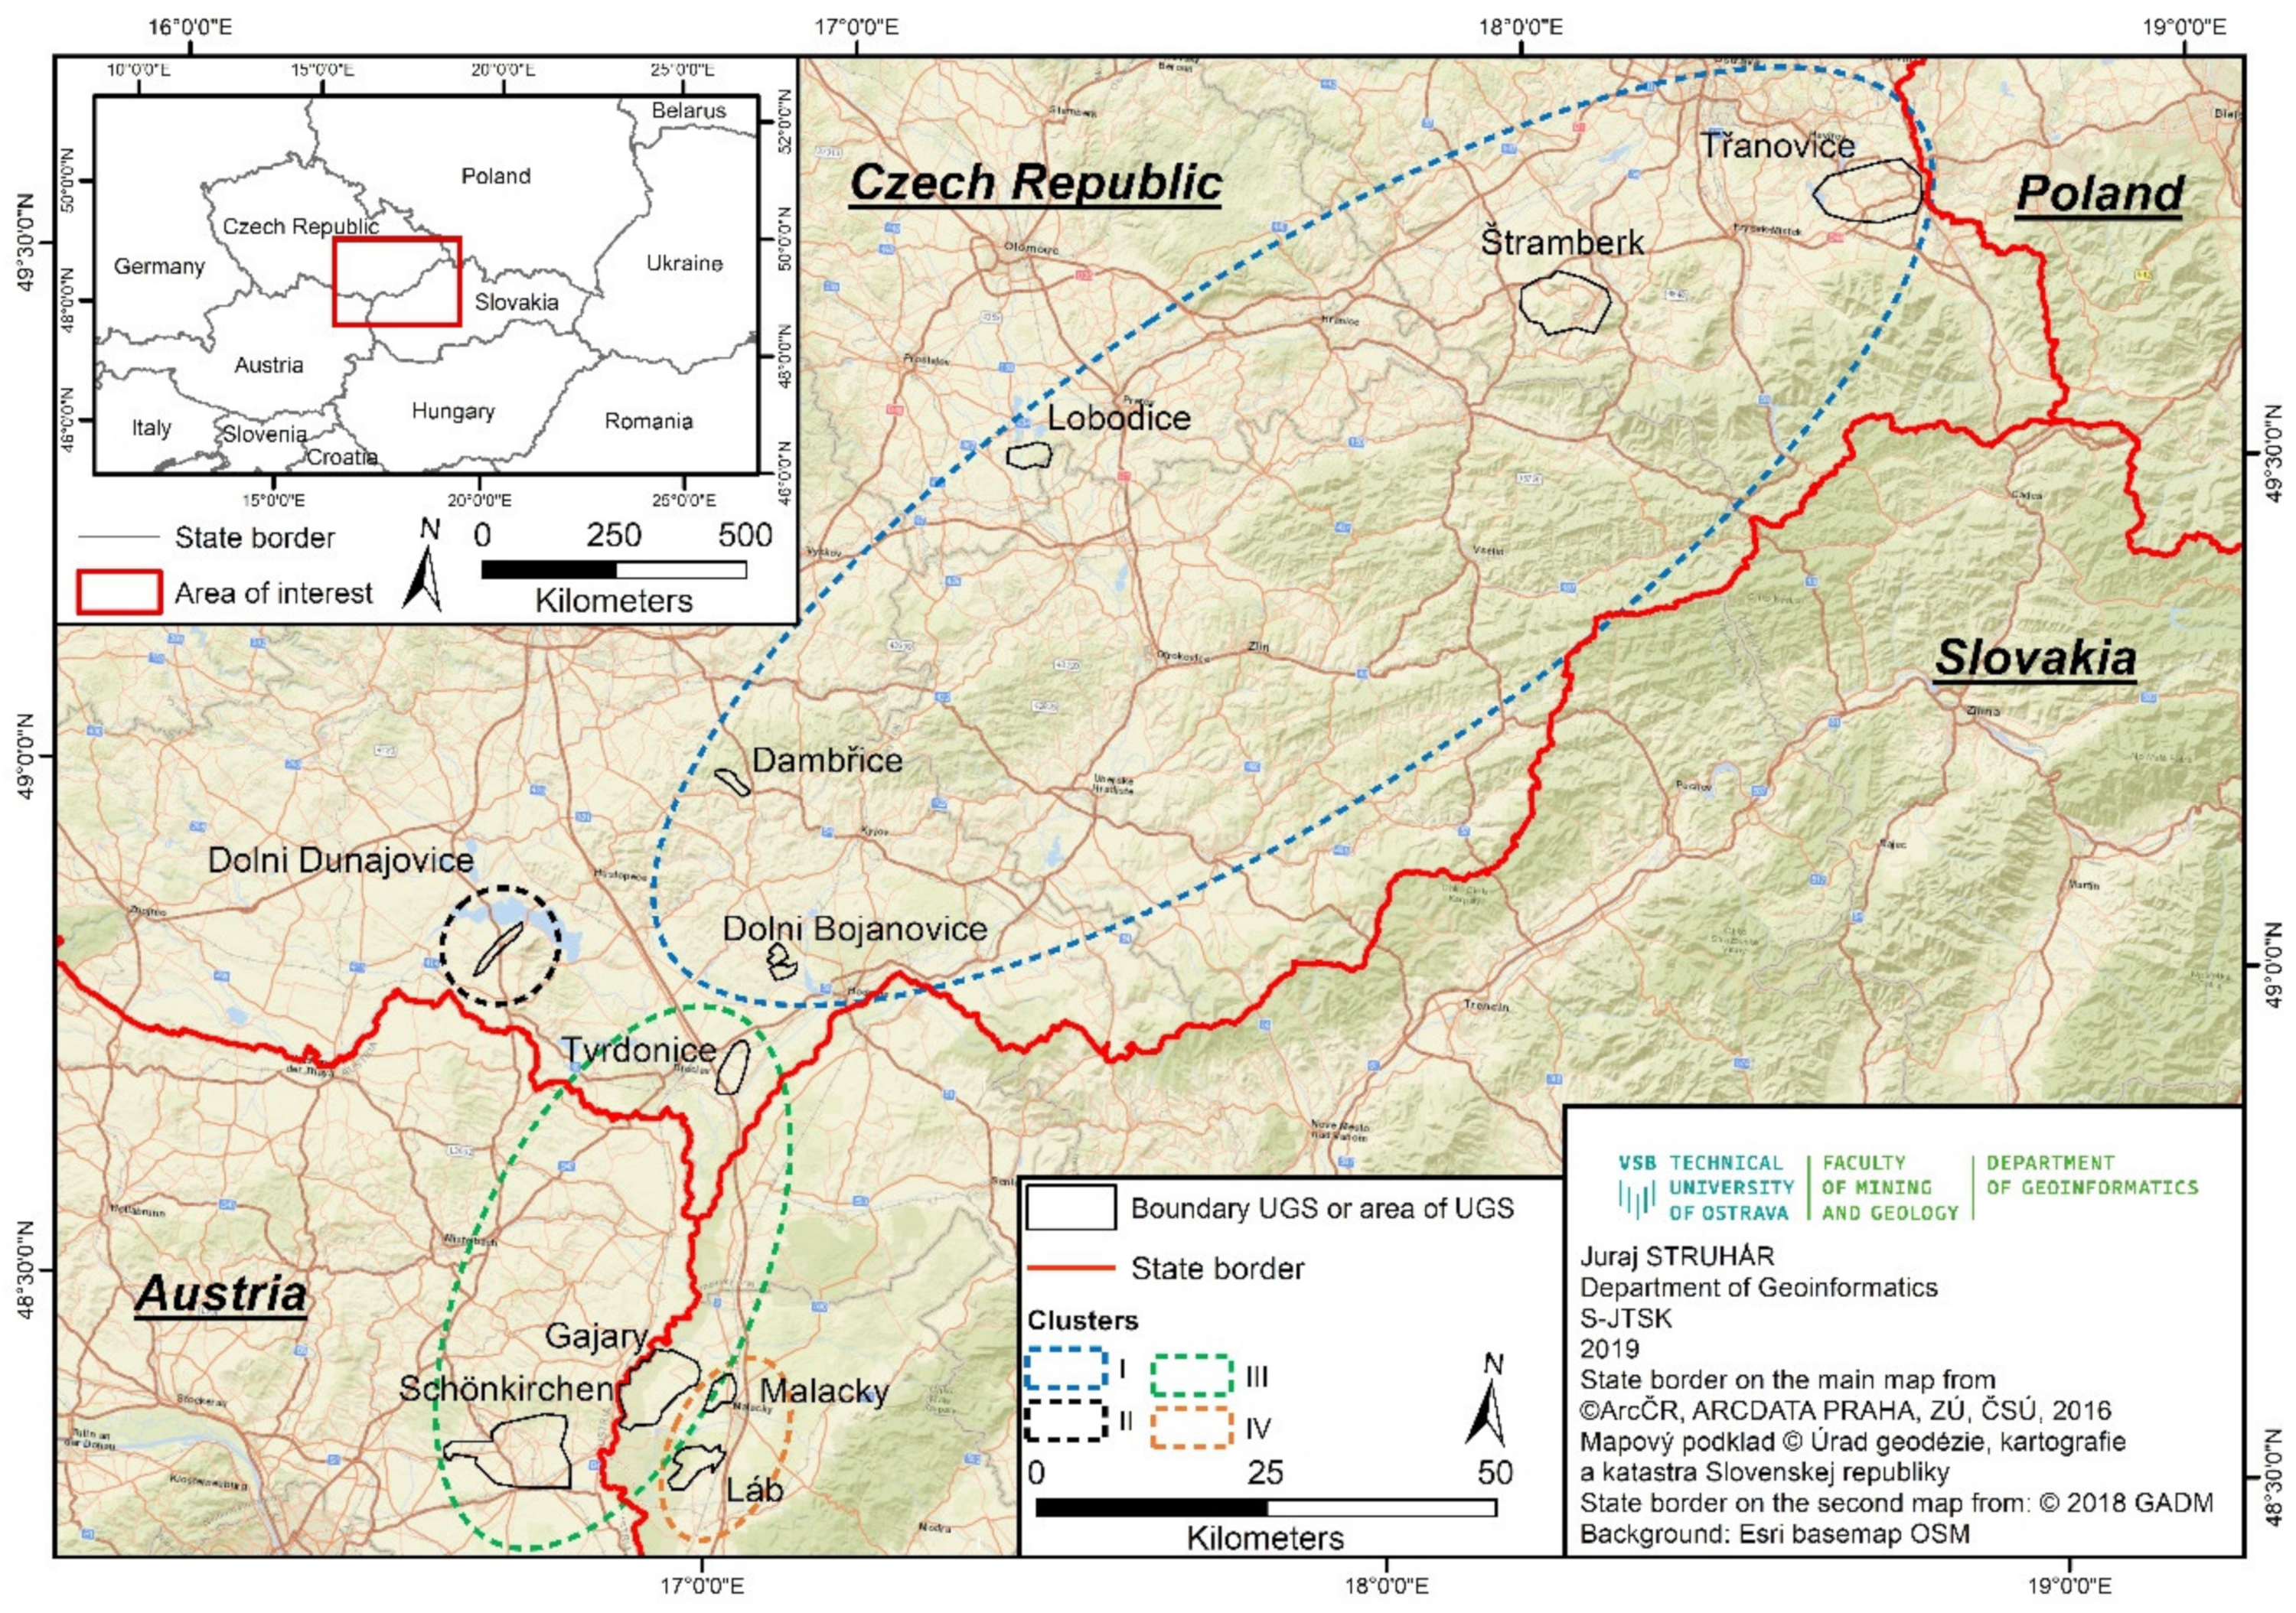
We researched the UGSs located in the east of the Czech Republic and southwest of Slovakia. These are the reservoirs listed in Table 1 and Figure 6. In the case of the UGSs located in the Czech Republic, their delineations were taken from the website of the Czech Geological Survey [32]. In the case of the UGSs in Slovakia, the boundaries of deposits used for building the UGSs were taken from the Slovak Geological Survey [33] website; unfortunately, the exact delimitation of individual UGS boundaries is not available, therefore the areas we process are named differently from the names of the operated UGS. In the case of the Shönkirchen UGS located in Austria, the boundary was determined approximately according to the distribution of wells in the area around the town of Shönkirchen. No other delimitation was available. This UGS was included in the processing only for comparison, as due to its proximity it was covered by Slovakias data collection of the UGSs and also because it is in the same geological unit as the UGSs in the south of the Czech Republic and southwest Slovakia. In Table 1, basic parameters of these UGSs are also given. It is clear from the table that within the monitored area, the UGSs are mostly built in depleted reservoirs, only the Lobodice reservoir is of the aquifer type.
These UGS occur in the contact region of two distinct geological units: Bohemian Massif and the Carpathians. In this area, the Carpathians move in the form of nappes over the Bohemian Massif framed at the outer border by the Carpathian Foredeep. In the southern part, the area is occupied by the neogenic Vienna Basin. This area is known for the presence of oil and gas deposits, which have been mined there for more than a hundred years. UGSs are subsequently built in the depleted reservoirs. An exception is the Lobodice UGS, where storage space was created by pushing the water in an aquifer by gas.
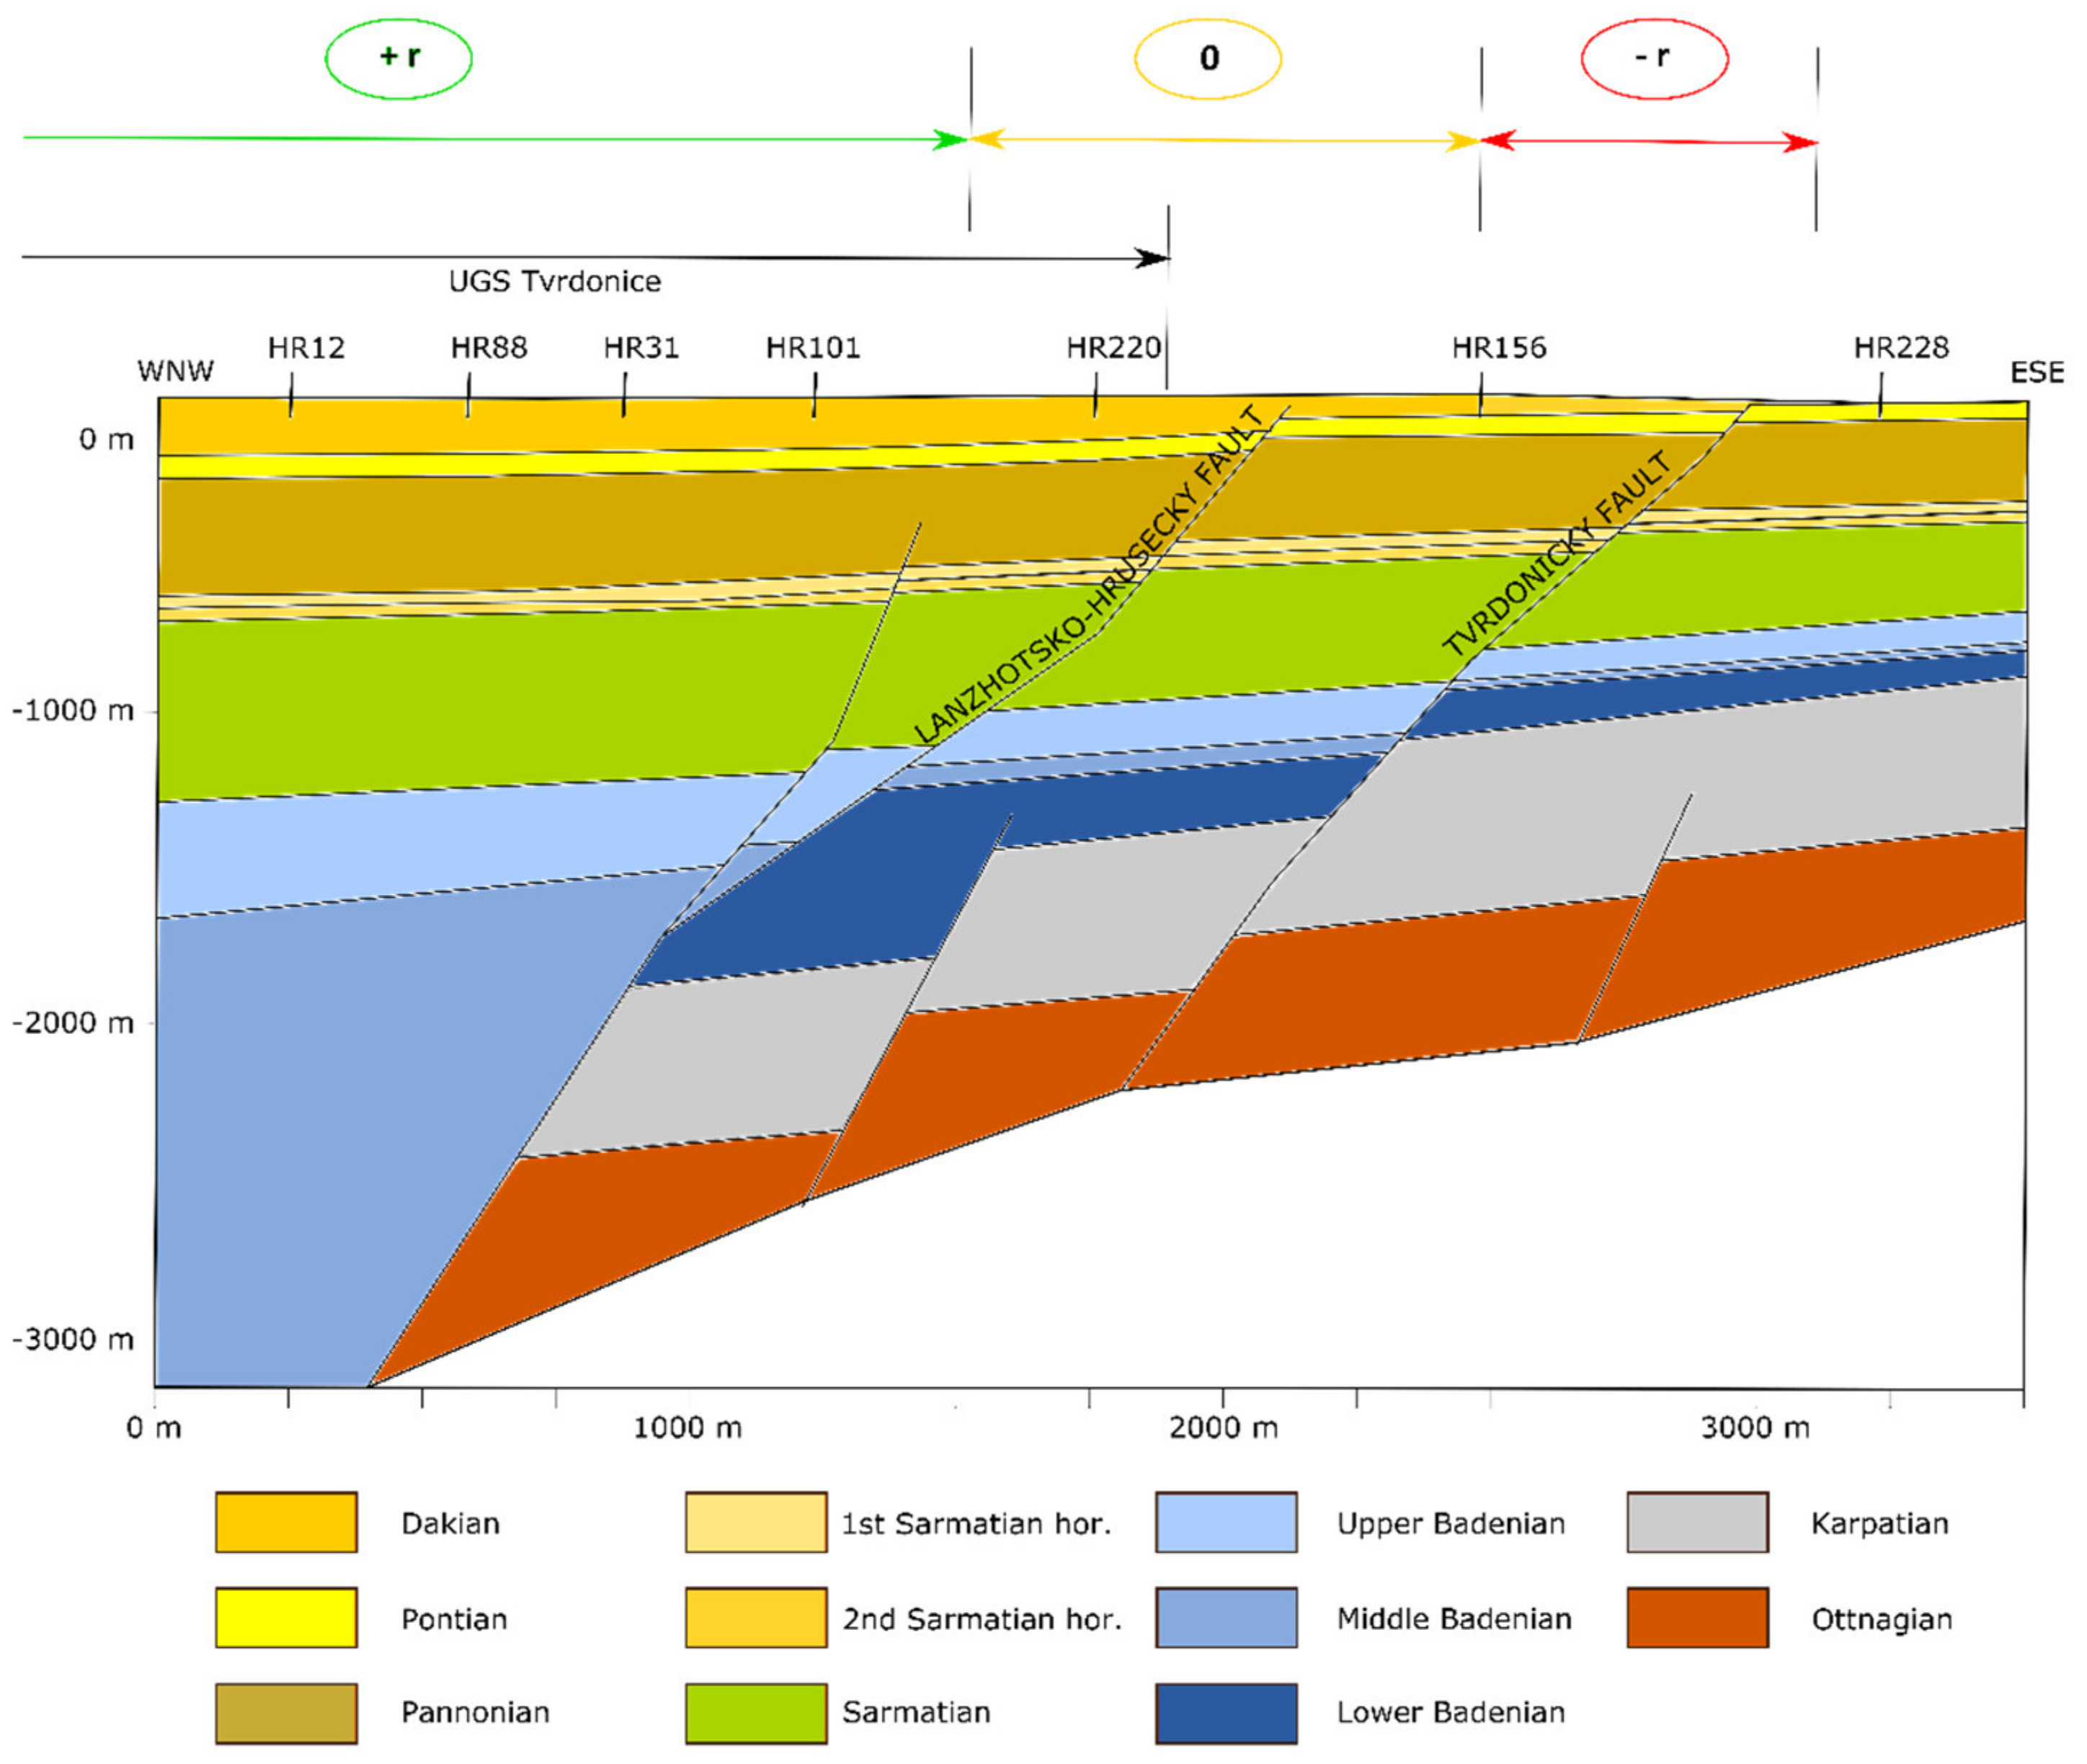
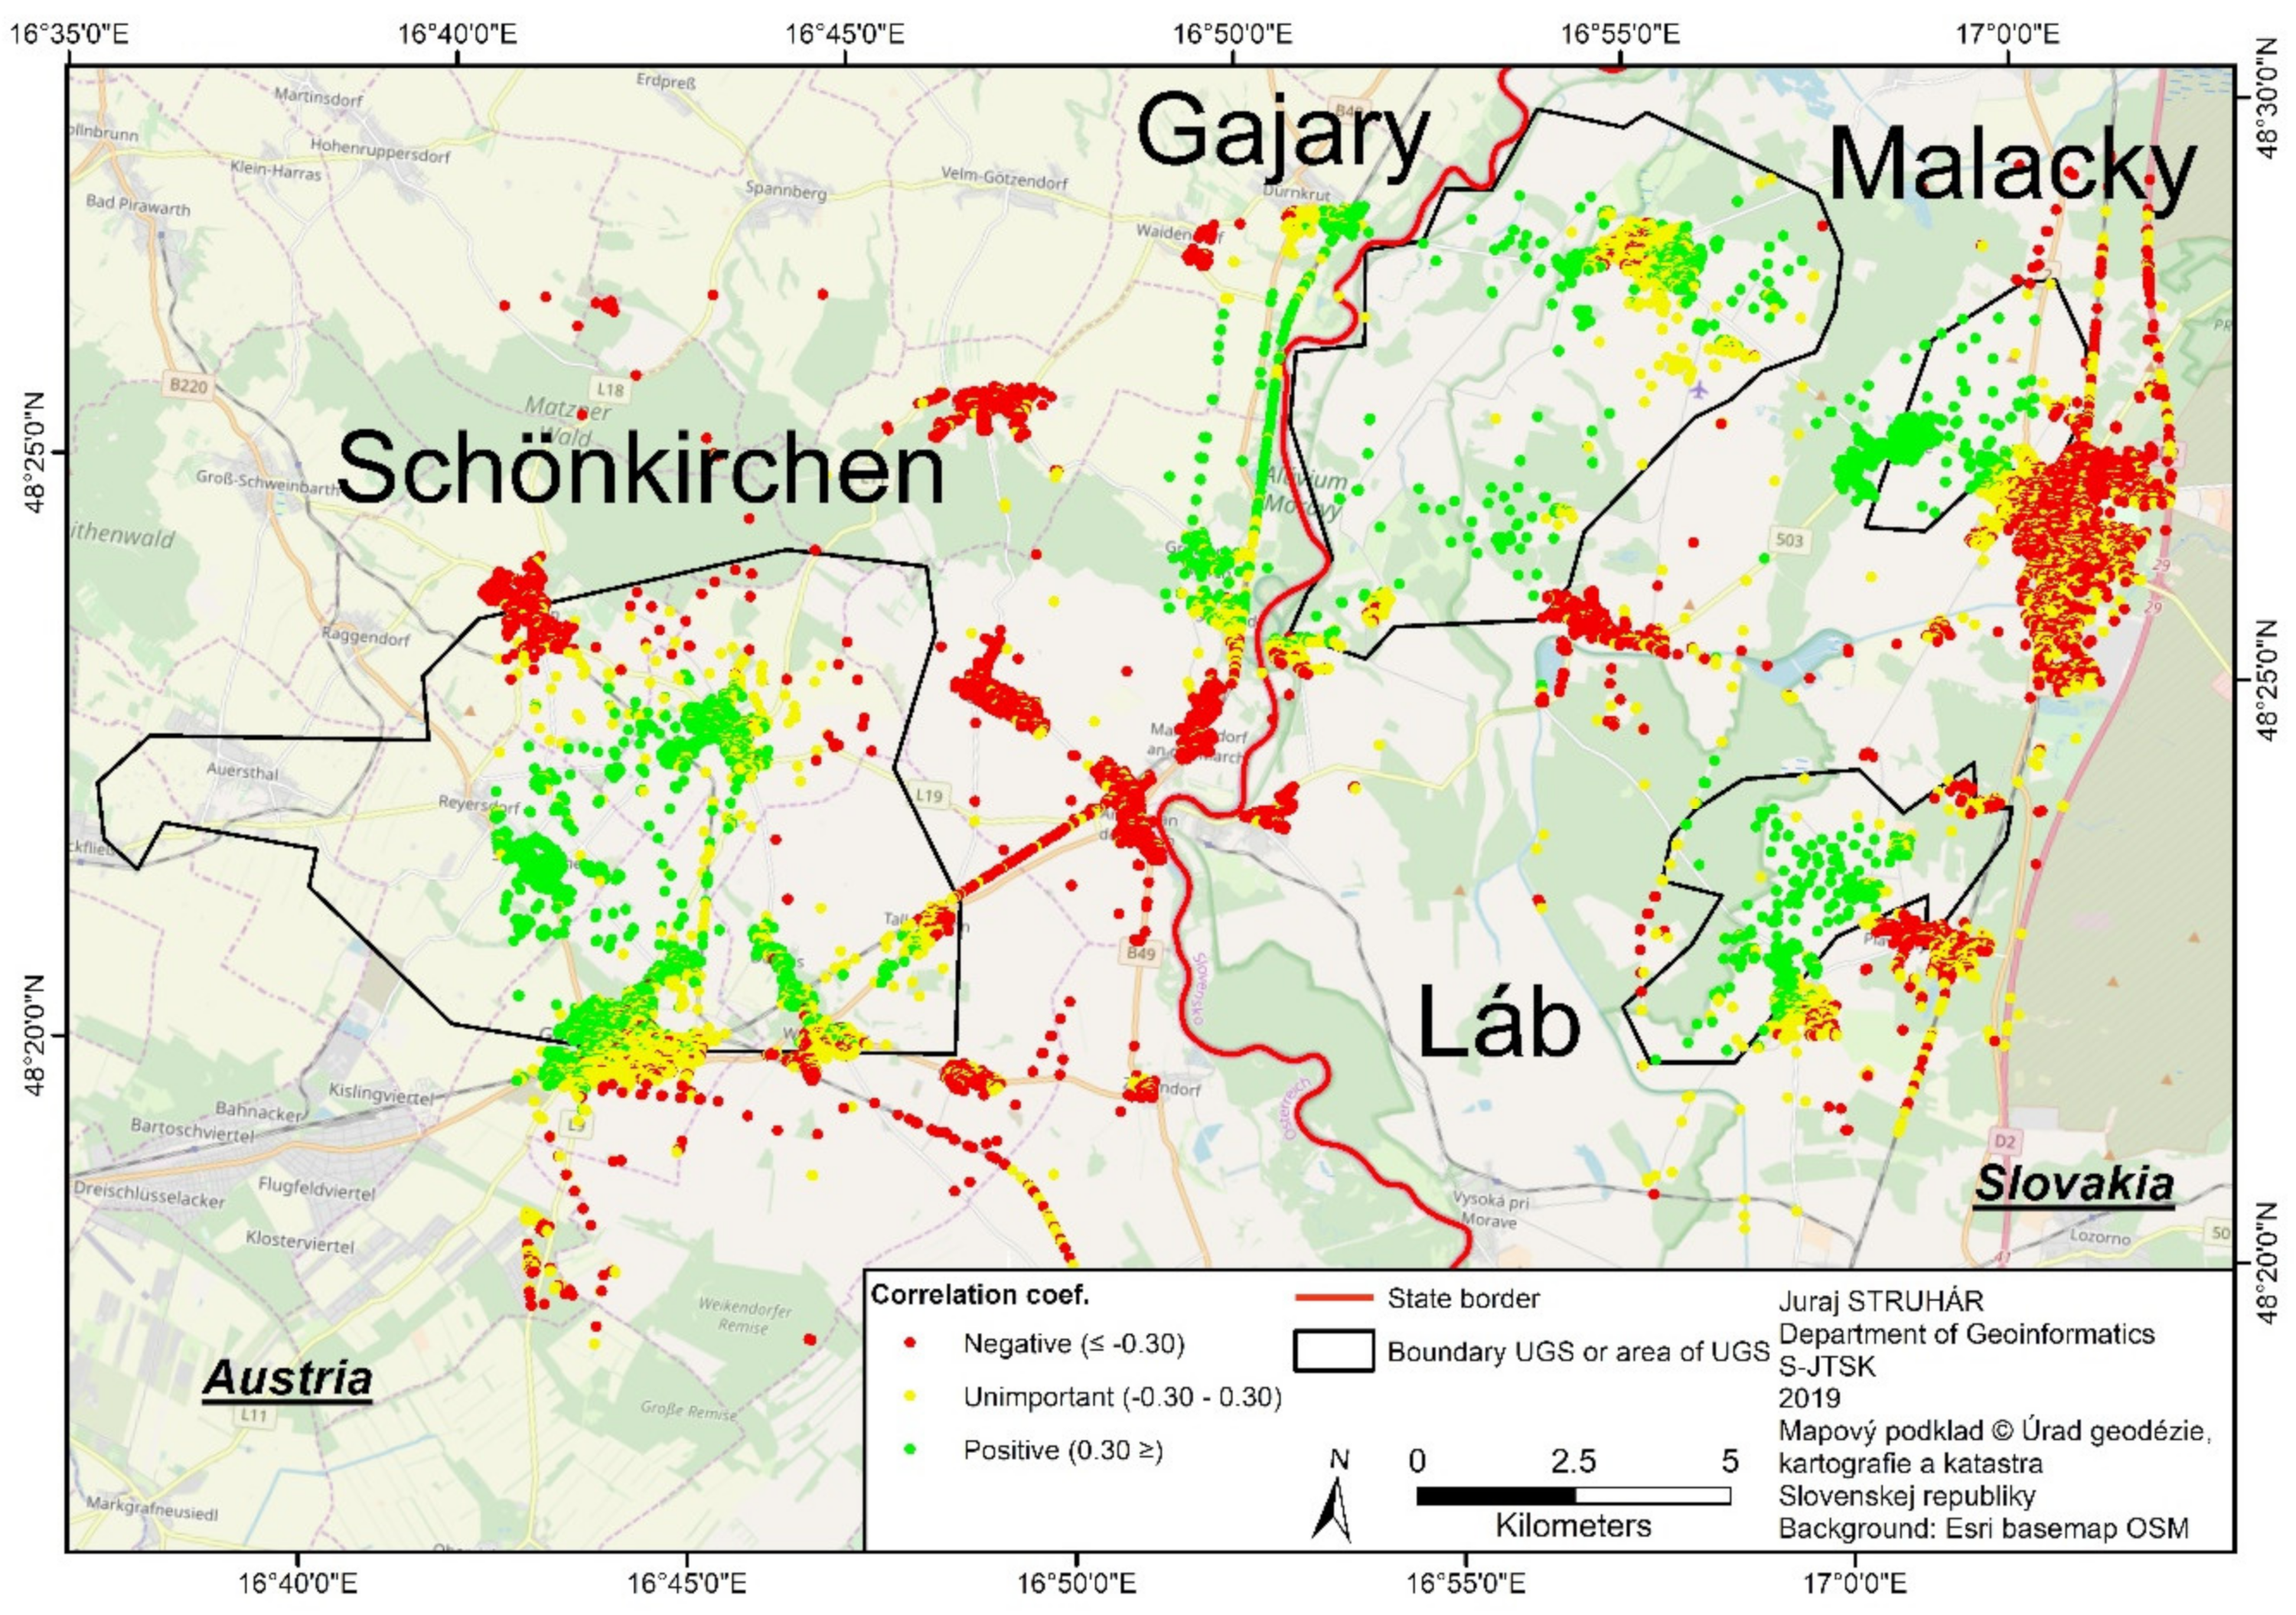
We have applied our approach to all UGSs and UGS areas. We have calculated the correlation coefficient between the theoretical curve reflecting the gas injection/withdrawal cycle from UGS (Figure 3) and the terrain change curves at the PS points above and in the vicinity of UGS. Its high values, approaching 1 (see Figure 4, Figure 8 and Figure 9), have shown that changes in terrain height synchronous to the injection/withdrawal of gas occur at UGSs. Also, we have found that there is an interesting phenomenon for the UGSs situated in the Vienna Basin: there are areas around the storage structure that show vertical movements in exactly the opposite direction to the area above the UGS. In Figure 4 an example of the Tvrdonice UGS is shown, which is limited from the east by the tectonic line of the Tvrdonice fault. In the area between the eastern boundary of the UGS and the Tvrdonice fault, the terrain moves in the exact opposite direction of the terrain moving above the UGS. Looking at the geological cross-section of the area (Figure 7) and including the direction of terrain movement into it, we see that the opposite movement corresponds to the border of the block with the UGS. It can be deduced that when the gas is injected into the UGS and terrain elevation is induced above the UGS, the edge of the block “slides” downwards over the Tvrdonice fault, and vice versa.
For illustration, Figure 8 shows in color histograms of correlation coefficient values r for points located in the area above the UGS (area A), in the transition zone around the UGS boundary (area B) and in the area between the UGS boundary and the Tvrdonice fault (area C). We assume that this behavior depends on the fault structure of the area. For comparison, the histogram of the distribution of correlation coefficient r for all points in this area (in grey) is always shown in the figure. We can see that while the points above the UGS (area A) show a strong positive correlation, the points around the UGS boundary (area B) are scattered almost evenly from positive to negative values and the points beyond the UGS boundary (area C) show a strong negative correlation. Similar behaviour was found in other UGSs situated in the Vienna Basin—see Figure 9.
When assessing the activity of faults around the UGS, we proceeded from a simple consideration: if the terrain in the UGS area responds to the natural gas injection/withdrawal cycle, this should be reflected in a higher proportion of points showing strong correlation with the theoretical vertical terrain movement curve, i.e., the histogram of coefficient correlation r values should be different from the situation where the UGS surrounding behaves independently. For verification, we used hierarchical clustering of histograms generated for individual UGS.
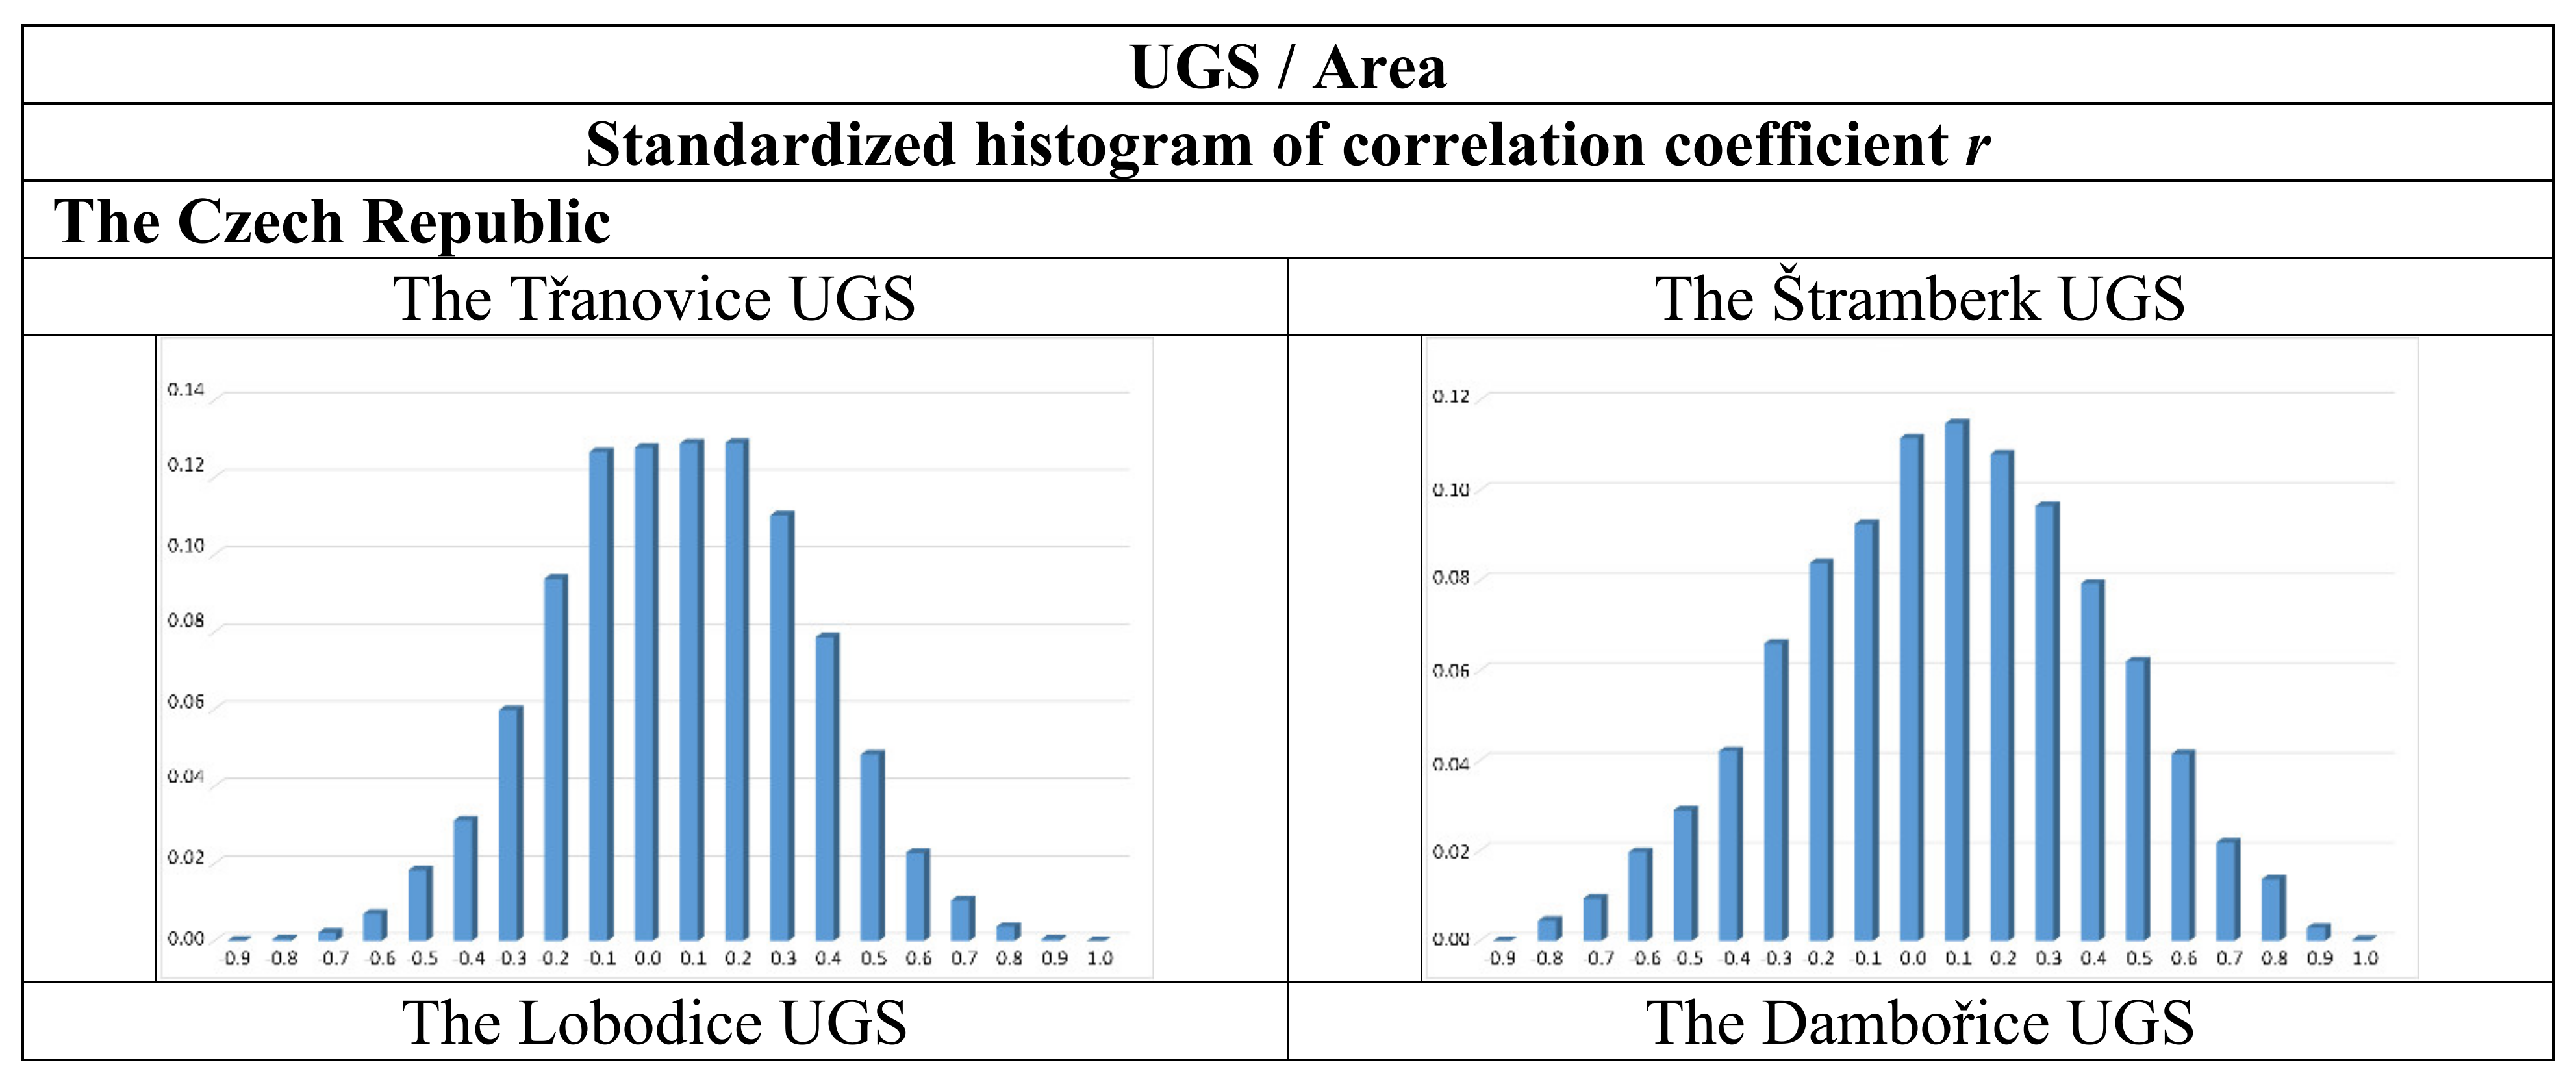
Figure 10 contains standardized histograms of the distribution of relative frequencies of correlation coefficient values between the theoretical curve of vertical terrain movements induced by natural gas injection/withdrawal and vertical movement curves for individual UGS, generated for individual PS points obtained by PS InSAR method. Figure 11 shows the result of hierarchical clustering of these histograms.
In total, four basic clusters, marked I, II, III and IV, can be distinguished within the UGSs and areas studied. The geographical distribution of these clusters is shown in Figure 6. Each of them corresponds to a different geological situation. Cluster I includes the UGSs that do not contain points in their vicinity that would strongly correlate with the theoretical curve (either positively or negatively), and even points above the UGS with a higher positive correlation are not very frequent. Cluster II corresponds to the Dolní Dunajovice UGS, the histogram shows a different distribution of values with a high proportion of strongly positively correlating points. Cluster III corresponds to three UGSs, which show a higher number of points with a strong positive or negative correlation. A similar situation is with Cluster IV.
The higher number of negative correlation points in Clusters III and IV is interesting. Their negative correlation suggests that there are areas in the vicinity of the UGSs whose vertical movements are in opposition to injecting/withdrawing natural gas from the UGSs. This can be seen at the Tvrdonice UGS (see Figure 4). From comparing the distribution of correlation coefficient values r with geological structure, especially faults, it follows that the existence and location of these points are likely dependent on the fault structure of the area. From Figure 4 and Figure 7 it can be seen that in the case of the Tvrdonice UGS the vertical movement slowly disappear to the west, but remain in the phase of injection/withdrawal of natural gas, while to the east, in the hanging wall block of the Tvrdonice fault, the movement is manifested in a counter-phase. This behavior can be explained by the fact that the rocks above the UGS behave as a cantilevered beam: it behaves as a cantilevered structure on the western side, while on the eastern side it is free due to the anticipated slip on the fault plane (it behaves as overhanging at this end). When it is subjected to pressure from the bottom in the area of the UGS, it then bends and decreases with its weight at the eastern end. From this, it can be concluded that the faults in this area allow the movement along fault planes.

4. Discussion and Conclusions

After obtaining the initial results, we addressed the question of whether the observed vertical movements are a manifestation of normal seasonal temperature changes. If this were the case, the terrain should behave the same everywhere, regardless of the presence of any UGS. Nevertheless, it is clear from the distribution of height changes in the monitored areas that places with the occurrence of regular cyclic changes in terrain height are mainly related to the UGSs. In the vicinity of the UGSs, this regularity disappears and in the case of some UGSs, the geological structure of the area even shows counter-directional movement, which is in the stark contrast to seasonal temperature changes. A phase shift of detected changes to the annual temperature disputes the dependence on seasonal temperature changes. The maximum temperatures are in July and August, but the maximum lift of the terrain is only at the turn of October and November. The same is true with the minimum.
Unfortunately, a comprehensive comparison with the results of the monitoring of UGSs elsewhere in the world cannot be done; similar work from another area has not been published. We may relate only the detected amplitude of terrain height change to agree with the published works [4,11,12,13].
The advantage of using the PS InSAR method for monitoring the activity of faults in the vicinity of UGSs is the possibility of its areal deployment. At present, about 800 UGSs are in operation worldwide; theoretically, it is possible to monitor all of them thanks to satellite radar data collection. The only requirement is that PS points must be detectable on and in the vicinity of the UGS area. The advantage of using radar data is usually a relatively high density of evaluated points, which allows a good description of the situation of UGS and its development. Due to the parameters of radar satellites operating today, the PS InSAR method can provide an areal, long-term and regular monitoring of terrain behavior above and around UGS. This method works particularly well when the urbanized area or the transport infrastructure elements (roads, railways) are located over the UGS. These objects usually generate a dense network of PS points. Generally, the distribution of PS points is more or less random, however, if necessary, significant points on the UGS and its surroundings can be signaled using simple corner reflectors and thus ensure their targeted monitoring. In the required area, it is possible to create a network of permanently reflecting points that can well describe the behavior of the UGS and its surroundings, the behavior of wells, or the behavior of other elements of the UGS surface infrastructure.
The use of this method, of course, has its weaknesses. The most significant one is the inability to create PS points on certain types of surfaces, such as vegetation, or influencing the reflections of the variability of terrain cover (again vegetation, or snow). Another disadvantage may be the random distribution of PS points, especially if their density is low.
The sensitivity of the radar to various noise factors, such as signal delay through the atmosphere, reduces the achievable accuracy of a single measurement and makes it necessary to analyze a time series of at least 15 acquisitions [8]. Radar measurement is limited by its wavelength and spatial resolution of the radar image. Movement exceeding 1/4 wavelength of radar beam between neighboring PS points in the time between two acquisitions causes ambiguity of the measured value, so-called phase ambiguity [20] and may cause so-called phase jumps. i.e., values of displacement being incorrectly evaluated as half of the radar wavelength higher or lower. In our case using Sentinel 1 data, the critical threshold is around 1.4 cm/6 days or 12 days. However, such a speed of movement is not expected in the case of the whole area of UGS.
Results of the research have shown that the PS InSAR method allows for a general, systematic, regular and, if necessary, targeted monitoring of UGSs. It can be used to assess the activity of faults in the vicinity of UGSs, which can contribute to increasing the reliability and safety of UGS operations.

Author Contributions

Conceptualization, P.R.; Methodology, P.R.; Software, M.L. and J.S.; Validation, P.R. and M.L.; Formal Analysis, P.R.; Investigation, J.S., P.R. and M.L.; Resources, M.L.; Data Curation, M.L., J.S. and P.R.; Writing-Original Draft Preparation, P.R., M.L. and J.S.; Writing-Review & Editing, P.R. and M.L.; Visualization, J.S. and P.R.; Supervision, P.R.; Project Administration, J.S.; Funding Acquisition, J.S., M.L. All authors have read and agreed to the published version of the manuscript.

Funding

This work partially supported by Grant of SGS No. SP2019/64, Faculty of Mining and Geology, VSB – Technical University of Ostrava. This work was partially supported by The Ministry of Education, Youth and Sports from the National Programme of Sustainability (NPU II) project “IT4Innovations excellence in science – LQ1602”.

Acknowledgments

We would like to thank our colleague Radomír Grygar for valuable consultations on the relationship between the identified behaviour of the area with the UGS and its geological structure. Sentinel–1 data were processed using IT4S1 system, based on open-source ISCE2 and STAMPS PS. Post-processing of PS InSAR outputs was performed on top of Matlab.

Conflicts of Interest

The authors declare no conflict of interest. The funders had no role in the design of the study; in the collection, analyzes, or interpretation of data; in the writing of the manuscript, or in the decision to publish the results.

References

  1. CEDIGAZ: Underground Gas Storage in The World—2018 Status. CEDIGAZ, 19p. Available online: https://cdn2.hubspot.net/hubfs/1982707/Overview%20of%20underground%20gas%20storage%20in%20the%20world%202018%20(1).pdf (accessed on 19 November 2018).
  2. NaturalGas.org: Natural Gas Storage. Available online: http://naturalgas.org/naturalgas/storage/ (accessed on 13 July 2019).
  3. Mokhatab, S.; Poe, W.A.; Mak, J.Y. Handbook of Natural Gas Transmission and Processing. Principles and Practices, 4th ed.; Gulf Professional Publishing: Oxford, UK, 2019; p. 862. [Google Scholar]
  4. Teatini, P.; Castelletto, N.; Ferronato, M.; Gambolati, G.; Janna, C.; Cairo, E.; Marzorati, D.; Colombo, D.; Ferretti, A.; Bagliani, A.; et al. Geomechanical response to seasonal gas storage in depleted reservoirs: A case study in the Po River basin, Italy. J. Geophys. Res. Space Phys. 2011, 116, 21. [Google Scholar] [CrossRef]
  5. Amadei, C. Encyclopaedia of Hydrocarbons. Istituto Della Enciclopedia Italiana, 2005. Chap. 7.4 Underground Storage of Natural Gas (Franco Falzolgher). Available online: http://www.treccani.it/export/sites/default/Portale/sito/altre_aree/Tecnologia_e_Scienze_applicate/enciclopedia/inglese/inglese_vol_1/pag879-912ING3.pdf (accessed on 13 July 2019).
  6. Flodr, J. Podzemní zásobníky plynu. Vysoké učení technické v Brně, Czech Republic, 2018. 32 s. Available online: https://www.vutbr.cz/www_base/zav_prace_soubor_verejne.php?file_id=174842 (accessed on 13 July 2019).
  7. Haghighi, M.H.; Motagh, M. Sentinel-1 InSAR over Germany: Large-Scale Interferometry, Atmospheric Effects, and Ground Deformation Mapping. ZFV 2017, 142, 245–256. [Google Scholar] [CrossRef]
  8. Ferretti, A.; Prati, C.; Rocca, F. Permanent scatterers in SAR interferometry. IEEE Trans. Geosci. Remote. Sens. 2001, 39, 8–20. [Google Scholar] [CrossRef]
  9. SENTINEL–1. Sentinel Online. Available online: https://sentinel.esa.int/web/sentinel/missions/sentinel-1 (accessed on 25 September 2019).
  10. Ketelaar, G. Satellite Radar Interferometry: Subsidence Monitoring Techniques; Springer: Berlin, Germany, 2009; p. 260. [Google Scholar]
  11. Bagliani, A.; Mosconi, A.; Marzorati, D.; Cremonesi, A.; Ferretti, A.; Colombo, D.; Novali, F.; Tamburini, A. Use of Satellite Radar Data for Surface Deformation Monitoring: A Wrap-Up After 10 Years of Experimentation. In Proceedings of the SPE Annual Technical Conference and Exhibition, Florence, Italy, 19–22 September 2010; p. 8. [Google Scholar]
  12. Janna, C.; Castelletto, N.; Ferronato, M.; Gambolati, G.; Teatini, P. A geomechanical transversely isotropic model of the Po River basin using PSInSAR derived horizontal displacement. Int. J. Rock Mech. Min. Sci. 2012, 51, 105–118. [Google Scholar] [CrossRef]
  13. Zoccarato, C.; Alzraiee, A.; Bau, D.; Ferronato, M.; Gambolati, G.; Janna, C.; Teatini, P. Geomechanical Characterization of Storage Reservoirs by Assimilation of Surface Displacements. In Proceedings of the Fourth EAGE CO2 Geological Storage Workshop, Stavanger, Norway, 22–24 April 2014; pp. 92–96. [Google Scholar]
  14. Lubitz, C.; Kempka, T.; Motagh, M. Integrated Assessment of Ground Surface Displacements at the Ketzin Pilot Site for CO2 Storage by Satellite-Based Measurements and Hydromechanical Simulations. IEEE J. Sel. Top. Appl. Earth Obs. Remote. Sens. 2019, 12, 186–199. [Google Scholar] [CrossRef]
  15. Qiao, X.; Chen, W.; Wang, D.; Nie, Z.; Chen, Z.; Li, J.; Wang, X.; Li, Y.; Wang, T.; Feng, G. Crustal deformation in the Hutubi underground gas storage site in China observed by GPS and InSAR measurements. Seismol. Res. Lett. 2018, 89, 1467–1477. [Google Scholar]
  16. Loesch, E.; Sagan, V. SBAS Analysis of Induced Ground Surface Deformation from Wastewater Injection in East Central Oklahoma, USA. Remote. Sens. 2018, 10, 283. [Google Scholar] [CrossRef] [Green Version]
  17. Wang, H.; Wright, T.J.; Liu-Zeng, J.; Peng, L. Strain Rate Distribution in South-Central Tibet From Two Decades of InSAR and GPS. Geophys. Res. Lett. 2019, 46, 5170–5179. [Google Scholar] [CrossRef] [Green Version]
  18. Milillo, P.; Perissin, D.; Salzer, J.T.; Lundgren, P.; Lacava, G.; Milillo, G.; Serio, C. Monitoring dam structural health from space: Insights from novel InSAR techniques and multi-parametric modeling applied to the Pertusillo dam Basilicata, Italy. Int. J. Appl. Earth Obs. Geoinf. 2016, 52, 221–229. [Google Scholar] [CrossRef]
  19. Cumming, I.G.; Wong, F.H. Digital Signal Processing of Synthetic Aperture Radar Data: Algorithms and Implementation; Artech House: London, UK, 2004; p. 660. ISBN 1580530583. [Google Scholar]
  20. Hanssen, R.F. Radar Interferometry: Data Interpretation and Error Analysis; Kluwer Academic Publishers: Dordrecht, The Netherlands, 2001; p. 308. [Google Scholar]
  21. Ferretti, A.; Prati, C.; Rocca, F. Nonlinear subsidence rate estimation using permanent scatterers in differential SAR interferometry. IEEE Trans. Geosci. Remote. Sens. 2000, 38, 2202–2212. [Google Scholar] [CrossRef] [Green Version]
  22. Hooper, A. A multi-temporal InSAR method incorporating both persistent scatterer and small baseline approaches. Geophys. Res. Lett. 2008, 35, 5. [Google Scholar] [CrossRef] [Green Version]
  23. Lazecky, M.; Bakon, M.; Hlavacova, I.; Sousa, J.J.; Real, N.; Perissin, D.; Patricio, G. Bridge Displacements Monitoring using Space-Borne SAR Interferometry. IEEE J. Sel. Top. Appl. Earth Obs. Remote Sens. 2016, 10, 205–210. [Google Scholar] [CrossRef] [Green Version]
  24. Zebker, H.A.; Hensley, S.; Shanker, P.; Wortham, C. Geodetically Accurate InSAR Data Processor. IEEE Trans. Geosci. Remote. Sens. 2010, 48, 4309–4321. [Google Scholar] [CrossRef]
  25. Lazecky, M. System for Automatized Sentinel–1 Interferometric Monitoring. In Proceedings of the 2017 conference on Big Data from Space, Toulouse, France, 28–30 November 2017; pp. 161–165, ISBN 978-92-79-73527-1. [Google Scholar] [CrossRef]
  26. Lazecký, M.; Hlaváčová, I.; Martinovič, J.; Ruiz-Armenteros, A.M. Accuracy of Sentinel-1 Interferometry Monitoring System based on Topography-free Phase Images. Procedia Comput. Sci. 2018, 138, 310–317. [Google Scholar] [CrossRef]
  27. Yague-Martinez, N.; Prats-Iraola, P.; Gonzalez, F.R.; Brcic, R.; Shau, R.; Geudtner, D.; Eineder, M.; Bamler, R. Interferometric Processing of Sentinel-1 TOPS Data. IEEE Trans. Geosci. Remote. Sens. 2016, 54, 2220–2234. [Google Scholar] [CrossRef] [Green Version]
  28. Hu, Z.; Peng, J.; Hou, Y.; Shan, J. Evaluation of Recently Released Open Global Digital Elevation Models of Hubei, China. Remote. Sens. 2017, 9, 262. [Google Scholar] [CrossRef] [Green Version]
  29. Vanderplas, J.T. Understanding the Lomb–Scargle Periodogram. Astrophys. J. Suppl. Ser. 2018, 236, 16. [Google Scholar] [CrossRef]
  30. Billard, L.; Kim, J. Advanced Review Hierarchical clustering for histogram data. WIREs Comput. Stat. 2017, 9, e1405. [Google Scholar] [CrossRef]
  31. Hierarchical Clustering. MathWorks Docummentation. Available online: https://au.mathworks.com/help/stats/hierarchical-clustering.html#bq_6_ia (accessed on 26 September 2019).
  32. Surovinový informační system (Natural resources information system). Czech Geological Survey. Available online: https://mapy.geology.cz/suris/ (accessed on 26 September 2019).
  33. Ložiská nerastných surovín (Natural resources). State Geological Institute of Dionyz Stur. Available online: http://apl.geology.sk/geofond/loziska2/ (accessed on 26 September 2019).
  34. Development – Capacities and rates. MND Gas Storage a.s. Available online: https://www.gasstorage.cz/en/operation-information/development-capacity-and-output/ (accessed on 14 July 2019).
  35. Our Underground Gas Storages. innogy Gas Storage. Available online: https://www.innogy-gasstorage.cz/en/map-of-storages/ (accessed on 14 July 2019).
  36. Škovroň, L. Podzemní zásobníky plynu RWE gas Storage. Presentation from conference in Karviná, the Czech Republic, 30 November 2010. Available online: https://slideplayer.cz/slide/2017074/ (accessed on 14 July 2019).
  37. Lengálová, M. Netradiční metody využití ložisek. Podzemní zásovník plynu Dolní Bojanovice. Presentation from Podzimní setkání těžařů workshop, Hotel Jezerka u Sečské přehrady, the Czech Republic, 13–15 November 2013. Available online: https://slideplayer.cz/slide/2505143/ (accessed on 14 July 2019).
  38. Podzemné uskladňovanie. Slovenský plynárenský a naftový zväz. Available online: http://www.spnz.sk/sk/o-spnz/fakty-cisla-udaje/podzemne-uskladnovanie.html (accessed on 14 July 2019).
  39. Rates and Storage capacity. NAFTA a.s. Available online: https://isodzz.nafta.sk/yCapacity/#/?nav=ss.od.sc&lng=EN (accessed on 14 July 2019).
  40. PZZP Láb 4. stavba. POZAGAS a.s. Available online: http://www.pozagas.sk/pzzp-lab-4-stavba/ (accessed on 14 July 2019).
  41. Nový zásobník plynu na Slovensku. EnviWeb. Available online: http://www.enviweb.cz/89932 (accessed on 14 July 2019).
  42. Reference projects. Underground gas storing capacity extension Gajary-Báden, Slovakia. GasOil Technology a.s. Available online: http://www.gasoil-tech.com/en/reference-projects (accessed on 14 July 2019).
  43. Hradil, F. Podzemní zásobník plynu – Lobodice. In Proceeding of Mining University of Ostrava, 12(7), 1966. Mining University of Ostrava: Ostrava, the Czech Republic. pp. 893–900. Available online: https://dspace.vsb.cz/bitstream/handle/10084/33161/HUT301.pdf?sequence=1&isAllowed=n (accessed on 14 July 2019).
  44. Bimka, T. Geologické Zpracování Sedimentů Svrchního Sarmatu na Pokleslé kře Lanžhotsko-Hrušeckého Zlomu a Jejich Posouzení z Hlediska Možnosti Akumulace Přírodních Uhlovodíků v Nejvyšších Strukturních Pozicích u L-H Zlomu. (Charakteristic of the Upper Sarmatia Sediments in the Decline Segment of the Lanzhot-Hrusky Fault—Implications for the Gas and Oil Accumulations). Diploma Thesis, Masaryk University, Brno, Czech Republic, 2013; p. 49. [Google Scholar]
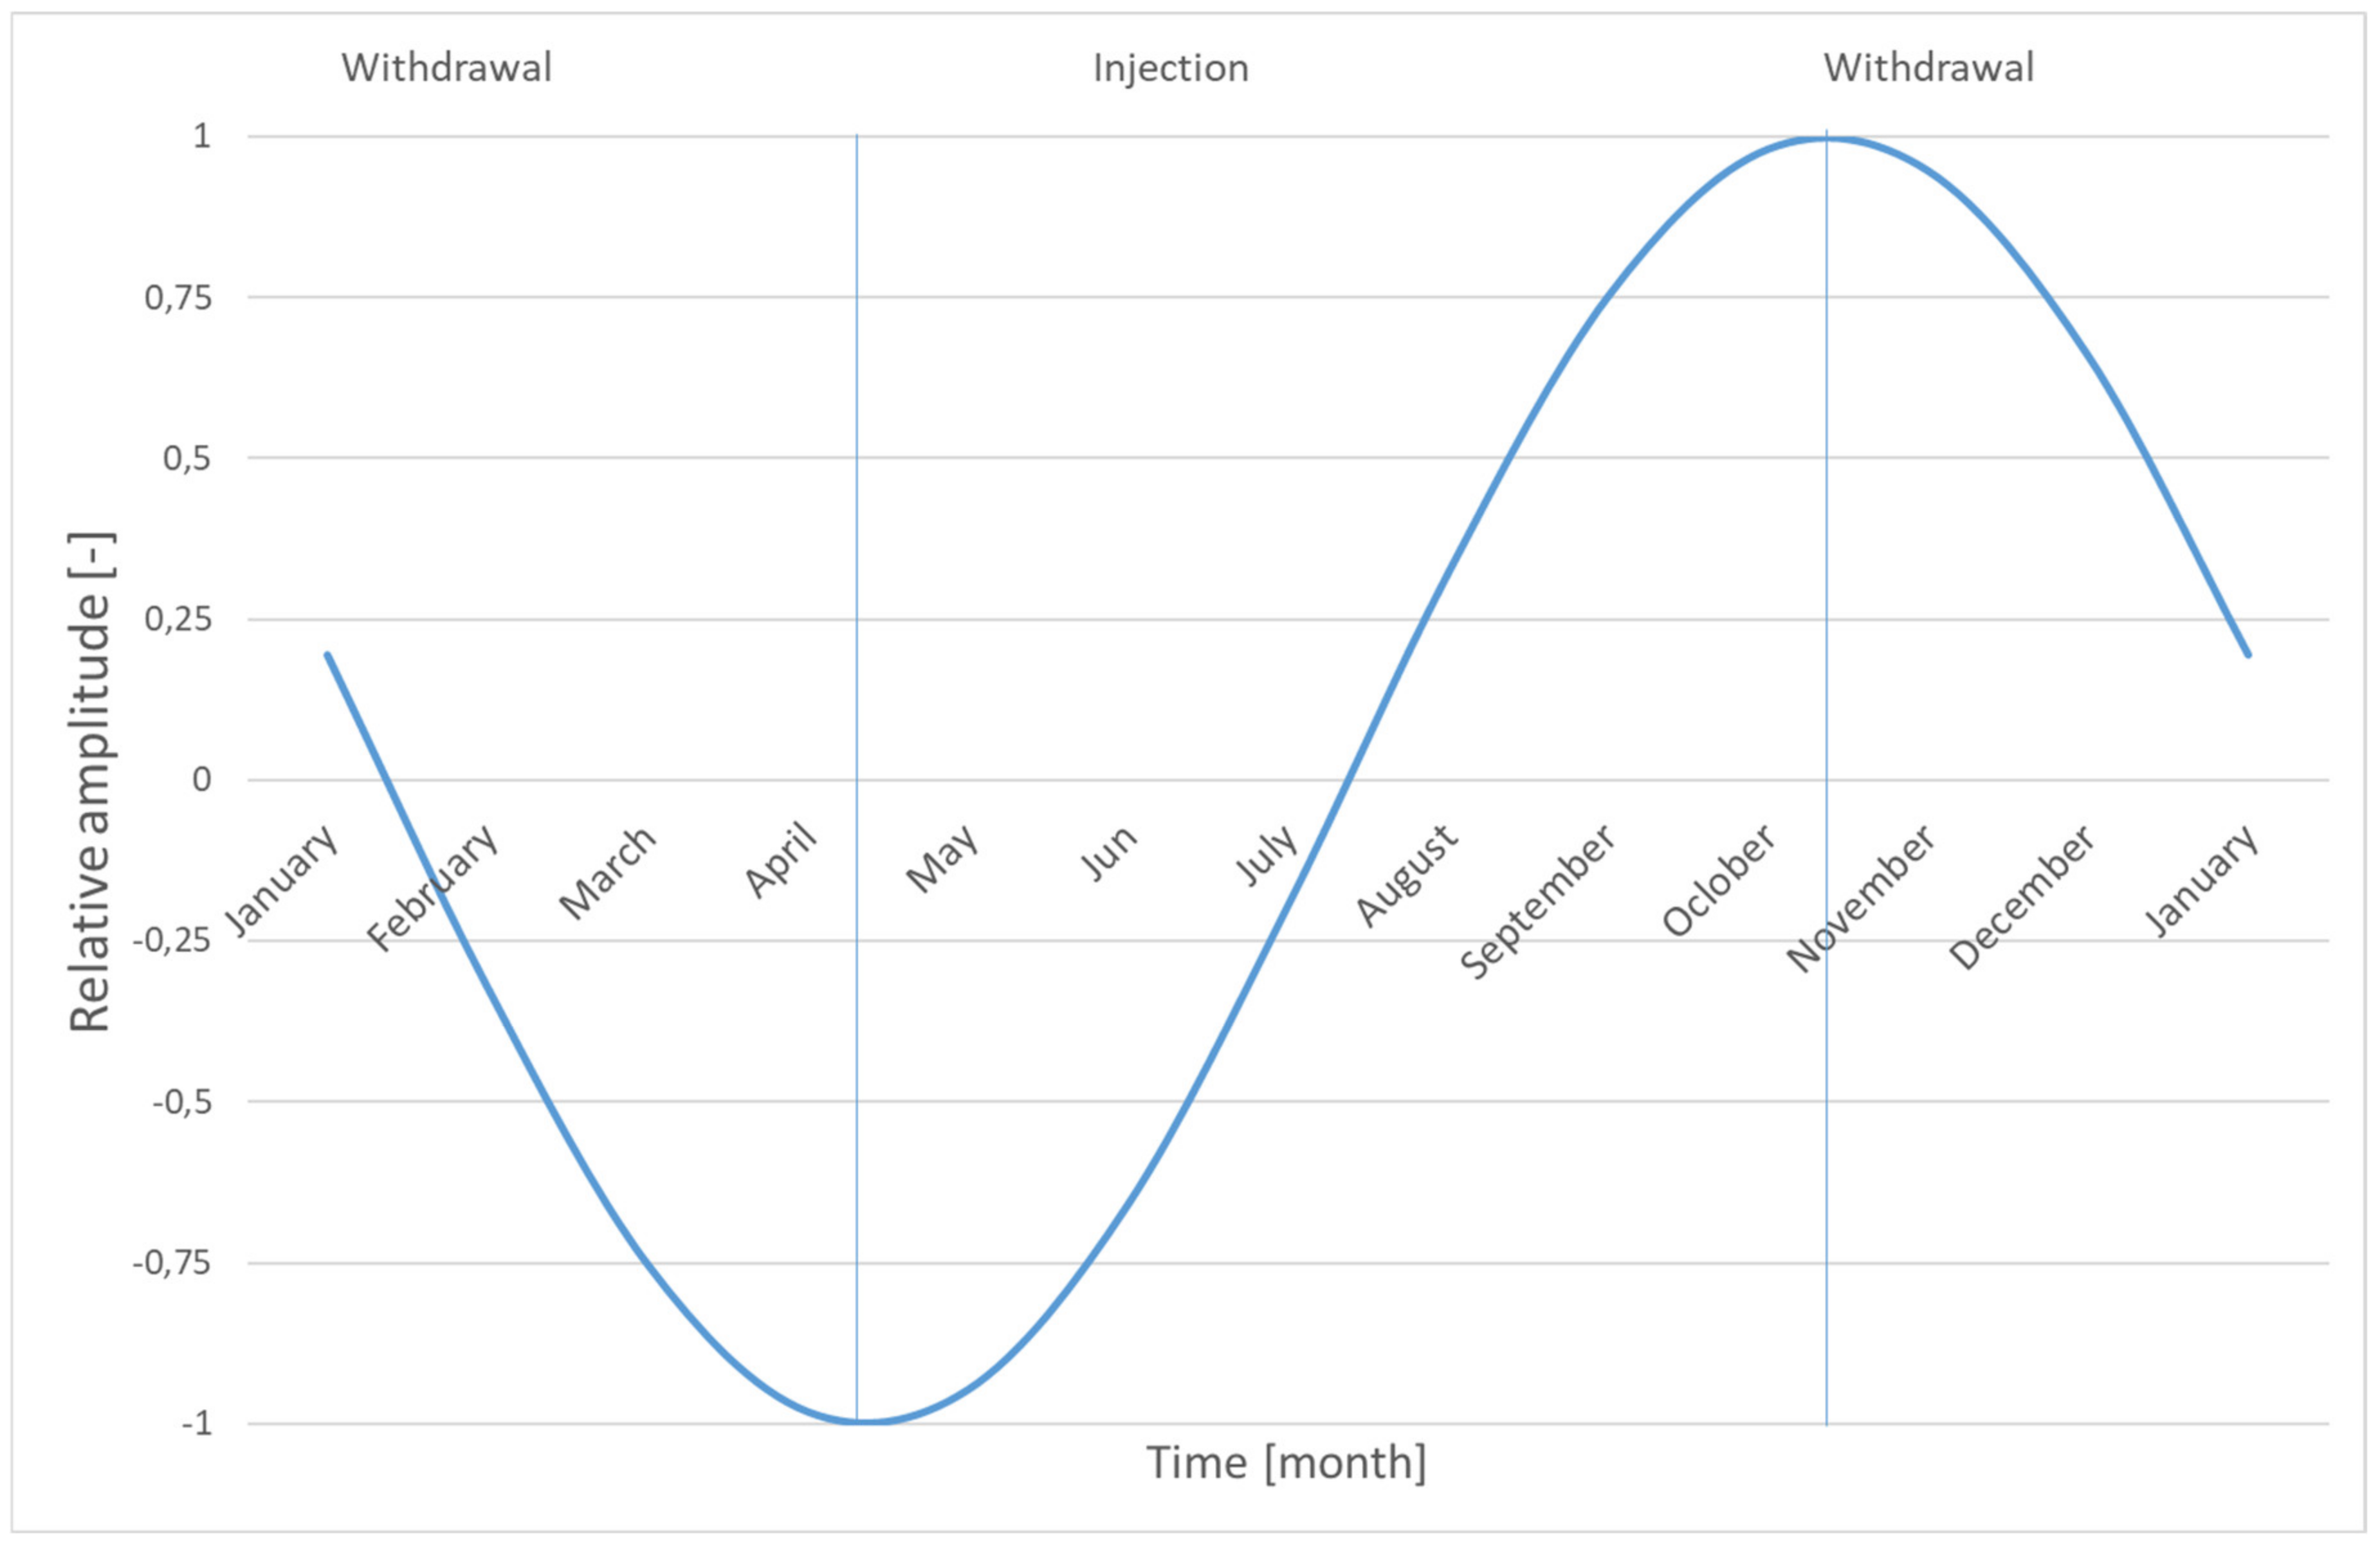
Figure 1. The theoretical course of injection and withdrawal cycle at an underground gas storage (UGS).
Remotesensing 12 00271 g001
Figure 2. Example of height change time series of three PS points selected from areas A, B and C (see also Figure 8). Coarse curves represent raw data collected at these points; smooth curves are smoothed by moving average with 180-day window.
Remotesensing 12 00271 g002
Figure 3. Example of periodogram for point no. 102 in the Tvrdonice UGS area. The period of 365 days, i.e., one cycle per year, which is significantly represented in the data, is marked by a red oval. Significance was determined using significance levels, where the coefficient (s) Pfa (0.5; 0.1; 0.01; 0.0001) correspond to significance levels of 50%, 10%, 1% and 0.01%.
Remotesensing 12 00271 g003
Figure 4. Example of distribution of correlation coefficient r values for the UGS Tvrdonice computed for every PS point; in the figure, it is showed the Tvrdonice fault and Lunžhotsko–hrušecký fault and drawing of course of the geological cross-section from Figure 7.
Remotesensing 12 00271 g004
Figure 5. Processing workflow diagram.
Remotesensing 12 00271 g005
Figure 6. Distribution of the UGSs in the studied area (ellipses I, II, III, and IV show the distribution of UGS clusters from Figure 11).
Remotesensing 12 00271 g006
Figure 7. Schematic geological cross-section of the Tvrdonice UGS area. Above the cross-section, the eastern boundary of the UGS is noted, and also the areas with the synchronous direction of movement (green; + r), the transition area (yellow; 0) and the area with opposite direction (red; −r) are marked. Horizons in layers of Sarmat and Baden are used for the UGS (modified according to [44]).
Remotesensing 12 00271 g007
Figure 8. Distribution of correlation coefficient values r in the Tvrdonice UGS area. At the top center of the figure, there is an overview and three areas are marked: area A above the UGS, area B on the border of the UGS and area C beyond the border of the UGS. The bottom left part of the figure shows the histograms of the coefficient r for each area. The histogram is shown in grey r for the entire dataset, in green, yellow or red are the value distribution of r for points lying in each area A–C.
Remotesensing 12 00271 g008
Figure 9. Example of the spatial distribution of correlation coefficient r (computed for every PS point) in the Vienna Basin in the UGS area in Slovakia and Austria.
Remotesensing 12 00271 g009
Figure 10. Standardized histograms of the relative frequency distribution of correlation coefficient r values for individual UGSs. The x-axis shows the frequency classes from -1 to 1 in steps of 0.1 for each histogram, and the relative frequency of the occurrence of the correlation coefficient r belonging to each class in the y-axis direction.
Remotesensing 12 00271 g010aRemotesensing 12 00271 g010bRemotesensing 12 00271 g010c
Figure 11. Hierarchical clustering of histograms for individual UGSs and UGS regions, with Clusters I to IV marked.
Remotesensing 12 00271 g011
Table 1. Parameters of the evaluated UGSs [34,35,36,37,38,39,40,41,42,43].
UGSOverall Capacity [106 m3]Rate of Injection brk [106 m3/day]Rate of Withdrawal brk [106 m3/day]Reservoir Depth [m]Operating Pressure [MPa]GeologyType
Czechia
Třanovice53088∅ 4451.4–3.9Carpathian Foredeepdepleted reservoir
Štramberk50077500–6901.8–4.4Carpathian Foredeepdepleted reservoir
Lobodice17753.3400–500unknownCarpathian Foredeepaquifer
Dolní Bojanovice65579700–21005.5–22Vienna Basindepleted reservoir
Dambořice4504.57.51350–15009.5–18.5Ždánická Unitdepleted reservoir
Tvrdonice535881050–1600unknownVienna Basindepleted reservoir
Dolní Dunajovice90017121050unknownCarpathian Foredeepdepleted reservoir
Slovakia
Láb 213031.837343–1800 Vienna Basindepleted reservoir
Gajary – baden5005618003.0–21.0Vienna Basindepleted reservoir
Láb IV6556.856.85620–10504.0–13.5Vienna Basindepleted reservoir