Coastal Mangrove Response to Marine Erosion: Evaluating the Impacts of Spatial Distribution and Vegetation Growth in Bangkok Bay from 1987 to 2017


Abstract
1. Introduction
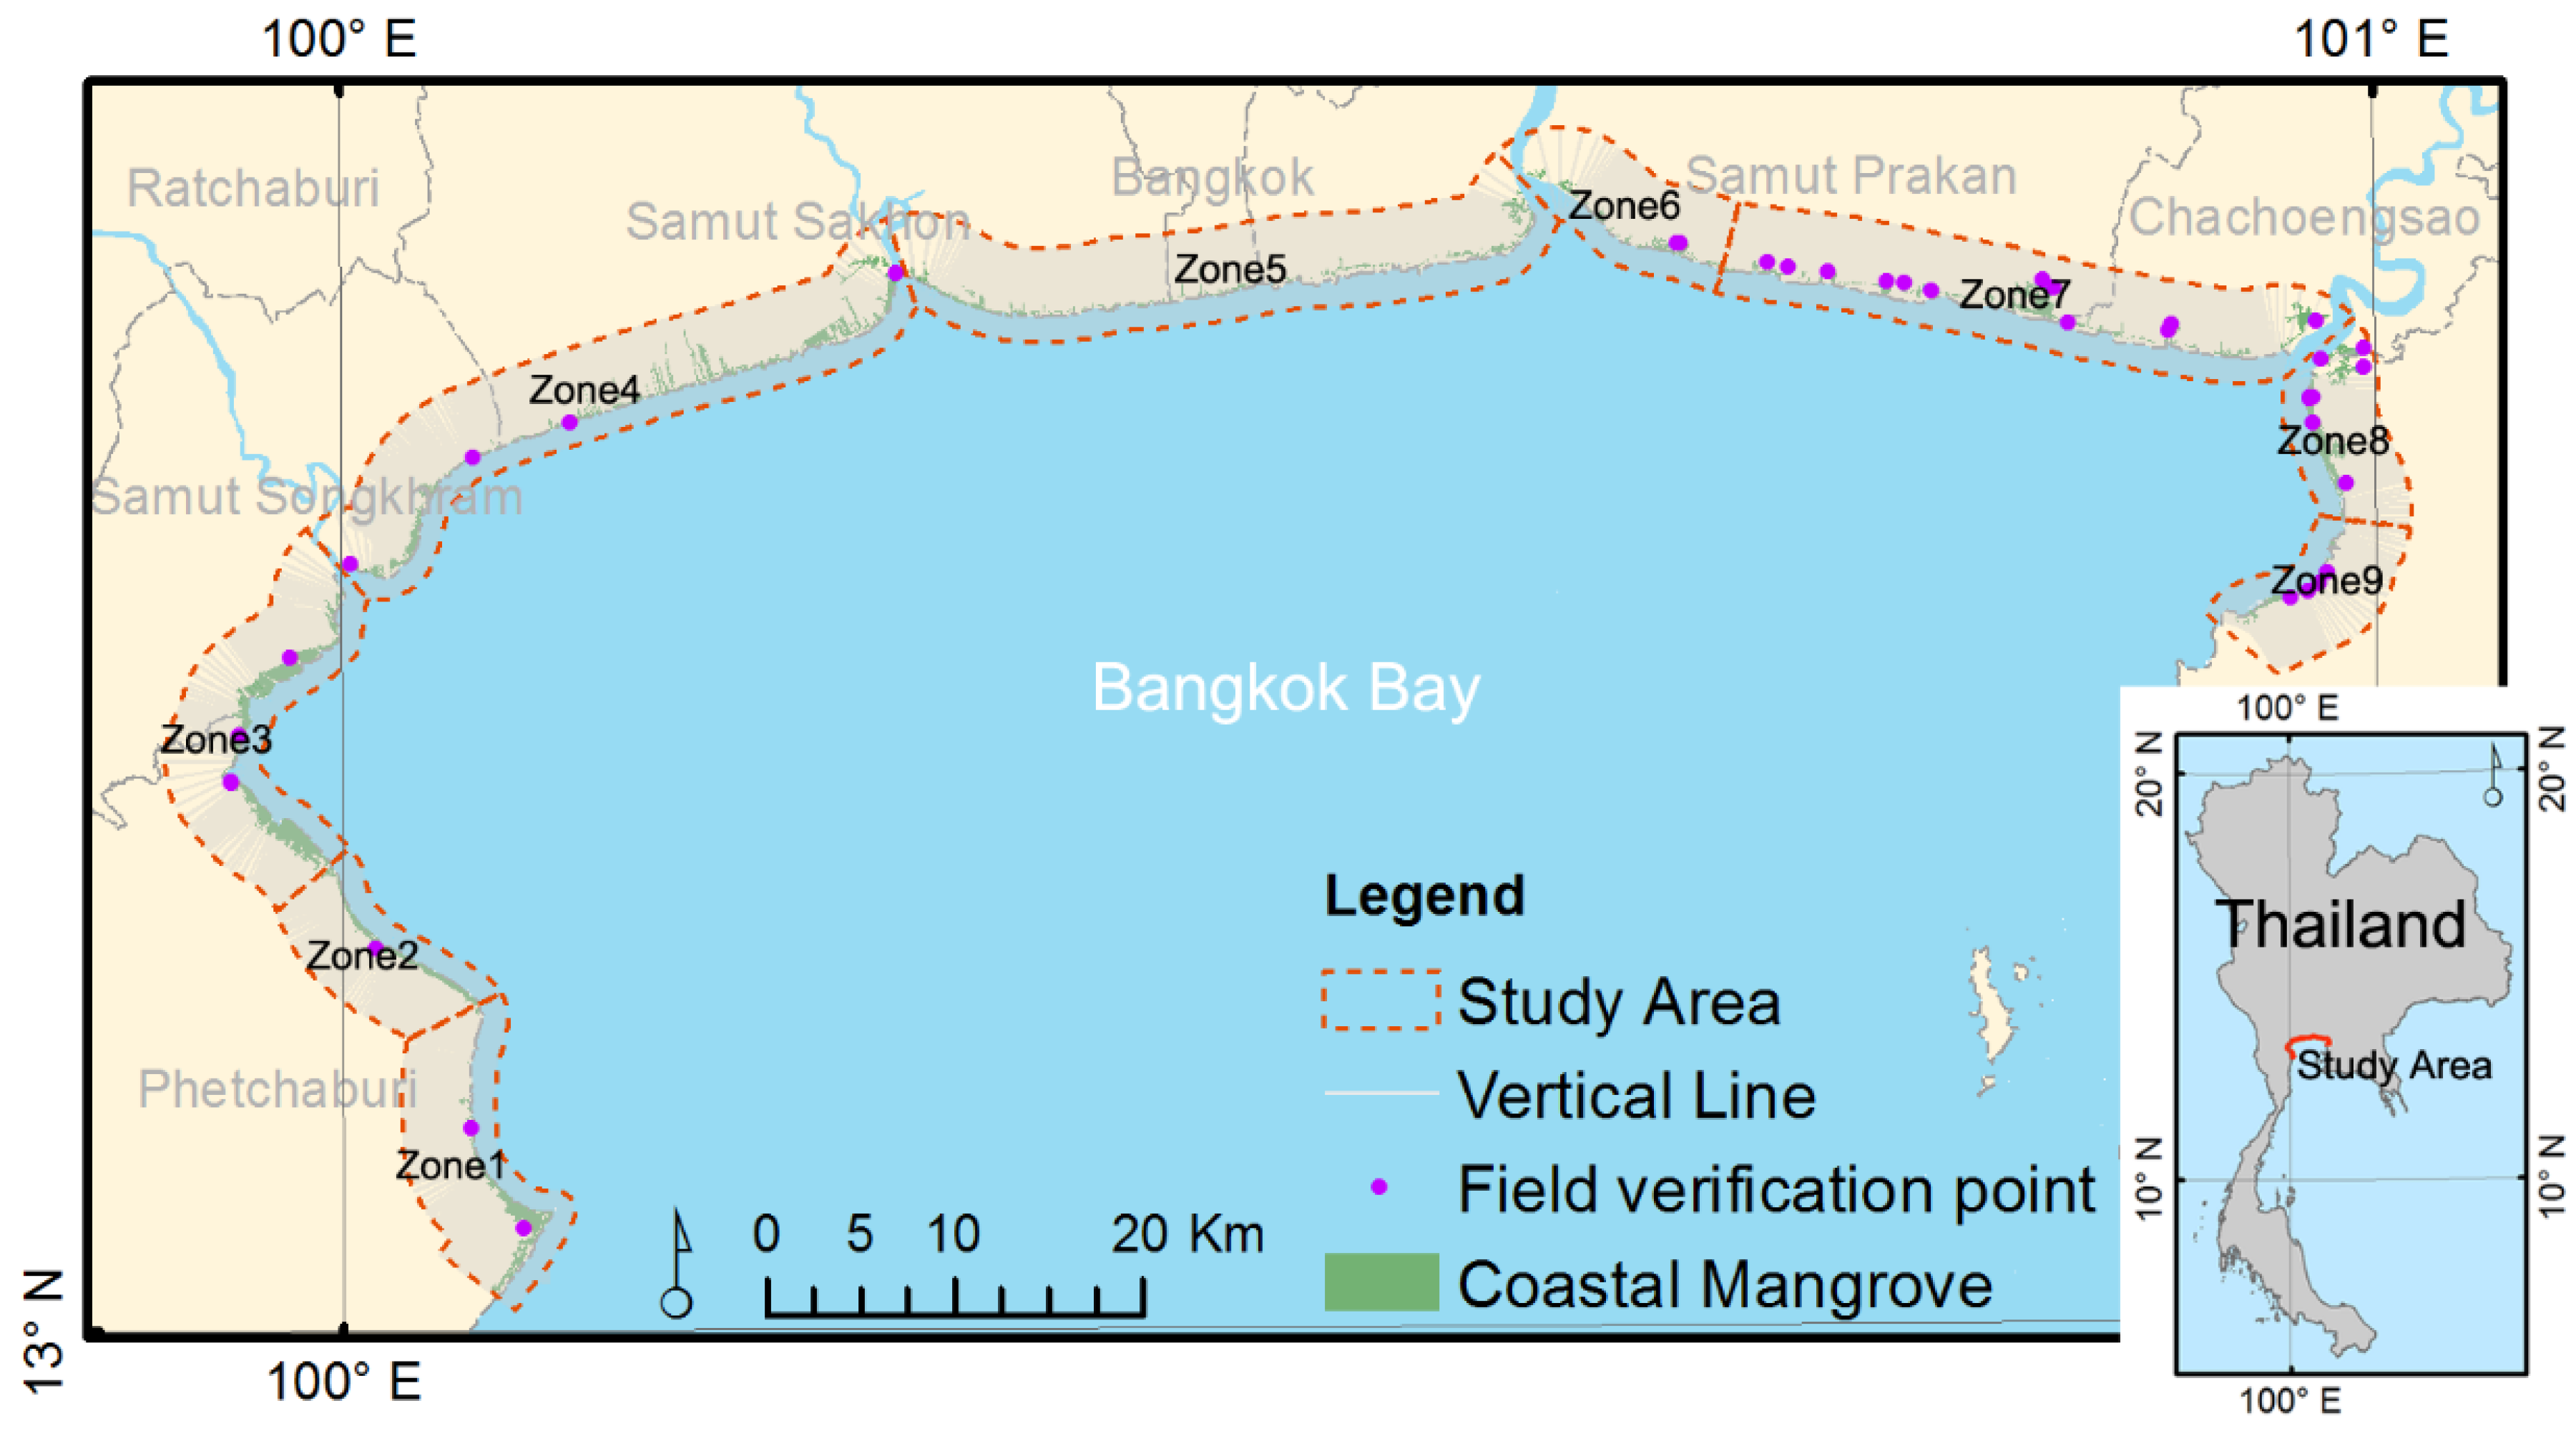
2. Study Area
3. Materials and Methods
3.1. Field Measurements and Investigations in the Study Area
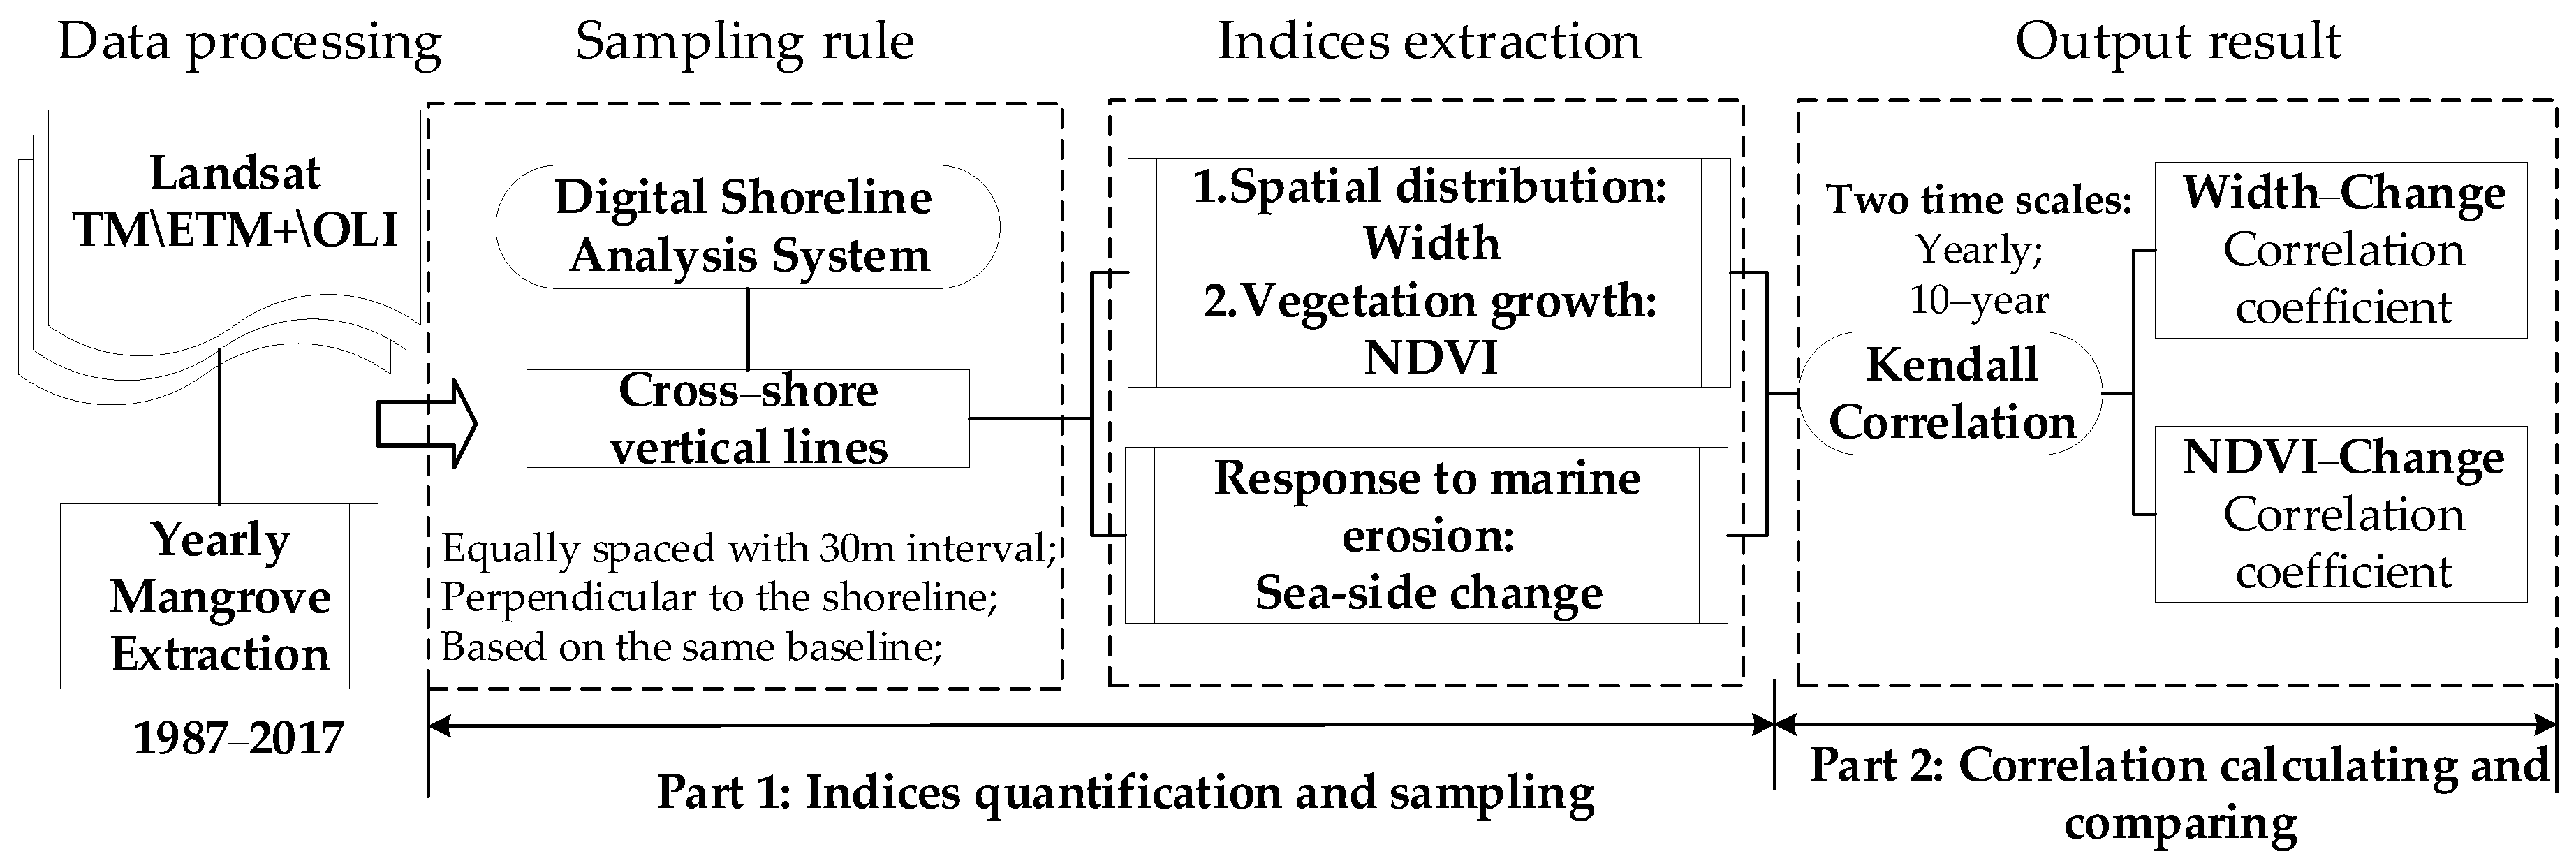
3.2. Satellite Data Processing and Mangrove Mapping
3.3. Relationship Resolution
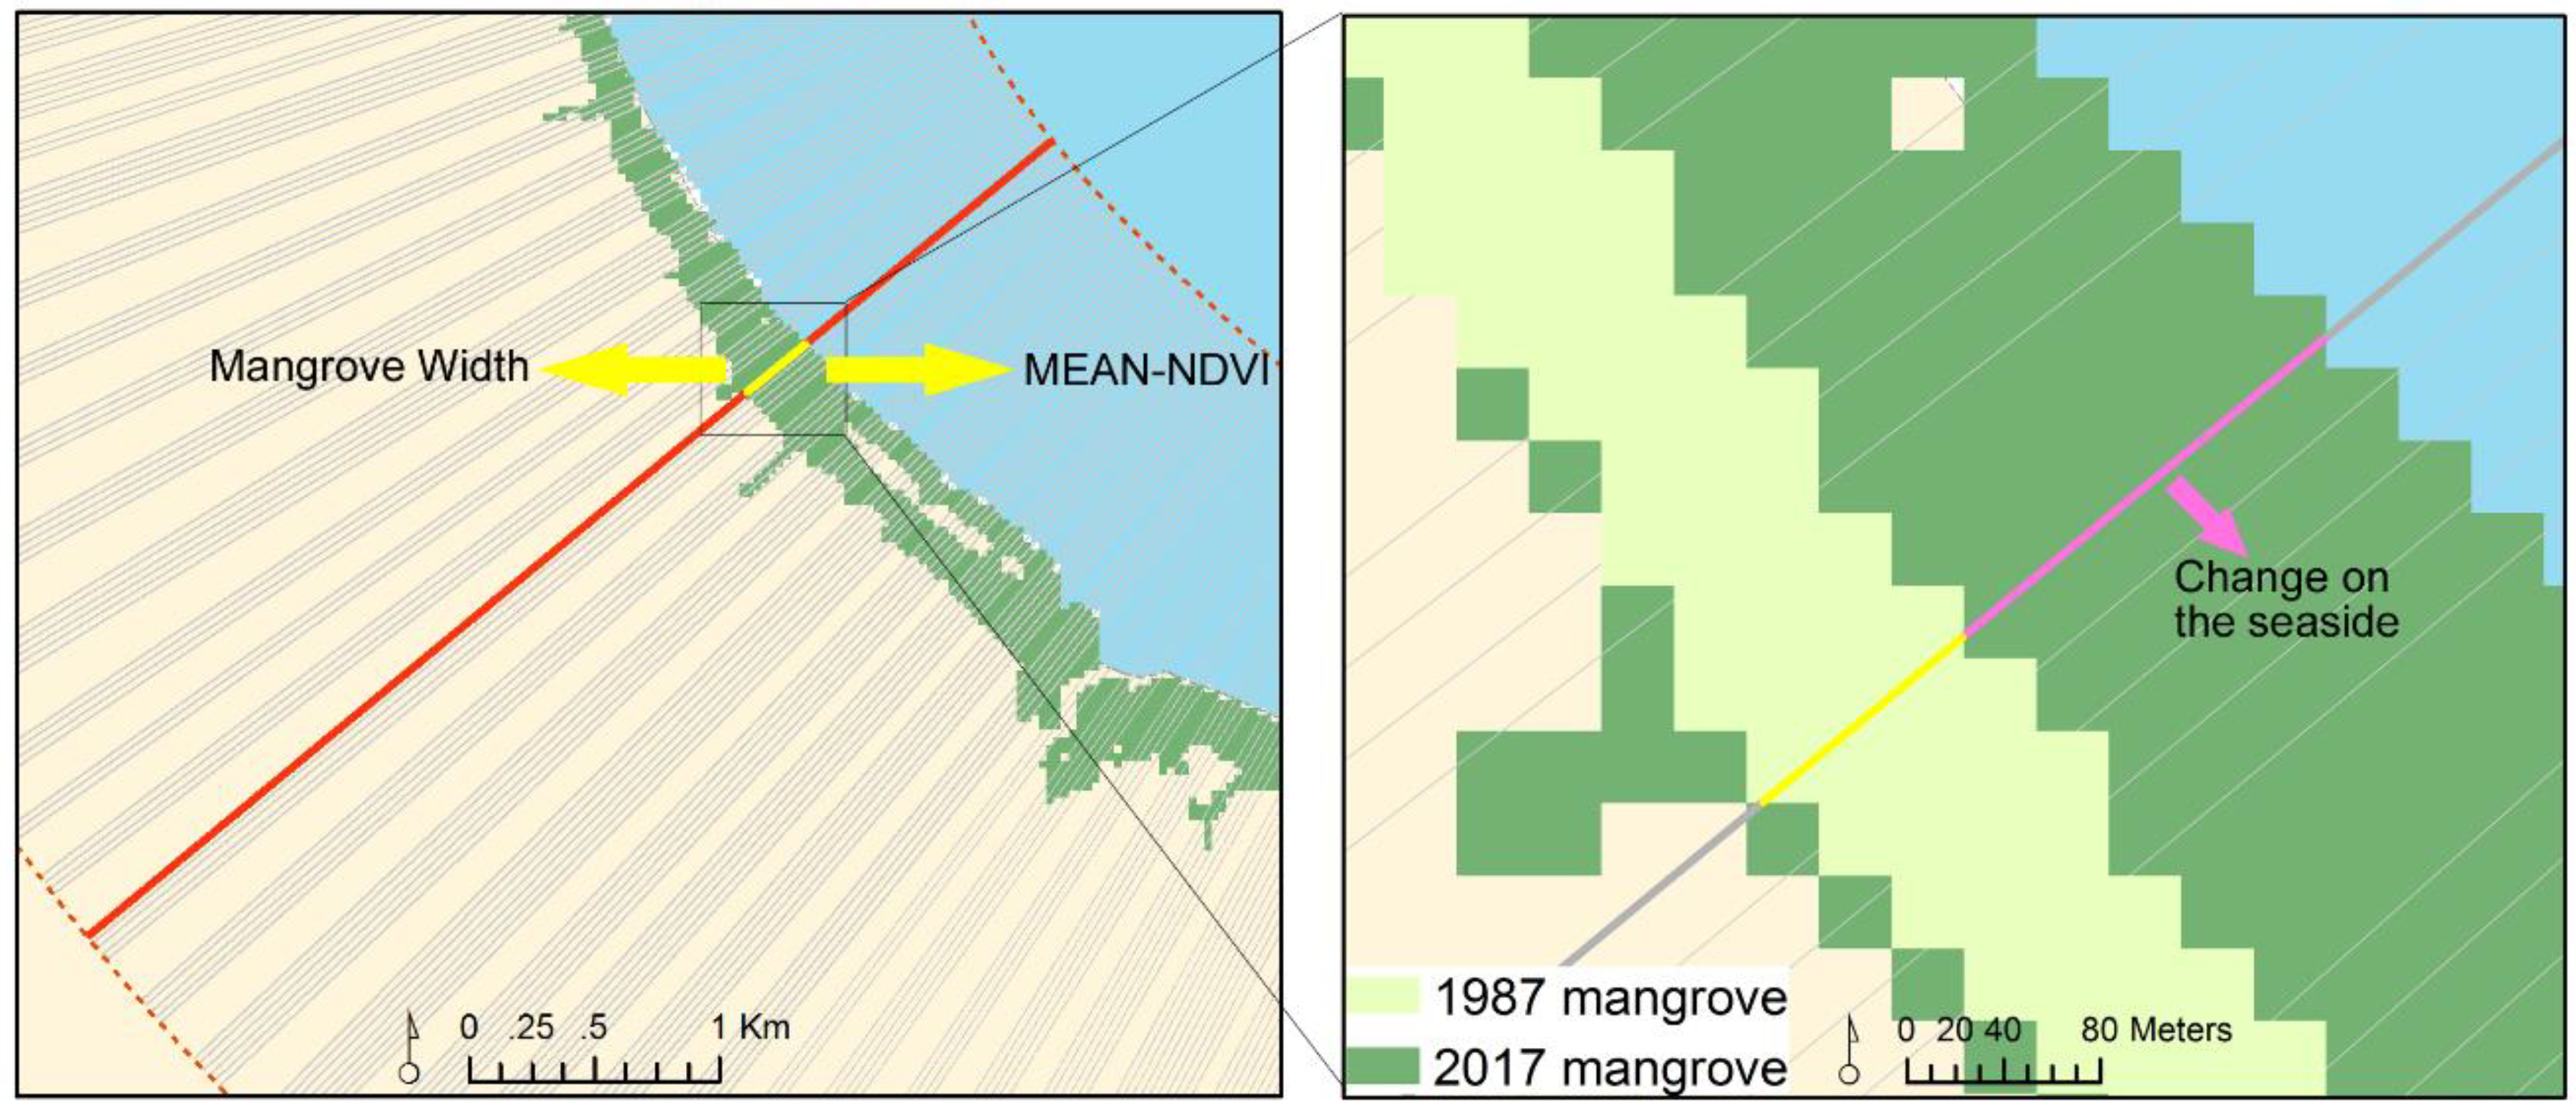
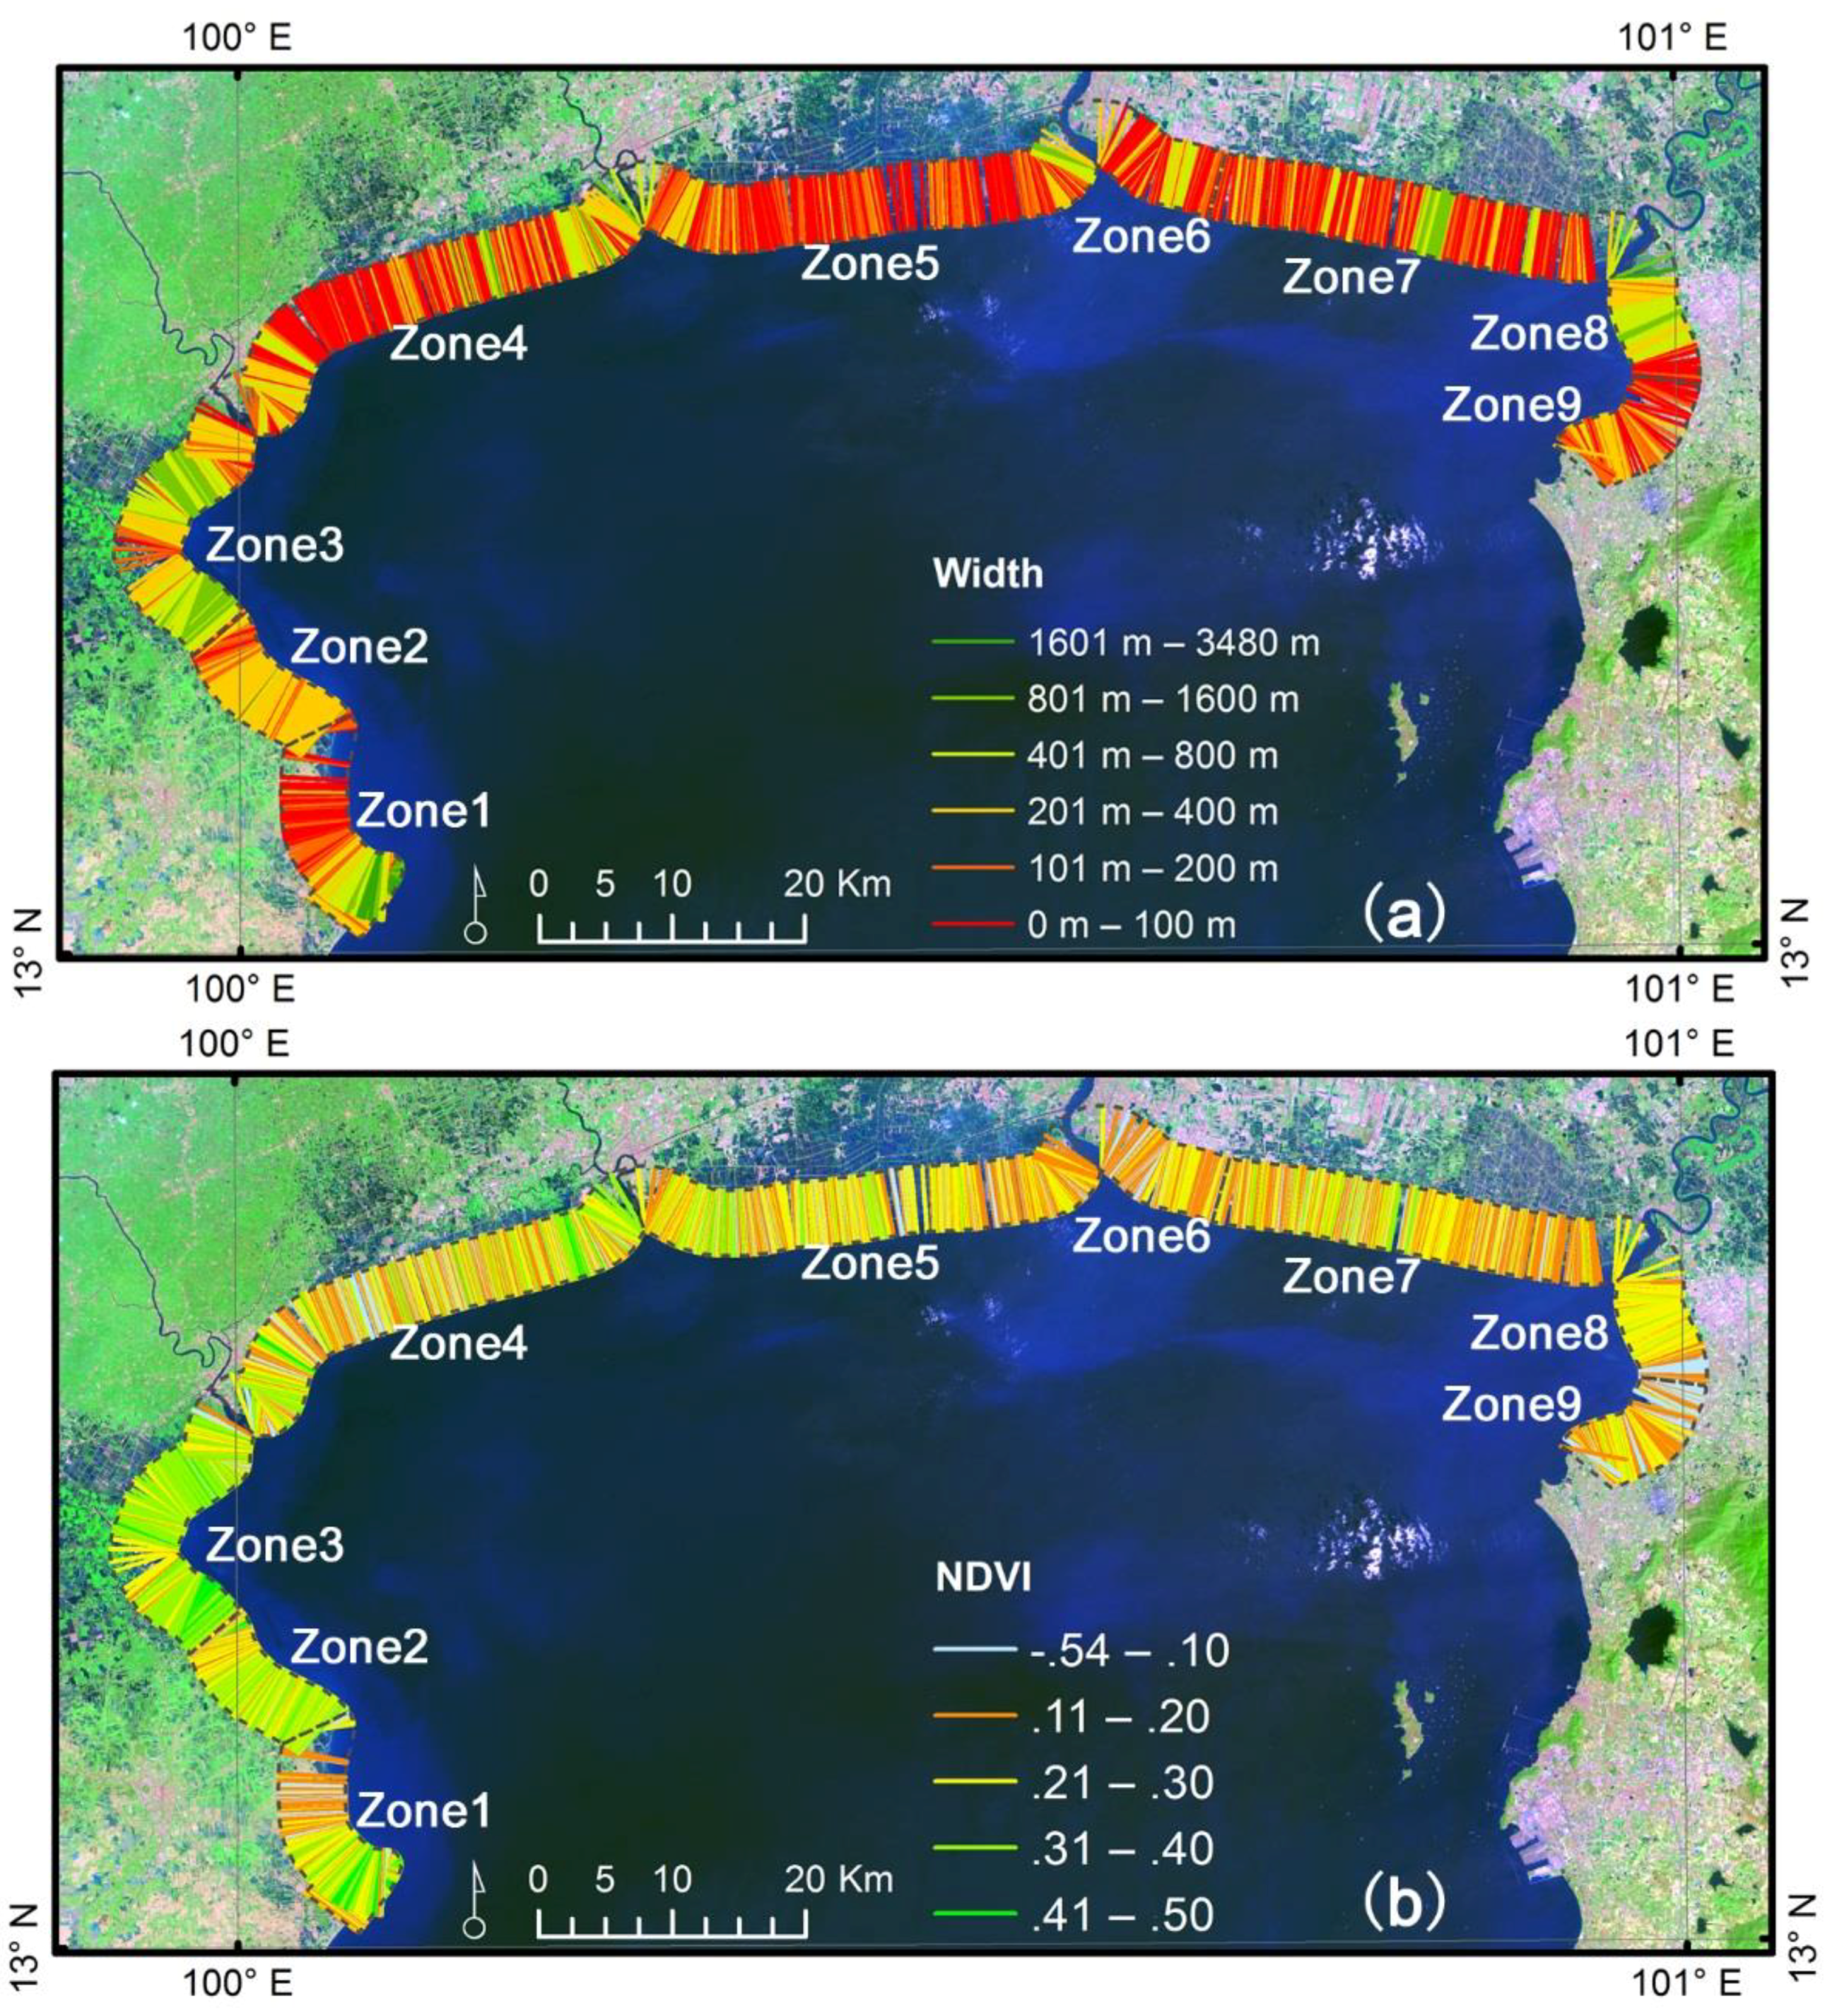
3.3.1. Sampling Rule and Indices Extraction
3.3.2. Long Time-Series-Based Relational Analysis Method
4. Results
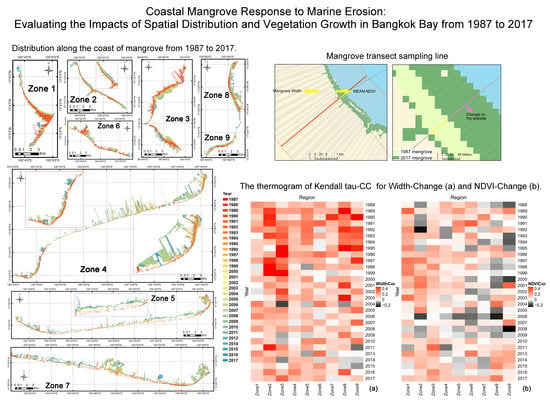
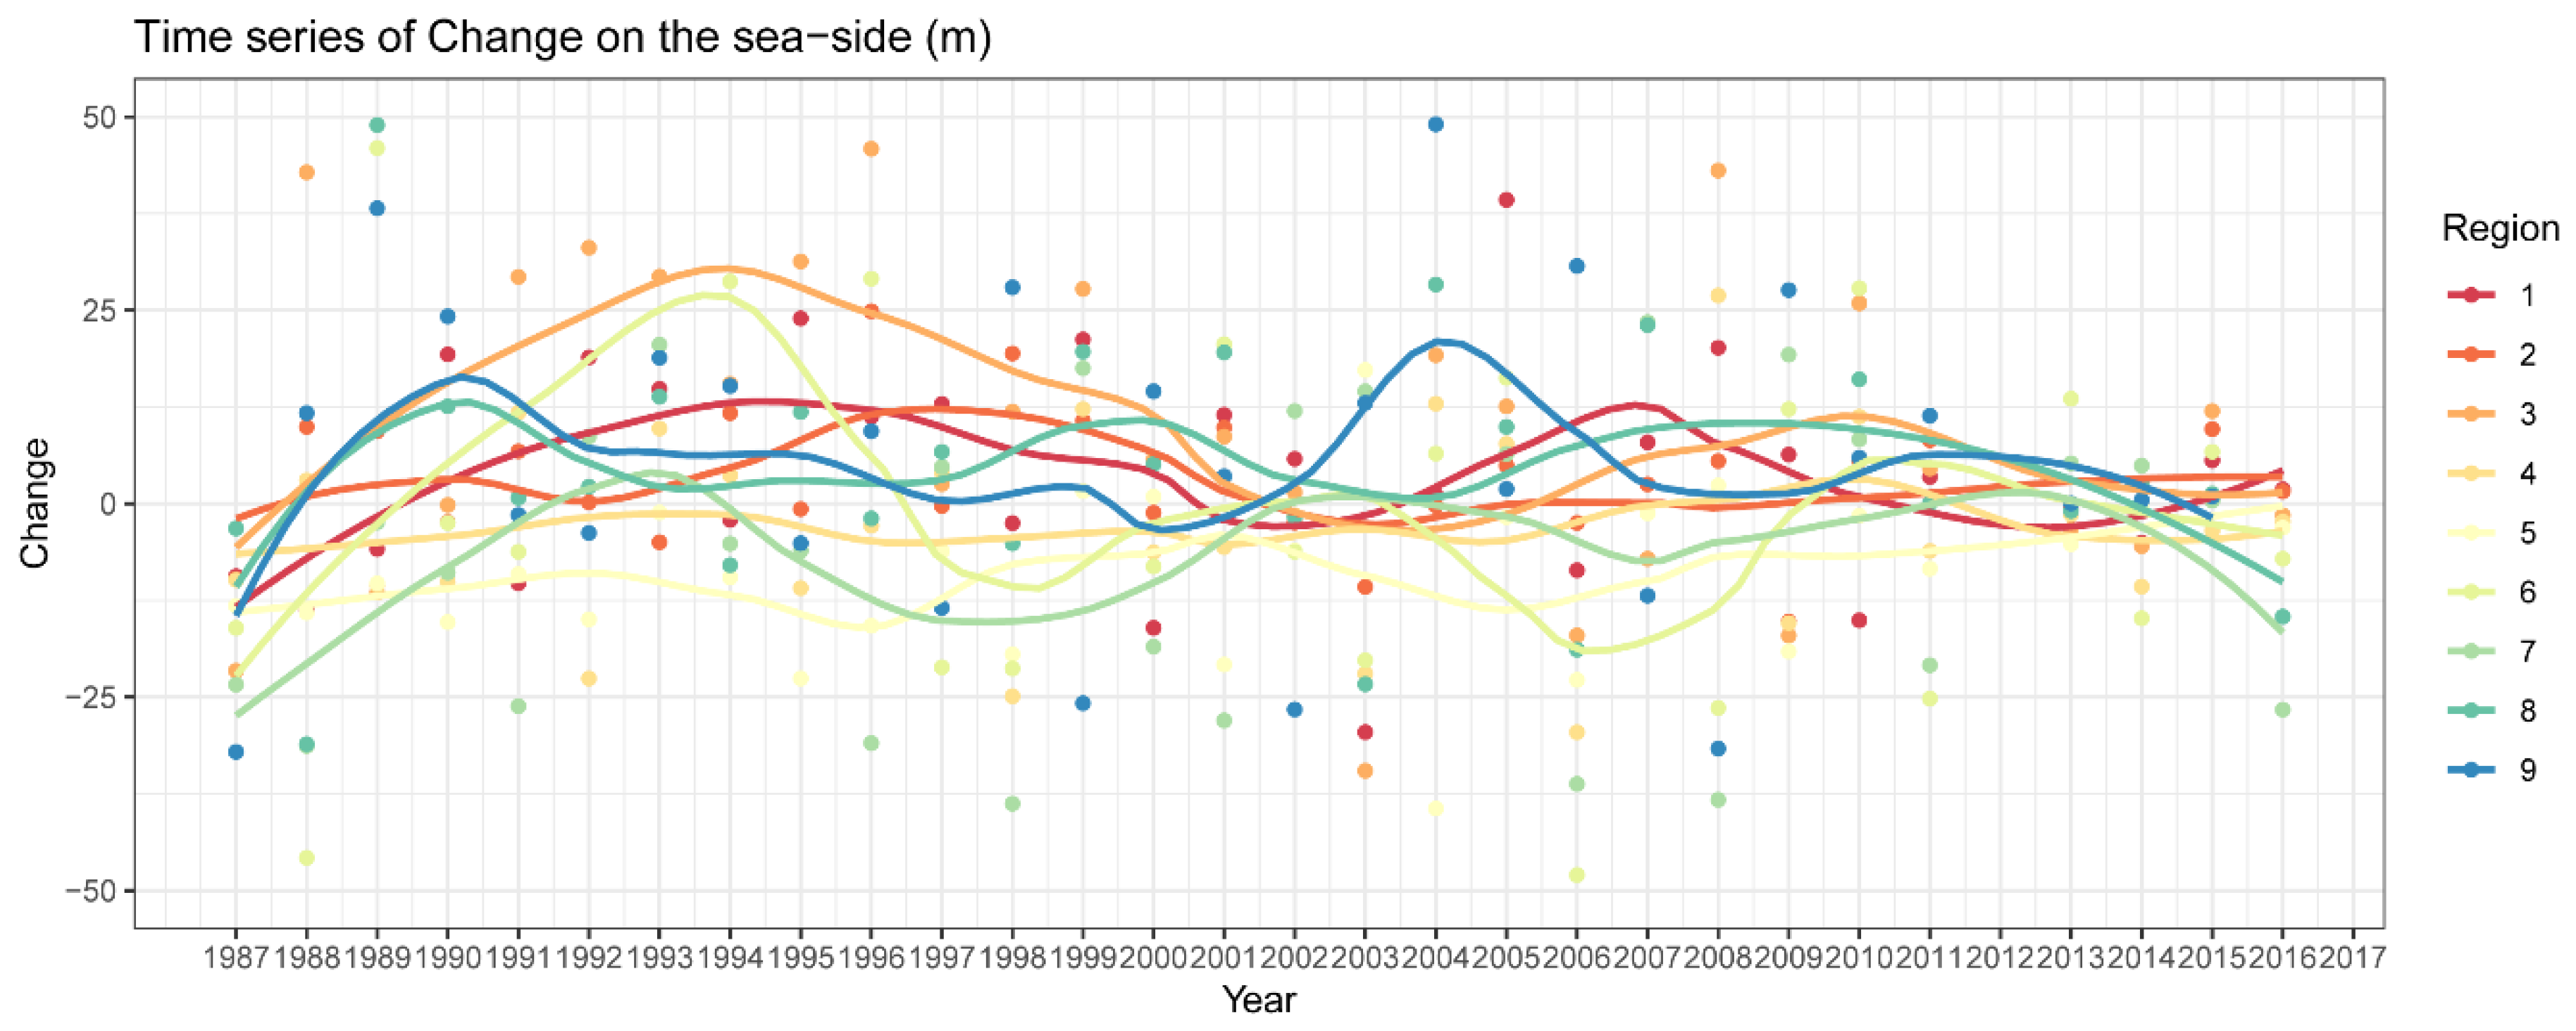
4.1. Dynamics of Coastal Mangrove Change Across 30 Years
4.2. Relationship between Width-Change and NDVI-Change
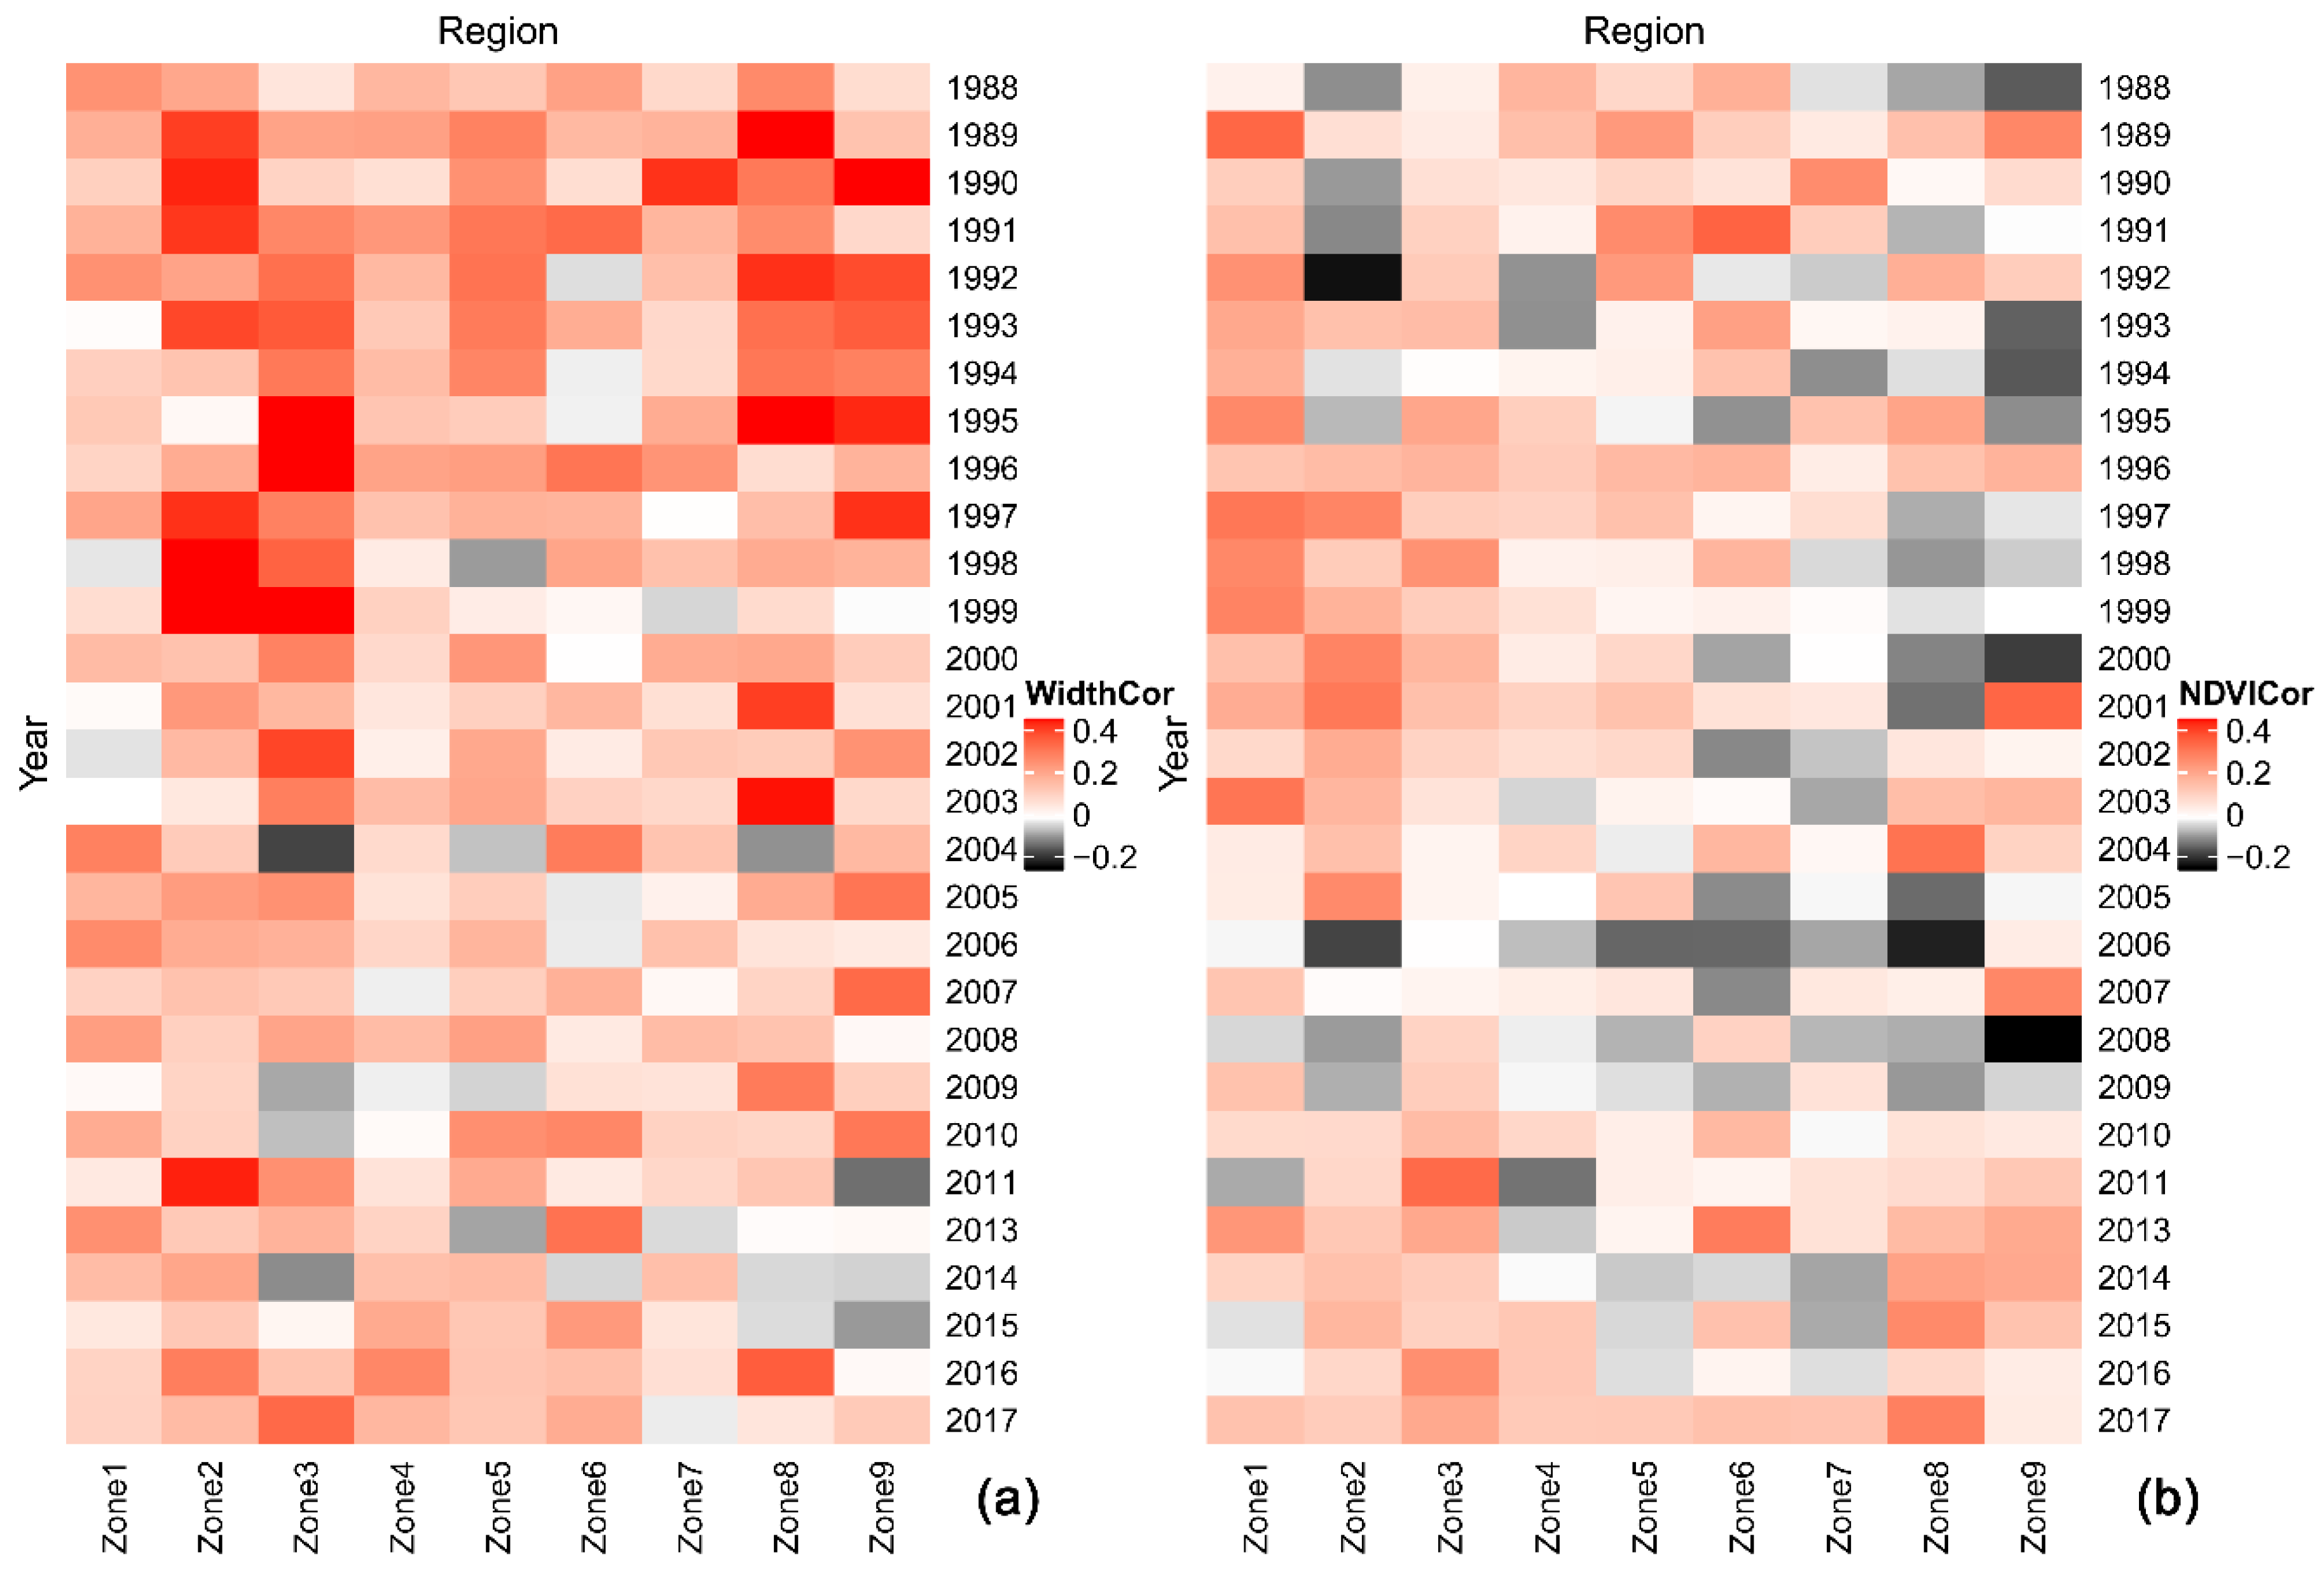
4.2.1. Correlations at the Yearly Scale
4.2.2. Correlations at the 10-Year Scale
5. Discussion
5.1. Quantification Method for Long-Term Analyses
5.2. The Impacts of Spatial Distribution and Vegetation Growth in the Various Growing Stages
6. Conclusions
Author Contributions
Funding
Acknowledgments
Conflicts of Interest
References
- Atwood, T.B.; Connolly, R.M.; Almahasheer, H.; Carnell, P.E.; Duarte, C.M.; Ewers Lewis, C.J.; Irigoien, X.; Kelleway, J.J.; Lavery, P.S.; Macreadie, P.I.; et al. Global patterns in mangrove soil carbon stocks and losses. Nat. Clim. Chang. 2017, 7, 523–528. [Google Scholar] [CrossRef]
- Curnick, D.J.; Pettorelli, N.; Amir, A.A.; Balke, T.; Barbier, E.B.; Crooks, S.; Dahdouh-Guebas, F.; Duncan, C.; Endsor, C.; Friess, D.A.; et al. The value of small mangrove patches. Science 2019, 363, 239. [Google Scholar] [PubMed]
- Alongi, D.M. Mangrove forests: Resilience, protection from tsunamis, and responses to global climate change. Estuar. Coast. Shelf Sci. 2008, 76, 1–13. [Google Scholar] [CrossRef]
- McIvor, A.; Möller, I.; Spencer, T.; Spalding, M. Reduction of Wind and Swell Waves by Mangroves. Natural Coastal Protection Series: Report 1; Cambridge Coastal Research Unit Working Paper 40; The Nature Conservancy and Wetlands International: London, UK, 2012; ISSN 2050-7941. [Google Scholar]
- Danielsen, F.; Sorensen, M.K.; Olwig, M.F.; Selvam, V.; Parish, F.; Burgess, N.D.; Hiraishi, T.; Karunagaran, V.M.; Rasmussen, M.S.; Hansen, L.B.; et al. The asian tsunami: A protective role for coastal vegetation. Science 2005, 310, 643. [Google Scholar] [CrossRef]
- Gracia, A.; Rangel-Buitrago, N.; Oakley, J.A.; Williams, A.T. Use of ecosystems in coastal erosion management. Ocean Coast. Manag. 2018, 156, 277–289. [Google Scholar] [CrossRef]
- Cai, F.; Su, X.; Liu, J.; Li, B.; Lei, G. Coastal erosion in China under the condition of global climate change and measures for its prevention. Prog. Nat. Sci. 2009, 19, 415–426. [Google Scholar] [CrossRef]
- Barbier, E.B. The protective service of mangrove ecosystems: A review of valuation methods. Mar. Pollut. Bull. 2016, 109, 676–681. [Google Scholar] [CrossRef]
- Giri, C.; Long, J.; Abbas, S.; Murali, R.M.; Qamer, F.M.; Pengra, B.; Thau, D. Distribution and dynamics of mangrove forests of South Asia. J. Environ. Manag. 2015, 148, 101–111. [Google Scholar] [CrossRef]
- Godoy, M.D.; de Lacerda, L.D. Mangroves response to climate change: A review of recent findings on mangrove extension and distribution. An. Acad. Bras. Ciências 2015, 87, 651–667. [Google Scholar] [CrossRef]
- Woodroffe, C.D. Response of tide-dominated mangrove shorelines in northern Australia to anticipated sea-level rise. Earth Surf. Process. Landf. 1995, 20, 65–85. [Google Scholar] [CrossRef]
- Jallow, B.P.; Barrow, M.K.A.; Leatherman, S.P. Vulnerability of the coastal zone of the gambia to sea level rise and development of response strategies and adaptation options. Clim. Res. 1996, 6, 165–177. [Google Scholar] [CrossRef]
- Gilman, E.; Ellison, J.; Coleman, R. Assessment of mangrove response to projected relative sea-level rise and recent historical reconstruction of shoreline position. Environ. Monit. Assess. 2007, 124, 105–130. [Google Scholar] [CrossRef] [PubMed]
- Woodroffe, C.D. Mangrove response to sea level rise: Palaeoecological insights from macrotidal systems in northern Australia. Mar. Freshw. Res. 2018, 69, 917–932. [Google Scholar] [CrossRef]
- Schuerch, M.; Spencer, T.; Temmerman, S.; Kirwan, M.L.; Wolff, C.; Lincke, D.; McOwen, C.J.; Pickering, M.D.; Reef, R.; Vafeidis, A.T.; et al. Future response of global coastal wetlands to sea-level rise. Nature 2018, 561, 231–234. [Google Scholar] [CrossRef]
- Kuenzer, C.; Bluemel, A.; Gebhardt, S.; Quoc, T.V.; Dech, S. Remote sensing of mangrove ecosystems: A review. Remote Sens. 2011, 3, 878–928. [Google Scholar] [CrossRef]
- Heumann, B.W. Satellite remote sensing of mangrove forests: Recent advances and future opportunities. Prog. Phys. Geogr. 2011, 35, 87–108. [Google Scholar] [CrossRef]
- Leempoel, K.; Satyaranayana, B.; Bourgeois, C.; Zhang, J.; Chen, M.; Wang, J.; Bogaert, J.; Dahdouh-Guebas, F. Dynamics in mangroves assessed by high-resolution and multi-temporal satellite data: A case study in zhanjiang mangrove national nature reserve (zmnnr), PR China. Biogeosciences 2013, 10, 5681–5689. [Google Scholar] [CrossRef]
- Wang, L.; Jia, M.; Yin, D.; Tian, J. A review of remote sensing for mangrove forests: 1956–2018. Remote Sens. Environ. 2019, 231, 111223. [Google Scholar] [CrossRef]
- Lewis, R.R., 3rd; Milbrandt, E.C.; Brown, B.; Krauss, K.W.; Rovai, A.S.; Beever, J.W., 3rd; Flynn, L.L. Stress in mangrove forests: Early detection and preemptive rehabilitation are essential for future successful worldwide mangrove forest management. Mar. Pollut. Bull. 2016, 109, 764–771. [Google Scholar] [CrossRef]
- Tian, B.; Wu, W.; Yang, Z.; Zhou, Y. Drivers, trends, and potential impacts of long-term coastal reclamation in China from 1985 to 2010. Estuar. Coast. Shelf Sci. 2016, 170, 83–90. [Google Scholar] [CrossRef]
- Fu, H.; Liu, X.; Sun, Y. Application of RS in Wetland Ecosystem Health Assessment: A Case Study of Dagu River Estuary. In Proceedings of the 2008 International Workshop on Education Technology and Training & 2008 International Workshop on Geoscience and Remote Sensing, Shanghai, China, 21–22 December 2008; pp. 279–282. [Google Scholar]
- Nittrouer, C.A.; Mullarney, J.C.; Allison, M.A.; Ogston, A.S. Sedimentary processes building a tropical delta yesterday, today, and tomorrow: The mekong system. Oceanography 2017, 30, 10–21. [Google Scholar] [CrossRef][Green Version]
- Willemsen, P.W.J.M.; Horstman, E.M.; Borsje, B.W.; Friess, D.A.; Dohmen-Janssen, C.M. Sensitivity of the sediment trapping capacity of an estuarine mangrove forest. Geomorphology 2016, 273, 189–201. [Google Scholar] [CrossRef]
- Jayanthi, M.; Thirumurthy, S.; Nagaraj, G.; Muralidhar, M.; Ravichandran, P. Spatial and temporal changes in mangrove cover across the protected and unprotected forests of India. Estuar. Coast. Shelf Sci. 2018, 213, 81–91. [Google Scholar] [CrossRef]
- Kamal, M.; Phinn, S.; Johansen, K. Characterizing the spatial structure of mangrove features for optimizing image-based mangrove mapping. Remote Sens. 2014, 6, 984–1006. [Google Scholar] [CrossRef]
- Li, Z.; Xie, C.; He, X.; Guo, H.; Wang, L. Dynamic changes of landscape pattern and vulnerability analysis in qingyi river basin. IOP Conf. Ser. Earth Environ. Sci. 2017, 94, 012189. [Google Scholar] [CrossRef]
- Lin, Y.; Hu, X.; Zheng, X.; Hou, X.; Zhang, Z.; Zhou, X.; Qiu, R.; Lin, J. Spatial variations in the relationships between road network and landscape ecological risks in the highest forest coverage region of China. Ecol. Indic. 2019, 96, 392–403. [Google Scholar] [CrossRef]
- Walters, B.B.; Rönnbäck, P.; Kovacs, J.M.; Crona, B.; Hussain, S.A.; Badola, R.; Primavera, J.H.; Barbier, E.; Dahdouh-Guebas, F. Ethnobiology, socio-economics and management of mangrove forests: A review. Aquat. Bot. 2008, 89, 220–236. [Google Scholar] [CrossRef]
- Araújo, L.; Silva, M.F.S.; Gomes, D.d.N.; Sousa, M.B.; Mayo, S.J.; de Andrade, I.M. Structure of a disturbed mangrove in the Rio Parnaíba delta, Piauí, northeast Brazil. Feddes Repert. 2018, 129, 75–91. [Google Scholar] [CrossRef]
- Holm, A.M.; Cridland, S.W.; Roderick, M.L. The use of time-integrated noaa ndvi data and rainfall to assess landscape degradation in the arid shrubland of western Australia. Remote Sens. Environ. 2003, 85, 145–158. [Google Scholar] [CrossRef]
- Hill, M.J.; Donald, G.E. Estimating spatio-temporal patterns of agricultural productivity in fragmented landscapes using avhrr ndvi time-series. Remote Sens. Environ. 2003, 84, 367–384. [Google Scholar] [CrossRef]
- Jia, M.; Wang, Z.; Wang, C.; Mao, D.; Zhang, Y. A new vegetation index to detect periodically submerged mangrove forest using single-tide sentinel-2 imagery. Remote Sens. 2019, 11, 2043. [Google Scholar] [CrossRef]
- Wattayakorn, G. Environmental issues in the gulf of Thailand. In The Environment in Asia Pacific Harbours; Springer: Berlin/Heidelberg, Germany, 2006; pp. 249–259. [Google Scholar]
- Sathirathai, S.; Barbier, E.B. Valuing mangrove conservation in southern Thailand. Contemp. Econ. Policy 2001, 19, 109–122. [Google Scholar] [CrossRef]
- Davies, K.P.; Murphy, R.J.; Bruce, E. Detecting historical changes to vegetation in a cambodian protected area using the landsat tm and etm+ sensors. Remote Sens. Environ. 2016, 187, 332–344. [Google Scholar] [CrossRef]
- USGS Landsat Collections. Fact Sheet; USGS, Ed.; USGS: Reston, VA, USA, 2018; p. 2.
- Gorelick, N.; Hancher, M.; Dixon, M.; Ilyushchenko, S.; Thau, D.; Moore, R. Google earth engine: Planetary-scale geospatial analysis for everyone. Remote Sens. Environ. 2017, 202, 18–27. [Google Scholar] [CrossRef]
- Farr, T.G.; Rosen, P.A.; Caro, E.; Crippen, R.; Duren, R.; Hensley, S.; Kobrick, M.; Paller, M.; Rodriguez, E.; Roth, L. The shuttle radar topography mission. Rev. Geophys. 2007, 45, 583–585. [Google Scholar] [CrossRef]
- Potapov, P.; Tyukavina, A.; Turubanova, S.; Talero, Y.; Hernandez-Serna, A.; Hansen, M.; Saah, D.; Tenneson, K.; Poortinga, A.; Aekakkararungroj, A. Annual continuous fields of woody vegetation structure in the lower mekong region from 2000–2017 landsat time-series. Remote Sens. Environ. 2019, 232, 111278. [Google Scholar] [CrossRef]
- Giri, C.; Ochieng, E.; Tieszen, L.L.; Zhu, Z.; Singh, A.; Loveland, T.; Masek, J.; Duke, N. Global Mangrove Forests Distribution, 2000; NASA Socioeconomic Data and Applications Center (SEDAC): Palisades, NY, USA, 2013.
- Jayanthi, M.; Thirumurthy, S.; Samynathan, M.; Duraisamy, M.; Muralidhar, M.; Ashokkumar, J.; Vijayan, K.K. Shoreline change and potential sea level rise impacts in a climate hazardous location in southeast coast of India. Environ. Monit. Assess. 2018, 190, 51. [Google Scholar] [CrossRef]
- Tran Thi, V.; Tien Thi Xuan, A.; Phan Nguyen, H.; Dahdouh-Guebas, F.; Koedam, N. Application of remote sensing and gis for detection of long-term mangrove shoreline changes in Mui Ca Mau, Vietnam. Biogeosciences 2014, 11, 3781–3795. [Google Scholar] [CrossRef]
- Ding, Z.; Liao, X.; Su, F.; Fu, D. Mining coastal land use sequential pattern and its land use associations based on association rule mining. Remote Sens. 2017, 9, 116. [Google Scholar] [CrossRef]
- White, J.C.; Wulder, M.A.; Hermosilla, T.; Coops, N.C.; Hobart, G.W. A nationwide annual characterization of 25 years of forest disturbance and recovery for canada using landsat time-series. Remote Sens. Environ. 2017, 194, 303–321. [Google Scholar] [CrossRef]
- Stephen, M.; Gu, C.; Yang, H. Visibility graph based time-series analysis. PLoS ONE 2015, 10, e0143015. [Google Scholar] [CrossRef] [PubMed]
- Cleveland, W.S.; Devlin, S.J. Locally weighted regression: An approach to regression analysis by local fitting. J. Am. Stat. Assoc. 1988, 83, 596–610. [Google Scholar] [CrossRef]
- Noether, G.E. Why kendall tau? Teach. Stat. 1981, 3, 41–43. [Google Scholar] [CrossRef]
- Croux, C.; Dehon, C. Influence functions of the spearman and kendall correlation measures. Stat. Methods Appl. 2010, 19, 497–515. [Google Scholar] [CrossRef]
- Krauss, K.W.; Lovelock, C.E.; McKee, K.L.; López-Hoffman, L.; Ewe, S.M.; Sousa, W.P. Environmental drivers in mangrove establishment and early development: A review. Aquat. Bot. 2008, 89, 105–127. [Google Scholar] [CrossRef]


| Class | Mangrove | Water | Bare Land | Other Vegetation |
|---|---|---|---|---|
| Counts of Sample points | 108 | 77 | 67 | 42 |
| Counts for training | 81 | 58 | 50 | 31 |
| Counts for verification | 27 | 19 | 17 | 11 |
| Data Set for Verification | Mangrove Classification Result | Accuracy |
| Verification points (25% of total sample points) | Results from 1987–2017 | 90.91%–96.24% |
| Data Set for Verification | Mangrove Classification Result | Proportion of Common Area |
| Mekong region Land cover 2000–2017 [40] | Results from 2000–2017 | 80.36%–88.21% |
| Global mangrove forests 2000 [41] | Result of 2000 | 87.39% |
| Parameter | Indices | Calculation Formula | Description |
|---|---|---|---|
| Spatial distribution | Cross-shore mangrove extent | The length of the mangrove width along the sample line. | |
| Vegetation growth | NDVI | The mean NDVI of the mangrove pixels () along the sample line. | |
| Response to marine erosion (RME) | Change on the seaside | The difference between the length of mangrove in the first year () and the length at the end of the relevant year (); |
| Region | Zone 1 | Zone 2 | Zone 3 | Zone 4 | Zone 5 | Zone 6 | Zone 7 | Zone 8 | Zone 9 |
|---|---|---|---|---|---|---|---|---|---|
| Change (m) | 166.2 | 115.5 | 317.1 | −36.0 | −140.1 | −31.1 | −142.8 | 108.0 | 62.7 |
| Width | Zone 1 | Zone 2 | Zone 3 | Zone 4 | Zone 5 | Zone 6 | Zone 7 | Zone 8 | Zone 9 |
| 1987–1997 | 0.36 *** | 0.40 *** | 0.59 *** | 0.41 *** | 0.16 ** | 0.43 *** | −0.02 | 0.29 *** | 0.50 *** |
| 1997–2007 | 0.12 *** | 0.25 *** | 0.44 *** | −0.03 | 0.17 ** | −0.04 | −0.01 | 0.15 ** | 0.25 *** |
| 2007–2017 | 0.43 *** | 0.27 *** | 0.23 *** | 0.00 | 0.20 *** | 0.46 *** | −0.03 | 0.27 *** | 0.38 *** |
| NDVI | Zone 1 | Zone 2 | Zone 3 | Zone 4 | Zone 5 | Zone 6 | Zone 7 | Zone 8 | Zone 9 |
| 1987–1997 | 0.38 *** | 0.24 *** | 0.36 *** | 0.21 *** | 0.07 * | 0.28 *** | −0.03 | 0.02 | 0.36 *** |
| 1997–2007 | 0.14 *** | 0.31 *** | 0.12 ** | −0.04 | 0.19 *** | −0.12 ** | −0.02 | 0.07 * | 0.03 |
| 2007–2017 | 0.29 *** | 0.21 ** | 0.21 ** | 0.05 | 0.10 * | 0.38 *** | 0.06 | 0.21 *** | 0.24 *** |
© 2020 by the authors. Licensee MDPI, Basel, Switzerland. This article is an open access article distributed under the terms and conditions of the Creative Commons Attribution (CC BY) license (http://creativecommons.org/licenses/by/4.0/).
Share and Cite
Xiao, H.; Su, F.; Fu, D.; Wang, Q.; Huang, C. Coastal Mangrove Response to Marine Erosion: Evaluating the Impacts of Spatial Distribution and Vegetation Growth in Bangkok Bay from 1987 to 2017. Remote Sens. 2020, 12, 220. https://doi.org/10.3390/rs12020220
Xiao H, Su F, Fu D, Wang Q, Huang C. Coastal Mangrove Response to Marine Erosion: Evaluating the Impacts of Spatial Distribution and Vegetation Growth in Bangkok Bay from 1987 to 2017. Remote Sensing. 2020; 12(2):220. https://doi.org/10.3390/rs12020220
Chicago/Turabian StyleXiao, Han, Fenzhen Su, Dongjie Fu, Qi Wang, and Chong Huang. 2020. "Coastal Mangrove Response to Marine Erosion: Evaluating the Impacts of Spatial Distribution and Vegetation Growth in Bangkok Bay from 1987 to 2017" Remote Sensing 12, no. 2: 220. https://doi.org/10.3390/rs12020220
APA StyleXiao, H., Su, F., Fu, D., Wang, Q., & Huang, C. (2020). Coastal Mangrove Response to Marine Erosion: Evaluating the Impacts of Spatial Distribution and Vegetation Growth in Bangkok Bay from 1987 to 2017. Remote Sensing, 12(2), 220. https://doi.org/10.3390/rs12020220