Article

Impacts of Urbanization on the Ecosystem Services in the Guangdong-Hong Kong-Macao Greater Bay Area, China

1
School of Geography and Ocean Sciences, Nanjing University, Nanjing 210023, China
2
State Key Laboratory of Resources and Environmental Information System, Institute of Geographic Sciences and Natural Resources Research, Chinese Academy of Sciences, Beijing 100101, China
3
Collaborative Innovation Center for the South China Sea Studies, Nanjing University, Nanjing 210023, China
*
Author to whom correspondence should be addressed.
Remote Sens. 2020, 12(19), 3269; https://doi.org/10.3390/rs12193269
Submission received: 2 September 2020 / Revised: 29 September 2020 / Accepted: 6 October 2020 / Published: 8 October 2020

Abstract

:
Unprecedented urbanization has occurred globally, which has converted substantial natural landscapes into impervious surfaces and further impacted ecosystem services and functioning. In this study, we quantified the spatiotemporal patterns of urbanization and investigated the impacts of urbanization on the ecosystem service value (ESV) in the Guangdong-Hong Kong-Macao Greater Bay Area (GBA) of China from 1980 to 2018. The results show that the GBA has experienced extensive urbanization, with the urban area increasing from 2607.4 to 8243.5 km2 from 1980 to 2018. Zhongshan, Zhuhai, Dongguan, Shenzhen, and Foshan exhibited the top five highest urban expansion rates. Throughout the study period, edge expansion was the most dominant growth mode, with a decreasing trend, while infilling increased in the GBA. The total ESV loss induced by urban expansion in the GBA reached 40.5 billion yuan over the past four decades. The ESV loss due to the water body decrease caused by urbanization was the largest. Our study suggests that decision-makers should control new urban areas and protect water bodies, wetlands, and forests with high ESVs to promote the sustainable development of urban agglomerations.

Graphical Abstract

1. Introduction

Dramatic urban expansion has occurred worldwide over the last centuries. The global population in urban areas has increased from 30% to 54% from 1950 to 2014 and is expected to rise to approximately 70% by 2050 [1,2,3]. Simultaneously, urban areas have expanded at a speed twice that of the urban population in recent years and are expected to have tripled by approximately 2050 [4]. Accounting for less than 3% of the global terrestrial surface, this unprecedented urbanization has contributed to 60% of residential water use, 78% of carbon emissions, and 76% of the wood used for industrial purposes [5]. Unprecedented urbanization has converted substantial natural landscapes into impervious surfaces and further impacted ecosystem services (ESs) and functioning [6]. Nevertheless, urbanization will continue to occur in the future, especially in developing countries [5].
Over the past few decades, individual cities have expanded at an unprecedented speed, and urban agglomerations have gradually emerged. Increasing numbers of researchers have studied the spatial and temporal patterns of urban expansion [1,7,8,9,10,11,12,13,14,15]. Dietzel et al. revealed that urbanization is an alternative process of diffusion and coalescence by examining a set of spatial metric values [15]. Liu et al. proposed a new landscape index, the landscape expansion index, which has proven to be better than other landscape metrics in quantitatively studying the changes in urbanization patterns [9]. In their research on the quantification of the urbanization patterns in the central Yangtze River Delta region of China, Li et al. found that urban expansion is not a simple two-phase diffusion-coalescence model but a spiraling process of multiple growth modes, namely, edge expansion, infilling, and leapfrog expansion, which appear simultaneously with alternating relative dominance levels [10]. Subsequently, urban growth modes in addition to the expansion rate have been adopted to study the spatiotemporal evolution of urbanization and urban agglomeration [1,14,16]. As modern cities are complex systems and organized at various levels exhibiting their own unique spatiotemporal patterns [17], researchers have studied urban expansion from various aspects, including in different cities [14,16], in inner and outer zones [13], and at different administrative levels [10], which has indicated that highly different findings are attained when studying urbanization from multiple aspects.
ESs refer to the benefits that ecosystems directly or indirectly provide to humans [18]. The assessment of ESs is very important for decision-makers to obtain knowledge on these services’ changes and driving factors. In 1997, Costanza et al. estimated the global value of ESs in 1995 using valuation methods and found that the ecosystem service value (ESV) was notably higher than the global gross domestic product (GDP) at that time [18]. In 2005, the Millennium Ecosystem Assessment revealed that global ESs are deteriorating and called for decision-makers to consider ES values in global economic analysis [19]. Subsequently, an increasing number of researchers and decision-makers has investigated ESs [20,21,22,23,24]. Bateman et al. estimated the comparable economic values of several ESs in the UK by combining spatially explicit models and valuation methods [20]. Based on Costanza’s method, many researchers have evaluated the ESV at the country or regional scale [23,24,25]. Estoque and Murayama calculated the total ESV loss due to urbanization in Baguio based on all land use/land cover categories by matching them to the proxy biomes in Costanza et al. [18,25]. Xie et al. compiled a table of correction coefficients adapted to China, which can be applied to assess ESs with specific land use areas, and they also updated the table of Chinese correction coefficients in 2014 [23,24]. The methods of Xie et al. have been widely applied by Chinese researchers, but it is not appropriate to use them at a regional scale [26,27]. Later, Xu et al. proposed using the total grain yield to revise the above correction coefficients to make them more effective and appropriate in regional areas [28]. In addition, in evaluating the ESV based on land use and land cover (LULC), previous studies have computed only the ESV of the primary classes, thereby ignoring the differences in ESs among the various subclasses belonging to a primary class, which probably led to errors in the results [25,26,27,28]. To obtain a better understanding of ESV changes, we calculated the ESV of the primary classes by summing the ESVs of all of the subclasses in the present study. For instance, to compute the farmland ESV, we first calculated the ESVs of both dry farmlands and paddy fields and then summed these values.
China, as one of the most populous countries in the world, has witnessed a dramatic urbanization with urban population increasing from 19.4% in 1980 to 52.6% in 2012, since the implementation of the reform and opening-up policy in 1978 [11,29]. The three urban agglomerations of the Yangtze River Delta, the Pearl River Delta, and the Jing-Jin-Ji region are the highest urbanization areas in terms of economic growth and population increase [1,12,16,30,31]. Urban expansion has notably driven land use change and impaired the structure and functions of ecosystems, which has further imposed negative impacts on their capacity to deliver a range of services [32]. Presently, many researchers have paid more attention to the spatial and temporal patterns of these urban agglomerations [10,16,31], but fewer studies have simultaneously examined their consequences on ESs. It is important to analyze the ESV changes in response to human activities to promote the sustainable development of the ecological environment.
The Guangdong-Hong Kong-Macao Greater Bay Area (GBA), known as the Pearl River Delta urban agglomeration, is one of the four greater bay areas and the largest morphologically contiguous megalopolis globally and is undergoing remarkable urbanization [1,33]. The GBA is one of most developed areas in China and plays an important strategic role in the overall national development situation, but there are few studies on the influences of urbanization on its ESs. Therefore, this study aimed to study the evolution of urbanization and investigate its effects on multiple ESs in the GBA based on long time series datasets. The main objectives of our study were to (1) quantify the speed and spatiotemporal pattern of urbanization in the GBA and its 11 cities from 1980 to 2018 and (2) assess the impacts of urbanization on ES change in terms of overall, regional, and urban growth types, LULC types, and ecosystem functions over four time periods. The results could provide references for decision-makers to establish more scientific and reasonable urban planning strategies in the GBA to ensure sustainable urban and environmental development.

2. Materials and Methods
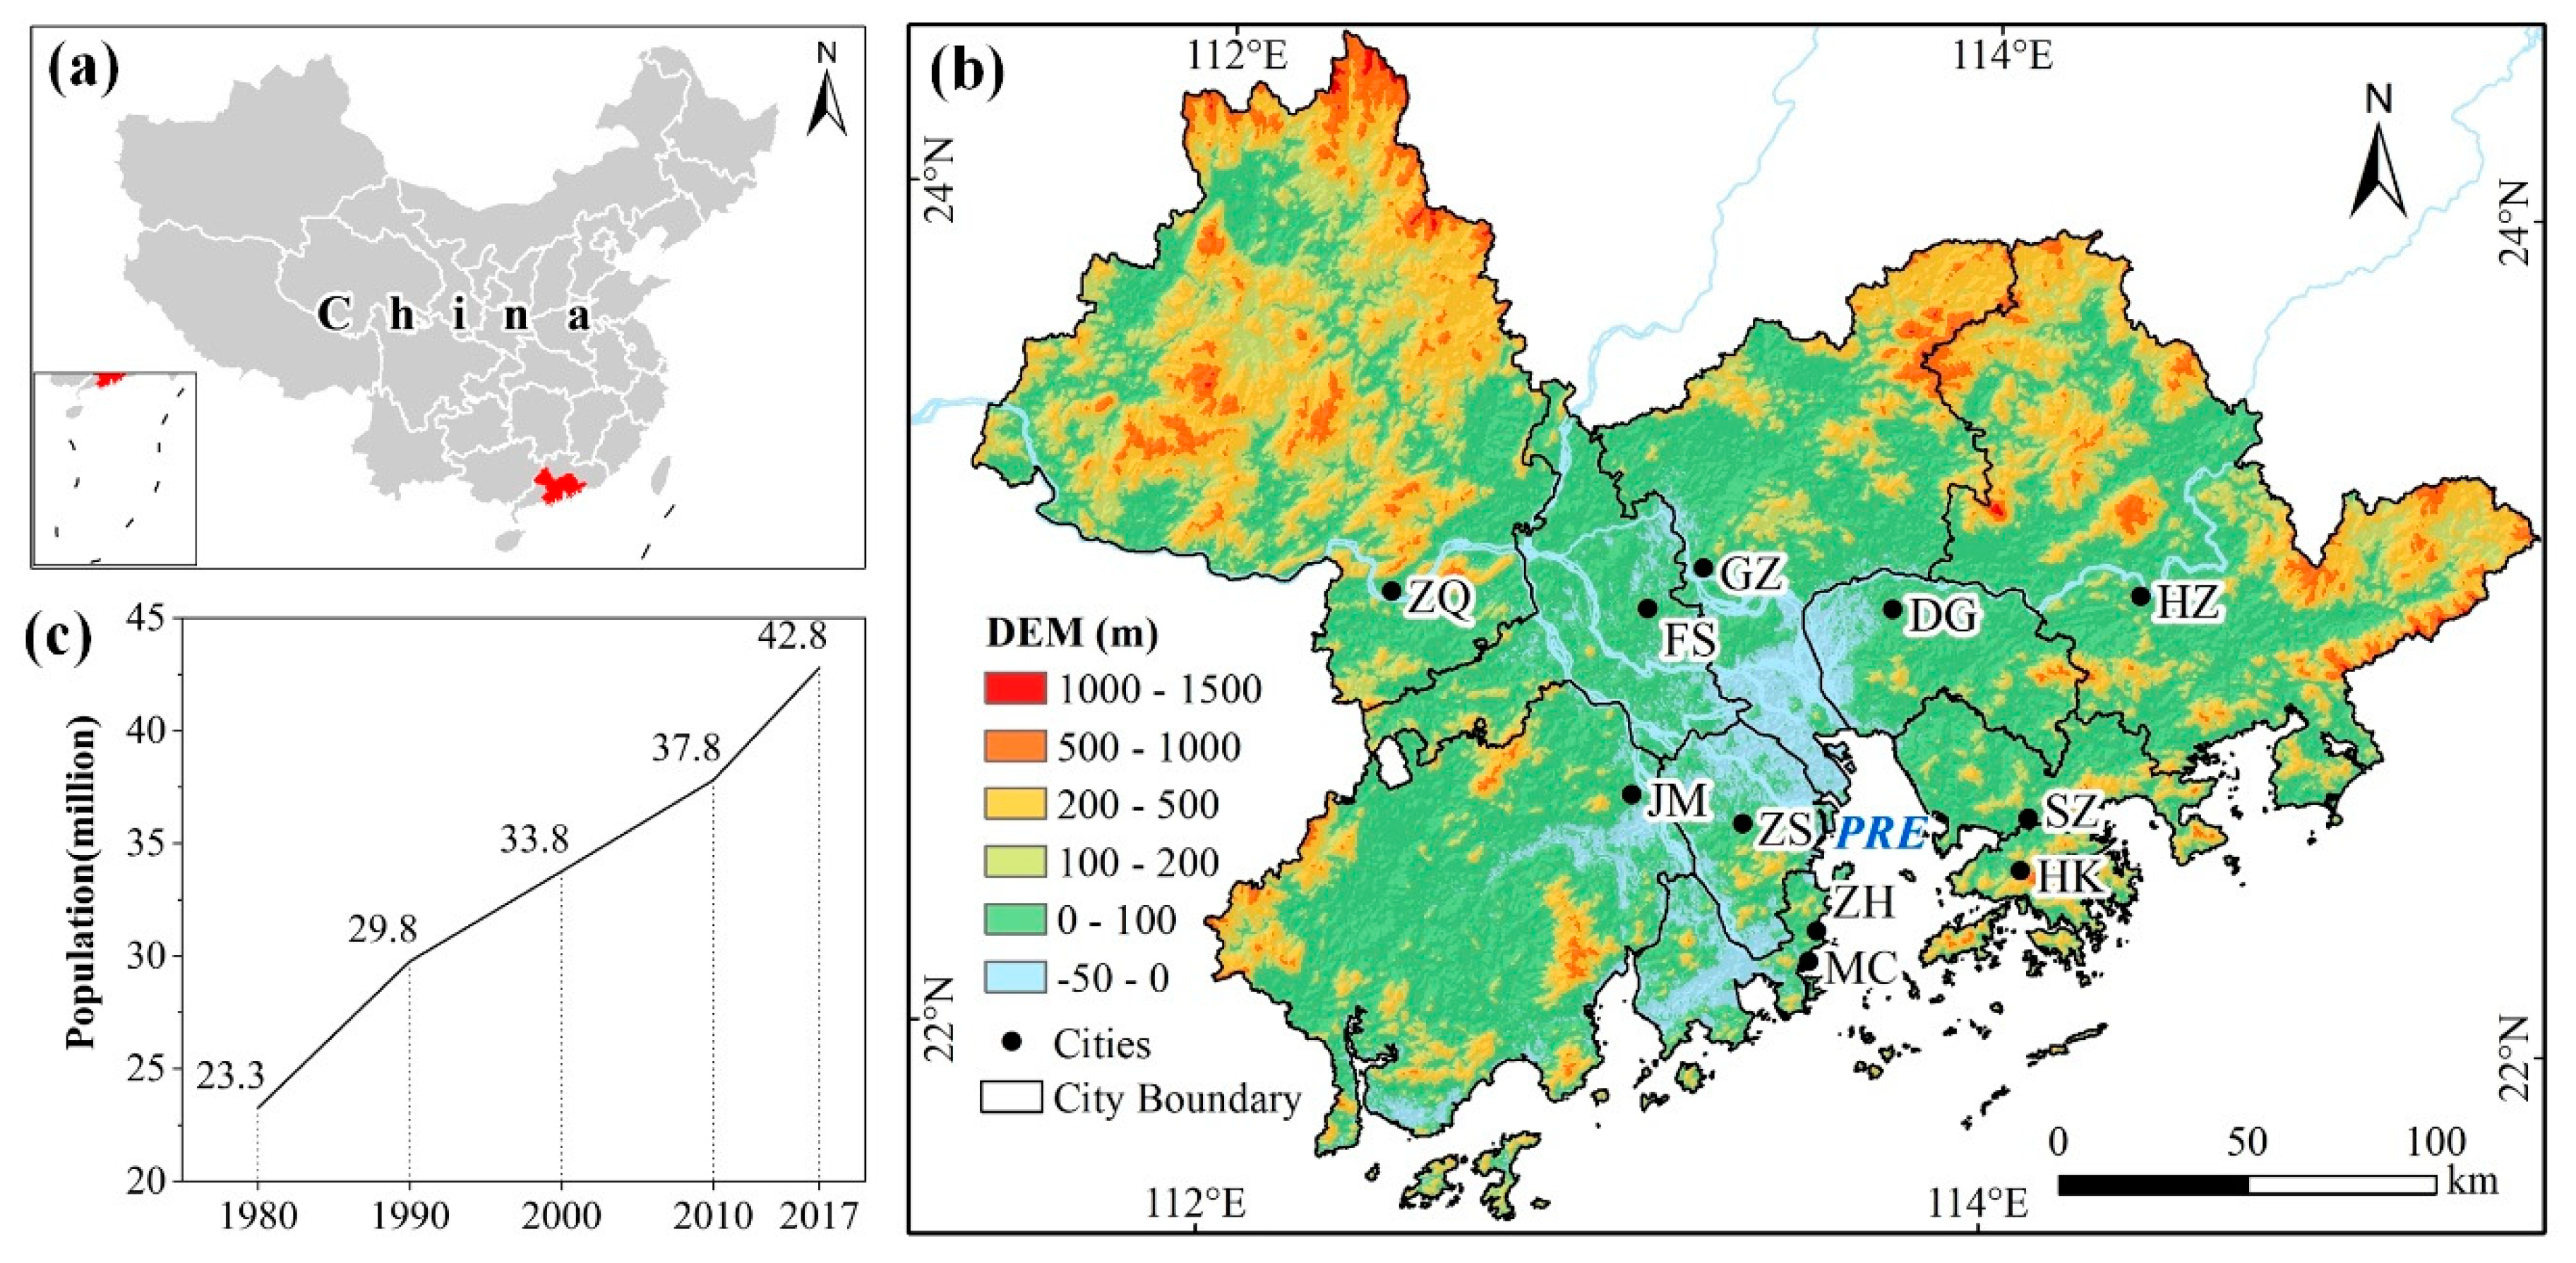
2.1. Study Area

The GBA is located in southern China (Figure 1a) and consists of 11 cities, namely, Guangzhou, Dongguan, Huizhou, Shenzhen, Foshan, Zhongshan, Zhuhai, Jiangmen, Zhaoqing, Hong Kong, and Macao (Figure 1b), with a total population of 42.8 million inhabitants (Figure 1c). It covers 55,000 km2 with varied typical geomorphic types, such as hills, monadnocks, platforms, and plains. The climate is a subtropical climate with an average annual temperature of 22.3 °C and an average annual rainfall of 1832 mm. As one of the earliest testbeds for the reform and opening-up policy, the GBA is one of the most economically developed and densely populated areas in China. In 2017, the population in GBA accounted for 5% of the overall population, and its GDP contributed to approximately 11% of China’s total GDP [31]. The GBA is expected to become a vibrant world-class city cluster, as well as provide important support for the construction of the Belt and Road and a demonstration area for the in-depth cooperation between the mainland and Hong Kong and Macao.

2.2. Data Sources

The land use datasets pertaining to the GBA were extracted for 1980, 1990, 2000, 2010, and 2018 from the Land Use and Land Cover of China (CNLUCC) database [34]. The CNLUCC has long been supported by a series of major scientific and technological projects, for instance, the Important Directions of Knowledge Innovation Project of the Chinese Academy of Sciences and the National Science and Technology Support Plan. Presently, the CNLUCC contains a multitemporal land use status database covering all of China, namely, the LUCC datasets of 1980, 1990, 1995, 2000, 2005, 2010, 2015, and 2018. In the process of developing the CNLUCC database, a series of multi-source and cloud-free Landsat images, including Thematic Mapper (TM), Enhanced Thematic Mapper (ETM), and Operational Land Imager (OLI) images, were collected to extract the distribution of China’s LUCC. The database was produced by integrating the object-oriented classification method and visual interpretation. As the most accurate remote sensing monitoring data product in China, the CNLUCC is very important for the investigation and research of national land resources, hydrology, and ecology.
The LULC datasets in the GBA include 7 primary classes and 22 subclasses, but this classification is slightly different from the table of Xie et al. used for ESV computation [23]. Hence, the classification was revised, as indicated in Table 1, to conveniently calculate the ESV changes based on the LULC changes due to urbanization. In this study, urban areas are not just cities but refer to all urban and rural residential areas and other construction land. In addition, because coastal reclamation has occurred in the study area, large seawater areas have been reclaimed, and we temporarily regarded the sea as a water body when calculating the ESV.

2.3. Urban Expansion Analysis

To quantify the rate of urban expansion, the annual increase (AI, km2/year) and annual expansion rate (AER, %) were calculated in the GBA and 11 cities between 4 adjacent periods from 1980 to 2018. AI was applied to assess the urban expansion in a specific city by measuring the annual changes in the urban area [1,16], while AER was effective to compare urban expansion across various cities without considering the size effect of cities [12,14].
AI = A 2 A 1 T
AER = [ A 2 A 1 1 / T 1 ] × 100 %
where A1 and A2 are the urban areas at the start and end times, respectively, and T is the time span in years.
Urban growth is divided into the following three types: edge expansion, infilling, and leapfrog expansion [35]. The landscape expansion type (LEI) was adopted to identify the urban growth type [9] as follows:
EI = L c o m P n e w
where Lcom is the length of the interface between pre-existing and new urban patches and Pnew is the perimeter of the new urban patch. The urban expansion type is identified as edge expansion when 0 < E ≤ 0.5, as infilling when E > 0.5, and as leapfrog expansion when E = 0.

2.4. Assessment of the Ecosystem Service Value

Based on the research of Costanza et al. [22] and Xie et al. [23], the ESV was estimated as follows:
ESV = ( A i × V i )
where Ai and Vi are the area and ESV, respectively, per unit area of land ecosystem i.
Xie et al. established an equivalent table of value coefficients for the different ESs in China [23], where the equivalent coefficient value of farmland is 1, which is an important reference for the other land use types and the basic reference for regional correction. To ensure that the value coefficients were appropriate to calculate the ESV at a regional scale, we revised them for this paper via correction coefficients based on the main grain yield in the GBA [28] as follows:
β t = y t Y t
where βt is the correction coefficient at time t and yt and Yt are the grain yields of Guangdong Province and China, respectively, at time t. Because it was difficult to obtain the grain yield in the GBA for the early study periods, we adopted the grain yield of Guangdong Province to replace that of the GBA. In this study, β1980, β1990, β2000, β2010, and β2018 are set to 1.34, 1.24, 1.38, 1.05, and 0.99, respectively. Correspondingly, the equivalent values per unit area for the different ESs in the GBA in the five periods are shown in Tables S1–S5 (Supplementary Materials).
The equivalent economic value of the ESV per unit area (Ea) in Guangdong Province was calculated [36,37] as follows:
E a = 1 7 × P × Y A g
where Y and Ag are the total yield and area, respectively, of the main grains in Guangdong Province in 2018 and P is the average price of the main grains in 2018 (3.77 yuan/kg), acquired from the website of the Grain Net of South China (http://www.grainmarket.com.cn/).
Finally, the ESV per unit area in the different land ecosystems was determined in Guangdong Province at different times. In this study, we calculated the ESV of the primary classes by summing the ESVs of all of its subclasses. For instance, to compute the farmland ESV, we first calculated the ESVs of both dry farmlands and paddy fields and then summed these values.

3. Results

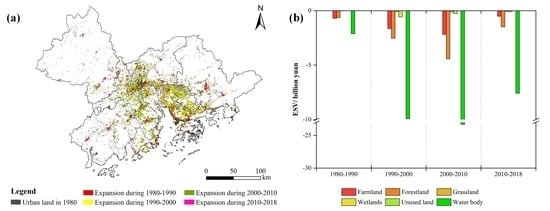
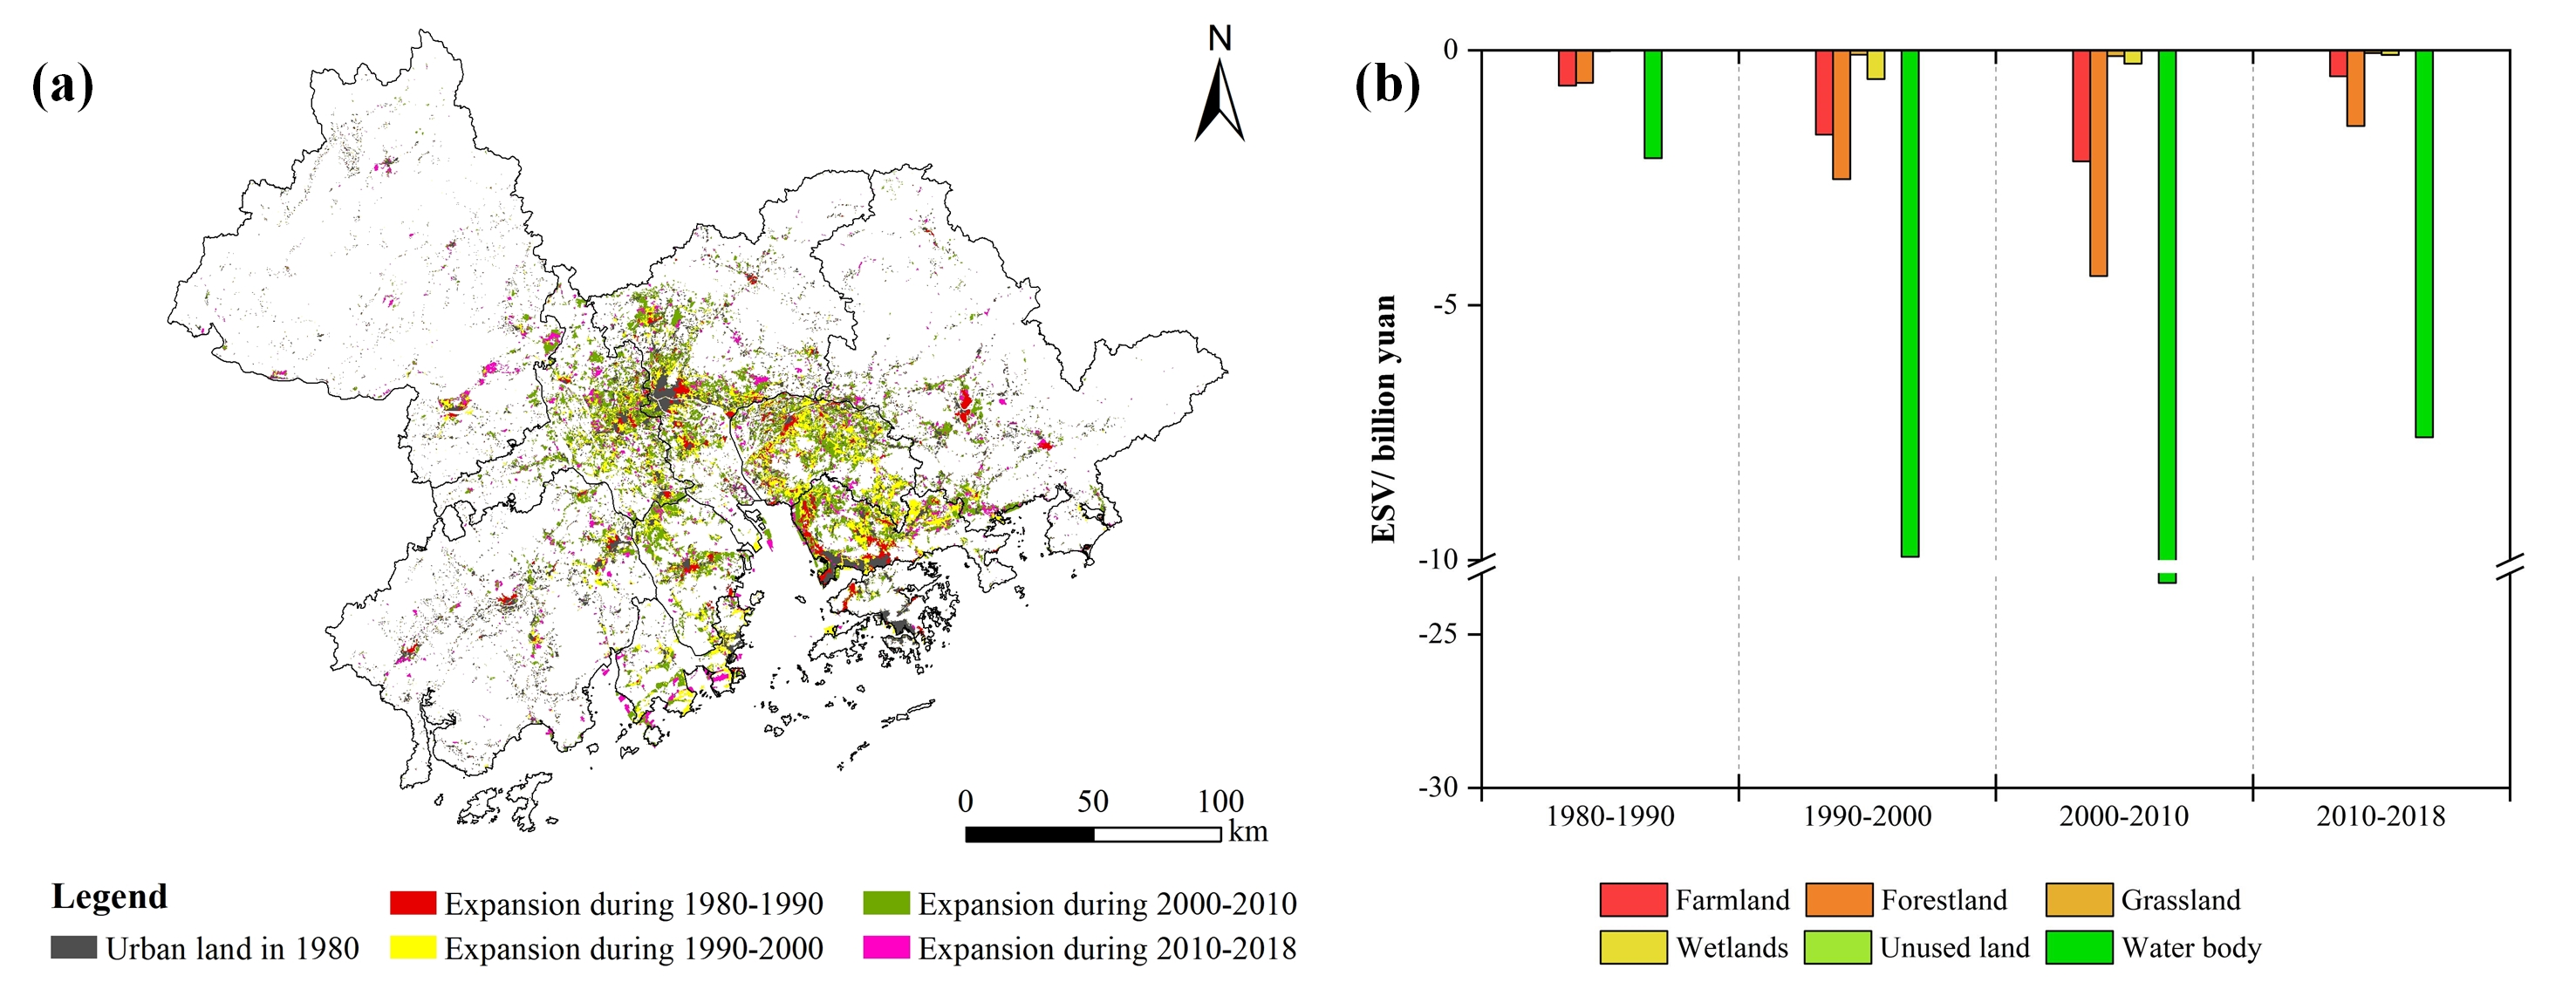
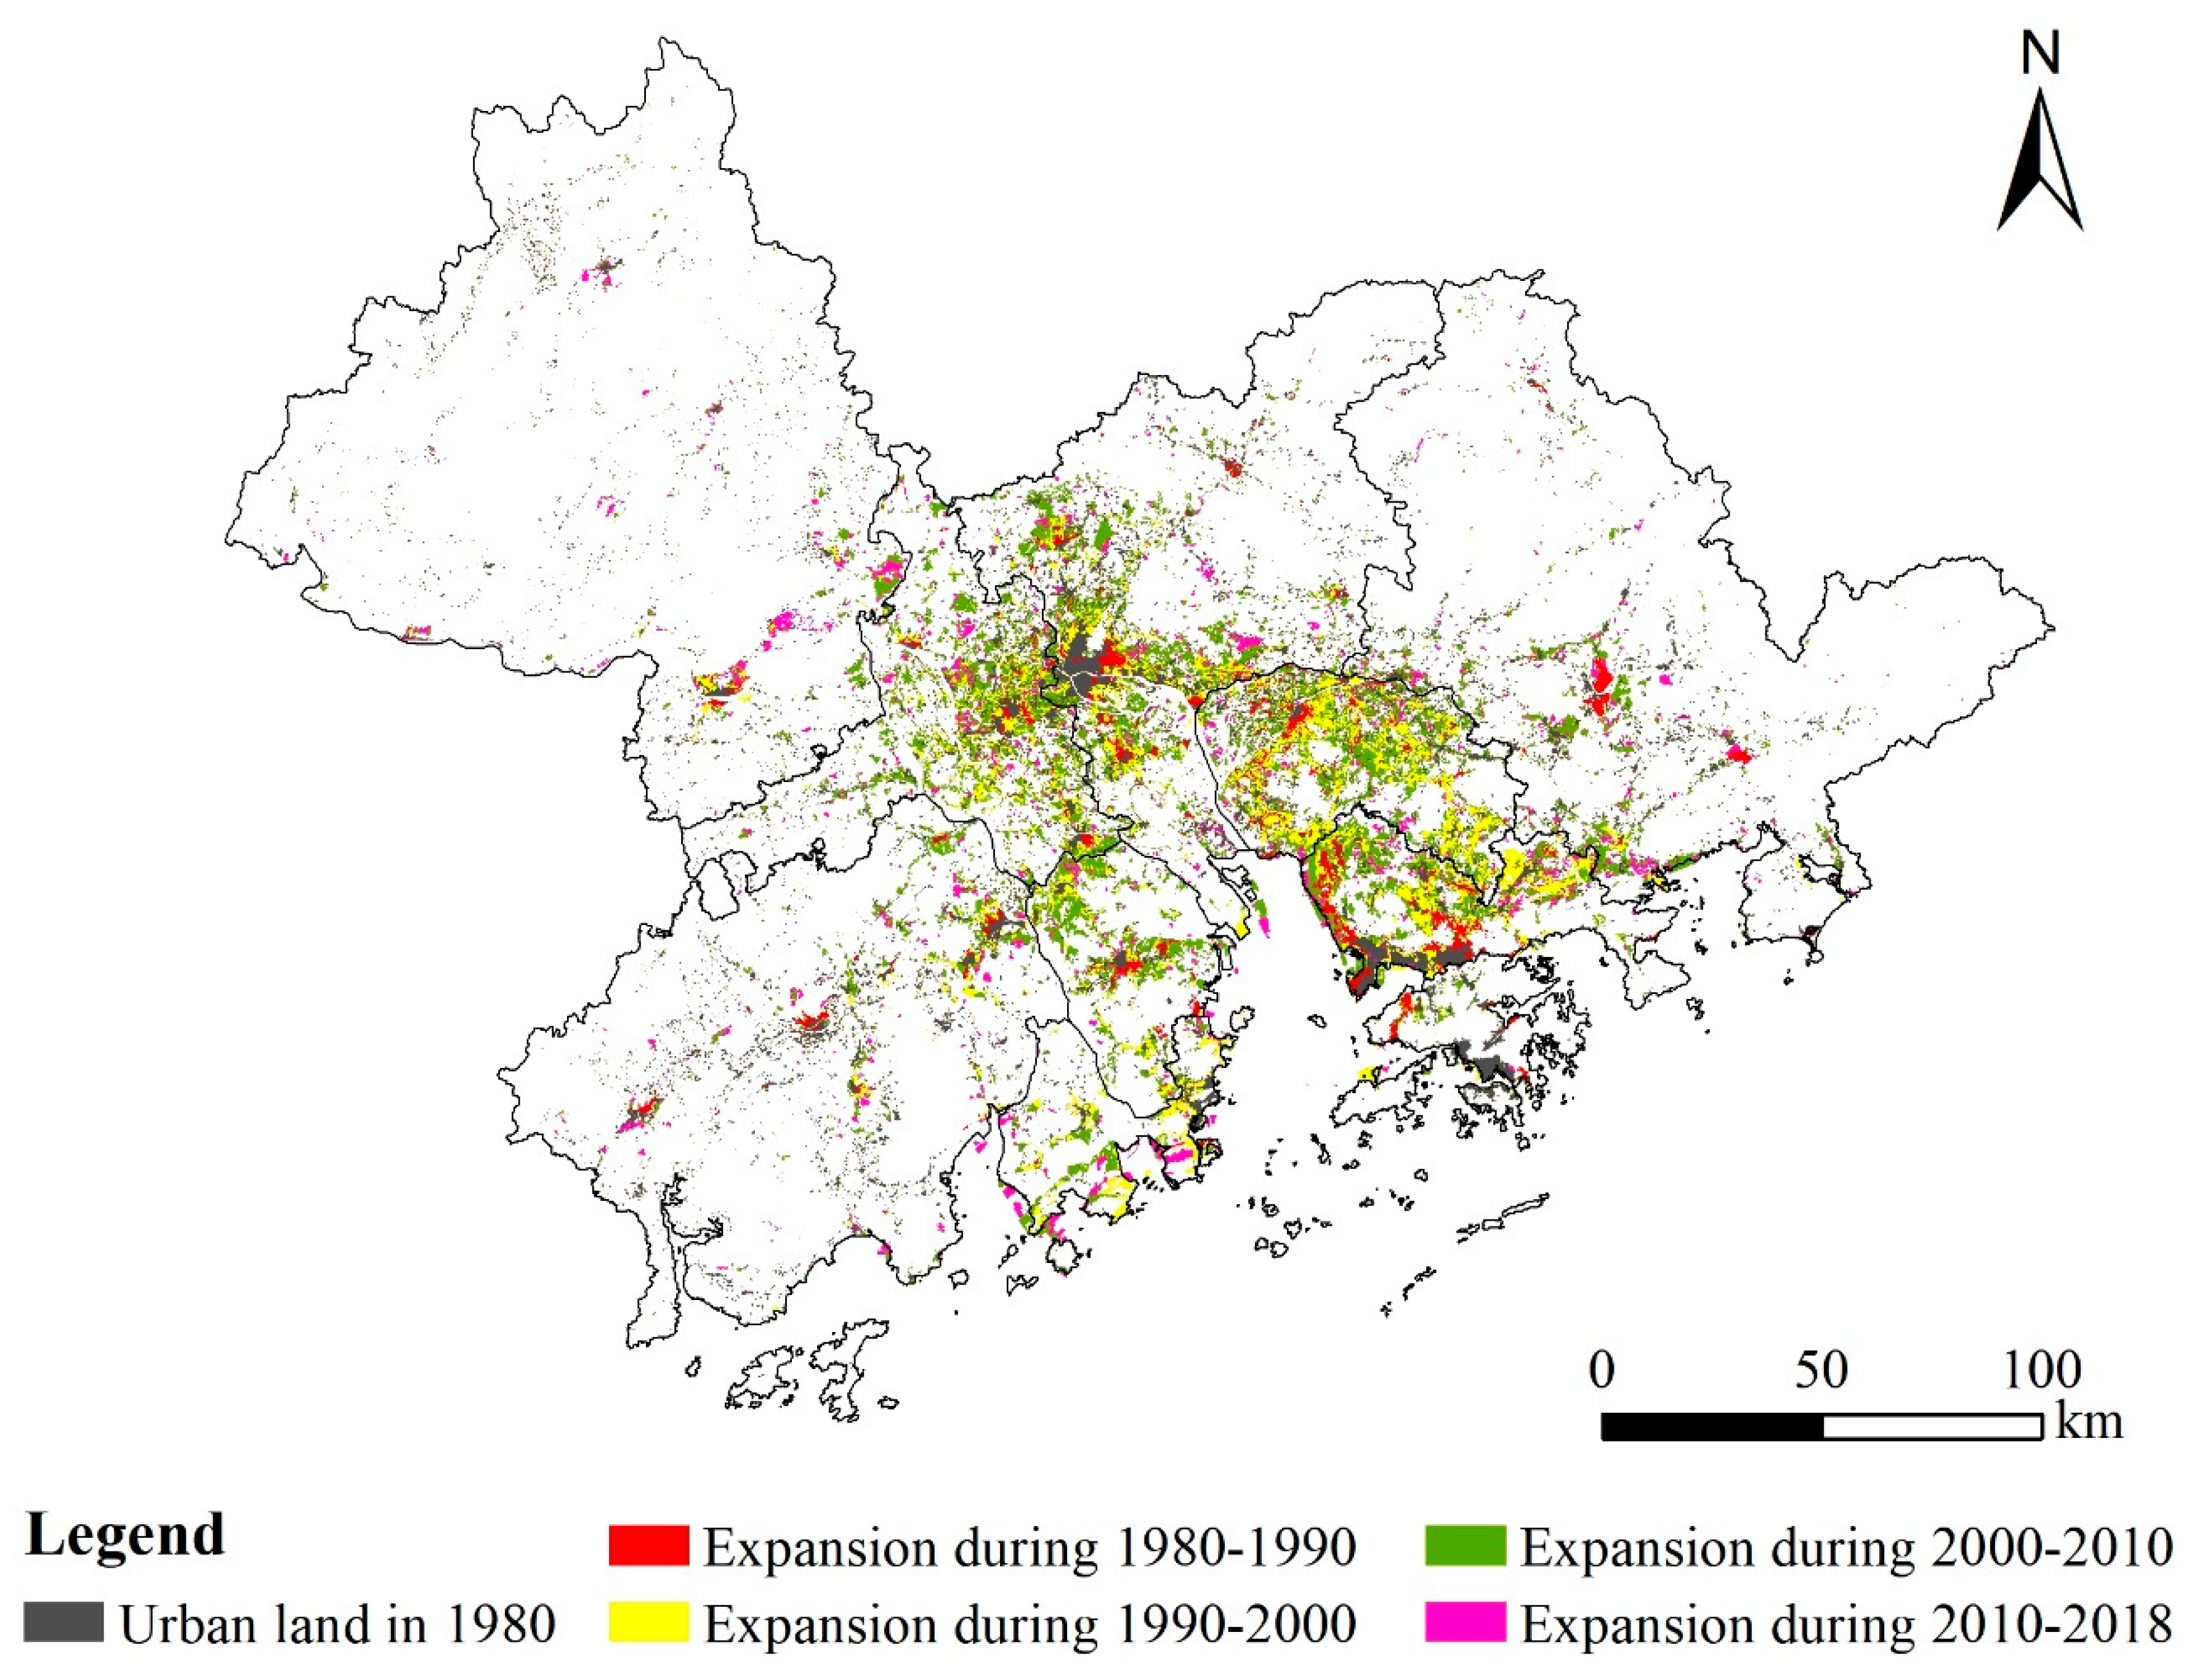
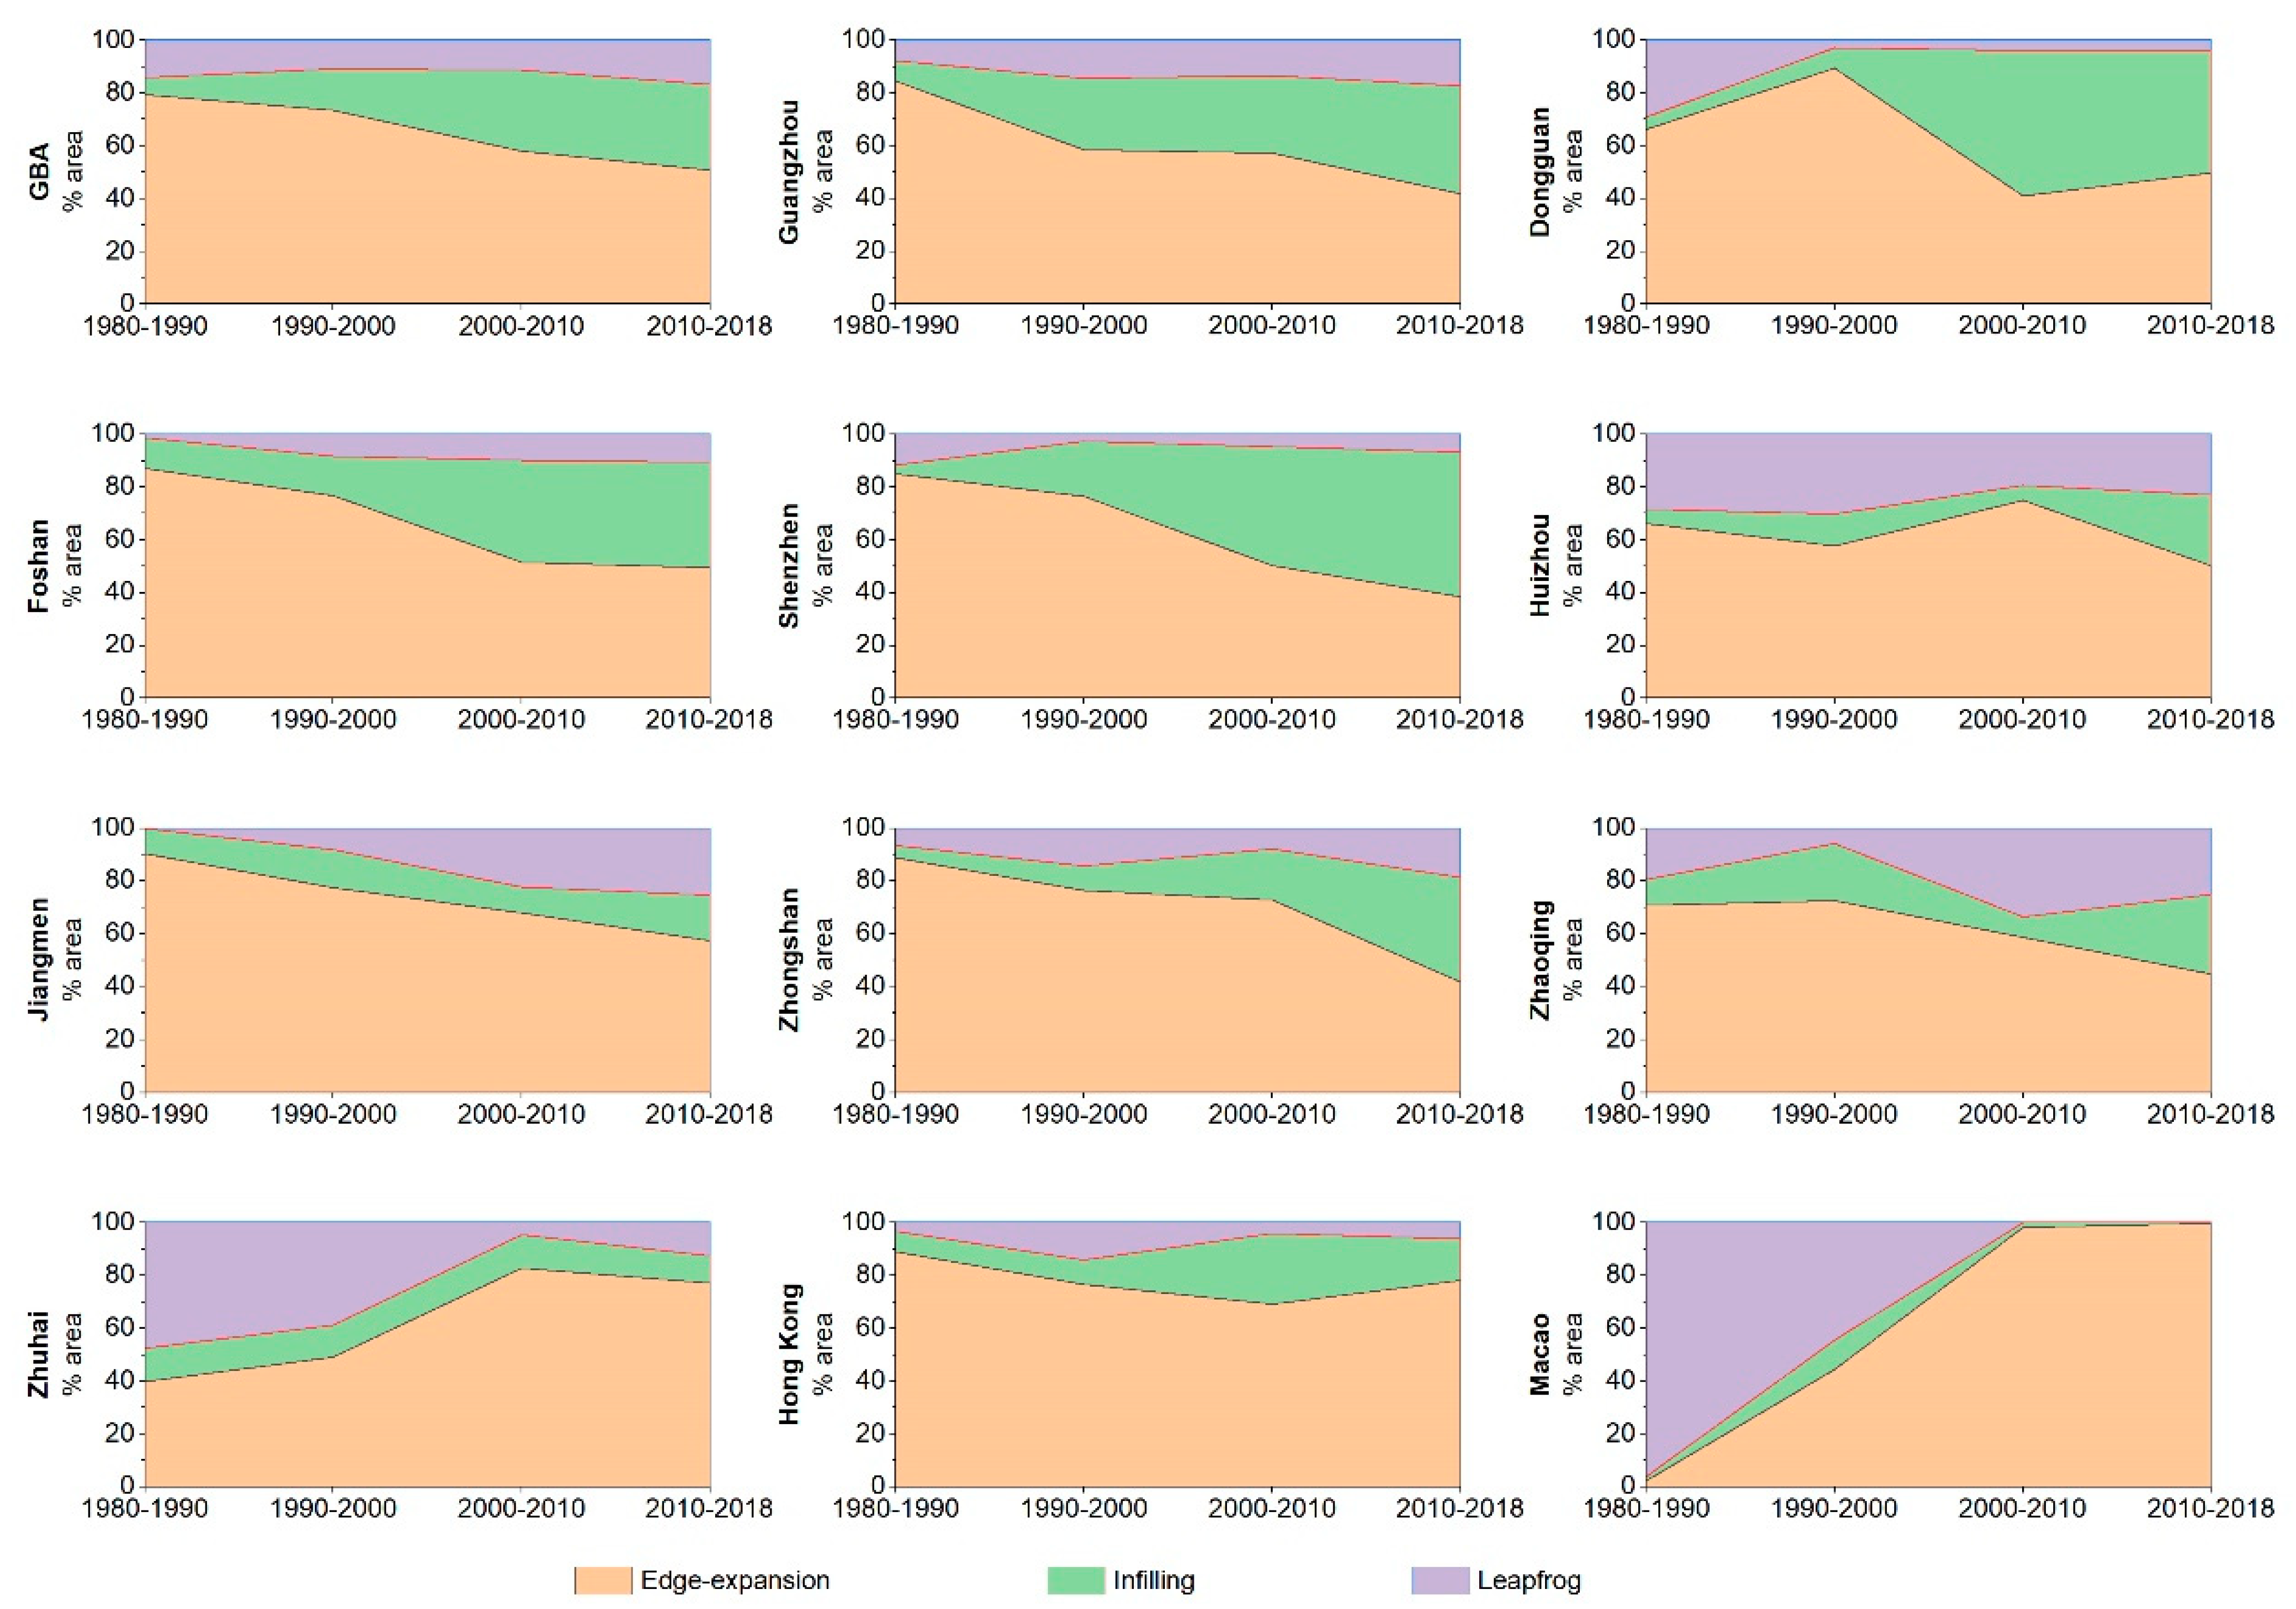
3.1. Urban Expansion in the GBA

Figure 2 shows the overall spatial patterns of urban expansion, and Table 2 lists the areas and the magnitude of expansion in the GBA and 11 cities during the different periods. From 1980 to 2018, the GBA and all cities experienced extensive urbanization, and AI and AER varied among the cities and periods. The overall urban area of the GBA has increased from 2607.4 to 8243.5 km2 at an AI of 148.3 km2/year over the past 38 years. In 1980, only Guangzhou, the capital city of Guangdong Province, covered an urban area of more than 500 km2, and Jiangmen attained the second largest urban area with 425.7 km2, followed by Huizhou with 333.0 km2 and Foshan with 313.7 km2. The urban areas of Dongguan and Shenzhen, two developed cities in the GBA, were only 242.3 and 204.3 km2, respectively, in 1980. Hong Kong and Macao, the most developed areas in the GBA, had the smallest urban areas because their administrative areas are relatively smaller than those of the other cities.
The spatial distribution of urban expansion revealed obvious changes over the past four decades. There was no obvious characteristic of the distribution of cities with urban areas larger than 300 km2 in 1980 (i.e., Guangzhou, Jiangmen, Huizhou, and Foshan). However, by 2018, cities exceeding 900 km2 were mainly distributed on both sides of the Pearl River Estuary (i.e., Guangzhou, Dongguan, Foshan, Shenzhen) (Figure 2).
From 1980 to 2018, the AI of Guangzhou, Dongguan, Foshan, Shenzhen, Huizhou, and Zhongshan exceeded 10 km2/year. The highest AI of the GBA, i.e., that of Guangzhou, Jiangmen, Huizhou, Foshan, Dongguan, Shenzhen, and Zhongshan, occurred from 2000 to 2010, whereas it occurred from 2010 to 2018 in Zhaoqing. The AER of the 11 cities ranged from 0.3% to 4.9%, 0.8% to 10.8%, 1.1% to 8.7%, and 0.2% to 3.3% in 1980–1990, 1990–2000, 2000–2010, and 2010–2018, respectively. Over the past four decades, the highest AER values occurred in 1990–2000 and 2000–2010. From 1980 to 2018, Zhongshan attained the highest AER (4.8%), followed by Zhuhai (4.5%), Dongguan (4.4%), and Shenzhen (4.2%). By 2018, Guangzhou was still the largest city with an urban area of 1471.9 km2, followed by Dongguan with 1244.4 km2, Foshan with 1183.6 km2, and Shenzhen with 992.1 km2.
Figure 3 and Figure S1 (Supplementary Materials) display the changes in the relative dominance of the three growth modes, including edge expansion, infilling, and leapfrog expansion. Edge expansion refers to a newly grown patch spreading unidirectionally in more or less parallel strips from an edge [35]. Infilling is defined as a newly grown patch that fills up the gap between old patches or within an old patch [9]. Leapfrog means the newly grown patch is isolated from the old [9]. In the GBA, edge expansion is the most dominant growth mode throughout the period of study, although its influence decreases from 79.4% to 50.7%, which mostly occurs due to the increase in infilling from 6.4% to 32.6%. A similar trend is observed in the 11 cities except Zhuhai and Macao, while there are few notable fluctuations. For example, the dominance of edge expansion and infilling in Dongguan exhibits very large fluctuations, whereas in Jiangmen and Huizhou a smooth trend is observed throughout the study periods. Leapfrog expansion was the most dominant growth mode in Zhuhai and Macao during the first period (with a dominance of 47.4% and 96.1%, respectively), while edge expansion became the most dominant growth pattern during the last study period (with a dominance of 77.1% and 99.7%, respectively). Lastly, leapfrog expansion increased in Jiangmen (from 19.6% to 25.3%) and Zhaoqing (from 0% to 25.4%) during the study periods.

3.2. Ecosystem Service Value Changes

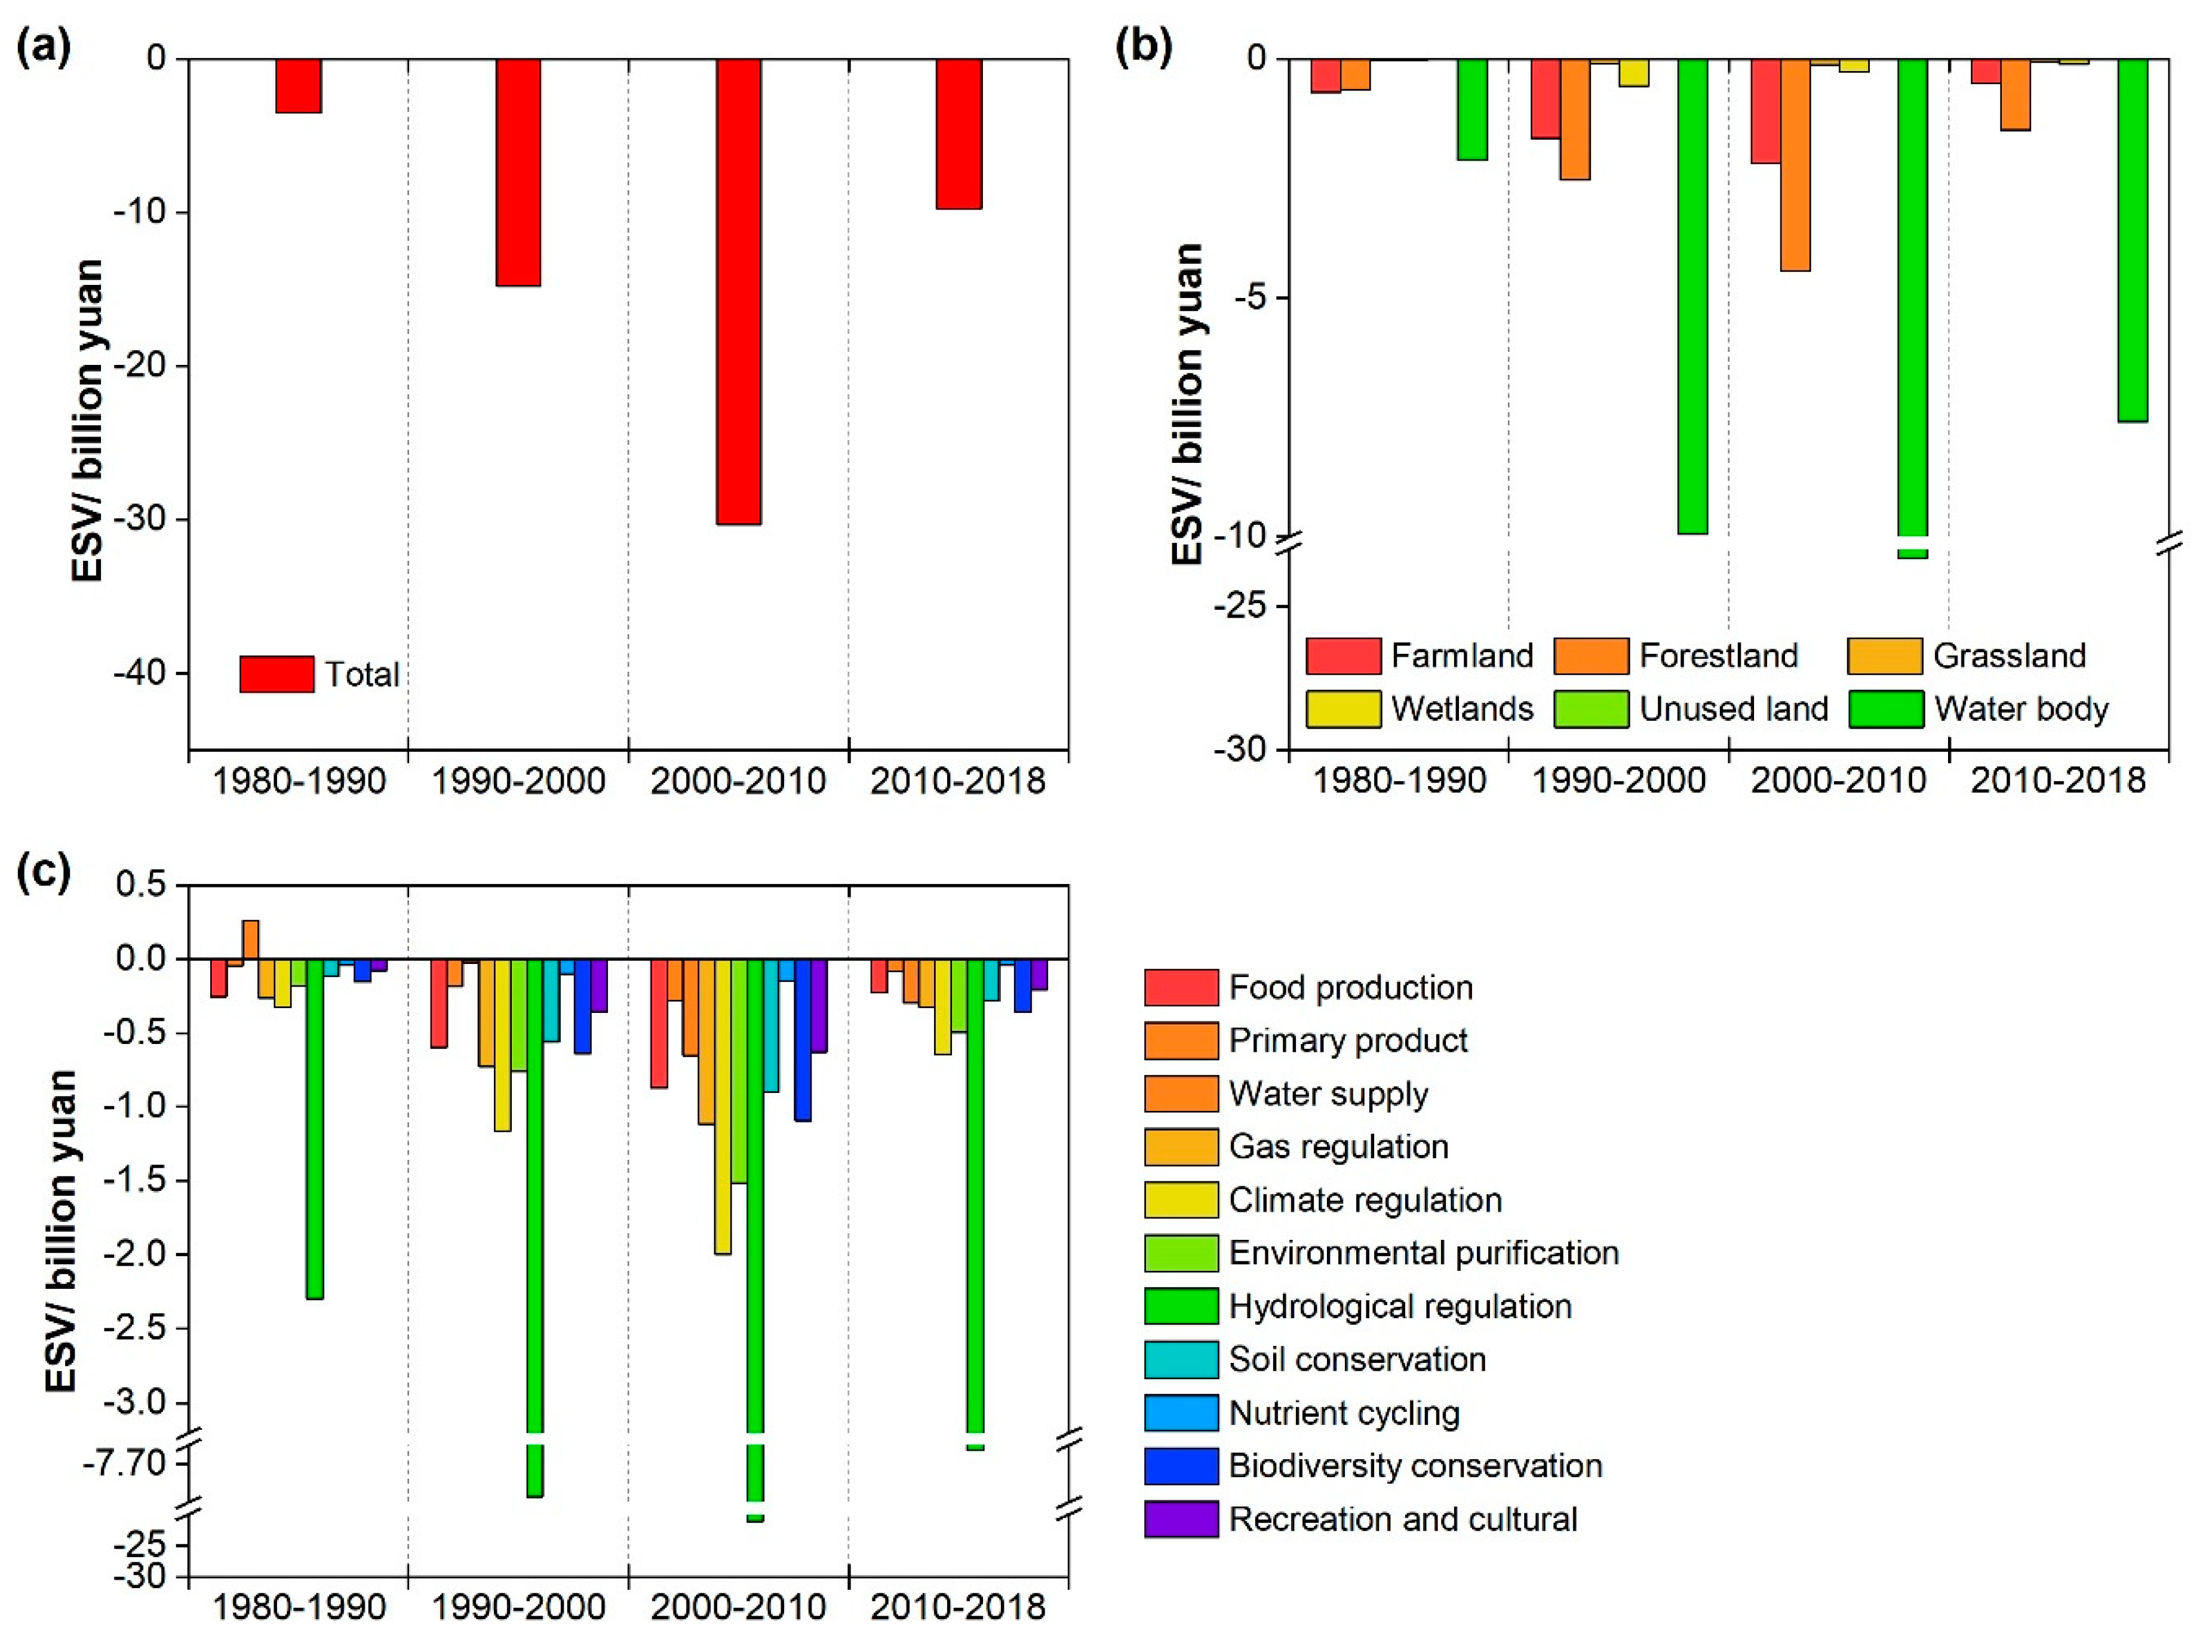
3.2.1. Changes in the Total ESV in the GBA

Figure 4 shows the ESV changes caused by urbanization in the GBA over the four study periods. The total ESV loss due to urbanization in the GBA has reached 40.5 billion yuan over the past 38 years. Among the four study periods, the largest ESV loss occurred from 2000 to 2010 (30.3 billion yuan), followed by 1990–2000 (14.8 billion yuan) and 2010–2018 (9.7 billion yuan) (Figure 4a). A similar tendency was observed for the ESV loss of the different LULC types (Figure 4b) and ESs (Figure 4c) over the study periods. Although the water body area encroached by urban sprawl was not the largest (Table S6, Supplementary Materials), the ESV loss due to the water body decrease caused by urbanization was the largest (ranging from 30.5% to 39.0%), followed by the forest (ranging from 7.3% to 9.2%) and farmland (ranging from 2.6% to 10.0%) ESV losses over the different study periods (Figure 4b). The ESV loss of the other LULC types was relatively smaller over the study periods. In terms of the ecosystem service functions, the value of the hydrological regulation loss induced by urban expansion was the largest among all ESs over the four periods, ranging from 65.5% to 69.9% (Figure 4c), followed by climate regulation (ranging from 6.6% to 9.2%).

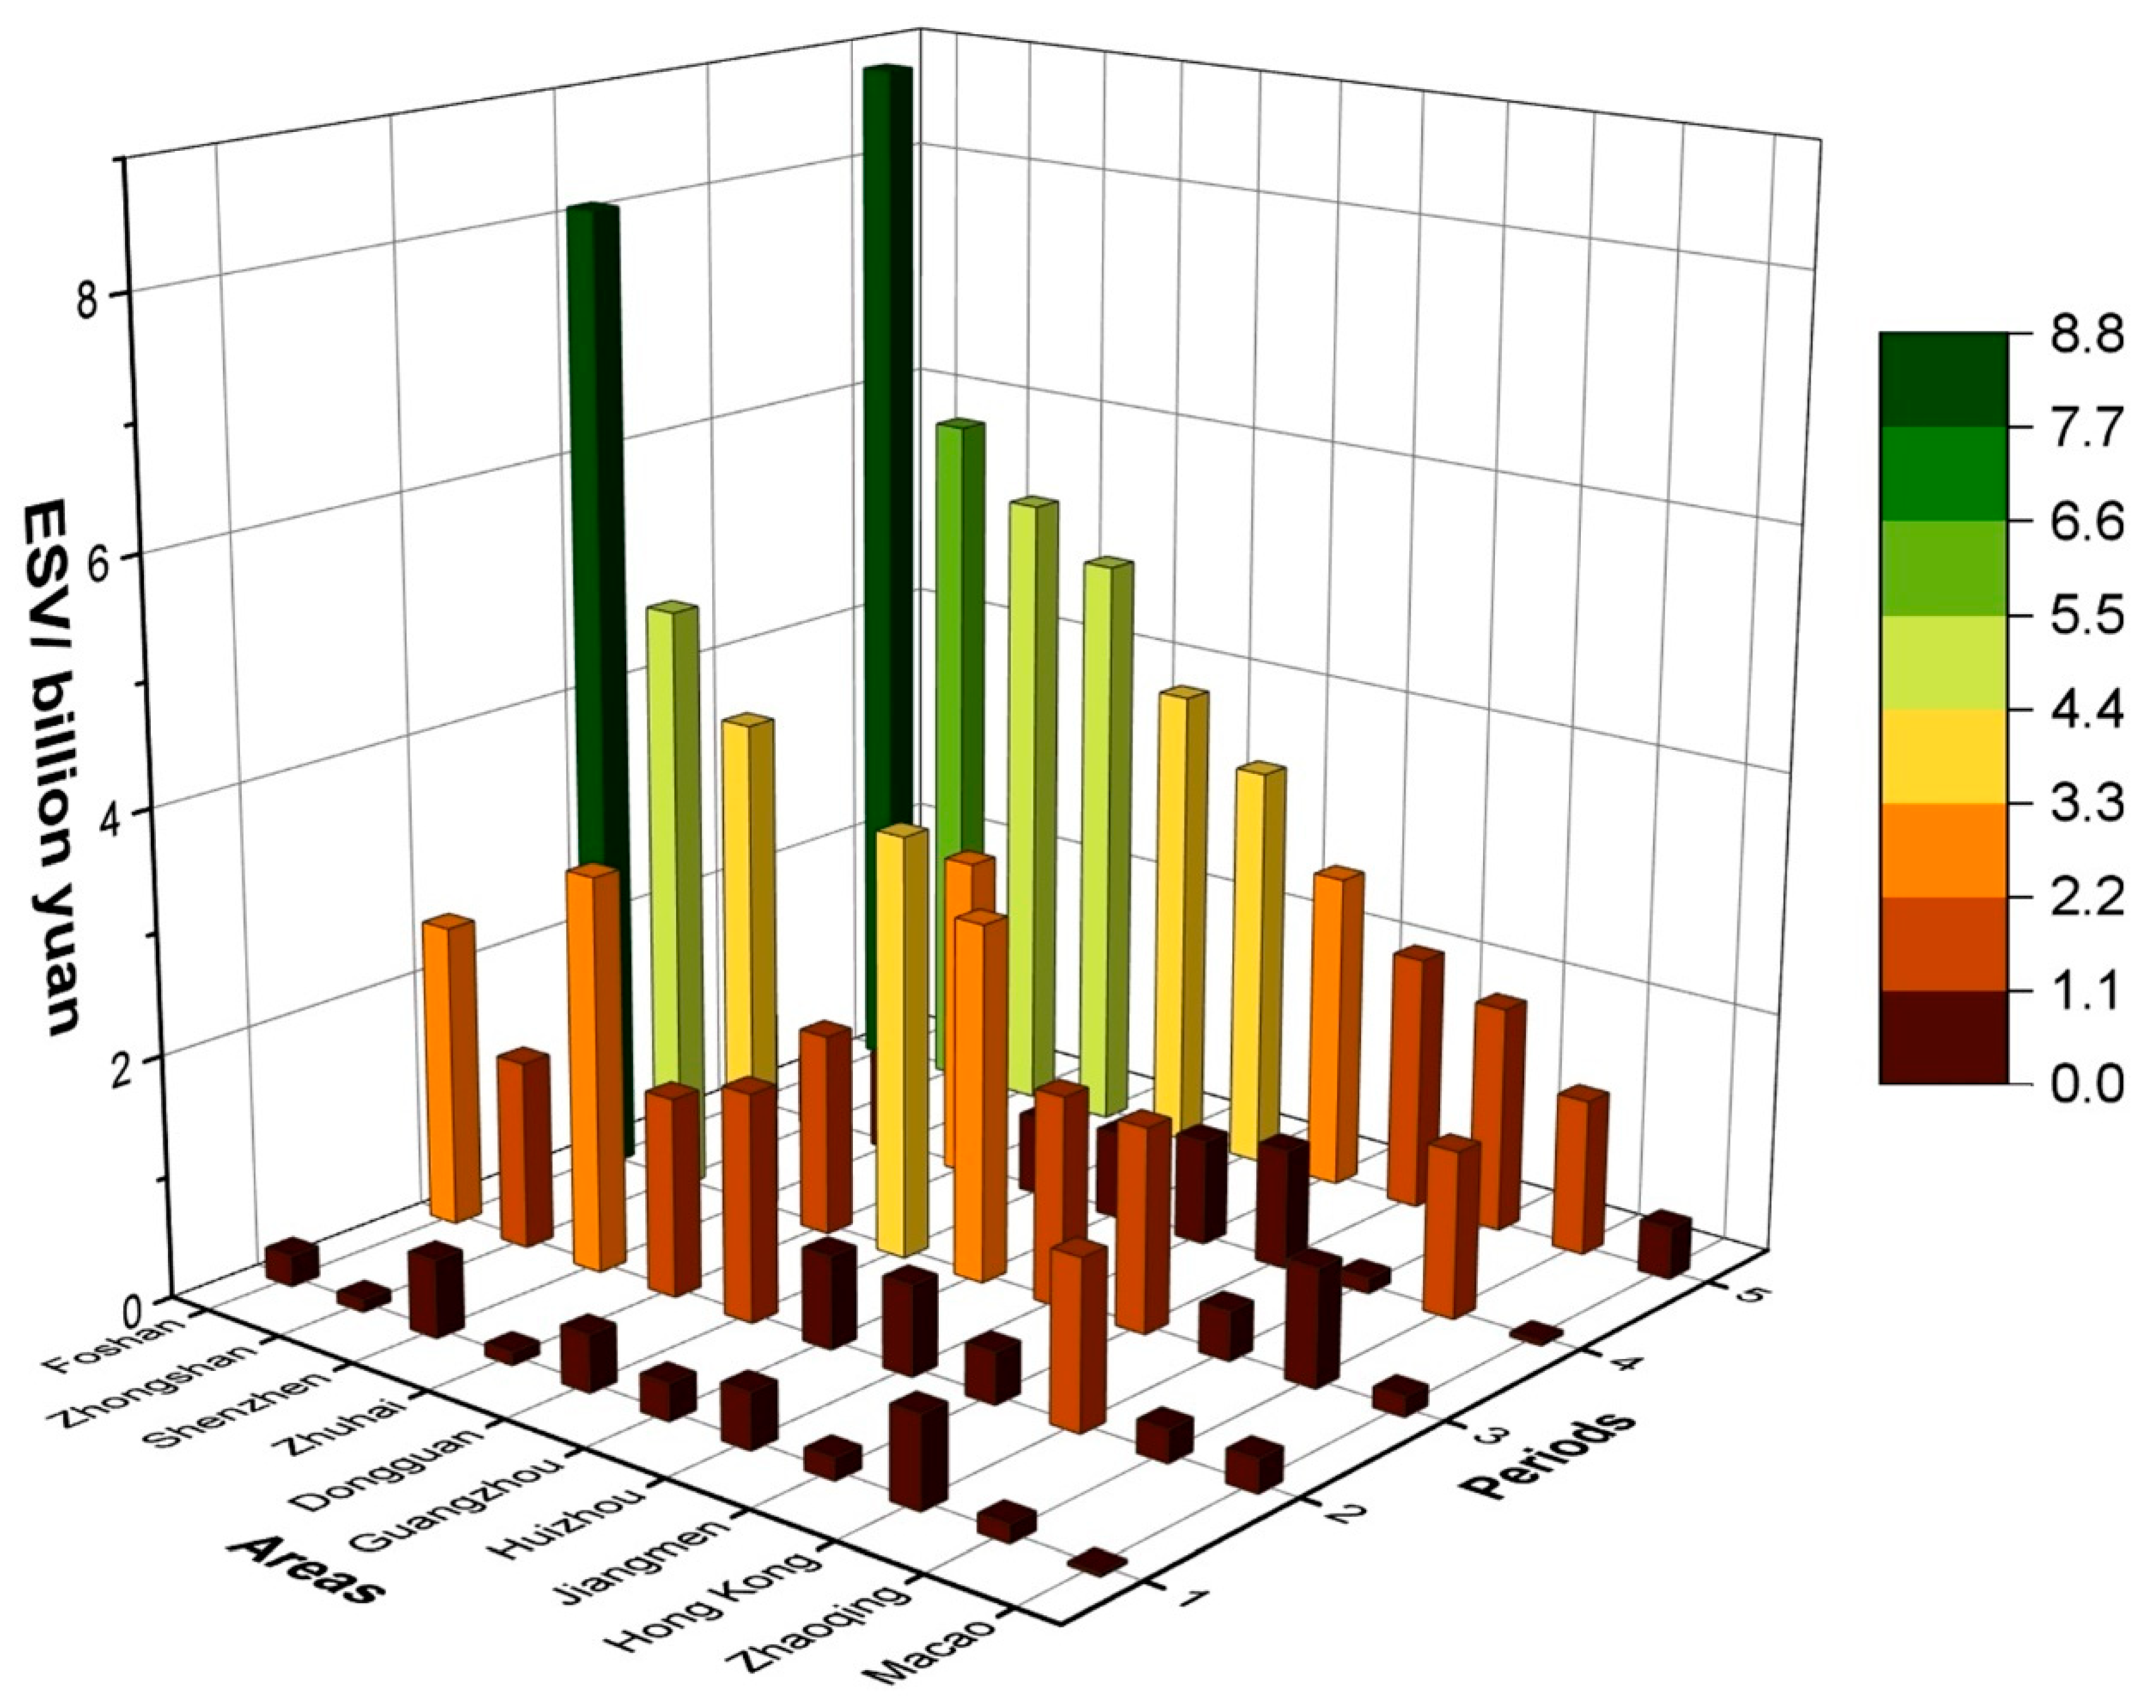
3.2.2. Changes in the ESV at the Regional Scale

Figure 5 shows the changes in the total ESV of the 11 cities over the various study periods. From 1980 to 2018, the total ESV loss of Foshan as a result of urbanization was the largest at 8.8 billion yuan, followed by Zhongshan at 5.8 billion yuan, Shenzhen at 5.3 billion yuan, and Zhuhai at 4.9 billion yuan. The ESV loss caused by urban expansion differs among the 11 cities over the study periods. The largest ESV losses of Hong Kong and Macao occur from 1990 to 2000, whereas those of Zhuhai and Zhaoqing occur from 2010 to 2018, and those of the other seven cities occur from 2000 to 2010. The minimum ESV loss of Hong Kong occurs over the last study period, whereas that of the other 10 cities occurs over the first study period. The trend of the ESV changes is roughly consistent with that of urban expansion (Table 2).

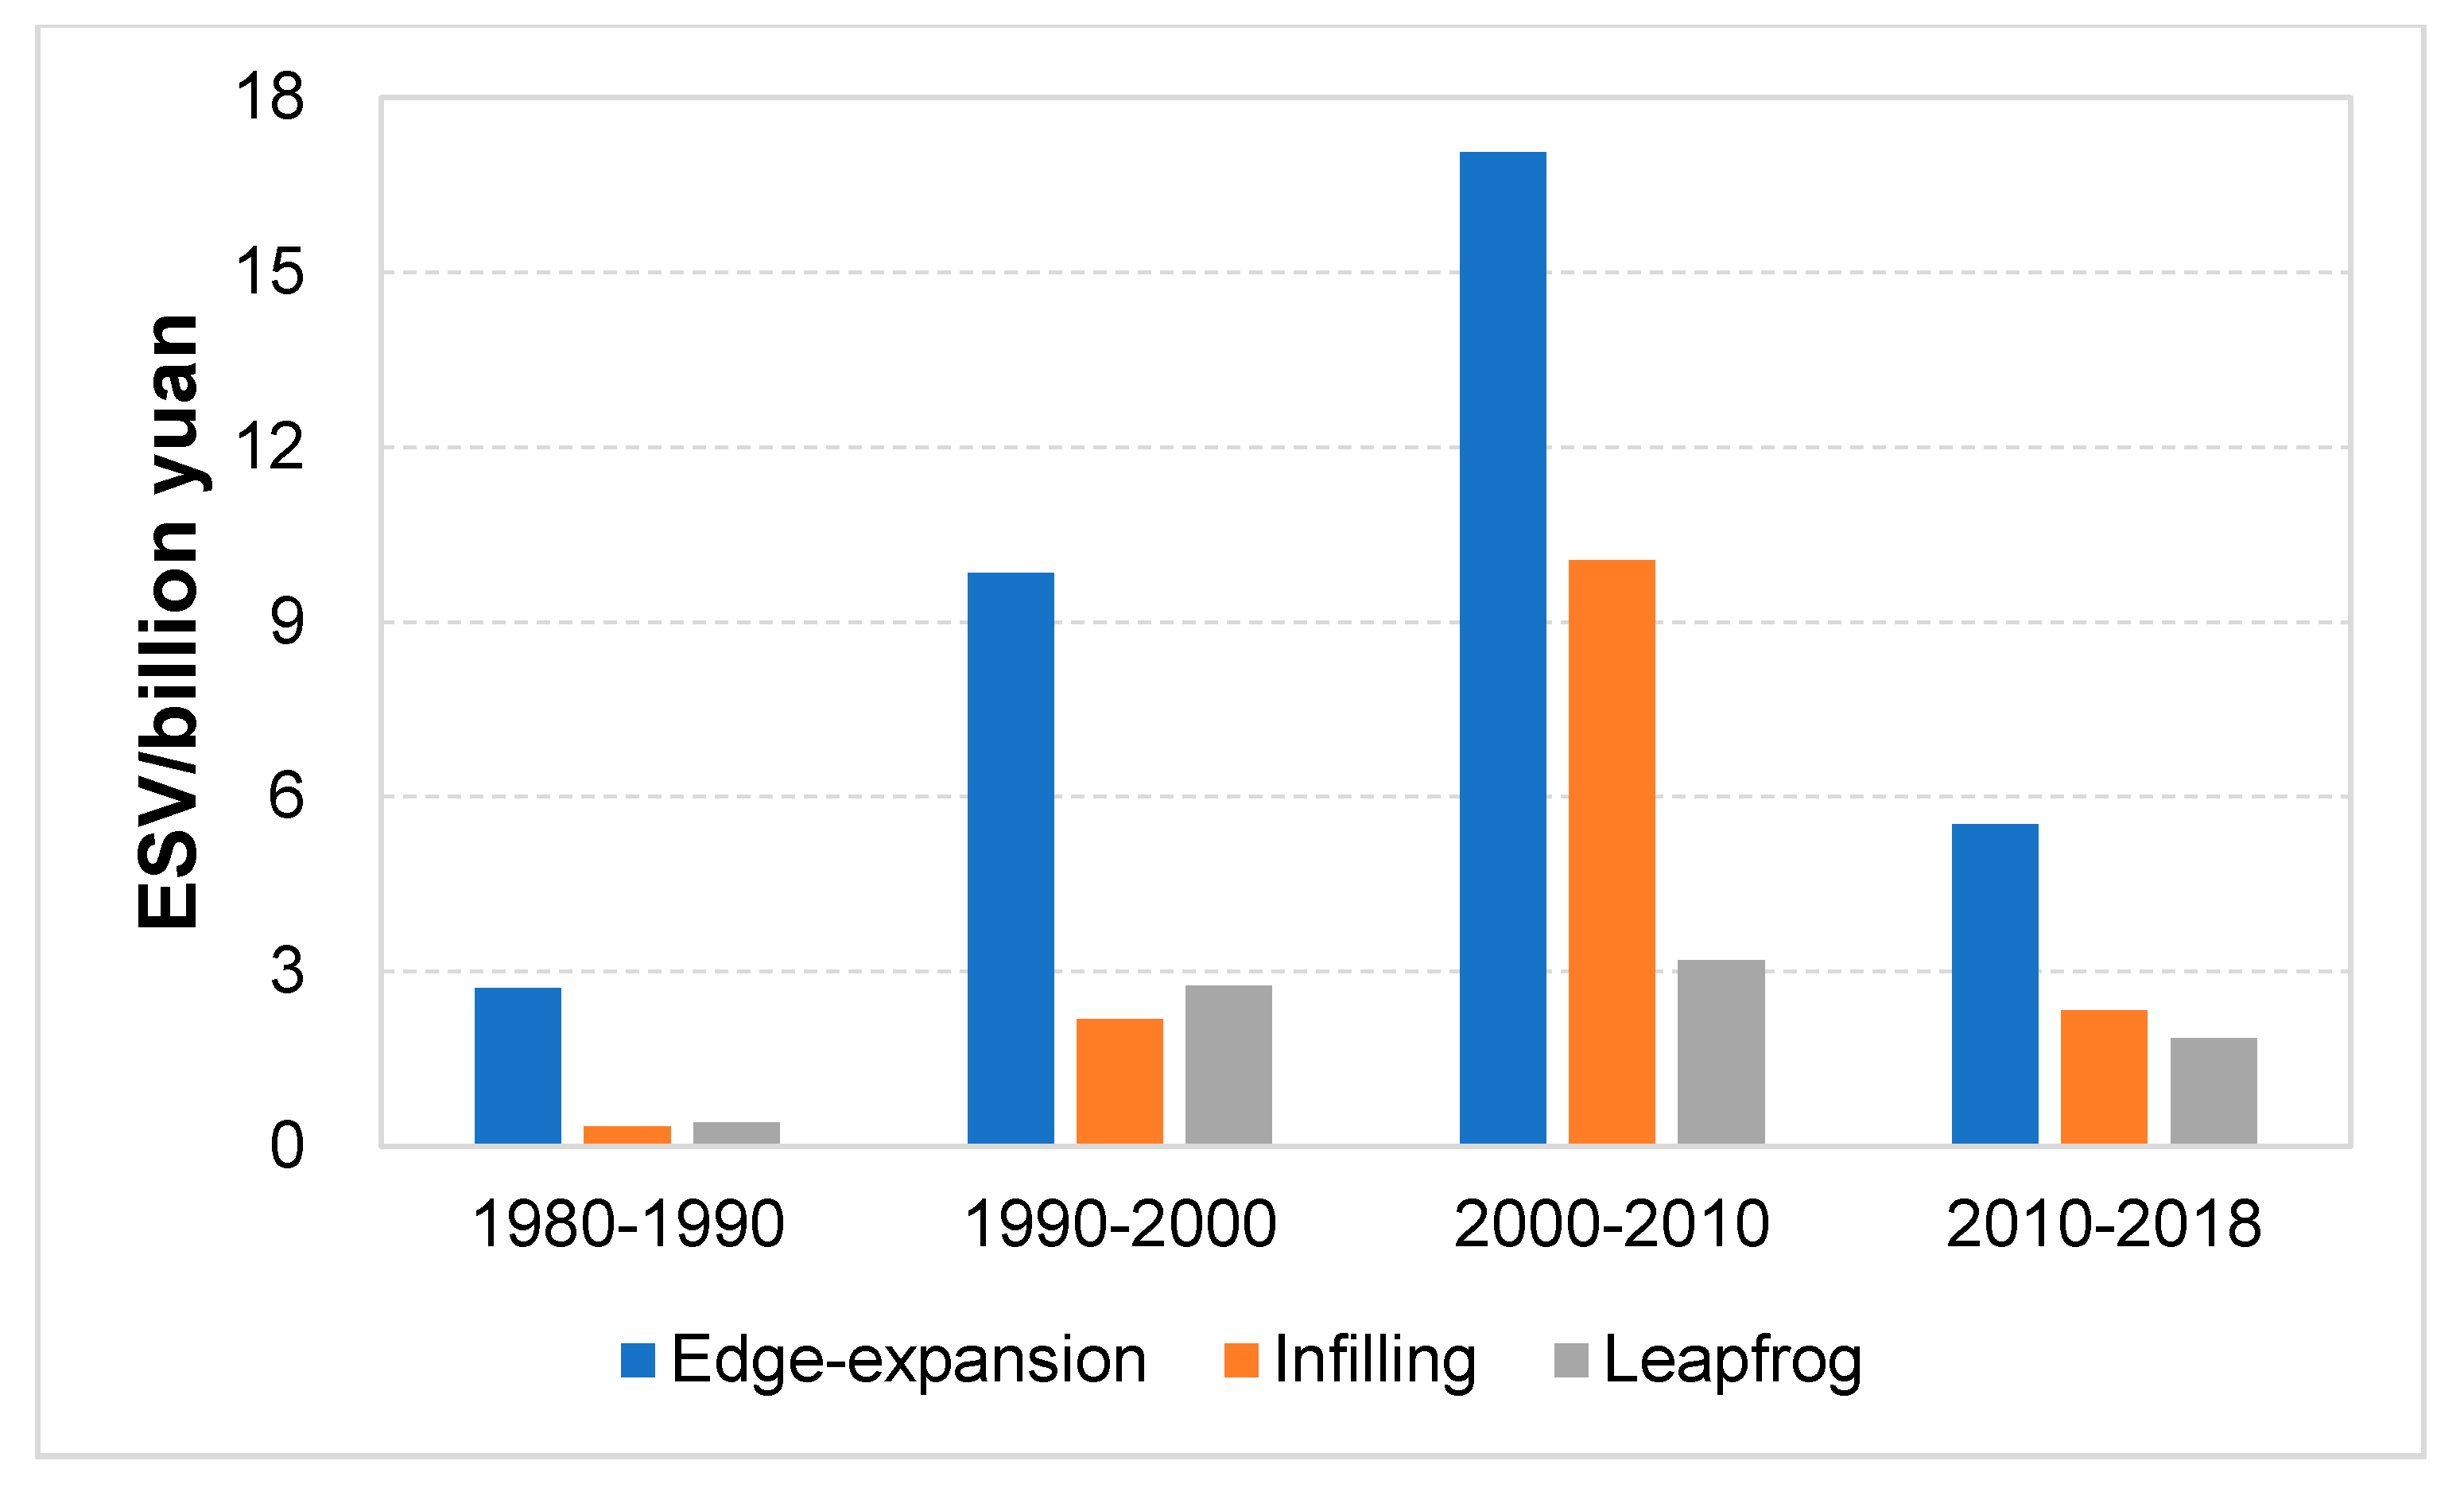
3.2.3. Changes in the ESV in Response to the Different Growth Modes

The changes in the ESV due to the three growth modes are shown in Figure 6. The ESV loss resulting from edge expansion, infilling, and leapfrog expansion exhibits a similar trend of increasing from the first period to the third period and then of declining. Among the three growth modes, edge expansion was the dominant pattern resulting in ESV losses and directly caused a loss of 2.7 billion yuan from 1980 to 1990, 9.8 billion yuan from 1990 to 2000, 17.1 billion yuan from 2000 to 2010, and 5.5 billion yuan from 2010 to 2018. In addition, it is observed that the ESV loss due to the infilling expansion pattern is smaller than that of the leapfrog expansion pattern over the first two periods, although the area of infilling is larger than that of leapfrog expansion over the first periods (Table S6).

4. Discussion

4.1. Spatial and Temporal Expansion of the Urban Areas

Our study reveals that the urbanized areas in the GBA dramatically increased over the past four decades from 1980 to 2018 in both the agglomeration and regional extents. The AI of the urbanized areas differed among the four time periods and the 11 hierarchical cities (Table 2). Over the first ten years (1980–1990), the urbanization in the GBA was the slowest, at an AI of 47.8 km2/year, because its social and economic development was in the primary and exploratory stage, although the reform and opening-up policy had been proposed in 1978 and special economic zones (Shenzhen and Zhuhai are two of the first special economic zones in the GBA) had been established in 1979. Urbanization and industrialization in the GBA began to develop after the first decade (1990–2000) at an AI of 149.1 km2/year. In 1992, Deng Xiaoping’s tour in the south, including visits to Shenzhen and Zhuhai, caused another upsurge in reform and opening up. In 1994, the Pearl River Delta Economic Zone was established by the government of Guangdong Province, which aimed to promote regional development depending on its geographical advantages due to its proximity to Hong Kong and Macao. Based on the development over the first two decades, the urban expansion in the GBA followed an explosive trend at an AI of 279.7 km2/year over the subsequent decade (2000–2010), especially after China joined the World Trade Organization in 2000, as a large number of foreign enterprises settled in the GBA [38]. Correspondingly, rapid urbanization and industrialization have caused serious environmental problems in the GBA, including heavy metal pollution of soil and water [39,40], wetland loss [41], urban heat island effects [42,43], and terrestrial carbon sources and sinks [44]. Therefore, central and local governments have implemented a series of policies and taken measures to protect wetlands [45], farmlands [46], and other ecosystems, and called for the construction of ecological cities and promulgated the National Plan on New Urbanization and the Opinions on Accelerating the Construction of Ecological Civilization to improve urbanization quality and protect natural ecosystems [47]. Thereafter, the rate of urbanization exhibited a decreasing trend at an AI of 108.7 km2/year over the last eight years (2010–2018). A similar urbanization trend to that in the GBA can be found in other urban agglomerations in China, including the Jing-Jin-Ji and Yangtze River Delta megalopolitan regions and other large cities [10,12,14,16,48]. Among the 11 cities, rapid urban expansion in Guangzhou, Dongguan, Foshan, Shenzhen, Zhongshan, and Zhuhai started in 1990, whereas that in Huizhou, Jiangmen, and Zhaoqing began in 2000, which may be related to the geographic location. Huizhou, Jiangmen, and Zhaoqing are not very close to the provincial capital, Guangzhou, as well as to Hong Kong, Macao, and the Pearl River Estuary, which probably limited their urbanization and industrialization process. Because of the limited administrative area and development degree, the urban expansion in Hong Kong and Macao revealed smooth and slightly changing trends. Disregarding the city size, the AER of Zhongshan, Zhuhai, Shenzhen, Foshan, Macao, and Guangzhou was relatively higher than that of the other cities. If the Pearl River Estuary is regarded as the axis, it seems that the degree of urban expansion tends to decrease from the inside to the outside.
Several studies have shown that urbanization is characterized as a spiraling process that includes the three growth modes of edge expansion, infilling, and leapfrog expansion [10,13,16]. As noted by Li et al. [10], edge expansion tends to maintain its importance, while leapfrog expansion and infilling are likely to alternate in terms of their relative dominance throughout much of the urbanization process. The study of Bosch et al. [13] suggested that infilling is becoming increasingly important at the expense of edge expansion, while the importance of leapfrog growth does not necessarily decrease with increasing agglomeration, with infilling remaining dominant; moreover, leapfrog growth is practically nonexistent in the inner zone of urban agglomeration. The results of this study exhibit various combinations of the urban growth types. The patterns of urbanization in the GBA, Shenzhen, Huizhou, and Zhongshan are primarily consistent with the results of Bosch et al. [13], whereas those in Dongguan, Zhaoqing, and Hong Kong coincide with the mode of Li et al. [10]. In addition, an increase in leapfrog growth is observed, while infilling does not exhibit any discernible trend in Jiangmen. In Guangzhou and Foshan, both infilling and leapfrog growth showed an increasing trend, but leapfrog expansion attained a lower growth rate. The influence of the three growth modes changes dramatically when inspecting the results in Zhuhai and Macao, which are mostly dominated by leapfrog expansion over the first period and edge expansion over the last period, and infilling is either practically nonsignificant or completely nonexistent. Overall, the results of this study suggest that the urbanization growth mode assembly changes over space and time.

4.2. Ecosystem Service Changes Caused by Urbanization

Urban expansion has not only converted various LULC types into construction land but has also impacted ecosystem functions and services [32]. Many studies have evaluated the ESV changes caused by urbanization [25,27,32,49,50], but previous researchers have paid more attention to the calculation of static values rather than to the relative change characteristics and trends of the ESV. This study collected grain yield data pertaining to the five study periods for year-to-year assessment to dynamically analyze the changes in ESs. Additionally, previous studies have only calculated the ESV of the primary classes of the LULC types (e.g., farmlands and forests), which could also affect the accuracy of the final ESV because the ESs of the different subclasses of land use types belonging to the same primary classes greatly differ [51]. Therefore, the farmland ESV is the sum of the ESVs of dry farmlands and paddy fields during each study period because the farmland class includes both dry farmlands and paddy fields in this study. Undeniably, there are various subjective factors impacting the evaluation of the ESV. Although different evaluation methods and perspectives are employed to assess the ESV, the change trend of the ESV remains similar in a specific region [28].
In this study, we found that the rapid and extensive changes in land use types caused by urban sprawl resulted in a major change in the ESs. Generally, the change trend of the ESV is consistent with the change in the land use if the evaluation of the ESV is based on the land use changes caused by urbanization. The results of this study are primarily consistent with this rule. In the GBA, the ESV loss because of urban expansion was the largest from 2000 to 2010 (30.3 billion yuan) because the decrease in the area of the other land use types as a result of urban sprawl was the highest (2797.3 km2) during this period. In addition, the decrease in ESV caused by edge expansion was the highest (Figure 6) because edge expansion was the dominant growth type of urban expansion throughout the study period (Figure 3). However, over the five study periods, the ESV loss due to water body encroachment by urban expansion was the largest, followed by the forests and farmlands in the GBA (Figure 4b). In contrast, the decrease in the farmland area was the largest because of urbanization, followed by forests and water bodies over the past four decades (Table S6). This clearly proves that a large area loss of a certain land use type does not necessarily result in a large ESV loss under the effects of urbanization. If we adopt water bodies as a reference, that is, both the area and ESV losses of water bodies are 1 during each study period, then the farmland area losses are 10.6, 5.3, 3.0, and 2.1, the forest area losses are 1.9, 1.8, 1.3, and 1.3, while the farmland ESV losses are 0.3, 0.2, 0.1, and 0.1, respectively, and the forest ESV losses are 0.3, 0.3, 0.2, and 0.2, respectively, from 1980 to 2018. It is not difficult to deduce that the water body ESV is far higher than that of farmlands and forests. Moreover, the order of the equivalent value per unit area of the different land use types is water bodies, wetlands, forestlands, grasslands, farmlands, and unused land (Tables S1–S5). As water bodies supply resistance and resilience to other ecosystems, wild species diversity, and biogeochemical cycling, and contribute to biological and genetic diversity [52], Chinese ecologists believe that the water regulation capacity of water bodies is far greater than that of other ecosystems and other ESs [24], which leads to the equivalent value per unit area of water bodies being far greater than other ecosystems. Therefore, even if the area of water bodies decrease is not the largest, the ESV loss due to water bodies decrease is apparently the largest, which highlights the importance of water bodies. In terms of the changes in the different ESs, hydrological regulation suffered the greatest changes due to urbanization (Figure 4c), which is not only because water bodies and wetlands possess a high hydrological regulation capacity but also because rain and runoff cannot penetrate the ground rapidly enough to participate in the natural water cycle as urban sprawl converts other land use types into impermeable surfaces [53].

4.3. Suggestions for Urban Planning

ESs are what humans directly or indirectly benefit from various kinds of ecosystems through ecological processes [18,22]. Extensive urbanization has driven the dramatic reduction and degradation of ESs, has caused serious environmental problems, and has imposed major impacts on human well-being [44,51,54]. These damages and influences are unpredictable, even unrecoverable. For example, wetlands loss caused by urbanization has directly led to the degradation and loss of natural habitat, which further results in species extinction and affects biodiversity [41,45]. However, most humans, driven by economic goals, continue to damage the environment rather than protect ecosystems [55]. Hence, to stabilize or reduce the continued consumption of ESs and promote sustainable urban development, it is vital for governments to establish more reasonable and scientific urban planning regulations. Based on the results of this study, we propose several urban planning regulations for urban agglomerations. First, as policies play an important role in the process of urbanization, governments must control the area of new urban patches, which could greatly inhibit the ESV loss. Second, because water bodies, wetlands, and forests have higher ESVs, we should protect these land cover types in urban planning. We should also build artificial lake, wetland, and forest parks within cities to improve the total ESV. Third, green infrastructure should also be planned and built, especially between roads and within cities, to improve the regional ESs [32,50].

5. Conclusions

In this study, the urbanization rates and spatiotemporal patterns in the GBA and its 11 cities were quantified and compared over the past four decades based on a series of long-term LULC databases. We also evaluated the ESV changes induced by urbanization from various perspectives in the whole GBA, at the regional scale, and for the various LULC types, ESs, and urbanization growth modes over each study period. From 1980 to 2018, the GBA experienced extensive urbanization, with the urban area increasing from 2607.4 to 8243.5 km2, and high AI and AER values were observed in 1990–2000 and 2000–2010. The AERs of Zhongshan, Zhuhai, Dongguan, Shenzhen, Foshan, and Macao were higher than those of the GBA and the other cities throughout the entire study period. It seems that the degree of urban expansion tends to decrease from the inside to the outside, with the Pearl River Estuary as the axis. In terms of the urbanization growth type, leapfrog and edge expansion were the dominant growth modes during the first and last periods, respectively, in Zhuhai and Macao; edge expansion was the most dominant growth mode with a decreasing trend, while infilling or leapfrog expansion increased throughout the study period in the GBA and the other nine cities. Extensive urbanization invaded substantial natural landscapes and further impacted ESs and functioning. The total ESV loss induced by urbanization in the GBA was 40.5 billion yuan from 1980 to 2018, and the biggest ESV loss was observed from 2000 to 2010, followed by 1990–2000. Throughout the study periods, the ESV loss of water bodies disappearing as a result of urban expansion was dominant, and hydrological regulation changed the most due to urbanization. We hope that this study provides references for decision-makers to establish more scientific and reasonable urban planning regulations in the GBA to ensure sustainable urban and environmental development.

Supplementary Materials

The following are available online at https://www.mdpi.com/2072-4292/12/19/3269/s1, Figure S1: Spatial and temporal distribution of three growth modes in the GBA, Table S1: Equivalent value per unit area of the different ESs in the GBA in 1980, Table S2: Equivalent value per unit area of the different ESs in the GBA in 1990, Table S3: Equivalent value per unit area of the different ESs in the GBA in 2000,Table S4: Equivalent value per unit area of the different ESs in the GBA in 2010, Table S5: Equivalent value per unit area of the different ESs in the GBA in 2018, Table S6: Conversion of other land use and land cover types to urban areas in the GBA over the study periods (km2).

Author Contributions

Conceptualization, X.W., F.Y., and F.S.; Formal analysis, X.W. and F.Y.; Funding acquisition, F.S.; Methodology, X.W. and F.Y.; Writing-original draft, X.W.; Writing-review and editing, X.W., F.Y., and F.S. All authors have read and agreed to the published version of the manuscript.

Funding

This research was supported by the National Natural Science Foundation of China (41890854). The principal author appreciates the scholarship provided by the China Scholarship Council (CSC) (No. 201906190120) for her study at Ghent University, Ghent, Belgium.

Acknowledgments

We appreciate the critical and constructive comments and suggestion from the reviewers that helped improve the quality of this manuscript. We also would like to offer our sincere thanks to those who participated in the data processing and provided constructive comments for this study.

Conflicts of Interest

The authors declare no conflict of interest.

References

  1. Yang, C.; Li, Q.; Hu, Z.; Chen, J.; Shi, T.; Ding, K.; Guofeng, W. Spatiotemporal evolution of urban agglomerations in four major bay areas of US, China and Japan from 1987 to 2017: Evidence from remote sensing images. Sci. Total. Environ. 2019, 671, 232–247. [Google Scholar] [CrossRef] [PubMed]
  2. World Bank. World Development Indicators. Available online: http://data.worldbank.org/data-catalog/world-development-indicators/wdi-2011 (accessed on 13 September 2012).
  3. Bloom, D.E. 7 Billion and Counting. Science 2011, 333, 562–569. [Google Scholar] [CrossRef] [PubMed] [Green Version]
  4. Angel, S.; Parent, J.; Civco, D.L.; Blei, A.; Potere, D. The dimensions of global urban expansion: Estimates and projections for all countries, 2000-2050. Prog. Plan. 2011, 75, 53–107. [Google Scholar] [CrossRef]
  5. Grimm, N.B.; Faeth, S.H.; Golubiewski, N.E.; Redman, C.L.; Wu, J.; Bai, X.; Briggs, J.M. Global Change and the Ecology of Cities. Science 2008, 319, 756–760. [Google Scholar] [CrossRef] [Green Version]
  6. Cumming, G.S.; Buerkert, A.; Hoffmann, E.M.; Schlecht, E.; Von Cramon-Taubadel, S.; Tscharntke, T. Implications of agricultural transitions and urbanization for ecosystem services. Nat. Cell Biol. 2014, 515, 50–57. [Google Scholar] [CrossRef]
  7. Alphan, H. Land-use change and urbanization of Adana, Turkey. Land Degrad. Dev. 2003, 14, 575–586. [Google Scholar] [CrossRef]
  8. Çakir, G.; Ün, C.; Baskent, E.Z.; Kose, S.; Sivrikaya, F.; KeleşS. Evaluating urbanization, fragmentation and land use/land cover change pattern in Istanbul city, Turkey from 1971 TO 2002. Land Degrad. Dev. 2008, 19, 663–675. [Google Scholar] [CrossRef]
  9. Liu, X.; Li, X.; Chen, Y.; Tan, Z.; Li, S.; Ai, B. A new landscape index for quantifying urban expansion using multi-temporal remotely sensed data. Landsc. Ecol. 2010, 25, 671–682. [Google Scholar] [CrossRef]
  10. Li, C.; Li, J.; Wu, J. Quantifying the speed, growth modes, and landscape pattern changes of urbanization: A hierarchical patch dynamics approach. Landsc. Ecol. 2013, 28, 1875–1888. [Google Scholar] [CrossRef]
  11. Yang, X.J. China’s Rapid Urbanization. Science 2013, 342, 310. [Google Scholar] [CrossRef]
  12. Zhao, S.; Zhou, D.; Zhu, C.; Qu, W.; Zhao, J.; Sun, Y.; Huang, D.; Wu, W.; Liu, S. Rates and patterns of urban expansion in China’s 32 major cities over the past three decades. Landsc. Ecol. 2015, 30, 1541–1559. [Google Scholar] [CrossRef]
  13. Bosch, M.; Jaligot, R.; Chenal, J. Spatiotemporal patterns of urbanization in three Swiss urban agglomerations: Insights from landscape metrics, growth modes and fractal analysis. Landsc. Ecol. 2020, 35, 879–891. [Google Scholar] [CrossRef]
  14. Sun, Y.; Zhao, S. Spatiotemporal dynamics of urban expansion in 13 cities across the Jing-Jin-Ji Urban Agglomeration from 1978 to 2015. Ecol. Indic. 2018, 87, 302–313. [Google Scholar] [CrossRef]
  15. Dietzel, C.; Herold, M.; Hemphill, J.J.; Clarke, K.C. Spatio-temporal dynamics in California’s Central Valley: Empirical links to urban theory. Int. J. Geogr. Inf. Sci. 2005, 19, 175–195. [Google Scholar] [CrossRef]
  16. Wu, W.; Zhao, S.; Zhu, C.; Jiang, J. A comparative study of urban expansion in Beijing, Tianjin and Shijiazhuang over the past three decades. Landsc. Urban Plan. 2015, 134, 93–106. [Google Scholar] [CrossRef]
  17. White, R.; Engelen, G.; Uljee, I. Modeling Cities and Regions As Complex Systems; MIT Press: Cambridge, MA, USA, 2015. [Google Scholar]
  18. Costanza, R.; d’Arge, R.; de Groot, R.; Farber, S.; Grasso, M.; Hannon, B.; Limburg, K.; Naeem, S.; O’Neill, R.V.; Paruelo, J.; et al. The value of the world’s ecosystem services and natural capital. Nature 1997, 387, 253–260. [Google Scholar] [CrossRef]
  19. Millennium Ecosystem Assessment. Ecosystems and Human Well-Being: Synthesis; Island Press: Washington, DC, USA, 2005. [Google Scholar]
  20. Bateman, I.J.; Harwood, A.R.; Mace, G.M.; Watson, R.T.; Abson, D.J.; Andrews, B.; Binner, A.; Crowe, A.; Day, B.H.; Dugdale, S.; et al. Bringing Ecosystem Services into Economic Decision-Making: Land Use in the United Kingdom. Science 2013, 341, 45–50. [Google Scholar] [CrossRef]
  21. Braat, L.C.; De Groot, R. The ecosystem services agenda:bridging the worlds of natural science and economics, conservation and development, and public and private policy. Ecosyst. Serv. 2012, 1, 4–15. [Google Scholar] [CrossRef] [Green Version]
  22. Costanza, R.; De Groot, R.; Sutton, P.; Van Der Ploeg, S.; Anderson, S.J.; Kubiszewski, I.; Farber, S.; Turner, R.K. Changes in the global value of ecosystem services. Glob. Environ. Chang. 2014, 26, 152–158. [Google Scholar] [CrossRef]
  23. Xie, G.; Zhang, C.; Zhang, L.; Chen, W.; Li, S. Improvement of the Evaluation Method for Ecosystem Service Value Based on Per Unit Area. J. Nat. Resour. 2015, 30, 1243–1254. [Google Scholar]
  24. Xie, G.; Zhen, L.; Lu, C.; Xiao, Y.; Chen, C. Expert Knowledge Based Valua tion Method of Ecosystem Services in China. J. Nat. Resour. 2008, 23, 911–919. [Google Scholar]
  25. Estoque, R.C.; Murayama, Y. Landscape pattern and ecosystem service value changes: Implications for environmental sustainability planning for the rapidly urbanizing summer capital of the Philippines. Landsc. Urban Plan. 2013, 116, 60–72. [Google Scholar] [CrossRef]
  26. Xie, G.; Li, W.; Xiao, Y.; Zhang, B.; Lu, C.; An, K.; Wang, J.; Xu, K.; Wang, J. Forest ecosystem services and their values in Beijing. Chin. Geogr. Sci. 2010, 20, 51–58. [Google Scholar] [CrossRef]
  27. Li, F.; Zhang, S.; Yang, J.; Bu, K.; Wang, Q.; Tang, J.; Chang, L. The effects of population density changes on ecosystem services value: A case study in Western Jilin, China. Ecol. Indic. 2016, 61, 328–337. [Google Scholar] [CrossRef]
  28. Xu, L.; Xu, X.; Luo, T.; Zhu, G.; Ma, Z. Services based on land use: A case study of Bohai Rim. Geogr. Res. 2012, 31, 1775–1784. [Google Scholar]
  29. Statistics Bureau of the people’s Republic of China. China Statistical Yearbook; China Statistics Press: Beijing, China, 2012.
  30. Lin, M.; Lin, T.; Sun, C.; Jones, L.; Sui, J.; Zhao, Y.; Liu, J.; Xing, L.; Ye, H.; Zhang, G.; et al. Using the Eco-Erosion Index to assess regional ecological stress due to urbanization—A case study in the Yangtze River Delta urban agglomeration. Ecol. Indic. 2020, 111, 106028. [Google Scholar] [CrossRef]
  31. Yang, C.; Li, Q.; Zhao, T.; Liu, H.; Gao, W.; Shi, T.; Guan, M.; Guofeng, W. Detecting Spatiotemporal Features and Rationalities of Urban Expansions within the Guangdong-Hong Kong-Macau Greater Bay Area of China from 1987 to 2017 Using Time-Series Landsat Images and Socioeconomic Data. Remote. Sens. 2019, 11, 2215. [Google Scholar] [CrossRef] [Green Version]
  32. Lyu, R.; Zhang, J.; Xu, M.; Li, J. Impacts of urbanization on ecosystem services and their temporal relations: A case study in Northern Ningxia, China. Land Use Policy 2018, 77, 163–173. [Google Scholar] [CrossRef]
  33. Taubenböck, H.; Weigand, M.; Esch, T.; Staab, J.; Wurm, M.; Mast, J.; Dech, S. A new ranking of the world’s largest cities-Do administrative units obscure morphological realities? Remote Sens. Environ. 2019, 232, 111353. [Google Scholar] [CrossRef]
  34. Xu, X.; Liu, J.; Zhang, S.; Li, R.; Yan, C.; Wu, S. China’s Multi-Period Land Use Land Cover Remote Sensing Monitoring Data Set (CNLUCC); Resource and Environment Data Cloud Platform: Beijing, China, 2018. [Google Scholar]
  35. Dytham, C.; Forman, R.T.T. Land Mosaics: The Ecology of Landscapes and Regions. J. Ecol. 1996, 84, 787. [Google Scholar] [CrossRef]
  36. Xiao, H.; Li, H.; Wang, L.; Chen, J.; Han, Y. Changes of Land Use and Ecosystem Service Value in the Guangdong-Hong Kong-Macao Greater Bay Area-A Case Study of Guangdong-Foshan-Zhaoqing. Res. Soil. Water. Conserv. 2020, 27, 290–297. [Google Scholar]
  37. Xiao, R.; Lin, M.; Fei, X.; Li, Y.; Zhang, Z.; Meng, Q. Exploring the interactive coercing relationship between urbanization and ecosystem service value in the Shanghai-Hangzhou Bay Metropolitan Region. J. Clean. Prod. 2020, 253, 119803. [Google Scholar] [CrossRef]
  38. Zou, B. From Special Zone to Greater Bay Area-Shenzhen’s historical contribution and future responsibility to urbanization in China. Time. Archt. 2019, 04, 12–17. [Google Scholar]
  39. Hu, Y.; Liu, X.; Bai, J.; Shih, K.; Zeng, E.Y.; Cheng, H. Assessing heavy metal pollution in the surface soils of a region that had undergone three decades of intense industrialization and urbanization. Environ. Sci. Pollut. Res. 2013, 20, 6150–6159. [Google Scholar] [CrossRef] [PubMed]
  40. Chang, C.Y.; Yu, H.Y.; Chen, J.J.; Li, F.; Zhang, H.H.; Liu, C.P. Accumulation of heavy metals in leaf vegetables from agricultural soils and associated potential health risks in the Pearl River Delta, South China. Environ. Monit. Assess. 2013, 186, 1547–1560. [Google Scholar] [CrossRef] [PubMed] [Green Version]
  41. Mao, D.; Wang, Z.; Wu, J.; Wu, B.; Zeng, Y.; Song, K.; Yi, K.; Luo, L. China’s wetlands loss to urban expansion. Land. Degrad. Dev. 2018, 29, 2644–2657. [Google Scholar] [CrossRef]
  42. Chen, X.L.; Zhao, H.M.; Li, P.X.; Yin, Z.Y. Remote sensing image-based analysis of the relationship between urban heat island and land use/cover changes. Remote. Sens. Environ. 2006, 104, 133–146. [Google Scholar] [CrossRef]
  43. Wu, J.; Chow, K.; Fung, J.C.H.; Lau, A.K.H.; Yao, T. Urban heat island effects of the Pearl River Delta city clusters-their interactions and seasonal variation. Theor. Appl. Clim. 2010, 103, 489–499. [Google Scholar] [CrossRef]
  44. Xu, Q.; Yang, R.; Dong, Y.-X.; Liu, Y.-X.; Qiu, L.-R. The influence of rapid urbanization and land use changes on terrestrial carbon sources/sinks in Guangzhou, China. Ecol. Indic. 2016, 70, 304–316. [Google Scholar] [CrossRef]
  45. Ma, Z.; Melville, D.S.; Liu, J.; Chen, Y.; Yang, H.; Ren, W.; Zhang, Z.; Piersma, T.; Li, B. Rethinking China’s new great wall. Science 2014, 346, 912–914. [Google Scholar] [CrossRef] [Green Version]
  46. Chien, S.-S. Local farmland loss and preservation in China-A perspective of quota territorialization. Land Use Policy 2015, 49, 65–74. [Google Scholar] [CrossRef]
  47. Wang, J.; Lin, Y.; Glendinning, A.; Xu, Y. Land-use changes and land policies evolution in China’s urbanization processes. Land Use Policy 2018, 75, 375–387. [Google Scholar] [CrossRef]
  48. Tian, G.; Jiang, J.; Yang, Z.; Zhang, Y. The urban growth, size distribution and spatio-temporal dynamic pattern of the Yangtze River Delta megalopolitan region, China. Ecol. Model. 2011, 222, 865–878. [Google Scholar] [CrossRef]
  49. Peng, J.; Tian, L.; Liu, Y.; Zhao, M.; Hu, Y.; Wu, J. Ecosystem services response to urbanization in metropolitan areas: Thresholds identification. Sci. Total. Environ. 2017, 706–714. [Google Scholar] [CrossRef]
  50. Li, B.; Chen, D.; Wu, S.; Zhou, S.; Wang, T.; Chen, H. Spatio-temporal assessment of urbanization impacts on ecosystem services: Case study of Nanjing City, China. Ecol. Indic. 2016, 71, 416–427. [Google Scholar] [CrossRef]
  51. Narducci, J.; Quintas-Soriano, C.; Castro, A.J.; Som-Castellano, R.; Brandt, J. Implications of urban growth and farmland loss for ecosystem services in the western United States. Land Use Policy 2019, 86, 1–11. [Google Scholar] [CrossRef]
  52. Doherty, E.; Murphy, G.; Hynes, S.; Buckley, C. Valuing ecosystem services across water bodies: Results from a discrete choice experiment. Ecosyst. Serv. 2014, 7, 89–97. [Google Scholar] [CrossRef]
  53. Bai, X.; McPhearson, T.; Cleugh, H.; Nagendra, H.; Tong, X.; Zhu, T.; Zhu, Y.-G. Linking Urbanization and the Environment: Conceptual and Empirical Advances. Annu. Rev. Environ. Resour. 2017, 42, 215–240. [Google Scholar] [CrossRef] [Green Version]
  54. Wang, W.; Wu, T.; Li, Y.; Xie, S.; Han, B.; Zheng, H.; Ouyang, Z. Urbanization Impacts on Natural Habitat and Ecosystem Services in the Guangdong-Hong Kong-Macao “Megacity”. Sustainability 2020, 12, 6675. [Google Scholar] [CrossRef]
  55. Paterson, S.; Bryan, B.A. Food-Carbon Trade-offs between Agriculture and Reforestation Land Uses under Alternate Market-based Policies. Ecol. Soc. 2012, 17, 17. [Google Scholar] [CrossRef] [Green Version]
Figure 1. Basic information for the study area. (a) the location of the GBA in China, (b) the administrative and topographical map of the GBA, and (c) the total population change in the GBA from 1980 to 2017. PRE: the Pearl River Estuary; ZQ: Zhaoqing; GZ: Guangzhou; FS: Foshan; JM: Jiangmen; ZS: Zhongshan; ZH: Zhuhai; MC: Macao; DG: Dongguan; HZ: Huizhou; SZ: Shenzhen; and HK: Hong Kong. Population data were obtained from the Guangdong Provincial Statistical Yearbook and Census, Statistics Department of Hong Kong, and Statistics and Census Service of Macao.
Remotesensing 12 03269 g001
Figure 2. Spatial distribution of the urban expansion in the GBA over the past four decades.
Remotesensing 12 03269 g002
Figure 3. Changes in the relative dominance of edge expansion, infilling, and leapfrog expansion during the four time periods in terms of the area of new urban patches in the urban agglomerations of the GBA and 11 cities.
Remotesensing 12 03269 g003
Figure 4. Ecosystem service value (ESV) changes due to urbanization in the GBA over the different periods: (a) total ESV changes, (b) ESV changes of the other land use types, and (c) ESV changes of the different ESs.
Remotesensing 12 03269 g004
Figure 5. ESV changes in the 11 cities over the five time periods. Periods 1, 2, 3, 4, and 5 represent the periods of 1980–1990, 1990–2000, 2000–2010, 2010–2018, and 1980–2018, respectively.
Remotesensing 12 03269 g005
Figure 6. ESV changes caused by the different growth modes of urban expansion in the GBA over the four time periods.
Remotesensing 12 03269 g006
Table 1. Classification systems of ecosystems based on the CNLUCC.
Ecosystems CNLUCC
Primary ClassesSubclassesSubclassesCodes
FarmlandDry farmlandDry farmland12
Paddy fieldPaddy field11
ForestlandBroad-leaved forestForest21
ShrubsShrubs22
ShrubsSparse woods23
ShrubsOther forestland24
GrasslandGrasslandHigh-coverage grassland31
Brush grassMedium-coverage grassland32
MeadowLow-coverage grassland33
WetlandsWetlandTidal flat45
WetlandBeach46
WetlandMarshland64
Unused landDesertSand61
Bare landBare land65
Bare landBare rock66
Water bodyRiver systemRivers and canals41
River systemLake42
River systemReservoir pond43
River systemSea99
Urban areas Urban residential area51
Rural residential area52
Other construction land53
Table 2. Area, annual increase (AI), and annual expansion rate (AER) of the urban areas in the GBA and 11 cities from 1980 to 2018. T1, T2, T3, T4, and T5 represent the periods of 1980–1990, 1990–2000, 2000–2010, 2010–2018, and 1980–2018, respectively.
AreasArea (km2)AI (km2/year)AEI (%)
19801990200020102018T1T2T3T4T5T1T2T3T4T5
GBA2607.43085.74576.57373.78243.547.8149.1279.7108.7148.31.74.04.91.43.1
Guangzhou532.7618.9841.41358.01471.98.622.351.714.224.71.53.14.91.02.7
Jiangmen425.7462.7526.5684.4800.83.76.415.814.69.90.81.32.72.01.7
Huizhou333.0380.0411.1704.8842.74.73.129.417.213.41.30.85.52.32.5
Foshan313.7345.5555.41076.41183.63.221.052.113.422.91.04.96.81.23.6
Dongguan242.3318.5694.31179.91244.47.637.648.68.126.42.88.15.40.74.4
Zhaoqing240.0247.5285.3389.6507.10.73.810.414.77.00.31.43.23.32.0
Shenzhen204.3330.3596.0909.1992.112.626.631.310.420.74.96.14.31.14.2
Hong Kong145.3175.6211.2235.7239.23.03.62.50.42.51.91.91.10.21.3
Zhongshan87.8117.8214.2491.6525.03.09.627.74.211.53.06.28.70.84.8
Zhuhai77.080.3224.9325.9417.30.314.510.111.49.00.410.83.83.14.5
Macao5.78.716.218.419.50.30.70.20.10.44.46.41.30.73.3

