Article

Identification of Polycentric Cities in China Based on NPP-VIIRS Nighttime Light Data

1
School of Geographical Sciences, Southwest University, Chongqing Jinfo Mountain Field Scientific Observation and Research Station for Karst Ecosystem, Ministry of Education, Chongqing 400715, China
2
State Cultivation Base of Eco-Agriculture for Southwest Mountainous Land, Southwest University, Chongqing 400715, China
3
Chongqing Engineering Research Center for Remote Sensing Big Data Application, School of Geographical Sciences, Southwest University, Chongqing 400715, China
4
Department of Geography and Environmental Science, University of Reading, Reading RG6 6AB, UK
5
Shenzhen State High-Tech Industrial Innovation Center, Shenzhen 518057, China
*
Author to whom correspondence should be addressed.
Remote Sens. 2020, 12(19), 3248; https://doi.org/10.3390/rs12193248
Submission received: 15 August 2020 / Revised: 25 September 2020 / Accepted: 3 October 2020 / Published: 7 October 2020
(This article belongs to the Section Urban Remote Sensing)

Abstract

:
Nighttime light data play an important role in the research on cities, while the urban centers over a large spatial scale are still far from clearly understood. Aiming at the current challenges in monitoring the spatial structure of cities using nighttime light data, this paper proposes a new method for identifying urban centers for massive cities at the large spatial scale based on the brightness information captured by the Suomi National Polar-Orbiting Partnership’s Visible Infrared Imaging Radiometer Suite (NPP-VIIRS) sensor. Based on the method for extracting the peak point based on digital elevation model (DEM) data in terrain analysis, the maximum neighborhood and difference algorithms were applied to the NPP-VIIRS data to extract the pixels with the peak nighttime light intensity to identify the potential locations of urban centers. The results show 7239 urban centers in 2200 cities in China in 2017, with an average of 3.3 urban centers per city. Approximately 68% of the cities had significant polycentric structures. The developed method in this paper is useful for identifying the urban centers and can provide the reference to the city planning and construction.

Graphical Abstract

1. Introduction

A city is the human settlement area that has developed to an advanced stage, representing important and productive areas in the modern society [1]. Over the last half century, urbanization has undergone rapid developed in the world, particularly in the developing countries [2,3]. After four decades of reform and opening-up, China’s urbanization rate increased from 17.9% in 1978 to 58.5% in 2017, with an average annual growth rate of approximately 1% [4]. China’s urban population is predicted to reach 1 billion by 2030 [5]. While the rapid urbanization has resulted in the development in economy [6,7], a series of ecological and environmental problems have become increasingly noticeable [8,9,10,11], and “urban diseases” like environmental pollution, overcrowding, and traffic congestion have emerged in many congested urban areas [12,13]. Cities are the fastest growing areas during the transition period in China, and city construction can largely affect China’s sustainable development [14,15]. Thus, the problems of “urban diseases” should be solved effectively. After many years of theoretical and empirical studies, the polycentric urban development model has been found to be effective in improving economic level and social cohesion, relieving crowded populations, and improving urban environment [16,17,18,19]. For the sustainable development of cities, therefore, it is important to monitor China’s urban centers, and to analyze the dynamics and spatial patterns of urban centers at different spatial scales.
Most current studies on the identification of polycentric urban regions are based on statistical or point of interest (POI) data with high accuracy and representativeness [20,21,22]. These data are of high quality but difficult to obtain. Therefore, research based on such data is mostly limited to single-phase or individual large cities. As a result, it is difficult to research the dynamics or at a large scale. In the last decade, nighttime light data have been used to identify the spatial structures of cities at large scales, and an increasing number of studies have utilized nighttime light data to monitor urban centers [23,24,25]. Nighttime light images from the Defense Meteorological Satellite Program’s Operational Line Scan System (DMSP-OLS), providing radiation-corrected data on a global scale, have been used to identify potential clusters with multiresolution segmentation [26]. After the removal of the haloing effect of potential clusters with support vector machine classifiers, bright urban areas were finally extracted using Gaussian volume models. This study produced good results in Hangzhou, East China, indicating that the markedly bright nighttime light areas in a city can be effectively identified. With the emergence of more nighttime light data and in-depth studies of urban spatial structures, the internal spatial characteristics of cities at a fine scale have received increasing attention. Compared with traditional DMSP-OLS nighttime light data, the nighttime light data from the Suomi National Polar-Orbiting Partnership’s Visible Infrared Imaging Radiometer Suite (NPP-VIIRS) have improved quality and can identify the central structure of a city at a fine spatiotemporal scale [27,28].
Monthly synthetic NPP-VIIRS data and POI data (with shared locations) from social platforms (microblogging) can be used with the local Moran index and geographic weighted regression method to effectively identify the urban central areas [29]. Such studies have been successfully conducted in Chinese cities such as Beijing, Shanghai, and Chongqing [30,31,32]. However, this research method needs to be supplemented with a large amount of POI data in the city, which requires a large amount of high-quality data. In small and medium-sized cities where this type of data is hard to collect, the recognition effect may be weaker than that in large cities. Considering the limitation of data quality, some researchers have focused on NPP-VIIRS nighttime light data and developed new methods to identify urban centers. In general, these new methods can be divided into two main groups: the contour number method based on the spatial characteristics of the city’s nighttime light level and the threshold segmentation method based on the brightness feature [32,33,34,35,36]. Some researchers have found that urban nighttime light models are largely similar to digital elevation model (DEM) which are represented as raised “peaks” and low “valleys” within a continuous area by their attribute values, and urban construction land can be identified by the abrupt areas between the bulges and the lowlands [32,36]. Therefore, terrain analysis methods such as the contour number method can be applied to the nighttime light data, such as NPP-VIIRS data, and the internal central structure of a single city can be effectively detected. Using the contour number method, 33 city centers were identified in Shanghai in 2014 [37]. Although good results have been achieved in the identification of central structures in a few cities, these studies are limited to single or a few large cities at a small scale. Comparative analyses among multiple cities at large spatial scales are still lacking. Based on the annual synthesized NPP-VIIRS data in 2015 and previous studies, Luo et al. [38] identified the urban centers of 286 cities above the prefecture level in China by setting thresholds, extracting clusters, and merging neighboring centers. In addition, they measured the degree of development of a city at the polycentric level in China in 2015. This study used a percentage threshold method based on nighttime light data, which extracted the areas with top 10% of urban brightness as urban centers. However, this method potentially excluded urban areas with generally low nighttime light intensity, such as emerging centers in large cities and centers in small cities. In addition, the identification results for a single year cannot reveal the long term change of urban centers.
In short, the research on the identification of urban centers in China based on NPP-VIIRS data is still in its infancy. In terms of the methods, the threshold segmentation method, which was widely used in the previous research, identifies the top 10% of the pixels with the highest brightness in a city as the urban center regions; as a result, urban centers with nighttime light brightness levels that are not within this threshold range are excluded. On the spatial scale, the existing studies focused on individual large cities and neglected a large number of medium- and small-sized cities. On the temporal scale, the existing studies focused on a particular single year, and time series analyses of urbanization are still lacking. Aiming at answering the above three scientific questions, this paper proposes a method to apply NPP-VIIRS nighttime light data to identify China’s urban centers at a large spatial scale. This method meets the need to determine whether a city has a center, the specific number of centers, and the spatial locations of the centers. The accuracy and uncertainty of the new method proposed in this paper are also estimated.

2. Study Area and Data
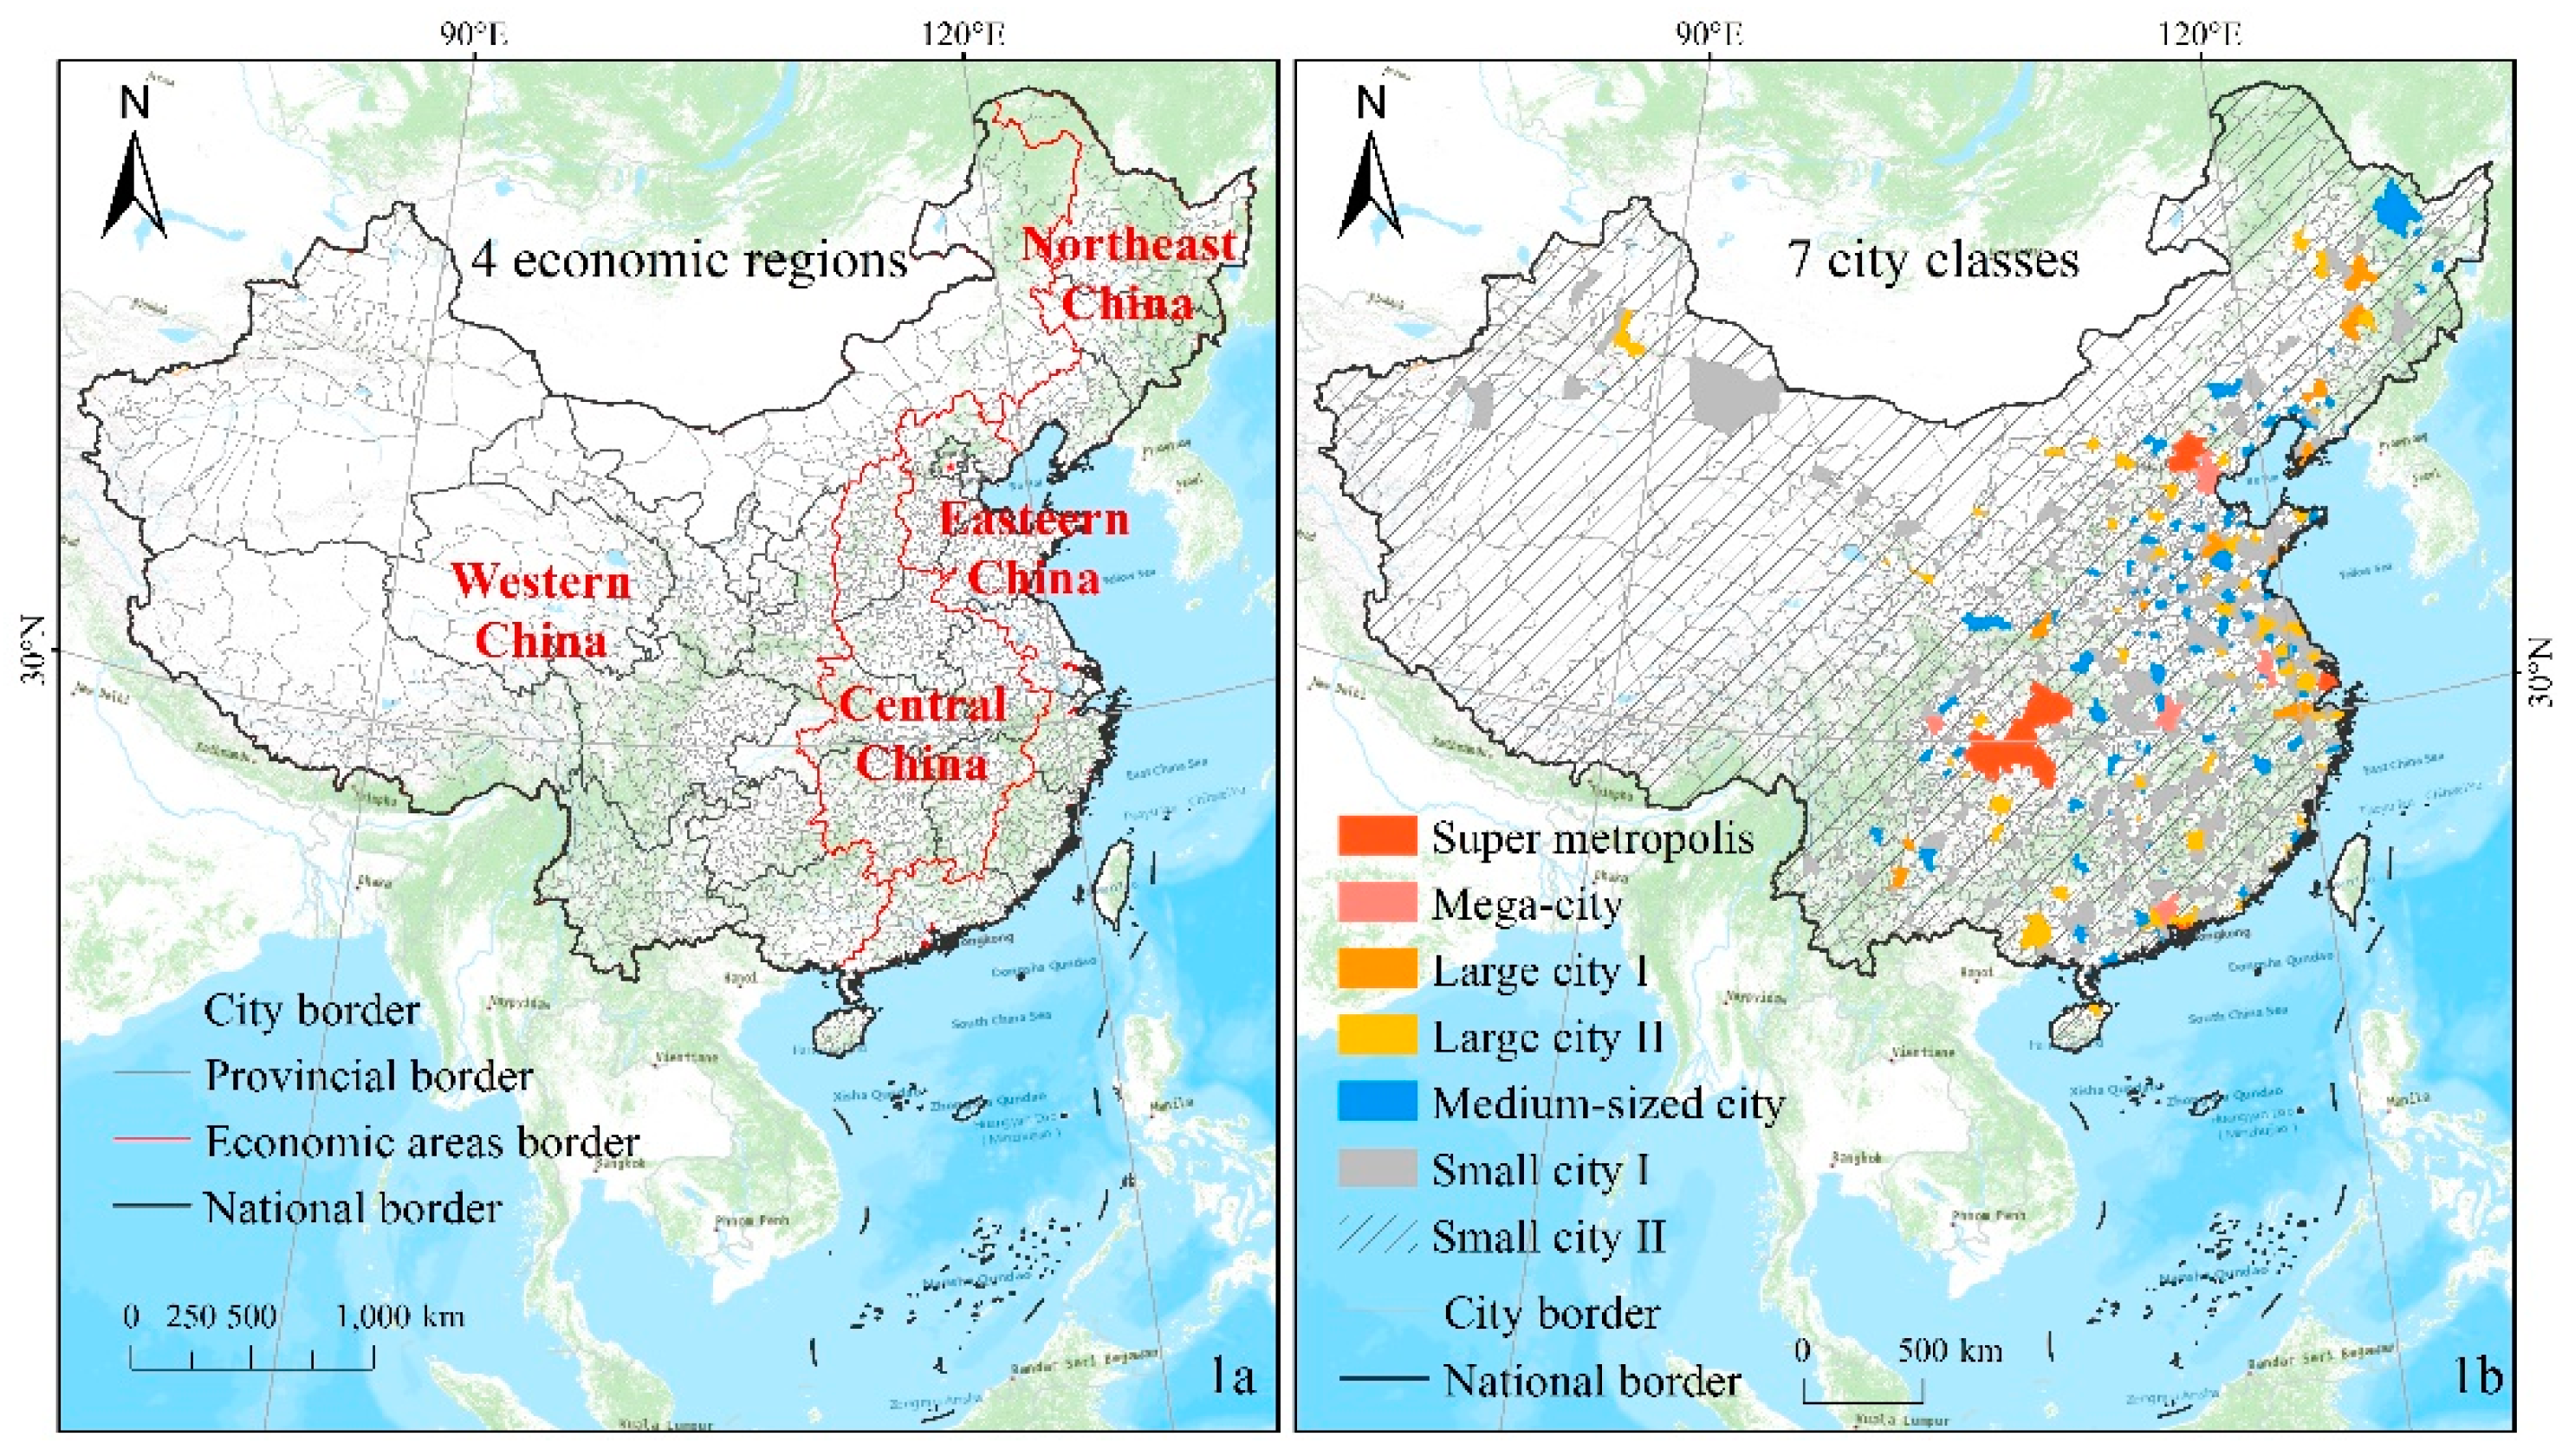
2.1. Study Area

The study area of this paper covers 2200 cities at the provincial, prefecture, and county administrative levels in mainland China (Hong Kong, Macao Special Administrative Region, and Taiwan Province were excluded due to lack of data). The vastness of China’s territory and the large variation in the socioeconomic conditions of China’s cities can lead to regional disparities in the level of urbanization.
According to the economic development and geographical condition, the whole of China is divided into four regions: northeastern China, eastern China, central China, and western China. Specifically, northeastern China includes three provincial administrative areas (Heilongjiang, Jilin, and Liaoning); eastern China includes 10 provincial administrative areas (Beijing, Tianjin, Hebei, Shandong, Jiangsu, Shanghai, Zhejiang, Fujian, Guangdong, and Hainan); central China includes six provincial administrative areas (Shanxi, Henan, Anhui, Hubei, Hunan, and Jiangxi); and western China includes 12 provincial administrative areas (Shaanxi, Gansu, Ningxia, Inner Mongolia, Qinghai, Xinjiang, Sichuan, Chongqing, Guizhou, Yunnan, Guangxi, and Tibet) (Figure 1a). This zoning method has been widely adopted in China [39,40].
For the city classification, referring to the division standard of city size issued by the State Council in 2014, Chinese cities were divided into three categories (large city, medium city, and small city) and seven secondary levels (super metropolis, megacity, large city I, large city II, medium-sized city, small city I, and small city II) based on the number of permanent residents in urban areas. The distribution of seven city classes in China is shown in Figure 1b. There is a relatively balanced distribution of the city classes in the four economic regions (Table 1), indicating a good match between the economic zoning and city scales in this study.

2.2. Data

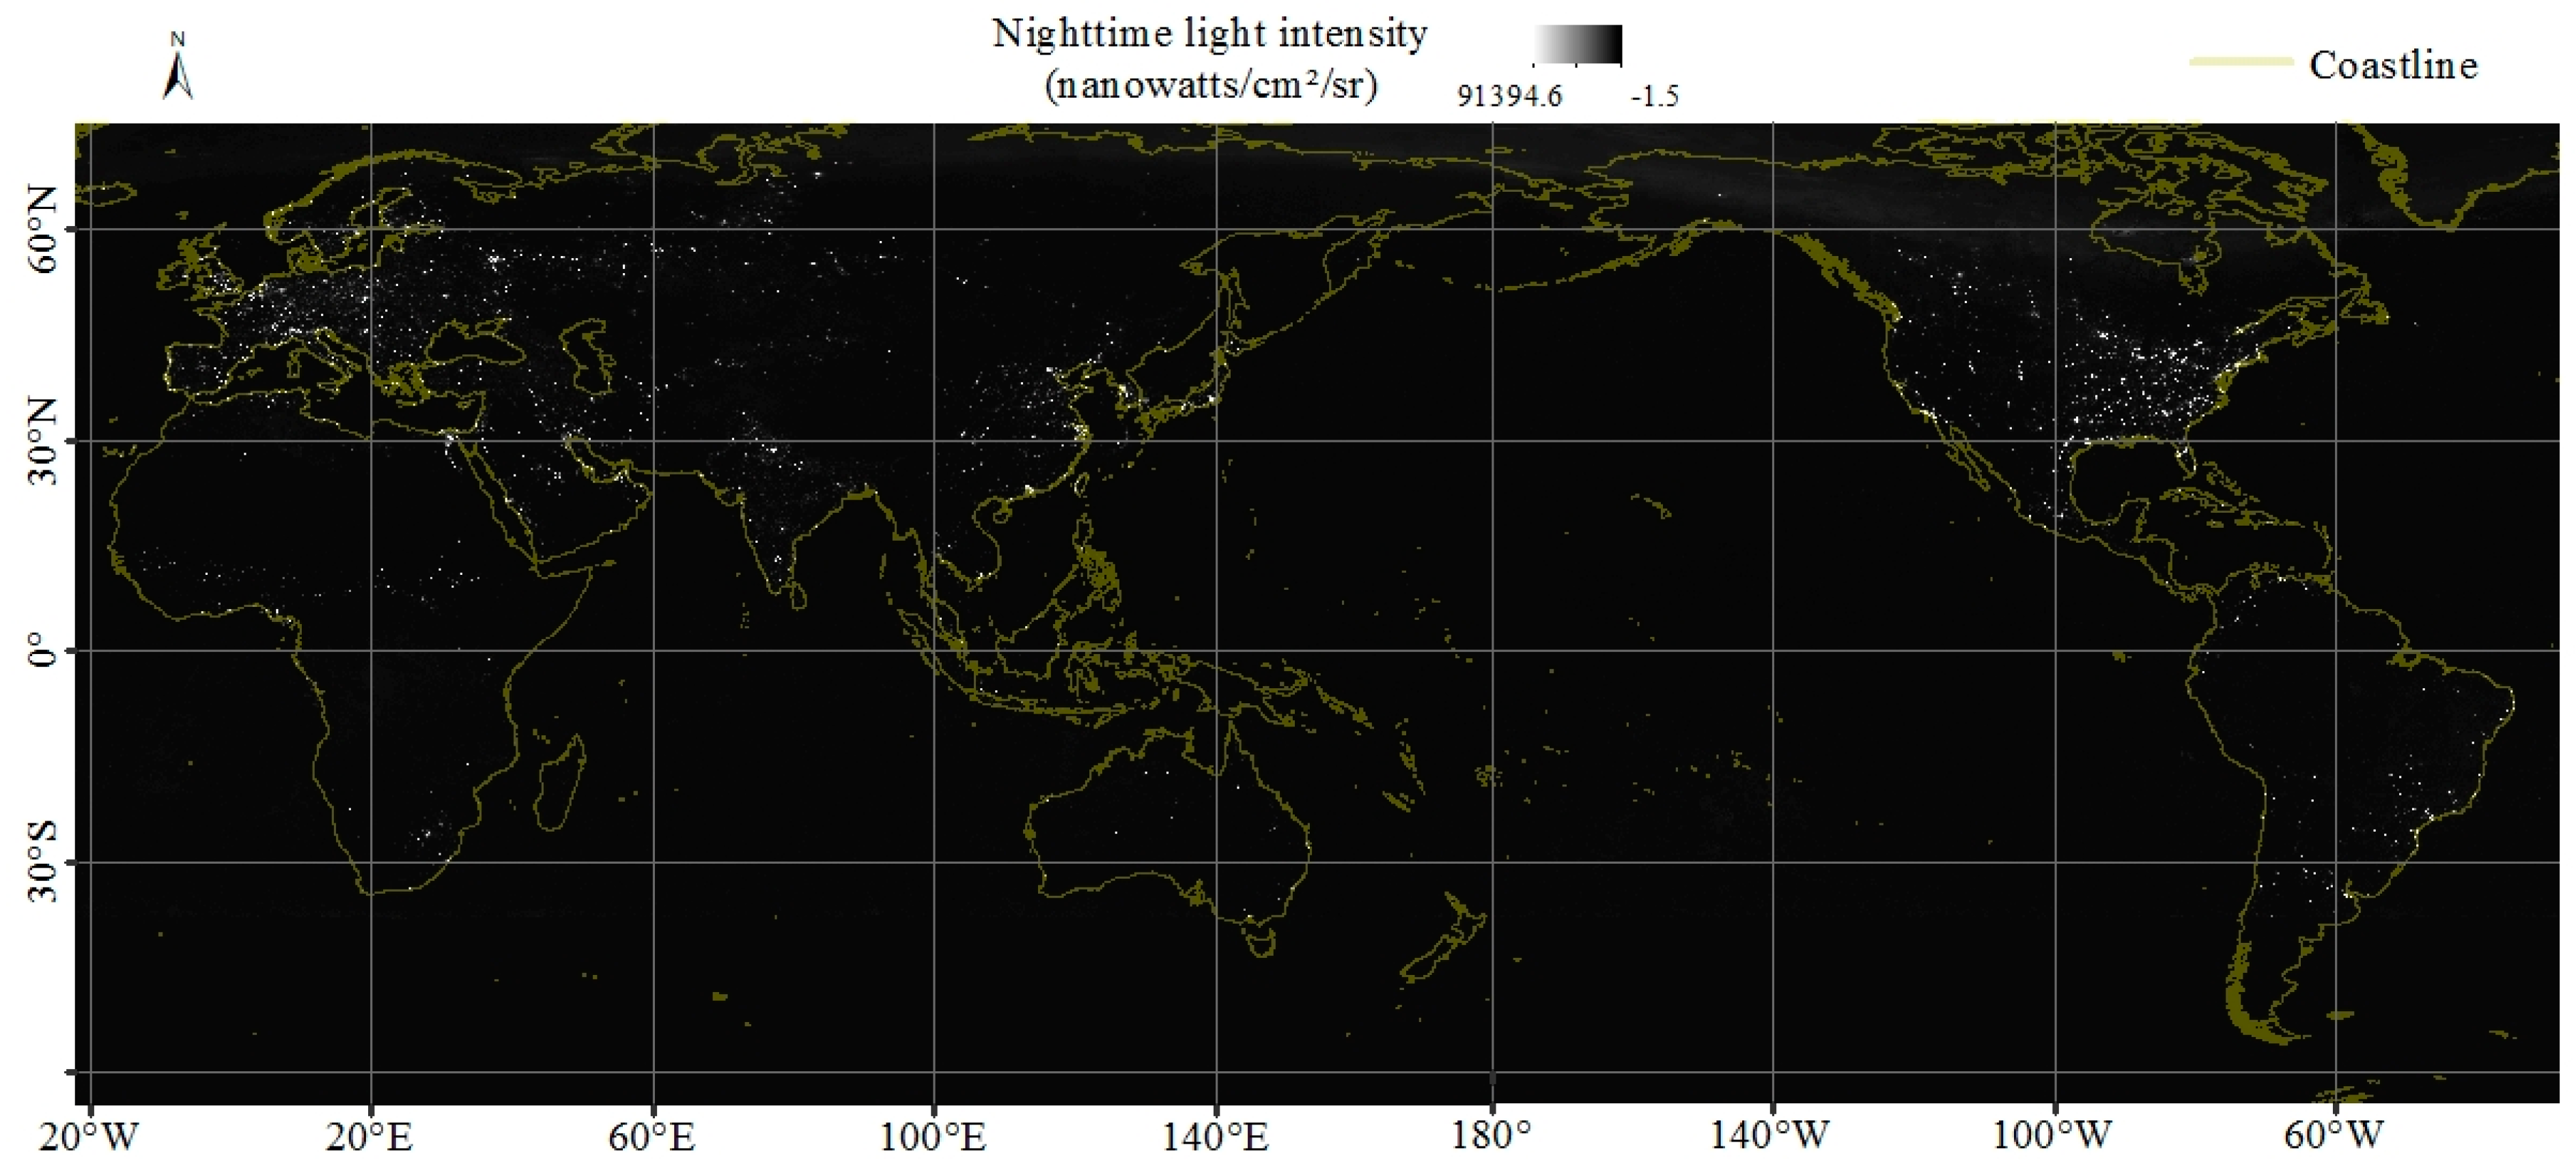
2.2.1. NPP-VIIRS Data

The nighttime light data used in this paper are the first version of cloud-free and monthly composite images from the NPP-VIIRS Day/Night Band (DNB), including 69 months from April 2012 to December 2017. The data were obtained from the National Centers for Environmental Information (NCEI), a subsidiary of the National Oceanic and Atmospheric Administration (NOAA) (https://ngdc.noaa.gov/eog/viirs/download_viirs_ntl.html). NPP-VIIRS grid products include three types of temporal resolution: day, month, and year. In terms of product quality and time series continuity, monthly composite products are used most widely. The monthly composite products are from April 2012 to the present, and they include two types (the products with stray light completely eliminated, and the products with stray light corrected) [41]. Before January 2014, only the former product is available; after January 2014, both products are available.
This study used cloud-free and monthly composite products and the effects of stray light were completely eliminated. The data are floating point values calculated by averaging the pixels deemed to be cloud-free, and their quantization is reported as radiance in units of nanowatts/cm2/sr [42]. The products are 15 arc second (approximately 475 m) grids spanning from 65° south to 75° north (Figure 2), and the global data were roughly cut into six tiles based on the equator and every 120° longitude interval. Before the monthly composite, the nighttime light captured by the DNB has been partially preprocessed to filter out the effects of stray light, lightning, moonlight, and clouds. However, monthly composite data still have background noise, such as auroras, oil and gas flames, and fishing fires.

2.2.2. Land Cover and Water Mask Data

Moderate Resolution Imaging Spectroradiometer (MODIS) land cover data (MCD12Q1) and water mask data (MOD44W) were obtained from the Land Process Distributed Active Archive Center of the National Aeronautics and Space Administration (NASA) (https://lpdaac.usgs.gov/product_search/?query=MODIS&view=cards&sort=title).
MCD12Q1, with a spatial resolution of 500 m, is the land cover data set based on the annual data obtained from the MODIS sensor carried by Terra and Aqua satellites. The sixth edition of the data set has continuous data from 2000 to the present and contains five different land cover classification systems. The land cover classification system of the International Geosphere Biosphere Programme (IGBP) is one of most widely used ones [43]. The system defines 17 land cover types, and this study used the land cover of urban areas as the extraction mask.
The MOD44W water mask data have a spatial resolution of 250 m and the time span from 2000 to 2015. Compared with the water data in MCD12Q1, MOD44W, the sixth edition, has high extraction accuracy for water and can more accurately represent the spatial distribution of water.

2.2.3. Population Density Data

The population density data were collected from the Gridded Population of the World (GPW) of the Socioeconomic Data and Applications Center (SEDAC) of NASA [44]. Based on the global population and housing census data from 2005 to 2014, the GPW data sets for 2000, 2005, 2010, 2015, and 2020 were produced through model calculations [45]. The population density data used in this study are the fourth edition optimized by statistics of the United Nations, with the spatial resolution of 30 arc seconds (approximately 1 km).

2.2.4. Other Auxiliary Data
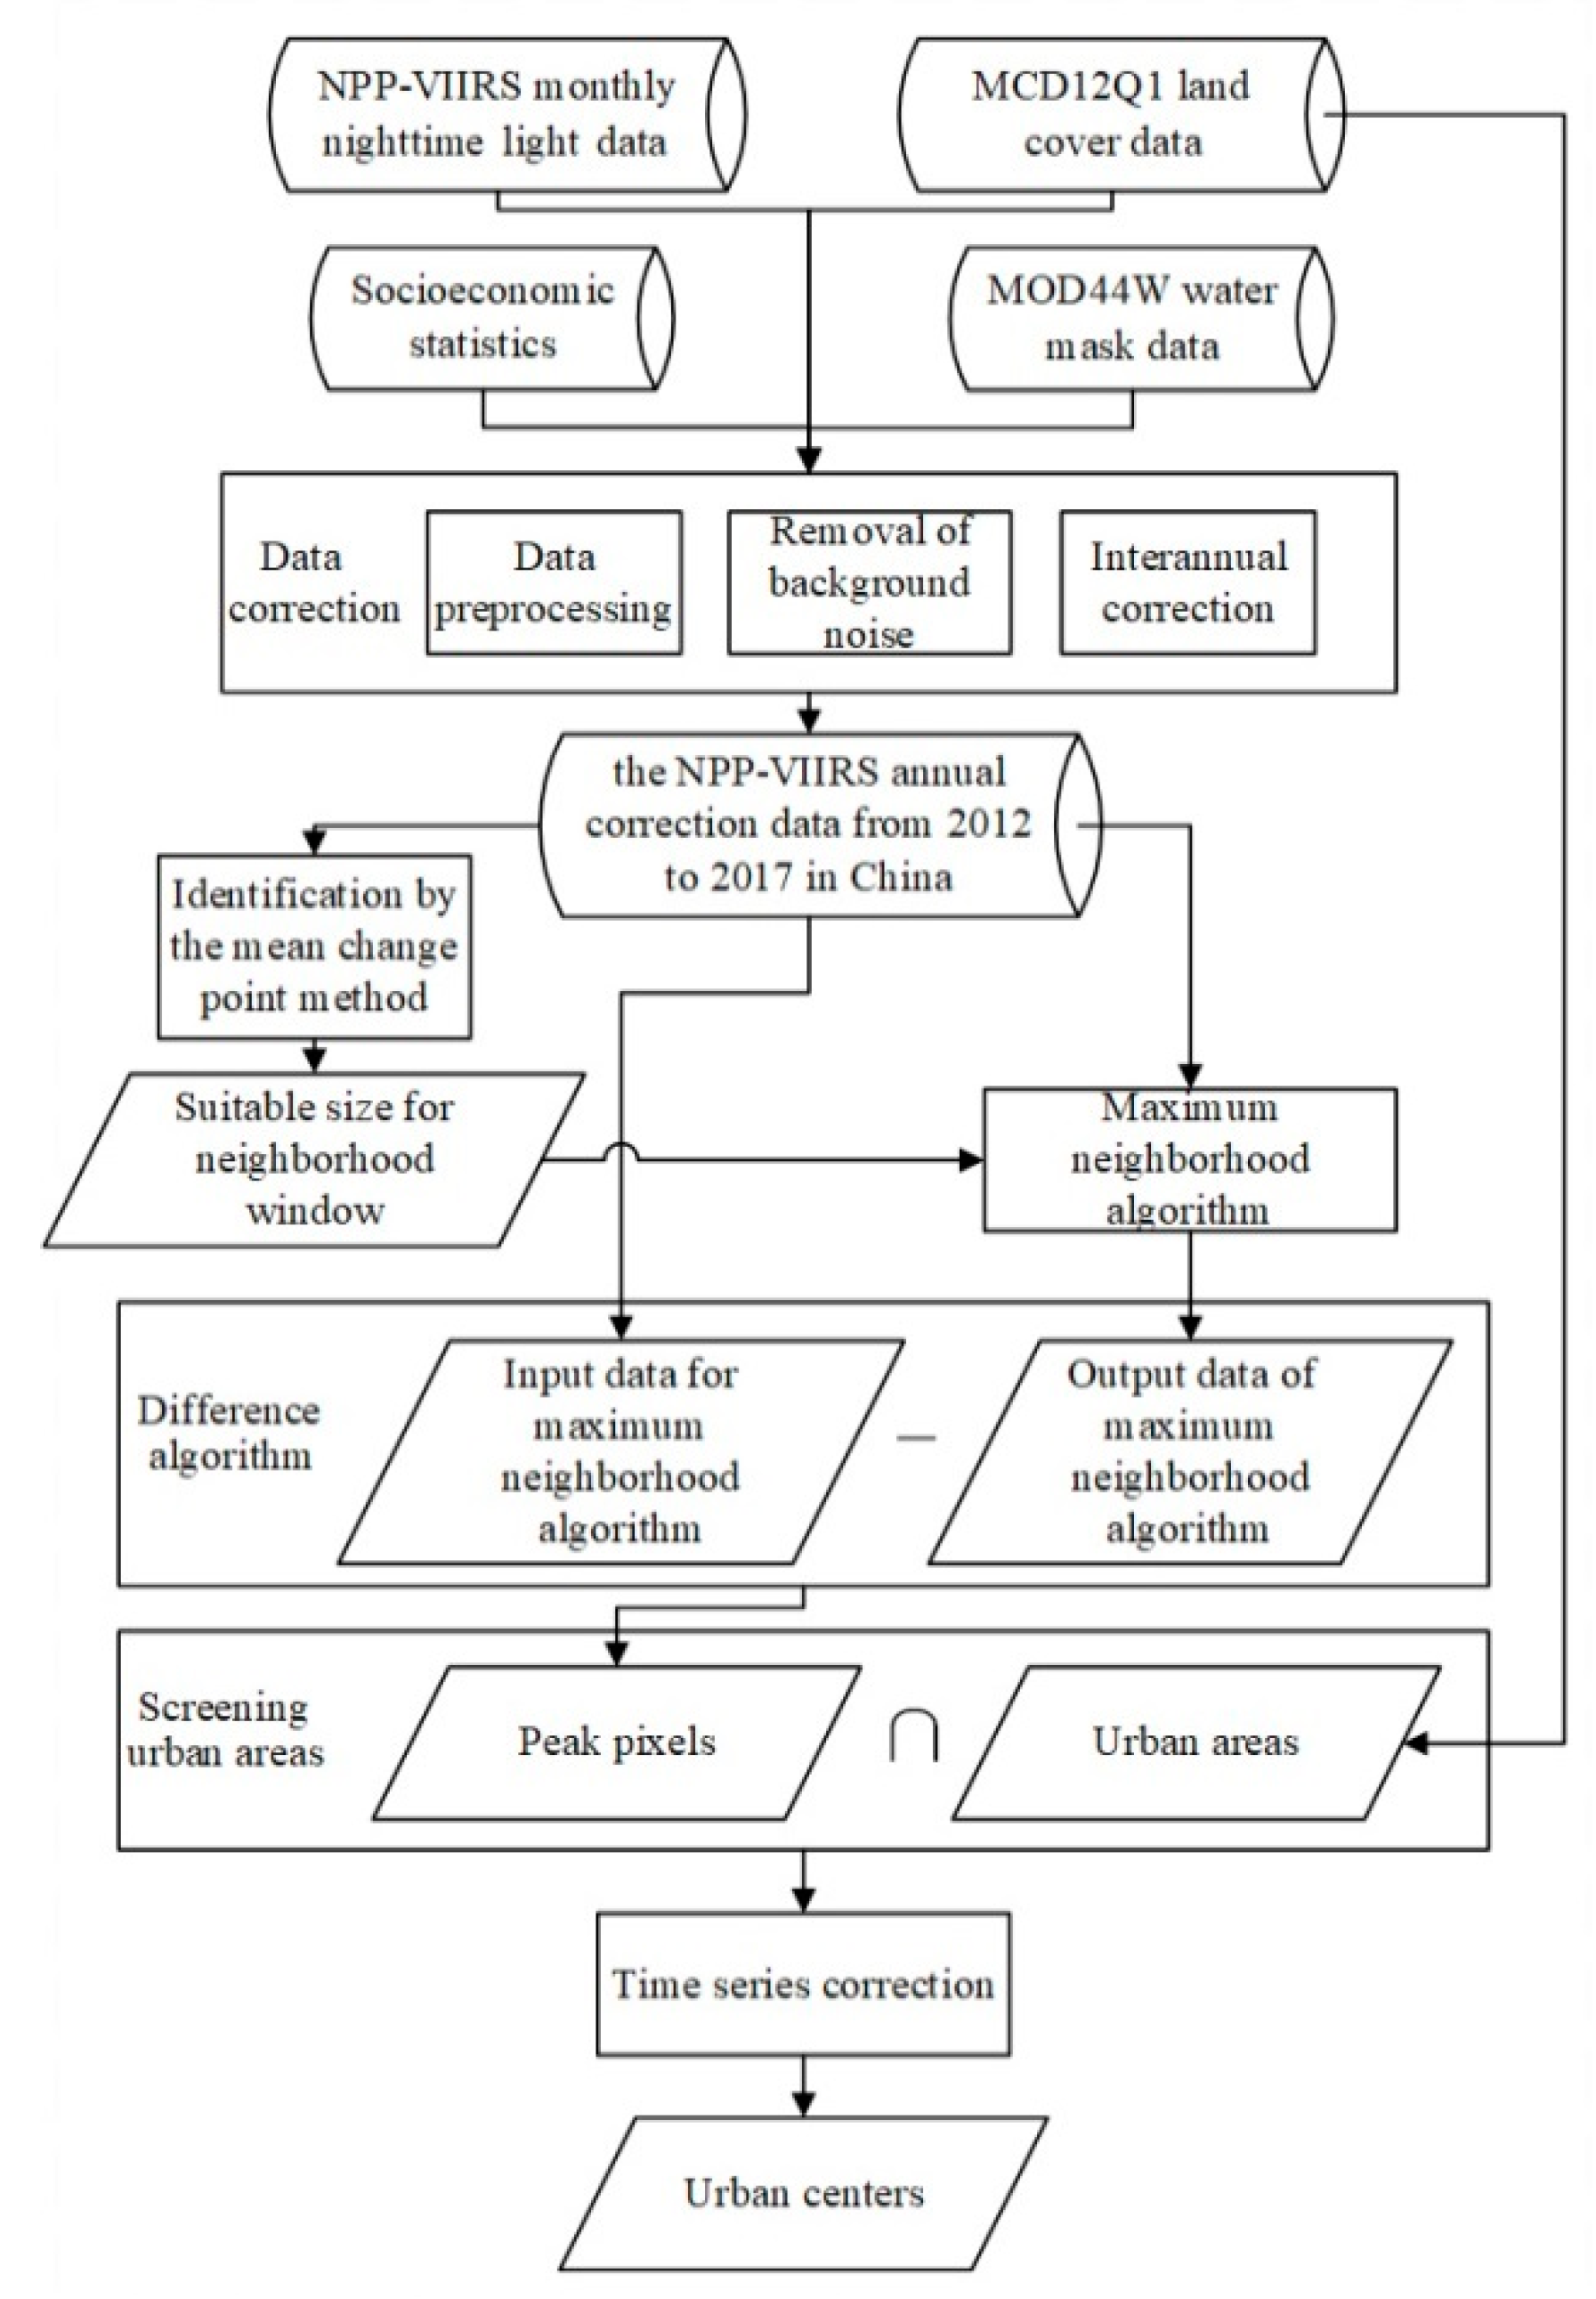
In addition to the above data, this study used the following auxiliary data:
The high-resolution historical remote sensing images were obtained from Google Earth. The administrative division data at national, provincial, and prefecture levels are the 1:4 million scale vector data set released from the National Geomatics Center of China (http://www.ngcc.cn/ngcc/html/1/391/392/16114.html). The data were updated with reference to the query platform for national administrative division information, the Ministry of Civil Affairs of the People’s Republic of China (http://xzqh.mca.gov.cn/map). Year-end total population, gross regional product, electricity consumption of the whole society, urban population, and county population statistics at the provincial and prefecture levels in China were obtained from China City Statistical Yearbook (National Bureau of [46], China Urban Construction Statistical Yearbook [47], and China County Seat Construction Statistical Yearbook [48]. The year-end total population is the total number of persons registered in the city at the end of the year, as counted by local public security department. Electricity consumption refers to the total amount of electricity used by all sectors of the city in the year. Gross regional product is the overall production activities of all residents in the city calculated at market prices in the year.

3. Methods

3.1. Data Preprocessing

To ensure the data comparability, all data with spatial information attributes were reprojected into the WGS84 geographic coordinate system and the Albers conical projection coordinate system and resampled to a spatial resolution of 500 m. NPP-VIIRS nighttime light data have been widely used in many fields because of their large spatial scale and multiple temporal resolutions. However, as a primary data product, some pixels of the data still have some noise, and there is a problem of discontinuous time series on the annual scale, which limits its application to a certain extent. To improve the quality of NPP-VIIRS data, they were corrected through three steps: data preprocessing, removal of background noise, and interannual continuity correction [49].

3.1.1. Preprocessing of NPP-VIIRS Data

Data preprocessing mainly includes image synthesis, reprojection, resampling, and cropping. First, the average NPP-VIIRS data for all months of the year were calculated. Then, to ensure the smallest area distortion, the data were projected into the WGS84 geographic coordinate system and the Albers conical projection coordinate system and resampled to a spatial resolution of 500 m. Finally, the vector data of the Chinese administrative boundary were used as a mask to reshape the processed NPP-VIIRS data. To avoid a mismatch between the administrative boundary and the latest coastline of the coastal zone, a 5 km buffer zone was extended outward from the coastal area boundaries to generate new vector boundaries as the mask for cropping.

3.1.2. Removal of Background Noise

The background noises of NPP-VIIRS data are mainly due to negative values, minimum values, and maximum values of background pixels. The negative values produced during the synthesis process do not meet the dimensional principle of light brightness. Due to the strong photoelectric sensing capability of VIIRS sensors, the very limited bright light emitted by human activities with slight intensity can often be captured [50]. In addition, light sources with extremely high brightness such as oil and gas, volcanic eruptions, auroras, and fire points can cause some of the pixel values to far exceed the brightness of the nighttime lights in human gathering areas. The background noises can limit the reliability and accuracy of nighttime light research in urban areas, so background noise must be removed from the image data obtained by the annual synthesis.
Since this research focused on cities, the background noise of NPP-VIIRS data needs to be removed according to the nighttime light characteristics in urban areas. First, the values of nighttime light pixels should increase from zero to positive values [51]. Pixels with values less than zero or those covered by a large area of water were all assigned a value of zero. In addition, as a kind of nighttime light data, DMSP-OLS can be used as auxiliary data to remove the maximum background noise of NPP-VIIRS data. Due to the limited threshold range (0–63) and high-value overflow of DMSP-OLS data, the coverage of its pixels is much larger than the actual urban human activity range. In addition, the maximum noises from oil, gas, and wildfire pixels of the DMSP-OLS data have been removed. The nonzero pixels of the DMSP-OLS data in the corresponding year can be used as a mask to extract NPP-VIIRS data to filter out most of the minimum values and the maximum background noises caused by nonhuman activities in the NPP-VIIRS data. In addition, the maximum nighttime light threshold of the city is determined by different levels, first at the national level and then at the provincial level. On a national scale, the highest value of nighttime light intensity in the central urban areas among the top five cities in terms of gross regional product in a given year was used as the maximum constraint threshold for nighttime light intensity in Chinese cities in that year. Next, the maximum constraint threshold was determined by the province based on the constraint threshold on a national scale. The highest value of nighttime light intensity in the central urban areas of the top five prefecture-level cities in terms of gross regional product in the provincial administrative districts was used as the maximum constraint threshold for nighttime light intensity in that province.
To check the effect of background noise removal, this study made a comparative validation with some typical applications of nighttime light data. To test the effect of denoising, this paper fitted the three socioeconomic indicators including year-end total population, electricity consumption of the whole society, and gross regional product, which were obtained from the China Statistical Yearbook for each city, with the NPP-VIIRS data before and after denoising. In the study where the nighttime light data were fitted with socioeconomic parameters, the total value of nighttime light, the cumulative value of all nighttime light pixels in an administrative division unit, had a good characterization ability [52]. Therefore, based on 31 provincial-level administrative regions and 244 prefecture-level administrative regions, this paper analyzed the correlation between the total value of nighttime light and the three socioeconomic indicators mentioned above in 2012.

3.1.3. Interannual Continuity Correction

In general, the monthly NPP-VIIRS data show regular time series changes, while some dramatic changes may cause some variation in nighttime light intensity, such as wars [53]. To assess the impact of war devastation in Syria on monthly NPP-VIIRS data, Li et al. [54] compared the ratio indices of nighttime light and found that the temporal variation in the monthly NPP-VIIRS data was relatively stable, with a maximum difference of less than 10% between two months. However, considering the differences between countries in terms of economic development and spatial scope, this research corrected the annual NPP-VIIRS data in China.
With reference to the steady economic development from 2012 to 2017 and the previous studies on interannual correction of DMSP-OLS data [55,56], this study considered that the nighttime light intensity of Chinese cities gradually enhanced during the period. Therefore, in theory, the NPP-VIIRS data should have the following characteristics: at the same pixel location, the nighttime light intensity in the following year should not be less than that of the previous year; the number of nighttime light pixels greater than zero in the following year should be larger than that in the previous year; in terms of spatial distribution, the following year should show an expansion trend compared to the previous year; and the nighttime light pixels of the previous year should not disappear in the following year. Under the above assumptions, this research performed interannual continuity correction on the NPP-VIIRS data from 2012 to 2017 using the following equation:
  DN ( n , i ) = {                   0 , when   DN ( n 1 , i ) = DN ( n , i ) = 0                 DN n 1 , i , when   DN ( n 1 , i ) DN ( n , i )               DN ( n , i ) , when   DN ( n , i ) > DN ( n 1 , i ) ( n   =   2012 ,   2013 ,   ,   2017 )
where DN ( n , i ) represents the value of the i-th pixel in year n; and DN ( n 1 ,   i ) represents the value of the i-th pixel in year n − 1.
Specifically, interannual continuity correction is the synthesis of band data (after preprocessing and denoising) from two consecutive years. With reference to the data from the first year, the pixel value of the data from the second year was determined by comparing the pixel values of the two annual data at the same pixel location. In this way, the interannual continuity correction of data was achieved. By comparing the data in 2012 and 2013 based on Equation (1), the corrected data for 2013 were determined and used as the new basic data for the data correction in 2014. Similarly, the NPP-VIIRS nighttime light images from 2012 to 2017 with a stable continuous time series were obtained.

3.2. Detection of Urban Centers

Due to the obvious human activity in urban centers, there is correlation between nighttime light and human activity in night. Because areas with high pixel values in nighttime light images have a high consistency with the spatial distribution of urban centers [37], pixels with high values in nighttime light images in urban areas are more likely to be urban centers. In general, the identification of urban centers in this research includes three steps: extraction of peak pixels based on the terrain analysis method, determination of a suitable window size for the neighborhood algorithm, and extraction of urban centers (Figure 3).

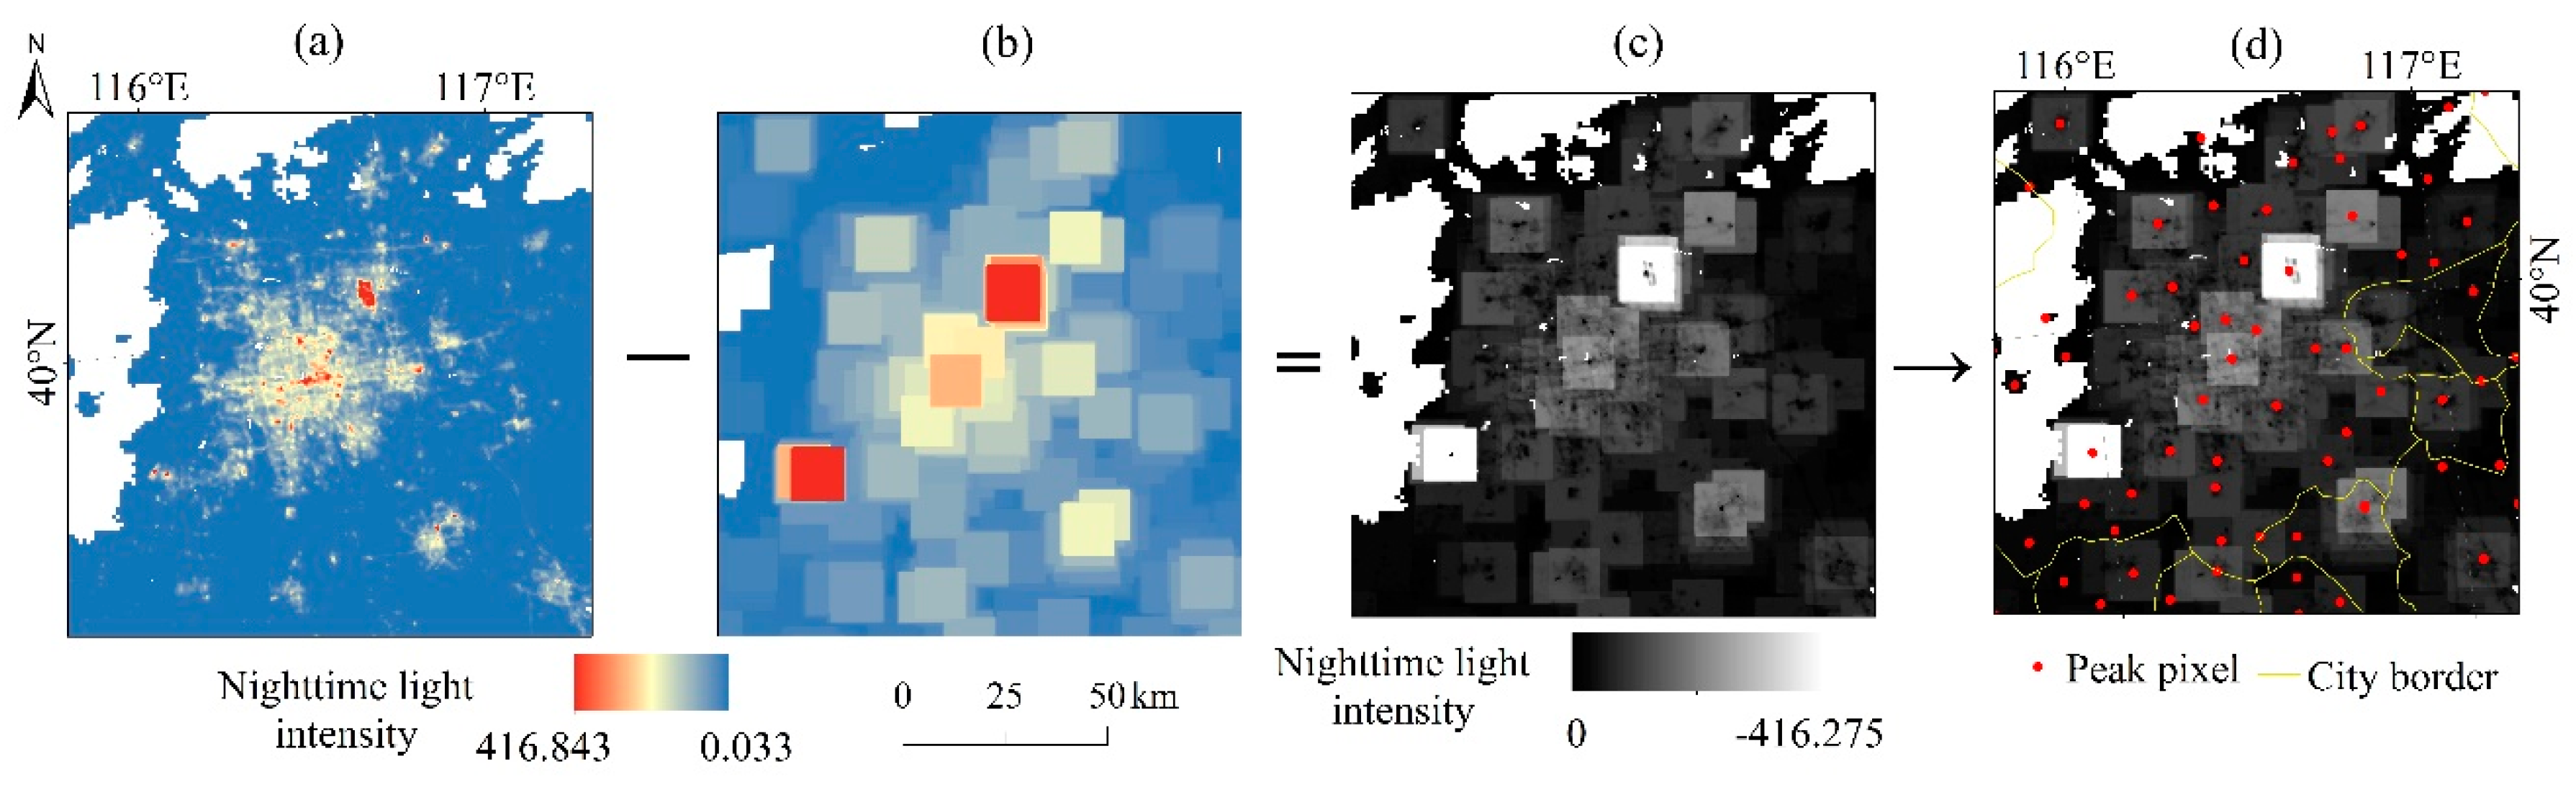
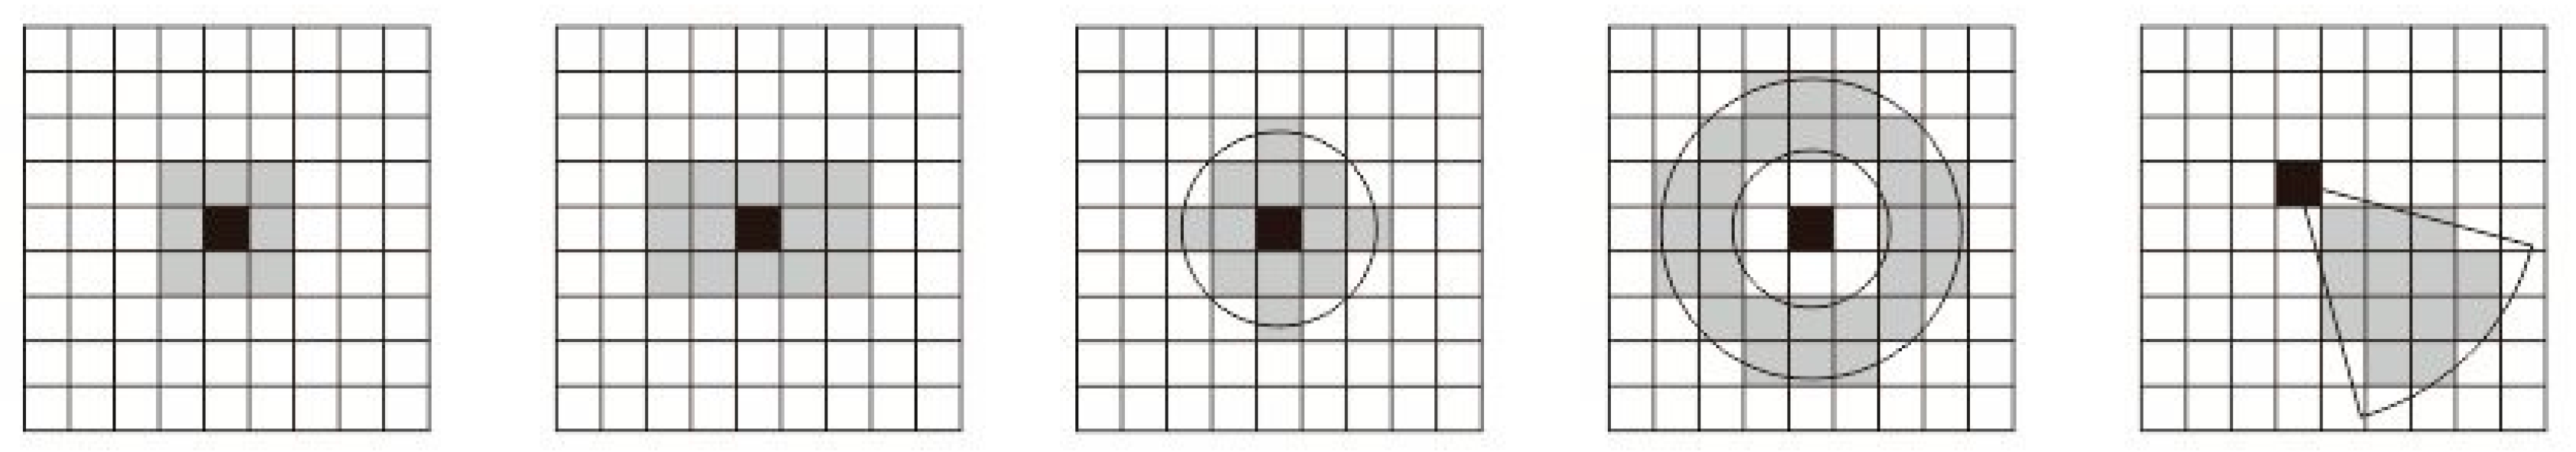
3.2.1. Extraction of Peak Pixels Based on Terrain Analysis

This study used the maximum neighborhood algorithm and the difference algorithm to extract the peak pixels with the largest nighttime light intensity within a limited spatial range. Figure 4 reflects the main process of extracting the peak pixels: subtract the pixel values of Figure 4b from the pixel values of Figure 4a to Figure 4c, and then extract Figure 4d according to Figure 4c. The detailed calculation process is described below.
The neighborhood refers to an area composed of several pixels adjacent to the target pixel in space and centered on the target pixel whose spatial extent is determined by the window size. Neighborhood windows in raster operations generally have rectangular, circular, ring, or fan shapes (Figure 5). To maintain neatness and avoid cutting the grid, 49 square windows with sizes of 3 × 3, 5 × 5, 7 × 7, ..., 25 × 25, ..., 99 × 99 were selected as potentially suitable windows for the maximum neighborhood algorithm.
The neighborhood algorithm iterated through all pixels in the nighttime light image, calculated the raster properties of the specified neighborhood range based on the limited window size, and moved the window continuously until the entire raster image was calculated. The maximum neighborhood algorithm assigned the maximum value of the nighttime light pixels in the neighborhood to all nighttime light pixels in the neighborhood. In the 3 × 3 window, the maximum neighbor algorithm compared the size of the center pixel with the values in the eight neighboring pixels. If the center pixel had the largest value, that value was assigned to the eight neighboring pixels; if one pixel among the eight neighboring pixels had the largest value, that value was assigned to the seven neighboring pixels. Such discriminations and assignments were performed pixel by pixel until all pixels were traversed in the nighttime light image. Since the operations between the neighborhood windows overlapped, the pixels after a certain operation could also be included in the neighbors of other pixels to be processed. Due to such characteristics, the neighborhood algorithm judged all pixels in the raster image and ensured the accuracy of the output result. Therefore, to traverse the nighttime light image pixels and output the result image with the peak pixels located in the center of the neighborhood, this study chose the following maximum neighborhood algorithm:
P out = max ( P 1 , P 2 , , P n )
where P out is the output value of the center pixel; ( P 1 , P 2 , P n ) are the values of pixels in the neighborhood of the limited window; and n is the number of pixels, which is determined by window size.
After the maximum neighborhood algorithm, the peak pixel value did not change, while the values of other pixels within the window range increased. Therefore, the difference calculation was performed on the data before and after the maximum neighborhood algorithm, and pixels with value of zero were the peak pixels that this research aimed to extract.

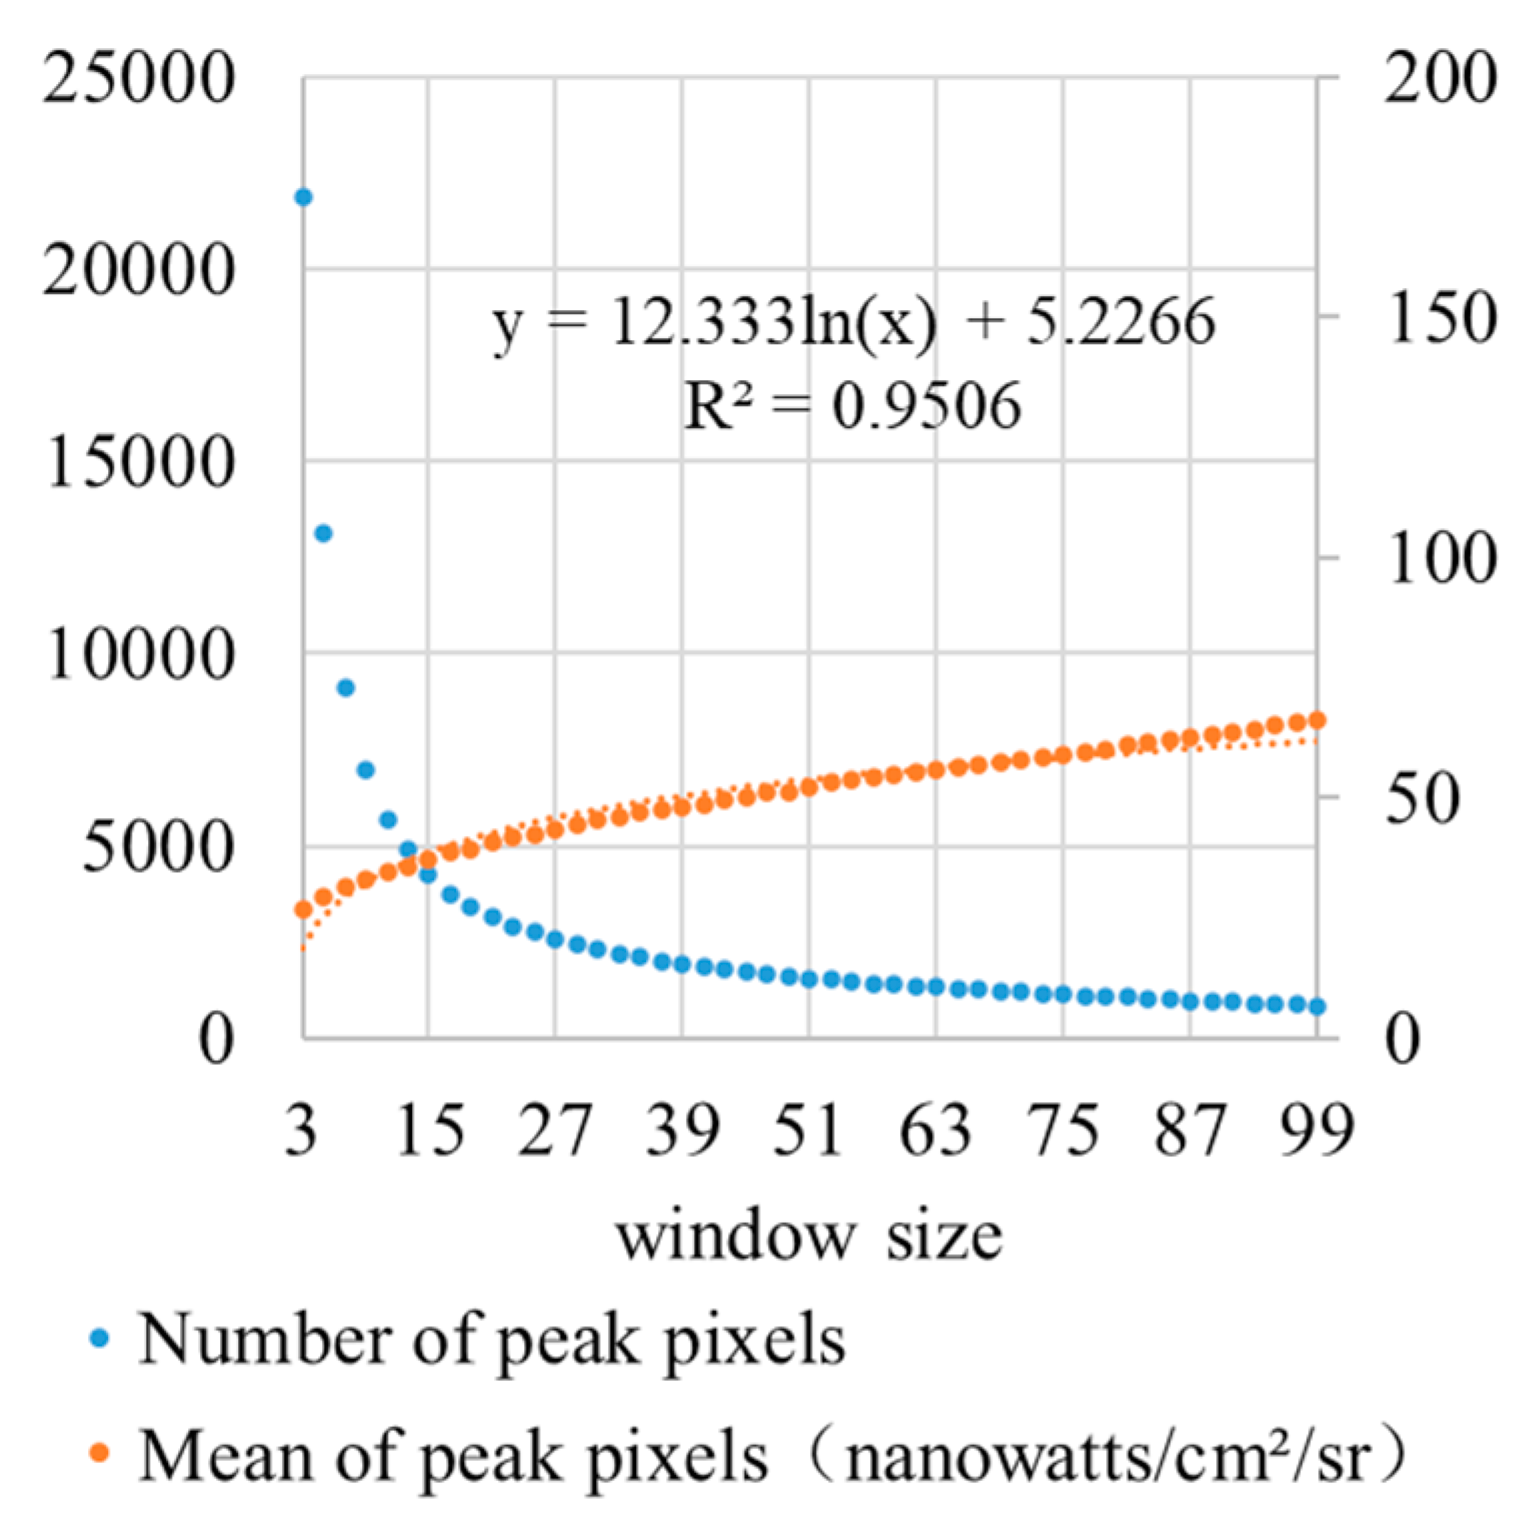
3.2.2. Determination of the Suitable Window Size for the Neighborhood Algorithm

The window size of the neighborhood algorithm limits the spatial range of the data involved in the calculation [57], which will directly affect the extraction results of the peak pixels. If the window size of the neighborhood algorithm is inconsistent, small cities will use small windows, while large cities will use large windows. Then, the number of peak pixels extracted may be the same, but the size of the neighborhood space it represents can be different. Finally, it can affect the accuracy of the number and scope of urban centers. The larger the population size and built-up area of a city are, the more size-limited windows it can accommodate, and correspondingly, the more peak pixels it will generate. Peak pixels extracted by the maximum neighborhood algorithm can serve as a potential identification area for urban centers. The uniform window size ensures a uniform comparison space for nighttime light intensity. Cities in different stages of urbanization can obtain peak pixels that can reflect the characteristics of their own urban areas, thus ensuring the comparability of extraction results. Therefore, it is necessary to determine the most suitable window size for the maximum neighborhood algorithm [58] so that the extracted nighttime light peak pixels in the city are reasonable, and the number and attribute characteristics of urban centers are comparable. For the above reasons, this paper used a uniform window size to extract peak pixels in all cities of China. The window size and the average nighttime light brightness of the peak pixels extracted with the corresponding window size can fit a significant logarithmic function curve (Figure 6), and this study analyzed the window size corresponding to the change point on the curve from steep to slow.
The mean change point method is a statistical method for processing nonlinear relationship data, most effective for tests with a unique change point. In Xinjiang [59], the Qinghai–Tibet Plateau [60], and other regions with large spatial ranges and marked differences in surface relief, this method was often used to determine suitable window sizes for terrain analysis. Because nighttime light images have similar “terrain” features as the DEM, this study used the mean change point method to determine the appropriate window size for the peak pixels of nighttime light intensity in the cities. The end of the time series in this study is 2017, and the latest urbanization dynamics can be reflected in this study according to the data in 2017. Therefore, based on the calculation results under different window sizes in 2017, this study determined the most suitable window size to extract peak pixels for Chinese cities and applied the window size to other years in the time series. The mean change point was calculated following the steps:
Step 1: Segmentation of the sample sequence. Peak pixels were obtained from a single nighttime light raster image, and its attribute value was the nighttime light intensity per unit area. The peak pixels were extracted with windows of different sizes in a specific city level form the data sequence T . The logarithm of T was taken to obtain the sample sequence X ( X = { x t , t = 1 , 2 ,   ,   49 } ). Then, i was used to divide the sample sequence X into x 1 , x 2 , ..., x i 1 and x i , x i + 1 , ..., x N .
Step 2: Statistical analyses. This study took i = 2, 3, N and calculated the arithmetic mean and statistics for each sample segment according to the following equations:
X ¯ = t = 1 N x t N
x i 1 ¯ = t = 1 i 1 x t N
x i 2 ¯ = t = i N x t N
S i = t = 1 i 1 ( x t x i 1 ¯ ) 2 + t = i N ( x t x i 2 ¯ ) 2
S = t = 1 N ( x t X ¯ ) 2
where X represents the sample sequence; X ¯ represents the mean of all sample values; N represents the number of samples, and it is 49 in this paper; x t represents the t-th sample value; i represents the segmentation point of the sample X ; x i 1 ¯ represents the mean of sample values in the first segmentation; x i 2 ¯ represents the mean of sample values in the second segmentation; S i represents the segmented statistic; and S represents the original sample’s statistic.
Step 3: Calculation of the difference between the original sample’s statistic S and the segmented statistic S i . The existence of the change point increases the difference between S and S i . When the difference between the two reaches the maximum, the change point can be determined.

3.2.3. Extraction of Urban Centers

With the appropriate window size, the peak pixels of nighttime light can be obtained using the maximum neighborhood algorithm on the nighttime light images in the cities. Since the peak pixel identifies a location where human activities are significantly active within a certain spatial range, the peak pixel within the urban areas identifies the potential location of the urban center. Therefore, this paper superimposes the extracted peak pixels on the land cover of the urban built-up area to obtain the peak pixels in urban areas. A time series correction for some outliers in the interannual variations in the peak pixels was performed, and the urban center points in cities were finally identified. In specific, the following steps were taken:
Step 1: Filtering the peak pixels in urban areas. Since the extraction of peak pixels is based on nighttime light images in all areas of China, some high-intensity nighttime light pixels that are not in urban areas will be identified. The built-up area from MCD12Q1 land cover data was used as a mask to extract the peak pixels in the urban areas. However, due to differences in algorithms and spatial resolution, there are some difference between the built-up area of MCD12Q1 and the actual built-up areas in Chinese cities [6], especially in small cities with limited built-up areas. To ensure the result accuracy, this study extracted the peak pixels that are spatially included and are in close proximity to the urban land cover data in the corresponding year. Our experiments found that the peak pixels extracted within the urban boundary or within a 3 km buffer zone outside the urban boundary were basically located in the urban built-up areas. Therefore, this study considered the peak pixels that had been screened according to the urban built-up areas as the urban centers.
Step 2: Correction of the urban center data. The maximum neighborhood algorithm was used to calculate the values for all pixels by moving the calculation window, and the position with the highest intensity of nighttime light in the spatial range was finally determined. When another high-intensity source of nighttime light appeared in the neighborhood of an urban center, the original position of the nighttime light peak was deprived. When the neighborhood algorithm gradually moved to the surrounding pixels, the peak pixel position also moved accordingly. When the algorithm moved beyond the boundaries of the administrative divisions of the city, the peak pixels of the city cannot be monitored, nor the center of the city. In particular, in cities with high brightness in surrounding cities but low brightness in their own centers, the number and spatial distribution of their extracted urban centers were not continuous in the interannual sequence.
In general, a monocentric city can develop into a polycentric city, and a polycentric city with only two centers can also become a monocentric city. However, for a city that has developed a central structure, in reality, there is almost no situation in which its center completely disappears. A monocentric city will maintain the existing number of centers or develop into a multi-center structure. In the development of polycentric cities, there may be alternating growth among multiple centers, which is manifested by the increase or decrease in the number of centers. This study considered that the centers of cities, with only one or two centers, will not disappear completely—that is, once only one center or two centers of a city are monitored, they will not disappear in subsequent years. Therefore, for a city with only one or two centers, if it is detected that its center point completely disappears in the following year, it is necessary to perform time series correction on the anomaly of city centers. Based on the dynamics of the number of urban centers (Table 2), this paper performed time series correction from 2012 to 2017 for cities with one or two centers that completely disappeared in the next year. For multi-center cities with two or more centers whose number of centers did not decrease to zero, the slight fluctuations in the number and location of centers were considered to be normal evolutionary features, so time series correction is unnecessary for these cities.

3.3. Accuracy Assessment

Differences in spatial scale, number of target cities, and extraction methods may cause subtle differences in the results of urban centers. To verify the result accuracy, this study validated the overall quantitative characteristics and spatial location of urban centers in China on a multilevel scale with reference to the existing research results [29,37,38,61,62] and Google Earth high-resolution remote sensing images.

4. Results

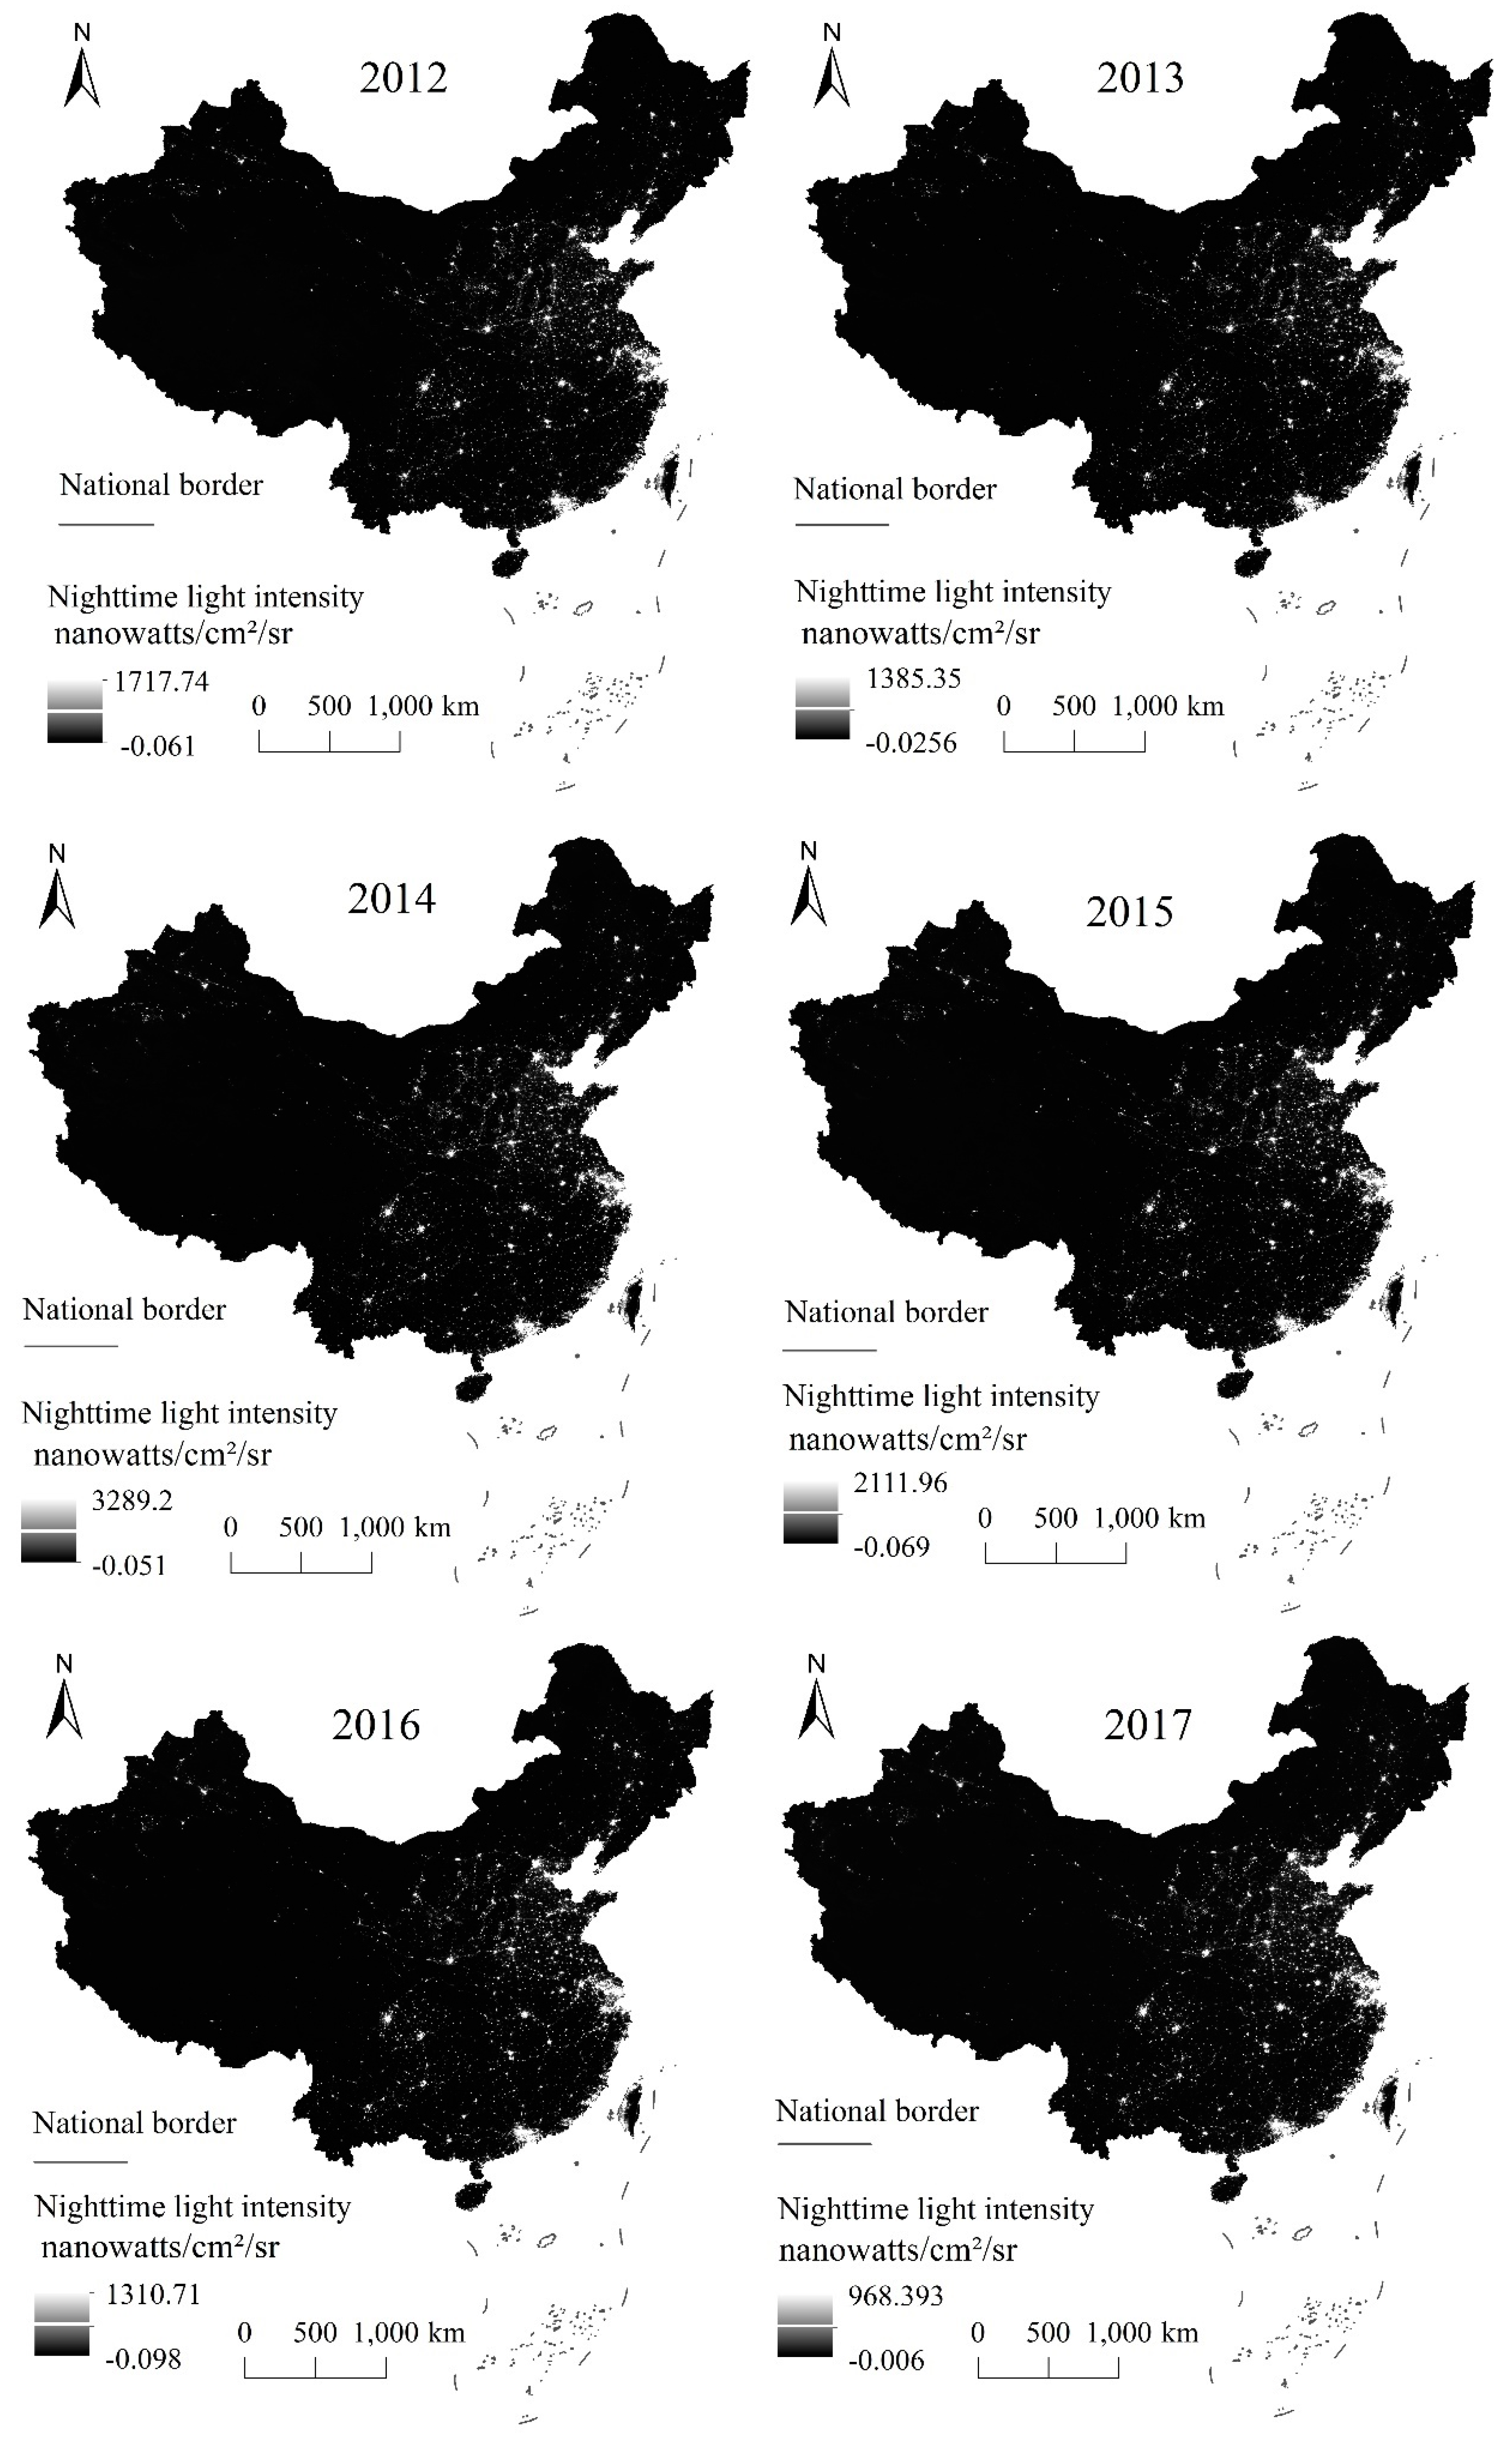
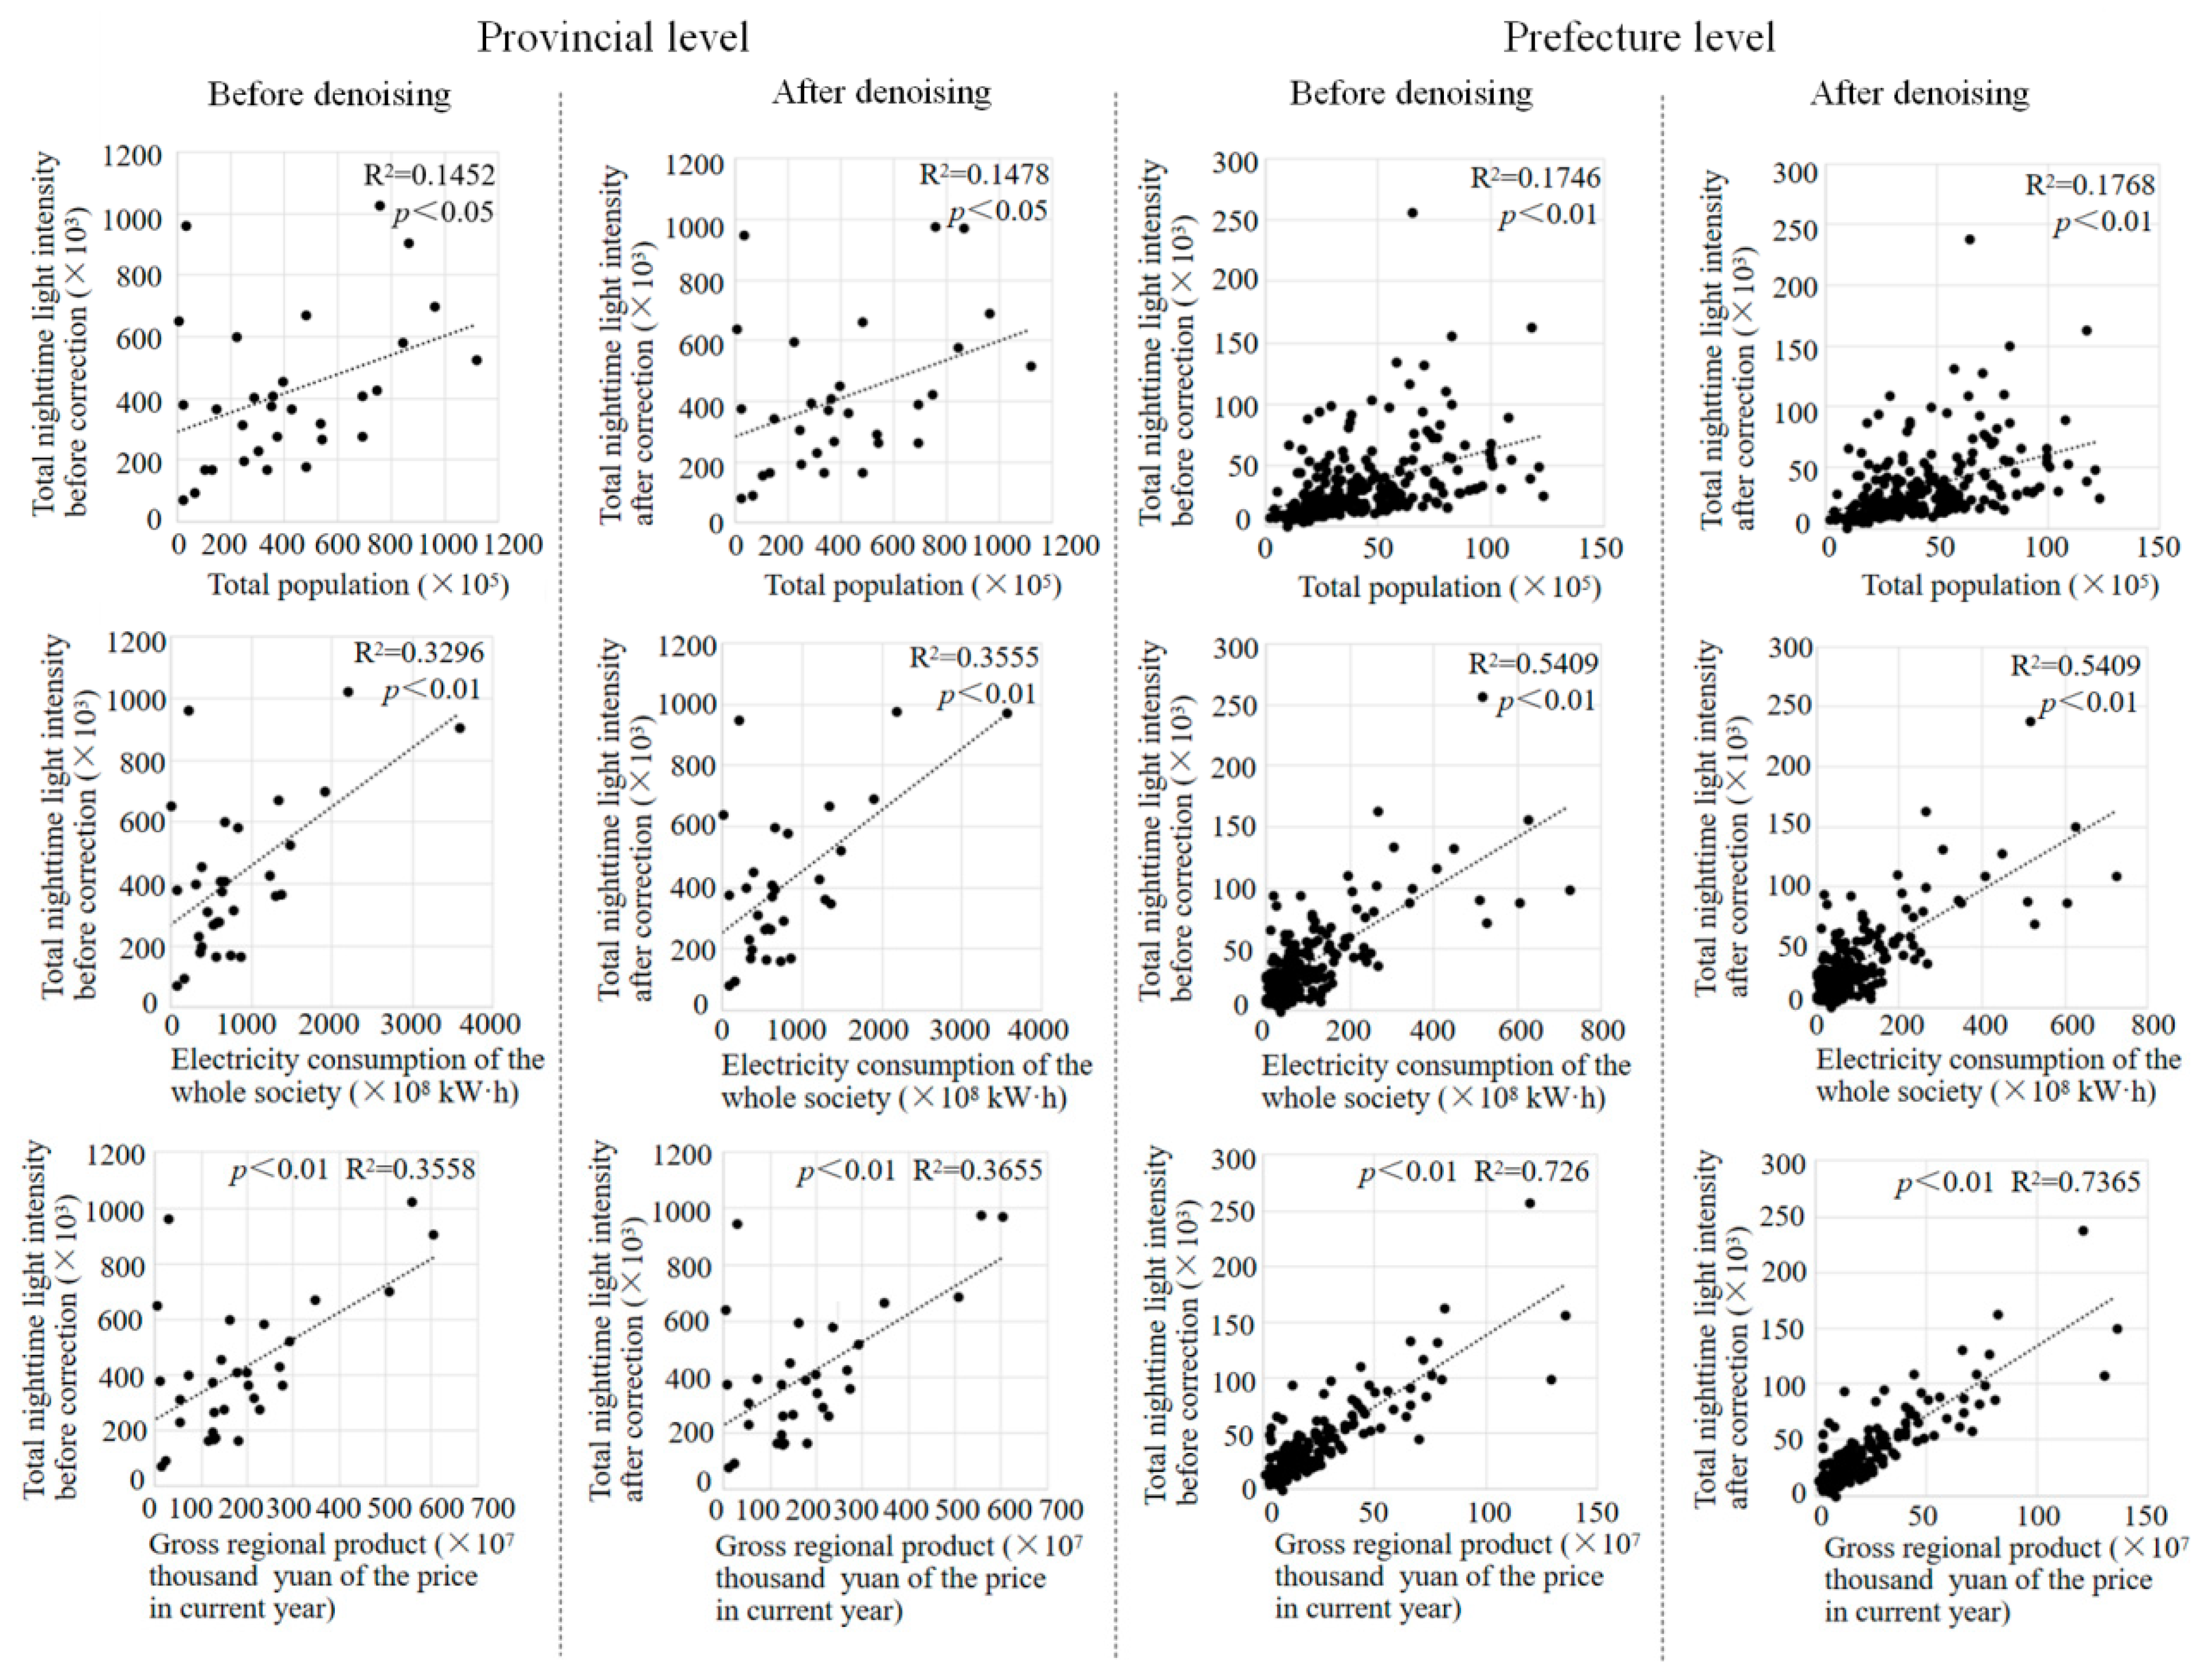
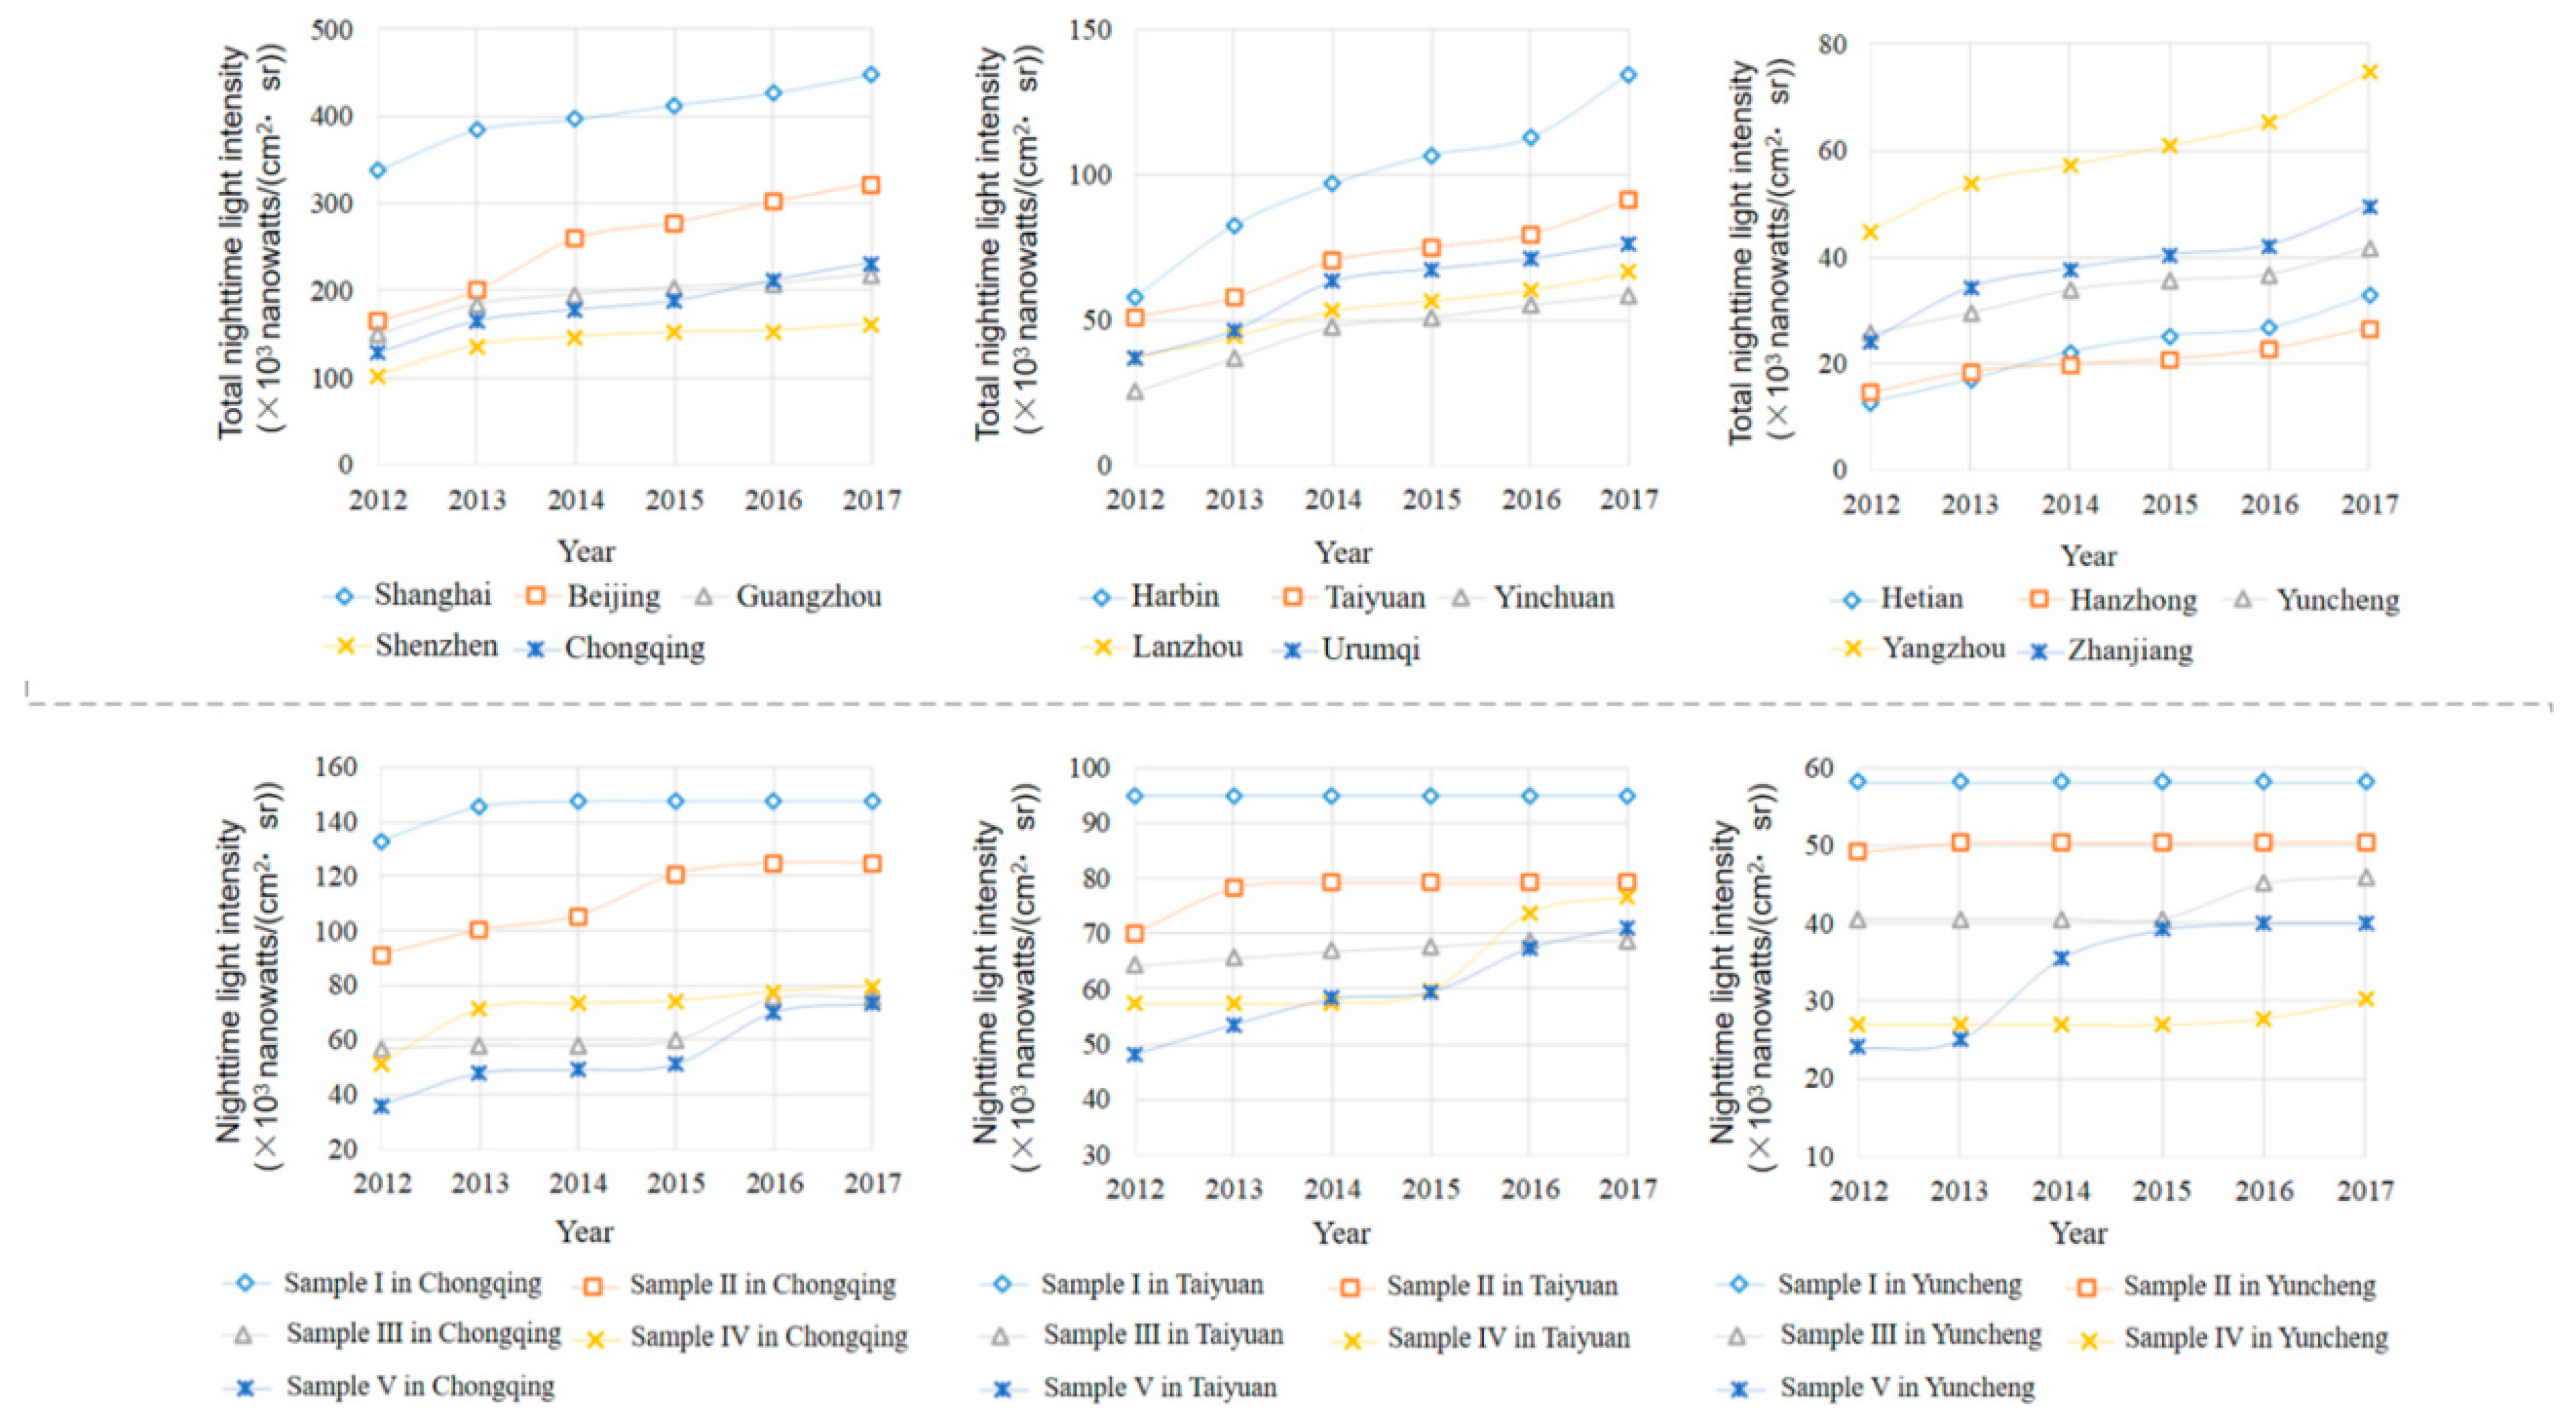
4.1. Preprocessing Results of NPP-VIIRS Data

After image synthesis, reprojection, resampling, and cropping, the NPP-VIIRS nighttime light images of China in 2012–2017 are shown in Figure 7.
At the provincial level with 31 units and the prefecture level with 244 units, this study calculated the square of the correlation coefficient (R2) between the total nighttime light intensity and three socioeconomic indicators (the year-end total population, gross regional product, and electricity consumption of the whole society) in 2012 (Figure 8). At the provincial level, the R2 of the total nighttime light intensity calculated with the data without denoising and the year-end total population, gross regional product, and electricity consumption of the whole society were 0.1452, 0.3296, and 0.3558, respectively. R2 of the total nighttime light intensity calculated with the denoised data and the year-end total population, gross regional product, and electricity consumption of the whole society were 0.1478, 0.355, and 0.3655, respectively. It is clear that the three sets of R2 values calculated using the denoised data were larger than those using the undenoised data. Specifically, the three sets of R2 increased by 1.79%, 7.86%, and 2.73%, respectively. Compared with the correlation analysis results at the provincial level, the correlation results at the prefectural level improved markedly. At the prefectural level, the three sets of R2 values calculated with the denoised data were also larger than those calculated with the data without denoising, and R2 increased by 1.26%, 1.07%, and 1.45%, respectively. At both the provincial and prefecture levels, compared with the original data, the NPP-VIIRS nighttime light data after denoising exhibited a better correlation with the three socioeconomic indicators and can better characterize human activities and socioeconomic parameters, showing the effectivity of removing background noise.
To test the interannual correction results, this study separately calculated the total nighttime light intensity of the cities at different socioeconomic development levels and collected random samples for testing in Chongqing (municipality), Taiyuan (provincial capital city), and Yuncheng (prefecture-level city) (Figure 9). The continuity of the interannual change shows good results regardless of whether the cumulative values of the pixels at the multiregional scale or single pixels were used.

4.2. Identification of Urban Centers

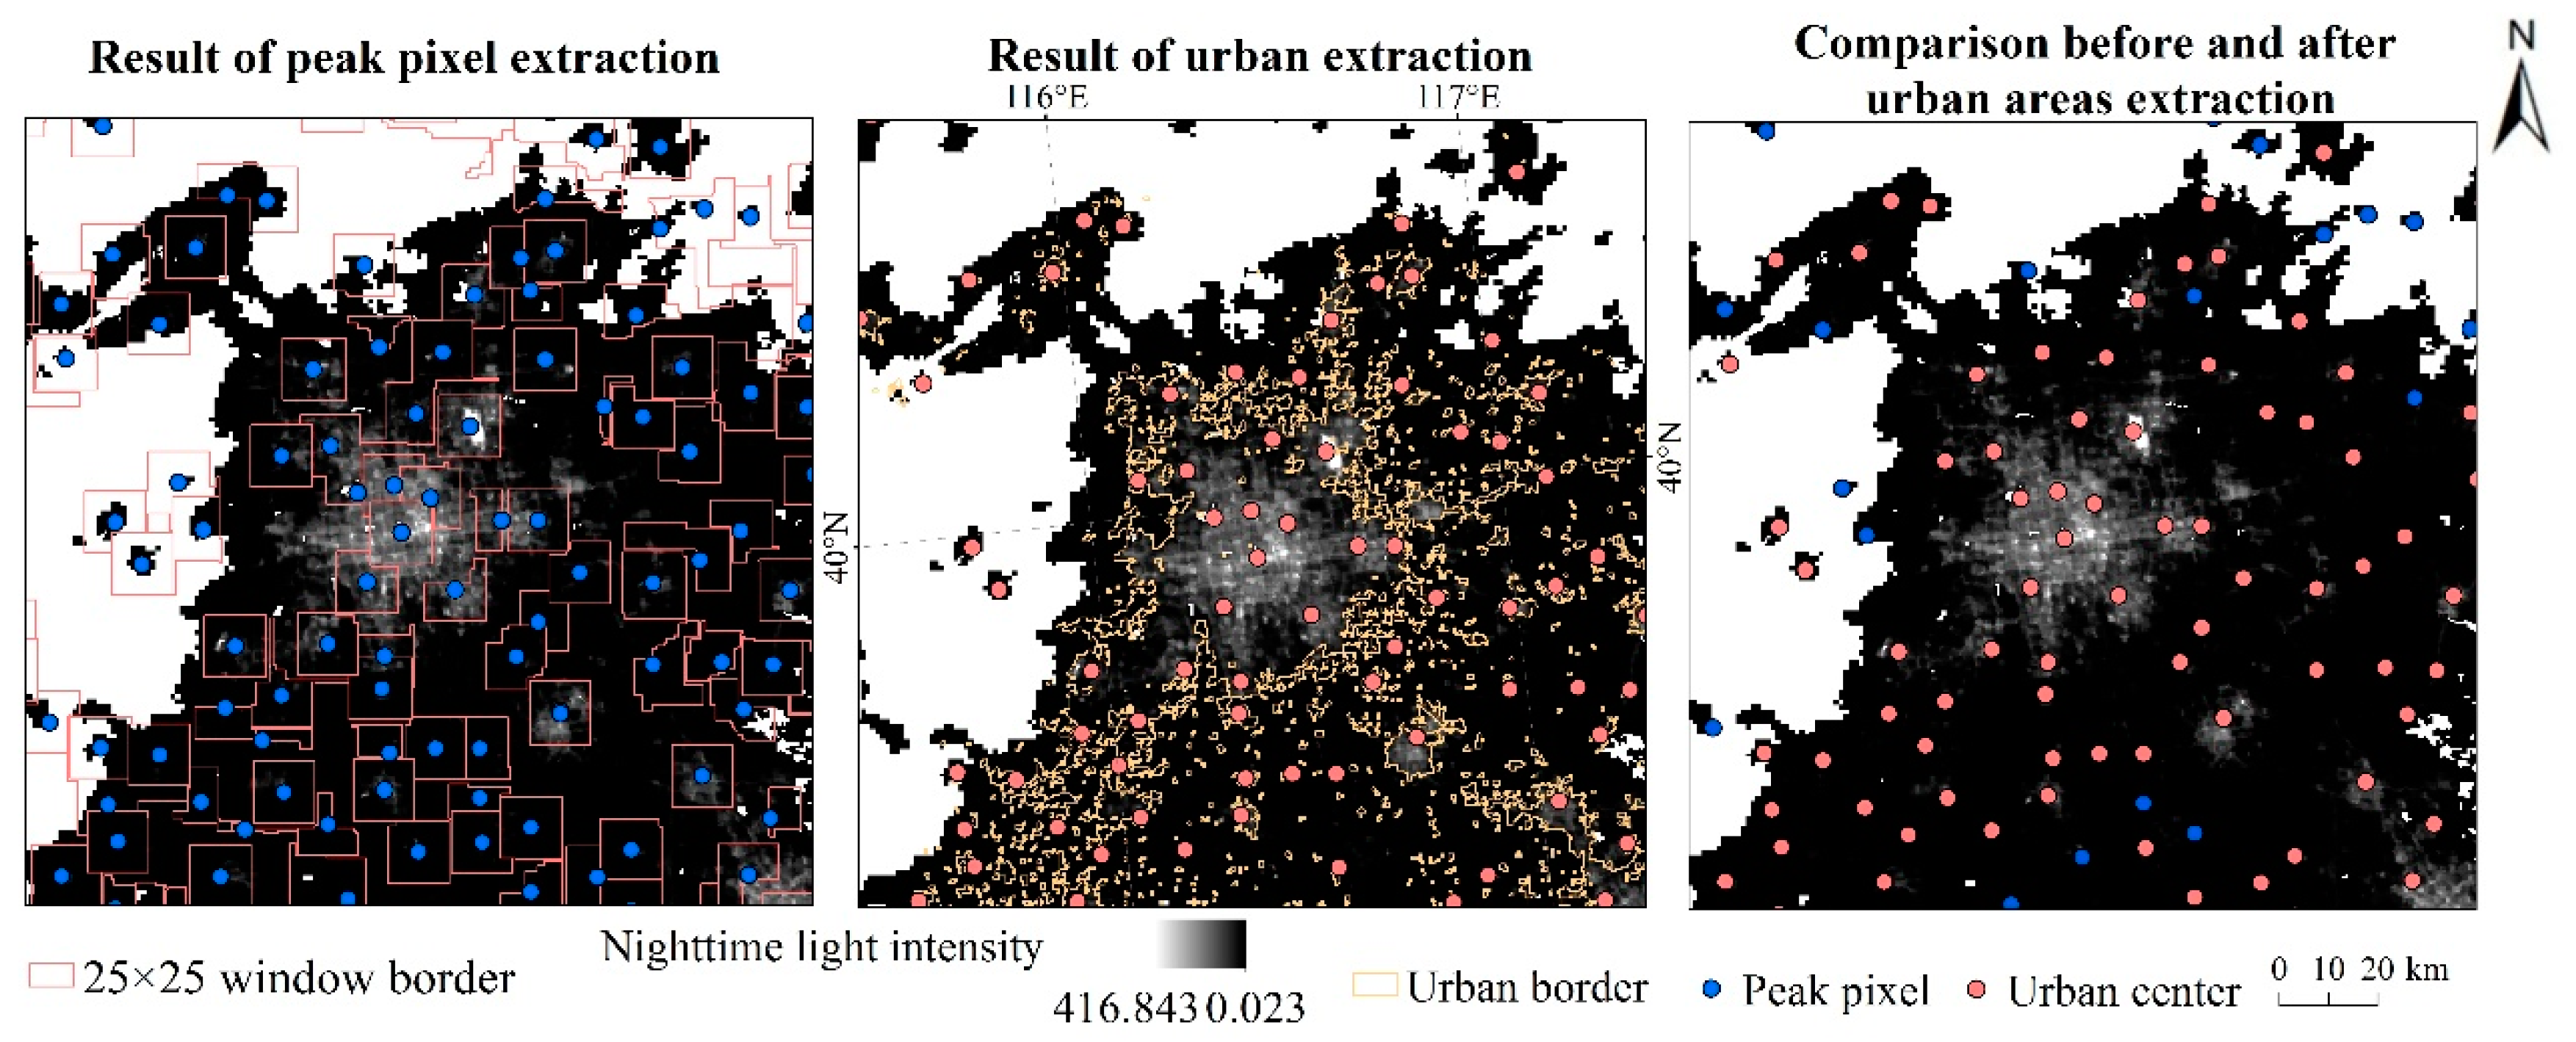
4.2.1. Extraction Results of Peak Pixels

As shown in Figure 10, based on NPP-VIIRS data, 49 window sizes were selected for the maximum neighborhood algorithm. The peak pixels of Chinese cities under different window sizes were obtained, and the number of peak pixels and the attributes of nighttime light intensity were counted. The number and brightness characteristics of the nighttime light peak pixels in cities were combined.
In terms of the quantitative characteristics of nighttime light peak pixels, overall, as the size of the window increased, the number of peak pixels in Chinese cities showed a decreasing trend with the power function. This decreasing trend can be roughly divided into a sudden decrease at small window sizes and a slow decrease at large window sizes. When the window size increased until it covered the entire city, the number of peak pixels decreased until the only peak pixel that represented the largest brightness value for the entire city was left. Specifically, the expansion of a small window caused a marked reduction in the number of peak pixels, while the expansion of a large window caused only a slight reduction in the number of peak pixels. When the window size of the neighborhood algorithm was small (i.e., the neighborhood spatial range was small), there were fewer horizontal comparisons among the nighttime light pixels, and a large number of neighborhood spaces were formed in the city. When a large number of peak pixels were generated, these peak pixels represented only a small neighborhood space covered by a smaller window. When the window size of the neighborhood algorithm increased (i.e., neighborhood space range increased), the number of horizontal comparisons among the nighttime light pixels increased. When the number of neighborhood spaces within a limited city reduced, the value of a peak pixel with a small brightness value was replaced by the value of a peak pixel with a high brightness value, and the number of peak pixels reduced accordingly.
In view of the brightness characteristics of nighttime light peak pixels, when the window size increased, the brightness of peak pixels in cities showed an increasing trend with the power function. This increasing trend can be roughly divided into a sudden increase at small window sizes and a slow increase at large window sizes. When the window size increased until it covered the entire city, the brightness of peak pixels increased until only the peak pixel that represented the largest brightness value for the entire city was left. In specific, the expansion of the small window caused a marked increase in the brightness of peak pixels, while the expansion of the large window caused only a slight increase in the brightness of peak pixels. When the window size of the neighborhood algorithm was small (i.e., the neighborhood spatial range was small), there were fewer horizontal comparisons among the nighttime light pixels, and a large number of neighborhood spaces were formed in the city. As a result, a large number of peak pixels with comparatively low brightness values were extracted. When the window size of the neighborhood algorithm increased (i.e., the neighborhood space increases), there were more horizontal comparisons among the nighttime light pixels in a large neighborhood spatial range. The values of the peak pixel with a small brightness value were replaced by the value of the peak pixel with a high brightness value. Finally, the brightness values of the extracted peak pixels increased.

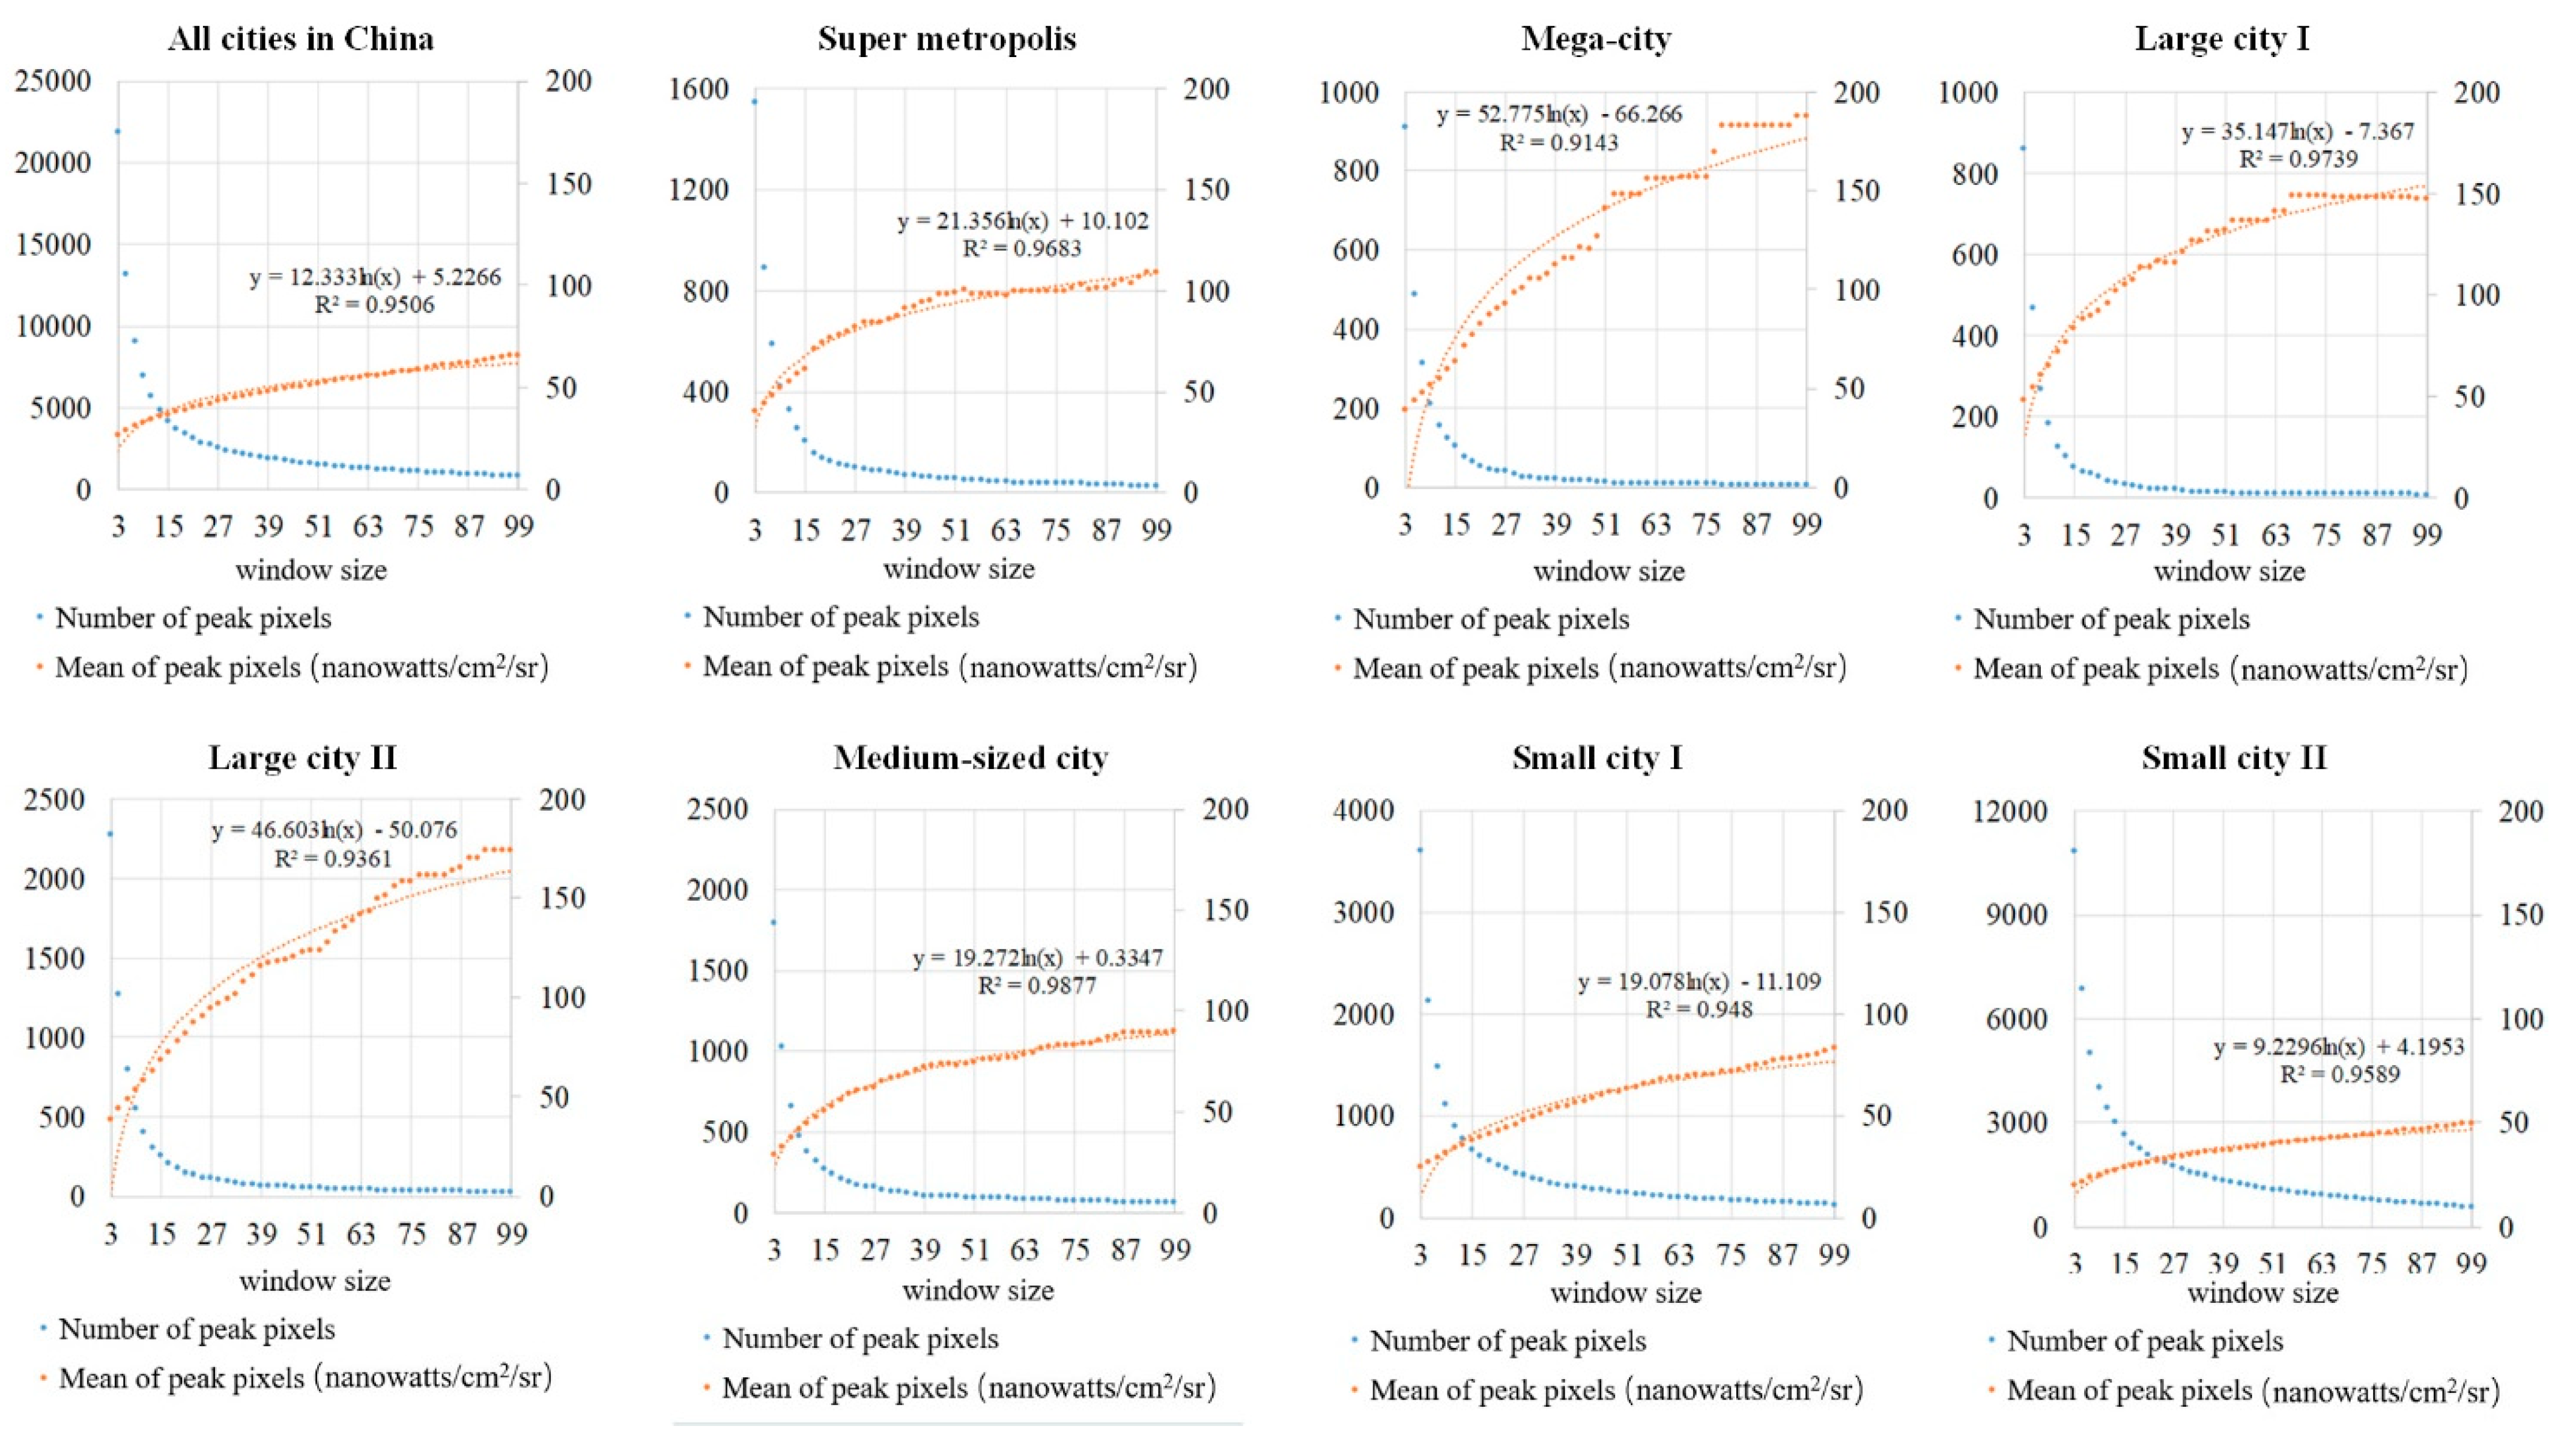
4.2.2. Suitable Window for the Neighborhood Algorithm

Based on the mean change point method, this research determined the change point on the logarithmic function curve, which reflects the relationship between the window size for the neighborhood algorithm and the average brightness of the extracted peak pixels of Chinese cities in 2017. As shown in Table 3, when i is 12 (that is, the twelfth window size), the difference between S and S i reaches the maximum. In this paper, the twelfth window size corresponds to 25 × 25, so the rectangular area of 25 × 25 pixels is a suitable window for the extraction of peak pixels in Chinese cities.
In the NPP-VIIRS images with a spatial resolution of 500 m, a 25 × 25 pixel window for the neighborhood algorithm frames a rectangular area of 12.5 km × 12.5 km. In large cities with a clear polycentric structure, the population and industry are clustered in multiple and scattered urban centers [63], and the nighttime light peak pixels are somewhat scattered in the whole city. These cities tend to have a larger urban built-up area, more permanent urban residents, a larger range of nighttime light, and a greater intensity of nighttime light [32]. Therefore, these cities can accommodate a large number of neighborhood algorithm windows and peak pixels. However, for cities with underdeveloped polycentric structures, the population is mostly concentrated in a limited number of urban centers whose locations are concentrated [64]. The spatial distribution of peak pixels in these cities is mostly concentrated, and the numbers of windows and peak pixels that these cities can accommodate are relatively small.

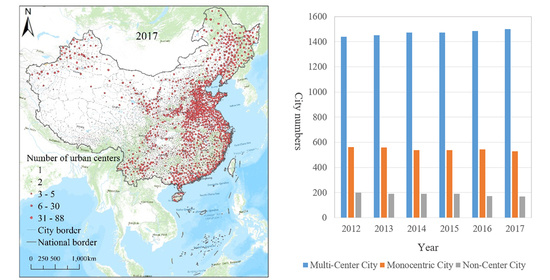
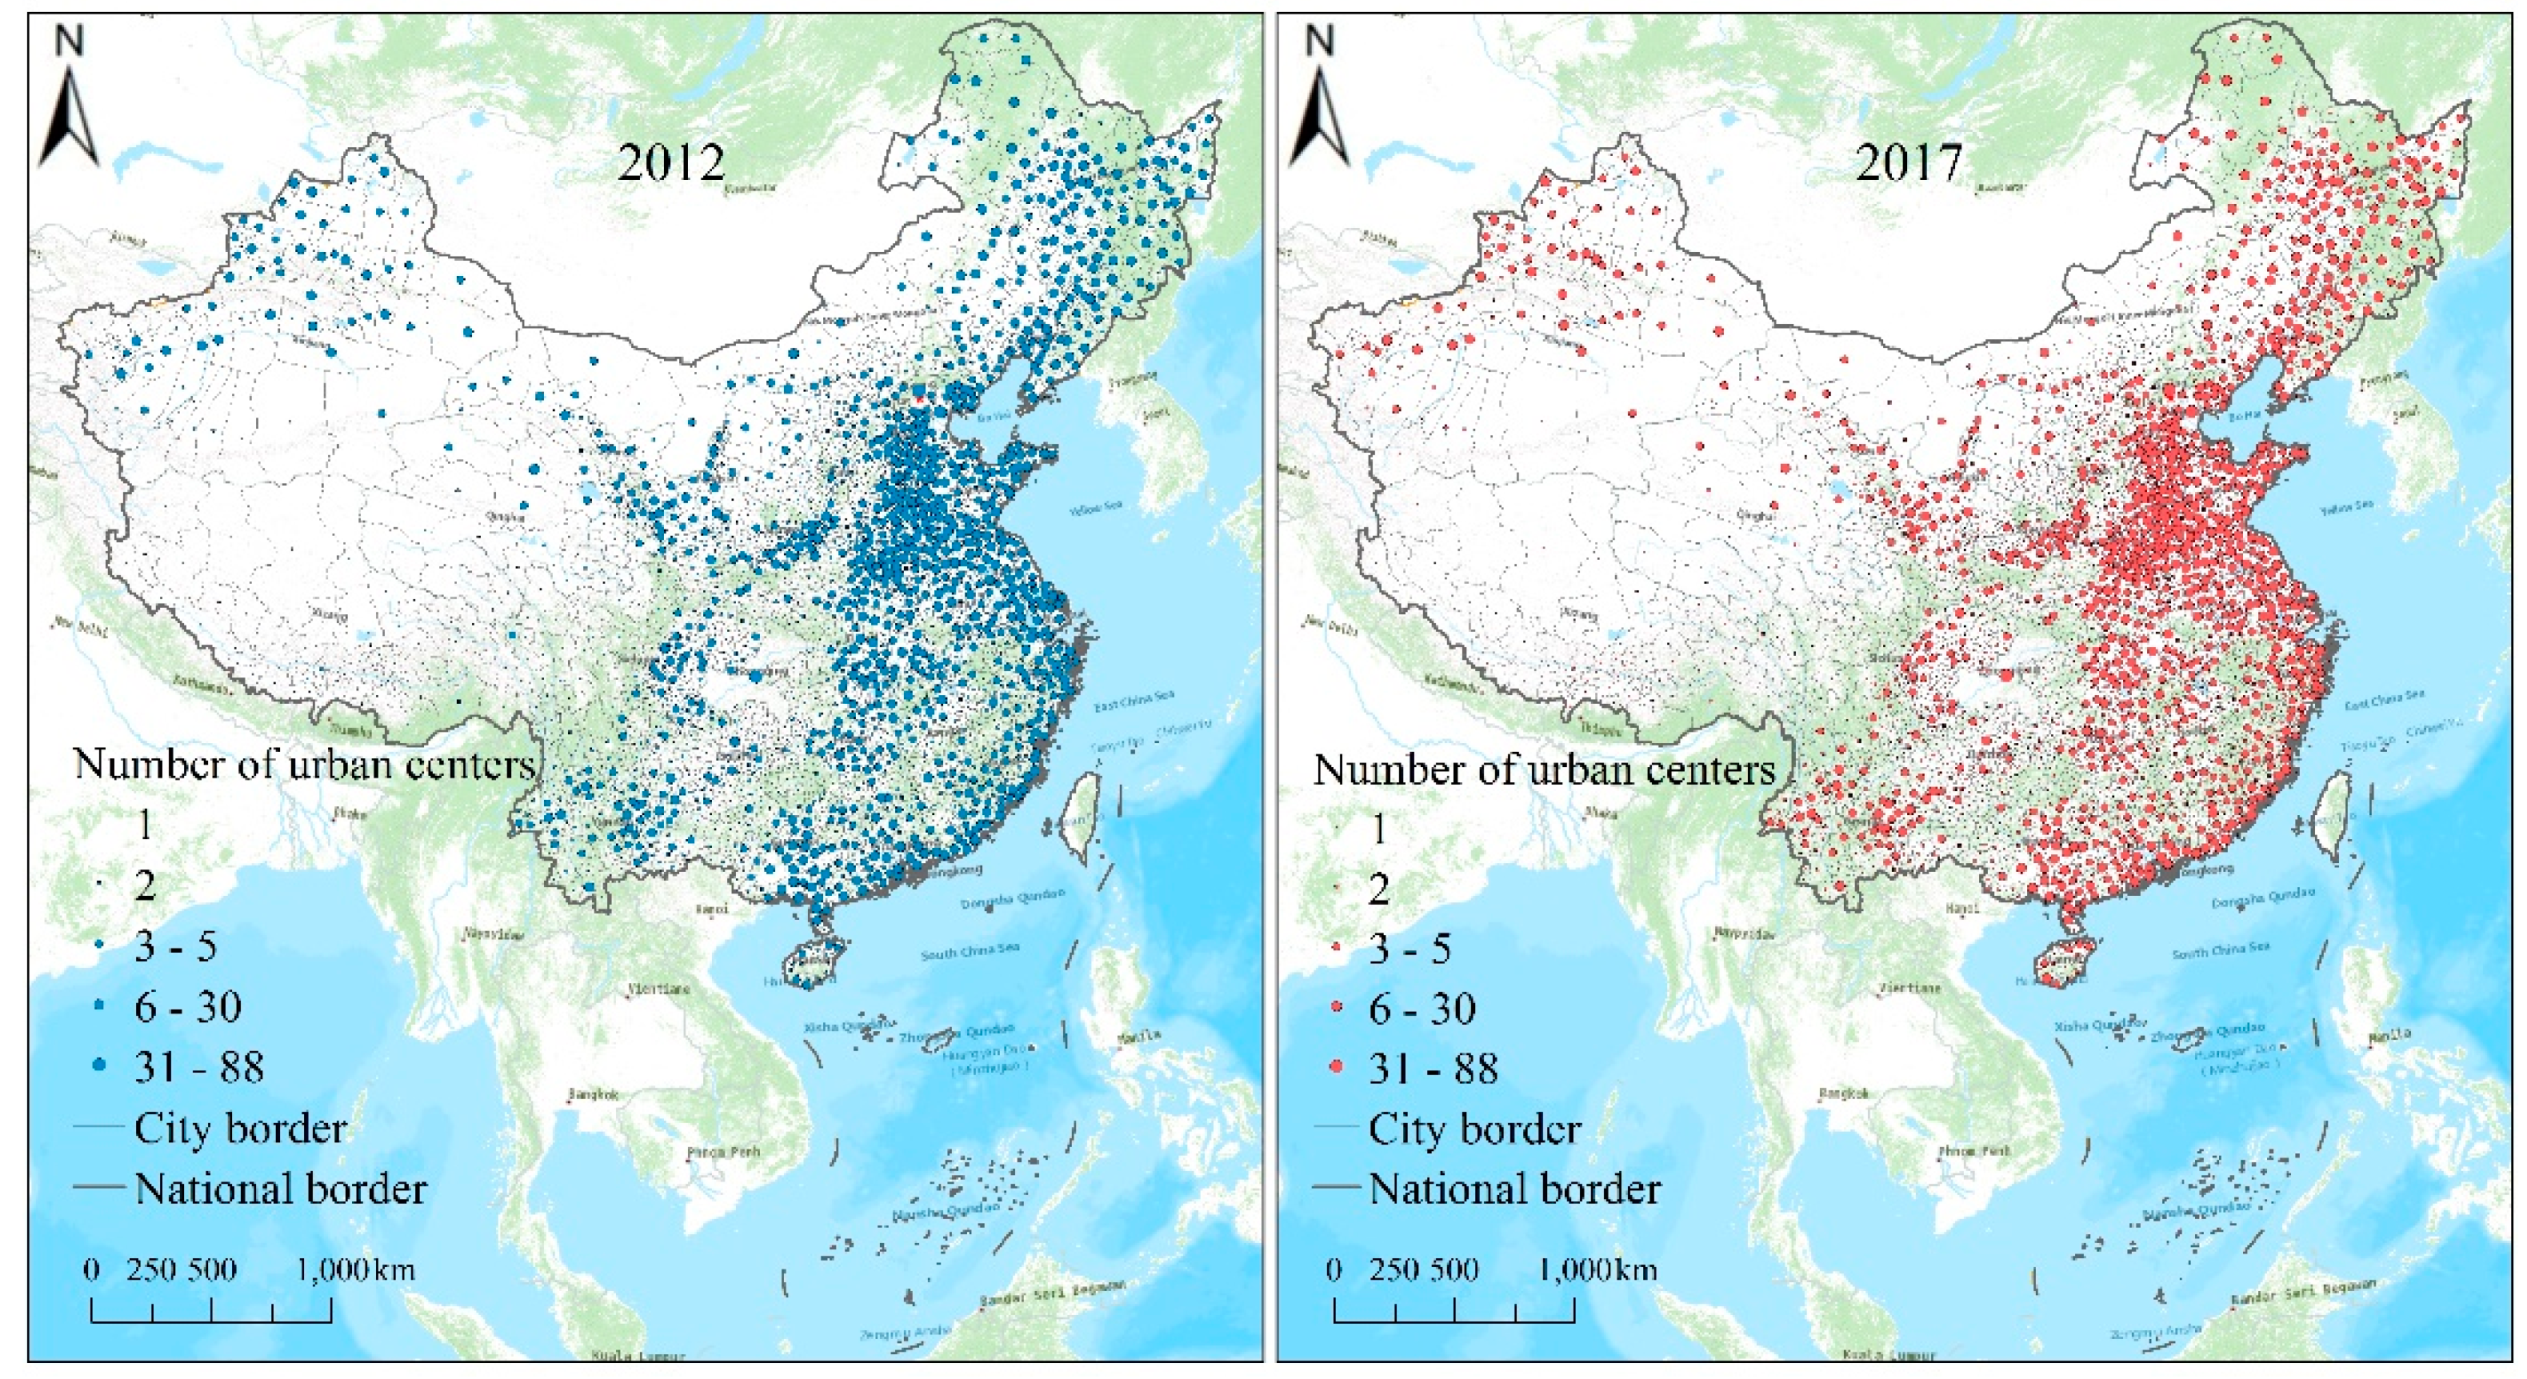
4.2.3. Extraction Results of Urban Centers

Figure 11 shows the screening results of peak pixels in urban areas in Beijing. After the maximum neighborhood algorithm and difference calculation were employed based on the 25 × 25 window, this study obtained the peak pixels of the nighttime light intensity in China from 2012 to 2017. After the superimposed screening with the urban built-up area, this study obtained the peak pixels within the urban areas, and it clearly indicated the locations of the cities where human activities were significantly high.
In this study, the peak pixels within the urban areas were identified as the urban centers. Using 2012 as the base data, the number of central points in each city in 2013 was compared with that in 2012, and results indicated that the central points of 12 monocentric cities disappear. Therefore, the unique central point data for these 12 cities in 2012 were assigned to these cities in 2013. Then, this study identified 20, 2, 16, and 17 monocentric cities that need to be corrected in 2014–2017. In terms of cities with two centers that disappeared in the following year, only 2 and 15 cities were found in 2013 and 2016, respectively. Therefore, the two centers of these cities monitored in the previous year were assigned to the following year. Then, this study extracted the urban centers in China that can reflect the continuous time series changes from 2012 to 2017 and counted the number of multi-center cities in China over the six years.
Table 4 and Figure 12 show the number and distribution of urban centers in China from 2002 to 2017. In general, the temporal variation and spatial distribution of Chinese urban centers showed two main characteristics. First, the number of urban centers in China grew slowly, and cities with multi-center structures increased annually. Second, there were large regional differences in the number of urban centers, and polycentric cities were mostly concentrated in northern China and the eastern coastal areas of China.
In terms of the temporal changes, the multi-center urban structure is the direction of China’s urban development. Non-center cities were constantly transformed into monocentric cities. Monocentric cities continued to form new center(s), and multi-center cities continued to grow. As of 2017, there were 7239 urban centers distributed in 2200 cities in China, with an average of approximately 3.3 urban centers per city. Approximately 68% of cities had two or more centers, the polycentric urban structure; approximately 24% of cities had only one city center, a typical monocentric structure; and approximately 8% of cities did not have urban centers.
The characteristics of polycentric structure cities at various scales are obviously different. In terms of economic regions, the proportion of polycentric cities in each region showed the following pattern: eastern region > northeast region > central region > western region. The proportions of monocentric and non-center cities were completely opposite to that of multi-center cities (east region < northeast region < central region < west region). In terms of city levels, cities at high levels are more likely to have the polycentric structure. In 2017, all super metropolises (four cities), mega-cities (five cities), and large cities I (ten cities) were polycentric. When the urban hierarchy decreased from large cities II (56 cities), the proportion of cities with a multi-center structure shrank. In the meantime, the lower the urban hierarchy was, the higher the proportion of cities with mono-center and non-center structures was (Table 5).

4.3. Accuracy Assessment

4.3.1. Accuracy Assessment Based on the Results of Existing Studies

In terms of the number of multi-center cities and the number of urban centers in subregions, our results are comparable with the previous results [38,61,62]. Notably, however, the smallest scale of this research is county-level cities, so a larger number of cities were analyzed in the current study. In addition, this paper focused on analyzing the proportion difference of cities with various central structures.
Liu and Wang [61] identified the polycentric morphology of 364 Chinese cities at or above the prefecture level in 2012 and found that 318 cities had a central structure. Among the 318 cities, the number of non-center, monocentric, and multi-center cities accounted for 13%, 37%, and 50% of the total number of cities, respectively. Based on the population density LandScan data in 2014, Li et al. [62] identified 337 Chinese cities at or above the prefecture level, and their monitoring results showed that 31 cities (accounting for approximately 9% of the total number of cities) in western China did not have urban centers. The above two studies were conducted in Chinese cities that were at or above the prefecture level and covered a large spatial scale. Their research results confirmed that the multi-center structure had become the development model for nearly half of Chinese cities at or above the prefecture level, and cities with no center structure existed in West China. Similarly, the extraction results of the current study show that the proportions of non-center, monocentric, and multi-center cities in China in 2012 were 9%, 26%, and 65%, respectively. In 2014, the proportion of non-center cities in China was 8.6%, which was consistent with the conclusions of the above two studies.
Based on the annual NPP-VIIRS nighttime light data in 2015, Luo and Li [38] identified 289 Chinese cities at or above the prefecture level. They found that 181 cities had a polycentric structure, around 63% of the cities that they studied. Similarly, the current study extracted 1473 polycentric cities, approximately 67% of 2200 researched cities. Luo and Li [38] also found that the number of urban centers increased with the city level from small city II to mega-city. As shown in Table 6, the similar relationship between the city levels and the numbers of centers was found in this study in the eastern, central, and western regions. However, there are some differences in the number of centers in small cities I and II in northeastern China between the current study and Luo and Li [38]. This difference is mainly due to the fact that this paper used the spatial neighborhood algorithm method to identify the most significant areas of human activity in the square space with a side length of 12.5 km. In small cities I and II with developed heavy industry in northeastern China, the factory areas can be easily captured and recognized as the urban center because of its high nighttime light brightness in the neighborhood. Luo and Li [38] used the percentage threshold method at the prefecture-level city scale, while this method filtered out centers in some areas where the light brightness was strong but the overall brightness did not reach the top 10% of the city brightness. Compared with previous results, the number of urban centers identified in this research was relatively higher in small cities in northern China and northeastern China, mainly because of the differences in methods.
On the city scale, the spatial accuracy of the urban centers extracted in this study was compared with the locations of the urban centers identified in previous studies. Using the NPP-VIIRS nighttime light data from 12 months in 2014, Chen et al. [37] extracted 33 urban centers in Shanghai. With NPP-VIIRS nighttime light and social media location data from April 2015 to April 2016, Cai et al. [29] not only identified main centralized and continuous centers in Beijing, Shanghai, and Chongqing but also identified several subcenters in the three cities (10, 12, and 8, respectively). Figure 13 shows the results of the spatial superposition of the urban centers identified in this research and previous studies [29,37]. The comparison shows that the identification results of the urban center in this study are the most extensive. Almost all urban centers identified in previous studies can be found in the current study. For example, in Shanghai, this study effectively identified the financial business centers such as Lujiazui and Hongqiao; transportation centers such as airports and railway stations in Pudong and Hongqiao; urban subcenters such as Qingpu District, Jiading District, Fengxian District, and Zizhu National High-tech Industrial Development Zone in Minhang District; and industrial centers such as Yuepu Industrial Park in Baoshan District, Gaoqiaozui Port in Pudong New District, and Wuhaogou Port and Yangshan International Trade Center in Jinshan District.

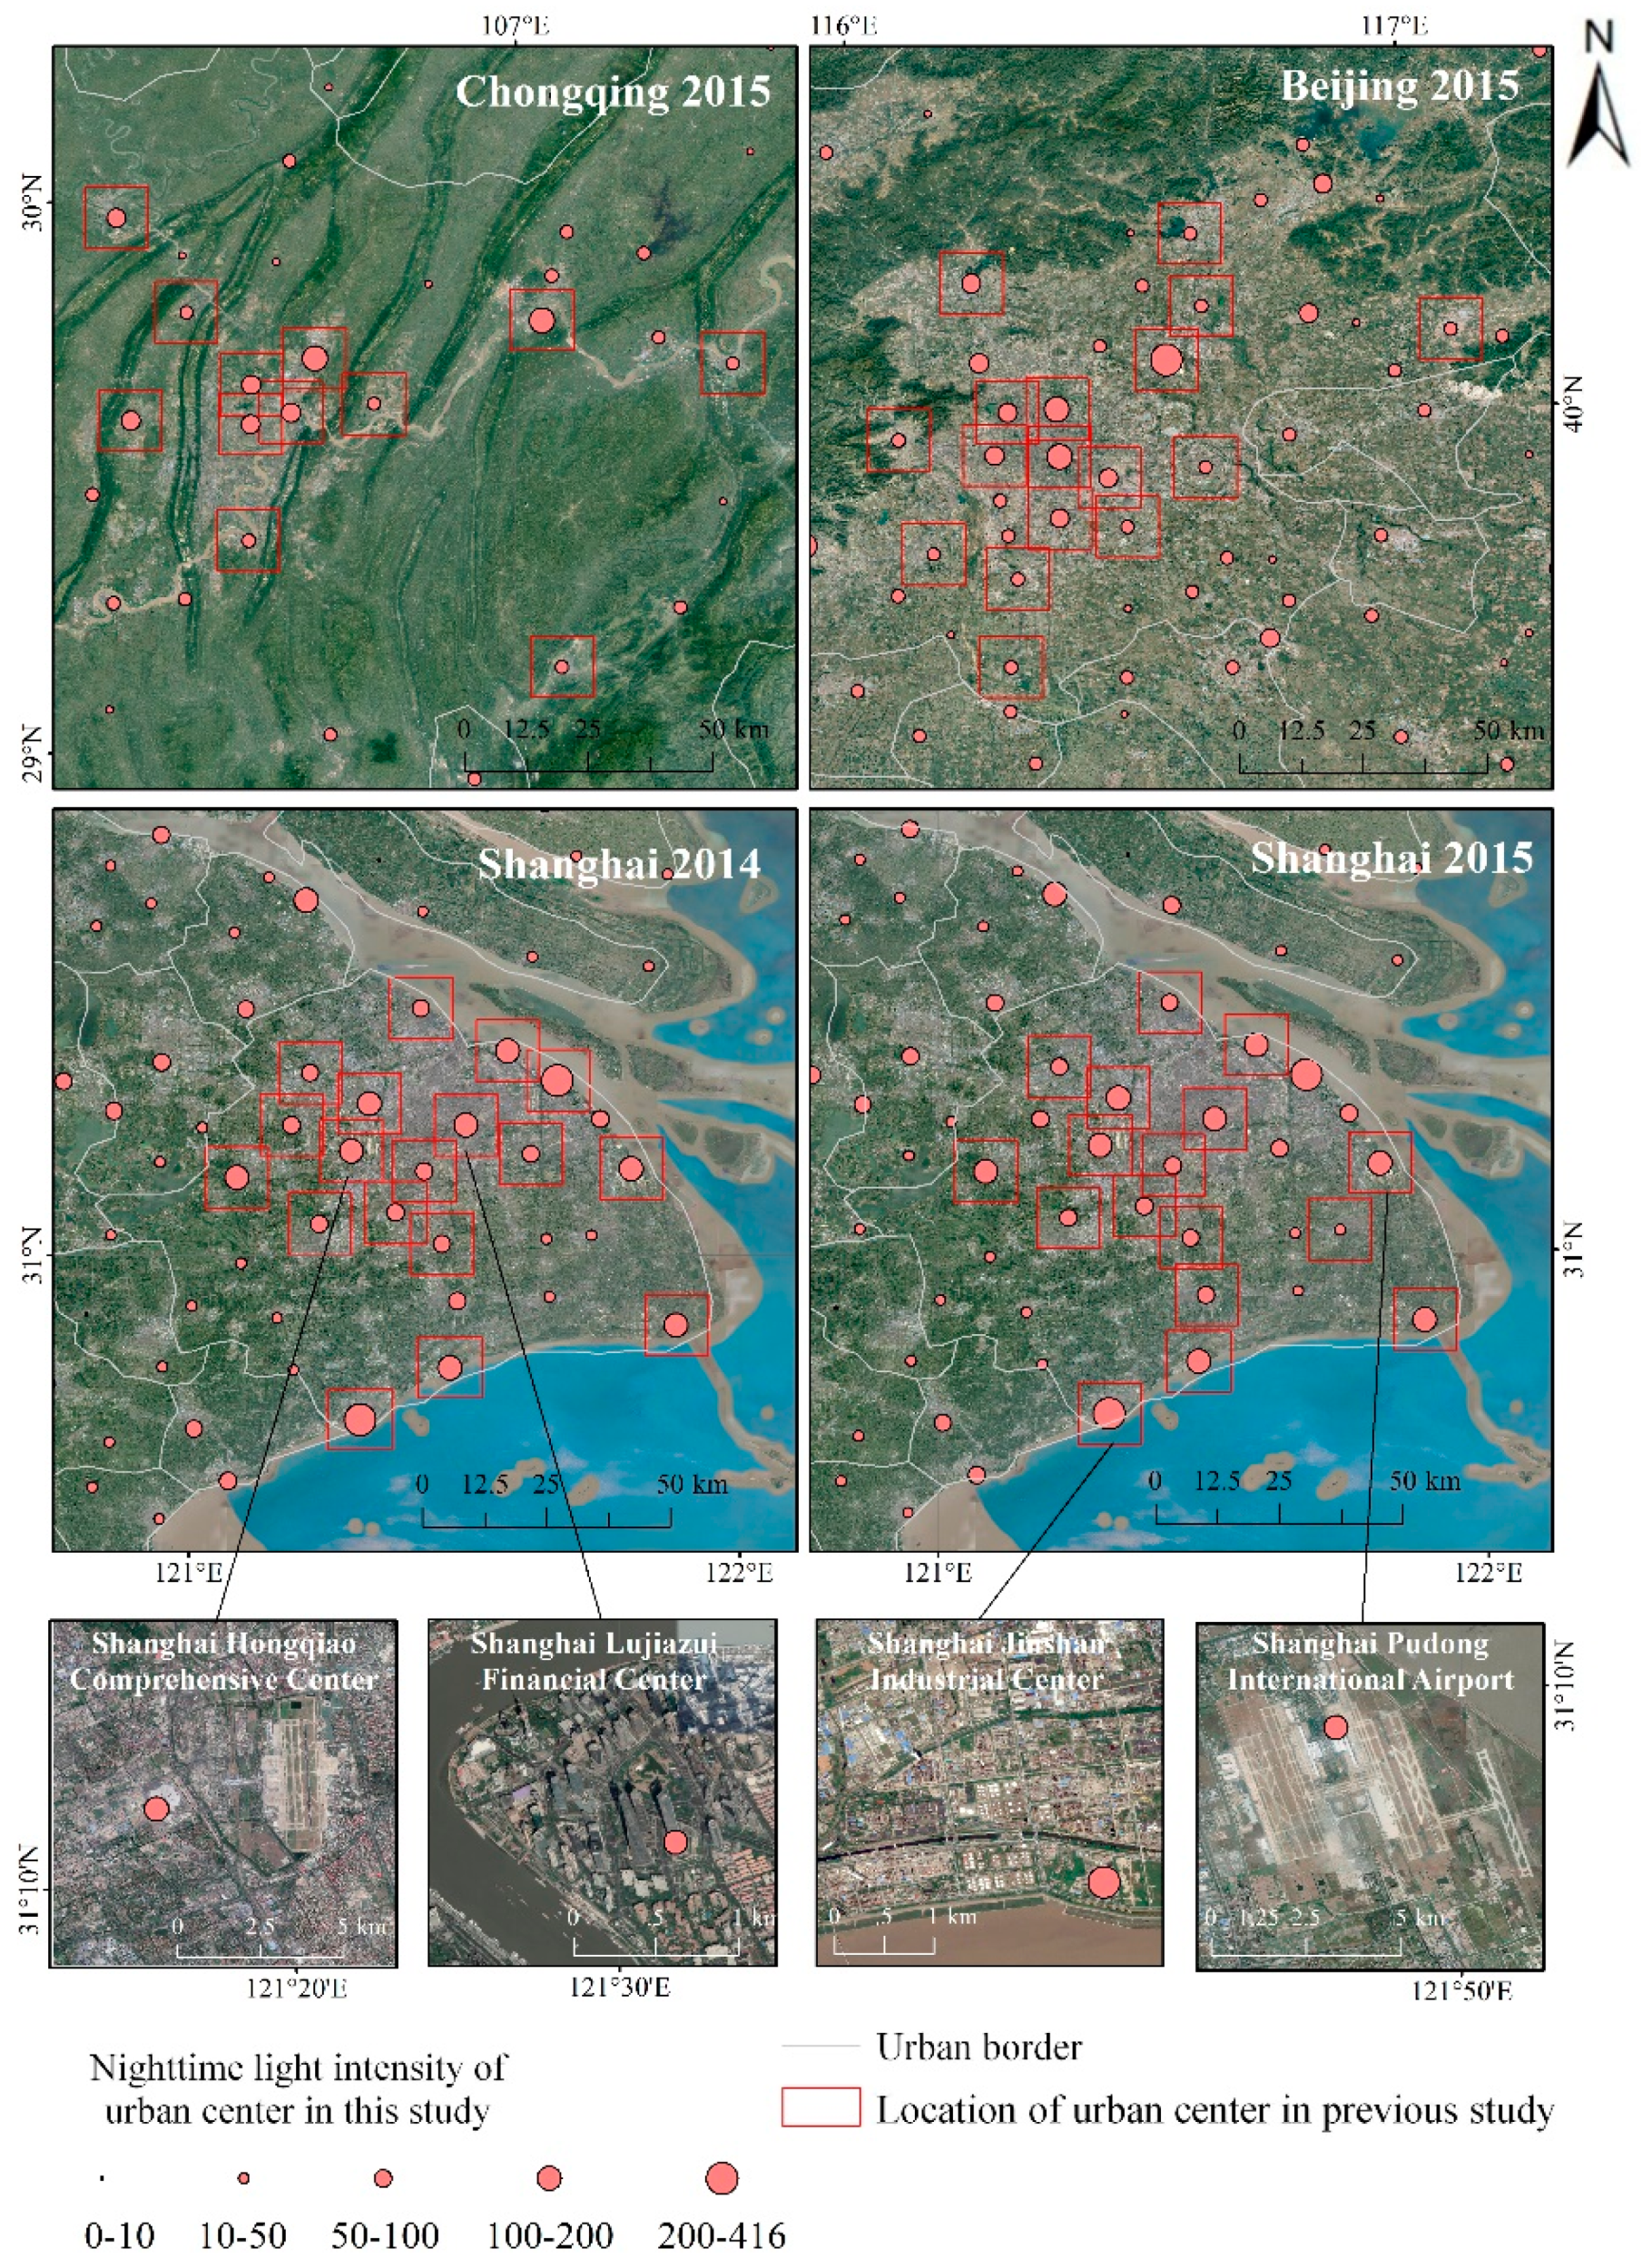
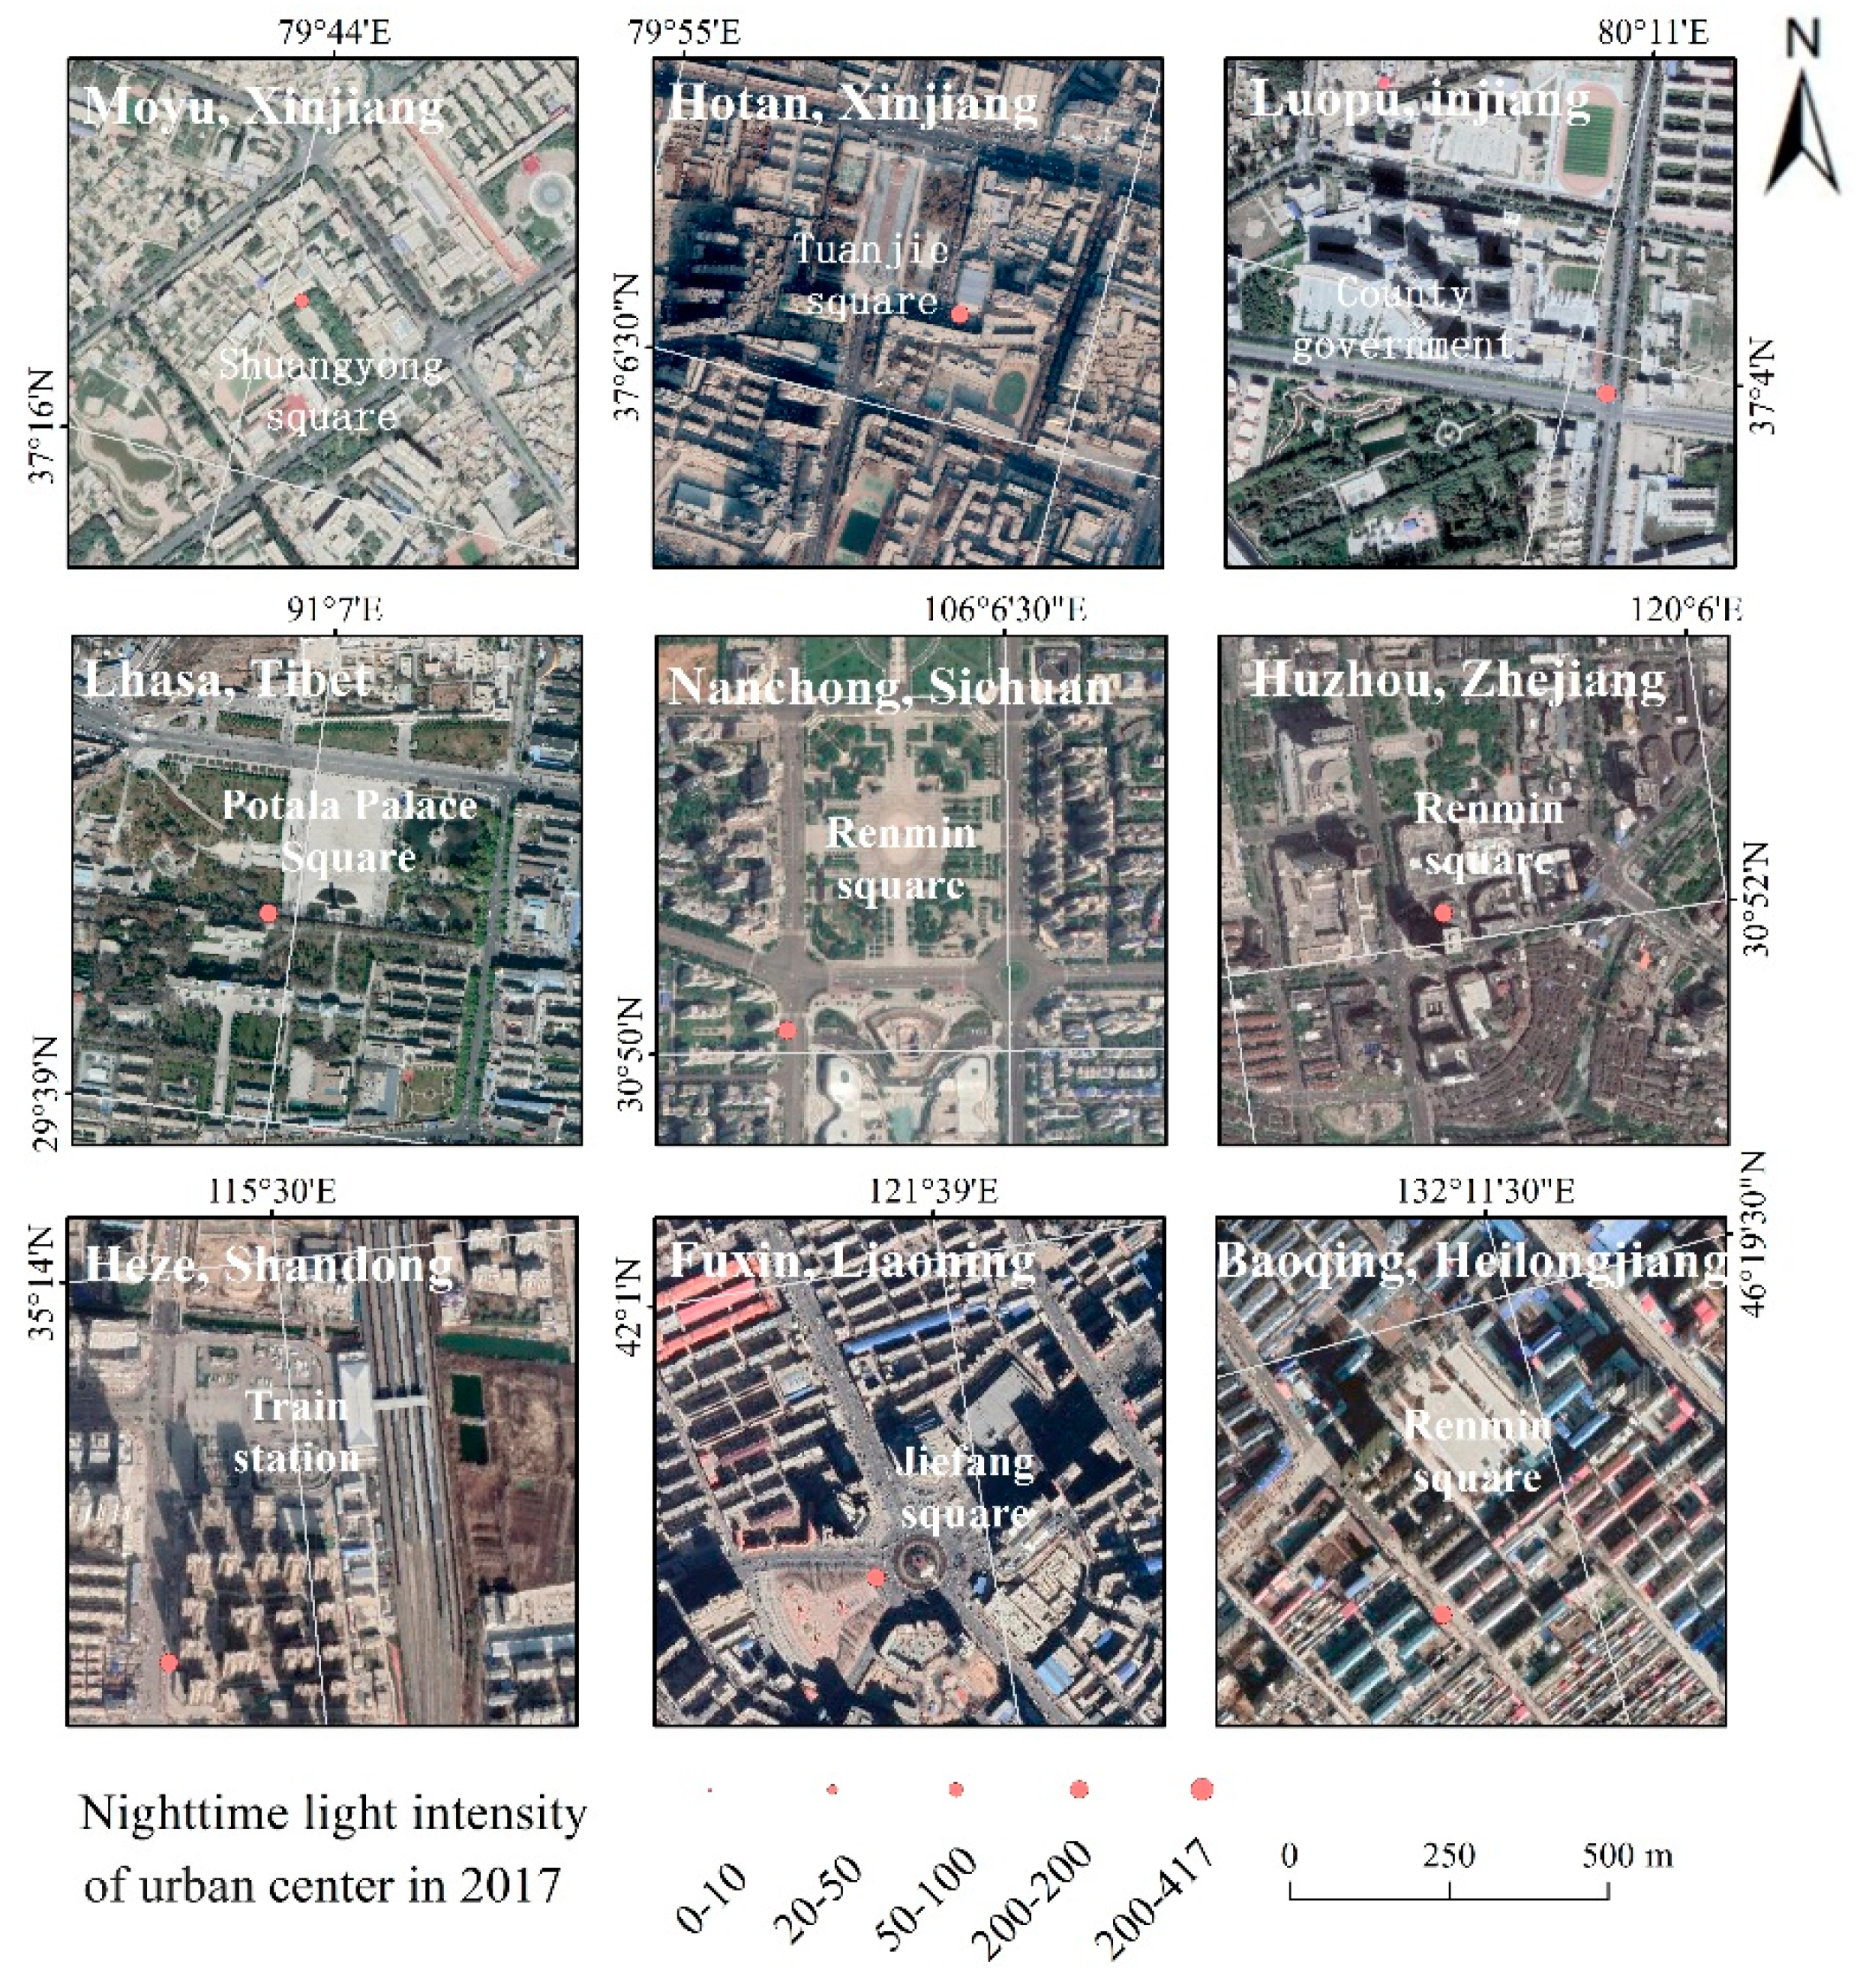
4.3.2. Accuracy Assessment Based on High-Resolution Remote Sensing Images

Combined with high-resolution remote sensing images, the internal spatial structure of a city can be analyzed at a fine scale. To further improve the accuracy of identification results in small and medium-sized cities, this study superimposed the identified urban centers on the high-resolution remote sensing images in the corresponding years and compared the identified urban centers with the actual spatial structure of the cities (Figure 14). The results show that the centers of the small and medium-sized cities identified in the current study were mainly distributed near the squares, government offices, and train stations of the cities, which basically coincide with the central structure of the cities and can effectively characterize the distribution of the small- and medium-sized cities.

5. Discussion

Identifying the centers for a large number of cities over a large scale is a challenging task. The interaction between natural factors, such as geomorphology and land cover type, and socioeconomic factors, such as industrial structure, economic level, and planning and management capabilities, has formed different urban center distribution patterns [65]. Based on NPP-VIIRS nighttime light data, this research extracted the urban centers in China over a large spatial scale. To enhance the comparability of different urban centers, this paper used a neighborhood computing window of uniform type and size. The size of the window was determined by the mean change point method, but the regular square window was not necessarily suitable for cities with different shapes.
The urban center extraction method proposed in this paper is suitable for large spatial scales. This method can obtain information on the number of urban centers that can be compared simultaneously. In addition, this method can improve the identification accuracy of center positions of high-level multi-center cities and low-level monocentric cities. However, more work is still needed to further improve the accuracy of the method.
Variations in urbanization, socioeconomic level, and type of industrial structure can amplify the differences in the nighttime light intensity between cities. Although the current nighttime light data can accurately assess the level of urbanization, cities with different urbanization and socioeconomic levels have differences in light equipment, light power inputs, and others [66]. Large cities with strong economic strength create “urban lighting” activities at night—that is, many financial resources are invested in artificial lights to light up the city, with a view to enhancing the city’s image and attracting tourists [67]. These activities may cause cities with more nighttime lights to appear brighter because cities with relatively weak economic strength may do less in this regard. The above difference is reflected in the brightness of the nighttime light image, while more studies are still needed to evaluate the difference in socioeconomic parameters characterized by unit brightness values in different cities. In addition, existing studies have found that industrial areas in cities exhibit strong performance in nighttime light, usually with higher nighttime light intensity than commercial and residential centers [26]. The method for identifying urban centers proposed in this study characterized the degree of human activity through the nighttime light intensity and compared the pixels based on the neighboring relationship in a limited neighborhood space. Generally, urban areas have brighter nighttime lights than nonurban areas [68,69], but there are differences in the ability of human activities to express nighttime light among different areas within the city [70,71]. When industrial centers and other centers are relatively close in distance, especially in the same neighborhood space, the nighttime lights in the industrial area can replace the lights in other areas as peak pixels; thus, the industrial areas will become the representative of the entire neighborhood space and even city center in the area. Some cities with developed secondary industries (especially heavy industries such as minerals, natural gas, and petrochemicals) have a large number of petrochemical and smelting factories distributed at the edge of the cities. These factories showing high nighttime light brightness will affect the identification of urban centers. Nighttime light provides information on the degree of human activity, but on the city scale, it may not be able to fully characterize the differences in population agglomerations among different areas within the city. In terms of the city shape, for strip-shaped river valleys and coastal cities, rectangular and fan-shaped windows may have a better identification effect. Therefore, careful classification and specific recognition are required according to different factors, such as the city shape, economic zoning, population size, and economic level. In addition, neighborhood computing windows of different sizes need to be determined for various levels of cities.
NPP-VIIRS monthly synthesis products themselves still has some shortcomings that can affect the urban center extraction results. At larger spatial and temporal scales, changes in atmospheric turbidity and different satellite views can affect the cloud-free radiation data, leading to some errors in the NPP-VIIRS monthly synthesis products and thus affecting the extraction results for urban centers. Additionally, due to its broadband response, the NPP-VIIRS is sensitive to spectral composition of light sources in a city and also wavelength-dependent optical distortion in the atmosphere. The cumulative emissions from many individual sources of light are different for different wavelengths [72], so further work will consider light emissions for different wavelengths. Moreover, because the time acquiring the NPP-VIIRS images is very late at night when post ornamental lights in China are off, this time bias can have an impact on the extraction results for urban centers [73]. LuoJia1-01 with full coverage of China can make up for that deficiency, so we will consider using LuoJia1-01 data for further study. Our results indicate that super metropolises, mega-cities, and large cities all have polycentric structure over the research period. For the sustainable development of these cities, more attention is still needed to optimize city structure and avoid negative environmental and ecological impacts [74,75]. There are also many cities with a single center. From 2002 to 2017, the number of Chinese cities with polycentric structures has gradually increased, indicating a steady improvement in urban development. Considering the rapid economic development and population growth and consequent environmental impact [76,77], proper city planning is needed and polycentric structure should receive more attention.

6. Conclusions

Based on the NPP-VIIRS annual data from 2012 to 2017, this paper developed a new method to identify the urban central points in China. Comparison of current results with previous urban center identification results and high-precision remote sensing images confirmed the validity of current study. The specific conclusions are drawn as follows:
The urban centers extracted in this study were determined by the locations where the levels of human activities were significantly higher than those in other regions within a certain spatial range. Based on the NPP-VIIRS nighttime light data, this paper extracted the peak pixels with brightness values in a certain neighborhood. Specifically, this method includes the following steps: correction of the NPP-VIIRS data, the maximum neighborhood algorithm, the mean change point method to determine the appropriate window, difference calculation, extraction of urban areas, and time series correction.
To enhance the comparability of cities on a large spatial scale, this study divided cities by economic development (four regions) and city levels (three categories (large cities, medium cities, and small cities) and seven levels). Aside from super metropolises and mega-cities, the distribution of the other five classes of cities in the four economic regions was relatively balanced, indicating a strong match between the economic levels and the city development.
As of 2017, Chinese cities had an average of approximately 3.3 centers, and around 68% of the cities have developed a multi-center structure. From 2012 to 2017, the number of polycentric cities has gradually increased. However, there was uneven spatial distribution of polycentric cities, and they were concentrated in the eastern coastal areas and northern China.
The extraction results of the current study show that the proportions of non-center, monocentric, and multi-center cities in China in 2012 were 9%, 26%, and 65%, respectively. In 2014, the proportion of non-center cities in China was 8.6%. We extracted 1473 polycentric cities, approximately 67% of 2200 researched cities. By comparing with previous research results and high-resolution real-time remote sensing images, the urban centers extracted in this paper were verified. Our results are consistent with the actual urban centers and can effectively reflect the number, location, and development level of the urban center area over a large spatial scale. Due to the new method, the number of urban centers in northern China and northeastern China in the current study were relatively higher than those in previous studies.

Author Contributions

Conceptualization, W.G.; data curation, Q.L. and W.G.; formal analysis, K.S.; funding acquisition, M.M.; methodology, M.M., H.Y., K.S., and W.G.; writing—original draft, M.M., Q.L., and W.G.; writing—review and editing, M.M. and H.Y. All authors have read and agreed to the published version of the manuscript.

Funding

This research was funded by the National Natural Science Foundation of China, grant number: 41771453, 41830648; the Chongqing R&D Project of the high technology and major industries (grant number: [2017] 1231). The APC was funded by the National Natural Science Foundation of China, grant number: 41771453.

Acknowledgments

The NPP-VIIRS nighttime light data was obtained from https://ngdc.noaa.gov/eog/viirs/download_viirs_ntl.html, the MCD12Q1 and MOD44W data was obtained from https://lpdaac.usgs.gov/product_search/?query=MODIS&view=cards&sort=title.

Conflicts of Interest

The authors declare no conflict of interest.

References

  1. Xu, X.; Zhou, Y.; Ning, Y. Urban Geography, 2nd ed.; Higher Education Press: Beijing, China, 2009; pp. 19–20. (In Chinese) [Google Scholar]
  2. Wu, J. Urban ecology and sustainability: The state-of-the-science and future directions. Landsc. Urban Plann. 2014, 125, 209–221. [Google Scholar] [CrossRef]
  3. Liu, Y.; Huang, X.; Yang, H.; Zhong, T. Environmental effects of land-use/cover change caused by urbanization and policies in Southwest China Karst area – A case study of Guiyang. Habitat Int. 2014, 44, 339–348. [Google Scholar] [CrossRef]
  4. Bai, X.; Shi, P.; Liu, Y. Realizing China’s urban dream. Nature 2014, 509, 158–160. [Google Scholar] [CrossRef] [PubMed] [Green Version]
  5. Liu, X.; Derudder, B.; Wu, K. Measuring polycentric urban development in China: An intercity transportation network perspective. Reg. Stud. 2016, 50, 1302–1315. [Google Scholar] [CrossRef]
  6. Zhang, L.; Zhao, S.X.B. Reinterpretation of China’s under-urbanization: A systemic perspective. Habitat Int. 2003, 27, 459–483. [Google Scholar] [CrossRef]
  7. Zhao, R.; Wang, Y.; Zhang, X.; Liu, J. Human Geography, 2nd ed.; Higher Education Press: Beijing, China, 2006; p. 209. (In Chinese) [Google Scholar]
  8. Arnfield, A.J. Two decades of urban climate research: A review of turbulence, exchanges of energy and water, and the urban heat island. Int. J. Climatol. 2003, 23, 1–26. [Google Scholar] [CrossRef]
  9. Parrish, D.D.; Zhu, T. Clean air for megacities. Science 2009, 326, 674–675. [Google Scholar] [CrossRef] [PubMed]
  10. Grimmond, S. Urbanization and global environmental change: Local effects of urban warming. Geogr. J. 2007, 173, 83–88. [Google Scholar] [CrossRef]
  11. Seto, K.C.; Gueneralp, B.; Hutyra, L.R. Global forecasts of urban expansion to 2030 and direct impacts on biodiversity and carbon pools. Proc. Natl. Acad. Sci. USA 2012, 109, 16083–16088. [Google Scholar] [CrossRef] [Green Version]
  12. Yang, H.; Xia, J.; Thompson, J.R.; Flower, R.J. Urban construction and demolition waste and landfill failure in Shenzhen, China. Waste Manag. 2017, 63, 393–396. [Google Scholar] [CrossRef]
  13. Yang, H.; Huang, X.; Thompson, J.R.; Bright, R.M.; Astrup, R. The crushing weight of urban waste. Science 2016, 351, 674. [Google Scholar] [CrossRef] [PubMed] [Green Version]
  14. Zhang, P.; Yuan, H.; Tian, X. Sustainable development in China: Trends, patterns, and determinants of the “Five Modernizations” in Chinese cities. J. Clean. Prod. 2019, 214, 685–695. [Google Scholar] [CrossRef]
  15. Romano, G.C. Strategies for sustainable urban development: Towards green(er) Chinese cities? Asia Pac. J. Public Adm. 2014, 36, 233–247. [Google Scholar] [CrossRef]
  16. Bettencourt, L.M.A.; Lobo, J.; Helbing, D.; Kuehnert, C.; West, G.B. Growth, innovation, scaling, and the pace of life in cities. Proc. Natl. Acad. Sci. USA 2007, 104, 7301–7306. [Google Scholar] [CrossRef] [Green Version]
  17. Kloosterman, R.C.; Musterd, S. The polycentric urban region: Towards a research agenda. Urban Stud. 2001, 38, 623–633. [Google Scholar] [CrossRef]
  18. McMillen, D.P.; Smith, S.C. The number of subcenters in large urban areas. J. Urban Econ. 2003, 53, 321–338. [Google Scholar] [CrossRef]
  19. Hall, P. Looking backward, looking forward: The city region of the mid-21st century. Reg. Stud. 2009, 43, 803–817. [Google Scholar] [CrossRef]
  20. Duan, Y.; Liu, Y.; Liu, X.; Wang, H. Identification of polycentric urban structure of central Chongqing using points of interest big data. J. Nat. Res. 2018, 33, 788–800. [Google Scholar] [CrossRef]
  21. Jin, Y.; Wei, Y. An Research on the polycentric structure of Changchun city based on spatial principal component of producer service analysis. J. Hum. Settl. West China 2018, 33, 47–54. [Google Scholar]
  22. Wu, L. Recognition and analysis of the status quo of public centers in Guangzhou based on big data. Intell. City 2018, 4, 15–16. [Google Scholar]
  23. Lou, G.; Chen, Q.; He, K.; Zhou, Y.; Shi, Z. Using nighttime light data and POI big data to detect the urban centers of Hangzhou. Remote Sens. 2019, 11, 1821. [Google Scholar] [CrossRef] [Green Version]
  24. Zheng, W.; Run, J.; Zhuo, R.; Jiang, Y.; Wang, X. Evolution process of urban spatial pattern in Hubei province based on DMSP/OLS nighttime light data. Chin. Geogr. Sci. 2016, 26, 366–376. [Google Scholar] [CrossRef] [Green Version]
  25. Xu, T.; Ma, T.; Zhou, C.; Zhou, Y. Characterizing spatio-temporal dynamics of urbanization in China using time series of DMSP/OLS night light data. Remote Sens. 2014, 6, 7708–7731. [Google Scholar] [CrossRef] [Green Version]
  26. Zhang, X.; Sun, J.; Wang, Y.; Li, W.; Sun, Q.; Wang, H.; Quan, J.; Cao, G.; Wang, J.; Yang, Y.; et al. Factors contributing to haze and fog in China. Chin. Sci. Bull. 2013, 58, 1178–1187. [Google Scholar] [CrossRef]
  27. Ma, L.; Wu, J.; Li, W.; Peng, J.; Liu, H. Evaluating saturation correction methods for DMSP/OLS nighttime light data: A case study from China’s cities. Remote Sens. 2014, 6, 9853–9872. [Google Scholar] [CrossRef] [Green Version]
  28. Letu, H.; Hara, M.; Tana, G.; Nishio, F. A Saturated light correction method for DMSP/OLS nighttime satellite imagery. IEEE Trans. Geosci. Remote Sens. 2012, 50, 389–396. [Google Scholar] [CrossRef]
  29. Cai, J.; Huang, B.; Song, Y. Using multi-source geospatial big data to identify the structure of polycentric cities. Remote Sens. Environ. 2017, 202, 210–221. [Google Scholar] [CrossRef]
  30. Zhou, L.; Zhao, Q.; Yang, F. Identification of urban agglomeration boundary based on POI and NPP/VIIRS night light data. Prog. Geogr. 2019, 38, 840–850. [Google Scholar] [CrossRef]
  31. Dong, H.; Li, R.; Li, J.; Li, S. Study on urban spatiotemporal expansion pattern of three first-class urban agglomerations in China derived from integrated DMSP-OLS and NPP-VIIRS nighttime light data. J. Geo-Inf. Sci. 2020, 22, 1161–1174. [Google Scholar] [CrossRef]
  32. Liu, Y.; Li, Y. Urban centers extraction and analysis using night time light date: A case study of main urban areas of Chongqing. China Resour. Compr. Util. 2019, 37, 160–164. [Google Scholar] [CrossRef]
  33. Huang, L.; Yang, Y.; Zhu, Q. Expansion research on the build-up area in Nanjing city based on DMSP/OLS data. Geos. Inf. 2018, 16, 94–97+99. [Google Scholar] [CrossRef]
  34. Dou, Y.; Liu, Z.; He, C.; Yue, H. Urban land extraction using viirs nighttime light data: An evaluation of three popular methods. Remote Sens. 2017, 9, 175. [Google Scholar] [CrossRef] [Green Version]
  35. Fernández-Maldonado, A.M.; Romein, A.; Verkoren, O.; Pesso, R.P.P. Polycentric structures in Latin American metropolitan areas: Identifying employment sub-centres. Reg. Stud. 2014, 48, 1954–1971. [Google Scholar] [CrossRef]
  36. Yi, K.; Tani, H.; Li, Q.; Zhang, J.; Guo, M.; Bao, Y.; Wang, X.; Li, J. Mapping and evaluating the urbanization process in northeast China using DMSP/OLS nighttime light data. Sensors 2014, 14, 3207–3226. [Google Scholar] [CrossRef] [PubMed] [Green Version]
  37. Chen, Z.; Yu, B.; Song, W.; Liu, H.; Wu, Q.; Shi, K.; Wu, J. A new approach for detecting urban centers and their spatial structure with nighttime light remote sensing. IEEE Trans. Geosci. Remote Sens. 2017, 55, 6305–6319. [Google Scholar] [CrossRef]
  38. Luo, Q.; Li, X. The spatial differentiation and influencing factors of urban centers in China based on VIIRS night light. Geogr. Res. 2019, 38, 155–166. [Google Scholar] [CrossRef]
  39. Liu, J.Y.; Liu, M.L.; Tian, H.Q.; Zhuang, D.F.; Zhang, Z.X.; Zhang, W.; Tang, X.M.; Deng, X.Z. Spatial and temporal patterns of China’s cropland during 1990-2000: An analysis based on Landsat TM data. Remote Sens. Environ. 2005, 98, 442–456. [Google Scholar] [CrossRef]
  40. Huang, Z.; Wei, Y.D.; He, C.; Li, H. Urban land expansion under economic transition in China: A multilevel modeling analysis. Habitat Int. 2015, 47, 69–82. [Google Scholar] [CrossRef]
  41. Mills, S.; Weiss, S.; Liang, C. VIIRS day/night band (DNB) stray light characterization and correction. In Proceedings of the Earth Obser, Systems XVIII, San Diego, CA, USA, 26–29 August 2013; pp. 88661P.88661–88661P.88618. [Google Scholar]
  42. Baugh, K.; Hsu, F.-C.; Elvidge, C.D.; Zhizhin, M. Nighttime lights compositing using the VIIRS day-night band: Preliminary results. Proc. Aisa-Pac. Adv. Net. 2013, 70–86. [Google Scholar] [CrossRef] [Green Version]
  43. Yuan, L.; Maichun, Z. Comparative analysis on three land cover datasets based on IGBP classification system over Hanjiang river basin. Remote Sens. Technol. Appl 2017, 32, 575–584. [Google Scholar] [CrossRef]
  44. Gridded Population of the World, Version 4 (GPWv4): Population Density Adjusted to Match 2015 Revision UN WPP Country Totals, Revision 10. Center for International Earth Science Information Network - Ciesin - Columbia University: 2017. Available online: https://sedac.ciesin.columbia.edu/data/collection/gpw-v4/documentation (accessed on 4 August 2020).
  45. Balk, D.L.; Deichmann, U.; Yetman, G.; Pozzi, F.; Hay, S.I.; Nelson, A. Determining Global Population Distribution: Methods, Applications and Data. Adv. Parasit. 2006, 62, 119–156. [Google Scholar]
  46. National Bureau of Statistics of China. China City Statistical Yearbook: 2013; China Statistics Press: Bejing, China, 2013. (In Chinese)
  47. Ministry of Housing and Urban-Rural Development of the People’s Republic of China. China Urban Construction Statistical Yearbook: 2013. Available online: http://www.mohurd.gov.cn/xytj/tjzljsxytjgb/jstjnj/w02016020220935112116700109.rar (accessed on 4 August 2020).
  48. Ministry of Housing and Urban-Rural Development of the People’s Republic of China. China County Seat Construction Statistical Yearbook: 2013. Available online: http://www.mohurd.gov.cn/xytj/tjzljsxytjgb/jstjnj/w02016020220935112402324535.rar (accessed on 4 August 2020).
  49. Zhu, X.; Ma, M.; Yang, H.; Ge, W. Modeling the Spatiotemporal Dynamics of Gross Domestic Product in China Using Extended Temporal Coverage Nighttime Light Data. Remote Sens. 2017, 9, 626. [Google Scholar] [CrossRef] [Green Version]
  50. Lee, T.E.; Miller, S.D.; Turk, F.J.; Schueler, C.; Julian, R.; Deyo, S.; Dills, P.; Wang, S. The NPOESS VIIRS day/night visible sensor. Bull. Am. Meteorol. Soc. 2006, 87, 191–199. [Google Scholar] [CrossRef]
  51. Li, X.; Xu, H.; Chen, X.; Li, C. Potential of NPP-VIIRS Nighttime Light Imagery for Modeling the Regional Economy of China. Remote Sens. 2013, 5, 3057–3081. [Google Scholar] [CrossRef] [Green Version]
  52. Zhang, Q.; Seto, K.C. Mapping urbanization dynamics at regional and global scales using multi-temporal DMSP/OLS nighttime light data. Remote Sens. Environ. 2011, 115, 2320–2329. [Google Scholar] [CrossRef]
  53. Li, X.; Li, D.; Xu, H.; Wu, C. Intercalibration between DMSP/OLS and VIIRS night-time light images to evaluate city light dynamics of Syria’s major human settlement during Syrian Civil War. Int. J. Remote Sens. 2017, 38, 5934–5951. [Google Scholar] [CrossRef]
  54. Li, X.; Zhang, R.; Huang, C.; Li, D. Detecting 2014 Northern Iraq Insurgency using night-time light imagery. Int. J. Remote Sens. 2015, 36, 3446–3458. [Google Scholar] [CrossRef]
  55. He, C.; Shi, P.; Li, J.; Chen, J.; Pan, Y.; Li, J.; Zhuo, L.; Toshiaki, I. Restoring urbanization process in China in the 1990s by using non-radiance calibrated DMSP/OLS nighttime light imagery and statistical data. Chin. Sci. Bull. 2006, 51, 1614–1620. [Google Scholar] [CrossRef]
  56. Liu, Z.; He, C.; Zhang, Q.; Huang, Q.; Yang, Y. Extracting the dynamics of urban expansion in China using DMSP-OLS nighttime light data from 1992 to 2008. Landsc. Urban Plan. 2012, 106, 62–72. [Google Scholar] [CrossRef]
  57. Liu, X.; Lu, H.; Ren, Z.; Ren, Z. Scale issues in digital terrain analysis and terrain modeling. Geogr. Res. 2007, 26, 433–442. [Google Scholar]
  58. Yang, X.; Tang, G.; Liu, X.; Li, F.; Zhu, S. Digital Terrain Analysis: Theory, Method and Application. Acta Geog. Sin. 2009, 64, 1058–1070. [Google Scholar]
  59. Zhang, J.; Li, X.; Chen, C.; Liu, J. Analysis of the relief amplitude in Xinjiang. J. Lanzhou Univ. (Nat. Sci.) 2008, 10–13. [Google Scholar] [CrossRef]
  60. Han, H.; Gao, T.; Yi, H.; Yang, M.; Yan, X.; Ren, G.; Yang, J. Extraction of relief amplitude based on change point method: A case study on the Tibetan Plateau. Sci. Geogr. Sin. 2012, 32, 101–104. [Google Scholar]
  61. Liu, X.; Wang, M. How polycentric is urban China and why? A case study of 318 cities. Landsc. Urban Plan. 2016, 151, 10–20. [Google Scholar] [CrossRef]
  62. Li, Y.; Liu, X. How did urban polycentricity and dispersion affect economic productivity? A case study of 306 Chinese cities. Landsc. Urban Plann. 2018, 173, 51–59. [Google Scholar] [CrossRef]
  63. Wu, Y.; Lai, S.; Wu, C. Research on polycentricity: Concept, connotation, and spatial features. City Plann. Rev. 2016, 40, 23–31. [Google Scholar] [CrossRef]
  64. Zheng, J.; Chen, Q. Monocentricity or Polycentricity: On Urban Internal Spatial Structure of Chinese Cities. China Econ. Stud. 2019, 93–105. [Google Scholar] [CrossRef]
  65. Wang, J.; Gu, G.; Yao, L.; Chen, Y. Analysis of new urbanization’s spatial pattern evolution and influence factors in China. Sci. Geogr. Sin. 2016, 36, 63–71. [Google Scholar] [CrossRef]
  66. Pan, J.; Li, J. Estimate and Spatio-Temporal Dynamics of Electricity Consumption in China Based on DMSP/OLS Images. Geogr. Res. 2016, 35, 627–638. [Google Scholar] [CrossRef]
  67. Cao, X. Research on Countermeasures to Develop Night Tourism in Cities of China. Inq. Econ. Issues 2008, 125–128. [Google Scholar] [CrossRef]
  68. Small, C.; Elvidge, C.D.; Balk, D.; Montgomery, M. Spatial scaling of stable night lights. Remote Sens. Environ. 2011, 115, 269–280. [Google Scholar] [CrossRef]
  69. Small, C.; Pozzi, F.; Elvidge, C.D. Spatial analysis of global urban extent from DMSP-OLS night lights. Remote Sens. Environ. 2005, 96, 277–291. [Google Scholar] [CrossRef]
  70. Shu, S.; Yu, B.; Wu, J.; Liu, H. Methods for deriving urban built-up area using night-light data: Assessment and application. Remote Sens. Technol. Appl. 2011, 26, 169–176. [Google Scholar]
  71. Li, D.; Li, X. An overview on data mining of nighttime light remote sensing. Acta Geod. Cart. Sin. 2015, 44, 591–601. [Google Scholar] [CrossRef]
  72. Kocifaj, M.; Antonio Solano-Lamphar, H.; Videen, G. Night-sky radiometry can revolutionize the characterization of light-pollution sources globally. Proc. Natl. Acad. Sci. USA 2019, 116, 7712–7717. [Google Scholar] [CrossRef] [Green Version]
  73. Levin, N.; Kyba, C.C.M.; Zhang, Q.; De Miguel, A.S.; Roman, M.O.; Li, X.; Portnov, B.A.; Molthan, A.L.; Jechow, A.; Miller, S.D.; et al. Remote sensing of night lights: A review and an outlook for the future. Remote Sens. Environ. 2020, 237. [Google Scholar] [CrossRef]
  74. Yang, H. China must continue the momentum of green law. Nature 2014, 509, 535. [Google Scholar] [CrossRef] [Green Version]
  75. Li, J.; Huang, X.; Yang, H.; Chuai, X.; Wu, C. Convergence of carbon intensity in the Yangtze River Delta, China. Habitat Int. 2017, 60, 58–68. [Google Scholar] [CrossRef] [PubMed]
  76. Yang, H.; Flower, R.J.; Thompson, J.R. China’s new leaders offer green hope. Nature 2013, 493, 163. [Google Scholar] [CrossRef] [Green Version]
  77. Yang, H.; Huang, X.; Thompson, J.R.; Flower, R.J. China’s Soil Pollution: Urban Brownfields. Science 2014, 344, 691–692. [Google Scholar] [CrossRef]
Figure 1. Four economic regions (a) and seven city classes (b) in China.
Remotesensing 12 03248 g001
Figure 2. Global NPP-VIIRS nighttime light image in December 2012.
Remotesensing 12 03248 g002
Figure 3. Flow chart for extracting China’s urban centers based on NPP-VIIRS data.
Remotesensing 12 03248 g003
Figure 4. An example of the extraction process of peak pixels in Beijing, China: (a) is the corrected NPP-VIIRS image, (b) is the result image of maximum neighborhood algorithm, (c) is the result image of difference neighborhood algorithm, and (d) is the peak pixels extracted by (c) and city border.
Remotesensing 12 03248 g004
Figure 5. Typical shapes of the neighborhood window.
Remotesensing 12 03248 g005
Figure 6. The relationship between window size and nighttime light peak pixel quantity and intensity of all cities in China.
Remotesensing 12 03248 g006
Figure 7. Raw NPP-VIIRS nighttime light images of China from 2012 to 2017.
Remotesensing 12 03248 g007
Figure 8. Comparison of the correlation between NPP-VIIRS nighttime light images and three socioeconomic parameters before and after the removal of background noise.
Remotesensing 12 03248 g008
Figure 9. Results of interannual correction.
Remotesensing 12 03248 g009
Figure 10. The relationship between window size and nighttime light peak pixel quantity and intensity.
Remotesensing 12 03248 g010
Figure 11. Comparison before and after urban area extraction in Beijing, China.
Remotesensing 12 03248 g011
Figure 12. Comparison of the number of urban centers in China between 2012 and 2017.
Remotesensing 12 03248 g012
Figure 13. Comparison of urban center locations between this study and two previous research studies [29,37].
Remotesensing 12 03248 g013
Figure 14. Comparison of urban center locations between this study and high spatial resolution remote sensing images in nine selected cities.
Remotesensing 12 03248 g014
Table 1. Economic regions and city classes.
City ClassesUrban Population
(×104)
Northeast
China
Eastern
China
Central
China
Western
China
Total Number of Cities
Large citySuper metropolis>1000-3-14
Megacity500–1000-3115
Large city I300–500431210
Large city II100–300428111356
Medium cityMedium-sized city50–1001733311495
Small citySmall city I20–50161008556257
Small city II<201373464368441773
Table 2. Time series detection of urban centers.
Type of CityNumber of CentersChange in
the Number
of Centers
Difference Between
the Number of Centers
in the Following Year
and the Previous Year
Processing Model
Multi-center≥2Increase>0Do not process
≥2Unchanged0Do not process
≥2Decrease<0If it decreased to zero, the center point from the previous year is assigned to the following year; otherwise, it will not be processed.
Mono-centric1Increase>0Do not process
1Unchanged0Do not process
1Decrease<0Assign the center point of the previous year to the following year
Non-center0Increase>0Do not process
0Unchanged0Do not process
Table 3. The difference between S and S i .
iS-SiiS-SiiS-SiiS-SiiS-SiiS-Si
10.07290.306170.332250.292330.216410.119
20.126100.315180.329260.284340.206420.105
30.169110.323190.325270.275350.195430.091
40.205120.339200.322280.266360.183440.077
50.234130.332210.318290.257370.171450.062
60.258140.334220.312300.247380.159460.048
70.278150.334230.306310.237390.146470.032
80.293160.333240.300320.227400.132480.016
Table 4. Numbers of three types of cities in China from 2012 to 2017.
YearMulti-Center CityMonocentric CityNon-Center City
20121440561199
20131451559190
20141471539190
20151473537190
20161486543171
20171501530169
Table 5. Proportion of cities with different numbers of centers in four economic regions and seven city classes in 2017.
Regions/City ClassesMulti-Center CityMonocentric CityNon-Center City
Eastern China89.91%9.38%2.48%
Northeastern China82.97%17.58%6.59%
Central China68.77%25.29%7%
Western China51.88%33.62%16%
Super metropolis100%0%0%
Mega-city100%0%0%
Large city I100%0%0%
Large city II92.86%7.14%0%
Medium-sized city82.11%14.74%3.16%
Small city I80.93%14.79%4.28%
Small city II64.52%26.73%8.74%
Table 6. Comparison of number and proportion of urban centers in four economic regions and seven city classes in 2017.
Results of Previous Studies *Results of this Study
City ClassesEastern ChinaCentral ChinaWestern ChinaNortheastern ChinaEastern ChinaCentral ChinaWestern
China
Northeast
China
Super metropolis18
(33.2%)
0
(0)
21
(57.1%)
0
(0)
27.667
(29.4%)
0
(0)
79
(65.7%)
0
(0)
Mega-city17.33
(32.0%)
0
(0)
0
(0)
0
(0)
30.666 (32.6%)28
(64.0%)
9
(7.5%)
0
(0)
Large city I8.5
(15.7%)
8.25
(52.2%)
7.33
(19.9%)
8
(54.2%)
14.333
(15.3%)
1
(2.3%)
16
(13.3%)
21.5
(49.9%)
Large city II4.88
(9.0%)
4
(25.3%)
4.27
(11.6%)
3.75
(25.4%)
8.143
(8.7%)
4.818
(11.0%)
6.307
(5.2%)
7.75
(18.0%)
Medium-sized city2.76
(5.1%)
2
(12.7%)
2
(5.4%)
1.62
(11.0%)
5
(5.3%)
3.452
(7.9%)
4.214
(3.5%)
3.875
(9.0%)
Small city I1.71
(3.2%)
1.56
(9.9%)
1.41
(3.8%)
1.38
(9.4%)
4.93
(5.2%)
3.894
(8.9%)
3.625
(3.0%)
4.187
(9.7%)
Small city II1
(1.8%)
0
(0)
0.75
(2.0%)
0
(0)
3.247
(3.5%)
2.571
(5.9%)
2.087
(1.7%)
5.8
(13.5%)
Mean4.142.382.242.634.3082.9042.3915.879
* Luo and Li [38].

