Abstract
The use of radar to monitor insect migration is of great significance for pest control and biological migration mechanism research. However, migrating insects usually have small radar-cross-section (RCS) and are accompanied by maneuvering. The current radar detection algorithms mainly have contradictions in detection performance and computational complexity. So it is difficult for traditional radar detection algorithms to detect them effectively. Hence, a novel coherent integration detection algorithm based on dynamic programming (DP) and fractional Fourier transforming (FrFT) is proposed. By combining the advantages of DP and FrFT, the proposed DP-FrFT method can quickly search the target track, and simultaneously perform parameters estimation and motion compensation, achieving high integration gain with relatively low time consumption. The high efficiency of the method is verified with a large number of simulations and sufficient field experiments.
1. Introduction
Numerous insect species have migration behaviors, and they can undertake sustained flights high in the atmosphere [1]. Some species are beneficial insects, which are essential pollinators and can guarantee the supply of food; others are pests, which are carriers of animal and plant viruses and even feed on cash crops. Therefore, the migration of insects is essential to the ecology and human living conditions [2,3,4]. However, there are many studies on the migration of terrestrial animals or birds, but the studies on insect migration are not fully addressed.
Effective observation of insects is the basis for an early warning of migratory insects and the research on the mechanism of insect migration. Traditional trapping lamp or vehicle-mounted sweep nets have a limited ability to monitor insects flying at a height of several hundred meters. Radar observing such targets has the advantages of a wide detection range all-time, so more and more entomologists and even agricultural scientists have turned their attention to the radar and developed a variety of entomological radar detection systems for aerial insects [5,6,7].
However, the detection algorithm used by traditional entomological radar is relatively simple. It mainly realizes target detection through moving target detector (MTD), which employs Doppler filter bank to improve clutter rejection and target detection within one range unit [8,9]. It has a low calculation amount, but can only compensate for phase changes caused by constant velocity (CV) movement. However, insects have the characteristics of weak echo and strong maneuverability, which makes the traditional algorithm have a large number of missed detections and false alarms. To solve this problem, the key is to improve the signal-to-noise ratio (SNR). Hence, the long-time integration technologies are usually required [10].
To achieve an ideal integration performance, the two key problems of range-cell migration (RCM) and Doppler frequency migration (DFM) caused by target maneuvering during the long observation period should be dealt with firstly. Aiming at these problems, a lot of long-time integration technologies have been proposed, which can be generally divided into two categories: non-coherent integration methods and coherent integration methods.
Non-coherent integration methods only accumulate amplitude and do not require Doppler compensation. Therefore, the calculation amount is small, but the loss of integration gain is large. The typical methods include Hough transform (HT) [11,12,13] and Radon transform (RT) [14,15]. They accumulate the echoes’ energy along the linear track. When dealing with maneuvering targets, the detection performance degrades rapidly. To solve this problem, a track-before-detect (TBD) based on dynamic programming (DP) is proposed [16,17,18]. For DP-TBD algorithm, all possible state sequences are searched, and their merit functions are then compared with a threshold for potential targets detection. However, the detection threshold is often difficult to be analytically determined [19,20].
Compared with the non-coherent integration algorithm, the coherent integration algorithm compensates for both RCM and DFM, thus can obtain a higher integration gain and a better detection performance. For RCM correction (RCMC), keystone transform (KT), which involves slow-time axis remapping, is a classic algorithm [21,22,23]. However, KT is only suitable for targets with CV. For DFM correction (DFMC), the key step is to compensate the secondary phase caused by acceleration. Lv’s distribution (LVD) [24] and fractional Fourier transform (FrFT) [25,26,27] are two typical methods to solve this problem. The former performs scale conversion operation on the parameter symmetrical instantaneous autocorrelation function (PSIAF) to release the coupling between delay and time, thereby eliminating linear DFM. While the later introduced the variable of rotation angle, which makes it perform better when dealing with constant acceleration (CA) movement. However, both methods need to be applied on each range unit to detect all the potential targets. Hence, the calculation amount is difficult to be accepted.
Besides the mentioned limitations, the above methods also treat the RCM and DFM as two separate problems. Therefore, they cannot maintain the ideal performance when the integration time is further increased. To solve this problem, Radon Fourier transform (RFT) and its generalized form (GRFT) [28,29,30] have been widely concerned recently. RFT and GRFT can simultaneously realize RCMC and DFM by searching motion parameters. However, the parameter searching process is much more computationally intensive than the previous coherent integration methods.
In summary, existing methods generally have the disadvantages of low integration gain or large calculation amount. Therefore, a novel coherent integration method, which takes into account both high integration gain and low calculation amount, was proposed in this paper. In the proposed method, the dynamic programming (DP) is first used for RCM correction. Then, the rough motion parameters are estimated according to the track obtained with DP. Based on the rough motion parameters, FrFT is used for accurate motion parameters estimation and phase compensation. Finally, target detection is performed in FrFT domain. Since the method does not need to traverse the motion parameters, the calculation amount is also greatly reduced.
The remainder of the paper is organized as follows. In Section 2, the motion model of aerial insects is analyzed by experiment datasets and the mathematical model of target echo is established. In Section 3, the principle of the proposed long-time coherent integration algorithm is introduced in detail. In Section 4, the performances of the proposed method are analyzed by numerical simulations and field experiments. In Section 5, conclusions and possible future research tracks are given.
2. Signal Model
2.1. Motion Model of Aerial Insects
The key to coherent integration is motion compensation, so it is necessary to know its motion model.
First, we used the experiment data to analyze the free-flying insect's motion model. The experiment data was obtained by a high-resolution Ku-band vertical-beam experimental entomological radar, whose resolution is 0.2 m. The raw radar data was collected in September 2018 at Xilinhot League, Inner Mongolia, China. In one night's datasets, two hundred datasets containing a large number of insects with high SNR were selected to analyze the insect's movement model.
The processing result of a typical piece of data is shown in Figure 1. The RCM phenomenon can be obviously seen from the range profiles of an insect in multiple pulses (Figure 1a). Then, we extract the target echo and perform short-time Fourier transform [31] to obtain a time-frequency figure as shown in Figure 1b. We can see that the Doppler velocity of the target changes from 1 m/s to 0.5 m/s, and this change is approximately a slant line. It indicates that there is acceleration in the flight of the insect.

Figure 1.
The processing result of a typical piece of data. (a) is the time-range image of the typical data; (b) is the time-velocity image of the target after short-time Fourier transform
With the same method, the tracks of more than 4600 targets in 200 datasets are analyzed and the target accelerations are counted. It can be seen from this histogram (Figure 2) that, in about 40% of insects, their accelerations spread between 0 and 0.5 m/s2, while in the rest 60%, their accelerations exceed 0.5 m/s2. Hence, we can conclude that a considerable number of insects have obvious acceleration in their migration. So in the long-time integration detection algorithm, the maneuvering situation must be considered.
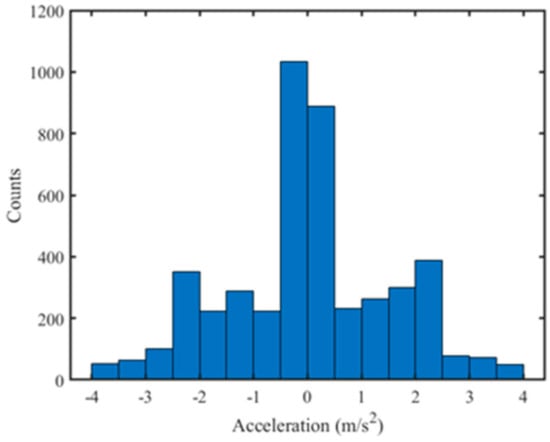
Figure 2.
The histogram of acceleration of 4600 insects.
2.2. Echo Signal Model
In modern radar systems, the chirp signal and pulse compression technique are usually used to SNR. With stop-go model, the target echo can be expressed as [32]:
where is the echo amplitude, is the rectangular window, is the pulse duration, is the frequency rate of linear frequency modulated (LFM) signal, is the velocity of light, is the carrier frequency and is the round transmitting delay, which can be obtained with
where is the target range, is pulse repetition period (PRT), and is the pulse serial number.
Then the pulse compression result can be expressed as:
where represents the signal bandwidth.
For a moving target, the range can be expanded into a polynomial by Taylor formula, that is:
where , , and are the starting range, speed, acceleration and jerk of target motion, respectively.
According to the conclusion we got in Section 2.1, the range for insects can be simplified by assuming a constant acceleration:
Then, by taking (5) into (3), the target signal can be further expanded:
In Equation (6), and are the amplitude and envelope of pulse compression result, respectively, and the phase term is a quadratic phase about . It can be seen from the formula that when the target velocity/acceleration is small or the integration time is short, the primary term and secondary term of the model can be ignored. At this time, the target lies in the same range cell (i.e., ) in the echoes of multiple pulses, so coherent integration can be simply achieved with FFT between pulses (i.e., traditional MTD). However, when the integration time is long, the target will occupy different range-bins in different PRTs and has changing Doppler frequency over time, that is, RCM and DFM occur, and so the traditional MTD or FrFT cannot be applied directly.
3. Algorithm Principle
Aiming at the above problems, many coherent integration methods have been proposed. However, most of the existing methods have contradictions between the integration performance and the calculation amount, which limit their application in practice.
Therefore, a novel long-time coherent integration algorithm based on DP-FrFT is introduced in this section. The method performs track search and motion compensation with DP and FrFT, respectively, which can significantly reduce the calculation amount while maintaining the integration performance.
The algorithm is mainly composed of four parts of track quick search, phase compensation, target detection and track correction. The diagram is shown in Figure 3 and the details will be given in following sections.
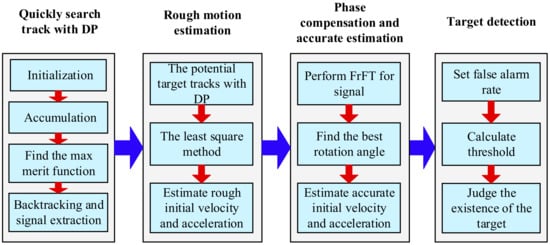
Figure 3.
The flowchart of the integration algorithm based on dynamic programming and fractional Fourier transforming (DP-FrFT).
3.1. Quickly Search Track With DP
To achieve echo integration, the complex amplitude sequence along the target track should be firstly obtained. In traditional algorithms, keystone transform and RFT are most commonly used. However, they have the problems of fuzzy speed estimation and large computational amount. Therefore, in the proposed algorithm, the DP technology is used to achieve a fast trajectory search.
DP is a mathematical method for decision process optimization, which is often used in the shortest/longest path search problems [33]. The main idea of DP is to seek the potential tracks with signal energy on the range-time plane. The detailed steps are shown as below.
(1) Merit function initialization
For one-dimensional range profile of the first stage (i.e., PRT), a target exists in any range unit. The merit function initialization can be expressed as the following formula,
where represents th state (i.e., th range unit) at the first stage, and is the total number of range units at the first stage. represents the observation of state , generally the amplitude or power of the range unit. is merit function (i.e., cost function), indicating the energy of a potential target track. records the state of the previous stage for backtracking track corresponding to , initialized to 0.
(2) Merit function accumulation
When , for a state at stage , its merit function can be calculated by Equation (8).
where is the merit function corresponding to and records the state of the previous stage for backtracking track corresponding to . represents the state set at stage , from which a transition to a particular state is possible.
(3) Finding the maximum merit function
At stage , find the maximum merit function and get the corresponding state , as shown in the following formula:
(4) Backtracking and signal extraction
For the state found in the step (3), use the to backtrack its complete track starting from the stage :
represents the corresponding state at stage . Then, the signal of the track can be extracted by and radar echo after pulse compression.
If this track comes from a real target, then and can be further expressed according to the signal model (6),
So, the RCM is eliminated after the search is completed.
3.2. Rough Motion Estimation Based on the Track With DP
After the above processing, we have obtained the potential target tracks with DP. Although these tracks have certain errors due to the influence of non-ideal factors such as target fluctuations, strong clutters, etc., the rough motion parameters can be estimated based on the track obtained with DP.
Assuming the tracks obtained with Equation (11) can be further expressed as:
where is the true range of the target, and is the track error of the DP search. For the error , it may take a positive value or a negative value, and the probability of either of the two cases is the same. Here we assume that it follows Gaussian distribution, and so the least square method can optimally estimate the motion parameters.
The rough motion parameters can be obtained by the following formula:
where
After the least square method is completed, the estimated rough acceleration and speed can limit the search range of FrFT, thereby reducing the calculation complexity of FrFT.
3.3. Phase Compensation and Accurate Estimation by FrFT
Phase compensation is the key process of achieving ideal coherent integration. Traditional MTD uses FFT to achieve coherent integration of stationary signals. But for maneuvering target, the echo is non-stationary, and the MTD method will have a large integration loss. Hence, FrFT is adopted to compensate the second-order phase in our algorithm. In order to reduce the calculation amount, FrFT in our method is only needed for echoes from a limited number of potential target tracks obtained by DP, and FrFT’s acceleration search range is also narrowed down based on previous rough estimates. So, the velocity and acceleration can be accurately and efficiently estimated based on the result of FrFT.
FrFT is an extension of the traditional Fourier transform (FT) and is often used to compensate the secondary phase of the linear frequency modulated (LFM) signal. Compared with the FT, the FRFT has an additional degree of freedom, that is, rotation angle. The FRFT includes a quadratic form in its kernel function, which completes the phase compensation in the proper FrFT domain. Assuming the input signal in time domain is , its FrFT can be expressed as:
where is rotation angle, is the FrFT domain and is the kernel function of FrFT:
For the moving target considered in this paper, its phase can be expressed as , where the first-order term and second-order term correspond to and of the FrFT kernel function, respectively. Therefore, using FrFT for phase compensation of a moving target, the target signal can be integrated as an impulse in the proper FrFT domain.
In Section 3.1, we extracted the signal after eliminating the RCM by DP as shown in Equation (11). It can be further shortened to:
where is a constant.
Substituting Equation (18) into Equation (16), the FrFT of can be written as:
where denotes the total number of pulse. When and satisfy Equation (20), can obtain the maximum value.
Therefore, the FrFT of the signal can be converted to the FrFT domain plane , and then the peak can be searched in the plane.
Assuming the peak position is , the initial velocity and acceleration of the target can be estimated by using Equation (20). The peak position also shows that the integration gain is best when the rotation angle is . So, the signal in FrFT domain at rotation angle is extracted for subsequent target detection.
3.4. Target Detection
After the above two steps, the target echo has been well integrated. Therefore, target detection can be used to determine the presence or absence of a target and provide input for subsequent parameter estimation. Since FrFT is a linear transformation, in an environment where only noise is considered, the noise in FrFT domain after FrFT is still subject to Gaussian distribution. Therefore, we use the most classic CA-CFAR (cell average constant false alarm) detector for target detection. In the CA-CFAR detector, the background clutter power level is estimated from the average value of the reference unit samples. It is a maximum likelihood estimation of the clutter power level under the assumption that the reference unit sampling obeys the exponential distribution [34].
For a detection unit , the detection decision principle is:
where is the detection threshold, and it can be calculated by the following formula:
where is the false alarm rate, is the number of reference units, is the number of protection units and is the power of the reference unit.
4. Numerical Simulation and Radar Experiments
In this section, the performance of DP-FrFT is evaluated and compared with traditional integration methods such as MTD, Keystone-MTD and FrFT. Based on simulation and field experiments data, the factors of integration gain, time-consuming and detection probability are discussed in detail.
4.1. Numerical Simulations
In this section, we verify the function of the algorithm through simulation and analyze the ideal performance of indicators such as integration gain, time-consuming, detection probability and the accuracy of velocity and acceleration estimation. The main parameters used in the simulation are shown in Table 1.

Table 1.
Simulated parameters.
4.1.1. Integration Gain
Assuming that the SNR of a single pulse is 3dB and increasing the number of integrated pulses from 1 to 1000 (i.e., 2 ms~2 s), the integration gain of different algorithms can be seen from Figure 4. In the figure, the red dotted line on the diagonal is the theoretical integration gain, which is equal to the number of integrated pulses for the coherent integration algorithm. The blue curve is the integration gain of the simulation of the corresponding algorithm.
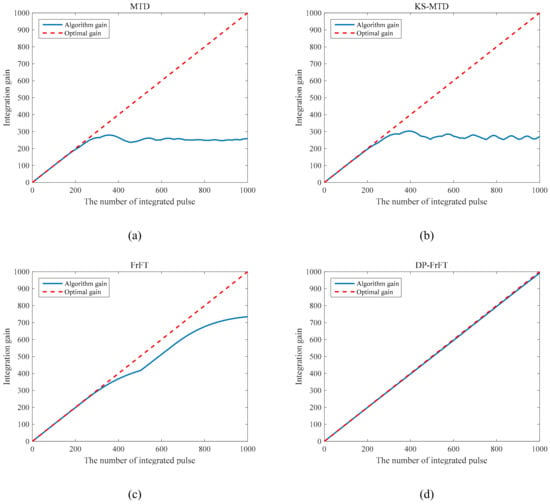
Figure 4.
The integration gain in different methods. (a) is the integration gain with the number of integrated pulse in moving target detector (MTD); (b) is the result in Keystone-MTD; (c) is the result in fractional Fourier transforming (FrFT); (d) is the result in DP-FrFT (our method).
Figure 4a shows the integration gain of the MTD with the number of pulses. After about 200th pulse, the gain loss began to become obvious due to the DFM resulting from acceleration. When the number of the integrated pulse is greater than 400, the displacement of the target has been greater than one range unit, reaching the upper limit of loss, so its gain no longer changes. Figure 4b is the result of Keystone-MTD. Although it partially compensates for the RCM, the DFM still causes a very large gain loss. After about 500th pulse, its gain no longer changes. Figure 4c is the result of FrFT. It compensates the phase well and eliminates the effect of DFM. When the number of the integrated pulse is greater than 400, the target moved across one range unit and the gain loss began to become obvious. Finally, Figure 4d is the result of DP-FrFT. It corrects RCM and compensate phase at the same time, so there is almost no gain loss.
4.1.2. Time-Consuming
In terms of time-consuming, we first analyze the theoretical computational complexity of different integration algorithms. And then, the running time of these six algorithms with the number of pulse is statistically compared by Monte Carlo simulations.
Consider a data matrix of size , where is the number of integrated pulses and is the number of range sampling points per pulse. For the FFT operation of N-point sequence, the theoretical computational complexity is . The theoretical complexity of different algorithms is shown in Table 2.

Table 2.
The theoretical computational complexity of different methods.
In Monte Carlo simulations, the radar system parameters are consistent with those in Table 1. The running time of different algorithms is shown in Figure 5 (the running time normalized by MTD).
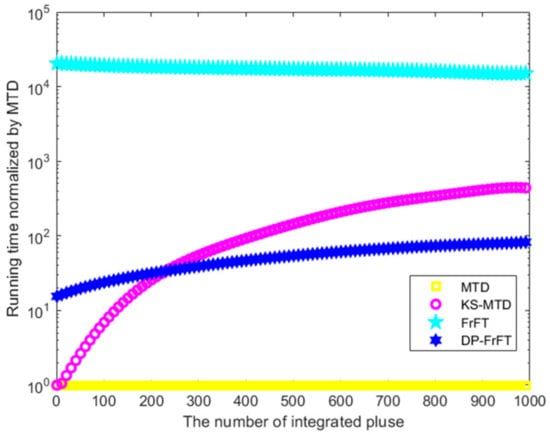
Figure 5.
Time-consuming of different methods.
We can see from the figure: (1) The operation of FrFT takes the longest time, which is about 15,000 times the MTD algorithm under the same conditions; (2) the running time of KS-MTD mainly comes from Keystone processing, and it increases with the increase of the number of pulses; (3) the running time of the DP-FrFT algorithm is 10 times to 100 times that of MTD. DP-FrFT is second only to MTD in terms of time consumption.
4.1.3. Detection Probability
In order to verify that our algorithm has a very good detection performance for strong maneuvering targets, a target with a speed of 1 m/s and an acceleration of −0.8 m/s2 is set in the simulation. The SNR of a single pulse is changed from −10 dB to 10 dB and the false alarm probability is set to 10−6. For the integration result of 1000 pulses, we perform target detection and evaluate the detection probability. For each SNR, the detection probability is the average value of 1000 Monte Carlo simulations.
As shown in Figure 6, DP-FrFT has the strongest detection performance, and the detection probability is close to 1 under the condition of SNR = 0 dB, while the sub-optimal FrFT needs to be SNR = 4 dB to achieve this detection probability. However, in the case of SNR lower than 0 dB, there is a sharp decrease in the curve of detection probability for DP-FrFT. Especially when SNR is lower than −8dB, the target is basically not detected. In fact, the sharp decrease of detection probability results from the limit of DP search capability. In an environment with an extremely low SNR, the track with the highest energy is probably not the track from target. Then the searched track will seriously deviate from the real track, and even the track cannot be effectively corrected using the estimated parameters of FrFT. So, the integration loss is serious and the detection probability is greatly reduced under extremely low SNR.
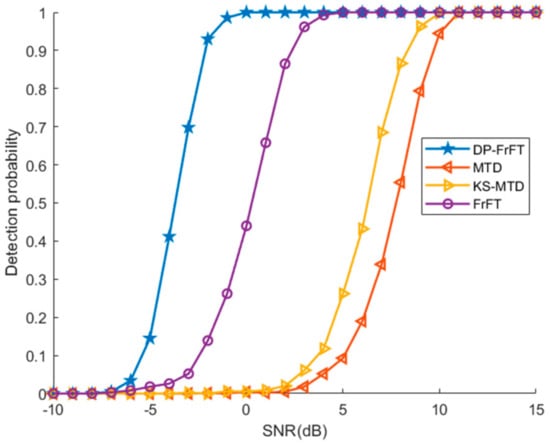
Figure 6.
Detection probability of four methods under different signal-to-noise ratios (SNRs).
In practical applications, it may be necessary to detect targets with very low SNR. In this case, MTD, Keystone-MTD or other integration methods can be first used to perform short-time coherent integration, so as to make the target SNR in a single coherent processing interval (CPI) reach more than 0dB. Finally, DP-FrFT is used for long-time coherent integration of multiple CPI signals to complete the detection under extremely low SNR.
4.1.4. Accuracy of Motion Parameters Estimation
In order to verify the high accuracy of our method on estimating target motion parameters, we perform Monte Carlo simulations with the simulation parameters in Section 4.1.3, and calculate the estimated speed and acceleration errors. The result obtained by the Drake and Wang’s method [4] is used as a comparison with the result of our method. In the Drake and Wang’s method, non-coherent integration method is used to detect insects and the motion parameters are estimated by the change of the range.
Under the condition of the low SNR, the detection performance of the non-coherent integration method is poor, and it is difficult to obtain the target track. To be fair, we use the track obtained by DP-FrFT as the standard. For our method, the motion parameters are estimated by phase compensation for the track echo; for the Drake and Wang’s method, the motion parameters are estimated by curve fitting for the track range.
After 1000 Monte Carlo simulations, the estimation accuracy of the two methods is shown in the figure below:
It can be seen from Figure 7 that with the increase of SNR, both methods have a higher estimation accuracy. And when the SNR is very low, our method of using phase compensation to estimate motion parameters has a higher accuracy than the Drake and Wang’s method.
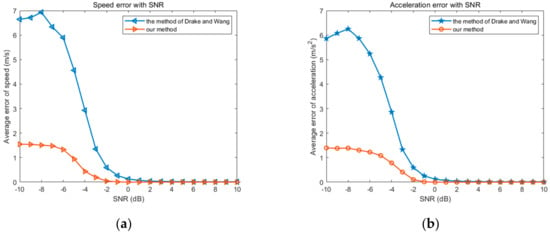
Figure 7.
The motion parameters estimation errors of two methods. (a) shows the different speed error with SNR in our method and Drake’s; (b) shows the different acceleration error with SNR in our method and Drake’s.
4.2. Field Experiments
In this section, we further evaluated the proposed algorithm with field experiments data. The data is derived from a Ku-band vertical-beam entomological radar and the main system parameters are shown in Table 3.

Table 3.
System parameters.
The radar collected the data in September 2018 at Xilinhot League, Inner Mongolia, China. At that time, many migrating insects passed there. The radar was placed on a flat and open grass; hence, the echo contains little clutter. There is a trap lamp next to the radar to attract insects at night. The working environment of the radar is shown in Figure 8. The radar started working around 8 p.m., when there were many migratory insects. This radar worked for one night, and we randomly selected 157 time periods of data (about 8 min) for processing.
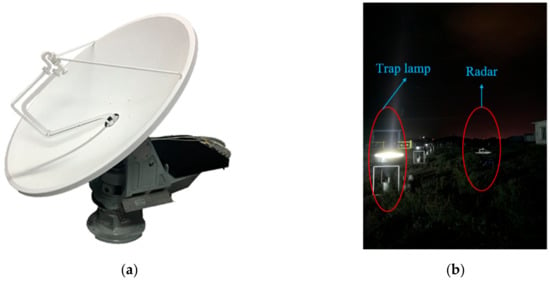
Figure 8.
The radar system and its working environment. (a) shows the Ku-band vertical-beam entomological radar; (b) shows the working environment of the radar.
In order to verify the processing performance of the DP-FrFT algorithm on the measured data, the DP-FrFT and MTD algorithms are used to the selected 157 time periods of data.
For DP-FrFT and MTD, every 1 s is as a CPI to complete the target detection and obtain the corresponding track. For MTD, since the maximum speed of the insect can reach 10 m/s [35], we perform sliding windows at 20 ms intervals to obtain a relatively stable detection results, and then the detection results are associated with each other to obtain the corresponding track by the nearest neighbor method and Kalman filtering. In both algorithms, the false alarm rate is set to .
As an example, a piece of typical detection result is showed in Figure 9. Figure 9a the time-range image corresponding to the detection result, where the SNR of the target is low. In Figure 9b, the detection results by MTD are shown, and the detection results by DP-FrFT are shown in Figure 9c.
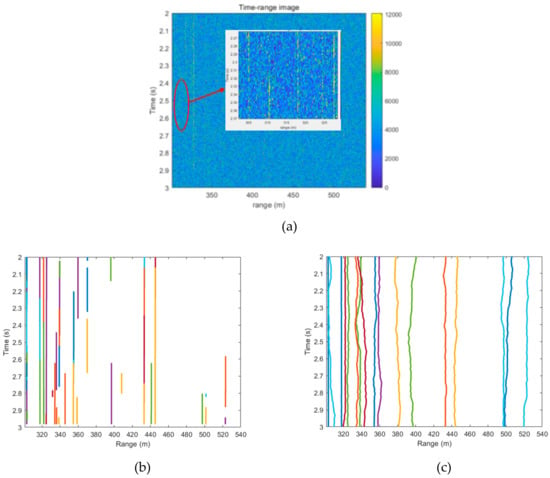
Figure 9.
The typical detection result by MTD and DP-FrFT. (a) is the time-range image corresponding to the detection result; (b) is the detection results by MTD; (c) is the detection results by DP-FrFT.
In Figure 9b,c, the lines of different colors represent the track of different targets. It can be seen from Figure 9b that, for MTD,
- (1)
- due to insufficient integration gain, the target is not detected in some time periods, so there are a large number of interrupted tracks;
- (2)
- due to RCM and DFM, the energy of the target is diverged, and one target may be detected as multiple targets, leading to the splitting of the target track.
The performance of DP-FrFT can be seen from Figure 9c in which the complete trajectories of all targets are obtained, without interruptions or splits. In addition, the tracks obtained by DP-FrFT is more tortuous than by MTD. This is caused by the smoothing of sliding window and the mismatch of the motion model in the MTD. So, the tracks obtained by DP-FrFT can better reflect the details of the insect target movement.
Obviously, due to the phenomenon of track interruption obtained by the MTD, we cannot compare the detection and tracking performance of DP-FrFT and MTD by the number of detected tracks. So, we propose a new indicator to quantify the performance, that is the sum of the duration of all target tracks. We counted each trajectory in the same algorithm and accumulated the duration of these trajectories. The greater the sum of the durations, the more stable the algorithm can track maneuvering weak targets (insects), and the stronger its detection and tracking performance.
In addition, the processing results for 157 time periods of data are shown in the following table. As can be seen from Table 4, DP-FrFT and MTD in the sliding window have basically the same time-consuming, but the detection and tracking performance of DP-FrFT is 40% higher than MTD in the sliding window.

Table 4.
The processing results by MTD and DP-FrFT.
5. Conclusions
In this paper, we used the experimental data to analyze the insect motion model and found that more than half of the insects had significant acceleration. Then, a new long-time coherent integration detection method for maneuvering aerial insects is proposed. By DP, the new method can quickly find potential target tracks, and effectively eliminate RCM without motion parameter search. FrFT is used to compensate the phase of signals from potential target tracks. Compared with the conventional methods, numerical simulation and radar experiments show that this method greatly improves the computational efficiency as well as ensuring the detection performance. A possible future work might concern the coherent integration for the targets with high-order motion parameters and extremely low SNR.
Author Contributions
Conceptualization, R.W. and J.C.; methodology, J.C.; software, R.W.; validation, R.W., J.C. and C.Z.; formal analysis, C.Z.; investigation, J.C.; resources, R.W.; data curation, R.W.; writing—original draft preparation, R.W.; writing—review and editing, J.C.; visualization, T.Z.; supervision, C.H.; project administration, C.H.; funding acquisition, C.H. All authors have read and agreed to the published version of the manuscript.
Funding
This research received the National Natural Science Foundation of China, 31727901.
Conflicts of Interest
The authors declare no conflict of interest.
References
- Dingle, H.; Drake, V.A. What is migration? Bioscience 2007, 57, 113–121. [Google Scholar] [CrossRef]
- Hu, G.; Lim, K.S.; Horvitz, N.; Clark, S.J.; Reynolds, D.R.; Sapir, N.; Chapman, J.W. Mass seasonal bioflows of high-flying insect migrants. Science 2016, 354, 1584–1587. [Google Scholar] [CrossRef] [PubMed]
- Jansson, S.; Brydegaard, M. Passive kHz lidar for the quantification of insect activity and dispersal. Anim. Biotelemetry 2018, 6, 6. [Google Scholar] [CrossRef]
- Drake, V.A.; Wang, H. Ascent and descent rates of high-flying insect migrants determined with a non-coherent vertical-beam entomological radar. Int. J. Remote Sens. 2019, 40, 883–904. [Google Scholar] [CrossRef]
- Bauer, S.; Shamoun-Baranes, J. The grand challenges of migration ecology that radar aeroecology can help answer. Ecography 2019, 42, 861–875. [Google Scholar] [CrossRef]
- Chilson, P.B.; Bridge, E.; Frick, W.F.; Chapman, J.W.; Kelly, J.F. Radar aeroecology: Exploring the movements of aerial fauna through radio-wave remote sensing. Biol. Lett. 2012, 8, 698–701. [Google Scholar] [CrossRef] [PubMed]
- Cui, K.; Hu, C.; Wang, R.; Sui, Y.; Mao, H.; Li, H. Deep-learning-based extraction of the animal migration patterns from weather radar images. Sci. China Inf. Sci. 2020, 63, 140304. [Google Scholar] [CrossRef]
- Skolnik, M.I. Introduction to Radar System, 3rd ed.; McGraw-Hill: Columbus, OH, USA, 2002. [Google Scholar]
- Hu, C.; Wang, Y.; Wang, R.; Zhang, T.; Cai, J.; Liu, M. An improved radar detection and tracking method for small UAV under clutter environment. Sci. China Inf. Sci. 2019, 62, 29306. [Google Scholar] [CrossRef]
- Yang, J.; Liu, X. Detection and speed estimation of moving target based on phase compensation and coherent accumulation using fractional fourier transform. Sensors 2020, 20, 1410. [Google Scholar] [CrossRef]
- Carlson, B.D.; Evans, E.D.; Wilson, S.L. Search radar detection and track with the Hough transform. III. Detection performance with binary integration. IEEE Trans. Aerosp. Electron. Syst. 1994, 30, 116–125. [Google Scholar] [CrossRef]
- Satzoda, R.; Suchitra, S.; Srikanthan, T. Parallelizing the Hough Transform Computation. IEEE Signal Process. Lett. 2008, 15, 297–300. [Google Scholar] [CrossRef]
- Zhou, Y.; Bi, D.; Shen, A.; Wang, X. Hough transform-based large micro-motion target detection and estimation in synthetic aperture radar. IET Radar Sonar Navig. 2019, 13, 558–565. [Google Scholar] [CrossRef]
- Carretero-Moya, J.; Gismero-Menoyo, J.; Asensio-Lopez, A.; Blanco-del-Campo, A. Application of the radon transform to detect small targets in sea clutter. IET Radar Sonar Navig. 2009, 3, 155–166. [Google Scholar] [CrossRef]
- Kong, Y.-K.; Cho, B.-L.; Kim, Y.-S. Ambiguity-free Doppler centroid estimation technique for airborne SAR using the radon transform. IEEE Trans. Geosci. Remote Sens. 2005, 43, 715–721. [Google Scholar] [CrossRef]
- Wallace, W.R. The use of track-before-detect in pulse-Doppler radar. In Proceedings of the 2002 International Radar Conference, Edinburgh, UK, 15–17 October 2002. [Google Scholar]
- Grossi, E.; Lops, M.; Venturino, L. A novel dynamic programming algorithm for track-before-detect in radar systems. IEEE Trans. Signal Process. 2013, 61, 2608–2619. [Google Scholar] [CrossRef]
- Yi, W.; Kong, L.; Yang, J.; Morelande, M.R. Student highlight: Dynamic programming-based track-before-detect approach to multitarget tracking. IEEE Aerosp. Electron. Syst. Mag. 2012, 27, 31–33. [Google Scholar] [CrossRef]
- Tonissen, S.M.; Evans, R.J. Peformance of dynamic programming techniques for track-before-detect. IEEE Trans. Aerosp. Electron. Syst. 1996, 32, 1440–1451. [Google Scholar] [CrossRef]
- Johnston, L.A.; Krishnamurthy, V. Performance analysis of a dynamic programming track before detect algorithm. IEEE Trans. Aerosp. Electron. Syst. 2002, 38, 228–242. [Google Scholar] [CrossRef]
- Li, G.; Xia, X.-G.; Peng, Y.-N. Doppler keystone transform: An approach suitable for parallel implementation of SAR moving target imaging. IEEE Geosci. Remote Sens. Lett. 2008, 5, 573–577. [Google Scholar] [CrossRef]
- Zhu, D.; Li, Y.; Zhu, Z. A keystone transform without interpolation for SAR ground moving-target imaging. IEEE Geosci. Remote Sens. Lett. 2007, 4, 18–22. [Google Scholar] [CrossRef]
- Zhan, M.; Huang, P.; Liu, X.; Liao, G.; Zhang, Z.; Wang, Z.; Hou, Q. Space Maneuvering Target Integration Detection and Parameter Estimation for a Spaceborne Radar System with Target Doppler Aliasing. IEEE J. Sel. Top. Appl. Earth Obs. Remote Sens. 2020, 13, 3579–3594. [Google Scholar] [CrossRef]
- Lv, X.; Bi, G.; Wan, C.; Xing, M. Lv’s distribution: Principle, implementation, properties, and performance. IEEE Trans. Signal Process. 2011, 59, 3576–3591. [Google Scholar] [CrossRef]
- Chen, X.; Guan, J.; Liu, N.; He, Y. Maneuvering target detection via Radon-Fractional Fourier transform-based long-time coherent integration. IEEE Trans. Signal Process. 2014, 62, 939–953. [Google Scholar] [CrossRef]
- Namias, V. The fractional order Fourier transform and its application to quantummechanics. IMA J. Appl. Math. 1980, 25, 241–265. [Google Scholar] [CrossRef]
- Guan, J.; Chen, X.-L.; Huang, Y.; He, Y. Adaptive fractional Fourier transform-based detection algorithm for moving target in heavy sea clutter. IET Radar Sonar Navig. 2012, 6, 389–401. [Google Scholar] [CrossRef]
- Xu, J.; Yu, J.; Peng, Y.-N.; Xia, X.-G. Radon-Fourier transform for radar target detection (I): Generalized Doppler filter bank processing. IEEE Trans. Aerosp. Electron. Syst. 2011, 47, 1186–1202. [Google Scholar] [CrossRef]
- Xu, J.; Yu, J.; Peng, Y.-N.; Xia, X.-G. Radon-Fourier transform for radar target detection (II): Blind speed sidelobe suppression. IEEE Trans. Aerosp. Electron. Syst. 2011, 47, 2473–2489. [Google Scholar] [CrossRef]
- Yu, J.; Xu, J.; Peng, Y.-N.; Xia, X.-G. Radon-Fourier transform for radar target detection (III): Optimality and fast implementations. IEEE Trans. Aerosp. Electron. Syst. 2012, 48, 991–1004. [Google Scholar] [CrossRef]
- Han, S.K.; Kim, H.T.; Park, S.H.; Kim, K.T. Efficient radar target recognition using a combination of range profile and time-frequency analysis. Prog. Electromagn. Res. 2010, 108, 131–140. [Google Scholar] [CrossRef]
- Lin, L.; Sun, G.; Cheng, Z.; He, Z. Long-Time Coherent Integration for Maneuvering Target Detection Based on ITRT-MRFT. IEEE Sens. J. 2020, 20, 3718–3731. [Google Scholar] [CrossRef]
- Mannila, H.; Orponen, P. Algorithms and Applications; Springer: Berlin/Heidelberg, Germany, 2010. [Google Scholar]
- Finn, H.M. Adaptive detection mode with threshold control as a function of spatially sampled clutter-level estimates. RCA Rev. 1968, 29, 414–465. [Google Scholar]
- Hu, C.; Li, W.; Wang, R.; Li, Y.; Li, W.; Zhang, T. Insect flight speed estimation analysis based on a full-polarization radar. Sci. China Inf. Sci. 2018, 61, 109306. [Google Scholar] [CrossRef]
© 2020 by the authors. Licensee MDPI, Basel, Switzerland. This article is an open access article distributed under the terms and conditions of the Creative Commons Attribution (CC BY) license (http://creativecommons.org/licenses/by/4.0/).