Article

Spatiotemporal Variation of Vegetation on the Qinghai–Tibet Plateau and the Influence of Climatic Factors and Human Activities on Vegetation Trend (2000–2019)

Institute of Desertification Studies, Chinese Academy of Forestry, Beijing 100091, China
*
Author to whom correspondence should be addressed.
Remote Sens. 2020, 12(19), 3150; https://doi.org/10.3390/rs12193150
Submission received: 31 August 2020 / Revised: 18 September 2020 / Accepted: 22 September 2020 / Published: 25 September 2020
(This article belongs to the Special Issue Remote Sensing of Vegetation Dynamics and Resilience)

Abstract

:
Vegetation is the terrestrial ecosystem component most sensitive to climate change. The Qinghai–Tibet Plateau (QTP), characterized by a cold climate and vulnerable ecosystems, has experienced significant warming in previous decades. Identifying the variation in vegetation coverage and elucidating its main driving factors are critical for ecological protection on the QTP. In this study, MOD13A2 Normalized Difference Vegetation Index (NDVI) data in the growing season (May to September) was used to represent QTP vegetation coverage during 2000–2019. The univariate linear regression, partial correlation analysis, residual analysis, and the Hurst exponent were used to detect the vegetation spatiotemporal dynamic, analyze the relationship between the vegetation and main driving factors, and predict the future vegetation dynamic. The growing season NDVI (GNDVI) of the QTP showed an extremely significant rate of increase (0.0011/a) during the study period, and 79.29% of the vegetated areas showed a greening trend. Over the past 20 years, the northeast, mid-east, and western edges of the plateau have been cooling and wetting, while the southwest, mid-west, and southeast have been warming and drying. Different climatic conditions lead to spatial differences in the response of plateau vegetation to climatic factors with generally 1–4 months lag time. The vegetation in the north of the plateau was mainly positively correlated with moisture, and negatively correlated with temperature, while the southern part showed positive correlation with temperature and negative correlation with moisture. Due to the enhancement of cooling and wetting trend in the last decade (2010–2019), especially in the south of the plateau, the greening trend of the plateau vegetation slowed down appreciably and even degraded in some areas. Human activities were mainly concentrated in the eastern part of the plateau—and its positive effect on vegetation was gradually increasing in most areas during study period, especially in the northeastern part. However, vegetation degradation caused by human activities in the southeast of the plateau should not be ignored. The future vegetation dynamic based on the Hurst exponent showed that the plateau faces a higher risk of vegetation degradation, which deserves more attention. This study explored the effect of climatic factors and human activities on vegetation of the QTP, thereby providing some guidance for the study of vegetation dynamic in the alpine areas.

Graphical Abstract

1. Introduction

The world has experienced significant warming over the past few decades, and this warming has produced a significant impact on vegetation [1,2,3]. Vegetation plays an irreplaceable role in the material circulation and energy flow of the terrestrial ecosystem [4,5,6,7]—and its change could also affect the climate by the feedback of surface moisture and thermal regulation [8,9,10,11]. Therefore, quantitative studies on the relationship between vegetation and climate help us to understand the influences of climate change on the ecosystem more accurately and implement sustainable development management measures [12,13].
The Qinghai–Tibet Plateau (QTP), located in southwestern China, is the largest geographical entity with the highest elevation. It is commonly called the “Third Pole” because the mean annual temperature of most areas of the QTP is <0 °C [14]. The QTP is the source of many Asian large rivers because of its vast reserves of glaciers, so it is also known as the “Asian water tower” [15]. As a powerful source of atmospheric heat [16], the QTP can also affect the climate of the Northern Hemisphere and even the entire world [17,18]. Since the 1950s, the QTP has experienced a uniform warming trend (0.16–0.67 °C/decade in different periods), which was almost twice the rate of global warming [19,20], and this upward trend is predicted to continue until the end of this century [21]. At the same time, the precipitation on the QTP has shown a slightly increasing trend (3.99–16.84 mm/decade in different periods) with strong spatial heterogeneity [20]. Overall, the QTP has become warming and wetting in the last few decades.
Because of the extreme hydrothermal conditions of the QTP, its ecosystem is highly fragile and very sensitive to climate change [22,23,24]. Numerous studies have shown that the vegetation on the QTP has improved in recent years affected by the increased temperature, including increased vegetation coverage [2,25,26], prolonged growth period [27,28,29,30], increased net primary productivity (NPP), and enhanced carbon absorption [31,32]. However, other studies have shown the opposite points. Research by Pang et al. [33] showed that the climate warming restricts vegetation growth since the end of the 1990s, because the high temperature would increase respiration and further inhibit vegetation growth, especially in areas with favorable water and temperature conditions [34]; Piao [29] and Yu [35] found that the green-up date was delayed at the beginning of this century; Chen et al. [36] and Huang et al. [37] found that higher temperatures could limit vegetation growth and reduce the vegetation NPP. Some studies thought that climate warming is the principal cause of land degradation on the QTP [38,39].
Compared with temperature, most studies showed that more precipitation can promote vegetation growth on the QTP [25,33,40]. However, a few studies have pointed out that precipitation has a negative effect on vegetation in some parts of the QTP [2,41], because the increased precipitation would reduce the temperature and solar radiation [42], contribute to soil erosion [43], and temperature decrease [44]. At present, many large-scale studies on vegetation dynamics used precipitation to reflect the water supply of the environment, but ignored the influence of evapotranspiration. The potential evapotranspiration represents the maximum ability of water to evaporate and transpire from a specific surface [45,46]. Previous studies have pointed out that the potential evapotranspiration of QTP has decreased significantly since the 1960s [47,48,49,50,51], but the increasing trend in potential evapotranspiration was also found after 1998 [50,51]. The change of potential evapotranspiration would directly affect the water supply capacity of surface soil to vegetation growth. Therefore, the influence of potential evapotranspiration on vegetation dynamics should not be ignored.
Affected by the vast area and complex geographical conditions of the plateau, there is strong spatial heterogeneity in the relationship between vegetation and climate on the plateau [34,52], which produced some controversies about the impact of climatic factors on vegetation growth on the QTP. Therefore, studying the dynamics of vegetation and its response to climate change could deepen the understanding of the vegetation change mechanism of the QTP under the background of climate warming, which has highly important ecological value and practical significance.
In addition to the natural climate, human activities also play an important role in affecting vegetation growth [36]. Compared with the large-scale influence of climatic factors on vegetation, the influence of human activities is more regional, especially in densely populated areas [2,24,53]. Human activities, such as population growth, mining, grazing, and urban expansion, would produce a negative impact on vegetation [19,54,55,56,57]. On the other hand, some human activities also have obvious positive effects on vegetation, such as environmental and ecological construction projects, have been implemented [58,59]. Restricted by natural conditions, the human activities intensity of the QTP was low overall; however, it has shown an increasing trend, which is significantly higher than the global level in the past few decades [60]. Therefore, in the context of climate warming, the impact of continuously increasing human activities on the QTP, a fragile (but important) region, has become a hot issue of global change.
The trend of vegetation dynamics not only reflects the conditions of vegetation changes during the study period, but also indicates its possible future directions [61]. The latter is more important because it allows us to adopt specific measures to cope with predicted changes in vegetation [62]. The Hurst exponent, which was an effective method to quantitatively describe the long-range dependence of time series data and to predict possible future change trends, has been widely used in hydrology, meteorology, finance, and other fields [63]. Several previous studies have used the Hurst exponent to analyze future vegetation dynamics [61,64,65,66]. Peng et al. [61] used the Hurst exponent method based on an AVHRR GIMMS NDVI dataset obtained during 1982–2003 to predict future vegetation change on the QTP. The result showed the Hurst exponent in most areas of the QTP was >0.5, which represented the consistency of the trends of vegetation dynamics after the study period. However, predictions of future vegetation variation based on recent trends of vegetation change on the QTP have not been reported.
As a simple and effective vegetation index, NDVI has been widely used in the study of vegetation dynamics, and numerous studies have used NDVI as a representative of vegetation activities [2,33,42,67]. This study used MOD13A2 NDVI data with 16-d temporal resolution and 1-km spatial resolution, acquired during 2000–2019, to analyze recent vegetation dynamics in the growing season on the QTP. Temperature data were obtained from MOD11A2 land surface temperature. In this paper, considering the influence of potential evapotranspiration, the moist coefficient was used instead of precipitation to more accurately reflect the relationship between water and vegetation dynamics. The moist coefficient was calculated from GPM precipitation data and MOD16A2 potential evapotranspiration data. We analyzed the climate change during the study period and calculated the correlation between vegetation and climatic factors on the QTP. On this basis, we used residual analysis to explore the impact of human activities on vegetation. Finally, based on the Hurst exponent, we predict the future vegetation trend. The purpose of this paper is (1) to understand the changing pattern of vegetation on the QTP in the past 20 years; (2) to understand the main driving mechanism of vegetation change from the perspective of both climatic and human factors.

2. Methods and Datasets
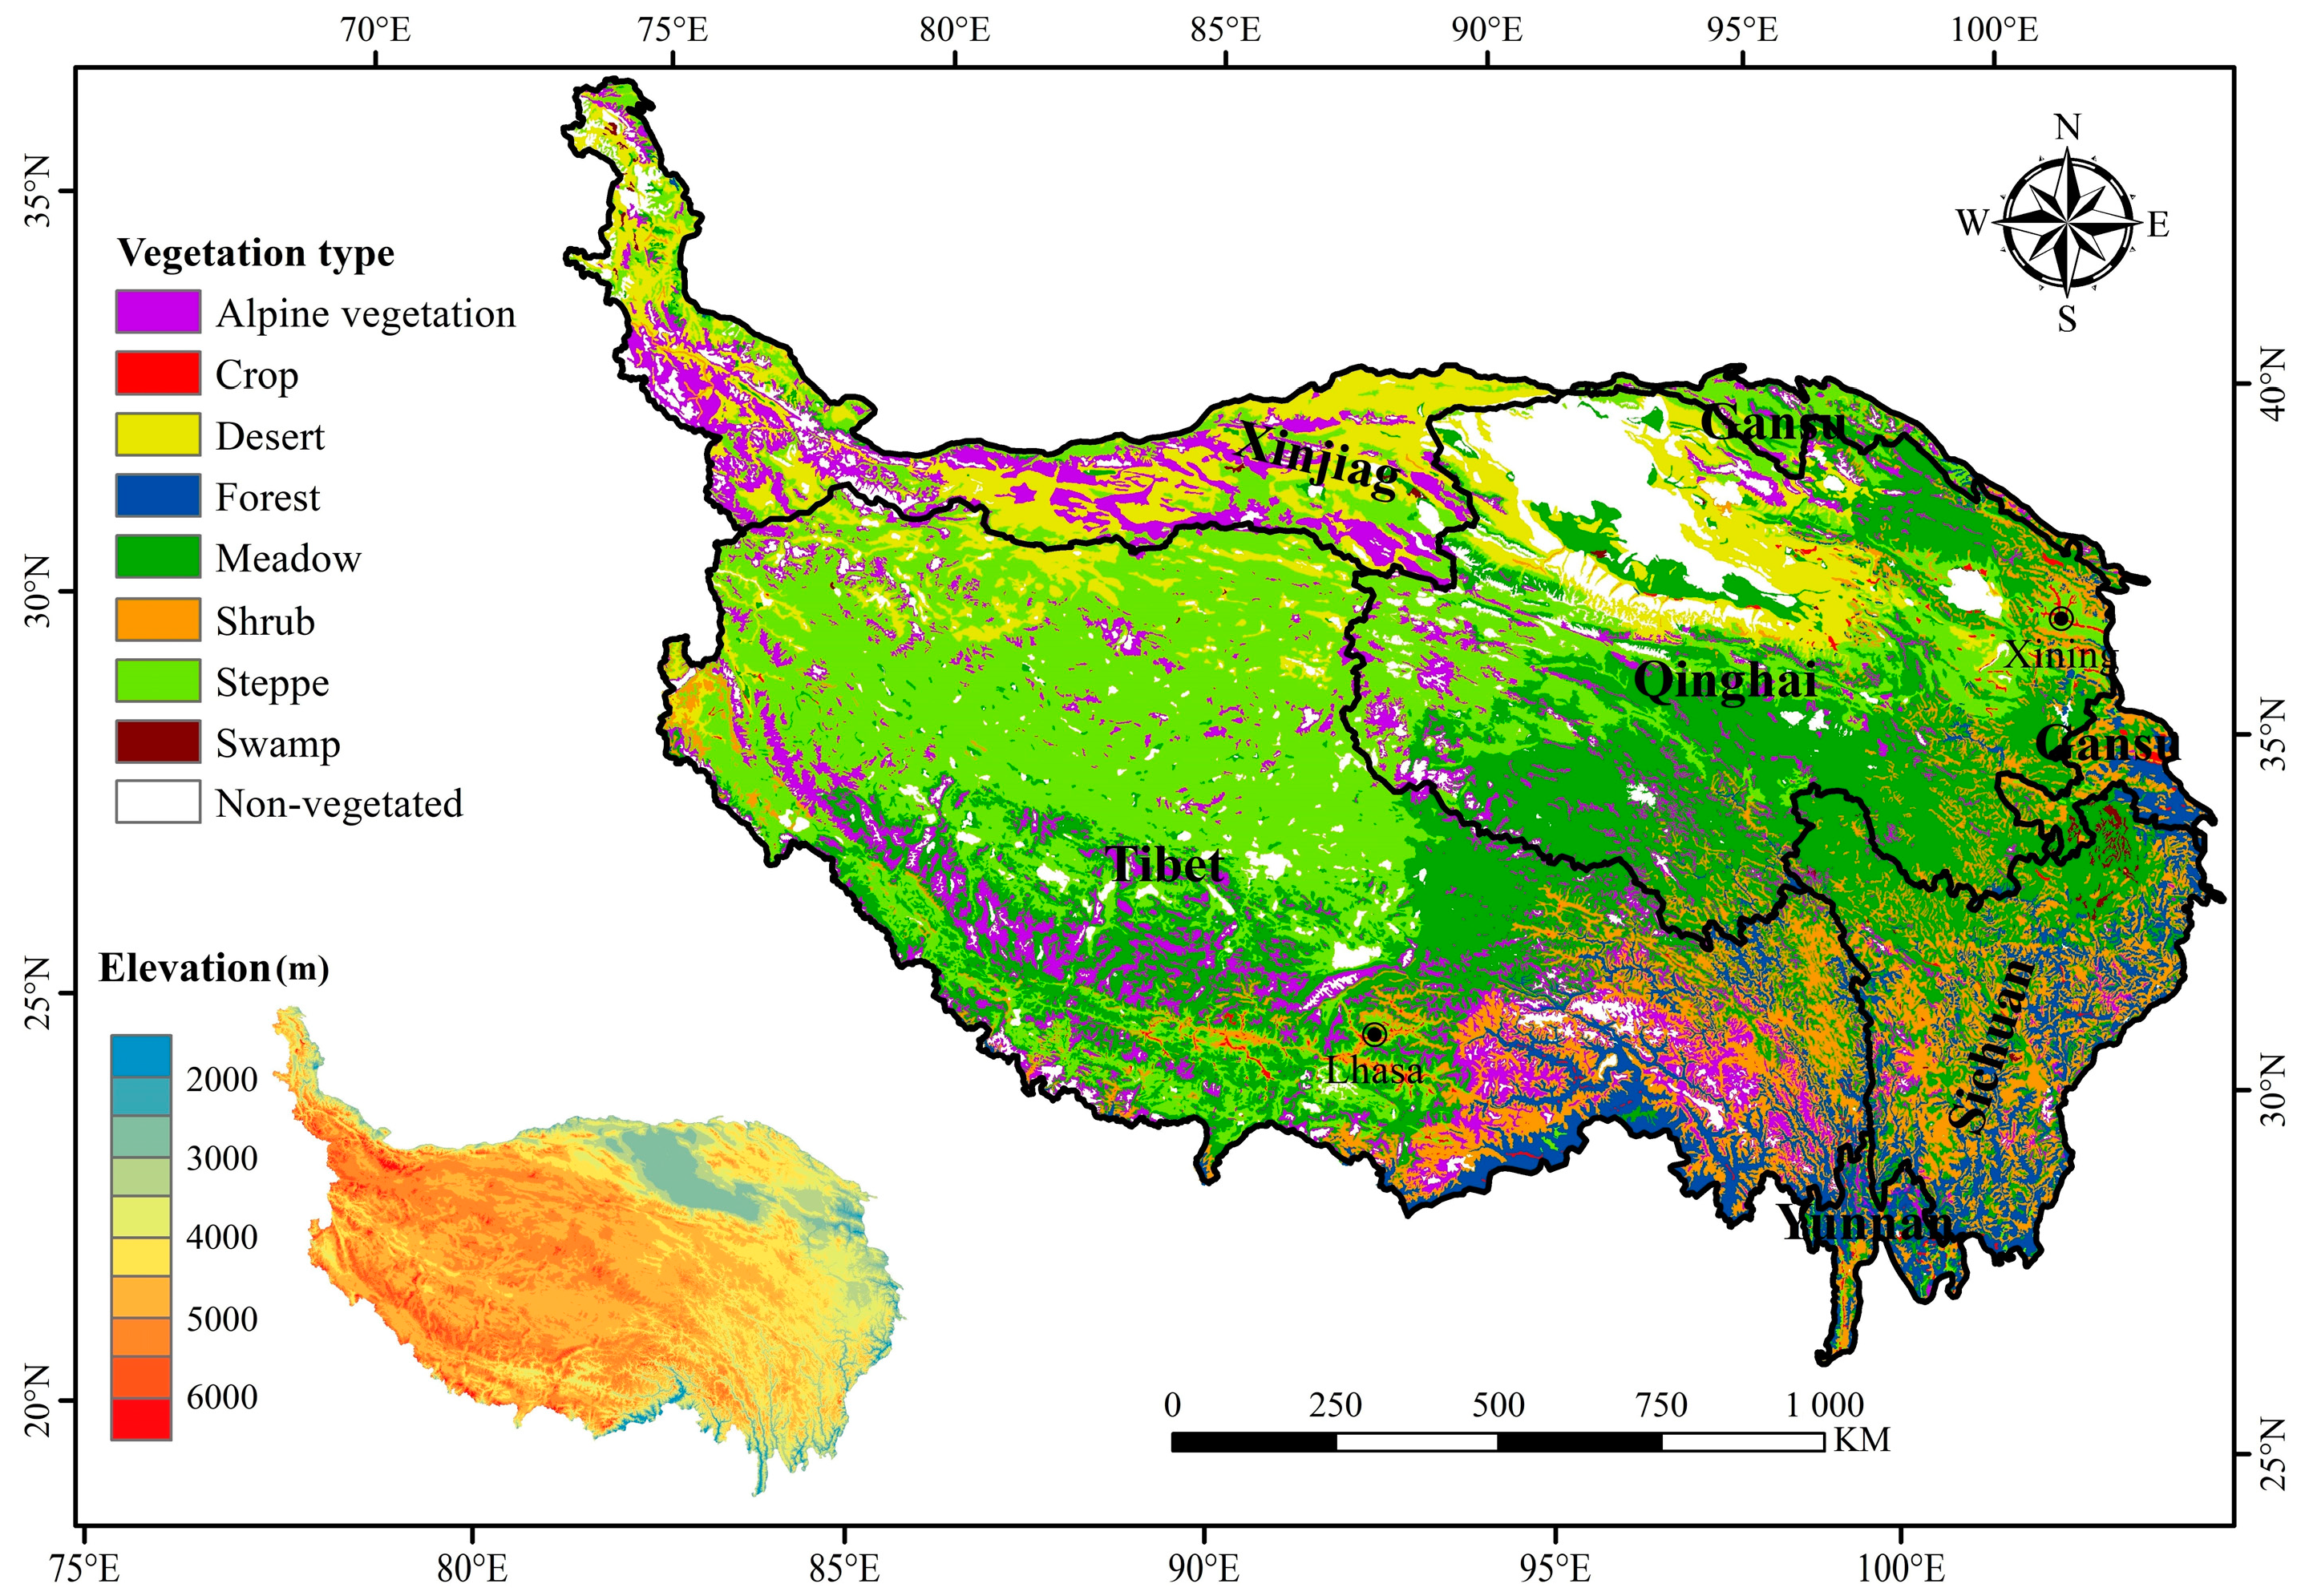
2.1. Study Area

The QTP is located in southwestern China, which covers an area of >2.5 million km2. It encompasses most of Tibet and Qinghai Province, and parts of Xinjiang, Gansu, Sichuan, and Yunnan provinces (Figure 1). The mean elevation of the QTP is more than 4000 m [7], which makes the plateau colder than any other regions at the same latitude [68]. In most of the QTP, the mean annual temperature is <0 °C, and the annual accumulated temperature >10 °C is <2000 °C [69]. The mean annual precipitation across the plateau is < 400 mm, which decreases from the southeast to the northwest with notable spatial difference [6]. Areas of forest and shrub are distributed mostly in the southeast of the plateau, while the desert is found primarily in northwestern areas of the QTP. As the two principal vegetation types, meadow and steppe occupy more than half the area of the plateau.

2.2. Data Sources and Preprocessing

2.2.1. NDVI Data

MOD13A2 NDVI data acquired from the National Aeronautics and Space Administration (https://ladsweb.modaps.eosdis.nasa.gov/) were used in this research. This data comprised the 16-day synthesized L3 data product with 1-km spatial resolution. Image splicing and projection transformation were applied using the MODIS Reprojection Tools (MRT). The Albers equal-area conic projection model was adopted with the Krasovsky datum. To further eliminate the contamination of clouds, we used a Savitzky–Golay approach to smooth the annual NDVI cycle, and then replaced the low-quality pixels based on the reliability data of MOD13A2 according to the following conditions: if the pixel value in the reliability layer is equal to 0, the original NDVI value is retained, while the pixel value is not equal to 0, then the reconstructed NDVI value is used to replace it. Through this process, the new annual NDVI data series were reconstructed [52,70]. The QTP has a short growing season, which generally concentrates from May to September; therefore, the mean annual growing season NDVI (GNDVI) value was averaged based on NDVI data from May–September each year. We calculated the 20-year mean GNDVI, and then masked out the pixels with a perennial mean of GNDVI less than 0.1 to exclude sparse and non-vegetated areas [2,10,52].

2.2.2. Temperature Data

The temperature data were acquired from MOD11A2 data. This data comprised the 8-day synthesized L3 data product with 1-km spatial resolution, and included daytime and nighttime land-surface temperature. The temperature data were processed using the same method as NDVI data above, and the difference is that the temperature data quality control was through the QC layer in MOD11A2. The daily temperature were obtained by averaging the daytime and nighttime land-surface temperature. The mean temperature of the growing season was obtained by averaging the daily temperature from May to September.

2.2.3. Moisture Data

Considering the effect of evapotranspiration on available water, we used moist coefficient as an indicator of water availability:
M o i s t   c o e f f i c i e n t = P r e c i p i t a t i o n P o t e n t i a l   e v a p o t r a n s p i r a t i o n
The greater the moist coefficient is, the better the moisture conditions for vegetation growth. The precipitation data were obtained from the Global Precipitation Measurement (GPM) data, which comprised daily precipitation data with 0.1° spatial resolution. The potential evapotranspiration data were obtained from MOD16A2. This data is the summation of 8-day total potential water with 500 m spatial resolution. After preprocessing, both data were resampled to the same spatial resolution as NDVI data (1 km), and then counted total precipitation and the total potential evapotranspiration in the growing season (May to September), respectively, the ratio of total precipitation to total potential evapotranspiration was the moist coefficient in the growing season. We acknowledge that, when precipitation and potential evapotranspiration were resampled to the same spatial resolution as NDVI data, it was impossible to eliminate uncertainties in spatial variation because of the change of spatial resolution, especially for precipitation data with coarse resolution (0.1° × 0.1°).

2.3. Data Analysis Method

2.3.1. Linear Trend Analysis

The univariate linear regression was applied to calculate the trends in the GNDVI and meteorological data of the QTP during 2000–2019. The specific calculation formula is as follows:
s l o p e = n × i = 1 n i × D i ( i = 1 n i ) ( i = 1 n D i ) n × i = 1 n i 2 ( i = 1 n i ) 2 ,
where n is the length of the research period (n = 20 in this study), D i represents the GNDVI and meteorological data value in the i-th year, and slope is the change rate of the regression equation. If slope > 0, the trend of the GNDVI and meteorological data during the 20-year period was increasing; if slope < 0, the trend was decreasing. In addition, the Mann-Kendall (MK) test was used to test slope significance.

2.3.2. Partial Correlation Analysis

The relationships between the GNDVI, temperature, and moist coefficient were evaluated by partial correlation coefficients [67]. The partial correlation coefficients were calculated as follows:
r 12 3 = r 12 r 13 × r 23 ( 1 r 13 2 ) × ( 1 r 23 2 )
r 13 2 = r 13 r 12 × r 23 ( 1 r 12 2 ) × ( 1 r 23 2 )
where r12, r13, and r23 are the correlation coefficients between the GNDVI and temperature, GNDVI and moist coefficient, and temperature and moist coefficient, respectively. Here, r12•3 represents the partial correlation coefficient of the GNDVI and temperature, and r13•2 represents the partial correlation coefficient between the GNDVI and moist coefficient.

2.3.3. Residual analysis

The residual analysis method was used to analyze the impact of human activities on vegetation change [71,72]. Based on 20 years of the GNDVI, temperature, and moist coefficient data, we establish the multiple linear regression model of vegetation and climatic factors through the least square method at pixel scale:
y ^ = a × x 1 + b × x 2 + ε
where y ^ is the calculated value of the GNDVI, x 1 is temperature, x 2 is the moist coefficient, ε is the random error, a and b are regression coefficients. The calculated GND VI value was obtained through the temperature and moist coefficient of each year. Then, the annual GNDVI residual was obtained by calculating the interpolation between the calculated GNDVI value and the actual value, and then linear regression was performed with the year to obtain the GNDVI residual trend. Positive residuals represent the promotion effect of human activities on the vegetation, while negative residuals represent inhibition effects.

2.3.4. Hurst Exponent Method

The Hurst exponent based on the annual GNDVI values during 2000–2019 was used to predict vegetation change trends and to assess the sustainability of the vegetation time series. The most commonly used Rescaled Range Analysis (R/S) analysis method, was adopted to calculate the Hurst exponent [73]:
(a) Divide the long time series xi (I = 1, 2, 3…, N) into A subseries with length of n, in which A × n = N. The subseries is represented by Ia (a = 1, 2, 3…, A), and the element in Ia could be represented by N (k, m), k = 1, 2, 3…, n, and m = 1, 2, 3…, A.
(b) Calculate the mean value (Ea) of Ia:
E a = 1 n   k = 1 n N k , a
(c) Create the cumulative deviation time series Xk,a of Ia:
X k , a = k = 1 n ( N k , a E a )
k = 1, 2, 3..., n
(d) Calculate the range Ra of Ia:
R a = max ( X k , a ) min ( X k , a )
k = 1, 2, 3..., n;
(e) Create the standard deviation Sa of Ia:
S a = { 1 n k = 1 n [ ( N k , a E a ) 2 ] } 1 / 2
(f) Create the rescale range Ra/Sa
(g) For A subseries with length of n, A rescale ranges can be calculated, and their mean value can be calculated to get the rescale range when the length is n:
[ R / S ] n = 1 A a A ( R a / S a )
(h) Starting from n = 3, repeat the above operations for all integers n that satisfy A × n = N to obtain the sequence of the double range of [R/S]n, n = 1, 2, 3…, N.
(i) Linear regression was performed with Log(R/S)n as factor and Log(n) as dependent variable:
log ( R / S ) n = log ( c ) + H × log ( n ) + ε
where c is a constant. H is the Hurst exponent with the range of 0–1. When 0 < H < 0.5, the future trend of the series is opposite to that of the past, and the closer the value of H to 0, the more obvious the reversal of the trend. When 0.5 < H < 1, the future trend of the series is consistent with that of the past, and the closer the value of H to 0, the more obvious the consistency of the trend. When H = 0.5, the time series information is a mutually independent random sequence for which the future change trend is uncertain. The vegetation trends in the future was obtained from superimposing the GNDVI slope and Hurst exponent as the pattern given in Table 1.
In addition, during a relatively long study period, the dynamics of vegetation in different time periods are likely to show different trends. Therefore, in the process of the GNDVI dynamic analysis and correlation analysis, we divided the study period into three time periods so that we can understand the dynamics of vegetation in different periods: The whole study period (2000–2019), the first decade (2000–2009) and the second decade (2010–2019).

3. Results

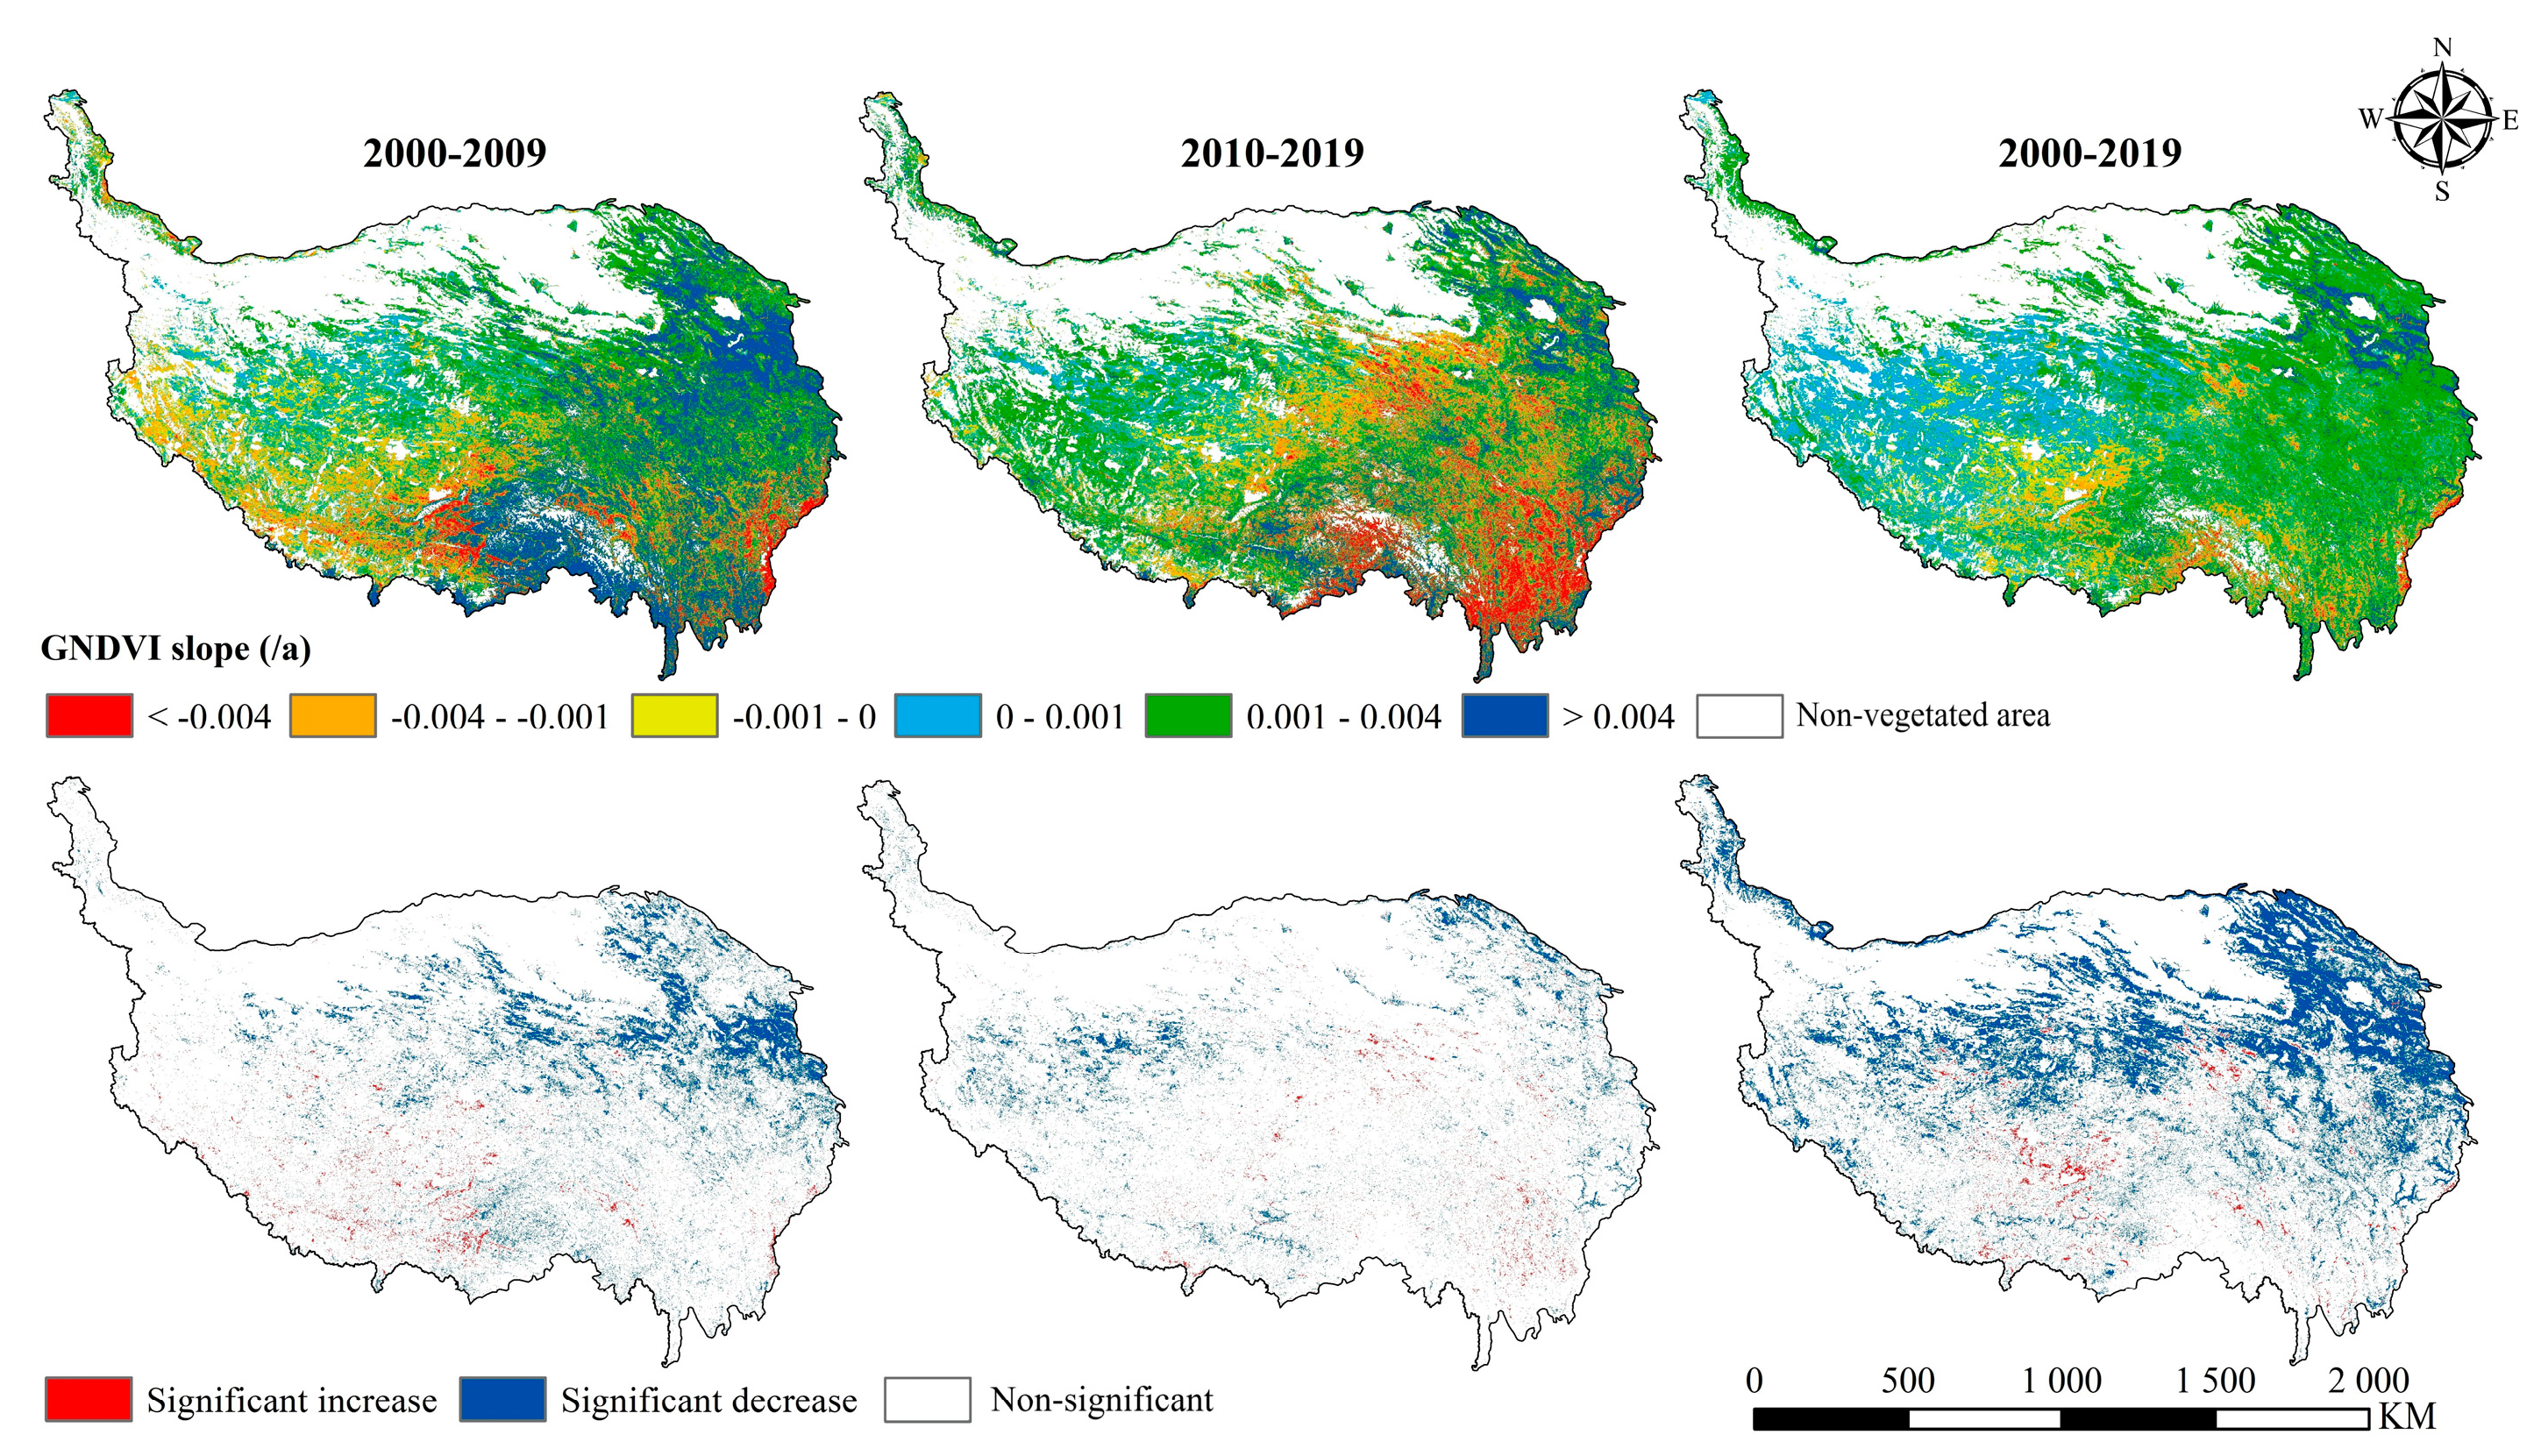
3.1. Spatiotemporal Changes of the GNDVI on the QTP

During 2000–2019, the mean GNDVI in the whole QTP was 0.3201, showing a decreasing trend from east to west (Figure 2). The sparse and non-vegetated areas (<0.1) occupied 30.74% of the whole plateau area, mainly including the Qaidam Basin in the north and the Kunlun Mountains in the northwest. For vegetated areas, the areal proportions of different GNDVI levels were 2.22% (>0.7), 20.36% (0.5–0.7), 22.72% (0.3–0.5), and 54.70% (0.1–0.3), respectively.
During 2000–2019, the change rate of the GNDVI across the entire QTP was 0.0011/a, showing an extremely significant increasing trend (p < 0.01) (Figure 3). The increase rate of the GNDVI in the latter decade (2010–2019) was significantly lower than that in the previous decade (2000–2009), and the increasing trend also became non-significant (p > 0.05). The GNDVI dropped significantly from 2011 to 2014, and then continued to rise, forming an obvious U-shaped curve. This difference in GNDVI trends led to the non-significant GNDVI variation in the latter decade on the QTP.
During 2000–2019, the GNDVI in 79.29% of the vegetated areas showed an increasing trend (Table 2), and 31.77% of the vegetated area reached a significant level (p < 0.05), which were mainly concentrated in the north of the QTP, especially the northeastern parts (Figure 4). The strongest increasing trend areas (slope > 0.004) were mainly located around Qinghai Lake and the Yellow River Basin in the northeast of the plateau, and the increasing trend in the east of the plateau was stronger than that in the west. On the other hand, the GNDVI decreasing areas accounted for 20.71% of the vegetated areas, but only 1.23% of areas reached a significant level (p < 0.05). The GNDVI decreasing areas mainly concentrated in the Qumalai prefecture in the central plateau, the Nagqu prefecture in north Tibet, the alpine valleys of the Yarlung Zangbo River and the Nu River in the southern parts and the eastern edge of the plateau.
Comparing the GNDVI slope in different decades, the areal proportion of the GNDVI with increasing trend decreased from 70.48% in 2000–2009 to 62.11% in 2010–2019 (Table 2), indicating that the increasing trend of the GNDVI on the QTP has been weakened in the past decade. The areas where the GNDVI trend has changed significantly included the southwestern, mid-eastern and southeastern parts of the QTP. The trend change of the southwestern part was mainly from negative to positive, while that of the mid-eastern and southeastern parts plateau were mainly from positive to negative (Figure 4).

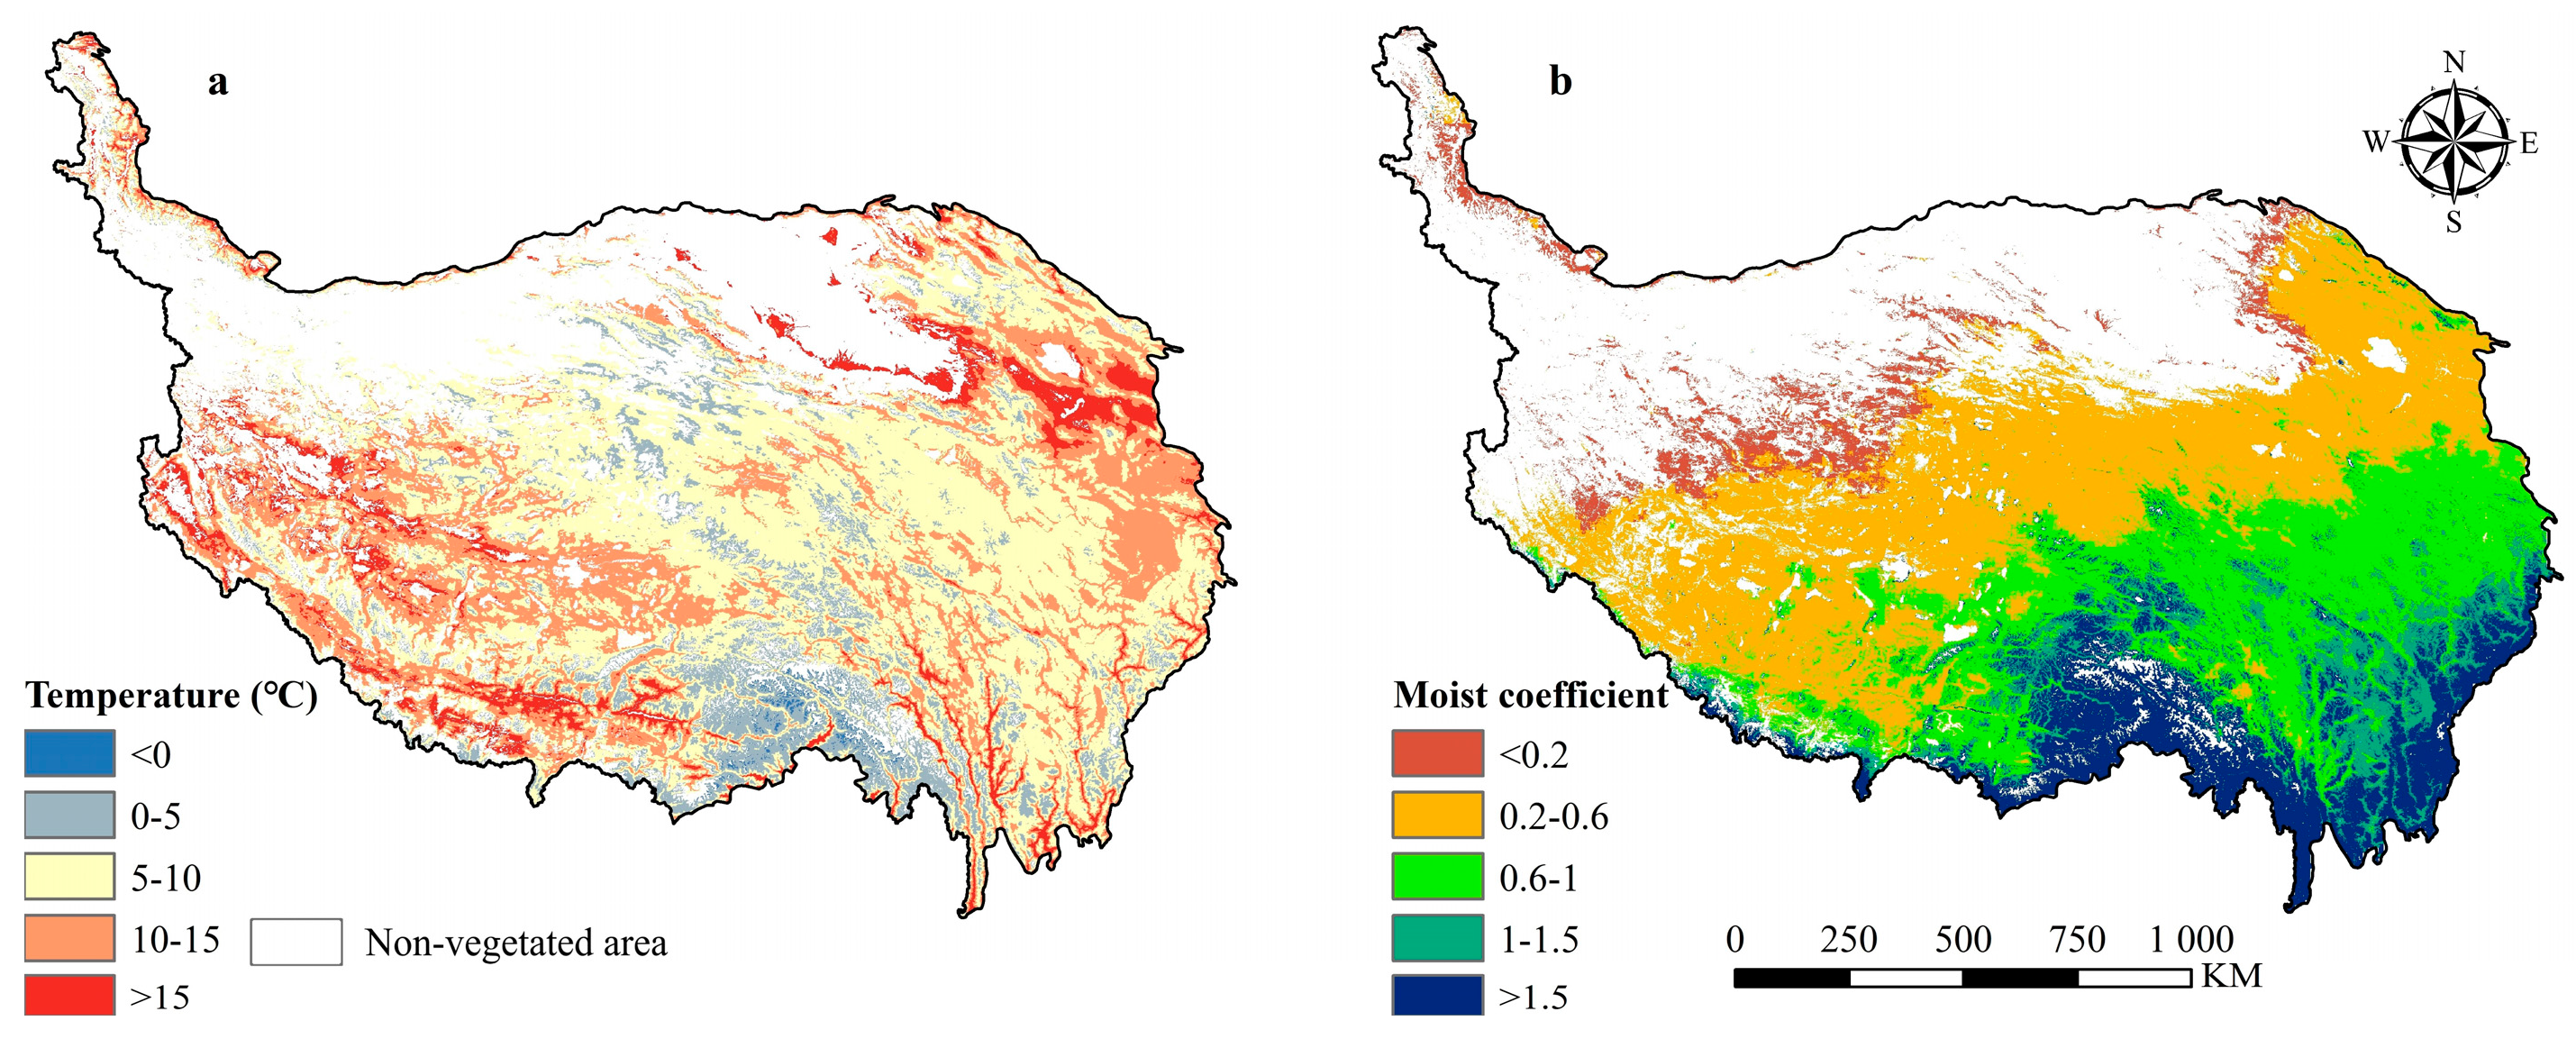
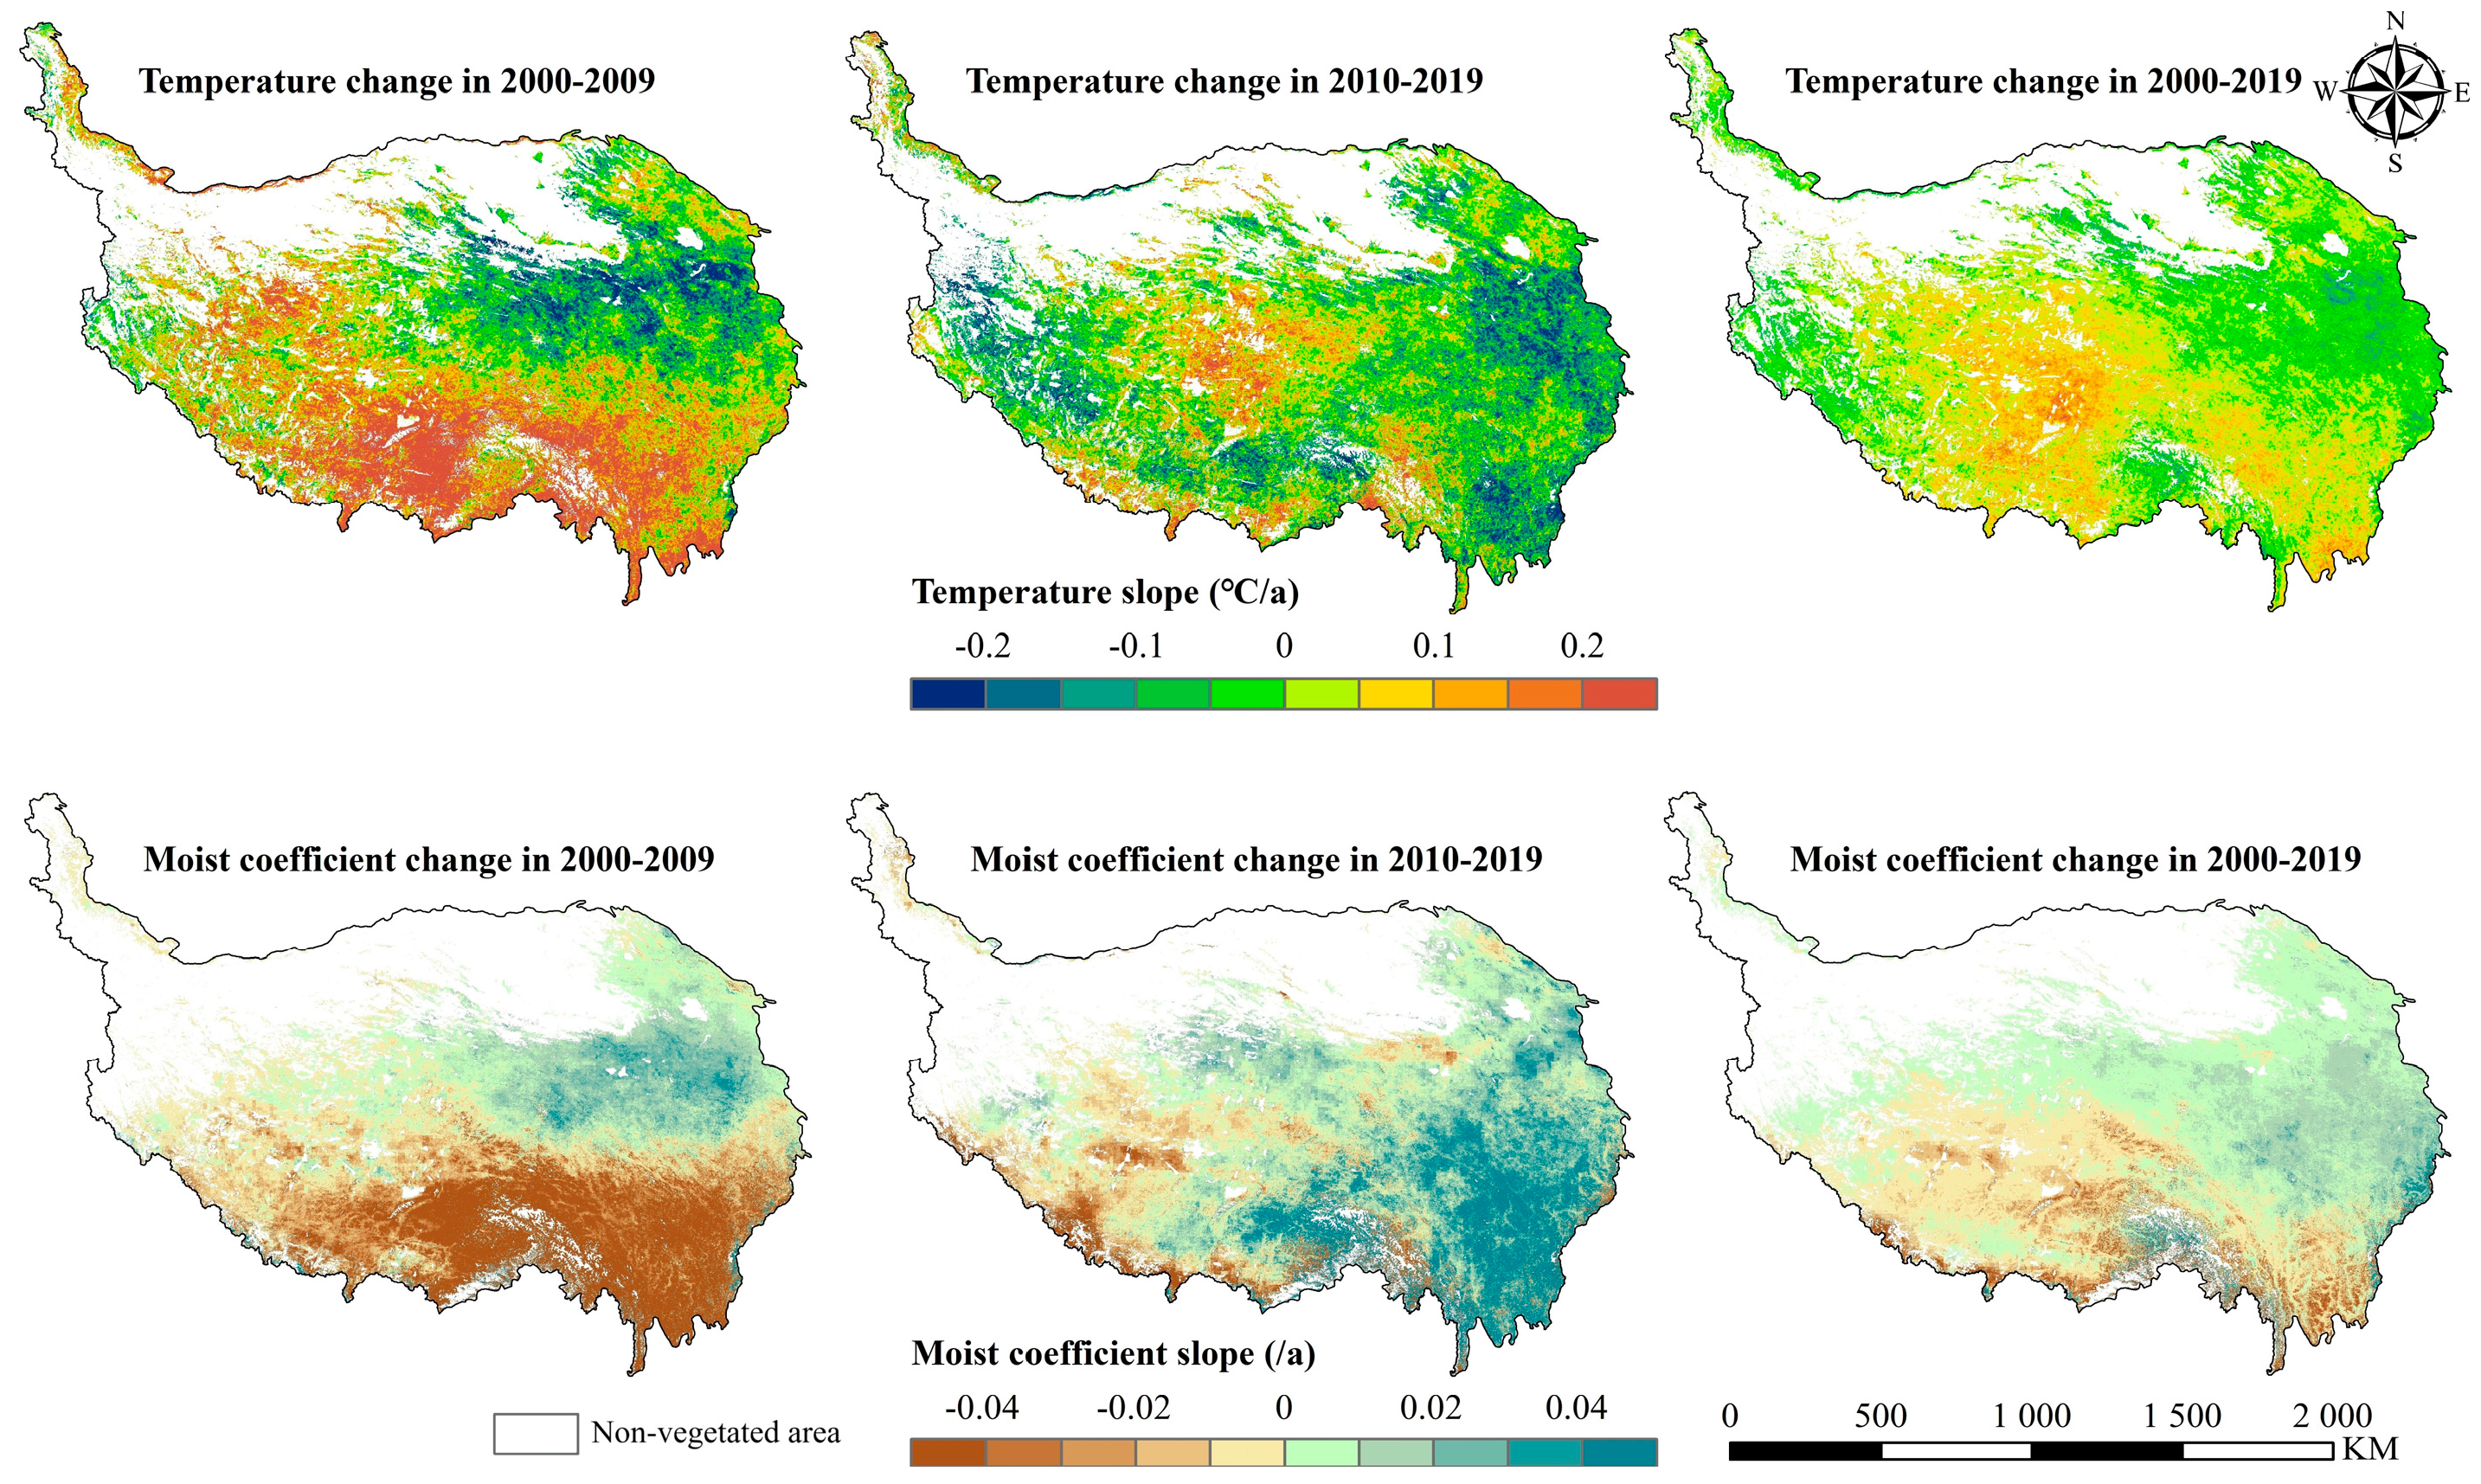
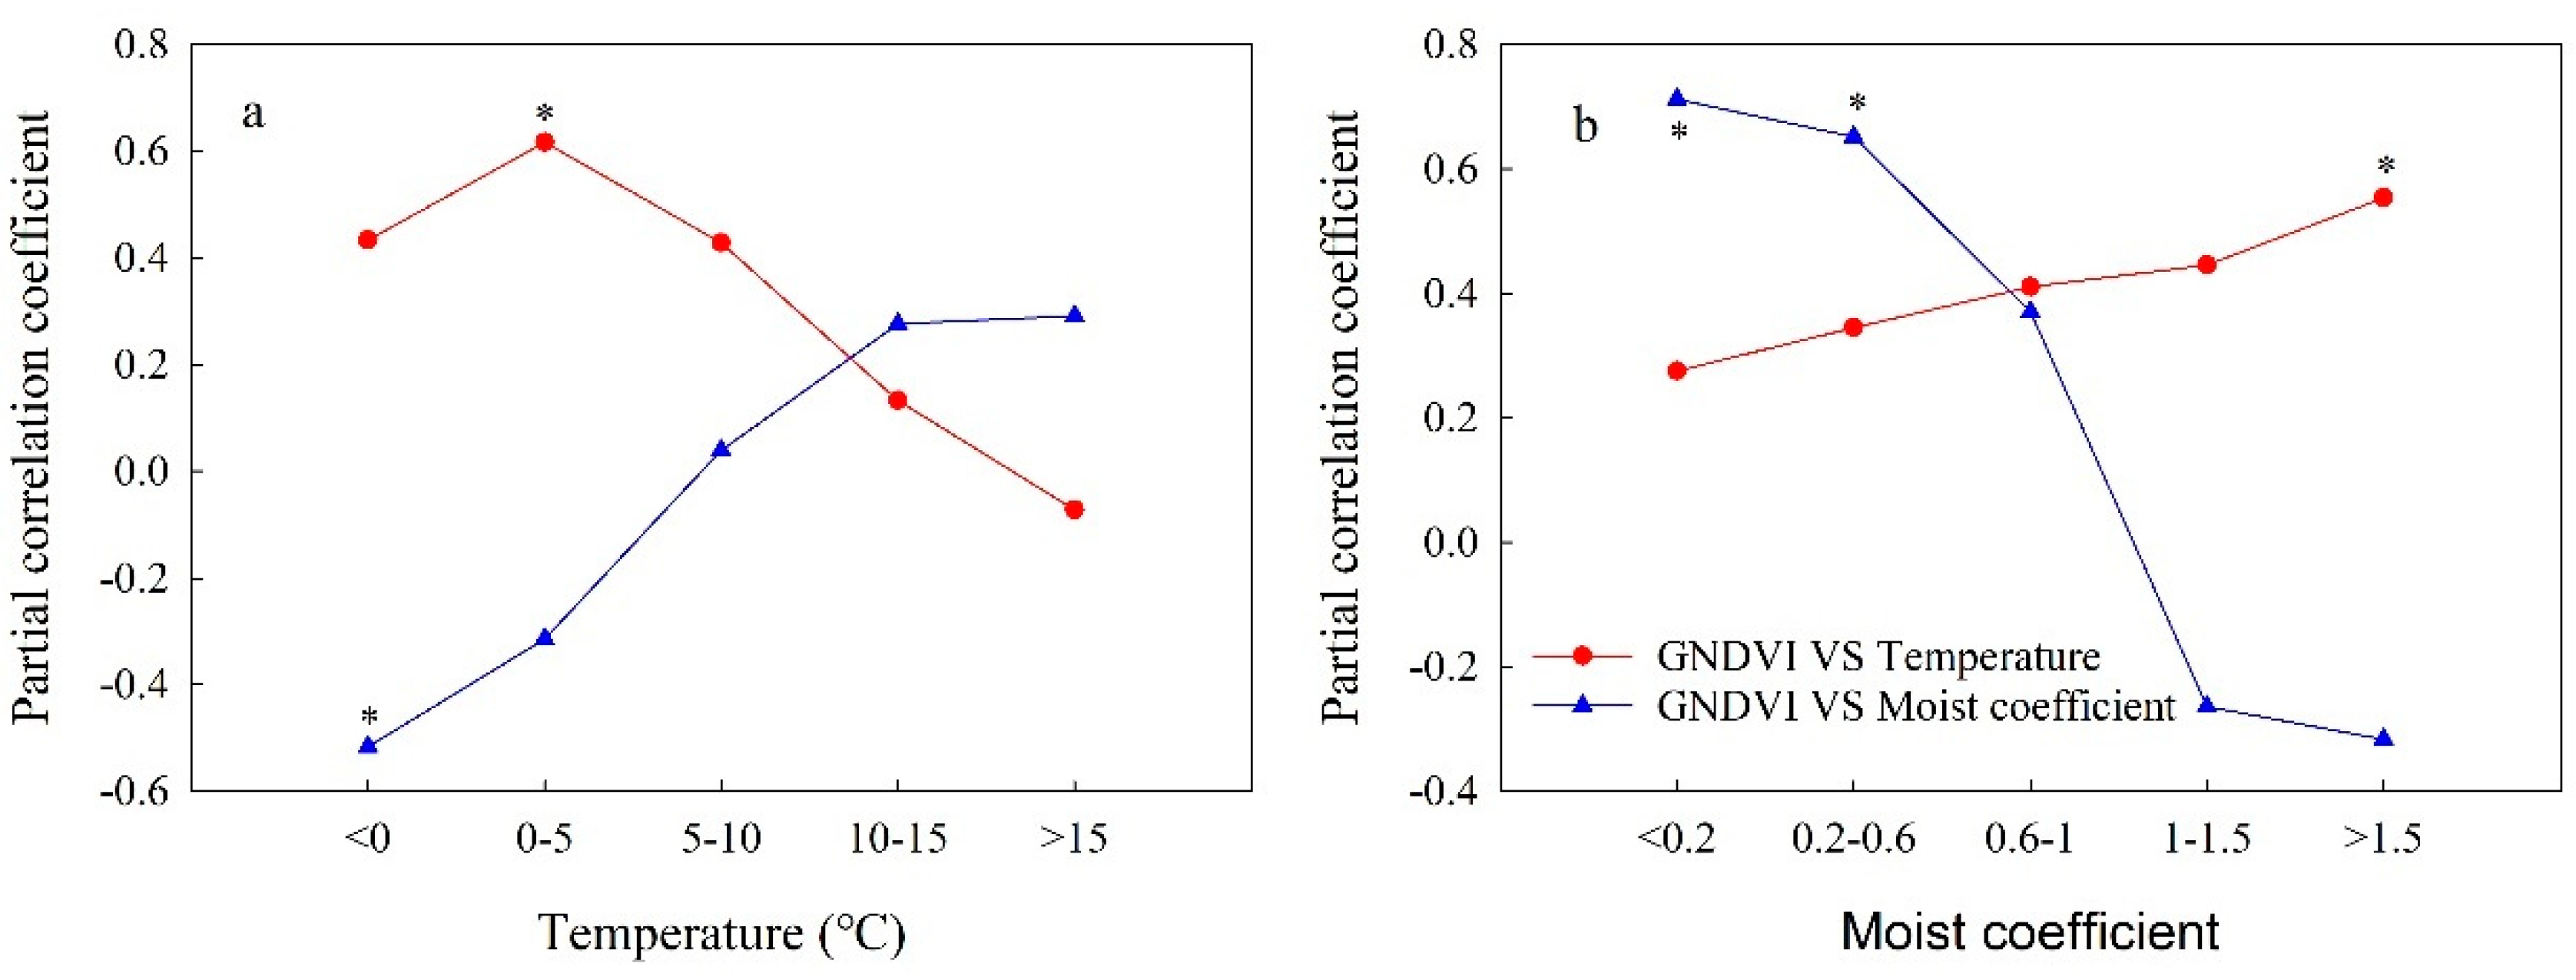
3.2. Vegetation Responses to Climate Change on the QTP

In Figure 5a, the temperature distribution of QTP displayed a pattern of high in northeast and southwest, low in central and southern, with the temperature in most areas (80.18%) between 5−15 ℃. The spatial distribution of moisture on the QTP decreased from southeast to northwest, and about half (47.27%) of the areas were in arid and semi-arid climate (Figure 5b).
In the past 20 years, the mean temperature in the growing season across the whole QTP showed a significant increasing trend (p < 0.05) with a rate of 0.0229 ℃/a, among which 65.65% of vegetated areas showed an increasing trend in temperature, while 34.35% showed a decreasing trend (Table 3). The cooling areas were mainly distributed in the northeast, mid-east, and western edge of the plateau, and the most cooling area was in the south of the Qinghai Lake. In contrast, the warming areas included the mid-west, southwest, and southeast of the plateau, especially the Nagqu Prefecture in northern Tibet (Figure 6). The moist coefficient in the growing season across the whole QTP showed a slightly increasing trend (p > 0.05) with a rate of 0.0038/a, indicating that the water supply was basically stable during the study period. The areas of increasing moist coefficient were mainly in the northeast of the plateau, accounting for 59.61% of the vegetated areas, while the decreasing areas were mainly in the southwest and southeast of the plateau, accounting for 40.39%. On the whole, western and southeastern parts of the QTP were warming and drying, while most other areas were warming and wetting during the study period.
However, climate change trends on the QTP were not consistent in different decades. The temperature change rate was 0.0609 ℃/a in the first decade (2000–2009), and then dropped to −0.0176 ℃/a in the latter decade (2010–2019), while the moist coefficient change rate was −0.0397/a in the first decade, and then rose to 0.0155/a in the latter decade. The areal proportion of the warming area also decreased, while that of the wetting area increased in different periods (Table 3). These changes indicated that the plateau has undergone a transition from a warming and drying trend to a cooling and wetting trend as a whole, and this transition in the climate change trend was more obvious in the western and southern part of the plateau.
Figure 7 showed the difference in response of vegetation to temperature and moisture under different environmental conditions. In cold areas (mean temperature < 5 °C), the temperature had a high positive correlation with the GNDVI, while the moisture showed a significantly negative correlation with GNVDI. With the warming of the environment, the correlation coefficient between the temperature and GNDVI decreased, while the correlation coefficient between water and the GNDVI gradually increased. Under relatively warm conditions (mean temperature > 10 °C), the effect of moisture on vegetation exceeded that of temperature. With the further increase of temperature, the correlation coefficient between the temperature and GNDVI becomes negative, which means that in the high-temperature areas, the warming will limit the vegetation growth. The result showed that low temperature was the main factor limiting vegetation growth in the low-temperature zone, and the increase of water had a negative inhibitory effect on vegetation growth. With the continuous rise of the ambient temperature, the roles of temperature and water are gradually exchanged. Finally, when the temperature reached a certain degree, the negative effect of drought brought by further warming would inhibit vegetation growth, and water would become the main factor affecting vegetation growth. The correlation coefficient between the moisture and GNDVI also experienced similar changes to that of temperature with the change of different moisture conditions. The above results showed that the variation of environmental conditions changed the limiting factors of vegetation growth and made the responses of vegetation to climate factors change.
Due to the great spatial heterogeneity of the climatic conditions on the QTP, the response of vegetation to climatic factors also had a strong spatial difference. During 2000–2019, the partial correlation coefficient between the GNDVI and temperature was negative for 46.41% pixels (8.16% significantly with p < 0.05), and positive for 53.59% pixels (11.60% significantly with p < 0.05) (Table 4). The positive correlation pixels were mainly distributed in the northeast and southwest of the plateau, while the negative correlation pixels were mainly distributed in the central and southeast of the plateau (Figure 8). The spatial pattern of the partial correlation coefficient between the GNDVI and moist coefficient showed a significant north-south difference. The positive correlation pixels were mainly distributed in the north of the plateau, accounting for 58.33% of total pixels (13.77% significantly with p < 0.05), while that negative correlation pixels were mainly distributed in the south, accounting for 41.67% of total pixels (4.95% significantly with p < 0.05). In different decades, the spatial pattern of the partial correlation coefficient between temperature and moist coefficient was basically consistent, except for some parts of the North Tibet Plateau, and the areal proportion of different partial correlation levels between the GNDVI and temperature and moist coefficient also did not change significantly over different decades (Table 4). Both phenomena suggested that the response mechanism of vegetation to climate change has not changed significantly in most areas of the QTP. In the North Tibet Plateau, the positive correlation between the temperature and GNDVI decreased, while the positive correlation between the moisture and GNDVI increased, which meant that available water gradually replaces temperature as the main factor affecting vegetation growth. This transformation might be associated with the lack of water, causing by the continuous climate warming and drying in this region.
Previous studies have highlighted that the relationship between the NDVI and various climatic factors has a general time lag [2,42,64], the shorter the lag time is, the more immediate the response of vegetation to climate change is. We studied the lag response between the GNDVI and climatic factors at an interval of eight days, and took the date corresponding to the maximum partial correlation coefficient as the hysteresis time. In order to prevent the negative correlation coefficient from being concealed, we converted the partial correlation coefficient to the absolute value in advance. The lag time between the GNDVI and temperature was 1-month for 36.45% pixels, 2-month for 20.93% pixels, 3-month for 19.17% pixels, and 4-month for 23.45% pixels, while the lag time for moist coefficient was 1-month for 24.87% pixels, 2-month for 19.60% pixels, 3-month for 25.83% pixels, and 4-month for 29.69% pixels, respectively. This result indicated that the hysteretic response of vegetation to climatic factors is common on the QTP. In terms of spatial distribution, the vegetation with a short lag response to temperature was mainly in the southeast, northwest, and parts of the northeast, while the vegetation with long lag response was mainly in the central and southwest of the plateau (Figure 9a). The vegetation with a short lag response to moisture was mainly in the northwest and parts of the southeast, while the vegetation with long lag response was mainly in the east and west of the plateau.

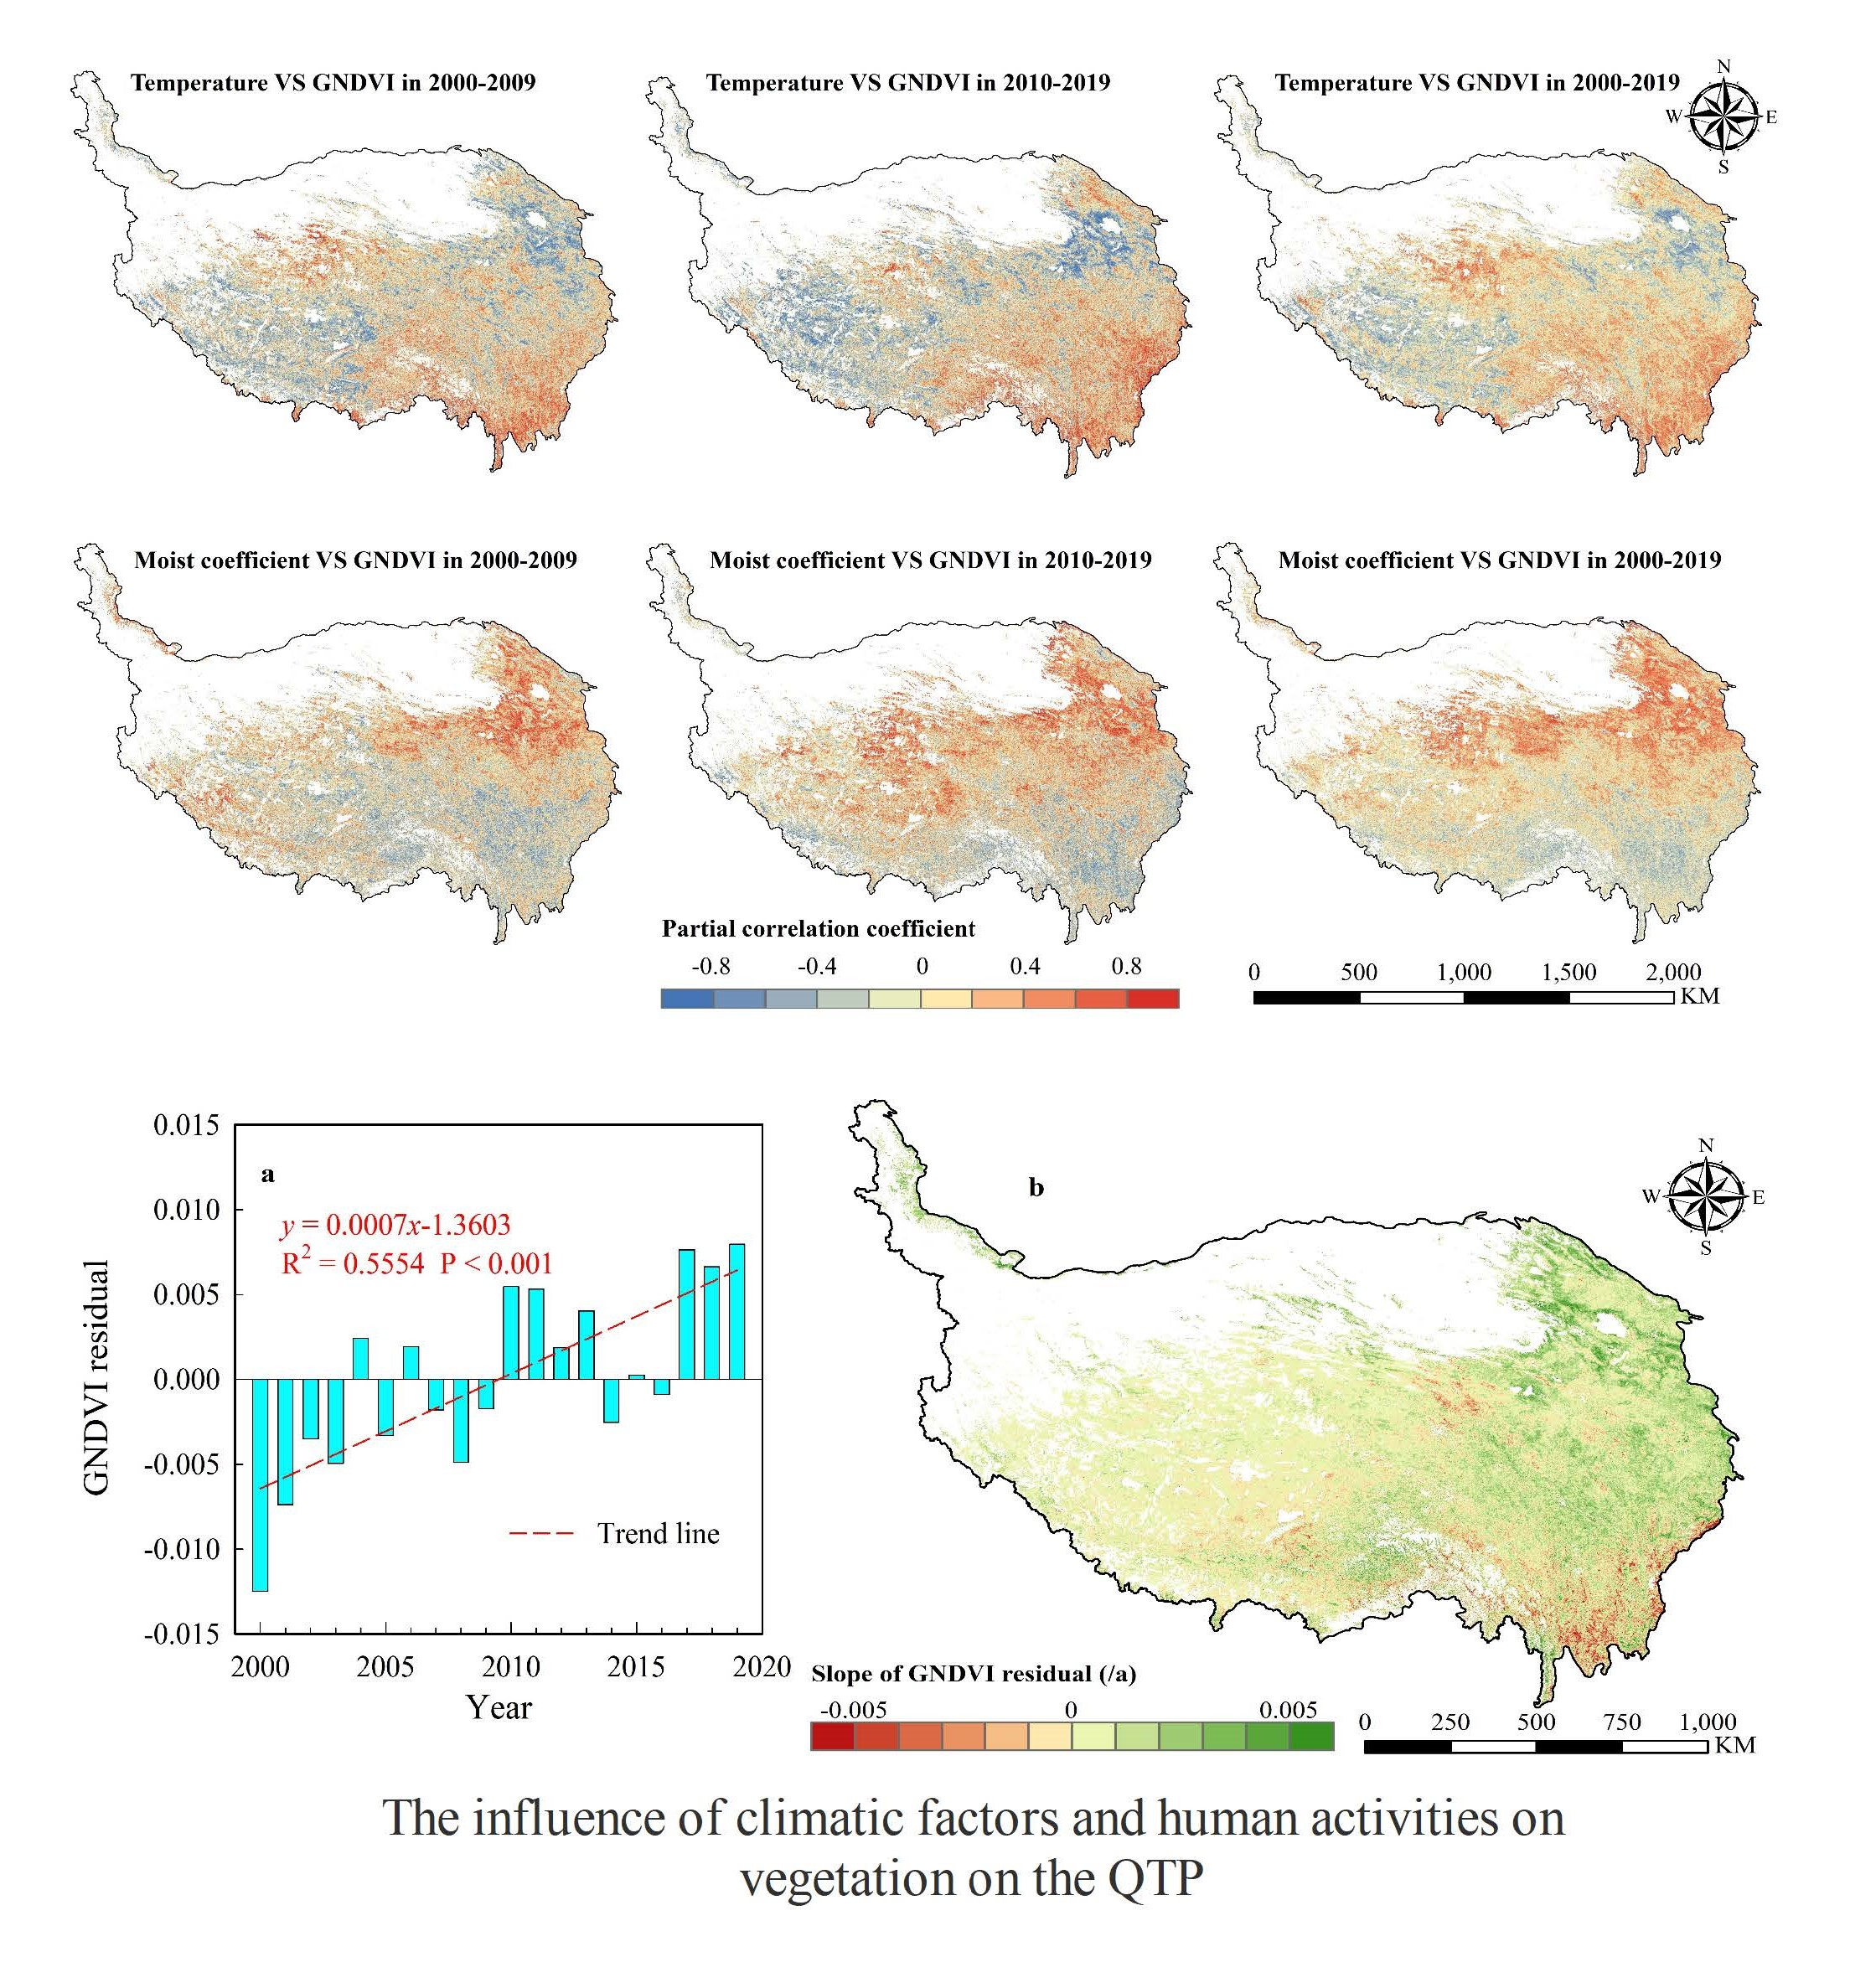
3.3. The Influence of Human Factors on Vegetation Change on the QTP

In the whole QTP, the GNDVI residuals were generally negative in the first decade (2000–2009), indicating that human activities had a negative effect on vegetation change at this stage (Figure 10a). Since 2010, the GNDVI residual turned positive, indicating that human activities began to play a promoting role in vegetation change. During the whole study period (2000–2019), the GNDVI showed an extremely significant upward trend with a rate of 0.0007/a (p < 0.001), indicating that human activities had an increasingly significant positive impact on vegetation on the QTP. In terms of the spatial pattern, the impact of human activities was low in the western plateau because of the sparsely populated, so the variation trend of the GNDVI residual was weak (Figure 10b). In contrast, the impact of human activities on vegetation in the eastern part of the plateau was relatively strong, especially in the northeastern part of the plateau, where the vast majority of the plateau’s population was located. The GNDVI residual in the northeast and mid-east of the plateau showed a relatively high increasing trend, represented that the human activities in these areas have strong positive promotion effects on vegetation. The negative trend of the GNDVI residual was mainly distributed in three regions, including the three-river source region in the south of Qinghai Province, the Lhasa region in the southwest of the plateau, and the southeastern edge region of the plateau.

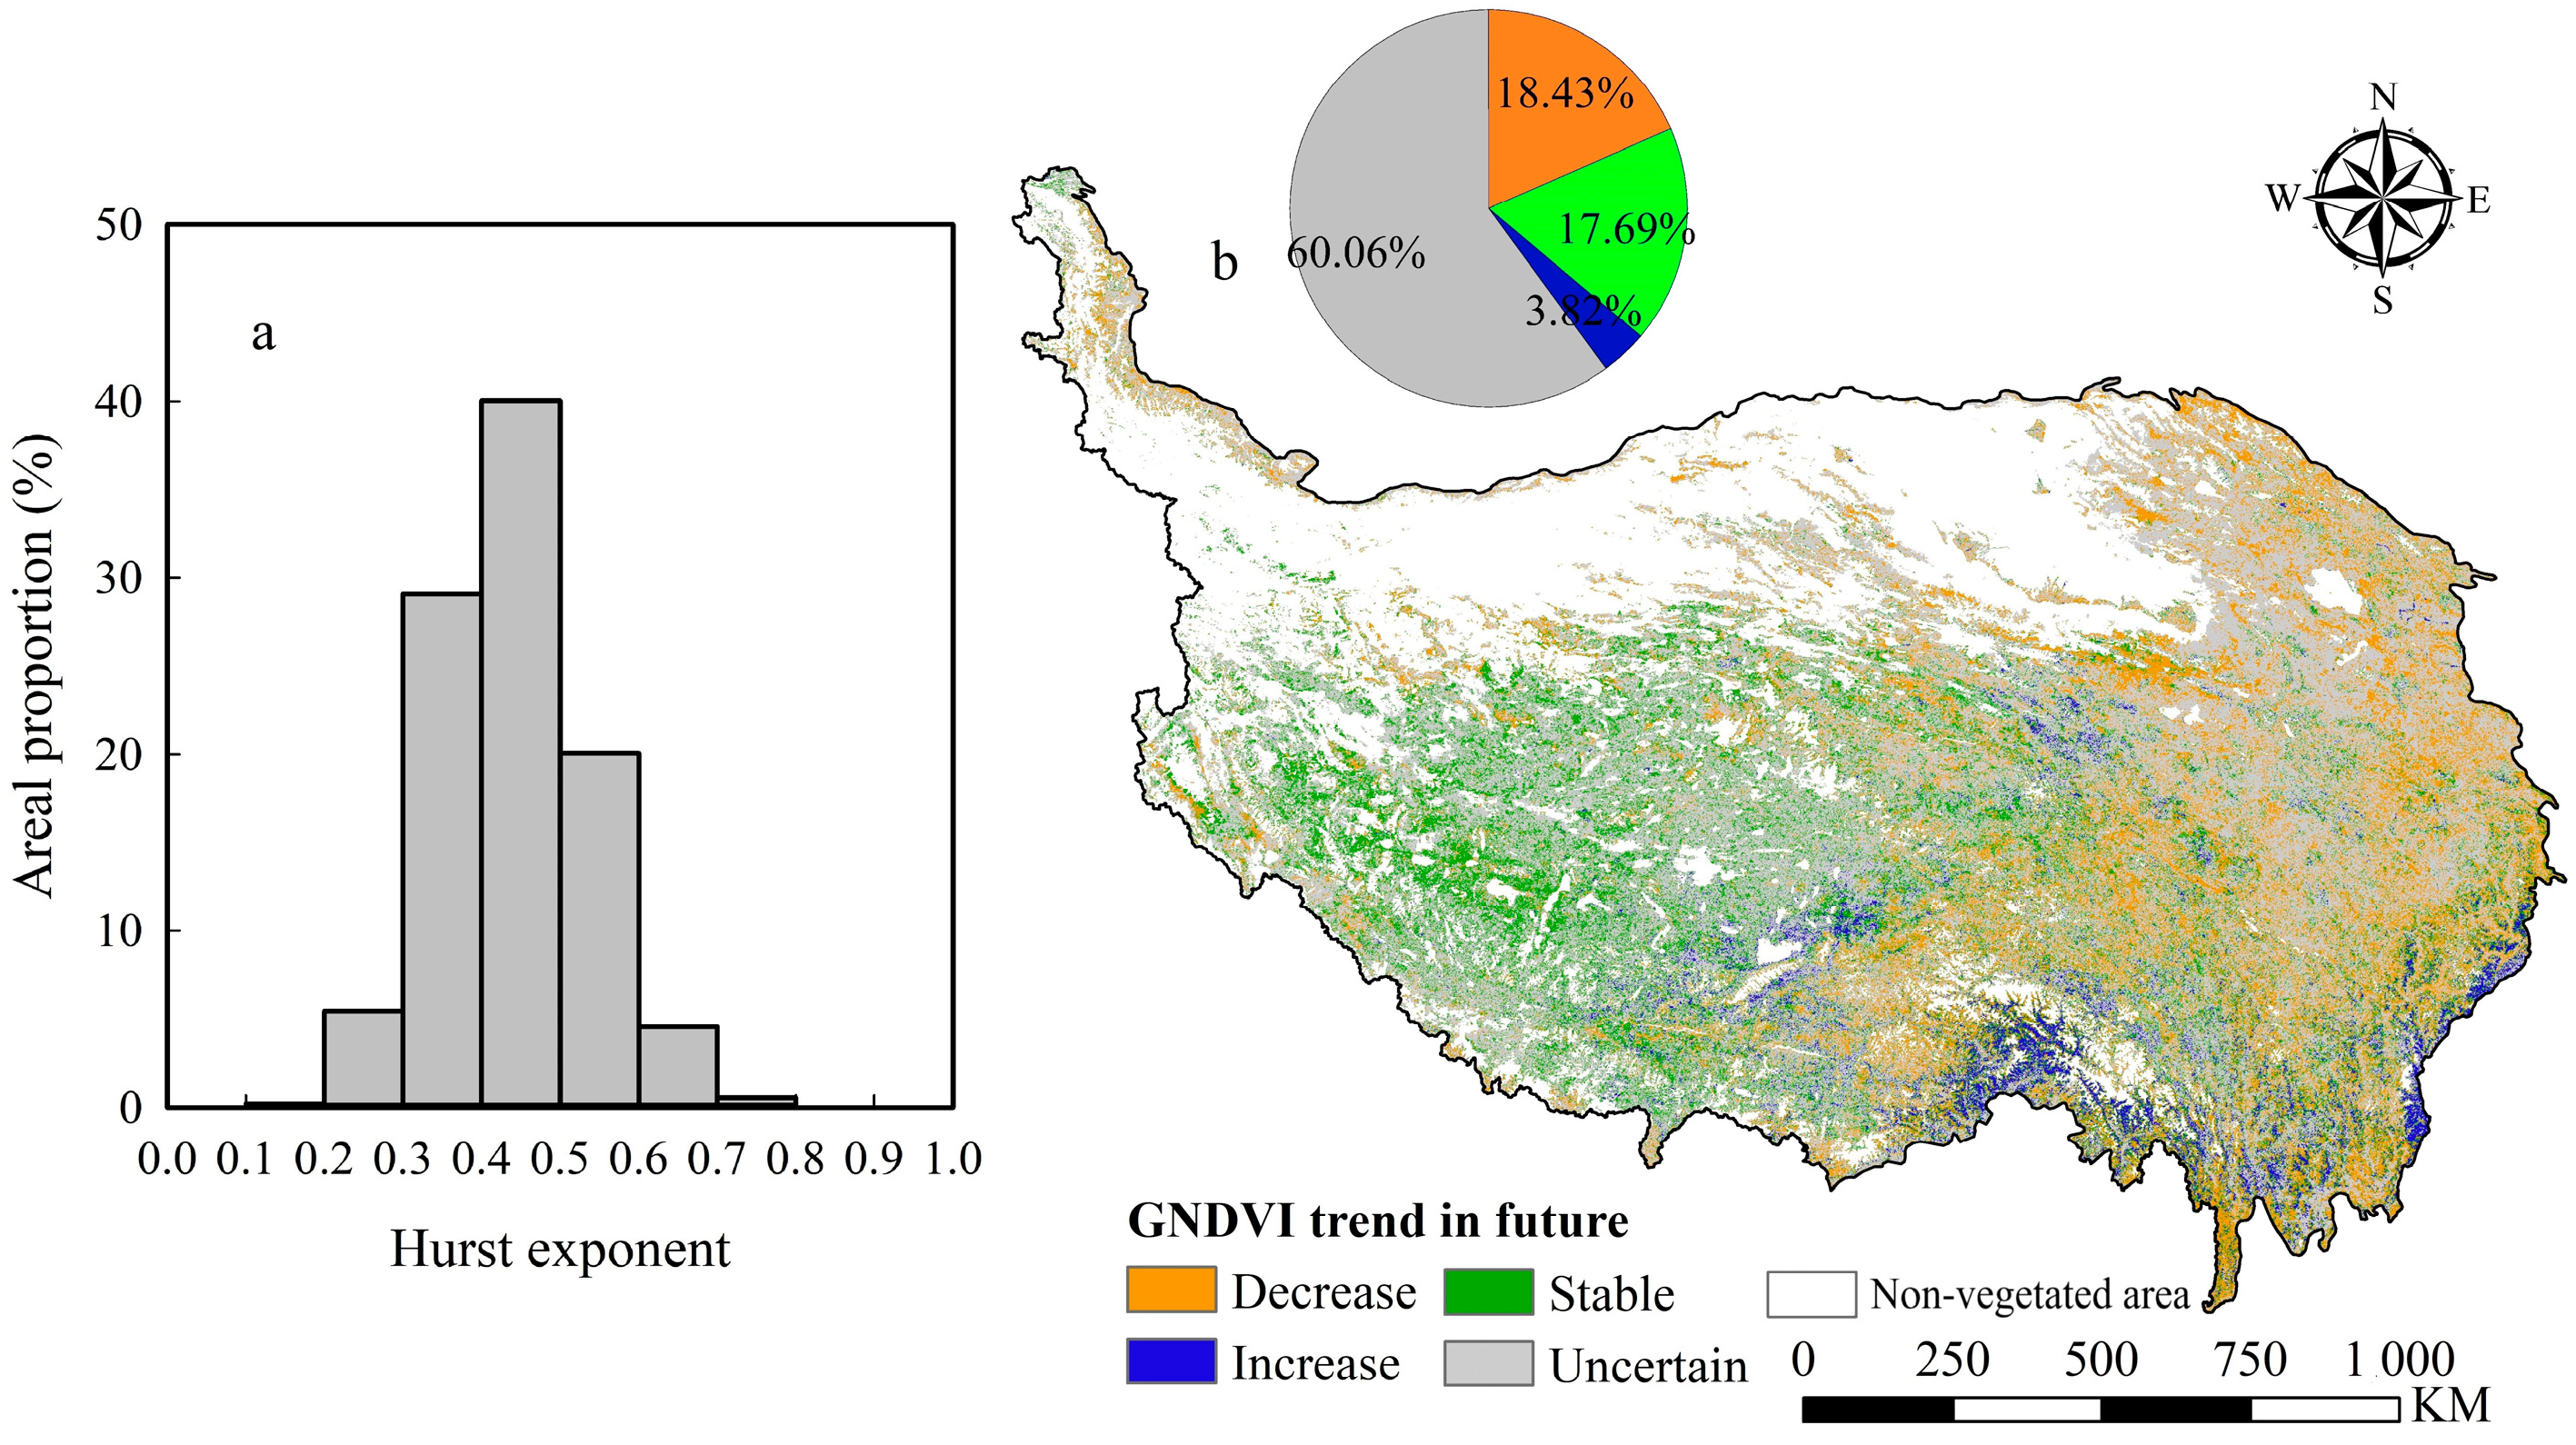
3.4. Prediction of Future Trends of Vegetation Trends

The Hurst exponent (H) of the GNDVI of the whole QTP was in the range 0.06–0.96 (mean value: 0.44). Pixels with H > 0.5 accounted for 25.21% of the total pixels, while pixels with H < 0.5 accounted for 74.79% (Figure 11a), indicating that the reversal of the current GNDVI trends would occur in most areas of the plateau in the future, and this reverse trend was probably related to the slowing of the rising trend of GNDVI in the second decade of the study period. However, the H values of 60.09% pixels were between 0.4 and 0.6, meaning that their future GNDVI trends are more random than a definite direction. The pixels with strong, consistent trends (H > 0.6) and strong reverse trends (H < 0.4) accounted for 5.14% and 34.75% of the total pixels, respectively.
Based on the Hurst exponent and current GNDVI trend, we predicted the spatial pattern of the GNDVI trend in the future on the QTP (Figure 11b). For most parts of the vegetated areas, the GNDVI future trends are not clear in future, as the H value ranges from 0.4 to 0.6. 17.69% of the plateau vegetated areas will remain stable because of the low current GNDVI change rate, and these areas are distributed primarily in the western parts of the plateau. The areas with a decreasing trend, which account for 18.43% of the vegetated area, are largely scattered in the eastern parts of the plateau. The areas with increasing trend only account for 3.82%, which are mainly distributed in the central and southern parts of the plateau. In terms of the whole plateau, the future vegetation degradation area is larger than the improvement area, which represents a certain risk of vegetation degradation on the QTP in the future, and this risk is most obvious in the northeast of the plateau.

4. Discussion

Over the past 20 years, the whole QTP showed an increasing trend in GNDVI, which was consistent with the trend identified in an earlier period (1982–2003) [61], indicating the whole QTP has undergone a process of continuous vegetation greening since 1982. Due to the spatial heterogeneity of climate change, the GNDVI trends of the plateau showed significant spatial difference [74,75].
Low temperature is one of the main factors limiting the growth of high-altitude vegetation [52], and climate warming can significantly promote vegetation growth on the QTP [2,76]. Our results showed that the positive response to temperature appeared in the southeast and northwest, while that negative mainly appeared in the southeast and northwest, which was similar to a previous study [77]. In the southeastern and northwestern parts, which were dominated by cold weather (Figure 5a), the increased temperature would directly promote photosynthesis of vegetation, and break the restriction of low temperature on vegetation growth [78,79]. The negative correlation with temperature appears in the northeast and southwest of the plateau, indicating that the high temperature would inhibit vegetation growth, and the likely cause is increased respiration caused by the higher temperature [80]. In addition, the increased temperature could also thin the active layer of the permafrost [33] and increase the soil evapotranspiration [36,81], both could reduce the amount of water available in the topsoil, and further lead to loss of soil organic matter and release of soil carbon and nitrogen, which in turn would limit vegetation growth [82,83].
The northern and southwestern parts of the QTP were dominated by the arid and semi-arid climate (Figure 5b) and we found that vegetation in these areas is positively correlated with moisture (Figure 8), which was consistent with previous studies [2,36]. The relatively dry environment limits the supply of water to vegetation growth, making the vegetation in these areas very sensitive to available water, especially under the background of continuous climate warming [84,85]. In contrast, the climate in the mid-east and southeast of the plateau is relatively humid with abundant water resources to offset the drought in soils caused by rising temperatures; increased moisture could reduce the plant photosynthesis and temperature, due to decreased solar radiation [42]. In addition, the increasing precipitation would restrict vegetation growth by producing soil erosion [43] and temperature decreasing [44], so the vegetation in these areas showed a negative correlation with moisture, and the influence of temperature on vegetation becomes more positive [37].
Although the GNDVI of the QTP showed an upward trend throughout the whole study period, the increasing trend of GNDVI slowed markedly in the last decade (Figure 3), and the most obvious change areas were in the central and south of the plateau (Figure 4). Compared the climate trends in different decades (Figure 6), we found that the causes of the GNDVI trend decline are different. In the central area, a warming and drying climate caused a decrease in available water, which led to a downward trend in GNDVI, while in the south, especially in the southeast areas, the downward trend in GNDVI was mainly caused by a cooling and wetting climate. Interestingly, the same cooling and wetting climate change in the southwest of the plateau has led to an upward trend in GNDVI, which may be due to the difference in vegetation types between the two areas. These changes in GNDVI and climatic factors well explains the different mechanisms of vegetation response to climate change in different areas of the QTP.
The vegetation in the QTP has shown hysteresis response to climate change generally with a lag of 1–4 months, which was similar to the findings of Piao’s study on the national scale [42]. The lag time is most likely due to the growth of vegetation that need time to accumulate the soil moisture, heat, and nutrient [86]. In addition, the low-temperature environment on the QTP made the rate of organic nitrogen and organic phosphate mineralization of soil slow, and the soil lacked available nitrogen and organic phosphorus that could be absorbed and utilized by vegetation, which might lead to the lag effect of vegetation growth in summer on spring precipitation [87]. Our results showed that the higher the correlation coefficient between vegetation and a certain climate factor is, the shorter the hysteresis response time is, which reflected the timely response of vegetation to the change of growth restriction factors [64,88].
The unique geographical conditions made the most of the QTP not suitable for human habitation, especially in the west, and most human activities were concentrated in the eastern part of the plateau [54,60,89]; the GNVDI residual analysis in this paper showed the similar result. The overall residual trend of the plateau was mainly positive, especially in the northeast of the plateau, indicating that a series of ecological projects which have been implemented has produced a positive influence on the vegetation of the QTP [36,43,90,91]. However, the GNDVI residual trend remained negative in some areas of the plateau, including the mid-eastern, southeastern and southwestern areas around Lhasa, where urban expansion and infrastructure construction might be the main factors affecting vegetation change [54,60]. Therefore, appropriate measures should be taken to prevent the further degradation of vegetation in these areas under human influence.
The Hurst exponent based on the GNDVI data (2000–2019) of the entire QTP is 0.44, indicating a very random future change of vegetation. This randomness was likely to be the significant decline in GNDVI between 2011 and 2014, which interrupted the increasing trend of the GNDVI in the latter decade, further undermining the consistency of the increasing trend of the GNDVI throughout the whole study period. Hurst exponent is a calculation based on the time series GNDVI value and does not involve other factors; but since the GNDVI is affected by climatic factors, climate change also indirectly affects Hurst exponent. The change of climate trends in different decades made the GNDVI trend more fluctuant, which further affected the Hurst exponent. Therefore, the relationship between Hurst exponent and climate change deserves further study. In addition, although Hurst exponent can be used to predict the trend of future vegetation dynamic, it cannot provide a clear duration, which makes vegetation prediction more like a possible risk indication. Thus, determining the likely duration is a more important issue that needs further study in the future [61].
Considering the important role of heat and water in vegetation growth, we used land surface temperature and moisture coefficient to quantify the two main environmental factors, and analyzed the relationship between them and vegetation dynamics. However, due to the large spatial heterogeneity on the QTP, other factors may also play important roles affecting vegetation growth, such as solar radiation [2,52], winter snow [37], and permafrost soil [75,92,93]. The combination of many factors may lead to errors in our assessment of the relationship between vegetation and major climatic factors. Therefore, the influence of other factors on vegetation on the QTP should be considered comprehensively in future studies.

5. Conclusions

The GNDVI of whole QTP showed a significant increasing trend in the past 20-years with a rate of 0.0011/a, with the exception of parts of the southwest, 79.29% of the plateau displayed greening trends. During the whole study period, both temperature and moist coefficient of the whole plateau dispalyed an upward trend, with the rising rates of 0.0229 °C/a and 0.0038/a, respectively. Spatially, there was a strong spatial heterogeneity of climate trends on the plateau: The climate trends in the mid-east, northeast, and west edge of the plateau were mainly cooling and wetting, while that in the mid-west, southwest, and southeast of the plateau mainly showed warming and drying trend. Because of the spatially heterogeneous of climatic conditions, the response of vegetation on the plateau to climatic factors has also formed obvious spatial differences: The northeast and southwest vegetation was negatively correlated with temperature and positively correlated with moisture. In contrast, the southeast vegetation was negatively correlated with moisture and positively correlated with temperature; while the northwest vegetation was positively correlated with both climatic factors. In the second decade of the study period (2010–2019), the cooling and wetting climate trend strengthened, which weakened the greening trend of the plateau, especially in the southern parts. The GNDVI residual of the whole plateau showed an extremely significant upward trend with the rate of 0.0007/a in the past 20 years, indicating the positive effect of human activities on vegetation, especially in the northeastern part of the plateau. However, the destruction of vegetation by human beings in the southeast of the plateau should not be ignored and more attention should be given to prevent further disturbance of human activities. The future vegetation dynamic based on the Hurst exponent showed that the area of degradation is likely to become larger than that of improvement, indicating a higher risk of vegetation degradation. To reduce the risk of ecological degradation on the plateau, we need to take a series of measures to protect the plateau’s ecological environment: Further progressing the ecological protection projects have been carried out; establishing natural ecological protection regions; enhancing local people’s awareness of ecological and environmental protection; carrying out afforestation and the construction of artificial grassland and prohibiting excessive development. In addition, rational resource planning and allocation will help us better cope with the ecological security challenges on the QTP.

Author Contributions

Conceptualization, F.Y.; Data Curation, J.C.; Formal Analysis, J.C. and F.Y.; Methodology, J.C., F.Y. and Q.L.; Software, J.C. and F.Y.; Investigation, J.C. and F.Y.; Resources, J.C., Q.L. and F.Y.; Supervision, Q.L. and F.Y.; Validation, J.C.; Visualization, J.C. and F.Y.; Writing-Original draft, J.C., F.Y. and Q.L.; Writing—Review & Editing, J.C., F.Y. and Q.L.; Funding Acquisition, F.Y.; Project Administration, F.Y. All authors have read and agreed to the published version of the manuscript.

Funding

This research was funded by National Nonprofit Institute Research Grant of Chinese Academy of Forestry (grant number CAFYBB2018ZA004), National Natural Science Foundation of China (grant number 41301458) and Outstanding Youth Science Foundation of Jiangsu China (BK20170102).

Acknowledgments

The authors would like to thank NASA for sharing MODIS products and we thank three anonymous reviewers for their valuable comments and suggestions.

Conflicts of Interest

The authors declare no conflict of interest.

References

  1. Nemani, R.R.; Keeling, C.D.; Hashimoto, H.; Jolly, W.M.; Piper, S.C.; Tucker, C.J.; Myneni, R.B.; Running, S.W. Climate-driven increases in global terrestrial net primary production from 1982 to 1999. Science 2003, 300, 1560–1563. [Google Scholar] [CrossRef] [PubMed] [Green Version]
  2. Li, L.; Zhang, Y.; Liu, L.; Wu, J.; Wang, Z.; Li, S.; Zhang, H.; Zu, J.; Ding, M.; Paudel, B. Spatiotemporal patterns of vegetation greenness change and associated climatic and anthropogenic drivers on the Tibetan Plateau during 2000–2015. Remote Sens. 2018, 10, 1525. [Google Scholar] [CrossRef] [Green Version]
  3. Zhang, L.; Guo, H.; Ji, L.; Lei, L.; Wang, C.; Yan, D.; Li, B.; Li, J. Vegetation greenness trend (2000 to 2009) and the climate controls in the Qinghai-Tibetan Plateau. J. Appl. Remote Sens. 2013, 7, 073572. [Google Scholar] [CrossRef]
  4. Zhang, Y.; Li, T.; Wang, B. Decadal change of the spring snow depth over the Tibetan Plateau: The associated circulation and influence on the East Asian summer monsoon. J. Clim. 2004, 17, 2780–2793. [Google Scholar] [CrossRef] [Green Version]
  5. Jin, L.; Ganopolski, A.; Chen, F.; Claussen, M.; Wang, H. Impacts of snow and glaciers over Tibetan Plateau on Holocene climate change: Sensitivity experiments with a coupled model of intermediate complexity. Geophys. Res. Lett. 2005, 32, L17709. [Google Scholar] [CrossRef] [Green Version]
  6. Yang, K.; Ye, B.; Zhou, D.; Wu, B.; Foken, T.; Qin, J.; Zhou, Z. Response of hydrological cycle to recent climate changes in the Tibetan Plateau. Clim. Chang. 2011, 109, 517–534. [Google Scholar] [CrossRef]
  7. Yao, T.; Thompson, L.G.; Mosbrugger, V.; Zhang, F.; Ma, Y.; Luo, T.; Xu, B.; Yang, X.; Joswiak, D.R.; Wang, W. Third pole environment (TPE). Environ. Dev. 2012, 3, 52–64. [Google Scholar] [CrossRef]
  8. Piao, S.; Wang, X.; Ciais, P.; Zhu, B.; Wang, T.A.O.; Liu, J.I.E. Changes in satellite-derived vegetation growth trend in temperate and boreal Eurasia from 1982 to 2006. Glob. Chang. Biol. 2011, 17, 3228–3239. [Google Scholar] [CrossRef]
  9. Peng, S.-S.; Piao, S.; Zeng, Z.; Ciais, P.; Zhou, L.; Li, L.Z.; Myneni, R.B.; Yin, Y.; Zeng, H. Afforestation in China cools local land surface temperature. Proc. Natl. Acad. Sci. USA 2014, 111, 2915–2919. [Google Scholar] [CrossRef] [Green Version]
  10. Shen, M.; Piao, S.; Jeong, S.J.; Zhou, L.; Zeng, Z.; Ciais, P.; Chen, D.; Huang, M.; Jin, C.S.; Li, L.Z.; et al. Evaporative cooling over the Tibetan Plateau induced by vegetation growth. Proc. Natl. Acad. Sci. USA 2015, 112, 9299–9304. [Google Scholar] [CrossRef] [Green Version]
  11. Zeng, Z.; Piao, S.; Li, L.Z.; Zhou, L.; Ciais, P.; Wang, T.; Li, Y.; Lian, X.; Wood, E.F.; Friedlingstein, P. Climate mitigation from vegetation biophysical feedbacks during the past three decades. Nat. Clim. Chang. 2017, 7, 432–436. [Google Scholar] [CrossRef]
  12. Mishra, N.B.; Mainali, K.P. Greening and browning of the Himalaya: Spatial patterns and the role of climatic change and human drivers. Sci. Total Environ. 2017, 587, 326–339. [Google Scholar] [CrossRef] [PubMed]
  13. Piao, S.; Yin, G.; Tan, J.; Cheng, L.; Huang, M.; Li, Y.; Liu, R.; Mao, J.; Myneni, R.B.; Peng, S. Detection and attribution of vegetation greening trend in China over the last 30 years. Glob. Chang. Biol. 2015, 21, 1601–1609. [Google Scholar] [CrossRef]
  14. Shen, M.; Piao, S.; Chen, X.; An, S.; Fu, Y.H.; Wang, S.; Cong, N.; Janssens, I.A. Strong impacts of daily minimum temperature on the green-up date and summer greenness of the Tibetan Plateau. Glob. Chang. Biol. 2016, 22, 3057–3066. [Google Scholar] [CrossRef] [PubMed]
  15. Immerzeel, W.W.; Van Beek, L.P.; Bierkens, M.F. Climate change will affect the Asian water towers. Science 2010, 328, 1382–1385. [Google Scholar] [CrossRef]
  16. An, Z.; Wu, G.; Li, J.; Sun, Y.; Liu, Y.; Zhou, W.; Cai, Y.; Duan, A.; Li, L.; Mao, J. Global monsoon dynamics and climate change. Annu. Rev. Earth Planet. Sci. 2015, 43, 29–77. [Google Scholar] [CrossRef] [Green Version]
  17. Li, Y.; Ding, Y.; Li, W. Interdecadal variability of the Afro-Asian summer monsoon system. Adv. Atmos. Sci. 2017, 34, 833–846. [Google Scholar] [CrossRef]
  18. Li, J.; Zheng, F.; Sun, C.; Feng, J.; Wang, J. Pathways of influence of the Northern Hemisphere mid-high latitudes on East Asian climate: A review. Adv. Atmos. Sci. 2019, 36, 902–921. [Google Scholar] [CrossRef]
  19. Chen, D.; Xu, B.; Yao, T.; Guo, Z.; Cui, P.; Chen, F.; Zhang, R.; Zhang, X.; Zhang, Y.; Fan, J. Assessment of past, present and future environmental changes on the Tibetan Plateau. Chin. Sci. Bull. 2015, 60, 3025–3035. [Google Scholar] [CrossRef]
  20. Kuang, X.; Jiao, J.J. Review on climate change on the Tibetan Plateau during the last half century. J. Geophys. Res. Atmos. 2016, 121, 3979–4007. [Google Scholar] [CrossRef]
  21. Diffenbaugh, N.S.; Field, C.B. Changes in ecologically critical terrestrial climate conditions. Science. 2013, 341, 486–492. [Google Scholar] [CrossRef] [PubMed] [Green Version]
  22. Lu, C.; Wang, L.; Xie, G.; Leng, Y. Altitude effect of precipitation and spatial distribution of Qinghai-Tibetan Plateau. J. Mt. Sci. 2007, 25, 655–663. [Google Scholar] [CrossRef]
  23. Ding, M.; Zhang, Y.; Sun, X.; Liu, L.; Wang, Z.; Bai, W. Spatiotemporal variation in alpine grassland phenology in the Qinghai-Tibetan Plateau from 1999 to 2009. Chin. Sci. Bull. 2013, 58, 396–405. [Google Scholar] [CrossRef] [Green Version]
  24. Chen, H.; Zhu, Q.; Peng, C.; Wu, N.; Wang, Y.; Fang, X.; Gao, Y.; Zhu, D.; Yang, G.; Tian, J. The impacts of climate change and human activities on biogeochemical cycles on the Qinghai-Tibetan Plateau. Glob. Chang. Biol. 2013, 19, 2940–2955. [Google Scholar] [CrossRef] [PubMed]
  25. Sun, J.; Cheng, G.; Li, W.; Sha, Y.; Yang, Y. On the variation of NDVI with the principal climatic elements in the Tibetan Plateau. Remote Sens. 2013, 5, 1894–1911. [Google Scholar] [CrossRef] [Green Version]
  26. Yu, H.; Xu, J.; Okuto, E.; Luedeling, E. Seasonal response of grasslands to climate change on the Tibetan Plateau. PLoS ONE 2012, 7, e49230. [Google Scholar] [CrossRef]
  27. Zhang, G.; Zhang, Y.; Dong, J.; Xiao, X. Green-up dates in the Tibetan Plateau have continuously advanced from 1982 to 2011. Proc. Natl. Acad. Sci. USA 2013, 110, 4309–4314. [Google Scholar] [CrossRef] [Green Version]
  28. Shen, M.; Zhang, G.; Cong, N.; Wang, S.; Kong, W.; Piao, S. Increasing altitudinal gradient of spring vegetation phenology during the last decade on the Qinghai–Tibetan Plateau. Agric. For. Meteorol. 2014, 189, 71–80. [Google Scholar] [CrossRef]
  29. Piao, S.; Cui, M.; Chen, A.; Wang, X.; Ciais, P.; Liu, J.; Tang, Y. Altitude and temperature dependence of change in the spring vegetation green-up date from 1982 to 2006 in the Qinghai-Xizang Plateau. Agric. For. Meteorol. 2011, 151, 1599–1608. [Google Scholar] [CrossRef]
  30. Ding, M.; Li, L.; Zhang, Y.; Sun, X.; Liu, L.; Gao, J.; Wang, Z.; Li, Y. Start of vegetation growing season on the Tibetan Plateau inferred from multiple methods based on GIMMS and SPOT NDVI data. J. Geogr. Sci. 2015, 25, 131–148. [Google Scholar] [CrossRef]
  31. Ding, J.; Chen, L.; Ji, C.; Hugelius, G.; Li, Y.; Liu, L.; Qin, S.; Zhang, B.; Yang, G.; Li, F. Decadal soil carbon accumulation across Tibetan permafrost regions. Nat. Geosci. 2017, 10, 420. [Google Scholar] [CrossRef] [Green Version]
  32. Wang, S.; Zhang, B.; Yang, Q.; Chen, G.; Yang, B.; Lu, L.; Shen, M.; Peng, Y. Responses of net primary productivity to phenological dynamics in the Tibetan Plateau, China. Agric. For. Meteorol. 2017, 232, 235–246. [Google Scholar] [CrossRef]
  33. Pang, G.; Wang, X.; Yang, M. Using the NDVI to identify variations in, and responses of, vegetation to climate change on the Tibetan Plateau from 1982 to 2012. Quat. Int. 2017, 444, 87–96. [Google Scholar] [CrossRef]
  34. Hua, T.; Wang, X. Temporal and Spatial Variations in the Climate Controls of Vegetation Dynamics on the Tibetan Plateau during 1982–2011. Adv. Atmos. Sci. 2018, 35, 1337–1346. [Google Scholar] [CrossRef]
  35. Yu, H.; Luedeling, E.; Xu, J. Winter and spring warming result in delayed spring phenology on the Tibetan Plateau. Proc. Natl. Acad. Sci. USA 2010, 107, 22151–22156. [Google Scholar] [CrossRef] [PubMed] [Green Version]
  36. Chen, B.; Zhang, X.; Tao, J.; Wu, J.; Wang, J.; Shi, P.; Zhang, Y.; Yu, C. The impact of climate change and anthropogenic activities on alpine grassland over the Qinghai-Tibet Plateau. Agric. For. Meteorol. 2014, 189, 11–18. [Google Scholar] [CrossRef]
  37. Huang, K.; Zhang, Y.; Zhu, J.; Liu, Y.; Zu, J.; Zhang, J. The influences of climate change and human activities on vegetation dynamics in the Qinghai-Tibet Plateau. Remote Sens. 2016, 8, 876. [Google Scholar] [CrossRef] [Green Version]
  38. Harris, R.B. Rangeland degradation on the Qinghai-Tibetan plateau: A review of the evidence of its magnitude and causes. J. Arid Environ. 2010, 74, 1–12. [Google Scholar] [CrossRef]
  39. Xue, X.; Guo, J.; Han, B.; Sun, Q.; Liu, L. The effect of climate warming and permafrost thaw on desertification in the Qinghai–Tibetan Plateau. Geomorphology 2009, 108, 182–190. [Google Scholar] [CrossRef]
  40. Shi, Y.; Wang, Y.; Ma, Y.; Ma, W.; Liang, C.; Flynn, D.; Schmid, B.; Fang, J.; He, J. Field-based observations of regional-scale, temporal variation in net primary production in Tibetan alpine grasslands. Biogeosciences. 2014, 11, 2003–2016. [Google Scholar] [CrossRef] [Green Version]
  41. Liu, S.; Zhang, Y.; Cheng, F.; Hou, X.; Zhao, S. Response of grassland degradation to drought at different time-scales in Qinghai Province: Spatio-temporal characteristics, correlation, and implications. Remote Sens. 2017, 9, 1329. [Google Scholar] [CrossRef] [Green Version]
  42. Piao, S. Interannual variations of monthly and seasonal normalized difference vegetation index (NDVI) in China from 1982 to 1999. J. Geophys. Res. 2003, 108. [Google Scholar] [CrossRef]
  43. Xu, H.-J.; Wang, X.-P.; Zhang, X.-X. Alpine grasslands response to climatic factors and anthropogenic activities on the Tibetan Plateau from 2000 to 2012. Ecol. Eng. 2016, 92, 251–259. [Google Scholar] [CrossRef]
  44. Wang, Q.; Lü, S.; Bao, Y.; MA, D.; Li, R. Characteristics of vegetation change and its relationship with climate factors in different time-scales on Qinghai-Xizang Plateau. Plateau Meteorol. 2014, 33, 301–312. [Google Scholar] [CrossRef]
  45. Zhang, T. Perspectives on environmental study of response to climatic and land cover/land use change over the Qinghai-Tibetan Plateau: An introduction. Arct. Antarct. Alp. Res. 2007, 39, 631–634. [Google Scholar] [CrossRef]
  46. Zhang, X.; Ren, Y.; Yin, Z.Y.; Lin, Z.; Zheng, D. Spatial and temporal variation patterns of reference evapotranspiration across the Qinghai-Tibetan Plateau during 1971–2004. J. Geophys. Res. Atmos. 2009, 114. [Google Scholar] [CrossRef]
  47. Shenbin, C.; Yunfeng, L.; Thomas, A. Climatic change on the Tibetan Plateau: Potential Evapotranspiration Trends from 1961–2000. Clim. Chang. 2006, 76, 291–319. [Google Scholar] [CrossRef]
  48. Wu, S.; Yin, Y.; Zheng, D.; Yang, Q. Climatic trends over the Tibetan Plateau during 1971–2000. J. Geogr. Sci. 2007, 17, 141–151. [Google Scholar] [CrossRef]
  49. Gao, Y.; Li, X.; Ruby Leung, L.; Chen, D.; Xu, J. Aridity changes in the Tibetan Plateau in a warming climate. Environ. Res. Lett. 2015, 10, 034013. [Google Scholar] [CrossRef]
  50. Yin, Y.; Wu, S.; Zhao, D.; Zheng, D.; Pan, T. Modeled effects of climate change on actual evapotranspiration in different eco-geographical regions in the Tibetan Plateau. J. Geogr. Sci. 2013, 23, 195–207. [Google Scholar] [CrossRef]
  51. Li, Y.; Liao, J.; Guo, H.; Liu, Z.; Shen, G. Patterns and potential drivers of dramatic changes in Tibetan lakes, 1972–2010. PLoS ONE 2014, 9, e111890. [Google Scholar] [CrossRef] [PubMed] [Green Version]
  52. Li, L.; Zhang, Y.; Wu, J.; Li, S.; Zhang, B.; Zu, J.; Zhang, H.; Ding, M.; Paudel, B. Increasing sensitivity of alpine grasslands to climate variability along an elevational gradient on the Qinghai-Tibet Plateau. Sci Total Environ. 2019, 678, 21–29. [Google Scholar] [CrossRef] [PubMed]
  53. Zhang, X.; Yang, Y.; Piao, S.; Bao, W.; Wang, S.; Wang, G.; Sun, H.; Luo, T.; Zhang, Y.; Shi, P. Ecological change on the Tibetan Plateau. Sci. Bull. 2015, 60, 3048–3056. [Google Scholar] [CrossRef] [Green Version]
  54. Li, S.; Wu, J.; Gong, J.; Li, S. Human footprint in Tibet: Assessing the spatial layout and effectiveness of nature reserves. Sci. Total Environ. 2018, 621, 18–29. [Google Scholar] [CrossRef]
  55. Li, S.; Wang, Z.; Zhang, Y. Crop cover reconstruction and its effects on sediment retention in the Tibetan Plateau for 1900–2000. J. Geogr. Sci. 2017, 27, 786–800. [Google Scholar] [CrossRef]
  56. Wei, Y.Q.; Lu, H.Y.; Wang, J.N.; Sun, J.; Wang, X.F. Responses of vegetation zones, in the Qinghai-Tibetan Plateau, to climate change and anthropogenic influences over the last 35 years. Pratacultural Sci. 2019, 36, 250–263. [Google Scholar] [CrossRef]
  57. Yu, C.; Zhang, X.; Zhang, J.; Li, S.; Song, C.; Fang, Y.; Wurst, S.; Wu, J. Grazing exclusion to recover degraded alpine pastures needs scientific assessments across the northern Tibetan Plateau. Sustainability 2016, 8, 1162. [Google Scholar] [CrossRef] [Green Version]
  58. Quanqin, S.; Jiangwen, F.; Jiyuan, L.; Lin, H.; Wei, C.; Lulu, L. Target-based assessment on effects of first-stage ecological conservation and restoration project in three-river source region, China and policy recommendations. Bull. Chin. Acad. Sci. 2017, 32, 35–44. [Google Scholar]
  59. Wang, X.; Cheng, G.; Zhao, T.; Zhang, X.; Zhu, L.; Huang, L. Assessment on protection and construction of ecological safety shelter for Tibet. Bull. Chin. Acad. Sci. 2017, 32, 29–34. [Google Scholar]
  60. Li, S.; Zhang, Y.; Wang, Z.; Li, L. Mapping human influence intensity in the Tibetan Plateau for conservation of ecological service functions. Ecosyst. Serv. 2018, 30, 276–286. [Google Scholar] [CrossRef]
  61. Peng, J.; Liu, Z.; Liu, Y.; Wu, J.; Han, Y. Trend analysis of vegetation dynamics in Qinghai–Tibet Plateau using Hurst Exponent. Ecol. Indic. 2012, 14, 28–39. [Google Scholar] [CrossRef]
  62. Li, S.-C.; Zhao, Z.Q.; Gao, Y.; Wang, Y.L. Determining the predictability and the spatial pattern of urban vegetation using recurrence quantification analysis:A case study of Shenzhen City. Geogr. Res. 2008, 27, 1243–1252. [Google Scholar] [CrossRef]
  63. Zhang, H.; Shu, Y.; Yang, O. Estimation of Hurst parameter by variance-time plots. In Proceedings of the 1997 IEEE Pacific Rim Conference on Communications, Computers and Signal Processing, PACRIM. 10 Years Networking the Pacific Rim, 1987–1997, Victoria, BC, Canada, 20–22 August 1997; Volume 2, pp. 883–886. [Google Scholar]
  64. Gu, Z.; Duan, X.; Shi, Y.; Li, Y.; Pan, X. Spatiotemporal variation in vegetation coverage and its response to climatic factors in the Red River Basin, China. Ecol. Indic. 2018, 93, 54–64. [Google Scholar] [CrossRef]
  65. Tong, S.; Zhang, J.; Bao, Y.; Lai, Q.; Lian, X.; Li, N.; Bao, Y. Analyzing vegetation dynamic trend on the Mongolian Plateau based on the Hurst exponent and influencing factors from 1982–2013. J. Geogr. Sci. 2018, 28, 595–610. [Google Scholar] [CrossRef] [Green Version]
  66. Tian, Y.; Bai, X.; Wang, S.; Qin, L.; Li, Y. Spatial-temporal changes of vegetation cover in Guizhou Province, Southern China. Chin. Geogr. Sci. 2017, 27, 25–38. [Google Scholar] [CrossRef] [Green Version]
  67. Sun, H.; Wang, C.; Niu, Z. Analysis of the vegetation cover change and the relationship between NDVI and environmental factors by using NOAA time series data. J. Remote Sens. 1998, 2, 210–216. [Google Scholar] [CrossRef]
  68. Qiu, J. China: The third pole. Nat. News 2008, 454, 393–396. [Google Scholar]
  69. Li, S.; Ma, B.Z.; Hou, Q.; He, H. Spatiotemporal evolution of effective accumulated temperatures of ≥5 °C and ≥10 °C based on grid data in China from 1961 to 2016. J. Nat. Resour. 2020, 35, 1216–1227. (In Chinese) [Google Scholar] [CrossRef]
  70. Jonsson, P.; Eklundh, L. TIMESAT—A program for analyzing time-series of satellite sensor data. Comput. Geoences. 2004, 30, 833–845. [Google Scholar] [CrossRef] [Green Version]
  71. Shen, M.; Tang, Y.; Chen, J.; Zhu, X.; Zheng, Y. Influences of temperature and precipitation before the growing season on spring phenology in grasslands of the central and eastern Qinghai-Tibetan Plateau. Agric. For. Meteorol. 2011, 151, 1711–1722. [Google Scholar] [CrossRef]
  72. Ibrahim, Y.Z.; Balzter, H.; Kaduk, J.; Tucker, C.J. Land Degradation Assessment Using Residual Trend Analysis of GIMMS NDVI3g, Soil Moisture and Rainfall in Sub-Saharan West Africa from 1982 to 2012. Remote Sens. 2015, 7, 5471–5494. [Google Scholar] [CrossRef] [Green Version]
  73. Liu, Y.; Lei, H. Responses of Natural Vegetation Dynamics to Climate Drivers in China from 1982 to 2011. Remote Sens. 2015, 7, 10243–10268. [Google Scholar] [CrossRef] [Green Version]
  74. Granero, M.S.; Segovia, J.T.; Pérez, J.G. Some comments on Hurst exponent and the long memory processes on capital markets. Phys. A Stat. Mech. Appl. 2008, 387, 5543–5551. [Google Scholar] [CrossRef]
  75. Cong, N.; Shen, M.; Yang, W.; Yang, Z.; Zhang, G.; Piao, S. Varying responses of vegetation activity to climate changes on the Tibetan Plateau grassland. Int. J. Biometeorol. 2017, 61, 1433–1444. [Google Scholar] [CrossRef] [PubMed]
  76. Lehnert, L.W.; Wesche, K.; Trachte, K.; Reudenbach, C.; Bendix, J. Climate variability rather than overstocking causes recent large scale cover changes of Tibetan pastures. Sci. Rep. 2016, 6, 24367. [Google Scholar] [CrossRef] [PubMed] [Green Version]
  77. Wang, G.; Baskin, C.C.; Baskin, J.M.; Yang, X.; Liu, G.; Ye, X.; Zhang, X.; Huang, Z. Effects of climate warming and prolonged snow cover on phenology of the early life history stages of four alpine herbs on the southeastern Tibetan Plateau. Am. J. Bot. 2018, 105, 967–976. [Google Scholar] [CrossRef]
  78. Yu, L.; Huang, L.; Shao, X.; Xiao, F.; Wilmking, M.; Zhang, Y. Warming-Induced Decline of Picea crassifolia Growth in the Qilian Mountains in Recent Decades. PLoS ONE. 2015, 10, e0129959. [Google Scholar] [CrossRef]
  79. Michaletz, S.T.; Cheng, D.; Kerkhoff, A.J.; Enquist, B.J. Convergence of terrestrial plant production across global climate gradients. Nature. 2014, 512, 39. [Google Scholar] [CrossRef]
  80. Lu, J.; Ji, J. A simulation and mechanism analysis of long-term variations at land surface over arid/semi-arid area in north China. J. Geophys. Res. 2006, 111. [Google Scholar] [CrossRef]
  81. Hua, W.; Lin, Z.; Guo, D.; Fan, G.; Zhang, Y.; Yang, K.; Hu, Q.; Zhu, L. Simulated Long-Term Vegetation–Climate Feedbacks in the Tibetan Plateau. Asia Pac. J. Atmos. Sci. 2019, 55, 41–52. [Google Scholar] [CrossRef]
  82. Feng, X.; Fu, B.; Piao, S.; Wang, S.; Ciais, P.; Zeng, Z.; Lü, Y.; Zeng, Y.; Li, Y.; Jiang, X.; et al. Revegetation in China’s Loess Plateau is approaching sustainable water resource limits. Nat. Clim. Chang. 2016, 6, 1019–1022. [Google Scholar] [CrossRef]
  83. Zeng, C.; Zhang, F.; Wang, Q.; Chen, Y.; Joswiak, D.R. Impact of alpine meadow degradation on soil hydraulic properties over the Qinghai-Tibetan Plateau. J. Hydrol. 2013, 478, 148–156. [Google Scholar] [CrossRef]
  84. Wang, G.; Wang, Y.; Li, Y.; Cheng, H. Influences of alpine ecosystem responses to climatic change on soil properties on the Qinghai–Tibet Plateau, China. Catena 2007, 70, 506–514. [Google Scholar] [CrossRef]
  85. Gao, Q.-Z.; Wan, Y.-F.; Xu, H.-M.; Li, Y.; Jiangcun, W.-Z.; Borjigidai, A. Alpine grassland degradation index and its response to recent climate variability in Northern Tibet, China. Quat. Int. 2010, 226, 143–150. [Google Scholar] [CrossRef]
  86. Li, Q.; Zhang, C.; Shen, Y.; Jia, W.; Li, J. Quantitative assessment of the relative roles of climate change and human activities in desertification processes on the Qinghai-Tibet Plateau based on net primary productivity. Catena 2016, 147, 789–796. [Google Scholar] [CrossRef]
  87. Cao, S.; Ma, H.; Yuan, W.; Wang, X. Interaction of ecological and social factors affects vegetation recovery in China. Biol. Conserv. 2014, 180, 270–277. [Google Scholar] [CrossRef]
  88. Yang, Y.-H.; Piao, S.-L. Variations in grassland vegetation cover in relation to climatic factors on the Tibetan Plateau. J. Plant Ecol. 2006, 30, 1–8. [Google Scholar] [CrossRef]
  89. Zhang, J.; Feng, Z.; Jiang, L.; Yang, Y. Analysis of the correlation between NDVI and climate factors in the Lancang River Basin. J. Nat. Resour. 2015, 30, 1425–1435. [Google Scholar] [CrossRef]
  90. Zhao, H.; Liu, S.; Dong, S.; Su, X.; Wang, X.; Wu, X.; Wu, L.; Zhang, X. Analysis of vegetation change associated with human disturbance using MODIS data on the rangelands of the Qinghai-Tibet Plateau. Rangel. J. 2015, 37, 77–87. [Google Scholar]
  91. Cai, H.; Yang, X.; Xu, X. Human-induced grassland degradation/restoration in the central Tibetan Plateau: The effects of ecological protection and restoration projects. Ecol. Eng. 2015, 83, 112–119. [Google Scholar] [CrossRef]
  92. Zhang, Y.; Hu, Z.; Qi, W.; Wu, X.; Bai, W.; Li, L.; Ding, M.; Liu, L.; Wang, Z.; Zheng, D. Assessment of effectiveness of nature reserves on the Tibetan Plateau based on net primary production and the large sample comparison method. J. Geogr. Sci. 2016, 26, 27–44. [Google Scholar] [CrossRef] [Green Version]
  93. Wang, X.; Yi, S.; Wu, Q.; Yang, K.; Ding, Y. The role of permafrost and soil water in distribution of alpine grassland and its NDVI dynamics on the Qinghai-Tibetan Plateau. Glob. Planet. Chang. 2016, 147, 40–53. [Google Scholar] [CrossRef]
Figure 1. The vegetation type and elevation of the QTP.
Remotesensing 12 03150 g001
Figure 2. The spatial distribution of 20-year mean GNDVI on the QTP during 2000–2019.
Remotesensing 12 03150 g002
Figure 3. Interannual variation of the GNDVI on the QTP during 2000–2019.
Remotesensing 12 03150 g003
Figure 4. The spatial patterns of the GNDVI trend on the QTP. The figures above show the GNDVI slope in different periods, and the figures below show the corresponding significance of the GNDVI slope.
Remotesensing 12 03150 g004
Figure 5. The perennial mean (a) temperature and (b) moist coefficient in the growing season of the vegetated areas during 2000–2019.
Remotesensing 12 03150 g005
Figure 6. The spatial distribution climate change in the growing season on the QTP.
Remotesensing 12 03150 g006
Figure 7. The partial correlation coefficient between the GNDVI and climatic factors under different conditions of (a) temperature and (b) moisture on the QTP during 2000–2019. * p <0.05.
Remotesensing 12 03150 g007
Figure 8. The spatial pattern of the partial correlation coefficient between the GNDVI and temperature and moist coefficient in the growing season on the QTP.
Remotesensing 12 03150 g008
Figure 9. The spatial distribution of climatic factor’s time lag at which the maximum partial correlation coefficient between the GNDVI and (a) temperature and (b) moist coefficient on the QTP during 2000–2019.
Remotesensing 12 03150 g009
Figure 10. (a) The GDNVI residual variation of the whole QTP and (b) its spatial pattern during 2000–2019.
Remotesensing 12 03150 g010
Figure 11. (a) The areal proportion of different Hurst exponent levels and (b) spatial distribution of future vegetation trends on the QTP.
Remotesensing 12 03150 g011
Table 1. Classification of the GNDVIvariation in the future.
GNDVI SlopeH < 0.40.4 < H < 0.6H > 0.6
Slope < −0.001IncreaseUncertainDecrease
−0.001 ≤ Slope ≤ 0.001StableUncertainStable
Slope ≥ 0.001DecreaseUncertainIncrease
Table 2. The areal proportion of different the GNDVI slope levels in different study periods on the QTP during 2000–2019 (%).
GNDVI Slope (/a)Study Period
2000–20092010–20192000–2019
<−0.0044.269.410.81
−0.004–−0.00112.7416.166.86
−0.001–012.5212.3213.03
0–0.00116.4117.1131.80
0.001–0.00429.5532.0842.12
>0.00424.5212.925.38
Table 3. The areal proportion of different climate change rates in different study periods on the QTP (%).
Temperature Slope (°C/a)Study Period
2000–20092010–20192000–2019
<−0.23.936.160.01
−0.2–−0.19.9517.930.83
−0.1–020.2532.9433.51
0–0.125.8328.8858.56
0.1–0.220.7111.467.04
>0.219.332.640.05
Moist Coefficient Slope (/a)2000–20092010–20192000–2019
<−0.0423.363.863.37
−0.04–−0.0211.764.073.89
−0.02–026.6322.8633.13
0–0.0229.3637.9455.17
0.02–0.047.7315.933.11
>0.041.1615.341.33
Table 4. The areal proportion of different partial correlation levels in different study periods on the QTP (%).
Temperature vs. GNDVIMoist Coefficient vs. GNDVI
PC2000–20092010–20192000–2019PC2000–20092010–20192000–2019
−1–−0.81.361.750.06−1–−0.80.980.780.02
−0.8–−0.67.288.172.24−0.8–−0.65.634.511.11
−0.6–−0.412.7412.989.23−0.6–−0.411.049.006.36
−0.4–−0.215.5115.0415.81−0.4–−0.214.8912.7214.25
−0.2–016.2015.3219.07−0.2–016.9315.5919.92
0–0.215.4814.6219.980–0.216.9917.0921.22
0.2–0.413.6313.1617.940.2–0.415.1416.7918.90
0.4–0.610.5110.7011.850.4–0.611.3013.9213.42
0.6–0.86.066.683.690.6–0.86.048.074.64
0.8–11.251.590.140.8–11.071.520.15
PC: Partial correlation coefficient.

