Article

Spectral Aerosol Optical Depth Retrievals by Ground-Based Fourier Transform Infrared Spectrometry

by
África Barreto
1,2,3,*,
Omaira Elena García
1,
Matthias Schneider
4,
Rosa Delia García
1,3,
Frank Hase
4,
Eliezer Sepúlveda
1,
Antonio Fernando Almansa
1,2,3,
Emilio Cuevas
1 and
Thomas Blumenstock
4
1
Izaña Atmospheric Research Center (IARC), State Meteorological Agency of Spain (AEMET), 38001 Santa Cruz de Tenerife, Spain
2
Cimel Electronique, 75011 Paris, France
3
Atmospheric Optics Group of Valladolid University (GOA–UVa), Valladolid University, 47001 Valladolid, Spain
4
Karlsruhe Institute of Technology (KIT), Institute of Meteorology and Climate Research (IMK-ASF), 76021 Karlsruhe, Germany
*
Author to whom correspondence should be addressed.
Remote Sens. 2020, 12(19), 3148; https://doi.org/10.3390/rs12193148
Submission received: 24 August 2020 / Revised: 16 September 2020 / Accepted: 21 September 2020 / Published: 24 September 2020
(This article belongs to the Section Atmospheric Remote Sensing)

Abstract

:
Aerosol Optical Depth (AOD) and the Ångström Exponent (AE) have been calculated in the near infrared (NIR) and short-wave infrared (SWIR) spectral regions over a period of one year (May 2019–May 2020) at the high-mountain Izaña Observatory (IZO) from Fourier Transform Infrared (FTIR) solar spectra. The high-resolution FTIR measurements were carried out coincidentally with Cimel CE318-T photometric observations in the framework of the Aerosol Robotic Network (AERONET). A spectral FTIR AOD was generated using two different approaches: by means of the selection of seven narrow FTIR micro-windows (centred at 1020.90, 1238.25, 1558.25, 1636.00, 2133.40, 2192.00, and 2314.20 nm) with negligible atmospheric gaseous absorption, and by using the CE318-AERONET’s response function in the near-coincident bands (1020 nm and 1640 nm) to degrade the high-resolution FTIR spectra. The FTIR system was absolutely calibrated by means of a continuous Langley–Plot analysis over the 1-year period. An important temporal drift of the calibration constant was observed as a result of the environmental exposure of the FTIR’s external optical mirrors (linear degradation rate up to 1.75% month 1 ). The cross-validation of AERONET-FTIR databases documents an excellent agreement between both AOD products, with mean AOD differences below 0.004 and root-mean-squared errors below 0.006. A rather similar agreement was also found between AERONET and FTIR convolved bands, corroborating the suitability of low-resolution sunphotometers to retrieve high-quality AOD data in the NIR and SWIR domains. In addition, these results demonstrate that the methodology developed here is suitable to be applied to other FTIR spectrometers, such as portable and low-resolution FTIR instruments with a potentially higher spatial coverage. The spectral AOD dependence for the seven FTIR micro-windows have been also examined, observing a spectrally flat AOD behaviour for mineral dust particles (the typical atmospheric aerosols presented at IZO). A mean AE value of 0.53 ± 0.08 for pure mineral dust in the 1020–2314 nm spectral range was retrieved in this paper. A subsequent cross-validation with the MOPSMAP (Modeled optical properties of ensembles of aerosol particles) package has ensured the reliability of the FTIR dataset, with AE values between 0.36 to 0.60 for a typical mineral dust content at IZO of 100 cm 3 and water-soluble particle (WASO) content ranging from 600 to 6000 cm 3 . The new database generated in this study is believed to be the first long-term time series (1-year) of aerosol properties generated consistently in the NIR and SWIR ranges from ground-based FTIR spectrometry. As a consequence, the results presented here provide a very promising tool for the validation and subsequent improvement of satellite aerosol products as well as enhance the sensitivity to large particles of the existing databases, required to improve the estimation of the aerosols’ radiative effect on climate.

Graphical Abstract

1. Introduction

Atmospheric aerosols are considered as an “essential climate variable” by the Global Climate Observing System (GCOS) World Meteorological Organization (WMO) programme [1], exerting an important influence on the Earth–atmosphere radiative balance. These atmospheric constituents are important radiative drivers of climate change through radiation, cloud, and surface interactions [2]. However, estimation of the overall aerosol force is fraught with uncertainties, with the dominance of uncertainty associated with the total anthropogenic drive of climate change [3].
The different aerosol–climate interactions strongly depend on the aerosols’ optical and radiative properties, which are characterized by an important spectral dependence from the ultraviolet (UV) to the infrared (IR) region. Accurate knowledge of this spectral behavior is fundamental to properly describe the different aerosol radiative effects on the Earth–atmosphere radiative balance. This is especially challenging in the IR region, where there is an important lack of aerosol spectral information as reference [4,5,6]. It is well known that most aerosol types show a rather small impact on IR in comparison to their effect in the visible (VIS) region [7], where the strongest aerosol–radiation interaction takes place. However, large aerosols such as mineral dust are able to efficiently interact with both solar and terrestrial radiation [8], with a radiative impact sensitive to particle size distribution and its evolution with transport [9]. A better characterization of larger aerosol particles may enhance, for example, the spectral sensitivity to super-micron (coarse mode) particles in the inversion techniques [10,11]. This improved characterization could help to estimate more precisely global anthropogenic aerosol forces [4] and to solve the problematic representation of large aerosols like mineral dust in the current global climate models. Traditionally, mineral dust in the atmosphere is considered a particle substantially coarser than the dust represented in climate models, leading to a bias towards a radiative cooling effect in these dust models [9,12]. Actually, as [9,13] have found, the incorporation of coarse particles in climate model simulations is important to account for the substantial radiative effect of dust in terms of the reduction of single-scattering albedo of shortwave radiation, the increase of radiative absorption, and the enhancement of long-wave radiation absorption.
Currently, aerosol spectral characterization is mainly addressed with aerosol models [14,15,16], by means of in-situ and ground-based remote sensing techniques [17,18,19] or space-based sensors [4,20,21].
Aerosol models provide a general description of aerosol properties using precalculated optical and microphysical properties of particles. Optical Properties of Aerosols and Clouds (OPAC) [14] and the Global Aerosol Database (GDAS) [15] are two of the most widely used models in the literature, both applying aerosol chemistry data sets to derive aerosol radiative properties. Recently, the MOPSMAP (Modeled optical properties of ensembles of aerosol particles) package has been developed by [16], improving the existing aerosol shape characterisation through spheroids and a small set of irregularly shaped dust particles. All these models provide reference information to estimate the aerosol radiative effect, but a few direct observations in the long-wave spectral range still exist for their validation.
Atmospheric remote sounding from space is also an essential component for the aerosol monitoring strategy, since it allows for global coverage. After a long period of disinterest in aerosol monitoring in the IR domain [22], in recent years, satellite remote sensing has been extended to IR in order to maximize the effectiveness of some aerosol products for climate and to improve surface reflectance estimations over land [7]. Remarkable examples are the Atmospheric Infrared Sounder (AIRS) on board National Aeronautics and Space Administration’s (NASA) Earth Observing System (EOS) Aqua satellite [23,24], the Infrared Atmospheric Sounder Interferometer (IASI) on board the EUMETSAT/Metop platforms [25], or the Moderate Resolution Imaging Spectroradiometer (MODIS) on board NASA’s Terra and Aqua satellites [4,26]. There are other sensors incorporating IR spectral bands, such as the Operational Land Imager (OLI) aboard Landsat-8 [27] and the Visible Infrared Imaging Radiometer Suite (VIIRS) aboard Suomi NPP [28], but they are less focused on the IR aerosol perspective. However, a continuous documentation of their quality is required for correct scientific usage and interpretation of these observational records.
Ground-level instruments based on solar-extinction measurements in IR are also scarce, even though this information can be considered as a reference for satellite product and aerosol model validation. Among the existing measurement systems, sun photometry is a well-developed technique which allows us to quantify the aerosols’ effects on climate through observation of column-integrated light extinction as well as to validate satellite remote sensing measurements [29]. Although ground-based photometric observations are mostly restricted to VIS, there are some exceptions covering spectral bands in the near IR (NIR) and short-wave infrared (SWIR) regions. This is the case of reference instruments of the most important ground-based aerosol monitoring networks: the Prede-POM in the SKYradiometer NETwork (SKYNET) [18] and the CE318-N and CE318-T in the Aerosol Robotic Network (AERONET and CE318-AERONET) [17,30,31]. Both instruments, within their corresponding networks, provide operational columnar aerosol properties in two spectral bands in the NIR (centred at 870 nm and 1020 nm) and in one band in the SWIR (centred at 1627 nm and 1640 nm for POM and CE318 photometers, respectively). The POM radiometer is also extended with a channel at 2200 nm, but operational data is still under development. There are other ground-based observation systems with the capability to perform aerosol spectral measurements in the NIR and SWIR, such as the 4STAR spectrometer [32], the GUVis radiometer [33], or the AATS-14 (NASA Ames Airborne Tracking Sunphotometer) [34], but they are far from being commercial instruments easily deployed for aerosol monitoring on a global scale.
In this context, ground-based Fourier Transform Infrared (FTIR) spectrometry offers a very promising tool to extend aerosol characterization to the IR spectral domain. FTIR spectrometers provide routine atmospheric concentrations of many different trace gases simultaneously and with high precision by analysing the pressure broadening effect on the measured solar infrared absorption spectra through inversion schemes [35,36,37,38,39,40,41]. Despite this instrument not being traditionally used for aerosol monitoring, some previous works have demonstrated its capability to derive aerosol microphysical and radiative properties, specially in the thermal IR region (e.g., [42,43,44,45]). In the current work, a tentative approach has been developed to explore the possibility to retrieve columnar aerosol properties from high-resolution FTIR solar spectra in the NIR and SWIR regions. We have focused on the Aerosol Optical Depth (AOD) parameter as an important indicator of columnar aerosol loading and widely used in climate studies [19,46]. AOD spectral dependence also contains useful information about aerosol radiative effects through aerosol size distribution [47,48,49], which can be roughly parametrized by the Ångström exponent (AE) [50]. The joint information on AOD and AE allows us to discriminate aerosols with similar solar extinction features but with different sizes [47,51,52,53].
This pioneering study has been developed at the subtropical high-mountain Izaña Observatory (IZO), where high-resolution FTIR measurements have been coincidentally carried out with standard sun photometry in the framework of the AERONET network during one year (May 2019–May 2020). The co-located AERONET-FTIR database will allow the new FTIR products to be comprehensively validated in the common spectral range covering the NIR and the SWIR. The spectral dependence of FTIR aerosol products will be further assessed by comparison to MOPSMAP model estimations. To do so, this paper is structured as follows. The test site is presented in Section 2, while the description of the FTIR technique and the measurements used in this study are given in Section 3. Section 4 describes the ancillary data considered to assess the quality and consistency of the new FTIR IR aerosol products: CE318-AERONET database and MOPSMAP package. Section 5 gives a detailed description of the methodology to select the FTIR micro-windows for the spectral AOD calculation (Section 5.1), the approach used for AOD (Section 5.2) and AE estimation (Section 5.3), the quality control implemented on the FTIR observations (Section 5.4), and the main limitations for FTIR AOD retrievals (Section 5.5). The results are tackled in Section 6, in terms of the FTIR absolute calibration (Section 6.1), AOD (Section 6.2), and AE (Section 6.3). Finally, a summary and conclusions of the present work are provided in Section 7.

2. Test Site

Izaña Observatory (IZO, 28.3 N, 16.5 W; 2373 m a.s.l.) is a high-altitude observatory located on Tenerife (Canary Islands, Spain). This station is managed by the Izaña Atmospheric Research Center (IARC), which is part of the State Meteorological Agency of Spain (AEMET). The elevation and the subtropical location of IZO, in the descending branch of Northern Hadley’s cell, entail dry atmospheric conditions and the presence of pristine skies representative of the free troposphere most of the time (see [54,55,56], and the references therein). These privileged conditions have allowed a comprehensive measurement programme for atmospheric composition monitoring to be established at IZO for many years. Indeed, IZO has contributed to the Global Atmosphere Watch (GAW) WMO programme since 1984 and was designated in 2014 by the WMO as a CIMO (Commission for Instruments and Methods of Observation) testbed for aerosols and water vapour remote sensing instruments [57]. The IZO monitoring activities routinely participate in multiple international networks and databases, highlighting its role as an absolute calibration site for two of the most important ground-based photometer aerosol networks: NASA-AERONET and GAW precision-filter radiometers (GAW-PFR). In this sense, IZO is commonly used for optimal application of the Langley–Plot technique to a large number of activities, such as absolute direct sun/moon photometric calibration [30,56,58,59] or the retrieval of reference top-of-atmosphere (TOA) solar spectrum from the ground at different spectral ranges [60,61]. Refer to [55] for more details about IZO and its atmospheric monitoring programmes.
Another important feature of IZO is related with its proximity to the African continent (∼300 km), where the Earth’s largest sources of mineral dust are located [62,63]. Indeed, IZO is placed within the main dust corridor from North African sources to the Atlantic Ocean, the so-called Saharan Air Layer (SAL, [63]). This long-range dust transport occurs from early summer to early autumn above the trade wind inversion [53], but also important dust outbreaks out of this season can sporadically affect IZO [62]. This strong seasonal variability can be explained by the different emission processes of mineral dust in North Africa and the presence of marked regional meteorological patterns [54].
Some studies in the literature have been focused on the aerosol climatology at IZO, showing that high AOD conditions due to Saharan dust transport are prevalent in summer months and can be characterized by AOD at 500 nm above 0.1, which can be associated with the presence of large particles (AE at 440–870 below 0.25 for pure mineral dust) [53,64,65]. Prevalent pristine conditions can be found the rest of the year [64], with AOD at 500 nm below 0.1 and AE above 0.6. However, as [65,66] have confirmed by means of lidar and in situ observations, respectively, mineral dust is the predominant aerosol in the North Atlantic free troposphere (and consequently at IZO) under most atmospheric conditions. This fact ensures that the IR spectral AOD characterization performed in the present study is focused mainly on mineral dust particles.

3. FTIR

In Fourier transform (FT) spectrometry, the source radiation (typically the sun for atmospheric ground-based measurements) is modulated by an interferometer and all optical frequencies are recorded simultaneously in the measured interferogram. Then, a discrete fast Fourier transformation is used to retrieve the atmospheric absorption spectrum from the interferogram [67]. Application of the FT measurement technique in the IR domain has a well-known capability for atmospheric gas monitoring and, therefore, for climate research, since most atmospheric molecules interact with solar electromagnetic radiation in this spectral region (e.g., [35,36,38,39,40,41,67,68,69,70,71], and the references therein.)
A ground-based FTIR experiment has two main components: an externally mounted active solar tracker that collects the solar beam and couples it into an FTIR spectrometer, for which the core element is typically a Michelson interferometer for high-resolution instruments. Nowadays, the globally distributed high-resolution FTIRs mainly operate within two international networks for atmospheric composition monitoring: NDACC (Network for the Detection of Atmospheric Composition Change [41]) and TCCON (Total Carbon Column Observing Network [39]). Recently, these high-resolution FTIR observations have been extended by COCCON (COllaborative Carbon Column Observing Network [72]), which is a research infrastructure of portable, compact, and low-resolution FTIRs set up as a supplement to TCCON.
Within the IZO’s atmospheric research activities, the FTIR programme started in 1999 in the framework of a collaboration between AEMET and KIT (Karlsruhe Institute of Technology) [36], contributing to NDACC and TCCON networks since 1999 and 2007, respectively. To do so, the IZO FTIR instrument, currently a Bruker IFS 125HR, records direct solar absorption spectra in the middle infrared (MIR) region within NDACC activities and in the NIR and SWIR spectral regions for TCCON retrievals, using a set of different apertures, narrow-bandpass filters, and detectors.
In this work, only the NIR and SWIR solar spectra acquired with standard TCCON settings are used [37,39]. These measurements are taken between 4000 and 10,000 cm 1 (corresponding to wavelengths λ between 1000 and 2500 nm) at a spectral resolution of 0.02 cm 1 (maximum optical path difference, OPD m a x , of 45 cm). This represents a resolution power λ / Δ λ at 5000 cm 1 of about 2.5 × 10 5 [37]. The aperture diameter is limited to 0.5 mm, leading to a narrow spectrometer’s field-of-view (FOV) angle of only 0.07 (considerably lower than the solar diameter of 0.5 ). While taking solar spectra, the FTIR FOV is automatically centred at the solar disc by means of the solar Camtracker system [73]. By evaluating the sun’s image on the FTIR’s entrance field stop acquired by a digital camera, the Camtracker system ensures a precise solar tracking and significantly improves the traditional accuracies (at better than 10 arc seconds), minimizing FTIR mispointing errors. The measurement settings for recording the interferograms were completed using a calcium fluoride (CaF 2 ) beam splitter, an extended Indium–Gallium–Arsenide (InGaAs) photodiode detector operated at room temperature, and no optical filters.
Six scans acquired with a scanner velocity of 20 kHz were co-added in order to increase the signal-to-noise ratio, and thus, the acquisition of one spectrum lasts about 4 min. While scanning, inhomogeneous sky conditions (e.g., due to thin clouds) could affect the interferograms, causing a distortion of the spectrum. To minimize this potential impact, together with the analog filtered detector signal (AC recording), the direct and unfiltered signal is recorded (DC coupling) and, therefore, the raw interferograms support the correction of solar intensity variations [74]. This so-called DC correction also allows unstable interferograms to be identified and, thus, filtered out in the subsequent analysis (which will be used in the quality-control procedure in Section 5.4). Although the DC correction is implemented at IZO, the FTIR solar spectra are mainly recorded when the line of sight between the instrument and the sun is cloud-free. Given the strategic location of IZO, these atmospheric conditions are very frequent and, thus, the IZO FTIR solar measurements are typically taken about three times a week (weather permitting).
Although the FTIR measurements were acquired with a spectral resolution of 0.02 cm 1 , the raw TCCON interferograms were truncated at different spectral resolutions to assess the impact of the spectrum definition on FTIR aerosol products. Consistent results were found, whereby the resolution of 0.5 cm 1 , the typical one of the portable and low-resolution COCCON FTIR instruments, has been selected in this work.
Finally, the raw spectra have been calibrated versus a tungsten-halogen lamp emitting similarly to Planck’s law at around 3300 K. Although the lamp used here is not traceable to primary-international standards, this post-calibration allows solar measurements to be referenced to the FTIR instrumental background and, thus, possible instrumental issues can partially be mitigated.

4. Ancillary Information

4.1. Cimel CE318-AERONET

The Cimel CE318-T radiometer is the reference instrument in AERONET (CE318-AERONET hereafter). A two-axis robot and an automatic pointing allow this instrument to perform two different types of radiometric measurements: direct solar and diffuse sky observations. The automatic pointing in each direct solar observation is refined using a four-quadrant sensor installed in the sensor head. With a FOV of ∼1.3 [17,75], this instrument is able to provide sun and sky-scanning every ∼15 min (or at fixed air mass intervals) at specific wavelengths. Spectral information is extracted by means of two detectors (Silicon and InGaAs) and nine narrow band-pass filters, normally centred at nominal wavelengths of 340, 380, 440, 500, 675, 870, 940, 1020, and 1640 nm. The full-width-at-half-maximum (FWHM) bandwidth ranges from 2 and 4 nm in the UV (for 340 and 380 nm, respectively) to 10 nm in the VIS and NIR (440 to 1020 nm) and 25 nm in the SWIR (1640 nm). CE318-AERONET is also able to measure the atmospheric pressure by means of a barometer integrated in the connector panel.
Multi-spectral direct solar measurements allow information about AOD and its spectral variations to be determined, while multi-angular observations can be used in operational inversion algorithms to retrieve additional information on the aerosols’ microphysical properties [17,31].
CE318-AERONET AOD total uncertainty is expected to range between 0.002–0.009 for reference instruments and 0.01–0.02 for field instruments, with higher errors expected for UV spectral bands. These uncertainties were estimated in [47] for those spectral bands from UV to NIR, and therefore, an specific analysis of the uncertainty associated with the AOD in the SWIR (1640 nm) is still missing.
Level 1.5 version 3 AOD and AE products from the AERONET database has been used in this study. This data selection ensures cloud-screened and quality-controlled AOD data. AOD in the NIR and SWIR (at 870, 1020, and 1640 nm) will be also used to retrieve the AE parameter in the IR and, therefore, to compare these values to those AE extracted from FTIR observations.

4.2. MOPSMAP

The MOPSMAP package has been developed in [16] as a dataset of precalculated optical properties of single aerosol particles to retrieve the full set of optical properties of user-defined aerosol ensembles under a high variety of atmospheric conditions. Different aerosol components can be selected (e.g., mineral nucleation/accumulation/coarse modes or water-soluble) as well as up to 10 aerosol types (e.g., continental clean, urban, or maritime polluted), consisting of a combination of aerosol components.
The main advantage of this package in comparison to the previous OPAC versions is that MOPSMAP uses a user-friendly web interface and a freely available FORTRANcode and includes more aerosol features such as spheroids and a small set of irregularly shaped dust particles. This new model is very efficient in term of computation time and is accessible via an interactive web interface (https://mopsmap.net, last access: 1 July 2020). The MOPSMAP v1.0 database was used in this work.

5. Methodology

5.1. FTIR Micro-Windows Selection

The selection of suitable spectral bands to compute AOD from FTIR solar spectra entails accurate knowledge of atmospheric gas absorption and molecular scattering in the target spectral regions. It is therefore necessary to focus on atmospheric windows with very high solar transmission, avoiding strong, gaseous absorption bands and, thus, minimizing the impact of gaseous signatures on the FTIR AOD retrievals.
For this purpose, measured high-resolution FTIR solar absorption spectra and spectral simulations have been carefully examined. Figure 1 displays an example of a typical FTIR solar spectrum measured at IZO in the 1000–2500 nm spectral range, where the strong water vapour (H 2 O) absorption bands and the atmospheric transparent windows commonly used in remote sensing studies are clearly discernible. The latter are located in the NIR, approximately at 1050 and 1250 nm, and in the SWIR, approximately at 1600 and 2200 nm [76]. In this work, seven narrow micro-windows within these atmospheric windows have been selected for FTIR AOD retrievals at the central wavelengths of 1020.90, 1238.25, 1558.25, 1636.00, 2133.40, 2192.00, and 2314.20 nm (henceforth referred to as B1–B7 bands, Table 1). As illustrated in the sub-plots of Figure 1, very weak absorption lines affect the selected spectral bands, mainly from H 2 O, carbon dioxide (CO 2 ), and methane (CH 4 ), whereby FTIR AOD retrievals are not expected to be significantly impacted by gaseous interferences. This figure also includes the truncated low-resolution FTIR spectrum (at 0.5 cm 1 ) used for AOD calculations. The high consistency between both measurements is remarkable, as is how the degraded FTIR spectrum improves the signal-to-noise ratio at wavelengths close to the lowest InGaAs detector cutoff (specially for the B1 band).
In order to consider the impact on the selected spectral micro-windows of the most important interfering species in the IR region, H 2 O, the solar absorption in these bands have been simulated for different atmospheric precipitable water vapor (PWV) contents at IZO using the line-by-line radiative transfer model PROFFWD [35]. This model has been developed at KIT, coupled to the inverse software PROFFIT (PROFile FIT, [35]), and is widely used to retrieve atmospheric trace gas concentrations from FTIR solar spectra (e.g., [35,36,37,40]). Only the humidity vertical profiles have been varied among simulations for the example measurement of Figure 1, considering the actual column integrated PWV value of 2.5 mm retrieved from TCCON records and two high PWV values, 15 mm and 25 mm, which could be typical values at higher latitudes. It should be noted that these two high PWV amounts are extreme values at IZO given the predominantly dry atmospheric conditions of the observatory. Considering the TCCON FTIR PWV time series in the 2007–2019 period, the annual average of PWV is only 4.8 mm (standard deviation, σ , of 2.8 mm), with maximum PWV amounts reached in summer (mean and σ of 7.1 and 3.3 mm, respectively) [77]. All remaining inputs for the simulations have been kept identical. The vertical profiles of atmospheric gaseous concentrations are taken from the TCCON database, which are daily generated at each TCCON site by a set of empirical functions that are optimized to fit different input observations (in situ measurements from balloon-borne platforms, aircraft, and space-based data) [39]. The daily meteorological data come from the National Center for Environmental Protection and National Center for Atmospheric Research (NCEP/NCAR). The effect of aerosols and clouds have not been taken into account in the simulations.
The average atmospheric transmittance in the seven selected bands for the different simulations as well as the intra-band coefficient of variation (CV), calculated as the standard deviation of transmittance values divided by the mean transmittance of each band, are presented in Table 1. The latter could be a good indicator for the transmittance variations due to instrumental issues (e.g., noise) or gaseous absorptions within each micro-window. As summarized in Table 1, atmospheric transmittances above 0.99 are overall estimated for all the bands under different PWV conditions. Only the B2–B3 bands seem to be slightly sensitive to the PWV amount, varying by ∼0.50% (B2) and 0.05% (B3) between the PWV contents of 2.5 and 15 mm (the typical maximum IZO records). The extreme PWV content of 25 mm considered leads to a variation of the mean transmittance by 1.0% in B2 and of only ∼0.20% in B3. For the remaining bands, the variations are expected to be lower than 0.07%. Therefore, the proposed FTIR micro-windows might be well-suitable for AOD estimation under a wide range of humidity conditions, although the impact of H 2 O should be further analyzed under very wet conditions, especially on the B2 micro-window.
The analysis of the stability of solar transmittance in the proposed micro-windows for all available FTIR solar measurements in the study period (May 2019–May 2020) corroborates the suitability of the selected bands. As also presented in Table 1, the mean and scatter of the intra-band transmittance CV values for the 1-year period are overall consistent among the different bands and with the simulations for the different PWV regimes. The higher variability observed for the whole data set is in part introduced by the range of optical air masses spanning the measured FTIR spectra. This is especially important at higher optical air masses, which change quickly with time as compared to lower air masses and, hence, are more affected by intensity variations while acquiring the FTIR solar spectra.
Two of the seven FTIR selected spectral bands are near-coincident with the CE318-AERONET channels (highlighted in bold in Table 1) and with those in the space-based sensor OLI (1609 and 2200 nm), VIIRS (1240, 1378, 1610, and 2257 nm), or MODIS (1240, 1630, and 2130 nm). Therefore, this new FTIR AOD database offers us a valuable tool to perform cross-validations with standard AOD products, such as AERONET or space-based platforms.

5.2. FTIR Absolute Calibration and AOD Calculation

For many years, solar transmittance methods have been considered a conceptually simple and inexpensive technique to study aerosol columnar concentration from direct or reflected sunlight measurements at narrow spectral bands [78,79]. The Beer–Lambert–Bouguer attenuation law can be applied to these bands, considering that solar irradiance is observed over a small bandwidth ( δ λ ) and, therefore, solar irradiance can be considered as practically monochromatic. This well-known attenuation law is the basis for the retrieval of τ a , λ (or A O D λ ) from direct solar measurements and can be written in a simplified form as follows:
V λ = V 0 , λ · d 2 · e x p m · τ λ
In this equation, V λ represents the direct sun measurement at the spectral band characterized by the nominal wavelength λ (voltage or physical units if the instrument is absolutely calibrated), V 0 , λ is the extraterrestrial signal of the instrument, d is the Earth–Sun distance in astronomical units, τ λ is the total optical depth calculated in the spectral band characterized by the nominal wavelength λ , and m is the optical air mass in the atmospheric path. In Equation (1), several attenuators contribute to the terms τ λ and m, such as aerosols, Rayleigh scattering by molecules, or gaseous absorption. This equation can be expressed in the following logarithmic form:
l n ( V λ · d 2 ) = l n ( V 0 , λ ) m R · τ R , λ m g · τ g , λ m a · τ a , λ
where τ R , λ , τ g , λ , and τ a , λ represent the contribution to the spectral extinction optical depth by molecules, gases, and aerosols, respectively, while m R , m g , and m a are their corresponding air masses. Following the AERONET procedure [17,31], m R , m g , and m a can be obtained by means of the equation presented in [80]. τ g , λ in Equation (2) can be considered negligible since gaseous absorption has been largely minimized within the seven FTIR micro-windows. τ R , λ is calculated following [81] using the nearest in time atmospheric pressure measured by the CE318-AERONET.
Following Equation (2), V 0 , λ can be determined by means of the Langley–Plot technique [82,83], considering a series of solar direct measurements taking over a range of air masses m’s, during which the optical depth is preferably stable and low. A detailed description on the AOD and the Langley–Plot calculation from sun photometric measurement can be found in [17,58,84,85]. In this work, we have followed the criteria defined by [58] to perform the Langley calibration in terms of aerosol loading ( τ a , 500 or A O D 500 below 0.025), standard deviation of the fitting analysis ( σ f i t below 0.006), and number of valid points >33%. Air masses between 2 and 5 have been selected for this analysis.
When comparing two instruments with very different spectral resolutions, it is important to take the limited sensitivity to fine absorption signatures of the low-resolution instrument into account. For this purpose, the FTIR AOD has been also derived by convolving the FTIR solar absorption spectra with the CE318-AERONET’s response function of the two channels coincident with FTIR spectral bands, centred at 1020 and 1640 nm. As illustrated in Figure 2, both FTIR B1 and B4 match well with the high transmission region of the CE318-AERONET channels. This coincidence allows us, on one hand, to analyze the effect of the FTIR high-spectral resolution degradation on the AOD estimates and, on the other hand, to ensure a fair AOD comparability between FTIR and AERONET.
To estimate this degraded FTIR AOD product, given the broad bandwidth of the CE318-AERONET channels, consistent gaseous absorption has been introduced in Equation (2). The τ g , λ term has been extracted from the AERONET procedure [31,86], where gaseous absorption depends on PWV content at the 1020-nm spectral band and on PWV, CO 2 , and CH 4 content at 1640 nm:
τ g , 1020 = τ P W V , 1020 = 0.0023 · P W V + 0.0002
τ g , 1640 = τ C O 2 , 1640 + τ C H 4 , 1640 + τ P W V , 1640 = 0.0087 · P P 0 + 0.0047 · P P 0 + ( 0.0014 · P W V 0.0003 )
where P and P 0 in Equation (4) refer to the atmospheric pressure at the station and at sea level, respectively.

5.3. FTIR Ångström Exponent (AE) Calculation

The AE is also an important parameter in climate studies which provides useful information about the aerosol size distribution [47,48,87,88,89,90]. The definition of the AE presupposes that the Junge power law [91] is valid over the whole aerosol size distribution and, therefore, the AOD spectral dependence can be expressed through the so-called Ångström formula:
τ a , λ = β · λ A E
where AE is the Ångström exponent and β is the turbidity factor.
This power law adopted by Junge is useful to describe the dynamic of aerosols because of the asymptotic distributions associated with the accumulation and coarse subranges [92,93].
In practice, AE depends on the spectral range used in its calculation and on the predominant mode of the aerosol size distribution. In this regard, it is important to highlight that the spectral curvature of the aerosol extinction is reduced for larger particles, such as mineral dust, which are characterized by spectrally flat extinctions.
The evaluation of the Ångström power law is useful to obtain the AE values by themselves and as a tool for assessment of the spectral consistency of FTIR AOD retrievals. In this work, the FTIR AE values have been computed by means of Equation (5) considering the spectral AODs in the seven micro-windows covering the 1020–2314 nm spectral range.

5.4. FTIR Cloud Mask and Quality-Control Procedure

A cloud mask and a quality-control procedure have been developed to remove cloud-contaminated data and/or instrumental issues from the FTIR dataset. It is composed of three different flags:
  • Cloud mask: 1-min measurements of co-located global and diffuse short-wave downward radiation (SDR) have been used to screen clouds following [94]. This cloud-screening method is based on the approach suggested by [95], with four individual tests applied to the normalized global and maximum diffuse SDRs in addition to the temporal change in global SDR and the normalized diffuse variability in SDR.
  • Quality-control: it basically analyzes the quality of the FTIR interferograms and the Langley absolute calibration.
    (a)
    DC-Quality Parameter: the implemented DC correction on the raw FTIR interferograms allows a DC-quality parameter to be defined for identifying and filtering out unstable interferograms. This parameter accounts for intensity variations of the recorded DC signal. A maximum variability of 0.10 has been set (i.e., 10% intensity variation in the co-added interferogram), which ensures high-quality FTIR spectra.
    (b)
    Flag for non-valid Langleys: This empirical flag has been included to account for those important changes in V 0 which can affect the instrument’s calibration in nearby days. This is the case of 26 February 2020, after a severe dust outbreak, and 4 April 2020, after the FTIR’s external mirrors were cleaned.

5.5. Limitations in FTIR AOD Retrievals

The quality and consistency of FTIR AOD retrievals strongly rely on a precise absolute calibration of FTIR solar absorption spectra. Given the strategic location of IZO, this absolute calibration has been successfully carried out in this work using the Langley technique. However, the application of the Langley method with accuracy enough for spectrometer absolute calibration requires special atmospheric conditions (i.e., pristine skies, high atmospheric stability, and rather low atmospheric humidity) [58], which are especially achieved at high-mountain sites (such as IZO) but difficult to be satisfied at lower altitudes. Nonetheless, this technique might be also applied at high-latitude stations [96,97], considering the low aerosol content in the pristine polar environment [98]. Furthermore, as [99] have found, if a sufficiently large number of cloud-free mornings or afternoons is available, a reliable calibration by using the Langley method can be achieved even at sea-level sites that are characterized by large aerosol variability. As a consequence, the main limitation to the applicability of the FTIR aerosol retrieval presented in this paper in a routine way at other FTIR stations is the need for absolute calibration.
Tentative approaches have been developed in the literature to address the absolute calibration of field instruments with procedures different than the classical Langley technique. One possibility might be to aggregate many Langley extrapolation estimates from short time segments (e.g., [45]) or to implement the improved In-situ Langley Plot technique (ILP) [100]. The ILP is used to calibrate monthly on-site the sun-photometers operating in SKYNET network and does not require exigent atmospheric conditions as in the traditional Langley method. However, ILP needs direct observations to be acquired almost simultaneously with additional solar diffuse radiance measurements. Alternative calibration attempts should involve the use of radiatively calibrated and tuneable lasers, such that the spectral response of the spectrometer being measured quickly, efficiently, and directly on site on specific spectral ranges [76]. Another possibility is to use high-intensity calibration sources and robust calibration transfers, as already implemented during sporadic field campaigns [76,101,102]. By using this approach, [101] found that high-resolution absolute solar irradiance in the IR region (2000–10,000 cm 1 ) on the ground could be achieved with a wavenumber-dependent uncertainty of between 3.3% and 5.9%. These values encompass uncertainties arising from the calibration procedure (including the transfer source), solar source and atmospheric path itself, FTIR’s external optics, and uncertainties from the FTIR spectrometer itself (optical alignment or detector). This work strongly points out the importance of the effect of ageing on the reflectance of all external mirrors of the FTIR system after use in the field.
The FTIR spectrometer at IZO is placed inside an air-conditioned scientific container, while the solar tracker is mounted outside on the container’s roof and covered by a dome. It is composed of two aluminium-coated optical mirrors that can be rotated around an azimuth and an elevation axis for properly tracking the sun. When measuring, these two optical mirrors are completely exposed to the environmental conditions. In a harsh environment, such as IZO, the whole system—and especially the solar tracker mirrors—can be degraded or damaged by this exposure [103]. This degradation could lead to a gradual signal loss, affecting the absolute photometric stability of the FTIR system required for aerosol retrievals, and therefore, it should be carefully monitored over time.
Nonetheless, it should be highlighted that the absolute calibration of FTIR is only necessary for detecting atmospheric constituents with broadband signatures (e.g., atmospheric aerosols or water continuum) for measuring lunar absorption spectra or atmospheric emissions [38]. For standard trace gas retrievals, an absolute calibration is dispensable, since high-resolution solar absorption spectra are self-calibrating in the sense that the absorption signature is referenced to the surrounding continuum [38]. This is a relevant advantage of ground-based FTIR systems for atmospheric trace gas monitoring provided that the instrument is optically well-aligned and well-characterized. At IZO, the Bruker IFS 120/5HR performance and stability, characterized by the instrumental line shape (ILS), is determined on a regular basis by low-pressure gas cell measurements [104], which ensures high-quality solar measurements. Note that, nonetheless, at 0.5 cm 1 spectral resolution, the ILS of a typical IFS 125HR spectrometer is expected to be nearly nominal [72]. Therefore, the impact of possible internal optical misalignments on the measured solar spectra (especially in the broadband signatures) may be unappreciated.
Even using DC-corrected interferograms, intensity variations during the course of the FTIR scans may lead to errors in the Langley calibration coefficient and AOD retrievals. In order to mitigate this impact, it would be desirable that the total scan time should not exceed 5 min (see [102], and the references therein). As aforementioned, with the measurement settings used in this work, the acquisition of an individual FTIR spectrum lasts about 4 min. However, the FTIR system is quite flexible and the spectral resolution and number of co-added interferogram scans can be easily adapted. For example, considering the measurement configuration routinely used in the low-resolution and portable COCCON instruments (0.5 cm 1 and 10 scans), an individual measurement is taken in approximately 1 min with a good enough signal-to-noise ratio [72].

6. Results

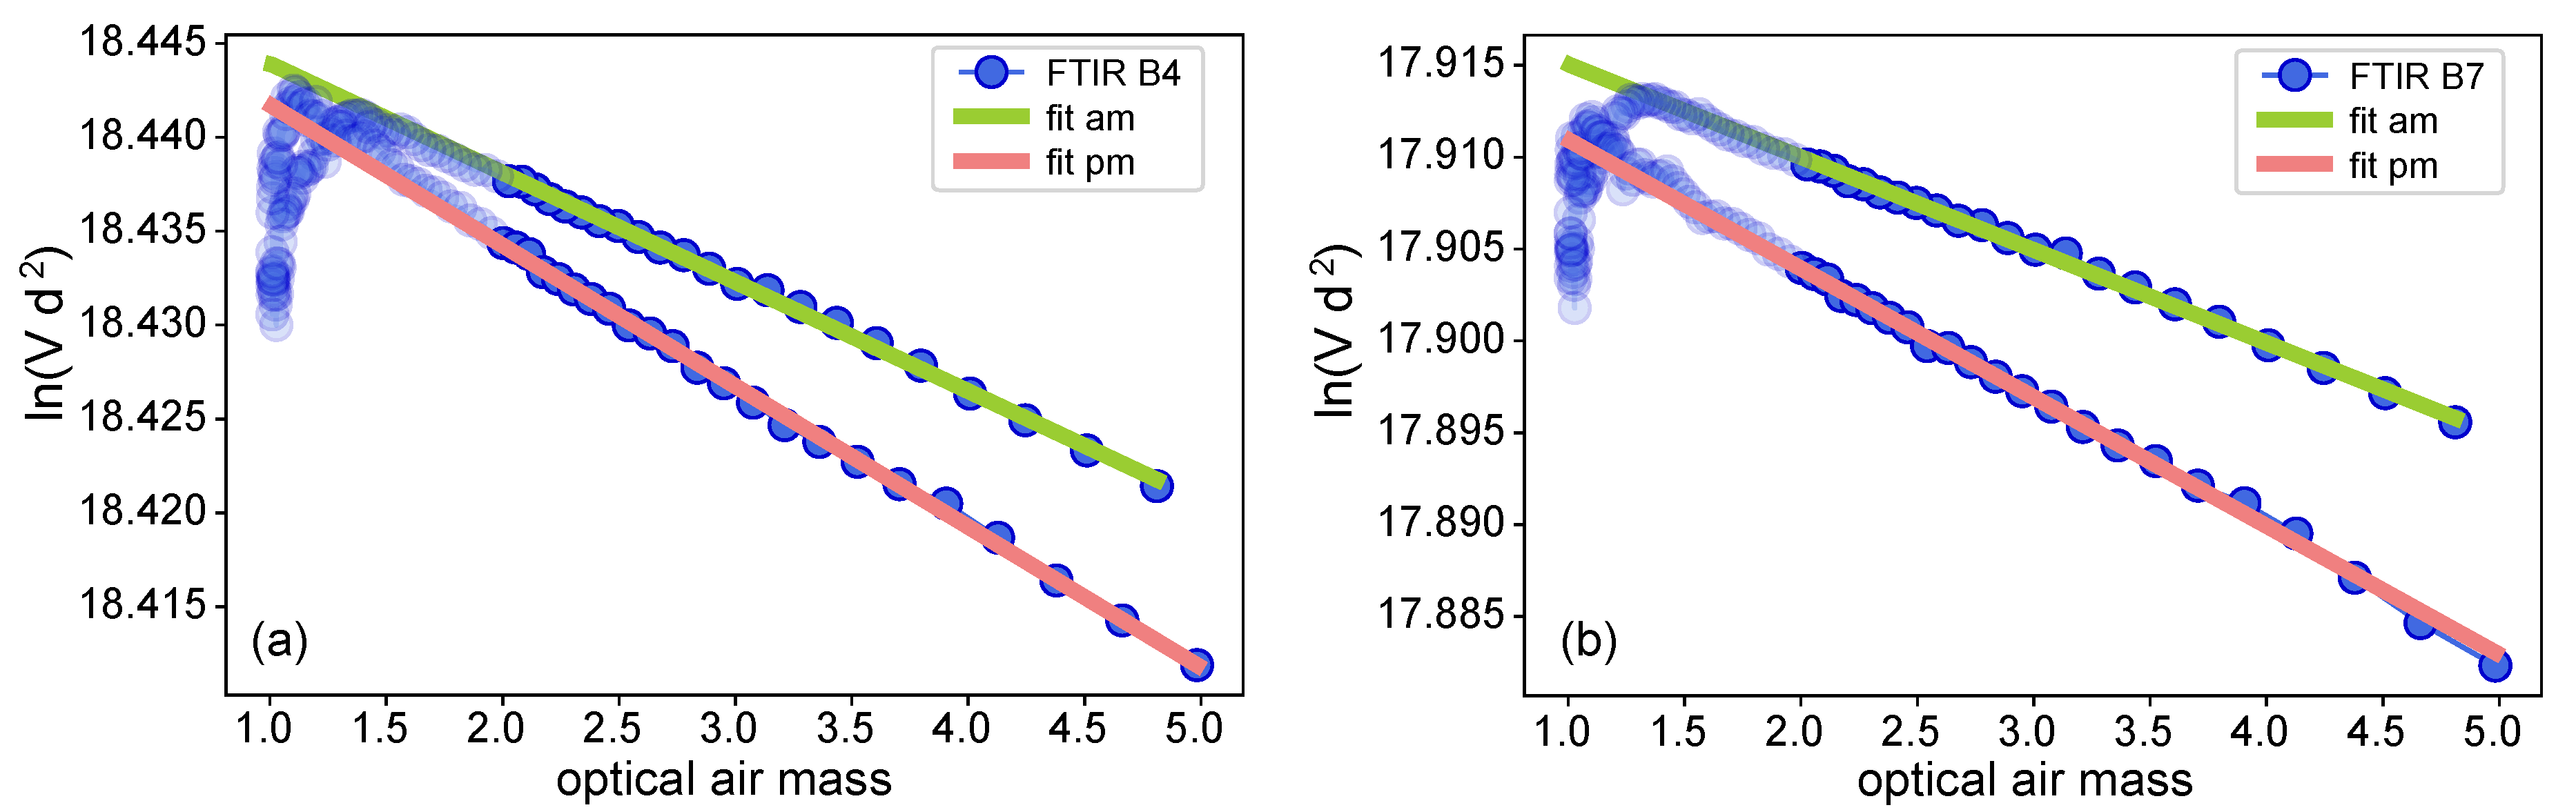
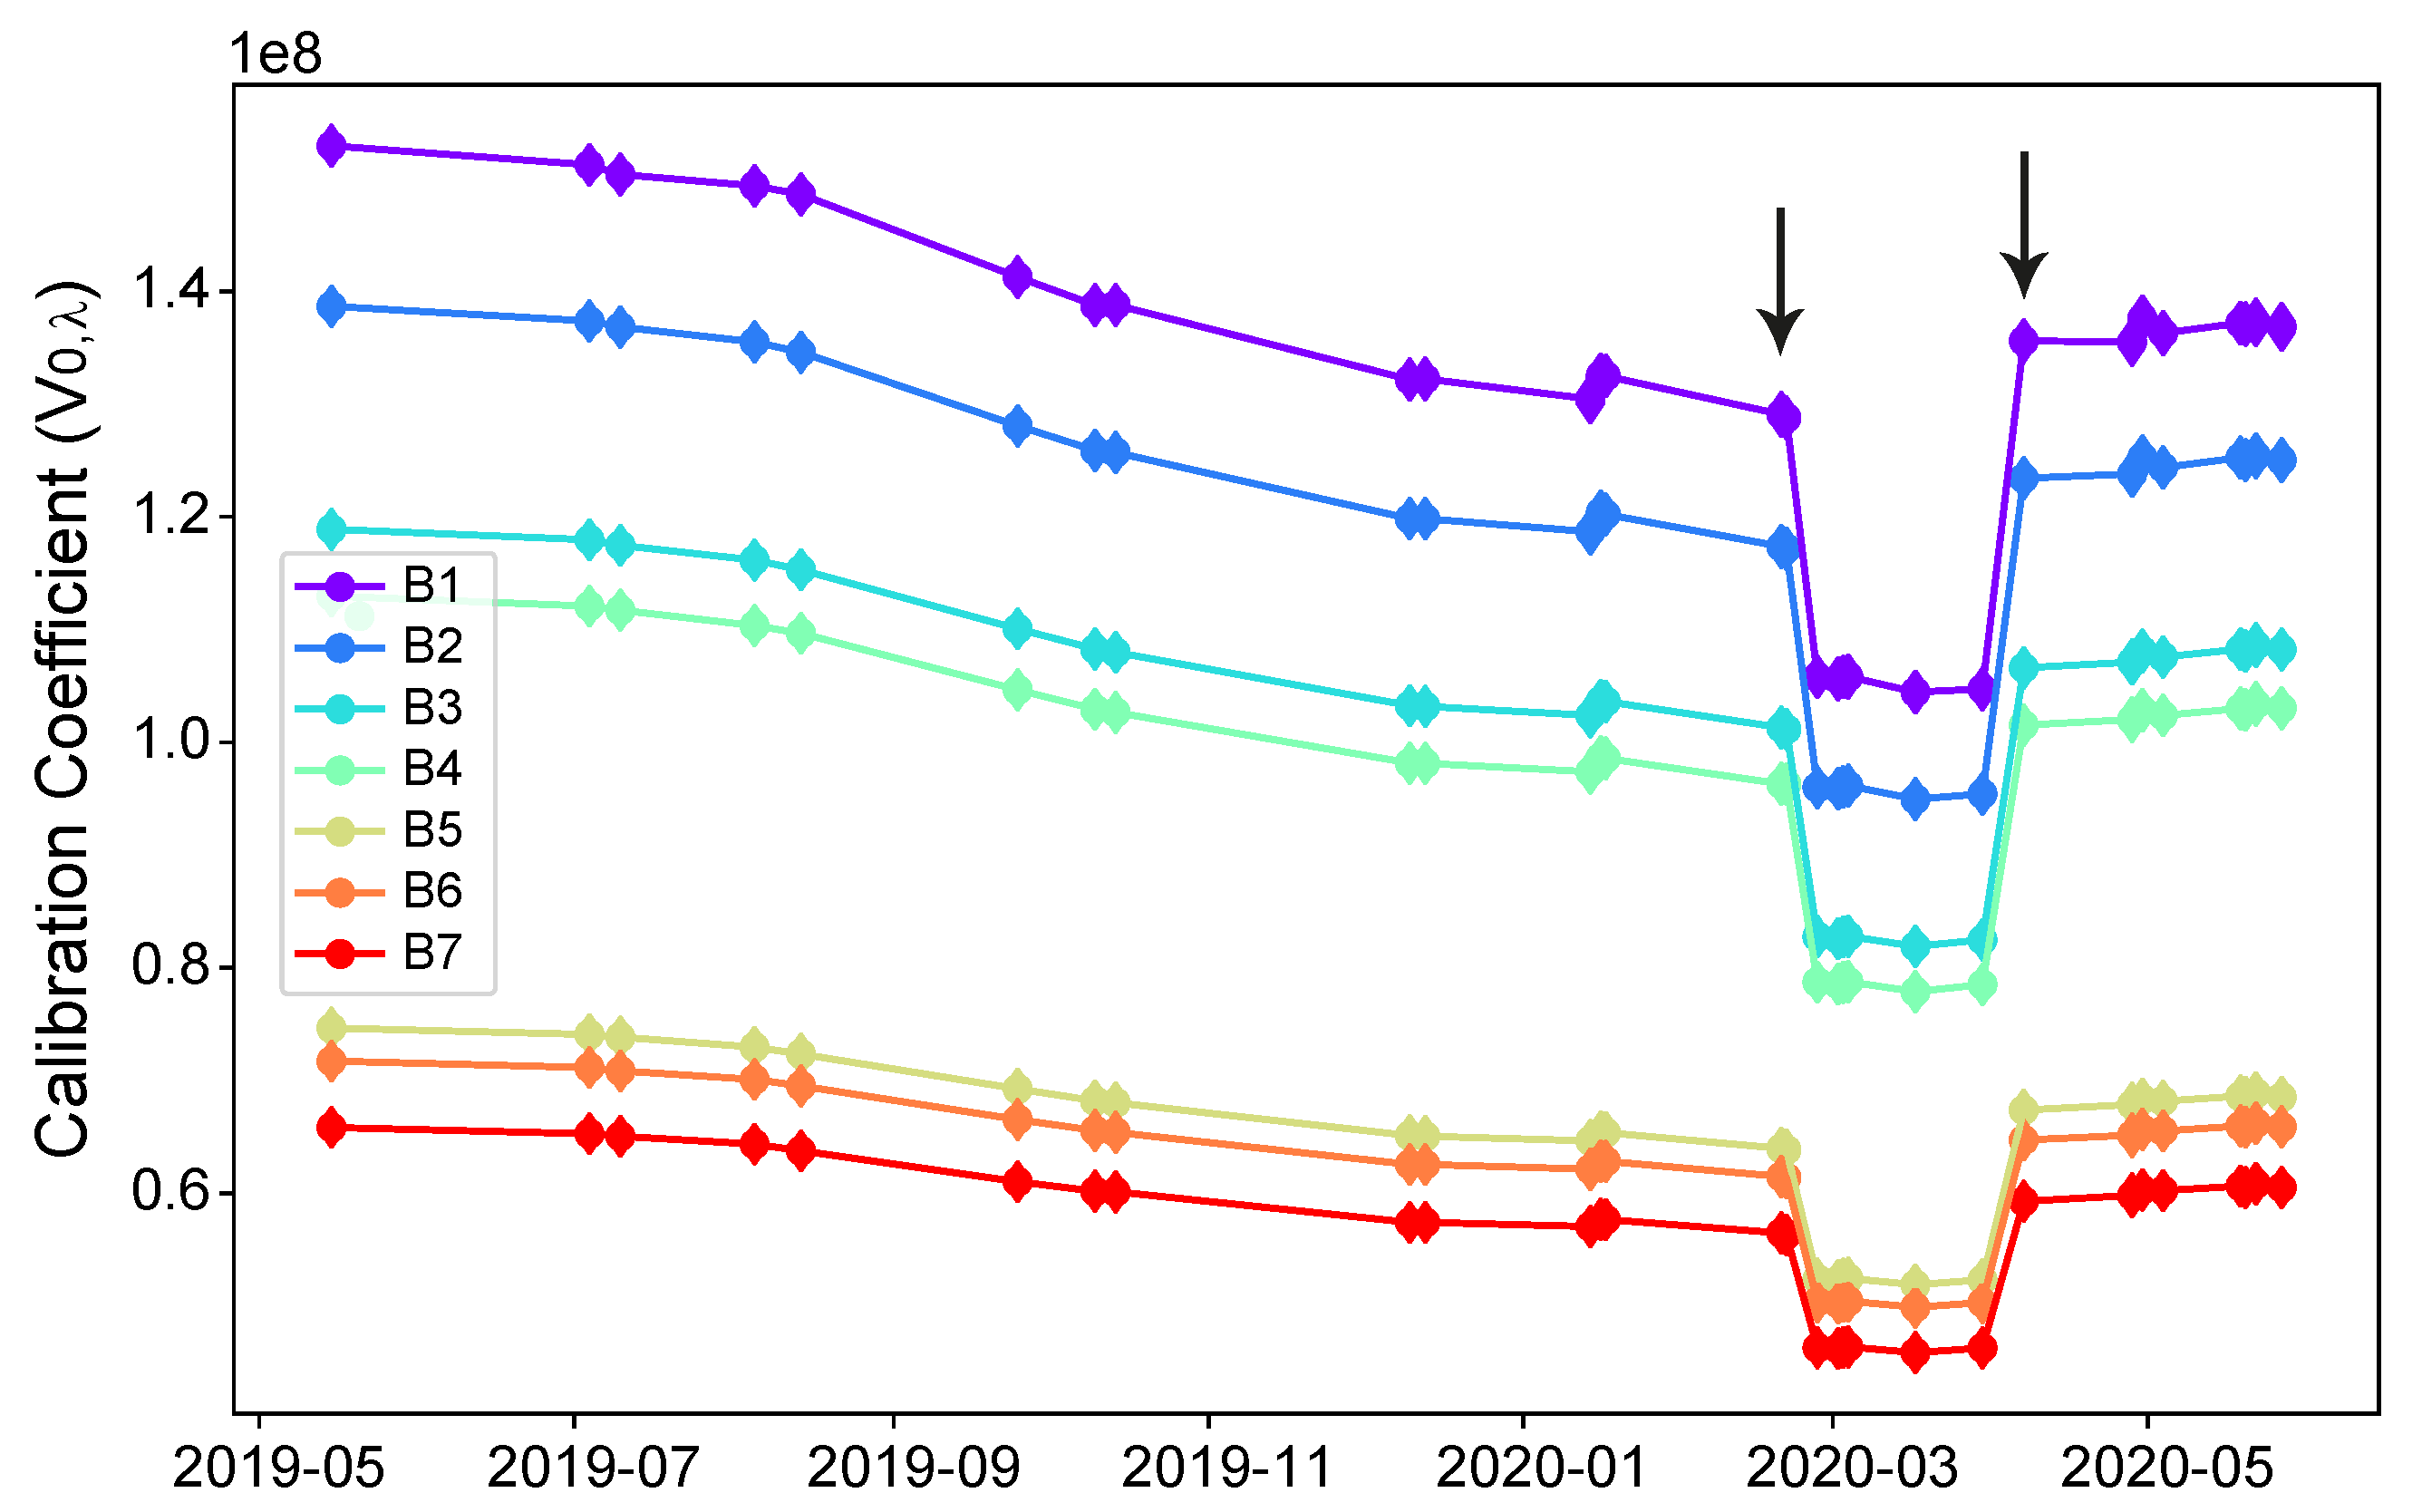
6.1. FTIR Absolute Calibration

The Langley analysis is useful not only to compute the AOD values but also to evaluate the photometric stability of the FTIR system. This method assumes that the atmospheric conditions remain constant during the measurement period, whereby any change (cloud coverage or variability in atmospheric parameters) may lead to errors in the derived calibration constant V 0 , λ . In this work, the Langley days have been selected following the criteria established by [58], as aforementioned, and by examining the fit quality. A total of 29 high-quality Langley–Plots have been obtained at the seven FTIR spectral bands between May 2019 and May 2020, with similar and high coefficients of correlation (R) (between 0.97 and 1.00) and standard deviations of the fitting analysis reaching the Toledano’s criterion ( σ f i t below 0.006). Additionally, the standard deviations of V 0 , λ at air mass 0 have been used to quantify the statistical error on the derived V 0 , λ [102]. These values range from 0.10% (B1) to 0.04% (B5). No significant differences in the quality-fit parameters were found among the different spectral bands, except for B1. This band showed slightly poorer statistics likely due to the higher noise of the FTIR solar spectra close to the detector cutoff (recall Figure 1).
An example of the Langley–Plot performed on May 19, 2020 on two of the seven FTIR spectral bands (B4 and B7) is displayed in Figure 3, while the main statistics of this fitting analysis are presented in Table 2 for all the FTIR bands. Very high R are obtained in both analyses, morning and afternoon, above 0.99, and very low dispersion of the fit ( σ f i t ). Note that the high scatter of measurements for air masses below 2 (not considered in the calibration analysis) is attributed to an increase of atmospheric turbidity due to typical convection processes in the planetary boundary layer around solar noon. Two different branches around solar noon have been consistently observed in the Langley–Plot analysis for all FTIR bands, with an associated change in V 0 , λ between morning and afternoon ranging from −0.24% (B1) to 0.18% (B7). However, no significant differences V 0 , λ are observed in the B2, B3, and B4 bands. The presence of V 0 , λ differences between morning and afternoon could be influenced by several factors, including a subtle misalignment of solar tracker with respect to the FTIR spectrometer, intensity variations of solar beam entering into the spectrometer (due to an uneven abrasion/tarnishing of the external mirrors), or polarization effects, but further investigations are required to clarify these differences. Taking these V 0 , λ differences into account, only Langley–Plots performed in the morning have been used in this work in order to avoid a possible bias in FTIR calibration.
The time series of the calibration coefficient V 0 , λ is presented in Figure 4. The continuous drift in the FTIR calibration is evident from this figure, pointing out the lack of photometric stability of the system. This is caused by the temporal degradation in the instrumental response because of the surface degradation or dirtiness on the FTIR solar tracker’s optical mirrors (dust deposition). The impact of mirror degradation on V 0 , λ depends on frequency (i.e., affects the mirrors’ frequency response), leading to stronger signal loss for shorter wavelengths over time. Given the optical properties of dust, the deposited particles reduce more efficiently the mirror’s response at NIR than at SWIR [103]. The degradation linearly drops at a rate of about 1.61%month 1 (B7) and 1.75%month 1 (B1), reaching a total decrease of 14.5% (B7) and 15.8% (B1) from May 2019 to February 2020 when a change-point affecting the FTIR calibration is clearly appreciable in Figure 4 (marked with an arrow). This event was due to an extraordinary dust storm affecting the observatory between 21 and 27 February 2020. The deposition of mineral dust on the FTIR solar tracker’s external mirrors during this important outbreak implied a reduction of V 0 , λ between 17.7% (B7) and 18.2% (B4). After this date, the external mirror was cleaned at the beginning of April, with a subsequent increase in V 0 , λ between the calibration performed in 30 March and 7 April 2020. This increase in V 0 , λ ranged between 28.1% (B7) and 29.5% (B1). Error bars in this figure add information about the standard deviation of V 0 , λ , with very low values in the seven spectral bands (3 orders of magnitude lower than V 0 , λ ), from 2.8 × 10 4 W/cm 2 sterad cm 1 in B7 to 1.3 × 10 5 W/cm 2 sterad cm 1 in B1. These very low values make the error bars in Figure 4 imperceptible.
The consequence of the previous results is the preferred calibration during the morning and the necessity to properly address the temporal evolution of the FTIR absolute calibration constant (due to continuous degradation and punctual change-points). In this regard, the V 0 , λ evolution presented in Figure 4, extracted by means of a smoothing spline fit, has been adopted for AOD calculation.

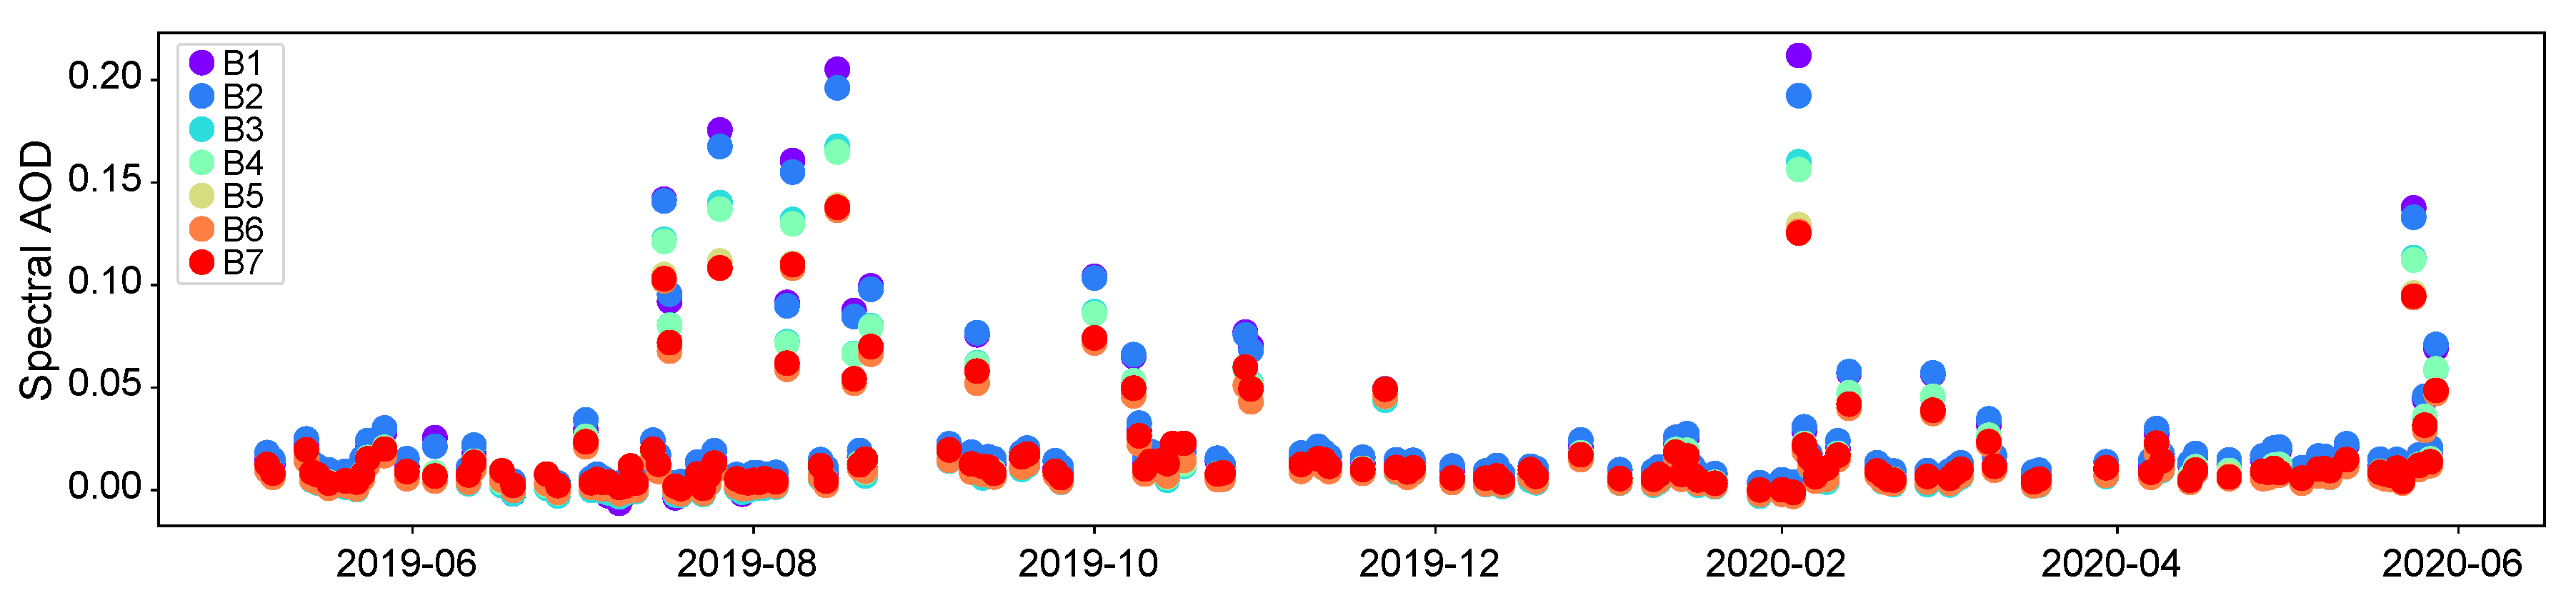
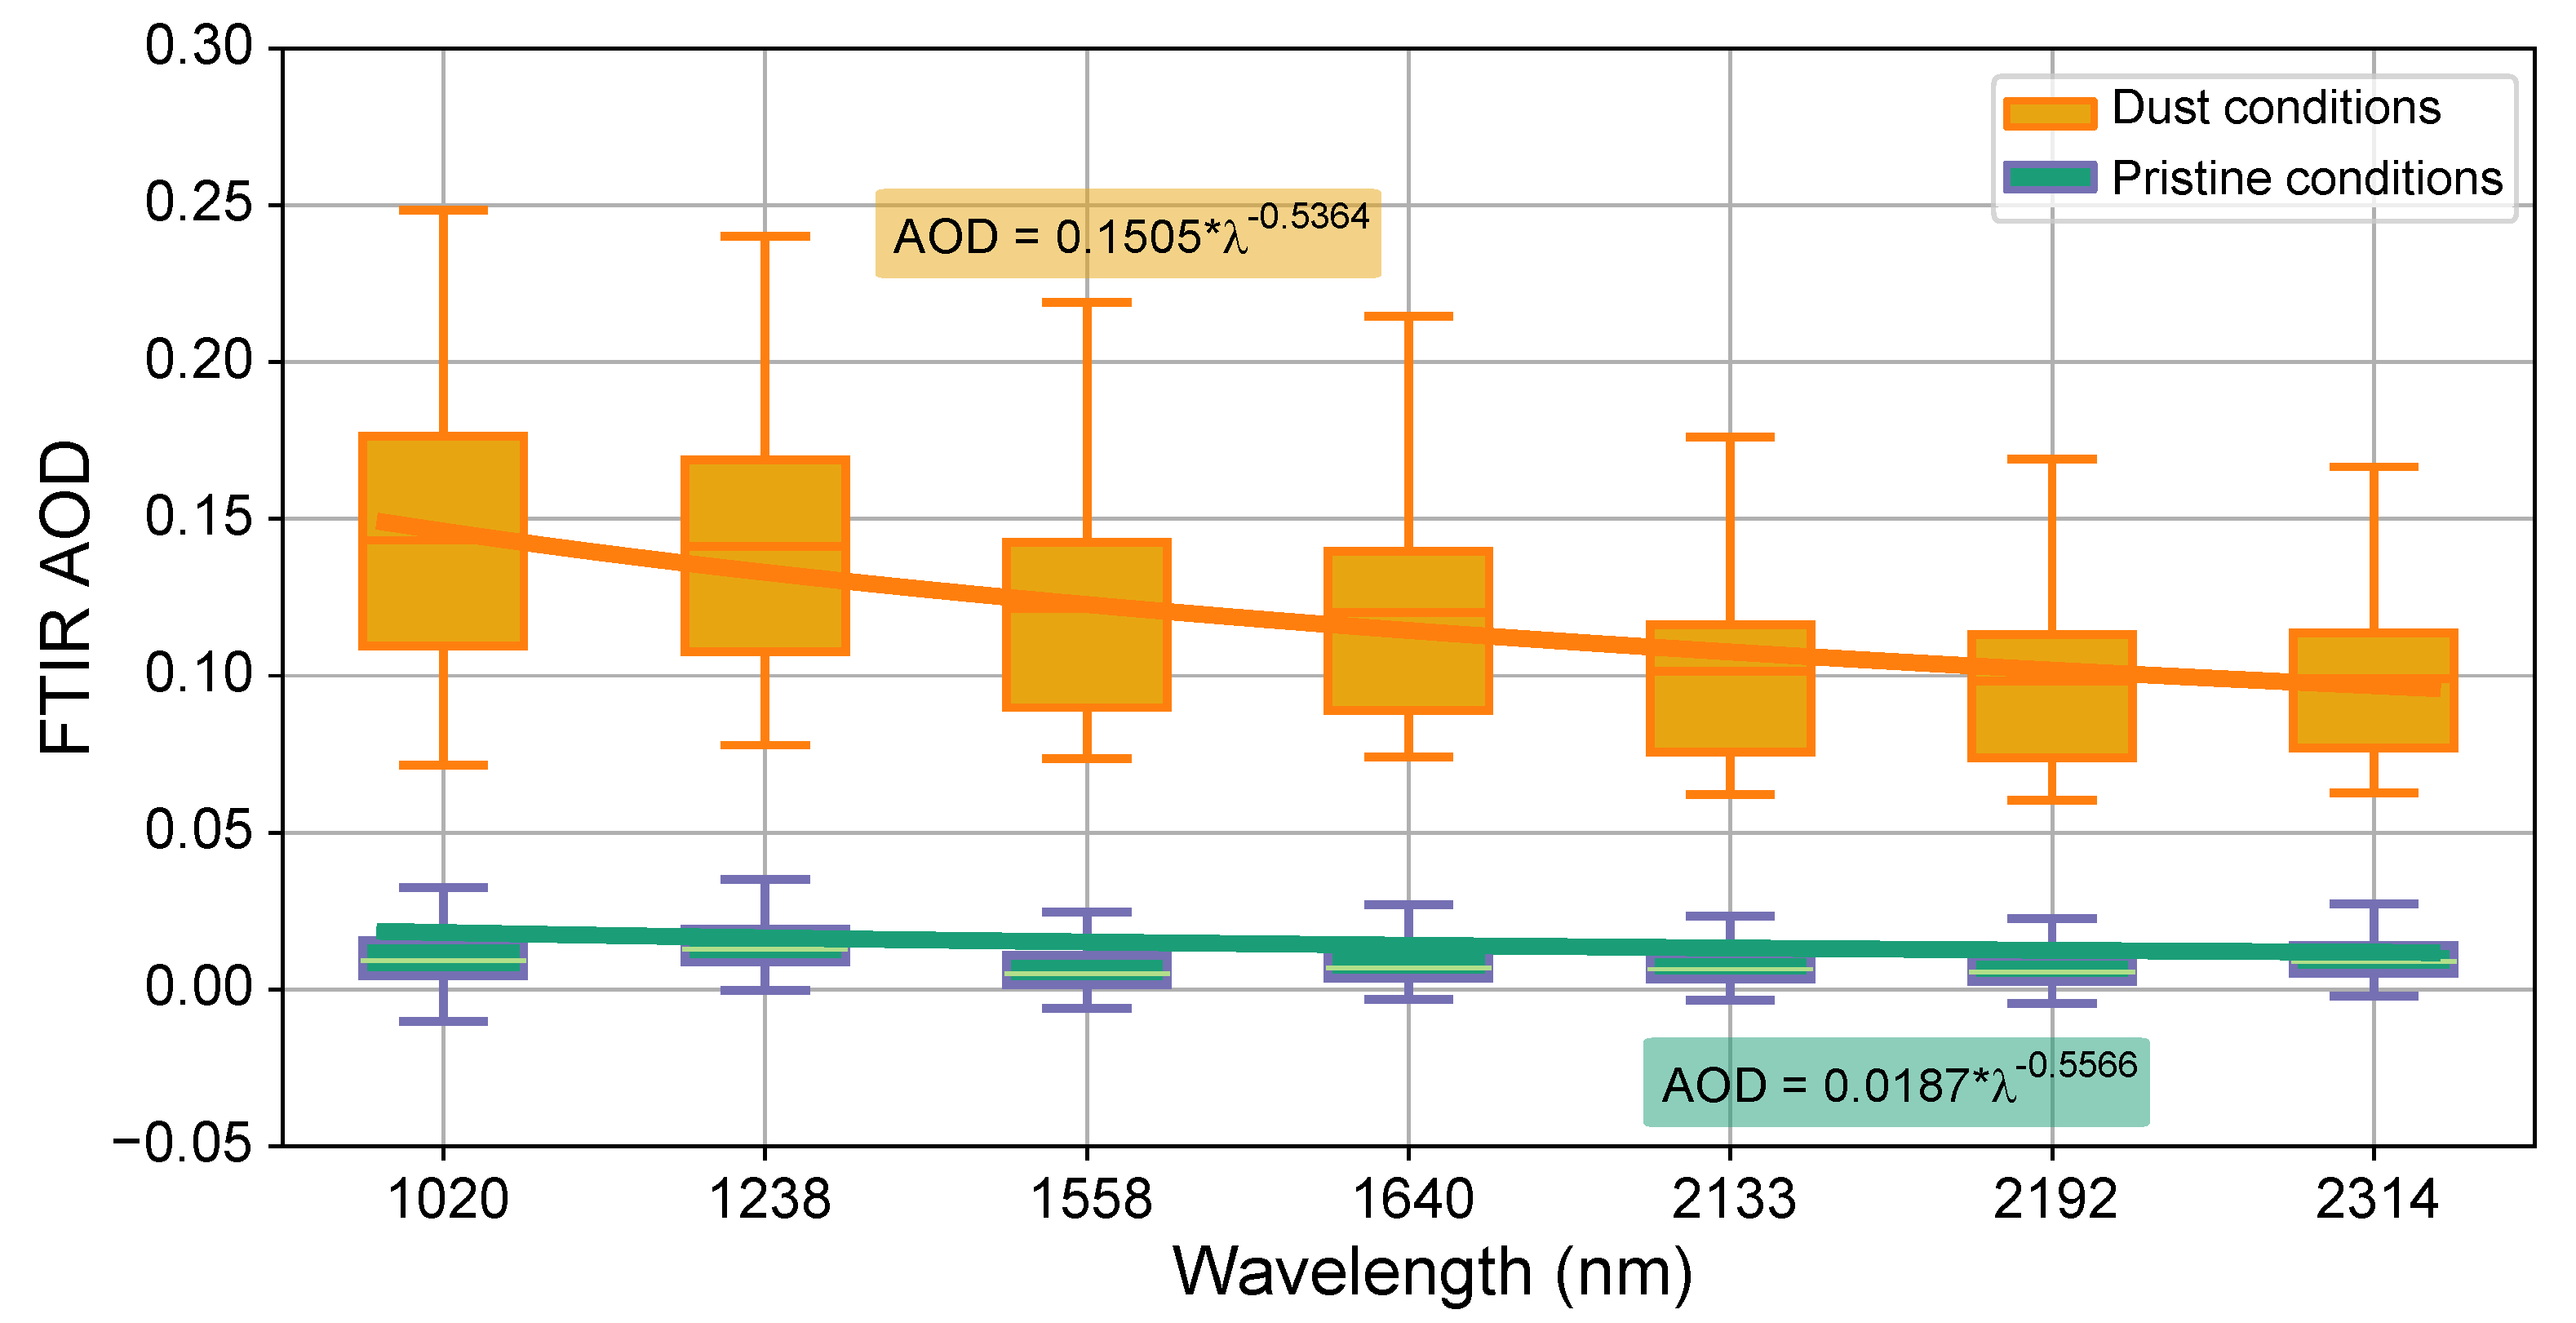
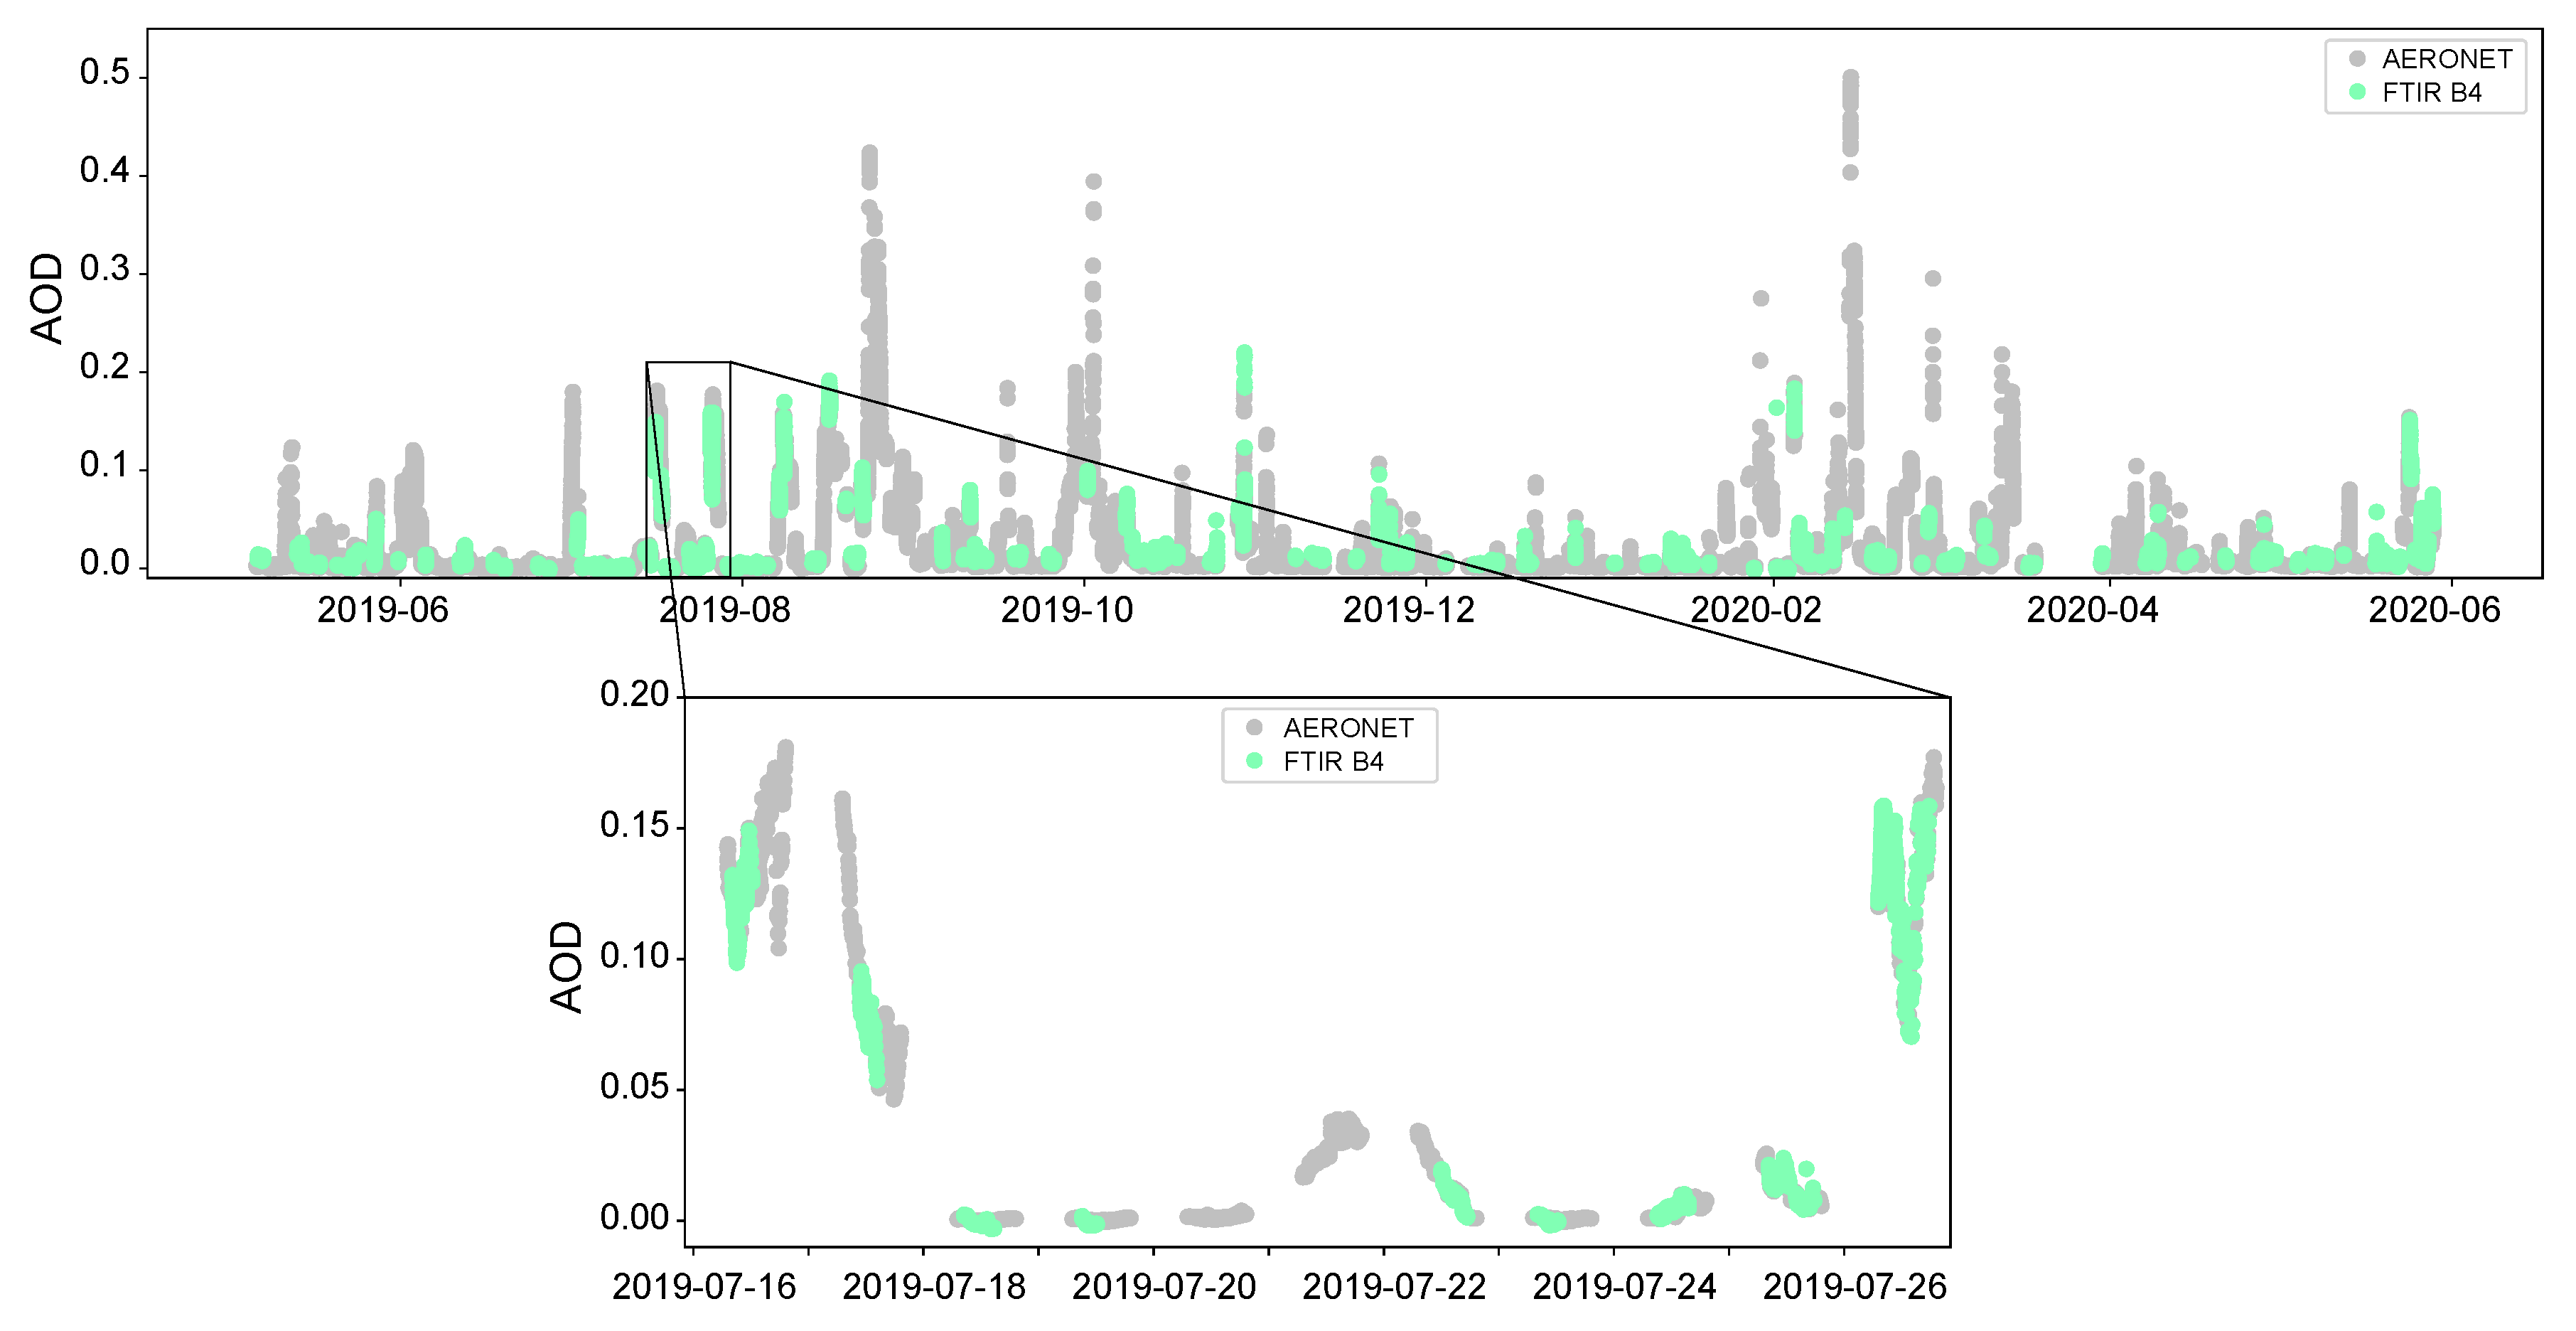
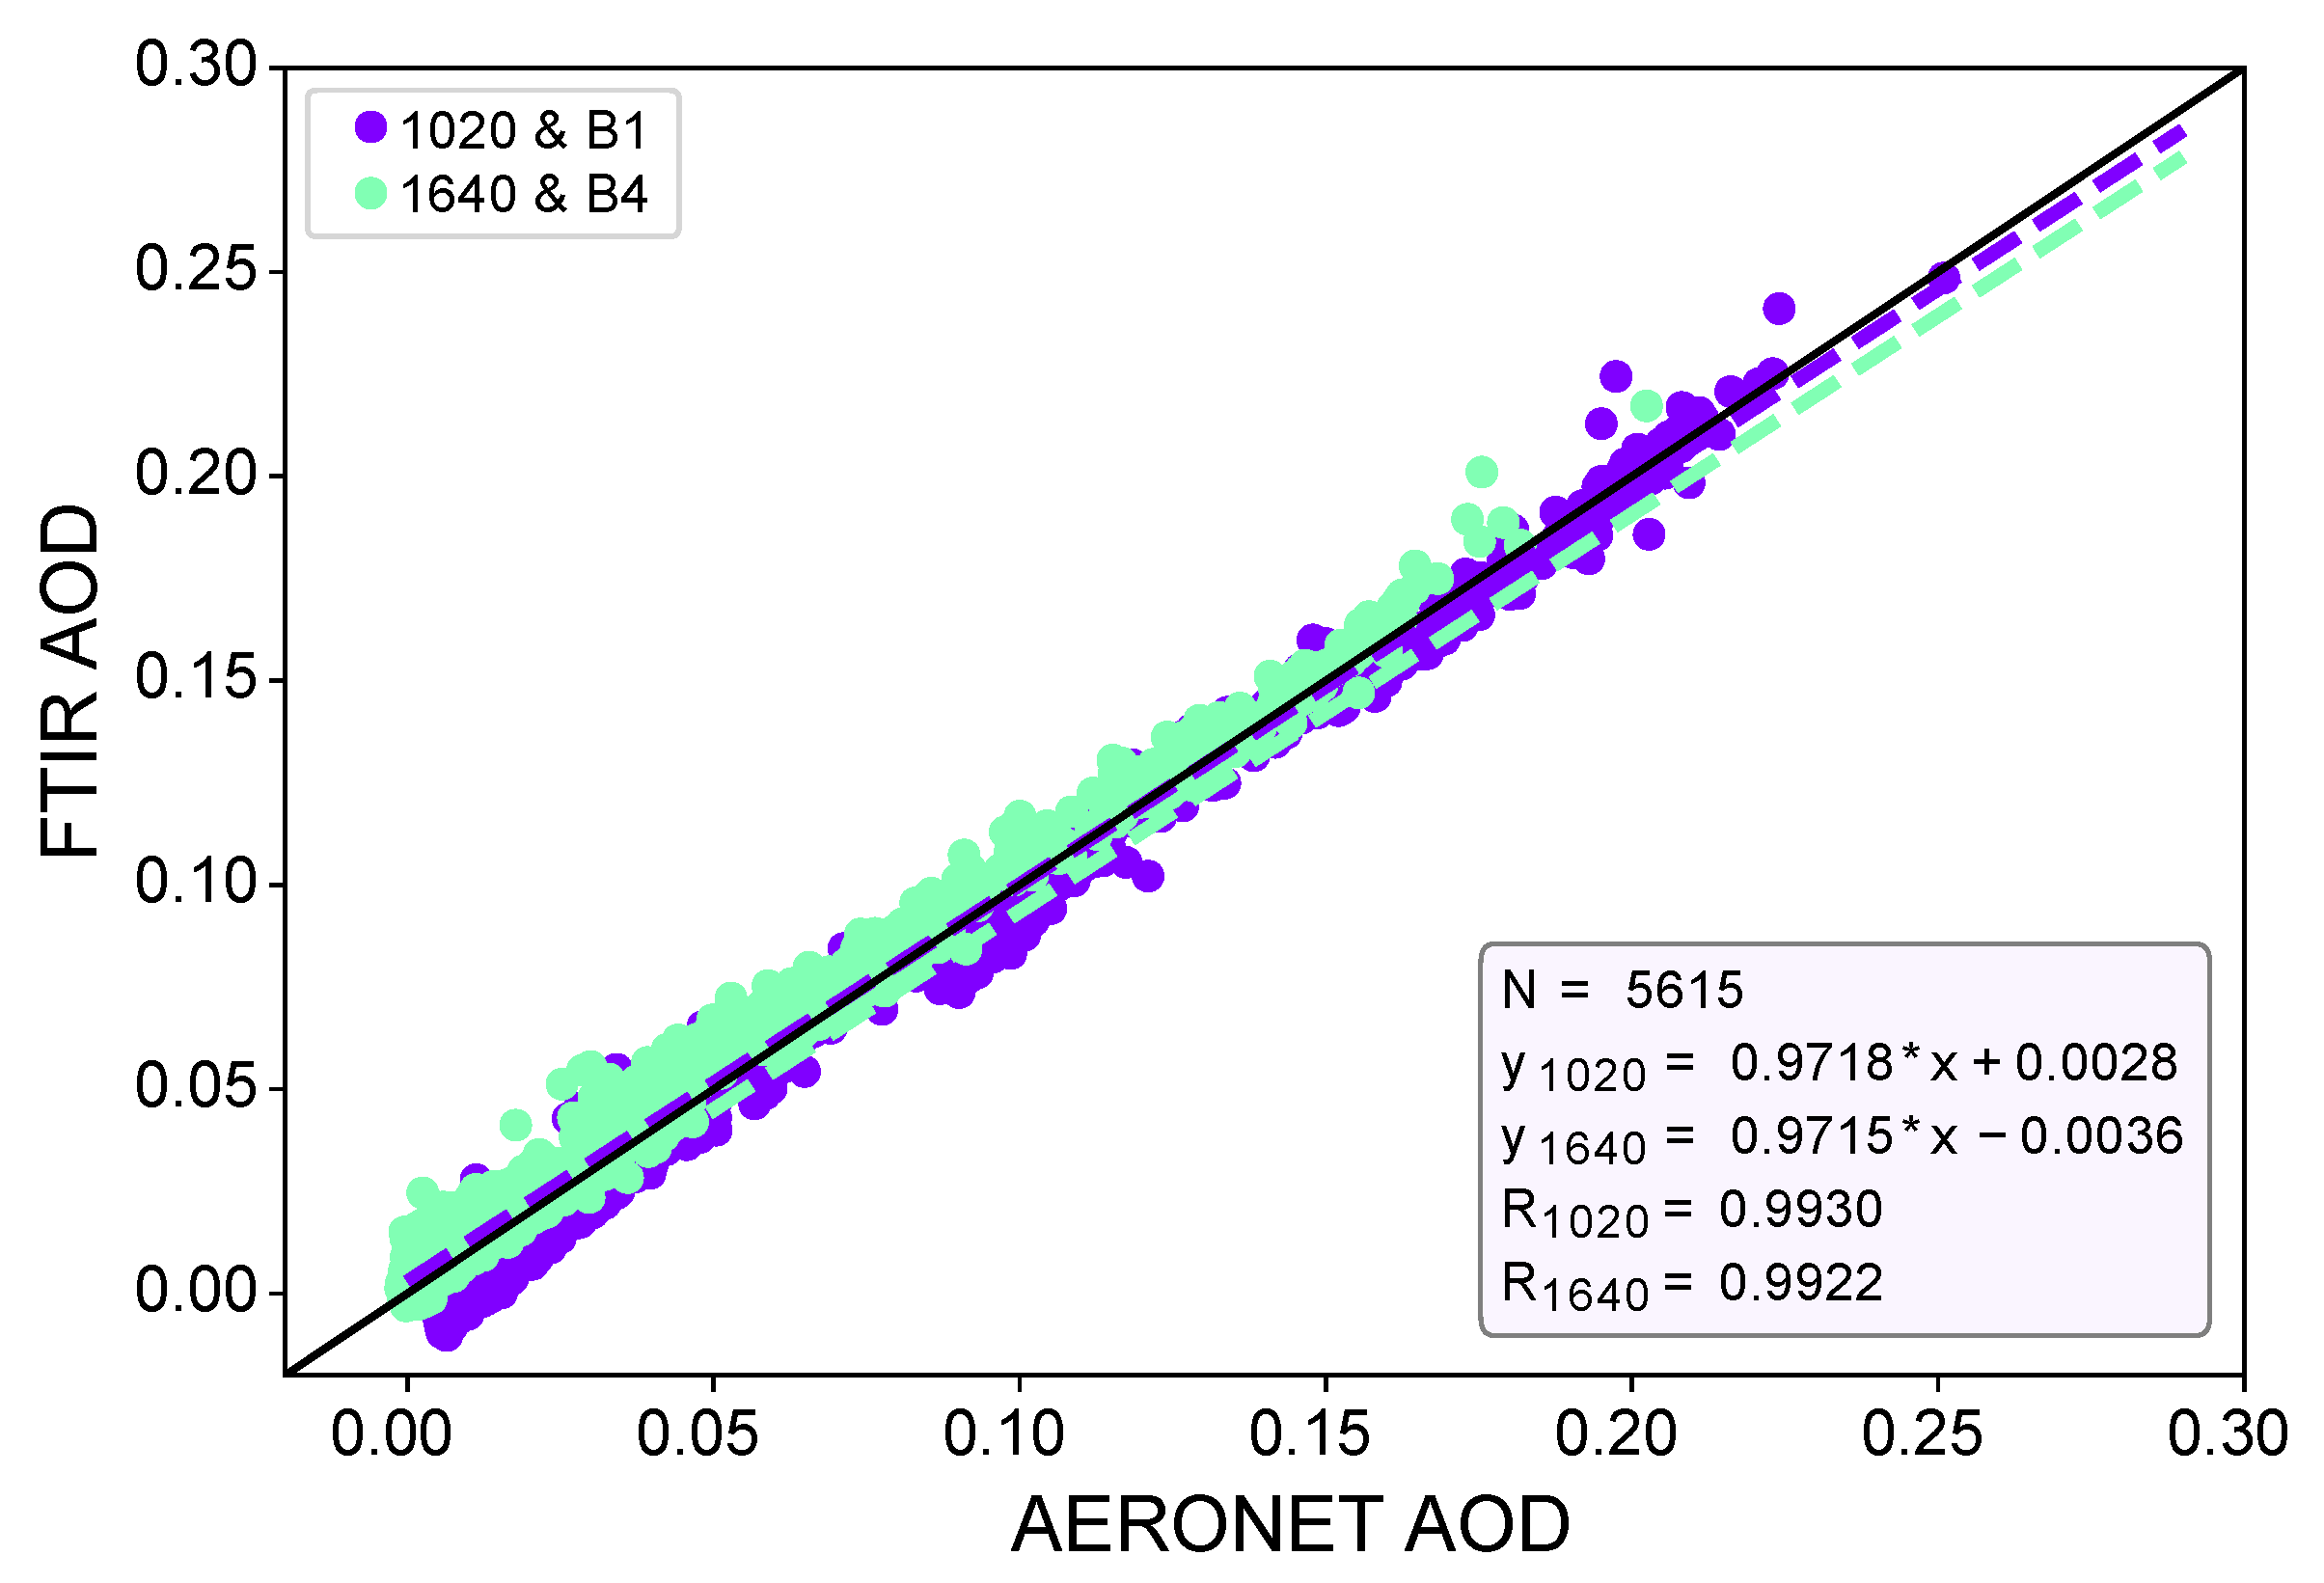
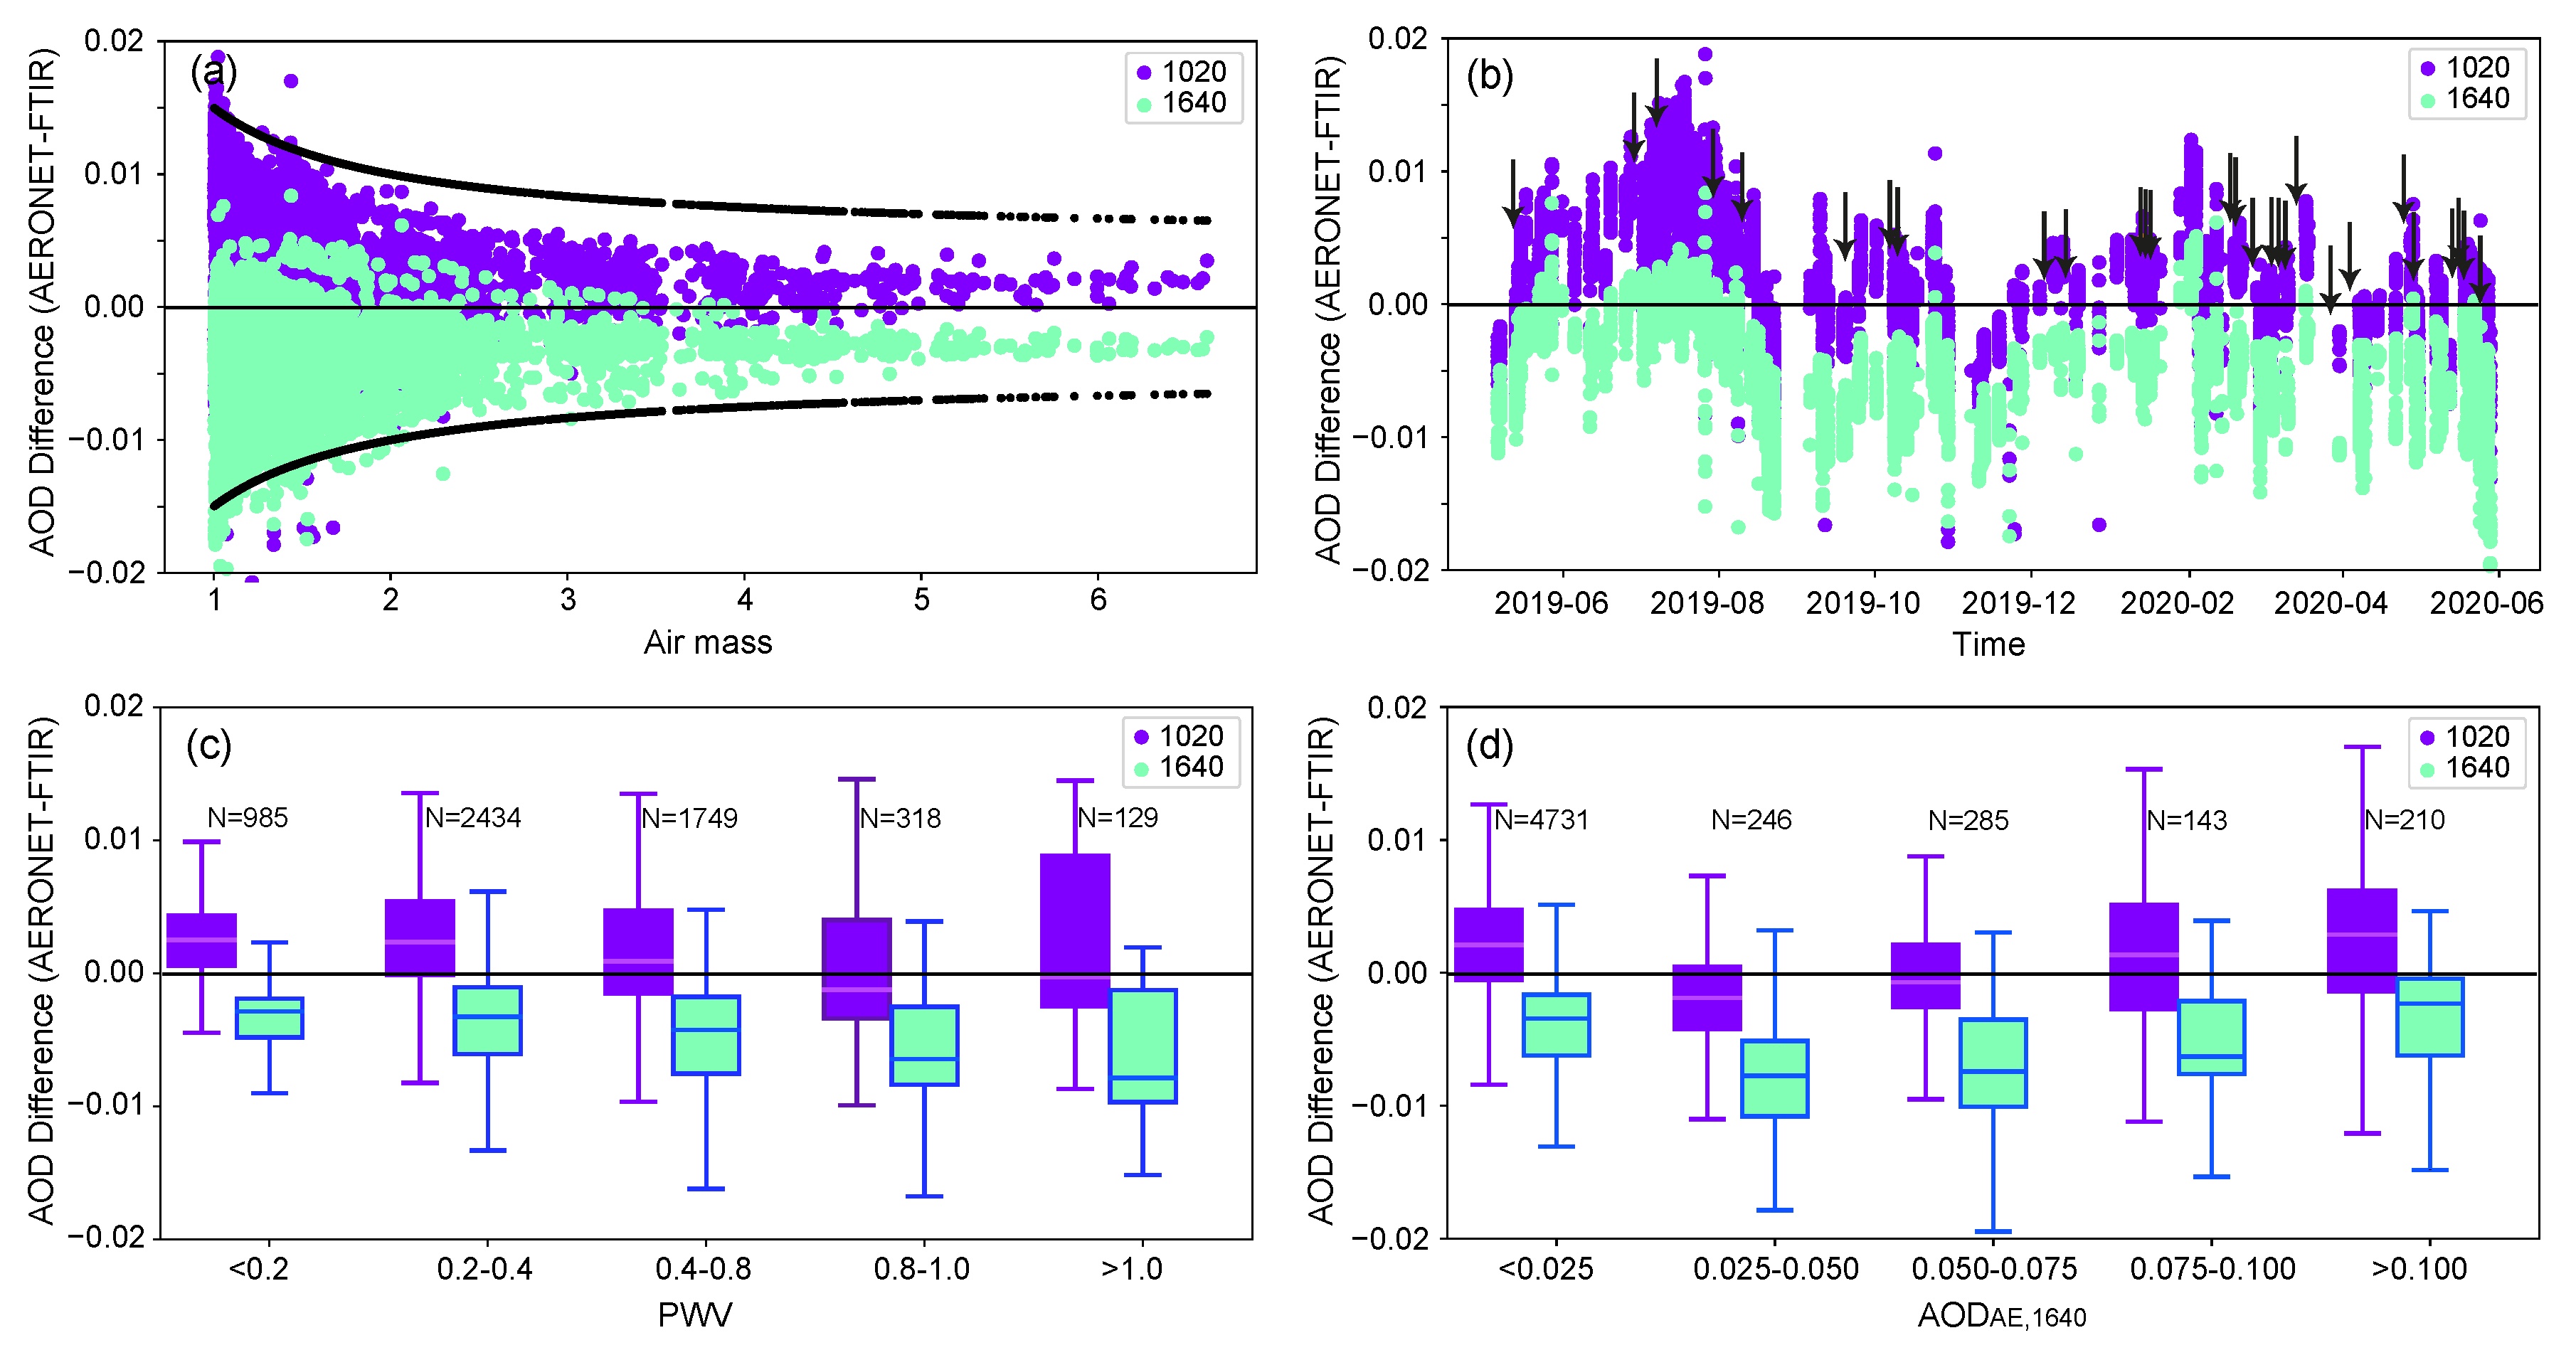
6.2. FTIR AOD Retrievals

FTIR AOD has been derived in a total of 156 days (25,590 instantaneous AOD values for the seven spectral bands) within the 1-year period using Equation (2). The cloud screening and quality-control procedure described in Section 5.4 has been applied to this dataset, therefore obtaining a final FTIR AOD database quality-controlled with 24,293 instantaneous AOD values for the seven spectral bands. A smooth temporal evolution between the calibration dates has been adopted to calculate AOD in the whole period, as explained in the previous section.
The time series of the daily-mean spectral AOD for the seven FTIR bands is displayed in Figure 5. A gradual decrease in AOD is observed at longer FTIR wavelengths in those conditions with medium and high aerosol loading. This spectral behaviour, determined by the combined effect of the aerosol size distribution, chemical composition, mixing state, and shape of the aerosols present, follows the expected λ -AOD dependence described by the Ångström power law in Equation (5). This is specially true for high-turbidity conditions (AERONET AOD at 1640 nm, A O D A E , 1640 > = 0.074, N = 2976), as illustrated in Figure 6. This limit in AOD has been extracted following [64], who set at A O D A E , 500 > 0.1 the limit for high-turbidity conditions at IZO. Considering a typical AE value of 0.25 for dust conditions at IZO and the Equation (5), this threshold can be extended to 1640 nm. The new threshold of A O D A E , 1640 > 0.074 has been consequently established. Figure 6 shows how the power law can be considered as a good approximation for dust conditions in the whole 1020–2314 nm spectral range, obtaining an averaged AE value of 0.54 from the regression fit to a power law in these conditions. With a spectral dependence one order of magnitude lower than dusty conditions, a spectrally flat behaviour of AOD is observed in the case of pristine conditions ( A O D A E , 1640 < 0.074, N = 21317).
The AOD temporal evolution of near-coincident FTIR B4 and AERONET AOD at 1640 nm from May 2019 to May 2020 is shown in Figure 7, where the good agreement between the two databases becomes evident. The evolution of the two products during a sequence of 11 days in July 2019 is also displayed in the zoom. Two dust outbreaks at IZO ( A O D A E , 1640 up to 0.18) and a sequence of six days with pristine conditions ( A O D A E , 1640 ranging from 0 and 0.034) can be observed during this time period. As seen, the FTIR system is able to properly follow the intra-day AOD variations both at high and low AOD regimes.
In order to assess the consistency of the FTIR retrievals over the entire 1-year period, only synchronous AOD measurements between FTIR and AERONET coincident spectral bands have been considered. The synchronization has been ensured by means of a matching criteria of ±30 s, leading to a total of 5615 coincident AOD observations in this time period. The scatterplot between these coincident AERONET and FTIR AOD values in the FTIR B1 and B4 bands is shown in Figure 8, while Table 3 summarizes the main statistics of the AOD intercomparison. High correlation coefficients (R above 0.99), low mean differences (absolute MD below 0.004), and root-mean-squared errors (RMSE below 0.006) ensure the excellent performance between the two AOD databases retrieved with these independent techniques. The obtained RMSE values, which account for the combination of AERONET and FTIR individual errors, can be considered a conservative estimate of the uncertainty for both AOD products. In the case of AERONET, the RMSE value at 1020 nm agrees with the expected uncertainty of 0.01 for field instruments [47], and could also be taken as an appropriate threshold for the 1640-nm channel.
Figure 9 examines the dependence of the AOD differences (AERONET- FTIR) on key factors, such as aerosol loading (i.e., A O D A E , 1640 ), water vapour content (i.e., PWV), and the optical path (i.e., optical air mass) as well as its temporal evolution. The comparison with the air mass gives us important information about the traceability of the two AOD datasets. Following the WMO traceability criteria [46], AOD measurements are traceable if 95% or more of the AOD differences lies within a specified acceptance limit, U95, defined in terms of the aerosol optical air mass as follows:
U 95 = ± ( 0.005 + 0.010 m a )
An excellent traceability between the two instruments is shown in Figure 9 (>99%), in addition to the lack of any perceptible bias with PWV, air mass, or AOD. However, Figure 9b reveals the dependence of AOD differences with time. This temporal behavior is the consequence of the lack of Langley–Plot calibrations over long periods (longer than 1 month), such as from 14 August to 15 September or from 14 October to 10 December. In these cases, the smoothed evolution of V 0 , λ may not be as accurate as in nearby days. Nevertheless, considering this degradation in calibration, AOD differences are still restricted between ±0.02. Note also that the AOD differences between AERONET at 1020 nm and FTIR B1 show overall higher dispersion than those for AERONET at 1640 nm and FTIR B4, which is expected from the higher noise of the FTIR solar spectra in this spectral range (closer to the detector cutoff, recall Figure 1).
The same analysis has been performed for AOD retrievals using the convolved FTIR spectra using the CE318-AERONET’s response functions for 1020 and 1640 nm channels (recall Figure 2). The same matching criteria has been applied to the two datasets, obtaining the same 5615 paired AODs. The main statistics are also shown in Table 3, with very similar results to that obtained with the FTIR micro-windows perspective (R above 0.99, MD below 0.002 and RMSE below 0.005). This result confirms the suitability of low-resolution convolved bands to retrieve high-quality AOD products provided that the gaseous absorption is correctly performed.
Analysis of the AOD differences (Figure 9 and Table 3) points out a different behaviour of the FTIR AOD products for the compared bands. While the FTIR B1 values slightly underestimate the standard AERONET product, the FTIR B4 data seems to systematically overestimate the aerosol content when the high-resolution FTIR spectra are considered. This overestimation is likely due to the gaseous absorption signals presented in B4 (Figure 1) being partly attributed to the presence of aerosols, leading to higher AOD values at this band. This behaviour disappears in the comparison of the degraded FTIR AOD products, as the fine absorption signatures become diluted within the convolved FTIR spectra. Then, the comparison results become more consistent for the two bands. As for the straightforward comparison, a poorer agreement between FTIR B1 and AERONET standard product is observed.

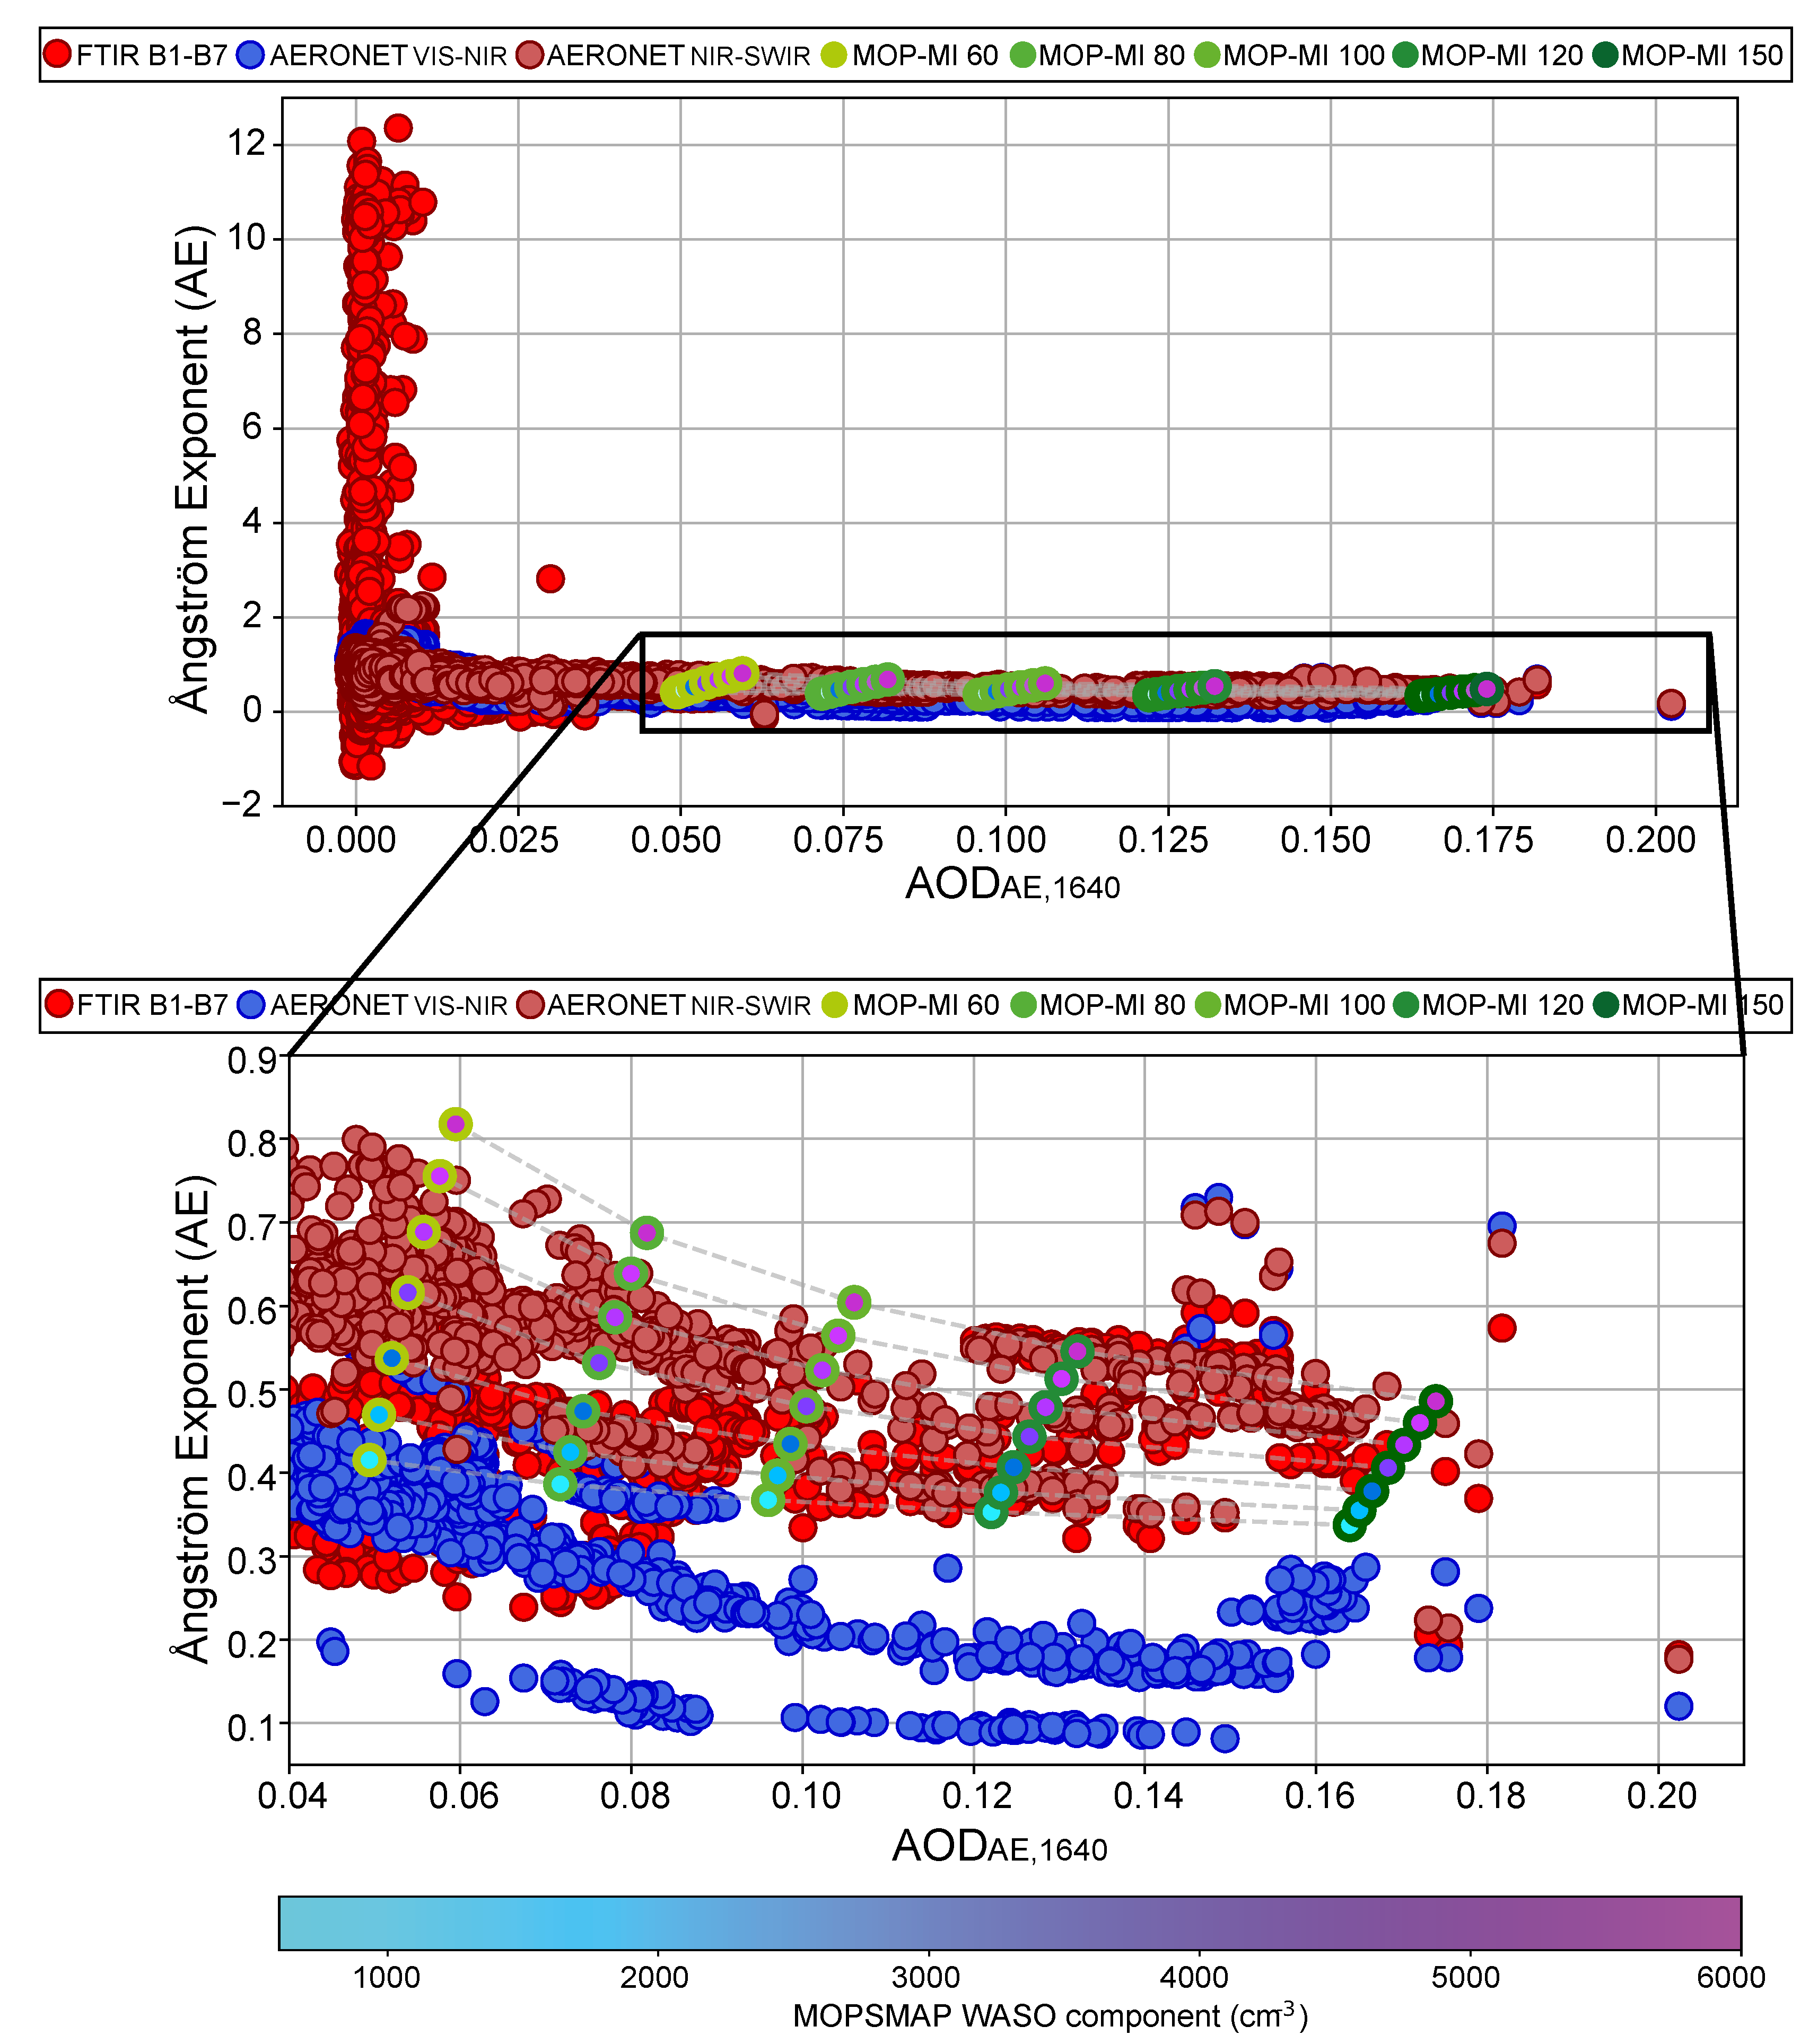
6.3. FTIR AE Retrievals

The spectral consistency of the near coincident FTIR and AERONET AOD observations (N = 5615) have been assessed in terms of the Ångström formula Equation (5), considering the 1020–2314 nm spectral range. AERONET AE product in the visible-to-near-infrared (440–870 nm) (AERONET VIS-NIR) and the estimated AE from AERONET NIR-SWIR (870–1640 nm) AOD data (AERONET NIR-SWIR) were also included in this analysis. These three datasets are shown in Figure 10 versus A O D A E , 1640 , revealing that unrealistic FTIR AE values (>2 and <0) are retrieved under very low AOD conditions. This artefact is introduced by forcing the spectrally flat behaviour of AOD to be fitted to a power law, specially at higher wavelengths, when the aerosol loading is rather poor at IZO. In these AOD conditions, the FTIR AOD values are close to the detection limit of this system, given by the uncertainty documented in the FTIR-AERONET AOD comparison (RMSE of ∼0.006, Section 6.2). Consequently, the FTIR AE estimates may be expected to be reliable beyond a conservative AOD threshold at 1640 nm of 0.01.
In order to validate these results, AE simulations retrieved by means of the MOPSMAP v1.0 package have been used. MOPSMAP extinction coefficients in the 1000–2500 nm spectral range with 50-m vertical resolution were used to calculate the spectral AOD, considering typical input values at IZO: relative humidity of 50%, mineral content in particle number (MI) from 60 to 150 cm 3 , and water-soluble (WASO) component (particle number) from 600 to 6000 cm 3 . The mixture of the three different mineral components to describe the size distribution of desert dust (nucleation, accumulation, and coarse mineral modes) have been calculated following the equations provided by [15]. The WASO component range has been included according to the results of the SAMUM-1 (Saharan Mineral Dust Experiment) campaign that took place in southern Morocco close to the Saharan desert in the summer of 2006 ([105], and references therein).
Figure 10 also includes the zoom in MOPSMAP AE estimates. The different datasets focused on the IR show a coherent agreement. MOPSMAP AE reveals a higher AOD wavelength dependence for low mineral content as WASO component is higher (maximum AE variability for mineral content of 60 cm 3 with AE ranging from 0.41 to 0.82). The strong dependence of AE on WASO particle number is also consistent with the results published in [105].
Mineral content at IZO is expected to be high in the case of dusty conditions. In this regard, Ref. [106] found average dust mass concentrations at IZO of 86.7 μ gm 3 (an approximately number of dust particles of 100 cm 3 , Sergio Rodríguez, personal communication) when the influence of the SAL prevails at the station. Therefore, a suitable value for mineral content of ∼100 cm 3 implies an AE range from 0.36 to 0.60 for WASO spanning from 600 to 6000 cm 3 , respectively. The AE value of 0.54 obtained from the regression analysis to a power law in Figure 6 is within the AE range predicted by MOPSMAP and is rather similar to the mean AE value of 0.53 extracted from FTIR database for high-turbidity conditions ( A O D A E , 1640 > 0.074, set in Section 6.2). This result is also consistent with the mean value of 0.51 retrieved with the AERONET NIR-SWIR AE for the same conditions, despite the different spectral range used (870–1640 nm). Similar standard deviations (0.08) were found for the two FTIR and AERONET AE products, pointing to a low AE dispersion and a spectrally flat AOD dependence in agreement with previous works for this spectral range (e.g., [107]).
The inclusion of the AERONET VIS-NIR product, calculated from AOD between 440 and 870 nm, can provide information on the relative influence of coarse- versus accumulation-mode on the size aerosol distribution and about the type of aerosol as well. A mean AERONET VIS-NIR value of 0.22 ± 0.10 was retrieved for the same high-turbidity conditions ( A O D A E , 1640 > 0.074 ), consistent with that expected for pure mineral dust [65]. A smooth spectral AOD dependence is retrieved in the case of A O D A E , 1640 values below 0.09, pointing to a small impact of accumulation-mode aerosols in this low-intermediate AOD conditions. AERONET VIS-NIR AE is spectrally flat for higher AOD values, in agreement with those published by [65] for the same site. A similar small spectral dependence is found for the AERONET NIR-SWIR product (likely introduced by the 870 nm channel), but a negligible dependence is observed for the FTIR AE data. In the FTIR spectral range (1020–2314 nm), there is no effect on accumulation-mode particles, confirming that the AOD- λ dependence is dominated by coarse particles. These large particles are assumed to be represented by mineral dust due to the absence of coarse marine aerosols at this high-mountain station [66].
In the light of the above results, we could confirm an AE for pure mineral dust in the IR domain between 0.51 ± 0.08 in the 870–1640 nm range and 0.53 ± 0.08 in the 1020–2314 nm range. However, it is fair to admit that this value is strongly dependent on the dust size distribution and mineralogy and, therefore, depends on the dust production mechanism and the distance to the dust source.

7. Summary and Conclusions

The high-resolution FTIR solar spectra are particularly relevant for climate studies, as they provide simultaneous information on fine absorption structures (i.e., trace gases) and broadband continuum signatures (i.e., aerosols or water continuum) across the entire IR domain. In this context, this work exploits the high-resolution FTIR infrared measurements, taken in a 1-year period (May 2019–May 2020) at the subtropical high-mountain Izaña Observatory (IZO), to retrieve AOD and AE products in the 1000–2500 nm spectral range. These measurements were carried out coincidentally with standard sun-photometry observations performed by means of a Cimel CE318-T part of the AERONET network. The special characteristics of IZO in terms of atmospheric stability and low aerosol loading enhance the reliability of these new IR products. In addition, the fact that the predominant aerosol in this North Atlantic high-mountain site is pure mineral dust ensures that the results drawn from this study are representative for this aerosol type.
Two different approaches have been used in this work to retrieve the spectral AOD information. Firstly, AOD was calculated in seven IR FTIR micro-windows (centred at 1020.90, 1238.25, 1558.25, 1636.00, 2133.40, 2192.00, and 2314.20 nm) especially selected to ensure the atmospheric gaseous absorption is negligible. Spectrally high-resolution simulations corroborate the high atmospheric transmission of these spectral bands (average transmission above 0.99). Secondly, spectral AOD calculation was performed on the degraded FTIR solar spectra using the CE318-AERONET’s response function in near-coincident bands (1020 nm and 1640 nm). A cloud screening and a quality-control procedure for FTIR observations have also been specifically developed to ensure the quality of FTIR AOD and AE database.
Although the FTIR systems provide high-quality spectroscopic measurements, the current setups have been not designed to provide the absolute photometric stability required for aerosol monitoring. The determination of its absolute calibration is challenging because it varies among systems (mirrors, alignment, and detector differences) with time (dust deposition) and may vary with relative mirror orientation [45]. In this work, the absolute calibration of the FTIR was performed by means of the Langley–Plot technique. The Langley analysis revealed that the FTIR absolute calibration at IZO is very sensitive to the surface degradation or dirtiness deposited on the FTIR external optical mirrors (with a linear degradation rate up to 1.75%month 1 ) and to punctual events affecting them. This lack of photometric stability was addressed in this paper by means of a continuous Langley–Plot procedure based on 29 different Langley–Plots smoothed with a spline smoothing method. This fact could be considered the main drawback of the proposed approach, but this issue might be overcome with an improved design of the FTIR external solar tracker.
The co-located AERONET-FTIR database have allowed us to perform a cross-validation of both techniques. This analysis is useful considering the lack of validation studies that still exists in the literature concerning the CE318-AERONET spectral band centred in the SWIR. The excellent agreement between AERONET and FTIR at the near-coincident spectral bands (mean AOD differences below 0.004 and RMSE below 0.006) demonstrates the suitability of AOD products obtained with the two techniques. This agreement further improves when FTIR convolved spectral bands are considered (MD below 0.002 and RMSE below 0.005).
The spectral AOD consistency in the seven FTIR spectral bands have been investigated through the verification of the AOD-wavelength Ångström power law. It has been documented that reliable AE values are only estimated when a certain aerosol loading is present at the station (AOD at 1640 nm higher than 0.01). The average AE extracted from FTIR (1020-2314 nm) and AERONET (870–1640 nm) is 0.53 ± 0.08 and 0.51 ± 0.08, respectively. These values lie within the MOPSMAP AE ranges from 0.36 and 0.60 for IZO typical values of mineral content (100 cm 3 ) and for a WASO content ranging from 600 and 6000 cm 3 . This cross-validation with MOPSMAP have ensured the reliability of the new FTIR database.
Although the FTIR solar absorption spectra were acquired at the spectral resolution of 0.02 cm 1 , these spectra were truncated at 0.5 cm 1 to retrieve the FTIR AOD products. This exercise was proposed to assess the capability of the low-resolution FTIR solar spectra, the typical one of portable FTIR instruments such as those operating within COCCON research infrastructure, to retrieve aerosol information in the NIR and SWIR regions. In light of the above results, the low-resolution COCCON instruments are suitable for detecting the aerosol broadband signal contained in the FTIR spectra as well as good enough for retrieving precise trace gas concentrations [72]. Consequently, our results serve as a first step to be applied to these portable low-resolution FTIR instruments, with a potentially higher spatial coverage.
This study is believed to be the first one to provide long-term (1 year) AOD and AE measurements in the 1020–2314 nm spectral range from ground-based FTIR solar spectra. In addition to enhance the multi-parameter capability of the FTIR technique for atmospheric monitoring (simultaneous gas and aerosol retrievals), this new AOD and AE dataset in the IR domain provides important additional information to increase the spectral sensitivity to large particles of the existing databases. However, new opportunities also come up for evaluating the performance of the existing ground- and satellite-based aerosol observations in the NIR and SWIR spectral ranges. This may be especially useful for satellite community as the selected FTIR spectral bands are near coincident with those in TERRA/AQUA/MODIS, Landsat/OLI, or Suomi-NPP/VIIRS remote sensors. Therefore, the new IR products could be used to directly validate different aerosol products, to allow the documented inconsistencies to be solved, and to further improve the retrieval algorithms in these spectral ranges. The highly biased Look-Up Table (LUT) retrieval products for dust as a result of the irregular shape of dust particles [34], the overestimation found for AE aerosol product of MODIS (MOD04) [34,108], and the high AOD uncertainty of MOD04 AOD product in the NIR could be examples of studies that could be addressed. Another potential application of the FTIR aerosol products is their use as proxy for atmospheric chemistry. As [109,110,111] have shown, AOD can be used as an useful proxy to trace gas concentrations and to differentiate among different atmospheric sources. This relationship may be therefore useful to complement the monitoring of atmospheric chemistry by ground- and space-based infrared sensors.

Author Contributions

Á.B. and O.E.G. designed and wrote the structure and methodology of the paper and computed the calculations required. M.S., R.D.G., F.H., and T.B. discussed the results and participated in the retrievals analysis. E.C. and T.B. ensured the provision of funds for the IZO FTIR measurement programme. E.S. and A.F.A. performed the maintenance and daily checks of the FTIR and CE318-AERONET, respectively, providing detailed technical information of this instrumentation. All authors discussed the results and contributed to the final paper. All authors have read and agreed to the published version of the manuscript.

Funding

This study has been performed thanks to regular funds from the State Meteorological Agency of Spain (AEMET) to the World Meteorological Organization (WMO) Commission for Instruments and Methods of Observations (CIMO) Izaña Testbed for Aerosols and Water Vapor Remote Sensing Instruments, dedicated resources from SIELTEC S.L., and the European Community Research Infrastructure Action under the FP7 ACTRIS grant, agreement no. 262254.

Acknowledgments

This work has been developed within the framework of the activities of the World Meteorological Organization (WMO) Commission for Instruments and Methods of Observations (CIMO) Izaña Testbed for Aerosols and Water Vapour Remote Sensing Instruments. AERONET sun photometers at Izaña have been calibrated within the AERONET Europe TNA, supported by the European Community Research Infrastructure Action under the FP7 ACTRIS grant, agreement no. 262254. The authors also acknowledge the support from the Ministerio de Economía y Competitividad from Spain through the project INMENSE (CGL2016-80688-P) and Izaña staff for maintaining the instrumentation, thus ensuring the quality of the data.

Conflicts of Interest

The authors declare no conflict of interest.

References

  1. Bojinski, S.; Verstraete, M.M.; Peterson, T.C.; Richter, C.G.; Simmons, A.; Zemp, M. The Concept of Essential Climate Variables in Support of Climate Research, Applications, and Policy. Bull. Am. Meteorol. Soc. 2014, 95, 1431–1443. [Google Scholar] [CrossRef]
  2. Boucher, O.; Randall, D.; Artaxo, P.; Bretherton, C.; Feingold, G.; Forster, P.; Kerminen, V.M.; Kondo, Y.; Liao, H.; Lohmann, U.; et al. Clouds and Aerosols. In Climate Change 2013: The Physical Science Basis. Contribution of Working Group I to the Fifth Assessment Report of the Intergovernmental Panel on Climate Change; Stocker, T., Qin, D., Plattner, G.K., Tignor, M., Allen, S., Boschung, J., Nauels, A., Xia, Y., Bex, V., Midgley, P., Eds.; Cambridge University Press: Cambridge, UK; New York, NY, USA, 2013; Chapter 7; pp. 571–658,. [Google Scholar] [CrossRef]
  3. Myhre, G.; Shindell, D.; Breon, F.M.; Collins, W.; Fuglestvedt, J.; Huang, J.; Koch, D.; Lamarque, J.F.; Lee, D.; Mendoza, B.; et al. Anthropogenic and Natural Radiative Forcing. In Climate Change 2013: The Physical Science Basis. Contribution of Working Group I to the Fifth Assessment Report of the Intergovernmental Panel on Climate Change; Stocker, T., Qin, D., Plattner, G.K., Tignor, M., Allen, S., Boschung, J., Nauels, A., Xia, Y., Bex, V., Midgley, P., Eds.; Cambridge University Press: Cambridge, UK; New York, NY, USA, 2013; Chapter 8; pp. 659–740. [Google Scholar] [CrossRef]
  4. Remer, L.A.; Kaufman, Y.J.; Tanré, D.; Mattoo, S.; Chu, D.A.; Martins, J.V.; Li, R.R.; Ichoku, C.; Levy, R.C.; Kleidman, R.G.; et al. The MODIS Aerosol Algorithm, Products, and Validation. J. Atmos. Sci. 2005, 62, 947–973. [Google Scholar] [CrossRef] [Green Version]
  5. Panicker, A.S.; Pandithurai, G.; Safai, P.D.; Kewat, S. Observations of enhanced aerosol longwave radiative forcing over an urban environment. Geophys. Res. Lett. 2008, 35. [Google Scholar] [CrossRef]
  6. Scott, V.C.A.C.M.P.C.C.R.A.L.C.N. Infrared dust aerosol optical depth retrieved daily from IASI and comparison with AERONET over the period 2007–2016. Remote Sens. Environ. 2018, 15–32. [Google Scholar] [CrossRef]
  7. Kim, J.; Yoon, J.; Ahn, M.H.; Sohn, B.J.; Lim, H.S. Retrieving aerosol optical depth using visible and mid-IR channels from geostationary satellite MTSAT-1R. Int. J. Remote Sens. 2008, 29, 6181–6192. [Google Scholar] [CrossRef]
  8. Clarisse, L.; Coheur, P.F.; Prata, F.; Hadji-Lazaro, J.; Hurtmans, D.; Clerbaux, C. A unified approach to infrared aerosol Remote Sens. and type specification. Atmos. Chem. Phys. 2013, 13, 2195–2221. [Google Scholar] [CrossRef] [Green Version]
  9. Ryder, C.L.; Highwood, E.J.; Walser, A.; Seibert, P.; Philipp, A.; Weinzierl, B. Coarse and giant particles are ubiquitous in Saharan dust export regions and are radiatively significant over the Sahara. Atmos. Chem. Phys. 2019, 19, 15353–15376. [Google Scholar] [CrossRef] [Green Version]
  10. O’Neill, N.T.; Eck, T.F.; Reid, J.S.; Smirnov, A.; Pancrati, O. Coarse mode optical information retrievable using ultraviolet to short-wave infrared Sun photometry: Application to United Arab Emirates Unified Aerosol Experiment data. J. Geophys. Res. Atmos. 2008, 113. [Google Scholar] [CrossRef]
  11. Toledano, C.; Torres, B.; Velasco-Merino, C.; Althausen, D.; Groß, S.; Wiegner, M.; Weinzierl, B.; Gasteiger, J.; Ansmann, A.; González, R.; et al. Sun photometer retrievals of Saharan dust properties over Barbados during SALTRACE. Atmos. Chem. Phys. 2019, 19, 14571–14583. [Google Scholar] [CrossRef] [Green Version]
  12. Kok, J.F.; Ridley, D.A.; Zhou, Q.; Miller, R.L.; Zhao, C.; Heald, C.L.; Ward, D.S.; Albani, S.; Haustein, K. Smaller desert dust cooling effect estimated from analysis of dust size and abundance. Nat. Geosci. 2017, 10, 274–278. [Google Scholar] [CrossRef]
  13. Does, M.; Knippertz, P.; Zschenderlein, P.; Harrison, R.; Stuut, J.B. The mysterious long-range transport of giant mineral dust particles. Sci. Adv. 2018, 4. [Google Scholar] [CrossRef] [Green Version]
  14. Hess, M.; Koepke, P.; Schult, I. Optical Properties of Aerosols and Clouds: The Software Package OPAC. Bull. Am. Meteorol. Soc. 1998, 79, 831–844. [Google Scholar] [CrossRef]
  15. Koepke, P.; Hess, M.; Schult, I.; Shettle, E.P. Global Aerosol Data Set; Technical Report 243, MPI Meteorologie Hamburg Report; MPI: Vaudreuil, QC, Canada, 1997. [Google Scholar]
  16. Gasteiger, J.; Wiegner, M. MOPSMAP v1.0: A versatile tool for the modeling of aerosol optical properties. Geosci. Model Dev. 2018, 11, 2739–2762. [Google Scholar] [CrossRef] [Green Version]
  17. Holben, N.B.; Eck Slutsker, T.F.A.; Tanre, I.A.; Buis, D.A.; Setzer, J.P.A.; Vermote, A.A.; Reagan, E.A.; Kaufman, J.A.A.; Nakajima, Y.J.A. AERONET—A Federated Instrument Network and Data Archive for Aerosol Characterization. Remote Sens. Environ. 1998, 1–16. [Google Scholar] [CrossRef]
  18. Takamura, T.; Sasano, Y.; Hayasaka, T. Tropospheric aerosol optical properties derived from lidar, sun photometer, and optical particle counter measurements. Appl. Opt. 1994, 33, 7132–7140. [Google Scholar] [CrossRef]
  19. WMO. Aerosol Measurement Procedures, Guidelines and Recommendations; Technical Report GAW Report No. 153; WMO TD No. 1178; World Meteorological Organization: Geneva, Switzerland, 2003. [Google Scholar]
  20. Bevan, S.L.; North, P.R.; Los, S.O.; Grey, W.M. A global dataset of atmospheric aerosol optical depth and surface reflectance from AATSR. Remote Sens. Environ. 2012, 199–210. [Google Scholar] [CrossRef]
  21. Huang, J.; Kondragunta, S.; Laszlo, I.; Liu, H.; Remer, L.A.; Zhang, H.; Superczynski, S.; Ciren, P.; Holben, B.N.; Petrenko, M. Validation and expected error estimation of Suomi-NPP VIIRS aerosol optical thickness and Ångström exponent with AERONET. J. Geophys. Res. Atmos. 2016, 121, 7139–7160. [Google Scholar] [CrossRef] [Green Version]
  22. Peyridieu, S.; Chédin, A.; Capelle, V.; Tsamalis, C.; Pierangelo, C.; Armante, R.; Crevoisier, C.; Crépeau, L.; Siméon, M.; Ducos, F.; et al. Characterisation of dust aerosols in the infrared from IASI and comparison with PARASOL, MODIS, MISR, CALIOP, and AERONET observations. Atmos. Chem. Phys. 2013, 13, 6065–6082. [Google Scholar] [CrossRef] [Green Version]
  23. Aumann, H.; Chahine, M.; Gautier, C.; Goldberg, M.; Kalnay, E.; McMillin, L.; Revercomb, H.; Rosenkranz, P.W.; Smith, W.L.; Staelin, D.H.; et al. AIRS/AMSU/HSB on the Aqua mission: Design, science objectives, data products, and processing systems. IEEE Trans. Geosci. Remote Sens. 2003, 41, 253–264. [Google Scholar] [CrossRef] [Green Version]
  24. Chahine, M.T.; Pagano, T.S.; Aumann, H.H.; Atlas, R.; Barnet, C.; Blaisdell, J.; Chen, L.; Divakarla, M.; Fetzer, E.J.; Goldberg, M.; et al. AIRS: Improving Weather Forecasting and Providing New Data on Greenhouse Gases. Bull. Am. Meteorol. Soc. 2006, 87, 911–926. [Google Scholar] [CrossRef] [Green Version]
  25. Crevoisier, C.; Clerbaux, C.; Guidard, V.; Phulpin, T.; Armante, R.; Brice, B.; Camy-Peyret, C.; Chaboureau, J.P.; Dufour, G.; Lavanant, L.; et al. The IASI-NG mission onboard METOP-SG: Scientific objectives and expected results. In Proceedings of the 3rd Conference IASI, Hyères, France, 4–8 February 2013. [Google Scholar]
  26. Tanré, D.; Kaufman, Y.J.; Herman, M.; Mattoo, S. Remote Sens. of aerosol properties over oceans using the MODIS/EOS spectral radiances. J. Geophys. Res. Atmos. 1997, 102, 16971–16988. [Google Scholar] [CrossRef]
  27. Ruddick, Q.V.K. Advantages of high quality SWIR bands for ocean colour processing: Examples from Landsat-8. Remote Sens. Environ. 2015, 89–106. [Google Scholar] [CrossRef] [Green Version]
  28. Cao, C.; De Luccia, F.J.; Xiong, X.; Wolfe, R.; Weng, F. Early On-Orbit Performance of the Visible Infrared Imaging Radiometer Suite Onboard the Suomi National Polar-Orbiting Partnership (S-NPP) Satellite. IEEE Trans. Geosci. Remote Sens. 2014, 52, 1142–1156. [Google Scholar] [CrossRef] [Green Version]
  29. Kaufman, Y.J.; Tanré, D.; Remer, L.A.; Vermote, E.F.; Chu, A.; Holben, B.N. Operational Remote Sens. of tropospheric aerosol over land from EOS moderate resolution imaging spectroradiometer. J. Geophys. Res. Atmos. 1997, 102, 17051–17067. [Google Scholar] [CrossRef]
  30. Barreto, A.; Cuevas, E.; Granados-Muñoz, M.J.; Alados-Arboledas, L.; Romero, P.; Gröbner, J.; Kouremeti, N.; Almansa, A.; Stone, T.; Toledano, C.; et al. The new sun-sky-lunar Cimel CE318-T multiband photometer—A comprehensive performance evaluation. Atmos. Meas. Tech. 2016, 9, 631–654. [Google Scholar] [CrossRef] [Green Version]
  31. Giles, D.M.; Sinyuk, A.; Sorokin, M.G.; Schafer, J.S.; Smirnov, A.; Slutsker, I.; Eck, T.F.; Holben, B.N.; Lewis, J.R.; Campbell, J.R.; et al. Advancements in the Aerosol Robotic Network (AERONET) Version 3 database—Automated near-real-time quality control algorithm with improved cloud screening for Sun photometer aerosol optical depth (AOD) measurements. Atmos. Meas. Tech. 2019, 12, 169–209. [Google Scholar] [CrossRef] [Green Version]
  32. Flynn, C.J.; Russell, P.B.; Schmid, B.; Redemann, J.; Dunagan, S.E.; Kluzek, C.D.; Hubbe, J.M.; Segal-Rosenheimer, M.; Livingston, J.M.; Eck, T.F.; et al. Hyperspectral aerosol optical depths from TCAP flights. J. Geophys. Res. Atmos. 2013, 118, 12180–12194. [Google Scholar] [CrossRef]
  33. Witthuhn, J.; Deneke, H.; Macke, A.; Bernhard, G. Algorithms and uncertainties for the determination of multispectral irradiance components and aerosol optical depth from a shipborne rotating shadowband radiometer. Atmos. Meas. Tech. 2017, 10, 709–730. [Google Scholar] [CrossRef]
  34. Redemann, J.; Zhang, Q.; Schmid, B.; Russell, P.B.; Livingston, J.M.; Jonsson, H.; Remer, L.A. Assessment of MODIS-derived visible and near-IR aerosol optical properties and their spatial variability in the presence of mineral dust. Geophys. Res. Lett. 2006, 33. [Google Scholar] [CrossRef]
  35. Hase, F.; Hannigan, J.W.; Coffey, M.T.; Goldman, A.; Hopfner, M.; Jones, N.B.; Rinsland, C.P.; Wood, S.W. Intercomparison of retrieval codes used for the analysis of high-resolution, ground-based FTIR measurements. J. Quant. Spectrosc. Radiat. Transf. 2004, 25–52. [Google Scholar] [CrossRef]
  36. Schneider, M.; Blumenstock, T.; Chipperfield, M.P.; Hase, F.; Kouker, W.; Reddmann, T.; Ruhnke, R.; Cuevas, E.; Fischer, H. Subtropical trace gas profiles determined by ground-based FTIR spectroscopy at Izaña (28deg; N, 16deg; W): Five-year record, error analysis, and comparison with 3-D CTMs. Atmos. Chem. Phys. 2005, 5, 153–167. [Google Scholar] [CrossRef] [Green Version]
  37. Schneider, M.; Sepúlveda, E.; García, O.; Hase, F.; Blumenstock, T. Remote Sens. of water vapour profiles in the framework of the Total Carbon Column Observing Network (TCCON). Atmos. Meas. Tech. 2010, 3. [Google Scholar] [CrossRef] [Green Version]
  38. Schneider, M.; Demoulin, P.; Sussmann, R. Fourier Transform Infrared Spectrometry, in Monitoring Atmospheric Water Vapour Ground-Based Remote Sensing and In Situ Methods; Technical Report; Springer: New York, NY, USA, 2013. [Google Scholar]
  39. Wunch, D.; Toon, G.C.; Blavier, J.F.L.; Washenfelder, R.A.; Notholt, J.; Connor, B.J.; Griffith, D.W.T.; Sherlock, V.; Wennberg, P.O. The Total Carbon Column Observing Network. Philos. Trans. A Math. Phys. Eng. Sci. 2011, 369, 2087–2112. [Google Scholar] [CrossRef] [PubMed] [Green Version]
  40. García, O.E.; Sepúlveda, E.; Schneider, M.; Hase, F.; August, T.; Blumenstock, T.; Kühl, S.; Munro, R.; Gómez-Peláez, A.J.; Hultberg, T.; et al. Consistency and quality assessment of the Metop-A/IASI and Metop-B/IASI operational trace gas products (O3,CO, N2O, CH4, and CO2) in the subtropical North Atlantic. Atmos. Meas. Tech. 2016, 9, 2315–2333. [Google Scholar] [CrossRef] [Green Version]
  41. De Mazière, M.; Thompson, A.M.; Kurylo, M.J.; Wild, J.D.; Bernhard, G.; Blumenstock, T.; Braathen, G.O.; Hannigan, J.W.; Lambert, J.C.; Leblanc, T.; et al. The Network for the Detection of Atmospheric Composition Change (NDACC): History, status and perspectives. Atmos. Chem. Phys. 2018, 18, 4935–4964. [Google Scholar] [CrossRef] [Green Version]
  42. Höpfner, M.; Blumenstock, T.; Hase, F.; Zimmermann, A.; Flentje, H.; Fueglistaler, S. Mountain polar stratospheric cloud measurements by Ground Based FTIR Solar Absorption Spectroscopy. Geophys. Res. Lett. 2001, 28, 2189–2192. [Google Scholar] [CrossRef]
  43. Holben, B.N.; Eck, T.F.; Slutsker, I.; Smirnov, A.; Sinyuk, A.; Schafer, J.; Giles, D.; Dubovik, O. Aeronet’s Version 2.0 quality assurance criteria. Proc. SPIE 2006, 6408. [Google Scholar] [CrossRef]
  44. Köhler, C.H.; Trautmann, T.; Lindermeir, E.; Vreeling, W.; Lieke, K.; Kandler, K.; Weinzierl, B.; Groß, S.; Tesche, M.; Wendisch, M. Thermal IR radiative properties of mixed mineral dust and biomass aerosol during SAMUM-2. Tell. B Chem. Phys. Meteorol. 2011, 63, 751–769. [Google Scholar] [CrossRef] [Green Version]
  45. Hedelius, J.K.; Toon, G.C.; Wennberg, P.O. Estimating AOD from an EM27/SUN. In Proceedings of the NDACC/IRWG and TCCON Meeting, Paris, France, 29 May–2 June 2017. [Google Scholar]
  46. WMO/GAW Experts Workshop on a Global Surface-Based Network for Long Term Observations of Column Aerosol Optical Properties; Technical Report GAW Report No. 162; WMO TD No. 1287; World Meteorological Organization: Davos, Switzerland, 2005.
  47. Eck, T.F.; Holben, B.N.; Reid, J.; Dubovik, O.; Smirnov, A.; Neill, N.; Slutsker, I.; Kinne, S. Wavelength dependence of the optical depth of biomass burning, urban, and desert dust aerosols. J. Geophys. Res. 1999, 104, 31333–31349. [Google Scholar] [CrossRef]
  48. O’Neill, N.T.; Dubovik, O.; Eck, T.F. Modified Ångström exponent for the characterization of submicrometer aerosols. Appl. Opt. 2001, 40, 2368–2375. [Google Scholar] [CrossRef]
  49. Schuster, G.L.; Dubovik, O.; Holben, B.N. Angstrom exponent and bimodal aerosol size distributions. J. Geophys. Res. Atmos. 2006, 111. [Google Scholar] [CrossRef] [Green Version]
  50. Ångström, A. The parameters of atmospheric turbidity. Tellus 1964, 16, 64–75. [Google Scholar] [CrossRef] [Green Version]
  51. Dubovik, O.; Holben, B.; Eck, T.F.; Smirnov, A.; Kaufman, Y.J.; King, M.D.; Tanré, D.; Slutsker, I. Variability of Absorption and Optical Properties of Key Aerosol Types Observed in Worldwide Locations. J. Atmos. Sci. 2002, 59, 590–608. [Google Scholar] [CrossRef]
  52. Toledano, C.; Wiegner, M.; Garhammer, M.; Seefeldner, M.; Gasteiger, J.; Müller, D.; Koepke, P. Spectral aerosol optical depth characterization of desert dust during SAMUM 2006. Tellus B 2009, 61, 216–228. [Google Scholar] [CrossRef]
  53. Basart, S.; Pérez, C.; Cuevas, E.; Baldasano, J.; Gobbi, G. Aerosol characterization in Northern Africa, Northeastern Atlantic, Mediterranean Basin and Middle East from direct-sun AERONET observations. Atmos. Chem. Phys. 2009, 9, 8265–8282. [Google Scholar] [CrossRef] [Green Version]
  54. Cuevas, E.; Gómez-Peláez, A.; Rodríguez, S.; Terradellas, E.; Basart, S.; García, R.; García, O.; Alonso-Pérez, S. The pulsating nature of large-scale Saharan dust transport as a result of interplays between mid-latitude Rossby waves and the North African Dipole Intensity. Atmos. Environ. 2017, 586–602. [Google Scholar] [CrossRef] [Green Version]
  55. Cuevas, E.; Milford, C.; Bustos, J.J.; García, O.E.; García, R.D.; Gómez-Peláez, A.J.; Guirado-Fuentes, C.; Marrero, C.; Prats, N.; Ramos, R.; et al. Izaña Atmospheric Research Center Activity Report 2017–2018; Technical Report WMO/GAW No. 247; World Meteorological Organization: Geneva, Switzerland; Izaña Atmospheric Resear Center (AEMET): Madrid, Spain, 2019; Available online: https://izana.aemet.es/wp-content/docs/Izana_Report_2017_2018.pdf (accessed on 2 July 2020).
  56. Cuevas, E.; Romero-Campos, P.M.; Kouremeti, N.; Kazadzis, S.; Räisänen, P.; García, R.D.; Barreto, A.; Guirado-Fuentes, C.; Ramos, R.; Toledano, C.; et al. Aerosol optical depth comparison between GAW-PFR and AERONET-Cimel radiometers from long-term (2005–2015) 1 min synchronous measurements. Atmos. Meas. Tech. 2019, 12, 4309–4337. [Google Scholar] [CrossRef]
  57. Commission for Instruments and Methods of Observation. Sixteenth Session; Technical Report WMO No. 1138. World Meteorological Organization: Saint Petersburg, Russia, 2014. Available online: https://library.wmo.int/doc_num.php?explnum_id=5576 (accessed on 30 July 2020).
  58. Toledano, C.; González, R.; Fuertes, D.; Cuevas, E.; Eck, T.F.; Kazadzis, S.; Kouremeti, N.; Gröbner, J.; Goloub, P.; Blarel, L.; et al. Assessment of Sun photometer Langley calibration at the high-elevation sites Mauna Loa and Izaña. Atmos. Chem. Phys. 2018, 18, 14555–14567. [Google Scholar] [CrossRef] [Green Version]
  59. García-Cabrera, R.D.; Cuevas-Agulló, E.; Barreto, A.; Cachorro, V.E.; Pó, M.; Ramos, R.; Hoogendijk, K. Aerosol retrievals from the EKO MS-711 spectral direct irradiance measurements and corrections of the circumsolar radiation. Atmos. Meas. Tech. 2020, 13, 2601–2621. [Google Scholar] [CrossRef]
  60. Bolsee, D.; Pereira, N.; Decuyper, W.; Gillotay, D.; Yu, H.; Sperfeld, P.; Pape, S.; Cuevas, E.; Redondas, A.; Hernandez, Y. Accurate Determination of the TOA Solar Spectral NIR Irradiance Using a Primary Standard Source and Bouguer-Langley Technique. Sol. Phys. 2014, 289. [Google Scholar] [CrossRef]
  61. Gröbner, J.; Kröger, I.; Egli, L.; Hülsen, G.; Riechelmann, S.; Sperfeld, P. The high-resolution extraterrestrial solar spectrum (QASUMEFTS) determined from ground-based solar irradiance measurements. Atmos. Meas. Tech. 2017, 10, 3375–3383. [Google Scholar] [CrossRef] [Green Version]
  62. Rodríguez, S.; Alastuey, A.; Alonso-Pérez, S.; Querol, X.; Cuevas, E.; Abreu-Afonso, J.; Viana, M.; Pérez, N.; Pandolfi, M.; de la Rosa, J. Transport of desert dust mixed with North African industrial pollutants in the subtropical Saharan Air Layer. Atmos. Chem. Phys. 2011, 11, 6663–6685. [Google Scholar] [CrossRef] [Green Version]
  63. Prospero, J.M.; Mayol-Bracero, O.L. Understanding the Transport and Impact of African Dust on the Caribbean Basin. Bull. Am. Meteorol. Soc. 2013, 94, 1329–1337. [Google Scholar] [CrossRef]
  64. Guirado, C. CaracterizacióN De Las Propiedades De Los Aerosoles en Columna En La RegióN Subtropical. Ph.D. Thesis, Universidad de Valladolid, Valladolid, Spain, 2015. Available online: http://uvadoc.uva.es/handle/10324/13220 (accessed on 18 July 2020).
  65. Berjón, A.; Barreto, A.; Hernández, Y.; Yela, M.; Toledano, C.; Cuevas, E. A 10-year characterization of the Saharan Air Layer lidar ratio in the subtropical North Atlantic. Atmos. Chem. Phys. 2019, 19, 6331–6349. [Google Scholar] [CrossRef] [Green Version]
  66. García, M.I.; Rodríguez, S.; Alastuey, A. Impact of North America on the aerosol composition in the North Atlantic free troposphere. Atmos. Chem. Phys. 2017, 17, 7387–7404. [Google Scholar] [CrossRef] [Green Version]
  67. Griffiths, P.R.; de Haseth, J.A. Fourier Transforms. In Fourier Transform Infrared Spectrometry; John Wiley and Sons, Ltd.: Hoboken, NJ, USA, 2006; Chapter 4; pp. 75–95. [Google Scholar] [CrossRef]
  68. Zander, R. Recent observations of HF and HCl in the upper stratosphere. Geophys. Res. Lett. 1981, 8, 413–416. [Google Scholar] [CrossRef]
  69. Rinsland, C.P.; Smith, M.A.H.; Rinsland, P.L.; Goldman, A.; Brault, J.W.; Stokes, G.M. Ground-based infrared spectroscopic measurements of atmospheric hydrogen cyanide. J. Geophys. Res. Ocean. 1982, 87, 11119–11125. [Google Scholar] [CrossRef]
  70. Rinsland, C.P.; Jones, N.B.; Connor, B.J.; Logan, J.A.; Pougatchev, N.S.; Goldman, A.; Murcray, F.J.; Stephen, T.M.; Pine, A.S.; Zander, R.; et al. Northern and southern hemisphere ground-based infrared spectroscopic measurements of tropospheric carbon monoxide and ethane. J. Geophys. Res. Atmos. 1998, 103, 28197–28217. [Google Scholar] [CrossRef]
  71. Zander, R.; Mahieu, E.; Demoulin, P.; Duchatelet, P.; Roland, G.; Servais, C.; De Mazière, M.; Reimann, S.; Rinsland, C.P. Our changing atmosphere: Evidence based on long-term infrared solar observations at the Jungfraujoch since 1950. Sci. Total Environ. 2008, 184–195. [Google Scholar] [CrossRef]
  72. Frey, M.; Sha, M.K.; Hase, F.; Kiel, M.; Blumenstock, T.; Harig, R.; Surawicz, G.; Deutscher, N.M.; Shiomi, K.; Franklin, J.E.; et al. Building the COllaborative Carbon Column Observing Network (COCCON): Long-term stability and ensemble performance of the EM27/SUN Fourier transform spectrometer. Atmos. Meas. Tech. 2019, 12, 1513–1530. [Google Scholar] [CrossRef] [Green Version]
  73. Gisi, M.; Hase, F.; Dohe, S.; Blumenstock, T. Camtracker: A new camera controlled high precision solar tracker system for FTIR-spectrometers. Atmos. Meas. Tech. 2011, 4, 47–54. [Google Scholar] [CrossRef] [Green Version]
  74. Keppel-Aleks, G.; Toon, G.; Wennberg, P.; Deutscher, N. Reducing the impact of source brightness fluctuations on spectra obtained by Fourier-transform spectrometry. Appl. Opt. 2007, 46, 4774–4779. [Google Scholar] [CrossRef] [PubMed] [Green Version]
  75. Torres, B.; Toledano, C.; Berjón, A.; Fuertes, D.; Molina, V.; Gonzalez, R.; Canini, M.; Cachorro, V.E.; Goloub, P.; Podvin, T.; et al. Measurements on pointing error and field of view of Cimel-318 Sun photometers in the scope of AERONET. Atmos. Meas. Tech. 2013, 6, 2207–2220. [Google Scholar] [CrossRef] [Green Version]
  76. Elsey, J.; Coleman, M.D.; Gardiner, T.; Shine, K.P. Can Measurements of the Near-Infrared Solar Spectral Irradiance be Reconciled? A New Ground-Based Assessment between 4000 and 10,000 cm−1. Geophys. Res. Lett. 2017, 44, 10071–10080. [Google Scholar] [CrossRef]
  77. Almansa, A.F.; Cuevas, E.; Barreto, A.; Torres, B.; García, O.E.; García, R.D.; Velasco-Merino, C.; Cachorro, V.E.; Berjón, A.; Mallorquín, M.; et al. Column Integrated Water Vapor and Aerosol Load Characterization with the New ZEN-R52 Radiometer. Remote Sens. 2020, 12, 1424. [Google Scholar] [CrossRef]
  78. Schmid, B.; Spyak, P.R.; Biggar, S.F.; Wehrli, C.; Sekler, J.; Ingold, T.; Mätzler, C.; Kämpfer, N. Evaluation of the applicability of solar and lamp radiometric calibrations of aprecision sun photometer operating between 300 and 1025 nm. Appl. Opt. 1998, 37, 3923–3941. [Google Scholar] [CrossRef]
  79. Schmid, B.; Michalsky, J.J.; Slater, D.W.; Barnard, J.C.; Halthore, R.N.; Liljegren, J.C.; Holben, B.N.; Eck, T.F.; Livingston, J.M.; Russell, P.B.; et al. Comparison of columnar water-vapor measurements from solar transmittance methods. Appl. Opt. 2001, 40, 1886–1896. [Google Scholar] [CrossRef] [Green Version]
  80. Kasten, F.; Young, A.T. Revised optical air mass tables and approximation formula. Appl. Opt. 1989, 28, 4735–4738. [Google Scholar] [CrossRef]
  81. Bodhaine, B.A.; Wood, N.B.; Dutton, E.G.; Slusser, J.R. On Rayleigh Optical Depth Calculations. J. Atmos. Ocean Tech. 1999, 16, 1854–1861. [Google Scholar] [CrossRef]
  82. Shaw, G.E. Solar spectral irradiance and atmospheric transmission at Mauna Loa Observatory. Appl. Opt. 1982, 21, 2006–2011. [Google Scholar] [CrossRef]
  83. Shaw, G.E. Sun Photometry. Bull. Am. Meteor. Soc. 1983, 64, 4–10. [Google Scholar] [CrossRef] [Green Version]
  84. Wehrli, C. Calibrations of filter radiometer for determination of atmospheric optical depth. Metrologia 2000, 37, 419. [Google Scholar] [CrossRef]
  85. Holben, B.N.; Tanré, D.; Smirnov, A.; Eck, T.F.; Slutsker, I.; Abuhassan, N.; Newcomb, W.W.; Schafer, J.S.; Chatenet, B.; Lavenu, F.; et al. An emerging ground-based aerosol climatology: Aerosol optical depth from AERONET. J. Geophys. Res. Atmos. 2001, 106, 12067–12097. [Google Scholar] [CrossRef]
  86. Smirnov, A.; Holben, B.; Lyapustin, A.; Slutsker, I.; Eck, T. AERONET processing algorithms refinement. In Proceedings of the AERONET Workshop, El Arenosillo, Spain, 10–14 May 2004. [Google Scholar]
  87. King, M.D.; Byrne, D.M. A Method for Inferring Total Ozone Content from the Spectral Variation of Total Optical Depth Obtained with a Solar Radiometer. J. Atmos. Sci. 1976, 33, 2242–2251. [Google Scholar] [CrossRef] [Green Version]
  88. Eck, T.F.; Holben, B.N.; Reid, J.S.; O’Neill, N.T.; Schafer, J.S.; Dubovik, O.; Smirnov, A.; Yamasoe, M.A.; Artaxo, P. High aerosol optical depth biomass burning events: A comparison of optical properties for different source regions. Geophys. Res. Lett. 2003, 30. [Google Scholar] [CrossRef] [Green Version]
  89. O’Neill, N.T.; Eck, T.F.; Holben, B.N.; Smirnov, A.; Dubovik, O.; Royer, A. Bimodal size distribution influences on the variation of Angstrom derivatives in spectral and optical depth space. J. Geophys. Res. Atmos. 2001, 106, 9787–9806. [Google Scholar] [CrossRef]
  90. O’Neill, N.T.; Eck, T.F.; Smirnov, A.; Holben, B.N.; Thulasiraman, S. Spectral discrimination of coarse and fine mode optical depth. J. Geophys. Res. Atmos. 2003, 108. [Google Scholar] [CrossRef]
  91. Junge, C. The size distribution and aging of natural aerosols as determined from electrical and optical data on the atmosphere. J. Meteorol. 1955, 12, 13–25. [Google Scholar] [CrossRef] [Green Version]
  92. Hidy, G.M.; Mohnen, V.; Blanchard, C. Tropospheric aerosols: Size-differentiated chemistry and large-scale spatial distributions. J. Air Waste Manag. Assoc. 2013, 63, 377–404. [Google Scholar] [CrossRef]
  93. Hidy, G.M. Atmospheric Aerosols: Some Highlights and Highlighters, 1950 to 2018. Aerosol Sci. Eng. 2019, 3, 1–20. [Google Scholar] [CrossRef]
  94. García, R.D.; García, O.E.; Cuevas, E.; Cachorro, V.E.; Romero-Campos, P.M.; Ramos, R.; de Frutos, A.M. Solar radiation measurements compared to simulations at the BSRN Izaña station. Mineral dust radiative forcing and efficiency study. J. Geophys. Res. Atmos. 2014, 119, 179–194. [Google Scholar] [CrossRef]
  95. Long, C.N.; Ackerman, T.P. Identification of clear skies from broadband pyranometer measurements and calculation of downwelling shortwave cloud effects. J. Geophys. Res. Atmos. 2000, 105, 15609–15626. [Google Scholar] [CrossRef]
  96. Herber, A.; Thomason, L.W.; Gernandt, H.; Leiterer, U.; Nagel, D.; Schulz, K.H.; Kaptur, J.; Albrecht, T.; Notholt, J. Continuous day and night aerosol optical depth observations in the Arctic between 1991 and 1999. J. Geophys. Res. Atmos. 2002, 107. [Google Scholar] [CrossRef]
  97. Stone, R. Monitoring aerosol optical depth at Barrow, Alaska and South Pole: Historical overview, recent results, and future goals. In Proceedings of the 9th Workshop Italian Research on Antarctic Atmosphere, Rome, Italy, 22–24 October 2001. [Google Scholar]
  98. Ortiz De Galisteo Torres, B.; Berjon, A.; Goloub, P.; Li, Z.; Blarel, L.; Abboud, I.; Cuevas, E.; Stock, M.; Schulz, K.H.; Virkkula, A. Evaluation of sun photometer capabilities for retrievals of aerosol optical depth at high latitudes: The POLAR-AOD intercomparison campaigns. Atmos. Environ. 2012, 4–17. [Google Scholar] [CrossRef] [Green Version]
  99. Marenco, F.; di Sarra, A.; Luisi, J.D. Methodology for determining aerosol optical depth from brewer 300–320-nm ozone measurements. Appl. Opt. 2002, 41, 1805–1814. [Google Scholar] [CrossRef]
  100. Campanelli, M.; Nakajima, T.; Olivieri, B. Determination of the solar calibration constant for a sun-sky radiometer: Proposal of an in-situ procedure. Appl. Opt. 2004, 43, 651–659. [Google Scholar] [CrossRef] [Green Version]
  101. Gardiner, T.D.; Coleman, M.; Browning, H.; Tallis, L.; Ptashnik, I.V.; Shine, K.P. Absolute high spectral resolution measurements of surface solar radiation for detection of water vapour continuum absorption. Philos. Trans. R. Soc. A. 2012, 370, 2590–2610. [Google Scholar] [CrossRef]
  102. Menang, K.P.; Coleman, M.D.; Gardiner, T.D.; Ptashnik, I.V.; Shine, K.P. A high-resolution near-infrared extraterrestrial solar spectrum derived from ground-based Fourier transform spectrometer measurements. J. Geophys. Res. Atmos. 2013, 118, 5319–5331. [Google Scholar] [CrossRef] [Green Version]
  103. Feist, D.; Arnold, S.; Hase, F.; Ponge, D. Rugged optical mirrors for Fourier transform spectrometers operated in harsh environments. Atmos. Meas. Tech. 2016, 9, 2381–2391. [Google Scholar] [CrossRef] [Green Version]
  104. Hase, F. Improved instrumental line shape monitoring for the ground-based, high-resolution FTIR spectrometers of the Network for the Detection of Atmospheric Composition Change. Atmos. Meas. Tech. 2012, 5, 603–610. [Google Scholar] [CrossRef] [Green Version]
  105. Gasteiger, J.; Wiegner, M.; Groß, S.; Freudenthaler, V.; Toledano, C.; Tesche, M.; Kandler, K. Modelling lidar-relevant optical properties of complex mineral dust aerosols. Tellus B 2011, 63, 725–741. [Google Scholar] [CrossRef] [Green Version]
  106. García, M.I.; Van Drooge, B.L.; Rodríguez, S.; Alastuey, A. Speciation of organic aerosols in the Saharan Air Layer and in the free troposphere westerlies. Atmos. Chem. Phys. 2017, 17, 8939–8958. [Google Scholar] [CrossRef] [Green Version]
  107. Otto, S.; de Reus, M.; Trautmann, T.; Thomas, A.; Wendisch, M.; Borrmann, S. Atmospheric radiative effects of an in situ measured Saharan dust plume and the role of large particles. Atmos. Chem. Phys. 2007, 7, 4887–4903. [Google Scholar] [CrossRef] [Green Version]
  108. Levy, R.C.; Remer, L.A.; Tanré, D.; Kaufman, Y.J.; Ichoku, C.; Holben, B.N.; Livingston, J.M.; Russell, P.B.; Maring, H. Evaluation of the Moderate-Resolution Imaging Spectroradiometer (MODIS) retrievals of dust aerosol over the ocean during PRIDE. J. Geophys. Res. Atmos. 2003, 108. [Google Scholar] [CrossRef]
  109. Paton-Walsh, C.; Jones, N.; Wilson, S.; Meier, A.; Deutscher, N.; Griffith, D.; Mitchell, R.; Campbell, S. Trace gas emissions from biomass burning inferred from aerosol optical depth. Geophys. Res. Lett. 2004, 31. [Google Scholar] [CrossRef] [Green Version]
  110. Paton-Walsh, C.; Jones, N.B.; Wilson, S.R.; Haverd, V.; Meier, A.; Griffith, D.W.T.; Rinsland, C.P. Measurements of trace gas emissions from Australian forest fires and correlations with coincident measurements of aerosol optical depth. J. Geophys. Res. Atmos. 2005, 110. [Google Scholar] [CrossRef] [Green Version]
  111. Paton-Walsh, C.; Emmons, L.K.; Wilson, S.R. Estimated total emissions of trace gases from the Canberra Wildfires of 2003: A new method using satellite measurements of aerosol optical depth and the MOZART chemical transport model. Atmos. Chem. Phys. 2010, 10, 5739–5748. [Google Scholar] [CrossRef] [Green Version]
Figure 1. Example of an Fourier Transform Infrared (FTIR) high-resolution solar spectrum for the 1000–2500 nm spectral region, acquired at spectral resolution of 0.02 cm 1 , for typical measurement conditions at Izaña Observatory (IZO; 19 May 2020 at 09:00 UTC with a solar zenith angle of ∼30 and a precipitable water vapor (PWV of ∼2.5 mm) (upper panel): the dotted black lines indicate the position of the seven narrow spectral bands selected for FTIR Aerosol Optical Depth (AOD) retrievals. Each sub-plot (lower panels) displays the measured transmittance spectrum within the spectral micro-windows, the truncated one at 0.5 cm 1 as well as the simulated transmittance for actual (2.5 mm), and extreme (15 mm and 25 mm) PWV values using the line-by-line PROFFWD model. The main interfering species are also displayed for each spectral band.
Remotesensing 12 03148 g001
Figure 2. CE318-AERONET filter response function for the channels centred at (a) 1020 nm and (b) 1640 nm and FTIR coincident micro-windows (B1 and B4).
Remotesensing 12 03148 g002
Figure 3. Langley–Plot example at IZO on May 19, 2020 for two spectral bands: (a) B4, centred at 1636.00 nm, and (b) B7, centred at 2314.20 nm. The two different fitting analyses correspond to morning (am) and afternoon (pm) measurements performed for optical air masses between 2 and 5 (bold blue dots). This is the same day analyzed in the FTIR micro-windows selection in Section 5.1 and Figure 1.
Remotesensing 12 03148 g003
Figure 4. Time series of the FTIR calibration coefficient V 0 , λ (in W/cm 2 sterad cm 1 ) for the seven FTIR spectral bands from May 2019 to May 2020: solid lines are the smoothing splines of the V 0 , λ throughout the 1-year period. The error bars standing for the standard deviation of V 0 , λ (3 orders of magnitude lower than V 0 , λ ) are included for each Langley day. Black arrows mark important changes in the calibration coefficients.
Remotesensing 12 03148 g004
Figure 5. Time series of the daily mean spectral AOD for the seven FTIR spectral bands from May 2019 to May 2020 at IZO.
Remotesensing 12 03148 g005
Figure 6. Spectral dependence of the FTIR AOD calculated at IZO for mineral dust conditions ( A O D A E , 1640 > = 0.074, N = 2976) and for pristine conditions ( A O D A E , 1640 < 0.074, N = 21,317): lower and upper boundaries for each box are the 25th and 75th percentiles, the solid line is the median value, and hyphens are the maximum and minimum values. The regression fit to a power law is also included for each AOD range.
Remotesensing 12 03148 g006
Figure 7. Time series of the AERONET and FTIR AOD values from May 2019 to May 2020 at IZO for FTIR B4 and AERONET channel centred at 1640 nm: the AOD evolution in a 11-day period in July 2019 is also displayed in the zoom.
Remotesensing 12 03148 g007
Figure 8. Scatterplot for the coincident AERONET-FTIR AOD values from May 2019 to May 2020 considering the FTIR B1 and B4 micro-windows: the number of coincidences (N), the fitting parameters, and correlation coefficient (R) are displayed in the legend.
Remotesensing 12 03148 g008
Figure 9. AOD differences (AERONET-FTIR) between the two coincident spectral bands for AERONET (1020 and 1640 nm) and FTIR (B1 and B4) with respect to (a) optical air mass, (b) time, (c) PWV, and (d) AOD at 1640 nm from AERONET (AOD A E , 1640 ): the solid curves in (a) represent the U95 uncertainty limit, while the black arrows in (b) indicate the Langley days used for the FTIR absolute calibration. The AOD differences in (c,d) are displayed as box plots, where the lower and upper boundaries for each box are the 25th and 75th percentiles, the solid line is the median value, and the hyphens are the maximum and minimum values. N is the number of cases in each box.
Remotesensing 12 03148 g009
Figure 10. AE- A O D A E , 1640 pair distributions: AE calculated with the seven FTIR B1-B7 bands (in red), AE retrieved from MOPSMAP for the same spectral bands for different mineral content (MOP-MI, displayed with a green scale) and water-soluble (WASO) component (in the colorbar), AEs from AERONET VIS-NIR channels between 440–870 nm (in blue), and AE calculated using NIR-SWIR AERONET channels between 870–1640 nm (AERONET NIR-SWIR, in brown).
Remotesensing 12 03148 g010
Table 1. Description of the seven spectral micro-windows used for the FTIR AOD retrievals: spectral range and bandwidth (in nm). It also includes the mean atmospheric transmittance and the intra-band coefficient of variation (CV, in %) given by the ratio between the standard deviation of the transmittance and the mean value in each band when simulating with different PWV values (2.5, 15, and 25 mm). The last column corresponds to the mean and the standard deviation ( σ ) of the intra-band trasmittance CV time series considering all available FTIR solar measurements between May 2019 and May 2020. Micro-windows in bold represent those bands coincident with CE318-AERONET.
Spectral RangeBandwidthMean TransmittanceTransmittance CVTransmittance CV
(nm)(nm)PWV = 2.5/15/25 mmPWV = 2.5/15/25 mm (%)Mean, σ (%)
B1: 1020.55–1021.250.70.9985/0.9982/0.99800.38/0.38/0.390.55, 0.04
B2: 1237.75–1238.7510.9983/0.9957/0.99340.35/0.83/1.380.52, 0.16
B3: 1557.75–1558.7510.9959/0.9944/0.99300.68/0.72/0.860.53, 0.03
B4: 1635.50–1636.5010.9845/0.9847/0.98470.89/0.89/0.891.28, 0.34
B5: 2132.90–2133.9010.9975/0.9970/0.99590.25/0.24/0.310.30, 0.07
B6: 2191.50–2192.5010.9971/0.9959/0.99470.43/0.43/0.450.61, 0.27
B7: 2313.80–2314.600.80.9944/0.9934/0.99241.19/1.18/1.191.05, 0.13
Table 2. Main statistics of the Langley analysis performed on 19 May 2020: shown are the standard deviation of the linear least-squares fit ( σ f i t ), coefficient of correlation (R), and the fit parameters (slope and intercept) in logarithm scale.
Spectral BandB1: 1020.90 nmB2: 1238.25 nmB3: 1558.25 nmB4: 1636.00 nmB5: 2133.40 nm
Langley Time Perioda.m.p.m.a.m.p.m.a.m.p.m.a.m.p.m.a.m.p.m.
σ f i t 3.9 × 10 4 6.8 × 10 4 2.7 × 10 4 3.6 × 10 4 2.7 × 10 4 2.7 × 10 4 2.8 × 10 4 2.4 × 10 4 2.4 × 10 4 2.0 × 10 4
R−0.9994−0.9988−0.9998−0.9996−0.9982−0.9986−0.9991−0.9993−0.9988−0.9992
Slope−0.0138−0.0159−0.0135−0.0155−0.0041−0.0059−0.0058−0.0075−0.0043−0.0059
σ S l o p e 2.3 × 10 4 3.6 × 10 4 1.6 × 10 4 1.9 × 10 4 1.6 × 10 4 1.4 × 10 4 1.7 × 10 4 1.2 × 10 4 1.4 × 10 4 1.1 × 10 4
Intercept18.736418.738818.645318.645618.499418.498918.449718.449218.043818.0420
σ I n t e r c e p t 8.0 × 10 4 1.1 × 10 3 5.6 × 10 4 6.1 × 10 4 5.6 × 10 4 4.5 × 10 4 5.8 × 10 4 4.0 × 10 4 4.9 × 10 4 3.4 × 10 4
B6: 2192.00 nmB7: 2314.20 nm
Langley Time Perioda.m.p.m.a.m.p.m.
σ f i t 2.1 × 10 4 1.8 × 10 4 2.1 × 10 4 2.8 × 10 4
R−0.9980−0.9990−0.9990−0.9989
Slope−0.0031−0.0048−0.0050−0.0071
σ S l o p e 1.3 × 10 4 9.7 × 10 5 1.3 × 10 4 1.5 × 10 4
Intercept18.004318.002617.920017.9182
σ I n t e r c e p t 4.4 × 10 4 3.1 × 10 4 4.4 × 10 4 4.7 × 10 4
Table 3. Main statistics of the AERONET and FTIR AOD comparison for the coincident spectral bands, considering the micro-windows and the degraded FTIR products: MD stands for the absolute mean AOD difference (AERONET-FTIR), σ is the standard deviation, and RMSE is the root-mean-squared error of the differences. The fit parameters are also included: correlation coefficient (R), slope, and intercept.
Micro-WindowsConvolution with CE318
Response Function
Spectral Band1020 nm1640 nm1020 nm1640 nm
MD0.0022−0.00420.00230.0012
σ 0.00470.00400.00450.0037
RMSE0.00520.00570.00500.0039
R0.99300.99220.99370.9933
Slope0.97180.97150.97510.9762
Intercept0.0028−0.00360.00290.0015

