Abstract
Apparent thermal inertia (ATI) is a remote sensing-based thermophysical approximation used to estimate surface properties such as particle size or soil moisture, but is subject to oversimplifications if uniform surface materials are assumed. Geological surfaces realistically contain multiple types of materials that are represented by mixed pixels in a digital image that can dramatically affect the derived thermal response. Thus, the current surface uniformity assumption can lead to erroneous calculations. To define how these mixed particle size surfaces affect ATI, a multi-instrument, multi-spectral study was conducted at the North Coulee rhyolite flow, Mono Domes (California). This flow is compositionally homogenous with particle sizes ranging from silt size to boulders, making it an ideal location to understand the relationship between particle size distributions and ATI. Multispectral data from orbital sensors with increasing spatial resolutions were analyzed in combination with samples, GPS, and photogrammetry data collected in the field. The surface particle size characteristics divided into three broad categories (fine, moderate, and coarse) were mapped based on WorldView-2 visible data and field observations. Broad categories were validated using a 3-dimensional point cloud derived from structure-from-motion (SfM) methods using field photographs. The areal percentage of each category within an ATI pixel was derived to populate a lookup table (LUT) with the corresponding ATI values to quantify the effect of mixed pixels. Lower ATI values are dominated by fine particles (sand and dust) as expected, however, surfaces with the highest values were predominately moderate-sized cobbles. Pixels with a high areal percentage of coarse sizes display an intermediate ATI value, suggesting that either self-shadowing or trapping of fines lowers the ATI value. Alternatively, areas with a majority of moderate particle sizes have less shadowing and efficient vertical sorting of smaller material, as seen in field data, leaving a thermal derived response indicative of the dominating particle size. This study demonstrates how a uniform property assumption can cause erroneous derived thermal modeling, particularly over surfaces with a high percentage of boulders and large particle sizes. Future thermophysical studies of Earth or other planetary surfaces can greatly benefit from a multi-sensor approach combined with a higher spatial resolution visible dataset.
1. Introduction
Lava flows and coulees provide information about past volcanic and subsequent eolian processes. For example, compositional or vesicularity differences between lava flow outcrops can suggest the presence of changing magma conditions and emplacement properties, which can, in turn, provide critical information about the evolution of the magma chamber [1,2,3]. Particle size on a lava flow can also be directly related to transport distance from the vent or the folding regime of the lava itself [4,5]. However, later deposition, erosion, and transportation of finer-grained materials by eolian processes can cover or obscure the small-scale details of these surfaces. The source of these fines may be derived from the lava itself, but the source may be difficult to determine, especially for remote or hazardous areas. Therefore, it is problematic to assume that the fines have the same spectral and compositional properties as the bedrock. The first step in investigating these mantled lava surfaces using remote sensing data is to accurately identify the composition and varied particle size distributions. This paper defines a relationship between the subpixel mixing of different particle sizes on a compositionally-homogenous lava surface and the corresponding thermo-spectral response. The goal is to ultimately quantify particle size using remotely-acquired thermal infrared (TIR) data.
TIR remote sensing data are invaluable to investigate lava surfaces in inaccessible or hazardous areas as it provides information on the surface thermophysical properties such as particle size, the major rock-forming mineral compositions, and/or the micron-scale roughness such as vesicularity [6,7,8]. However, mixed surfaces complicate the accurate derivation of these values because current mapping approaches assume uniform material properties at the spatial resolution of the data (i.e., no mixing at the sub-pixel scale). This singular value for an entire pixel typically does not represent the real surface (i.e., sub-pixel mixing). This complication can be quantified on surfaces with a homogenous composition where variability in the derived thermophysical data can be solely attributed to the mixing of different particle sizes. For example, the detection of coarse blocks in a pixel may be obscured by the mantling of fines (vertical layering) or a mixture of particle sizes (horizontal or checkerboard mixing pattern) may be misinterpreted as a single unit. Thus, our objective is to determine an approach using remote sensing data to identify different particle size mixtures and the presence of any vertical layering.
This study uses a multi-instrument multi-spatial resolution approach to define how subpixel variations of different particle sizes affect derived ATI values. Using visible near-infrared (VNIR) from WorldView-2 at 0.5 m spatial resolution, an interpretation of the surface particle size distributions were created close to the scale of field studies. To define the thermophysical surface properties, TIR data at 90 m and VNIR data at 15 m from the Advanced Spaceborne Thermal Emission and Reflectance Radiometer (ASTER) orbital instrument were used to calculate the ATI of the surface. This study aims to: (1) determine the particle size distributions on the surface using orbital data; (2) quantitatively define the areal percentages of those sizes within an ATI pixel, and (3) understand the constraints on the particle size variations that produce similar ATI values.
2. Background
2.1. Apparent Thermal Inertia and Particle Size
Thermal inertia measures the resistance of a material to changing temperature over the diurnal cycle. It is defined as
with units of Jm−2K−1s−1/2, where k, ρ, and c are the thermal conductivity, density, and thermal capacity, respectively. However, these material properties cannot be directly derived from remote sensing orbital data. Therefore, the ATI equation
was developed for Earth remote sensing as an approximation for thermal inertia [9]. The denominator (ΔT) is the temperature difference in two thermal images acquired over the diurnal cycle, with one day and one-night collection. The numerator (1 − α) is calculated using the daytime VNIR albedo as α [10]. Albedo is typically computed using both VNIR and short-wave infrared (SWIR) wavelengths [11], but the ASTER SWIR data have not been available since April 2008 due to a malfunction in the subsystem. Therefore, only an average of the three ASTER VNIR bands is applied to estimate the albedo [12]. However, the compositional uniformity of the flow’s surface means that there is very little spectral difference in the SWIR region and the loss in this study does not affect the results substantially. It should be noted that the ATI algorithm is applied differently in planetary remote sensing [13]. For example, ATI commonly describes the change of thermal inertia of layered surfaces for Mars with the time of day or planetary season (e.g., [14]).
I = √kρc
ATI = (1 − α)/ΔT,
ATI from VNIR and TIR data allows for the remote investigation of the surface material thermophysical properties. Thermal inertia (and ATI) is primarily controlled by the thermal conductivity of the targeted surface, which is a measure of the ability of a material to conduct heat or the rate heat passes through a specific thickness of a substance. Presley and Christensen [8] demonstrated thermal conductivity is most dependent on particle size and morphology of the surface material. A model describing the relationship between changes in particle size, soil density, and soil moisture with thermal inertia was proposed by Cracknell and Xue [15]. Some specific relationships between thermal inertia and particle size can be modeled for the Earth’s surface using ATI [16], whereas in other cases, soil moisture will dominate the variance of remotely sensed ATI [17]. Soil density and moisture are not a factor for the dome’s surface, therefore with the additional benefit of uniform composition, changes in ATI should be solely a factor of particle size.
2.2. Sub-Pixel Particle Size Mixtures
The minimum spatial unit of a digital image, the pixel, constrains the measurement scale of surface variability in the image. Variations or mixtures of materials below the pixel scale are not detected with traditional pixel-based analysis tools, especially for satellite data. The assumption of homogenous surface characteristics within image pixels may be valid for some areas, but this is not likely to be applicable for most complex surfaces. Pixels within satellite data with a lower spatial resolution are more likely to contain a mixed surface of two or more material types, thus the value will be a combination or average of the separate surface components present. The mixed pixel problem has been examined by numerous techniques and assumptions [7,18,19]. The distribution of pure and mixed pixels within an image is a function of the spatial resolution of the instrument and the complexity of the surface. To understand the relationship between mixed pixels and ATI, this study focuses on a young rhyolite lava flow with homogenous composition and highly variable particle size distributions.
Laboratory studies of thermal conductivity have examined the effect of different particle sizes on thermal inertia [8,20]. They showed that the thermal conductivity derived value reflects the largest particles in the particulate sample and up to 85–95% of the particles by weight within the sample are smaller than or equal to the derived particle size. Therefore, this suggests that particle sizes derived from thermal inertia containing complex surfaces could be skewed toward the maximum particle size present. However, whether this scales to mixed surfaces with larger particle sizes such as boulders has not been thoroughly investigated.
2.3. Geologic Setting of North Coulee
The Mono-Inyo Craters system, located on the east-dipping faults of the western edge of the Basin and Range Province in California, contains rhyolite flows that initially formed around 40,000 years ago [21,22,23]. Seismic and magnetotelluric studies of the area suggest that these domes and coulees formed from dikes fed by a north-south elongate magma chamber at ~10 to 20 km depth [24,25]. North Coulee, the focus of this study, has a homogenous rhyolitic composition that ranges between 75.4–77 wt. % SiO2 [26,27]. It was emplaced just over 1000 years before the present and is mantled in places with more than 10 cm of tephra deposits from younger rhyolitic eruptions [28]. The surface of the North Coulee has different mixtures of particle sizes (from ash to large boulders) ranging from predominantly uniform end-members (containing a single particle size) to the presence of vertical layering and/or horizontal mixing. A previous study by Price et al. [29] identified heavily-mantled versus non-mantled parts of the North Coulee surface using ATI. However, their study did not investigate the presence of mantling at the pixel-scale with horizontal mixing or complex surfaces, which is a focus of our study. The homogenous composition of the North Coulee with the variation in particle size provides an ideal surface to investigate their relationship. Finally, the vegetation is limited to small plants and pine trees, which are mostly confined to areas of thick mantling deposits.
2.4. Photogrammetry
One approach to quantify fine-scale topography, such as particle size distribution, below the spatial resolution of available remote sensing data is using ground-based structure-from-motion (SfM). This technique is used to create high spatial resolution digital terrain models (DTM) to investigate the surface structure and dimensional elements of lava flows and mantled surfaces. Specifically, SfM generates 3-dimensional point clouds that provide a base dataset for calculating other surface metrics such as roughness.
3. Methods
The primary goal of this study was to determine how mixtures of different particle sizes affect the derived ATI value from satellite data. The multi-instrument, multi-spectral approach in this study utilizes both VNIR and TIR datasets (Figure 1). Two VNIR datasets were utilized, with progressively higher spatial resolutions. VNIR data from WorldView-2 were used to map the flow surface into different particle size categories as well as the locations of trees. These mapping categories were visually identified, inspected, and documented in the field during a campaign between 23–30 July 2014. ASTER TIR data along with concurrent ASTER VNIR data were used to create the ATI image product. Due to the difference in spatial resolution, the albedo product (15 m), calculated by averaging the reflectance from three ASTER VNIR bands, was resampled to match the 90 m spatial resolution of the ASTER TIR temperature data to complete the ATI calculation.
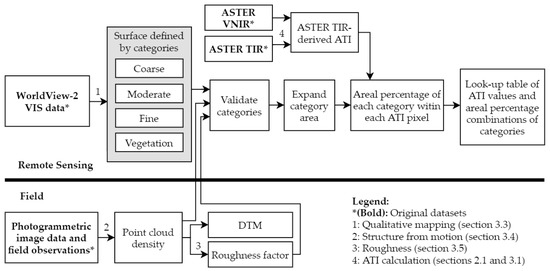
Figure 1.
Flowchart of the methodology used to determine the relationship between particle size and apparent thermal inertia (ATI).
3.1. Datasets
Orbital data were acquired for nearly coincidental dates available with the timing of the fieldwork campaign (Table 1). These included 15 m/pixel VNIR and 90 m/pixel TIR data from the ASTER instrument [30], as well as 0.50 m/pixel panchromatic and 2 m/pixel multispectral data from the WorldView-2 instrument [31]. ASTER has three bands in the VNIR ranging from 0.52 to 0.86 µm and five bands in the TIR ranging from 8.125 to 11.65 µm. The WorldView-2 panchromatic image spans a spectral range of 0.450–0.800 µm and the 8 band multispectral bands range from 0.4–1.040 µm.

Table 1.
Description of the datasets used with instrument spatial resolution, spectral range, and scientific applications.
To limit the effect of changes in surface properties over time, all data were collected in the shortest time window possible. ASTER day and nighttime data were collected within 30 hours of each other and the WorldView-2 data was within two months of the ASTER data. ASTER level 2 ground surface temperature (AST_08), level 2 VNIR surface reflectance (AST_07XT), and level 2 TIR surface radiance (AST_09T) data were used to calculate ATI [32].
3.2. Field Campaign
A field campaign was conducted at the North Coulee site from 23–30 July 2014 with the main goal to identify and map the variance of particle sizes on surfaces that correspond to specific pixels in the ATI data. Despite the presence of past mining roads, which allowed relatively easy access to the top of the flow, most of the surface is difficult to access. Therefore, sampling sites were selected near the flow margins and roads. Flow fronts were investigated from the ground level at the base of the flows. Four main study areas were chosen for analysis in greater detail; two sloped flow margins, “the Bowl” (a depression on the top of the Coulee, used for SfM data collection), and a large fine-grained deposit on the western edge of the flow (Figure 2). These areas were selected to investigate a pure pixel area with a single size end-member (e.g., the pumice deposit) and pixel areas with various particle size mixtures.
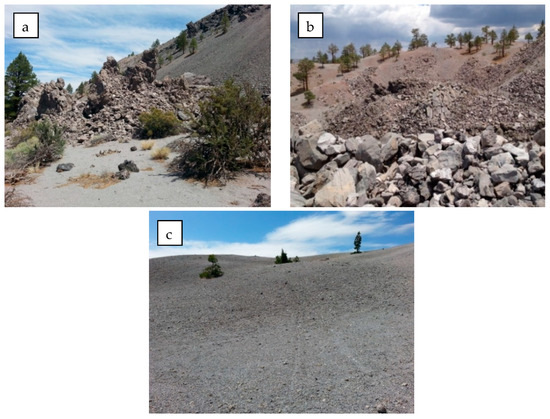
Figure 2.
Photographs of the sampling areas investigated during the field campaign: (a) slope of the coulee flow front, (b) “the Bowl” photogrammetry site, and (c) a fine-grained deposit location. These sites demonstrate the range of particle sizes present on the surface of the North Coulee with both mixed and pure end-member samples.
Additional data were acquired during the field campaign including differential global position system (dGPS) and high spatial resolution color images from a Nikon D7100 DSLR (24 MP). Samples were collected to assess the particle size distribution on the surface and the relationship to roughness calculated from SfM data which describes the deviation of the real surface from the estimated surface slope defined by a vector length. At each of the study sites, the mantling depth was estimated with particular care taken to identify the range of particle sizes present. Particle size boundaries were geolocated using the GPS with a spatial accuracy within 30–50 cm. The visible photographs acquired specifically for SfM analysis were later processed to produce high spatial resolution point clouds, each georeferenced by four dGPS locations. These data provided quantitative particle size measurements as well as the ability to estimate the percentage of shadowing.
3.3. Surface Units
To map the particle size distributions and mixing on the surface remotely, four categories were defined based on qualitative analysis of WorldView-2 VIS panchromatic data (Table 2, Figure 3). Three of these categories (e.g., fine, moderate, and coarse-grained surfaces) identify the presence of particle size ranges based on characteristics in the visible data such as the presence of shadowing and variability of the surface, whereas the fourth delineates the location of vegetation. The coarse category represents the location of the largest particle sizes on the North Coulee, consisting of large lava blocks or boulders [33]. These areas can be identified as highly variable from the highest degree of contrast in visible reflectance and significant amounts of shadowing present in the WorldView-2 data. The moderate category represents the intermediate particle size (~20 cm or cobbles) and is based on the presence of intermediate reflectance contrast and minor shadowing. The fine regions represent particles ranging in size from granules to silt and are identified by the low reflectance variability and no visible shadowing. Vegetation (mostly moderate pines) was easily identified in the high-spatial-resolution data. These were important to map because the trees mask the surface material and complicate the interpretation of ATI for those pixels. Using the described criteria, the four categories were mapped on the flow’s surface. This mapping approach was then validated during the field-campaign by measuring particle sizes and geolocating features such as trees and surface unit boundaries.
Table 2.
Description of the three particle size category types (plus vegetation) used to classify the image based on the surface characteristics. Roughness was calculated from photogrammetry. Colors correlate to the categories shown in Figure 3.
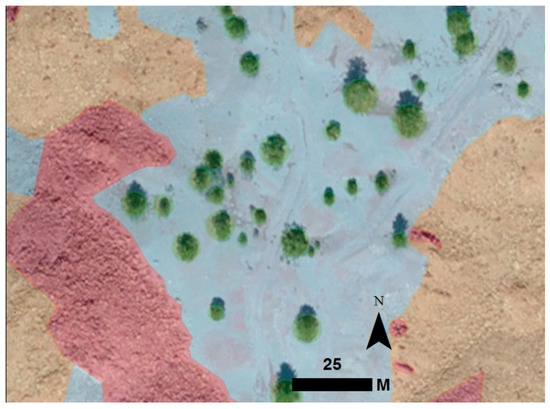
Figure 3.
Examples of the four categories overlain on the visible WorldView-2 data used for this qualitative mapping. The colors of the regions correlate to the categories in Figure 2.
3.4. Photogrammetry Dataset and Category Assessment
At one of the field sites, dubbed “the Bowl” for its distinct topographically-depressed shape, over 12,000 digital photographs were collected for SfM photogrammetry analysis of the particle size distributions. This location had a significant variation in particle sizes and was larger than one ASTER ATI pixel, making it an ideal location to investigate the particle heterogeneity influence of ATI (Figure 4). Photogrammetry processing produced a 3D dense point cloud and DTM at a 5 cm spatial resolution, geolocated using GPS coordinates. This provided the most surface detail of all the datasets in this study. The first application of these data was to qualitatively assess the accuracy of the defined surface categories. Using the point cloud and field photographs, the boundaries between the categories were refined by overlaying the shapefiles on the point cloud and identifying any errors or inconsistencies. After the accuracy of the mapping method was determined, the higher spatial resolution data were used as further training to extend the categories on the flow’s surface using the WorldView-2 data.
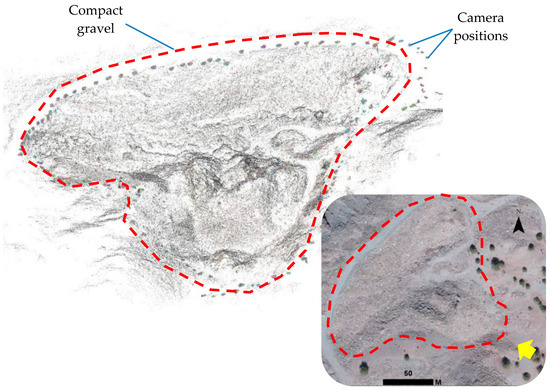
Figure 4.
3D rendering of the point cloud from the photographs taken during the field campaign. The majority of gray-colored points represent rhyolite blocks and grains, where camera locations are lightly colored spheres along the perimeter of usable data (outlined in red). Inset: WorldView-2 image of “the Bowl” area on the North Coulee (inset is shown lower right). The yellow arrow shows the directional perspective of the 3D point cloud rendering.
3.5. Roughness Calculations
The photogrammetry data were then used to calculate a roughness factor of the surface at each point in the 3D cloud. The roughness is defined as the distance between each point and the best-fit plane to a localized surface kernel size, representing the general slope defined by points within a specified radius of a sphere. Using this method, the regional slope is removed to create a factor due solely to the local particle size. This calculation is dependent on the user-defined kernel size that determines the localized area by which the best fitting plane is calculated. To select the appropriate kernel size for this study, the range of particle sizes present were evaluated to ensure that the largest size (~4 m and larger) would be captured in the roughness factor. Ultimately, a kernel size of 2 m was selected as the best representation of the surface roughness. The resulting roughness values correlate to the particle size of the surface because larger objects will produce a greater distance between a point on the surface of the object and the best fitting plane, thus producing higher roughness values. Alternatively, small particles will have a small distance between points and the best fitting plane. Each image-based category type mapped using WorldView-2 data were correlated to roughness values derived by the 3D photogrammetry data in “the Bowl” and validated by field observations.
3.6. Categories and ATI
With the validation of the categories defined using coincident WorldView-2 remote sensing and field data, the mapping area was expanded to cover as much area as possible on the North Coulee containing the full range of potential particle size distributions. At 20,457 square meters, “The Bowl” covered less than 1% of the entire North Coulee surface. This expansion allowed us to have large enough areas of representative surface types that correspond to our derived ATI pixels, ranging between pure endmembers (a single surface category) and a variety of mixed endmembers (a combination of surface categories). The areal percentage of each category was calculated using the overlap between the category shapefiles and the 201 ATI pixels that cover the surface of the flow to produce a look-up table (LUT). This LUT was used to quantitatively assess the relationship between ATI values and subpixel particle size distributions. From the three categories represented in our study, linear or non-linear trends between ATI and category distributions could be identified.
4. Results
4.1. Category Evaluation Within “the Bowl”
Comparison of the areal extents of three particle size categories defined using the WorldView-2 visible data to the locations of these same categories based on point cloud data and field images at the higher spatial resolution suggests the WorldView-2 data provide comparable results. Only minor variations between the WorldView-2 data and other datasets were observed along the boundary zones, thus proving adequate assessment of the surface particle size. This difference was noted mostly between the moderate and coarse categories, with a <10% difference over “the Bowl” study area (Figure 5). The fine category presented the most agreement between the two derived products. Evaluation of the DTM and qualitative category analysis demonstrates a lack of dependency on local topography and that the general topographic slope in the area is not significant enough to influence the particle size distributions (Figure 5a,c). “The Bowl” also provided an initial comparison of these category distributions within an ATI pixel. Pixel 1 in Figure 5d has an ATI of 0.029 and is mapped as 53% moderate, 24% coarse, and 23% fine. Pixel 2 has a lower ATI of 0.022 and is mapped as 75% fine, 11% moderate, 4% coarse, and 10% vegetation. This comparison demonstrates that the ATI values are sensitive to changes in the areal percentages of different particle sizes, suggesting the accuracy of the defined categories.
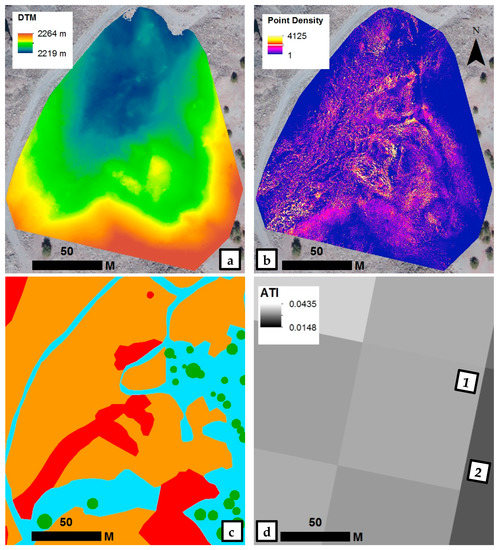
Figure 5.
“The Bowl” study site on North Coulee with overlays of the (a) digital terrain models (DTM) and (b) point cloud density derived from the photogrammetry dataset. (c) Visual categories defined using the WorldView-2 data, with red = coarse, orange = moderate, blue = fine, and green = vegetation. (d) ATI product at the pixel scale (90 m) with pixel 1 and 2 shown illustrating that “the Bowl” encompasses multiple pixels.
4.2. Roughness Calculation of Categories
The 3D point cloud and DTM data were used to derive a range of roughness values for each particle size category. These values represent the maximum roughness for a feature of that category at a particular kernel size (Table 2); 75–81 cm for coarse particles, 54–68 cm for moderate particles, and 13–16 cm for fine particles. A comparison of multiple kernel sizes (the area used to define the best fitting plane) resulted in a 2 m kernel producing the appropriate roughness for the scale of this study. Kernel sizes greater than 2 m tend to highlight only the major general topography and those lower than 2 m did not capture the larger particle size distributions at all. The roughness calculations using the 2 m kernel size result in a visible difference between the categories present on the surface of the North Coulee and validated the uniqueness of each class based on the maximum roughness values for each category (Figure 6). The difference between the maximum roughness ranges for moderate and coarse categories (7 cm) is smaller than that between the fine and moderate categories (38 cm), demonstrating a closer similarity between the former categories (Table 2). This smaller difference further suggests that the boundaries between these two categories are more difficult to define than either with the fine category. Areas mapped as fine show the smallest range in roughness values (3 cm) with near-uniformity of the surface, demonstrating that the boundaries of this category have the highest accuracy. Thus, the roughness values derived from ground-based photogrammetry data confirm the statistical separation of the categories created from visual interpretation. With this information, the mapping can be confidently extended to the rest of the North Coulee study area.
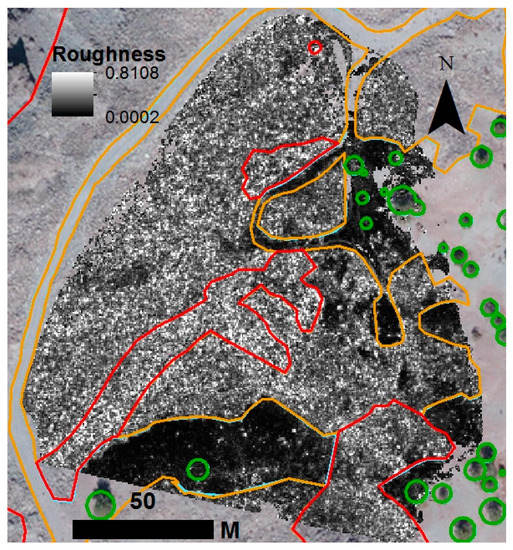
Figure 6.
Roughness calculation with kernel size = 2 m of “the Bowl” study area. Particle size category boundaries are overlaid with the colors corresponding to those in Table 2.
4.3. Location Distribution
Analysis of the expanded mapping shows a trend in the location of the three particle size categories (Figure 7a). The finer particles dominate the western and southwestern portions of the flow surface and moderate and coarse categories are found predominantly in the middle (vent region) and extend to the eastern portion. The distribution of the finer particle sizes suggests the effect of wind deposition. In this region, prevailing winds are from the west/northwest over the Sierra Nevada mountain range. The fine-grained material likely originated during the initial eruptive phases of the younger vents to the north of the study area [21]. Additional deposition on the windward side of the elevated coulee could have occurred from the later eolian transport of finer material. Vegetation is found almost exclusively in the fine category, which would be the most amenable to tree rooting and growth. The coarse category makes up the smallest population on the surface mostly confined to the vent region and predominately surrounded by moderately-sized material. This agrees with the findings of Anderson et al. [4] who found an inverse relationship between block size and distance from the vent. Blocks transported during flow emplacement of these silicic flows tended to become smaller with transport distance. This geographic trend in the category distributions is also reflected in the ATI values with the lowest values covering the western section (fine dominated) and higher values along the eastern section (moderate and coarse dominated) (Figure 7b).
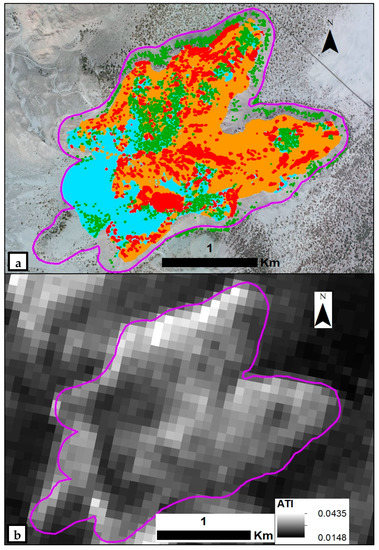
Figure 7.
(a) Category distributions (red = coarse, orange = moderate, blue = fine, and green = trees) overlain on WorldView-2 data (Courtesy of DigitalGlobe Foundation). Categories are derived from WorldView-2 panchromatic data. (b) Calculated ATI values from ASTER VNIR and TIR data displaying the variability in the study area. The extents of the North Coulee are defined in purple.
5. Discussion
Comparing the areal percentages of each category within the ATI pixels to the corresponding ATI value provided a thorough analysis of how mixed pixels of differing particle sizes affect the ATI determination (Figure 8). The surface area of the flow was covered by 201 ASTER-derived, 90 m ATI pixels, which had a range of 0.019 to 0.033 ATI. As expected, those pure pixels covered solely by the fine category displayed the lowest ATI values (0.019–0.022). Pixels with ATI values up to ~0.025 also possess some amount of vegetation (up to 12%), the presence of which increases the ATI. These results establish that the lowest ATI values (~0.020) are representative of pure pixels of fine particle sizes. Any addition of vegetation to a purely fine-grain covered surface pixel will increase the ATI value slightly above ~0.022. This relationship can be “unmixed” linearly based on the areal percentage of vegetation and sediment to remove vegetation signature from the ATI assessments.
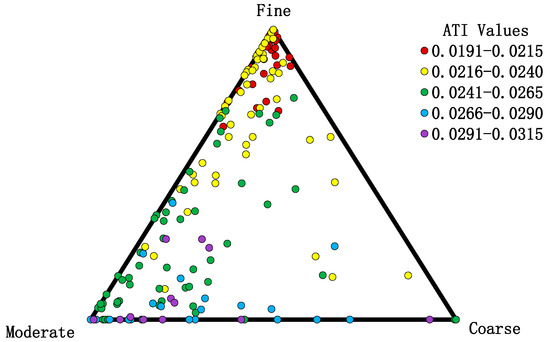
Figure 8.
Ternary plot of the areal percentages of each of the three particle size categories within each ATI pixel showing the variation over North Coulee. The peak of each axis corresponds to a 100% areal percentage of the corresponding category. The colored sample interval for the ATI values is derived by five equal divisions.
The upper range of ATI values on the flow surface, ranging from 0.025 to 0.031, is dominated by moderate and coarse particle sizes. Somewhat unexpected, the surfaces with the highest ATI on the North Coulee (max = 0.032) are dominated by moderate particle sizes. This suggests that this particle size category contains an inverse size grading in which the largest objects are on the top with void spaces that allow finer particles to settle beneath. However, if the uniform pixel assumption was correct, the highest ATI values should be dominated by the largest particle sizes, which is not seen in these results. In contrast, pixels dominated by the coarse category did not consistently display the highest ATI values. This suggests that the ATI values for these surfaces contain the thermal signature of the fine or moderate particle sizes found between the boulders and may exhibit sub-pixel shadowing. This complication is seen in the lower than expected ATI (~0.025) for the two pure pixels containing the coarse category. Even though the areas covered by these pixels display the criteria to qualitatively classify them as coarse using WorldView-2 data, the multiple large boulders are likely creating sub-pixel shadowing and the areas between multiple large boulders likely contain exposed fine or moderate particle sizes. This would ultimately create a thermally-mixed pixel response that would lower the ATI value.
Analysis of the mixed pixels and corresponding ATI values demonstrate that the uniform pixel assumption will incorrectly identify surfaces dominated with larger particle sizes and miss the presence of vegetation on surfaces of fine particles. Furthermore, this assumption may also overlook the presence of small amounts of larger particle sizes in mixed pixels with over ~70% areal percent of fine particles. This demonstrates how the use of a multi-instrument approach in which a higher spatial resolution visible dataset will provide critical information in the derivation of ATI. These areas, dominated by large particle sizes, can be used to reverse model these mixtures with further work.
6. Conclusions
The current assumption of uniform properties at the pixel scale (i.e., a pure pixel with only a single class) causes significant error in deriving particle size using orbital data. In reality, the surface usually contains a mixture of particle sizes (i.e., mixed pixel) that would produce an average ATI value in relation to the amount of each material present. The goal of this study was to understand better how these subpixel particle size variations within mixed pixels affect ATI values and identify any complications to the uniform pixel assumption. This was accomplished using a multi-instrument and multiresolution approach to calculate ATI over the study area, map particle size ranges using visible data, derive roughness from a 3D point cloud, and evaluate the areal percentage of different particle size ranges within each ATI pixel. The project also showed that different particle size distributions are identifiable in satellite VNIR data.
To interpret the distribution of different particle sizes on the surface of the North Coulee using satellite data, four categories were identified at the WorldView-2 spatial resolution: three particle size classes fine, moderate, and coarse and a vegetation class. These classes were mapped visually based on identifiable characteristics in the WorldView-2 data, such as the presence of shadowing and degree of reflectance variability, and the comparison with point cloud data (at a kernel size of 2 m) created using SfM photogrammetry techniques on fieldwork photographs. This comparison of the category distributions based on WorldView-2 data and the derived point cloud demonstrated that the spatial resolution of the satellite data was sufficient to distinguish the location of categories representing particular particle size ranges. Furthermore, a roughness factor calculated from the point cloud statistically validates the uniqueness of each class.
Analysis of the distribution of categories on the surface of the coulee (for both pure and mixed pixels) and the ATI values reveal distinct correlations between the datasets. Fine particles dominate the lower portion of the ATI range for this study area and the presence of vegetation slightly increases the ATI value. Pixels identified as predominately moderate in particle size corresponding to the highest ATI values and those covered by coarse material display an intermediate ATI value. This inverse relationship suggests that pixels covering the coarse areas do not solely represent the signature of the large block material and the areas between multiple large boulders likely contain exposed fine or moderate particle sizes and/or shadowing that would lower the ATI value. In areas dominated by moderate particle sizes, the rocks rest is such a way on the surface to create an inverse size grading that allows for smaller particles to settle beneath larger particles and blocks within crevices. Thus, the ATI values for pure moderate pixels are likely to display an accurate response for this particle size. This analysis demonstrates that the current assumption of uniform material properties at the pixel scale will incorrectly identify areas dominated with boulders and other large particle sizes and not account for vegetation in areas dominated by fine particles. Small percentages of moderate or large particle sizes in an area with >70% fine particles may be completely missed with this assumption. Within this study area (or similar ones) additional datasets are required in a multi-instrument approach, such as the WorldView-2 data, to accurately differentiate the presence of particle and block sizes on the surface. Additional work can include refining the particle size categories into smaller groupings to further increase the accuracy of derived particle sizes. Future ATI investigations should account for the complication created by a subpixel mixed surface to avoid misclassifying the surface materials. Overall, this study provides a methodology for improving the interpretation of complex volcanic surfaces and the ability to separate a range of material sizes.
Author Contributions
Conceptualization, C.S. and M.R.; methodology, C.S. and S.S.; validation, C.S.; formal analysis, C.S.; investigation, C.S.; resources, C.S., M.R., and S.S.; data curation, C.S. and S.S.; writing—original draft preparation, C.S.; writing—review and editing, C.S., M.R., and S.S.; visualization, C.S. and S.S.; supervision, M.R.; project administration, M.R.; funding acquisition, C.S. and M.R. All authors have read and agreed to the published version of the manuscript.
Funding
This research was supported through continuing funding of an original Mars Odyssey Participating Scientist Program project (grant number: NMO710630) and a NASA Earth and Space Science Fellowship (award number: 80NSSC17K0460).
Acknowledgments
I would also like to thank the DigitalGlobe Imagery Grant for supplying the WorldView-2 data. ASTER data used in this study are available at the Earthdata Search application: https://search.earthdata.nasa.gov/.
Conflicts of Interest
The authors declare no conflict of interest. The funders had no role in the design of the study; in the collection, analyses, or interpretation of data; in the writing of the manuscript, or in the decision to publish the results.
References
- Robert, B.; Harris, A.; Gurioli, L.; Medard, E.; Sehlke, A.; Whittington, A. Textural and rheological evolution of basalt flowing down a lava channel. Bull. Volcanol. 2014, 76, 824. [Google Scholar] [CrossRef]
- Rust, A.C.; Cashman, K.V. Permeability controls on expansion and size distributions of pyroclasts. J. Geophys. Res. 2011, 116, B11202. [Google Scholar] [CrossRef]
- Rotella, M.D.; Wilson, C.J.N.; Barker, S.J.; Schipper, C.I.; Wright, I.C.; Wysoczanski, R.J. Dynamics of deep submarine silicic explosive eruptions in the Kermadec arc, as reflected in pumice vesicularity textures. J. Volcanol. Geotherm. Res. 2015, 301, 314–332. [Google Scholar] [CrossRef]
- Anderson, S.W.; Stofan, E.R.; Plaut, J.J.; Crown, D.A. Block size distributions on silicic lava flow surfaces: Implications for emplacement conditions. Geol. Soc. Am. Bull. 1998, 110, 1258–1267. [Google Scholar] [CrossRef]
- Leggett, T.N.; Befus, K.S.; Kenderes, S.M. Rhyolite lava emplacement dynamics inferred from surface morphology. J. Volcanol. Geotherm. Res. 2020, 395, 106850. [Google Scholar] [CrossRef]
- Hunt, G.R.; Vincent, R.K. The behavior of spectral features in the infrared emission from particulate surfaces of various grain sizes. J. Geophys. Res. 1968, 73, 6039–6046. [Google Scholar] [CrossRef]
- Ramsey, M.S.; Christensen, P.R. Mineral abundance determination: Quantitative deconvolution of thermal emission spectra. J. Geophys. Res. 1998, 103, 577–596. [Google Scholar] [CrossRef]
- Presley, M.A.; Christensen, P.R. Thermal conductivity measurements of particulate materials: 2. Results. J. Geophys. Res. Planets 1997, 102, 6551–6566. [Google Scholar] [CrossRef]
- Price, J.C. Thermal inertia mapping: A new view of Earth. J. Geophys. Res. 1997, 82, 2582–2590. [Google Scholar] [CrossRef]
- Kahle, A.B.; Gillespie, A.R.; Goetz, A.F.H. Thermal inertia imaging: A new geologic mapping tool. Geophys. Res. Lett. 1976, 3, 26–28. [Google Scholar] [CrossRef]
- Liang, S. Narrowband to broadband conversions of land surface albedo I: Algorithms. Remote Sens. Env. 2001, 76, 213–238. [Google Scholar] [CrossRef]
- Mokhtari, M.H.; Busu, I.; Mokhtari, H.; Zahedi, G.; Sheikhattar, L.; Movahed, M.A. Neural network and multiple linear regression for estimating surface albedo from ASTER visible and near-infrared spectral bands. Earth Interact. 2013, 17, 1–20. [Google Scholar] [CrossRef]
- Kieffer, H.H.; Martin, T.Z.; Peterfreund, A.R.; Jakosky, B.M.; Miner, E.D.; Palluconi, F.D. Thermal and albedo mapping of Mars during the Viking primary mission. J. Geophys. Res. 1977, 82, 4249–4291. [Google Scholar] [CrossRef]
- Putzig, N.E.; Mellon, M.T. Apparent thermal inertia and the surface heterogeneity of Mars. Icarus 2007, 191, 68–94. [Google Scholar] [CrossRef]
- Cracknell, A.P.; Xue, Y. Thermal inertia determination from space—A tutorial review. Int. J. Remote Sens. 1996, 17, 431–461. [Google Scholar] [CrossRef]
- Hardgrove, C.; Moersch, J.; Whisner, S. Thermal imaging of alluvial fans: A new technique for remote classification of sedimentary features. Earth Planet. Sc. Lett. 2009, 285, 124–130. [Google Scholar] [CrossRef]
- Scheidt, S.; Ramsey, M.S.; Lancasater, N. Determining soil moisture and sediment availability at White Sands Dune Field, New Mexico, from apparent thermal inertia data. J. Geophys. Res. Earth Surf. 2010, 115, F02019. [Google Scholar] [CrossRef]
- Choodarathnakara, A.L.; Kumar, T.A.; Koliwad, S.; Patil, C.G. Mixed Pixels: A challenge in remote sensing data classification for improving performance. Int. J. Adv. Res. Comput. Engin. Tech. 2012, 1, 261–271. [Google Scholar]
- Ramsey, M.S.; Fink, J.H. Estimating silicic lava vesicularity with thermal remote sensing: A new technique for volcanic mapping and monitoring. Bull. Volcanol. 1999, 61, 32–39. [Google Scholar] [CrossRef]
- Presley, M.A.; Craddock, R.A. Thermal conductivity measurements of particulate materials: 3. Natural samples and mixtures of particle sizes. J. Geophys. Res. 2006, 111, E09013. [Google Scholar] [CrossRef]
- Bailey, R.A.; Dalrymple, G.B.; Lanphere, M.A. Volcanism, structure, and geochronology of Long Valley Caldera, Mono County, California. J. Geophys. Res. 1976, 81, 725–744. [Google Scholar] [CrossRef]
- Bursik, M.; Sieh, K. Range front faulting and volcanism in the Mono Basin, Eastern California. J. Geophys. Res. 1989, 94, 15587–15609. [Google Scholar] [CrossRef]
- Hill, D. Unrest in Long Valley Caldera, California, 1978–2004. Geol. Soc. Lond. Spec. Publ. 2006, 269, 1–24. [Google Scholar] [CrossRef]
- Achauer, U.; Greene, L.; Evans, J.R.; Iyer, H.M. Nature of the magma chamber underlying the Mono Craters Area, Eastern California, as determined from teleseismic travel time residuals. J. Geophys. Res. Solid Earth 1986, 91, 13873–13891. [Google Scholar] [CrossRef]
- Peacock, J.R.; Mangan, M.T.; McPhee, D.; Ponce, D.A. Imaging the magmatic system on Mono Basin, California, with magnetotellurics in three dimensions. J. Geophys. Res. Solid Earth 2015, 120, 7273–7289. [Google Scholar] [CrossRef]
- Bailey, R.A. Quaternary Volcanism of Long Valley Caldera, Mono-Inyo Craters Volcanic Chain, and Vicinity, Eastern California: Field Trip Guidebook T313; American Geophysical Union: Washington, DC, USA, 1989. [Google Scholar]
- Hildreth, W. Volcanological Perspectives on Long Valley, Mammoth Mountain, and Mono Craters: Several contiguous but discrete systems. J. Volcanol. Geotherm. Res. 2004, 136, 169–198. [Google Scholar] [CrossRef]
- Sieh, K.; Bursik, M. Most recent eruption of the Mono Craters, Eastern Central California. J. Geophys. Res. 1986, 9, 12539–12571. [Google Scholar] [CrossRef]
- Price, M.A.; Ramsey, M.S.; Crown, D.A. Satellite-Based Thermophysical Analysis of Volcaniclastic Deposits: A Terrestrial Analog for Mantled Lava Flows on Mars. Remote Sens. 2016, 8, 152. [Google Scholar] [CrossRef]
- Yamaguchi, Y.; Kahle, A.; Tsu, H.; Kawakami, T.; Pniel, M. Overview of advanced spaceborne thermal emission and reflectance radiometer (ASTER). IEEE T. Geosci. Remote Sens. 1998, 36, 1062–1071. [Google Scholar] [CrossRef]
- DigitalGlobe. WorldView 2 Data Sheet. 2013. Available online: https://dg-cms-uploads-production.s3.amazonaws.com/uploads/document/file/98/WorldView2-DS-WV2-rev2.pdf (accessed on 8 February 2016).
- Kahle, A.B. Surface emittance, temperature, and thermal inertia derived from thermal infrared multispectral scanner (TIMS) data for Death Valley, California. Geophysics 1987, 52, 858–874. [Google Scholar] [CrossRef]
- Wentworth, C.K. A scale of grade and class terms for clastic sediments. J. Geol. 1922, 30, 377–392. [Google Scholar] [CrossRef]


© 2020 by the authors. Licensee MDPI, Basel, Switzerland. This article is an open access article distributed under the terms and conditions of the Creative Commons Attribution (CC BY) license (http://creativecommons.org/licenses/by/4.0/).