Article

Co-Evolution of Emerging Multi-Cities: Rates, Patterns and Driving Policies Revealed by Continuous Change Detection and Classification of Landsat Data

1
National Engineering Laboratory for Applied Technology of Forestry & Ecology in South China, Central South University of Forestry and Technology, Changsha 410004, China
2
College of Biological Science and Technology, Central South University of Forestry and Technology, Changsha 410004, China
3
School of Natural Sciences, Bangor University, Thoday Building, Bangor LL57 2UW, UK
4
College of Forestry, Central South University of Forestry and Technology, Changsha 410004, China
5
Bangor College China, Joint Unit of Bangor University, Bangor, UK and Central South University of Forestry and Technology, Changsha 410004, China
*
Author to whom correspondence should be addressed.
Remote Sens. 2020, 12(18), 2905; https://doi.org/10.3390/rs12182905
Submission received: 27 July 2020 / Revised: 1 September 2020 / Accepted: 3 September 2020 / Published: 9 September 2020
(This article belongs to the Section Urban Remote Sensing)

Abstract

:
The co-evolution of multi-cities has emerged as the primary form of urbanization in China in recent years. However, the processes, patterns, and coordination are not well characterized and understood, which hinders the understanding of the driving forces, consequences, and management of polycentric urban development. We used the Continuous Change Detection and Classification (CCDC) algorithm to integrate all available Landsat 5, 7, and 8 images and map annual land use and land cover (LULC) from 2001 to 2017 in the Chang–Zhu–Tan urban agglomeration (CZTUA), a typical urban agglomeration in China. Results showed that the impervious surface in the study area expanded by 371 km2 with an annual growth rate of 2.25%, primarily at the cost of cropland (169 km2) and forest (206 km2) during the study period. Urban growth has evolved from infilling being the dominant type in the earlier period to mainly edge-expansion and leapfrogging in the core cities, and from no dominant type to mainly leapfrogging in the satellite cities. The unfolding of the “cool center and hot edge” urban growth pattern in CZTUA, characterized by higher expansion rates in the peripheral than in the core cities, may signify a new form of the co-evolution of multi-cities in the process of urbanization. Detailed urban management and planning policies in CZTUA were analyzed. The co-evolution of multi-cities principles need to be studied in more extensive regions, which could help policymakers to promote sustainable and livable development in the future.

Graphical Abstract

1. Introduction

The land covers and landscapes in many of China’s cities have been modified significantly in recent years due to the rapid economic development and population growth. Nowadays, more than 50% of China’s population lives in cities, and this rate will continue to rise to 75% by 2030 [1]. For this reason, urbanization has become one of the most important factors affecting ecosystem services and environmental quality, especially in some emerging cities or city clusters [2,3]. To address the adverse impacts and promote sustainable urban development, the Chinese government has issued the “New Urbanization Plan” with the intent to emphasize ecological progress, urbanization quality, domestic demand expansion, and rural–urban coordination simultaneously [4,5]. To achieve these goals, it is necessary to monitor and understand urban expansion continuously [6]. Mapping urban growth accurately is a prerequisite for studying and managing the urbanization process, revealing the drivers, and evaluating the consequences [7,8,9,10].
Co-evolution, the process of reciprocal evolutionary change that occurs between cities or within a city as they interact with each other [11,12], has been regarded as the key step for a city to become a megalopolis [13,14]. The international megalopolises in developed countries, such as the Northeast megalopolis in USA [15], the Great Tokyo Area in Japan, and other megalopolis [16], all have experienced long co-evolution processes to integrate multiple cities, gradually differentiating mutually beneficial and coordinated functions, and became the regional, national, and ultimately international economics centers [13]. The development of satellite remote sensing and geographic information system technologies has promoted the fascinating possibility of the analysis of the urbanization and co-evolution of multi-cities [17,18,19], especially in emerging cities in developing countries such as India, South Africa, and China, where there are relatively fewer references for sustainable urban development [10]. Previous studies on the spatiotemporal changes of urban land use and land cover (LULC) in China have largely focused on the Jing-Jin-Ji Megalopolis, Pearl River Delta Megalopolis, and Yangtze River Delta Megalopolis [10,20,21,22,23]; less attention has been paid to urban expansion in emerging cities in the land-locked regions, calling for more research and understanding of the processes and consequences of urban development in inland [24,25,26]. Besides, landscape ecology approaches and metrics have been widely used for analyzing the urbanization process, which could support a better understanding of the evolution of a city [20,27,28,29].
The temporal resolution of remote sensing data plays a crucial role in studying the co-evolution of multi-cities [30,31]. However, time intervals of 5 to 10 years have often been used to map urban expansion in most studies [27], which is apparently not suitable for mapping and monitoring the expansion processes in fast-growing cities where the annual urban expansion can exceed 5% [20,32]. Some small but important changes may be ignored in remote sensing monitoring over a large time interval, resulting in barriers analyzing fast transformations between the different LULC types, urbanization processes, and driving forces in emerging cities [20,33,34]. All of these were mainly due to the limitations from available remotely sensed data [7,35,36]. Specifically, images with inferior quality were unusable due to their low frequency and quality (i.e., seasonal variation and excessive cloudiness) [37], leading to most urban monitoring studies being based on a comparison of a classical supervised classification between two dates, instead of a proper time series algorithm [37,38]. The rapid developing cities, with great inter-annual changes, may require continuous time series models to reveal their series of urban expansion processes [22,23,39,40].
An efficient and stable remote sensing data processing method could integrate a volume of images, which would be meaningful in monitoring the urbanization process and analyzing the co-evolution of multi-cities [41,42,43]. Several methods have been developed in recent years to take advantages of time series of remotely sensed images for LULC detection, including the Landsat-based detection of Trends in Disturbance and Recover (LandTrendr) [44,45], the vegetation change tracker (VCT) [46], and the Continuous Change Detection and Classification (CCDC) algorithm [17,33,47,48,49,50]. These methods are designed to analyze the changes of ground objects through different mechanisms. LandTrendr detects abrupt change by the segmentation method and, between the abrupt changes, a slope is fitted for each segment to capture the gradual changes, and this approach has been used for insect infestation detection and forest change detection [44,47,51,52]. The VCT normalizes each Landsat image into a forest probability index and uses a thresholding method to detect forest disturbance. These two methods are usually used to monitor forest dynamics and rarely used to monitor urban expansion because limited indices could not support the classification of many land cover types [53]. The CCDC algorithm, on the other hand, uses all spectral bands in Landsat images to detect many kinds of surface change by fitting multiple surface reflectance models with sines and cosines simultaneously [54], and has been applied to study the changes in vegetation, impervious surface expansion, and surface temperature dynamic after land use change [55,56,57].
The Chang–Zhu–Tan urban agglomeration (CZTUA), located at the middle reach of the Yangtze river basin, is the fastest growing region in Hunan Province, showing the typical developing pattern that can be currently found elsewhere in China [26,58]. The development of CZTUA has benefited from a series of urban development policies such as “The Rise of Central China Plan” in 2004, “Resource saving and Environment friendly” dual-type society experimental areas in 2008, and “Middle Yangtze River Urban Agglomeration Planning” in 2015 [26,59,60]. These urban development policies, which promoted the prosperity of provincial cities and poorer neighbor regions, have been among the key drivers of the co-evolution of multi-cities [28]. Therefore, a comprehensive understanding of urban expansion in CZTUA is not only a prerequisite for comprehending the urbanization process and economic growth, but also the basis for better urban planning. We focused on the urban expansion dynamics in CZTUA during 2001 to 2017 when the majority of the development urban policies were formulated and carried out. The objectives of this study were to (1) map the annual LULC and landscape dynamics using the Landsat data and CCDC; (2) quantify the spatiotemporal patterns of urban expansion on the regional and city scales; and (3) analyze the co-evolution pattern, driving forces, and implemented policies of multi-cities.

2. Study Area and Datasets
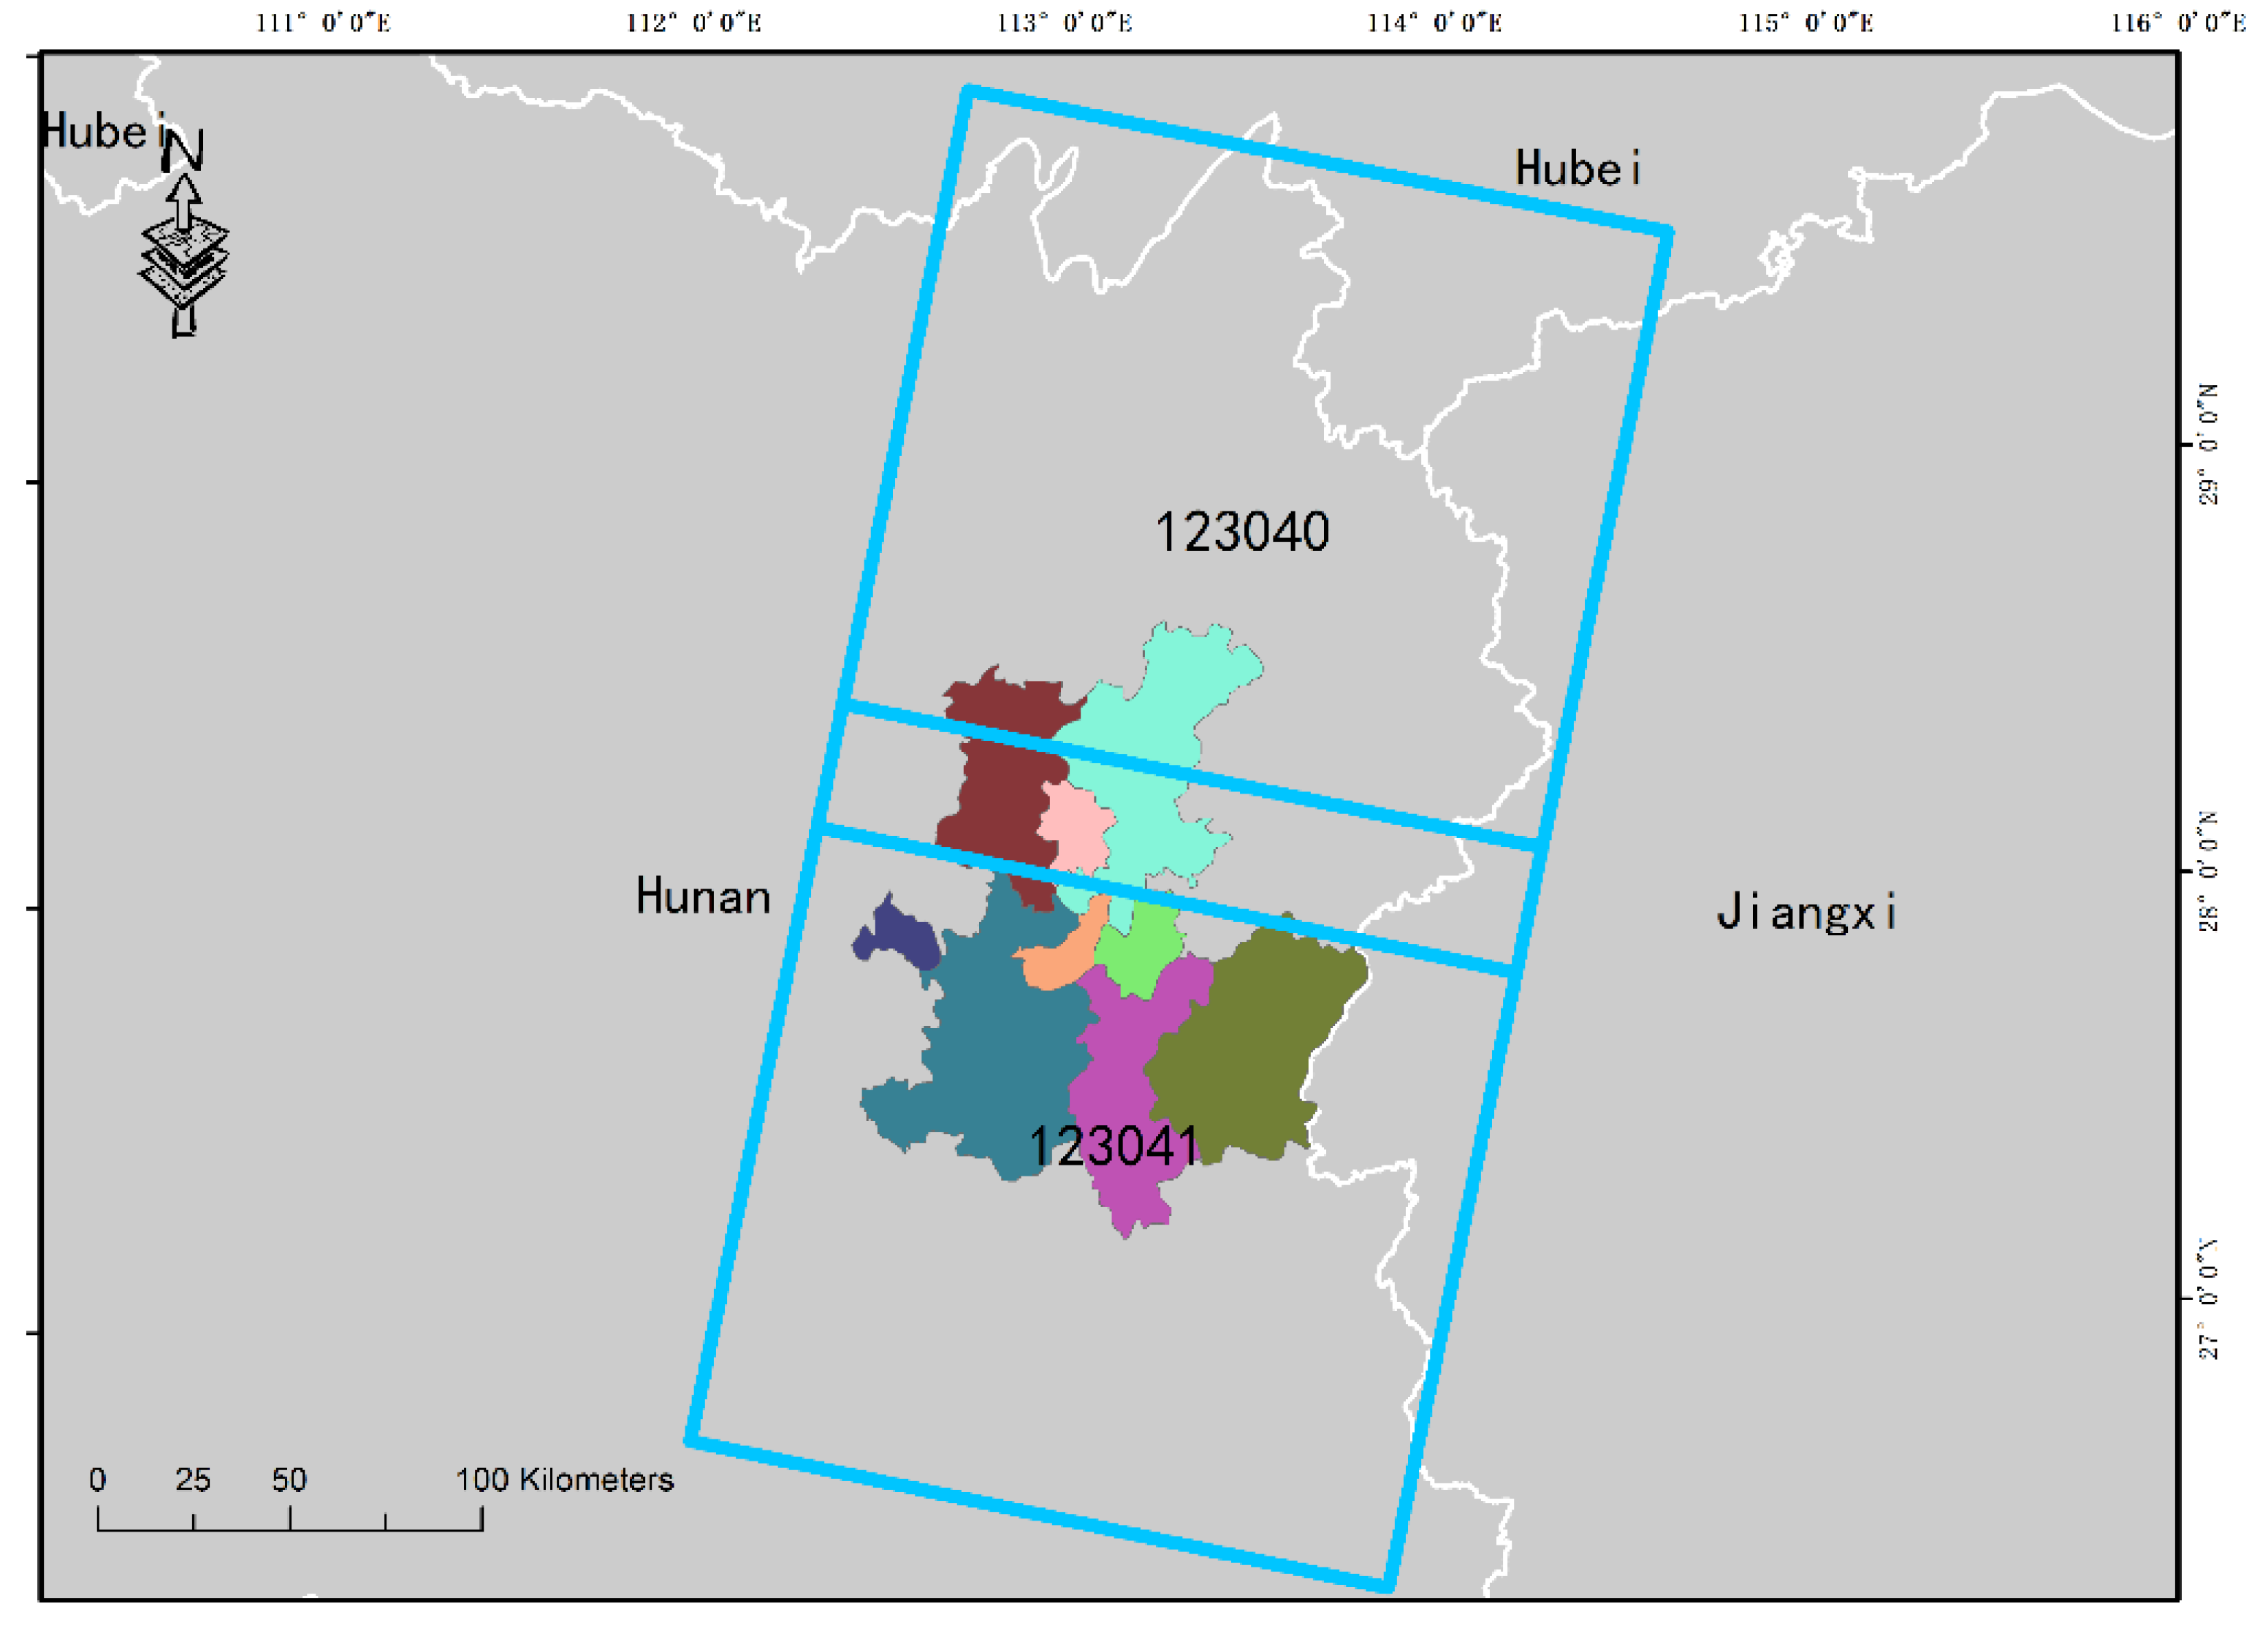
2.1. Study Area

The CZTUA, located in the central-eastern part of Hunan Province, is one of the most important urban agglomerations in the Middle Yangtze River Basin [21,58]. It has been the testbed for coordinated urban agglomeration development theories. Changsha City, Zhuzhou City, and Xiangtan City are the core cities of the CZTUA. These three cities present a unique triangular formation geographically forming a good foundation for developing a polycentric urban agglomeration (Figure 1). In addition to the core cities, the CZTUA includes several satellite cities, counties, or districts: Wangcheng District and Changsha County for Changsha City; Shaoshan City and Xiangtan County for Xiangtan City; and Liling City and Zhuzhou County for Zhuzhou City [58,61].

2.2. Data and Pre-Processing
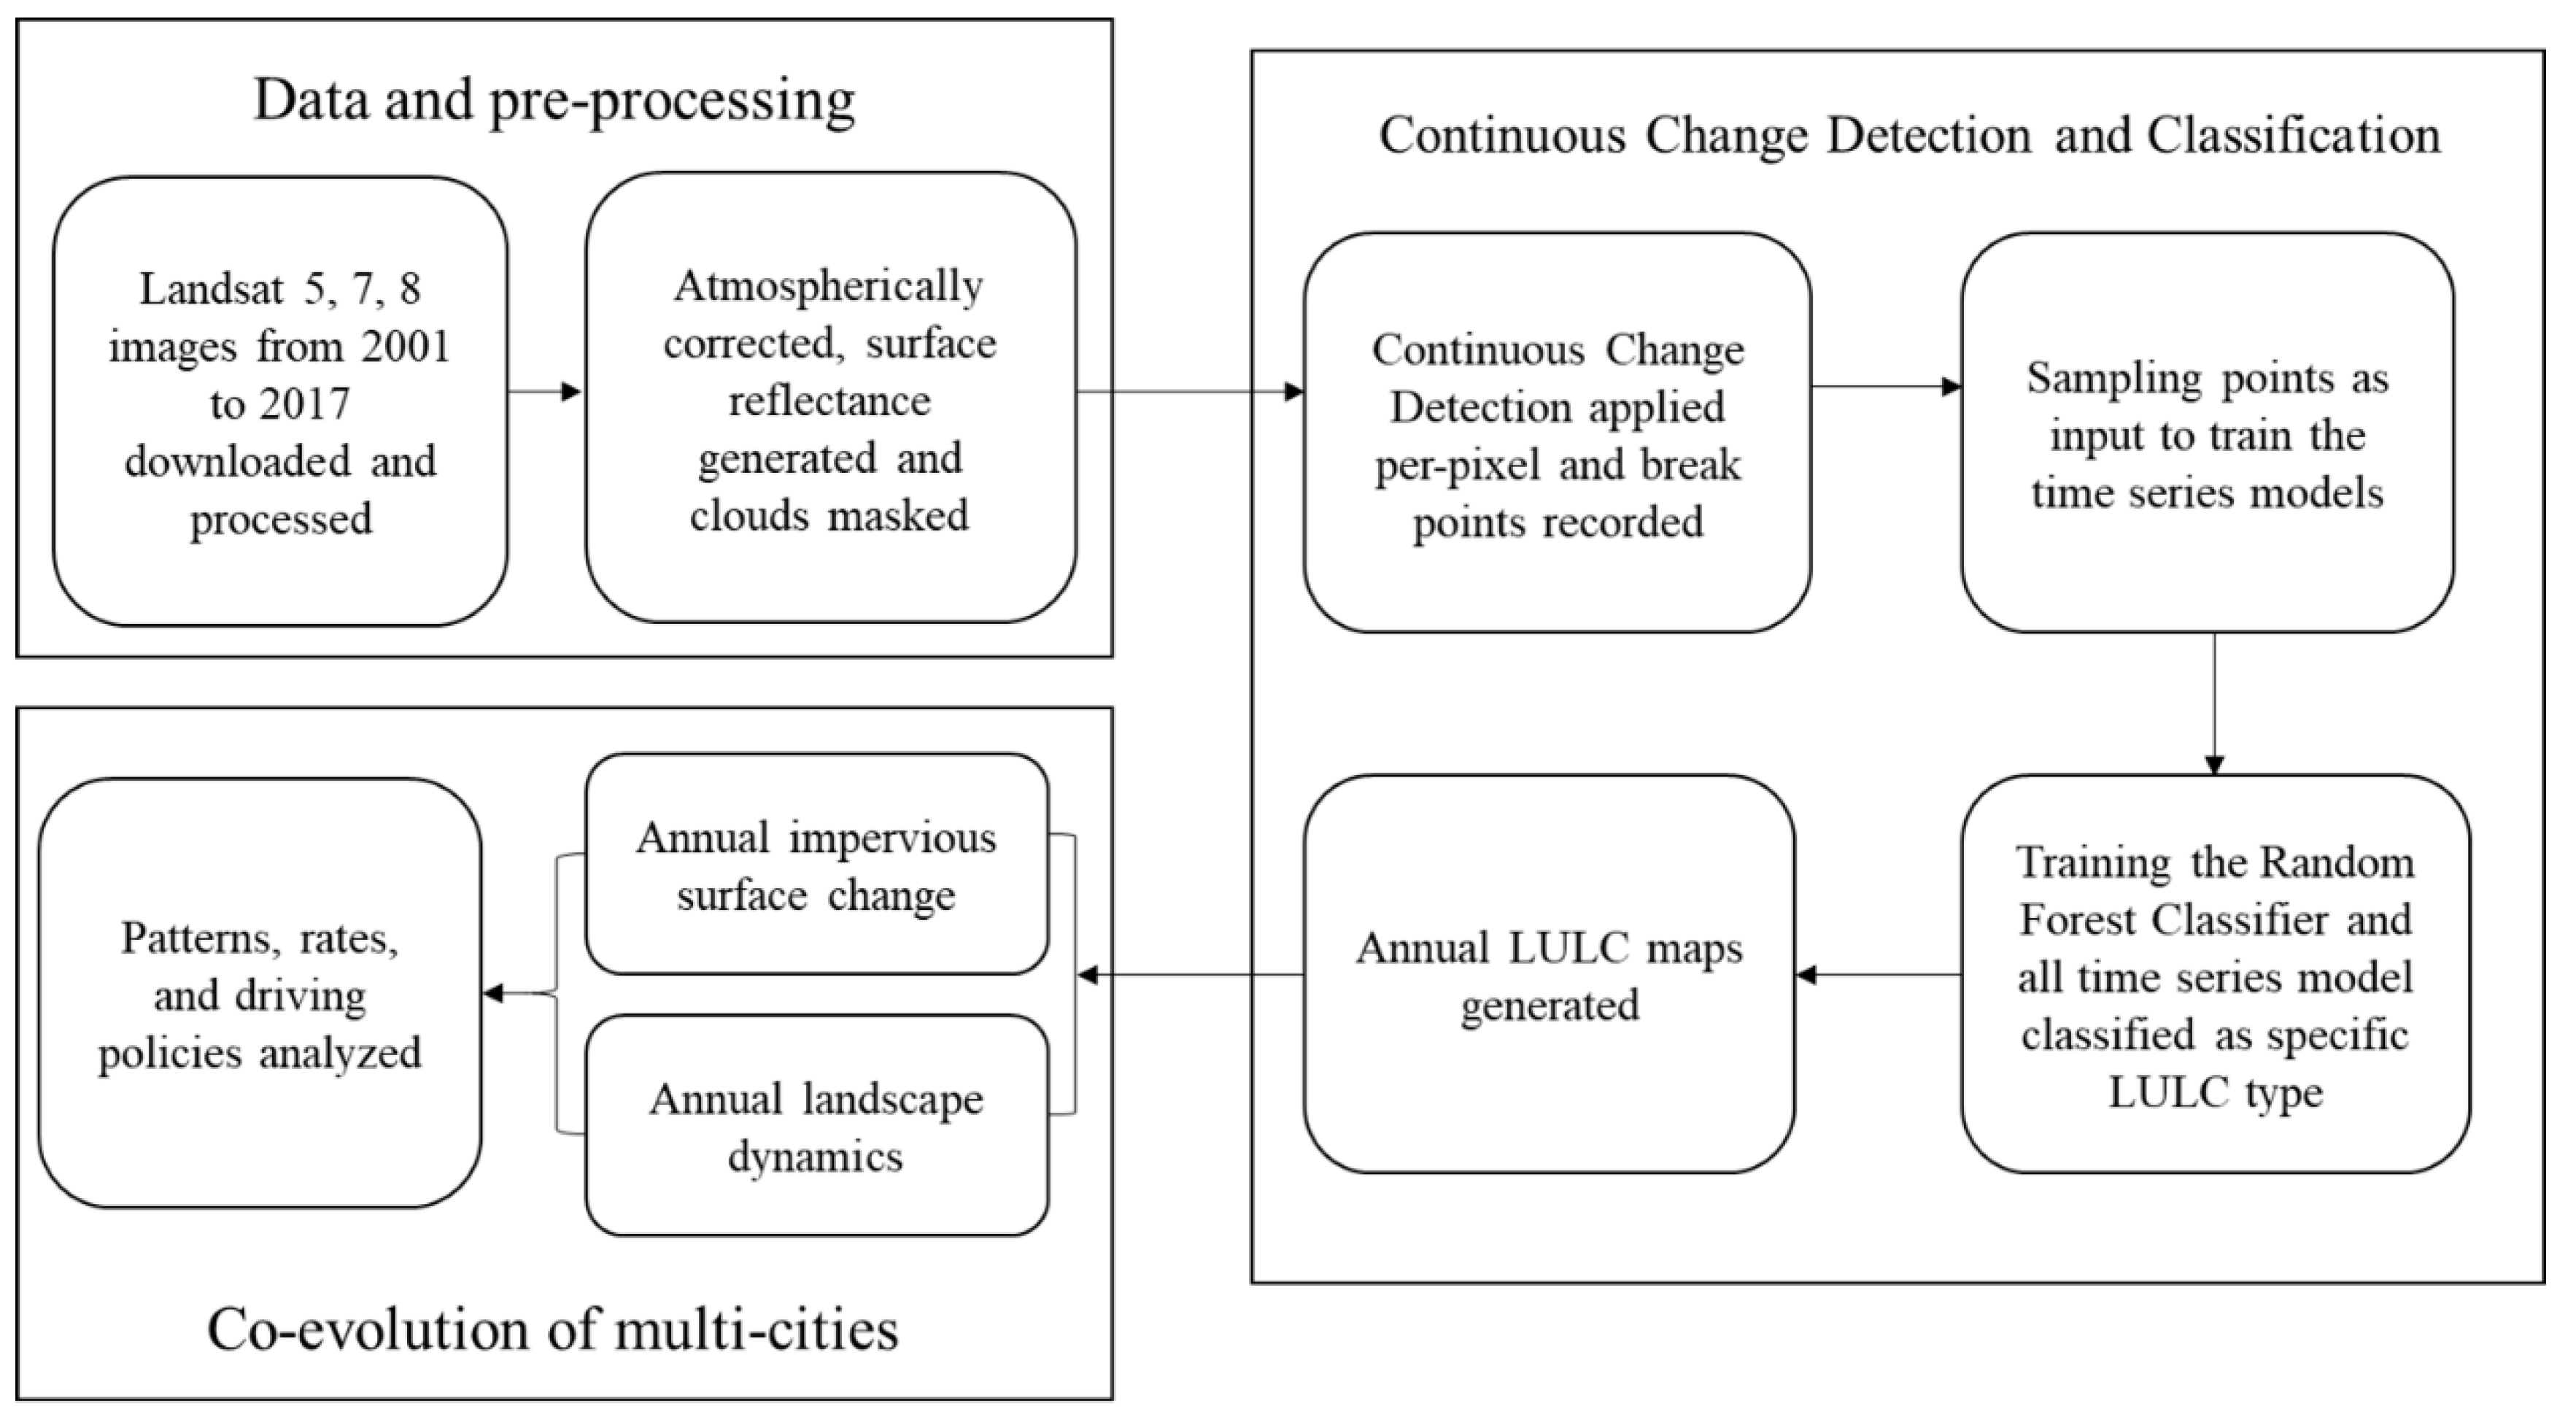
In this study, all available Level 1 Terrain (L1T) Landsat 5, 7, and 8 images for the World Reference System 2 (WRS2) path/row 123/040 and 123/041, with the percentage of cloud cover below 80%, were obtained (Figure A1). There was a total of 637 images meeting these criteria from 2001 to 2017. The image preprocessing was completed using ESPA (https://espa.cr.usgs.gov/), which provides an order mode to batch processing Landsat images [62]. All images were atmospherically corrected to the surface reflectance with established algorithms and presented a high consistency between the different sensors [63,64,65]. Specifically, Landsat 5 and 7 surface reflectances were processed by the Landsat Ecosystem Disturbance Adaptive Processing System (LEDAPS) algorithm (version 3.4.0) [66] and the Landsat 8 surface reflectances were processed by the Land Surface Reflectance Code (LaSRC) (version 1.4.1) [67]; auxiliary input data, such as water vapor, ozone, atmospheric pressure, and aerosol optical thickness, were retrieved from Moderate Resolution Imaging Spectroradiometer (MODIS); and the digital elevation derived from the Earth Topography Five Minute Grid [68]. For each Landsat image, six surface reflectance bands (Blue, Green, Red, NIR, SWIR1, and SWIR2), one thermal band (Brightness Temperature) and one quality assessment band were employed. To detect clouds, cloud shadows, and snow, we used the Function of Mask algorithm (FMask) combined with potential cloud pixels and the cloud probability mask to derive the potential cloud layer through discarding most unusable observations to reduce noise in the analysis [69,70]. We downloaded the CCDC version 12.30 from the Global Environmental Remote Sensing (GERS) Laboratory, and the data preparations were finished by the CCDC workflow and supported by the software ArcGIS 10.2 and ENVI 5.1 [54]. The overview flowchart is shown in Figure 2. City and county boundary datasets were obtained from the Data Center for Resources and Environmental Sciences, Chinese Academy of Sciences (RESDC) [22,71]. Auxiliary data were obtained from FROM-GLC and included the ground truth samples for the classification and reference data for the temporal-spatial accuracy assessment [72].

3. Methods

3.1. CCDC Algorithm and Annual LULC maps

Annual land cover changes were detected and mapped using the CCDC algorithm [37]. First, all available Landsat observations for each pixel were used to develop time series models with the seasonality, trend, and break components to detect the intra-annual, inter-annual, and abrupt changes by the following Equation (1) [37,73].
F ( i , x )   =   a 0 ,   i   +   a 1 ,   i cos ( 2 π T x )   +   b 1 ,   i sin ( 2 π T x )   +   c 1 , i x
where F is the fitted model for band i and time x (Julian date), a 0 ,   i is the coefficient for the mean of band i, a 1 ,   i and b 1 ,   i are the coefficients representing intra-annual change, c 1 ,   i x is the coefficient representing the inter-annual change, or trend, and T is the number of days per year (T = 365.25). If the land cover pattern does not change, the time series model will be continued. Once, the breaks were found by fitting a linear model to a stable history period of up to two dates. New observations were added and their residuals compared to the RMSE (Root Mean Square Error) of the history period. Whenever the error in the new observation was too high, the algorithm would place a break point and regard it as a potential change. If breaks accumulated enough in a point, a change was affirmed and a new stable model would be initialized. Generally, six breaks per pixel are used to provide a high confidence when the land-use pattern changed. The coefficients in Equation (1) were recorded as the input for the second part of the CCDC algorithm: land cover classification.
LULC classification in the CCDC was accomplished using a Random Forest Classifier (RFC) [74], because of its robustness in mapping large-area land cover, especially effective when a large number of features are included. The RFC model parameters were the model coefficients and RMSE. To balance computation time and classification accuracy, 500 bagging iterations were implemented in the RFC procedure, and the number of variables to split each node was limited to the square root of the total number of explanatory variables. The output of the RFC for each year was a six-category land cover map to satisfy our demand. According to the FROM-GLC Level 1 Type land cover system [72] and the actual situation in CZTUA, the LULC in the study was classified as Cropland (FROM-GLC classes of Crop), Forest (FROM-GLC classes of Forest), Grassland (FROM-GLC classes of Grass, Shrub), Wetland (FROM-GLC classes of Wetland), Water (FROM-GLC classes of Water), and Impervious Surface (FROM-GLC classes of Impervious, Bareland). We set the dynamics from the impervious surface as the urban expansion indicator. The ground truth samples were collected via visual interpretation, aided by very high resolution (VHR) images from Google EarthTM and prior research [22,75]. We randomly selected 26,670 samples within the study area among the six land cover categories; the samples proportion for each LULC category was controlled by the percentage of each class area in FROM-GLC10 (2017) [54,76]. Dividing the samples into two groups, 90% of the samples were used to train the RFC, and the remaining 10% were used for the accuracy assessment. The user’s and producer’s accuracy were calculated for each land cover type along with the overall accuracy [77].

3.2. Annual Urban Expansion Rate

In order to study the characteristics of urban expansion quantitatively (e.g., speed, extent, intensity, and direction), the annual increment (AI) (km2year−1) and the annual urban growth rate (AGR) (%) were calculated and used to quantify and compare the urban expansion speed of CZTUA during the study period. AI could show the newly developed impervious surface area per year and AGR could be used to make a better comparison among the cities, which could eliminate the influence of different primary city sizes [10]. The two indices were defined as follows:
A I   =   ( A e n d     A s t a r t d )
A G R   =   [ ( A e n d A s t a r t ) 1 d     1 ]   ×   100 %
where A s t a r t and A e n d are the urban area at the start and end year, respectively, while d is the time span of the study.

3.3. Urban Expansion Types

Urban growth patterns were generally classified as infilling, edge-expansion, and leapfrogging by Forman (1995) [78]. Infilling is defined as a new urban patch formed via filling in the gaps within existing urban patches. Edge-expansion is a type of urban growth in which a newly developed urban patch extends outward along the edge of existing urban patches. Leapfrogging growth represents new urban patches developed independently and without any existing urban patches. The landscape expansion index (LEI) [79] was calculated to define these three urban growth types using the following equation:
L E I   =   A 0 A 0   +   A v   ×   100 %
where A 0 is the area of the intersection between the buffer zone of the new patch and the existing patches (occupied category) and A v is the area of the intersection between the buffer and the vacant category. Infilling growth patch is defined by an LEI larger than 50 and an edge-expansion growth patch is defined by an LEI smaller than 50 but not equal to zero. The patches with a zero LEI were defined as leapfrogging growth.

3.4. Landscape Metrics

In order to reveal the evolution of the landscape pattern in the process of urbanization, six prominent landscape metrics based on spatial and complexity criteria were calculated to illustrate the characteristics of the CZTUA, which could avoid the influences of the different scales and extents of the regional boundary. These metrics include the Percentage of Landscape (PLAND), Largest Patch Index (LPI), Landscape Shape Index (LSI), Patch Density (PD), Patch Cohesion Index (COHESION) and Interspersion and Juxtaposition Index (IJI). These metrics could reflect the impervious surface patches’ spatial distribution and connectivity, which are relevant to urban expansion and able to show the results effectively [80]. PLAND describes the proportion of impervious surface in the total region area. LPI represents the percentage occupied by the largest patch, reflecting the city center. LSI and PD demonstrate the edge and density in the landscape, respectively. With impervious surface increase and the landscape becoming fragmented, the LSI and PD will increase, while the LSI and PD may decrease when the impervious surface patches merged [23]. COHESION explains the physical connectivity between the different impervious surface patches. IJI indicates the complexity of the patches around the impervious surface patches [81]. All of the landscape metrics were calculated for the impervious surface [20,23,27]. These metrics were computed for each of the selected cities at the landscape class with the help of FRAGSTATS 4.2. A detailed description for each metric is listed in Table 1. The formulas for the landscape metrics are listed in Equations (A1)–(A6).

4. Result

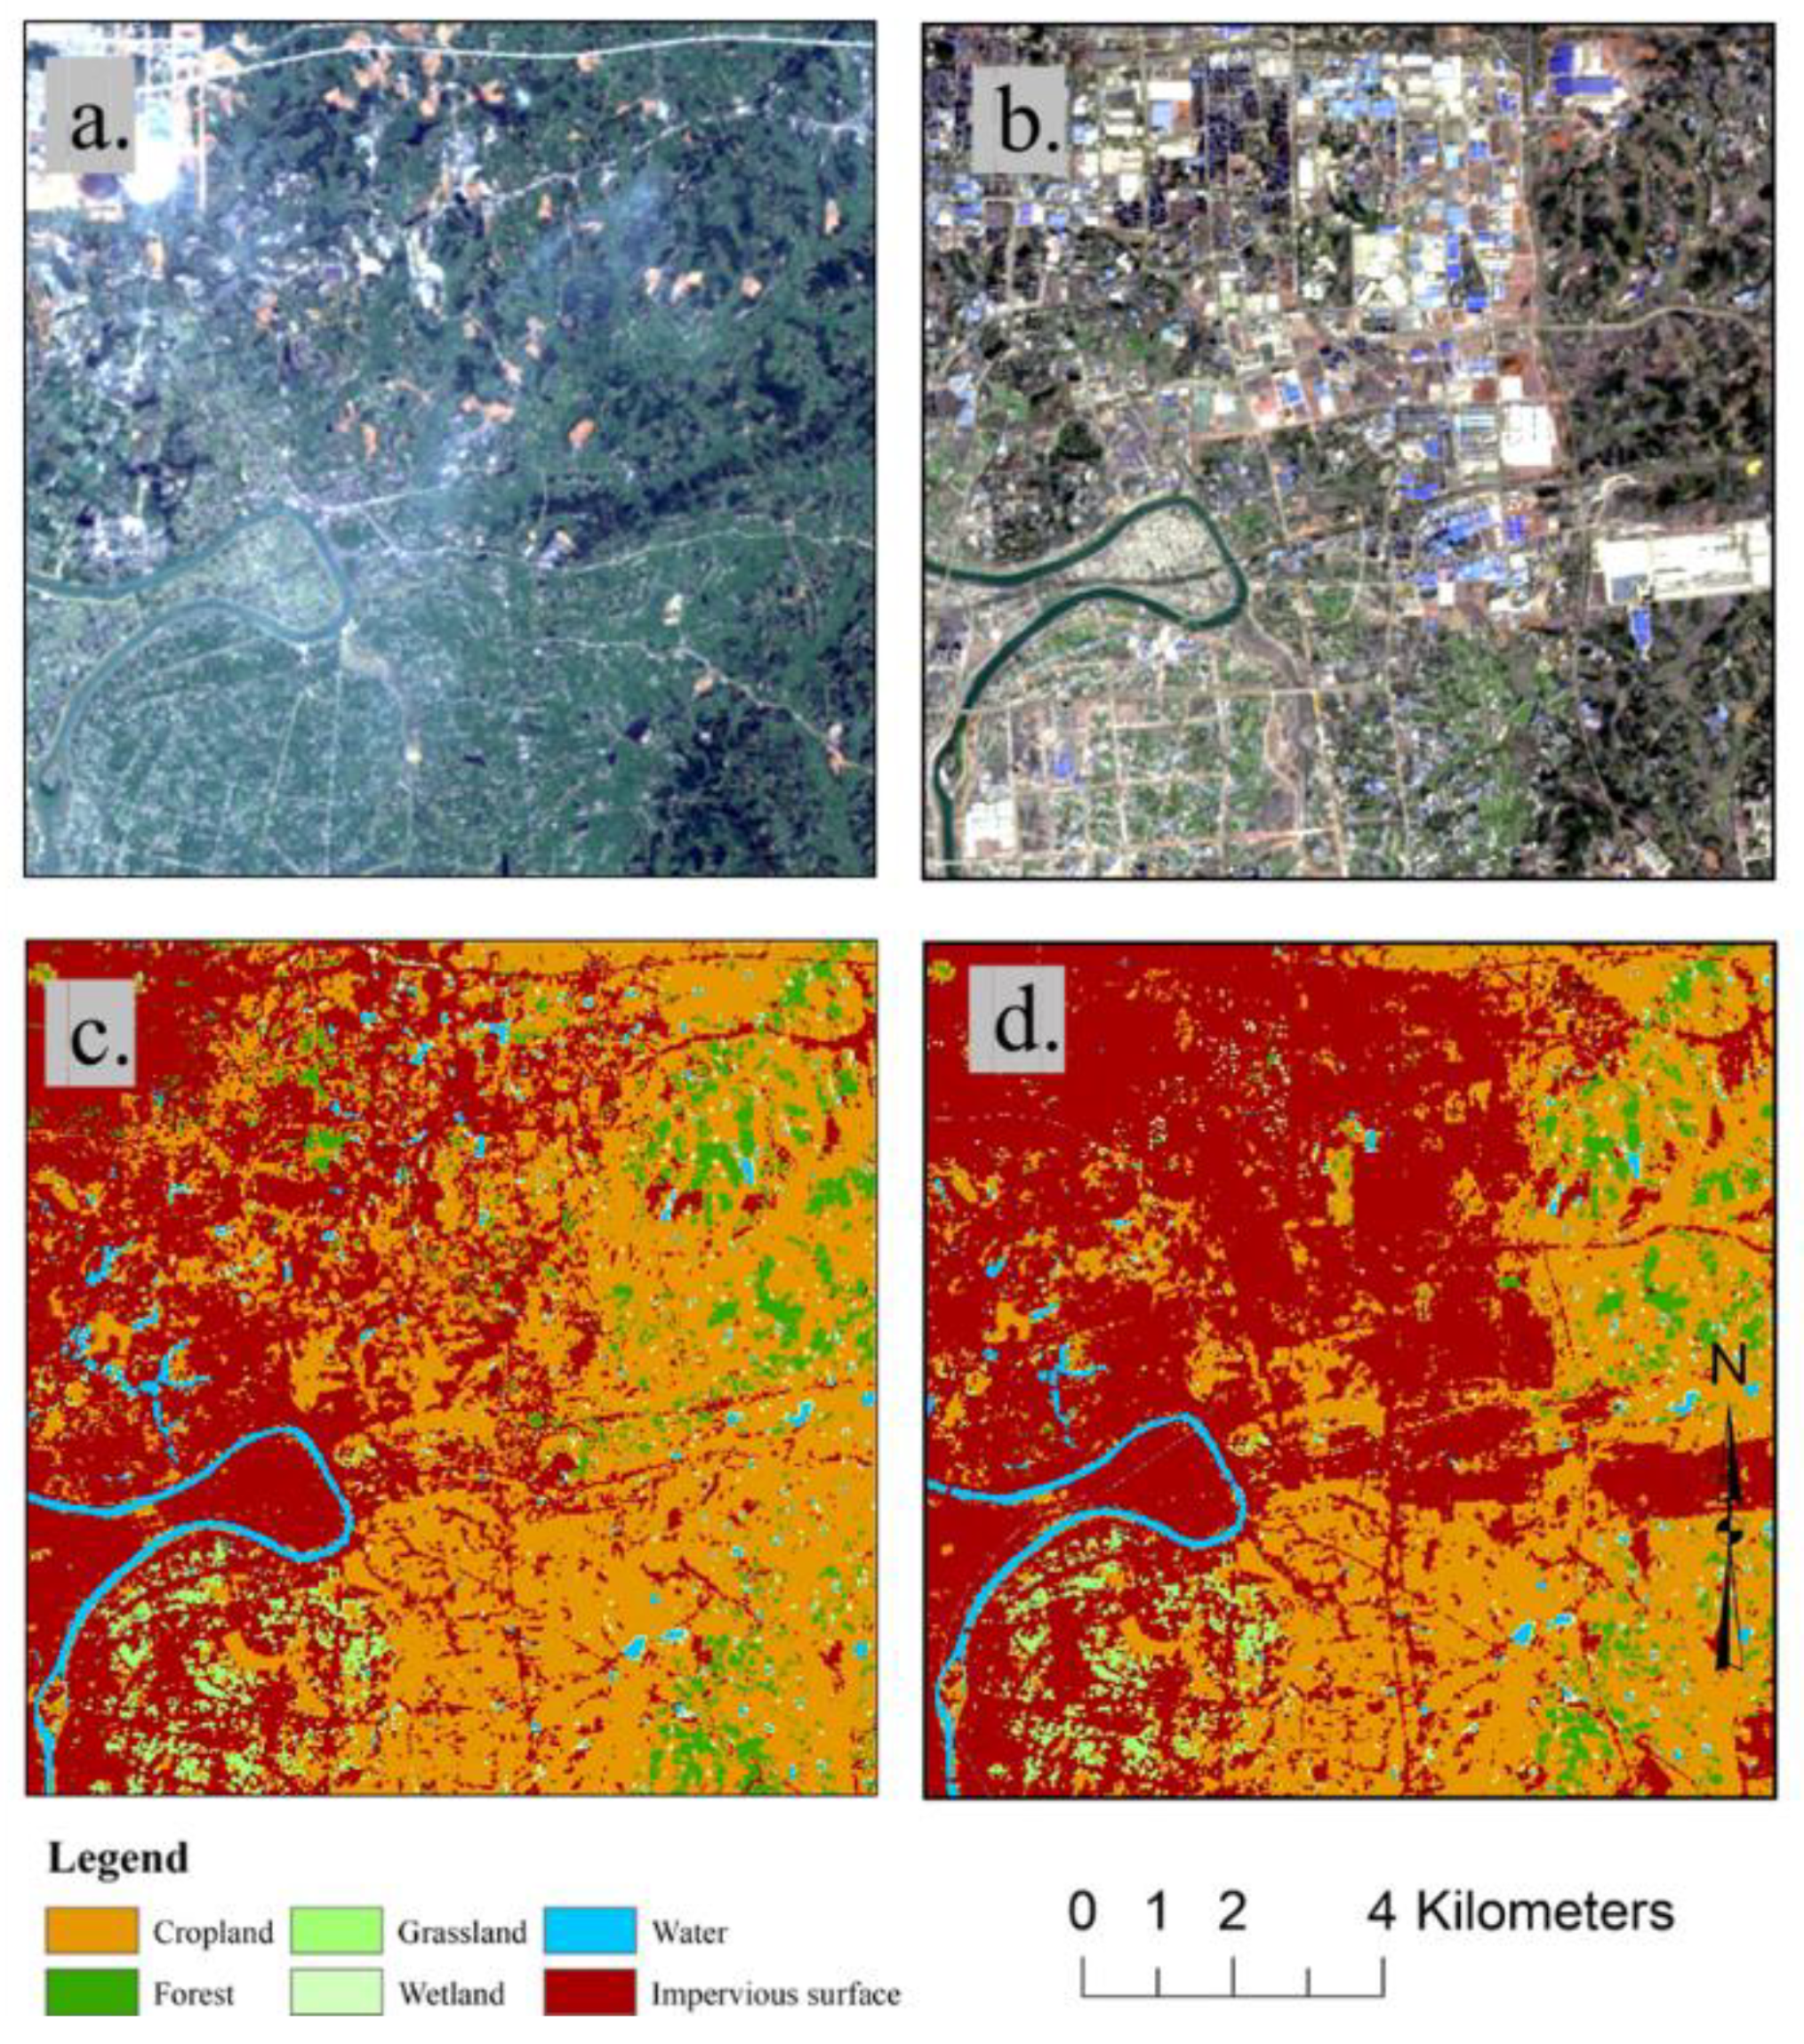
4.1. Accuracy of the LULC Classification

For the entire study area, we selected five years of the LULC maps (i.e., 2001, 2005, 2010, 2015, and 2017) for our spatiotemporal accuracy assessment. Validation samples were the remaining 10% of the samples. The classification results achieved an overall accuracy of 90.44%–92.31% across these five years (Table 2). Our results show that the highest overall accuracy (92.31%) was in 2001, followed by 92.20% (2005), 90.89% (2010), 90.63% (2017), with the related lowest one being 90.44% in 2015.
The classification results of the cropland, forest, and water classes were more accurate, while those of grassland and wetland were relatively poor. The difference in classification accuracy of different land covers may be due to the fact that the number of training samples for the grasslands and wetlands were less than those of the other land-cover types, typical for rare land cover types [82,83]. Besides, seasonal variations may also lead to the related low classification accuracy. For example, the probability of a misclassification between a cropland and forest was still high, and the grasslands and wetlands were confused easily. Nevertheless, the small differences in overall accuracy among the different years suggest that the CCDC model performed well in mapping the time series of LULC. So, the results could meet the requirement for monitoring and analyzing the urban expansion process. Figure 3 shows the Landsat images and resultant land cover maps in 2001 and 2017, respectively, in a typical area.

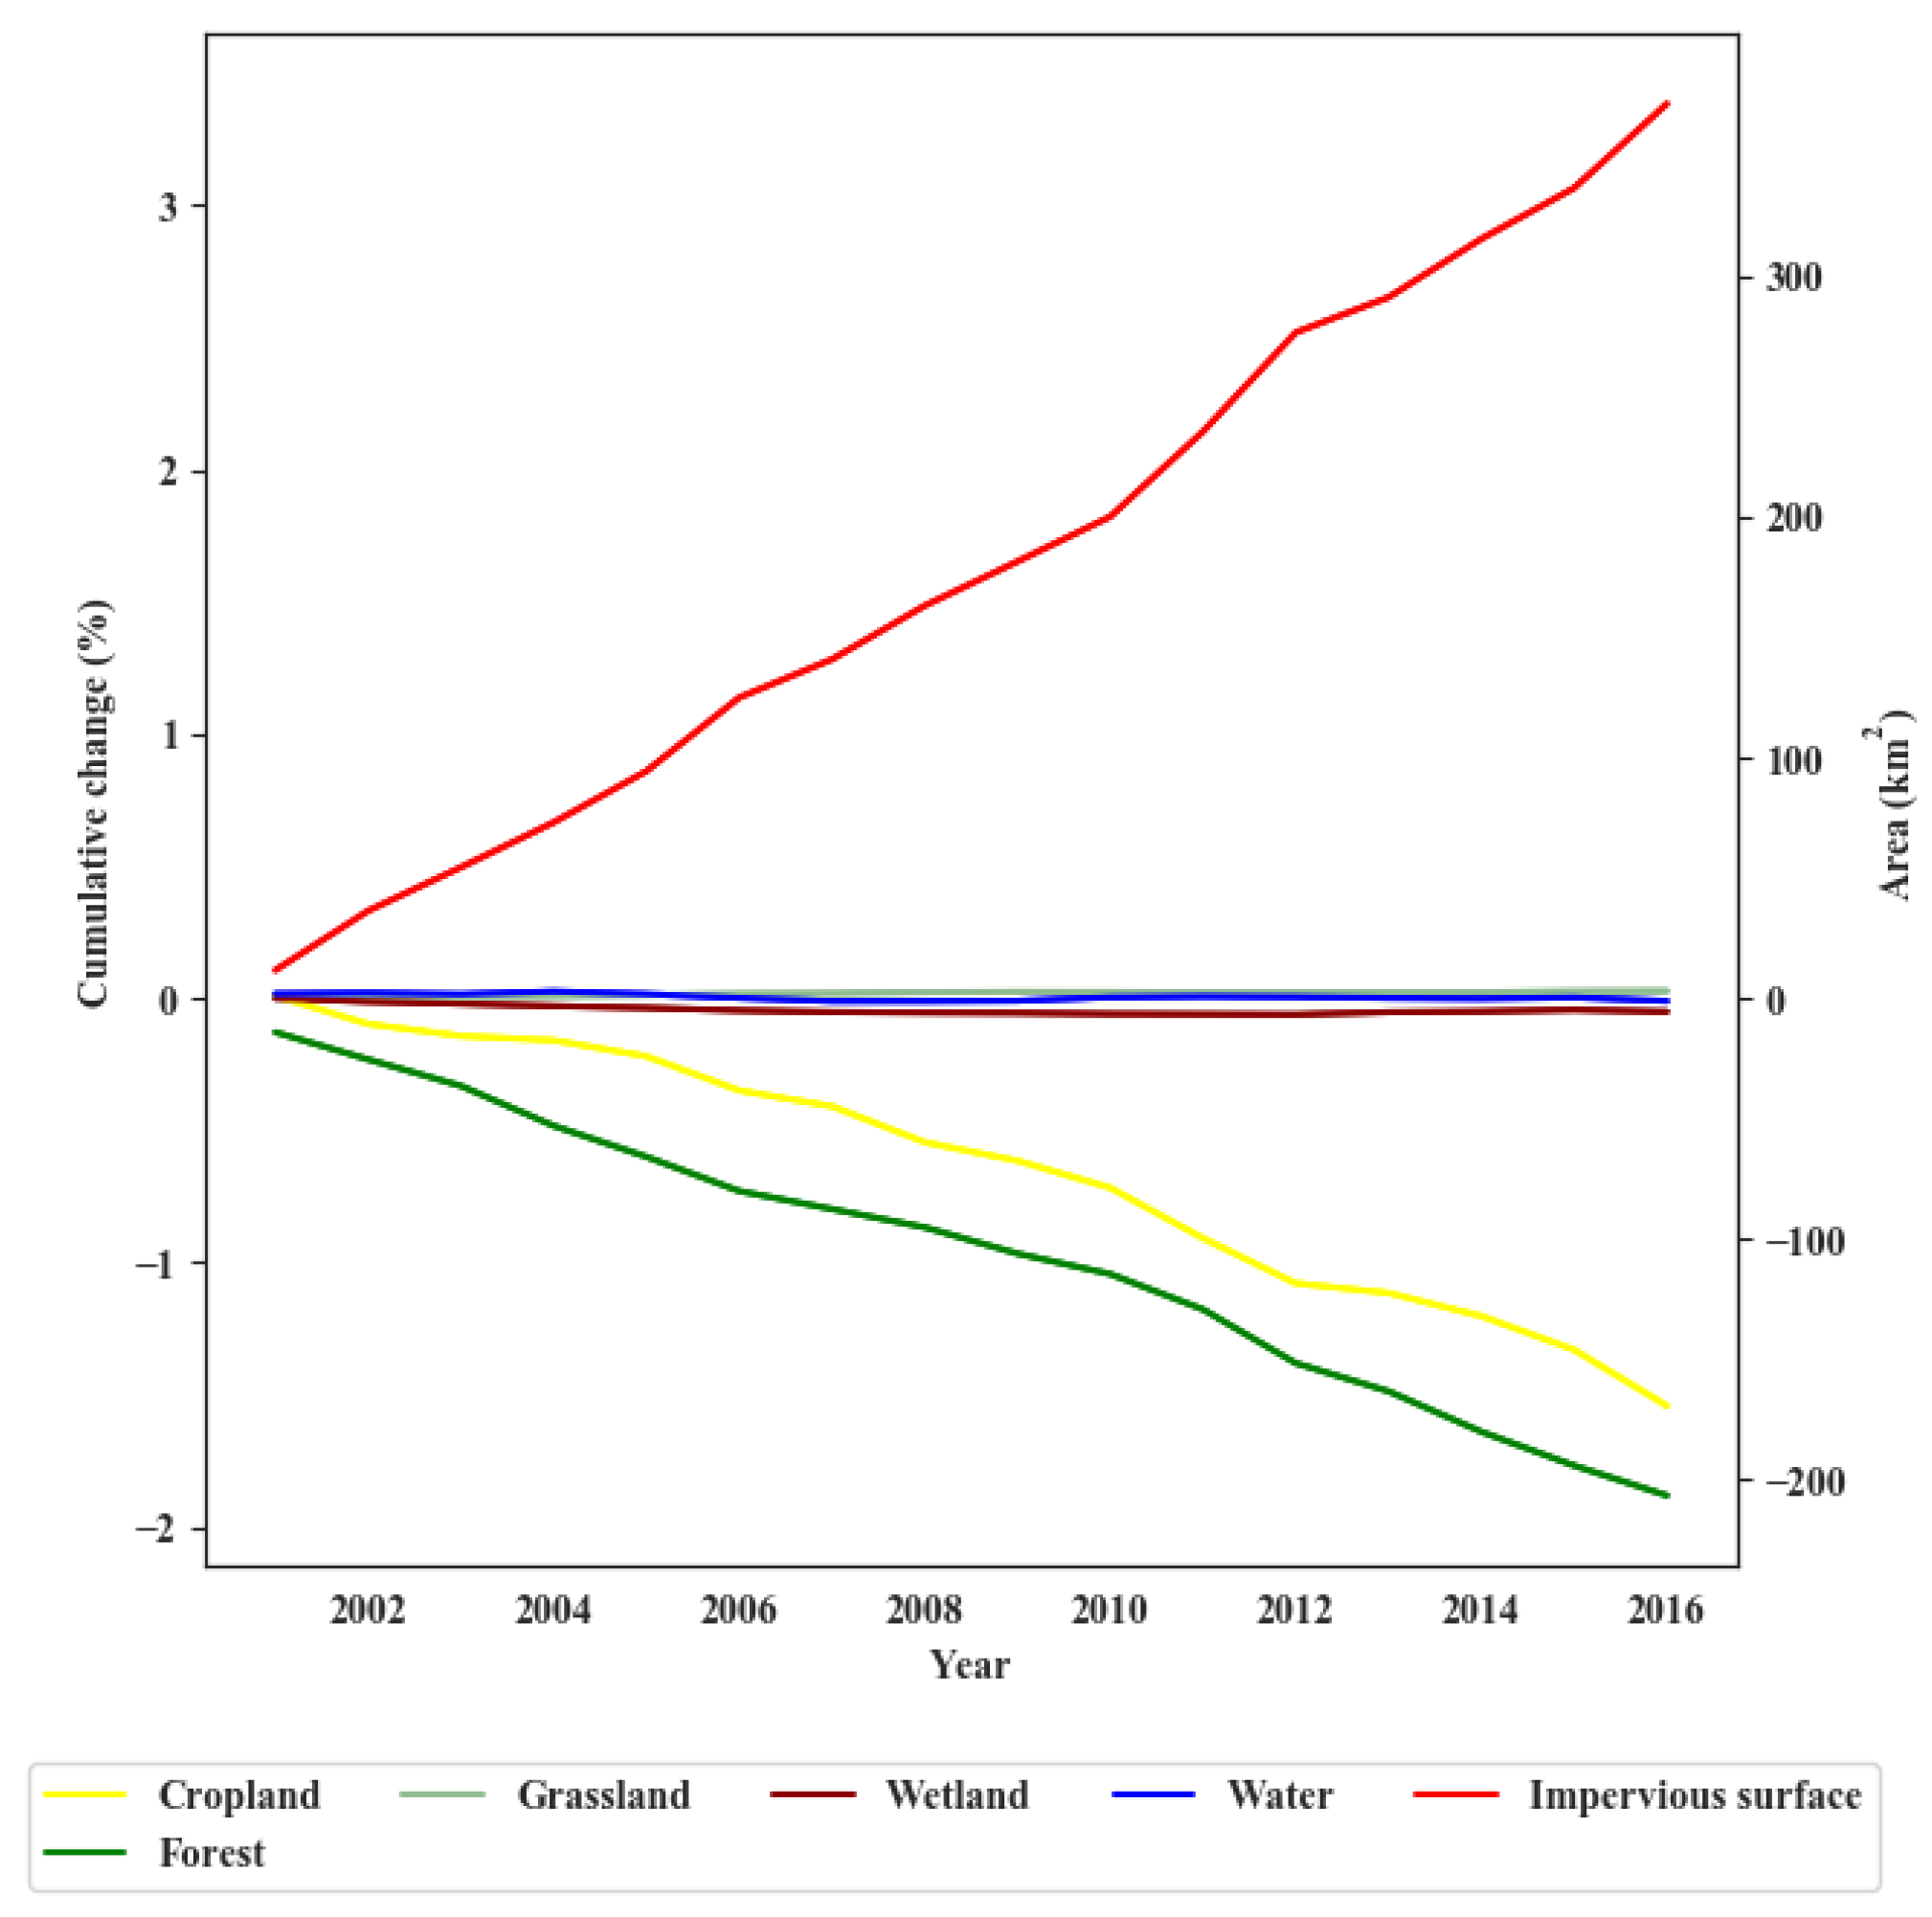
4.2. Temporal LULC Change from 2001 to 2017

Based on the yearly classification maps, the land cover in CZTUA has significantly and rapidly changed in the past 17 years (Figure 4). In general, the impervious surface area increased while the cropland and forest decreased continuously, and the water area, wetland, and grassland remained relatively stable. The land cover was composed of cropland of 5297 km2, forest of 4355 km2, grassland of 12 km2, wetland of 152 km2, water of 344 km2, and impervious surface of 808 km2 in CZTUA in the year of 2001 (Table A1). Overall, an increase of 371 km2 in impervious surface, and a decrease of 169 km2 and 206 km2 in cropland and forest, respectively, were observed from 2001 to 2017 in the study area (Figure 4). Most of the impervious surface was gained from both forest and cropland and the transformation from wetland, water, and grassland was not obvious (Table A2).
The impervious surface area increased from 808 km2 to 1179 km2 over the past 17 years with the net increase rate of 45.90% (Table A1). There was large spatial variation in the area of impervious surface increase among subregions: from 211 to 246 km2 (16.59%) for Changsha City; 145 to 227 km2 (56.55%) for Changsha County; 126 to 217 km2 (72.22%) for Wangcheng District; 82 to 106 km2 (29.27%) for Zhuzhou City; 31 to 64 km2 (106.45%) for Zhuzhou County; 63 to 94 km2 (49.21%) for Liling City; 83 to 103 km2 (24.10%) for Xiangtan City; 57 to 110 km2 (92.98%) for Xiangtan County; and 9 to 13 km2 (44.44%) for Shaoshan City (Table A4).
Figure 5 demonstrates the annual increment (AI) and annual growth rate (AGR) of the impervious surface for nine regions over the past 17 years. The AIs of impervious surface for Changsha County in the year of 2006, Wangcheng District in the year of 2011 and 2012, and Xiangtan County in the year of 2012 were the highest, which were greater than 10 km2 in the observation. A very small decrease in impervious surface was also presented in Changsha City during the years from 2013 to 2015. The relatively low AIs of impervious surface were appeared in Shaoshan City, which was lower than 0.1 km2 for most of the time. The AIs in the rest of the regions of CZTUA were increasing steadily. The highest AGR was presented in the Xiangtan county in 2012. AGRs in Changsha City, Xiangtan City, and Zhuzhou City became negative during certain periods. Zhuzhou County, Xiangtan County, and Wangcheng District had a relatively high AGR among the nine regions (Table A3).

4.3. Spatiotemporal Dynamics of Urban Expansion

CZTUA demonstrated great spatial variability in urban development from 2001 to 2017 (Figure 6). Changsha City, Xiangtan City, and Zhuzhou City are the belt-shaped cities that were initially developed along the river. In recent years, urbanization in the southern part of Changsha City, the northeast of Xiangtan City and the northwest of Zhuzhou City has been active, showing a trend of triangular convergence (Figure 6c). For Changsha County and Wangcheng District, the primary core has been constantly expanding outward, especially in the eastern part of Changsha County and western part of Wangcheng District (Figure 6a,b). Meanwhile, the urban area of Zhuzhou County and Xiangtan County expanded rapidly after the year 2010, resulting in a doubling growth. Shaoshan City and Liling City were developmentally restrained.
Figure 7 shows the dynamics for the proportion of three urban growth types (i.e., leapfrogging, edge-expansion, and infilling) of the newly developed impervious surface patches in CZTUA during the study period. It could be seen that there was large spatial and temporal variability during the urban expansion processes across regions. Over the entire study period, infilling was the dominant growth type with a steady trend to decrease, possibly as the gaps became filled. On the other hand, leapfrogging had a marginal occurrence at the beginning of the time series, to later become the dominant urban growth type in 2016. Edge-expansion remained more stable throughout the time series. The proportion of infilling reduced steadily from about 80% in 2001 to 40% in 2016 in Changsha City, while the proportion of edge-expansion increased smoothly from about 20% to 40% and the share of leapfrogging increased from about 0% to 10% (Figure 7). In 2016, leapfrogging increased sharply in Changsha County and Wangcheng District. Most of the newly developed urban land in Changsha County concentrated around the existing urban area and is distributed with the newly developed highways and airport in the region (Figure 3b).

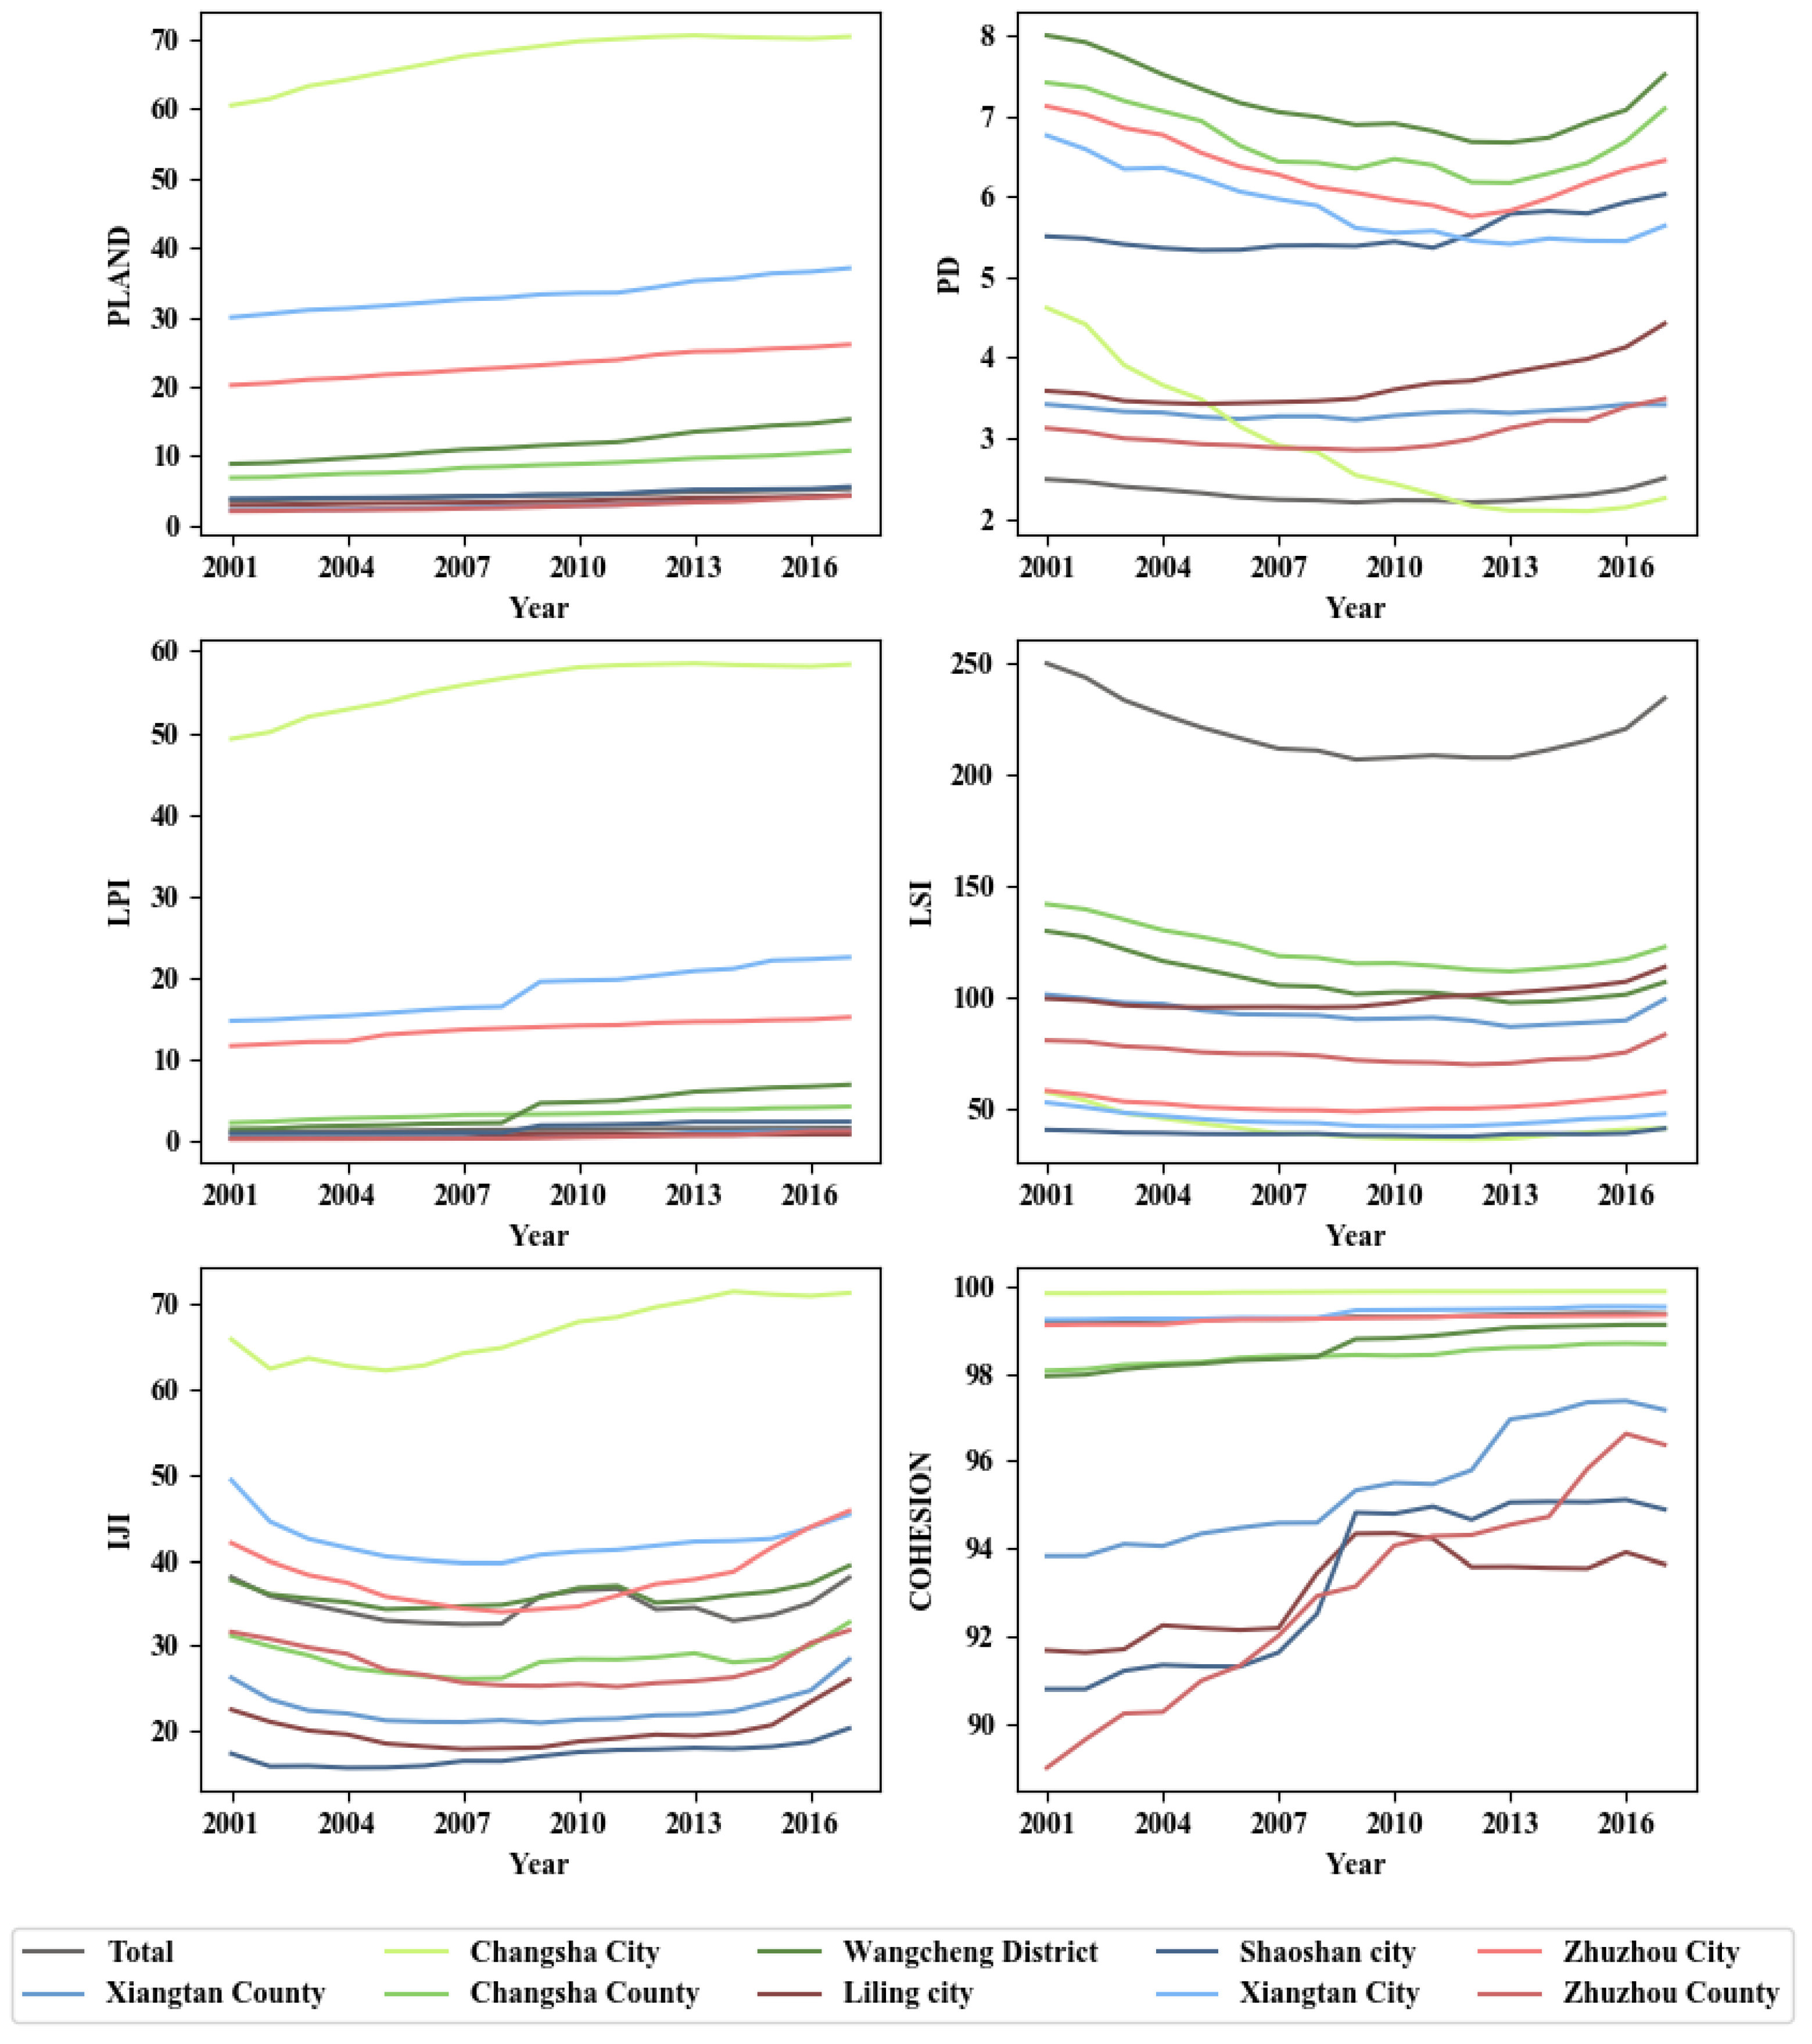
4.4. Landscape Changes during Urban Expansion

Figure 8 shows the annual changes in landscape metrics in CZTUA. The PLAND and LPI increased slowly for all nine regions during whole period. Changes in LPI suggested the proportion of the largest urban patch (the existed impervious surface) in each region. Specifically, Changsha City presented the highest proportion in PLAND and LPI with a steady increased rate among the nine regions, while the rest of the regions showed a similar pattern in PLAND and LPI though the values were lower than those for Changsha City. The LPI in Xiangtan City, Shaoshan City, and Wangcheng District has greatly increased from 2007 to 2010.
The landscape metrics PD and LSI described the complexity and fragmentation for the impervious surface. The PDs in Wangcheng District, Changsha County, and Zhuzhou City were relatively higher than those in other regions, with a slow decline in the early stage and rapid growth in the latest period. The remaining regions had a relatively lower PD and could form a different group. Changsha City was different from all other regions by presenting a steady decrease in PD over the past 17 years. Contrarily, Liling City, Xiangtan County, and Zhuzhou County increased in the latest period and had no significant changes in the earlier stage. In the total area of CZTUA, PD changed a little during the observation and kept a relatively low value. For the LSI, CZTUA had the highest LSI with the U-shape function changed. In this study, the LSI was lower than 150 in the past 17 years. According to the value of the LSI, the cities in CZTUA could be roughly divided into three groups, the first group of which were greater than 90, including Changsha County, Shaoshan City, Liling City, and Xiangtan County; for the second group, which includes Zhuzhou County, the LSI was between 60 to 90; the last group, with an LSI lower than 60, includes Zhuzhou City, Changsha City, Xiangtan City, and Shaoshan City. Most of regions in CZTUA were under a steady and similar pattern in LSI. The IJI and COHESION metrics represent aggregation and connectivity. IJI in Changsha City was the highest throughout the period, rising from 50 in 2001 to just under 70 until 2013, when there was a levelling off for three years. The remaining regions presented a similar pattern, which decreased first and then increased or kept the value without change for IJI. Wangcheng District and Changsha County had a reverse U-shape during this observation. For COHESION, Changsha City, Xiangtan City, Zhuzhou City, Wangcheng District, and Changsha County had a relatively higher value, which was close to 100, and presented a steady value or slight increase from 2001 to 2017. Xiangtan County, Shaoshan City, and Liling City increased steady before 2009 and stabilized in the latest period, while Xiangtan County, with a little bit of hysteresis, persisted by increasing up to 2013. Zhuzhou County presents sustainable growth in COHESION.

5. Discussion

5.1. Co-Evolution of Multi-Cities in CZTUA

For the nine regions in CZTUA, Changsha County, Wangcheng District, and Xiangtan County had the greatest magnitude of urban expansion from 2001 to 2017, with the net increase area of 82 km2, 91 km2, and 53 km2, respectively. Xiangtan county, Zhuzhou county, and Wangcheng District had the highest net increase rates, with 92.79%, 105.10%, and 71.91%, respectively (Table A4). Besides, Changsha City had the greatest primary impervious surface area, but its net increase rate was the smallest among the study area (Table A4).
Changsha City is the provincial city of Hunan province, which developed earlier with prior policy support. Cheap labor promoted manufacturing and heavy industry, and thousands of natural resources were developed in that early stage. The large existence of backward primary industry presented a great challenge for sustainable development pattern of the city [43]. Consequently, a strategy has been put in place to promote industrial upgrading, translocation, and co-evolution with neighboring cities [84]. Changsha County and Wangcheng District became the main receiving area for some of the city’s industries, especially in 2003, 2007, and 2013. In these periods, Changsha City had slowed down the pace of urban expansion while Changsha County and Wangcheng District accelerated the pace of urban expansion and achieved the greatest AIs in CZTUA (Figure 5). Both PD and LSI in Changsha City, Wangcheng District, and Changsha County decreased from 2001 to 2013, indicating that the impervious surface patches gradually merged (Figure 8). Besides, the COHESION of Zhuzhou county, Xiangtan City, and Xiangtan County increased beyond 3%, especially after 2009, indicating the connectivity in these regions achieved a high level in a short time (Figure 8). The AGR in Xiangtan County and Zhuzhou county had presented the highest values, reflecting that these regions were also promoted (Figure 5). The co-evolution pattern of the multi-cities could be summarized as follows: the core city developed first due to policy advantages, and the surrounding cities developed primarily benefited from the industrial upgrading of the core city. As a result, all cities were developed and presented co-evolution pattern where the cities in a specific region play a coordinated urban function. Many social, economic, and industrial studies show a similar pattern [12,15,16,85].
The co-evolution pattern of multi-cities in CZTUA may be an example of city development in other regions as some international megalopolises experienced a similar urbanization process. For instance, the Northeast megalopolis, the most populous megalopolis in US, has spent a very long time in integrating the major cities such as Boston, New York City, and Washington, D.C., along with their metropolitan areas and suburbs [86]. The urban industrial upgrading and transformation from major cities in the later 20th century had promoted the development of the surrounding cities. The Atlantic Ocean coastal cities connected with each other from northeast to southwest and differentiated into diverse specific functions, which could be regarded as the co-evolution model [84,87]. China and other developing countries are following this urbanization pattern and promoting urban area integration, sustainability, and livability in relatively short term [42,88].

5.2. Spatiotemporal Dynamics of Urban Expansion and the Possible Drivers

CZTUA presents a triangle pattern in geography, which made the urban agglomeration develop a polycentric pattern. Besides, the Xiang River winds its way through the core cities and provides a natural urban developing pattern [61]. On one hand, urbanization brings vitality to the city, promoting residents’ lives more efficiently and conveniently; but on the other hand, the negative consequences, especially in the old town, also emerged with urban expansion. Therefore, managing and promoting the urban areas to be livable and sustainable is a crucial and thorny issue for the management of the national and local governments. All these characteristics lead to distinct specific dynamics in the landscape metrics and urban expansion types during the urbanization process in CZTUA. In the earlier period, the three core cities were relatively independent, physically along the Xiang River, and the suburbs were not associated. As the transportation systems, such as highways, the G-series high-speed train, and urban rail, were built up, all regions in CZTUA were gradually connected, resulting in an increased IJI and COHESION.
The spatiotemporal difference between urban and suburban development was an important driving force of landscape change in CZTUA [89]. For urban areas, such as Changsha City, Zhuzhou City, and Xiangtan City, the dominant urban growth type had experienced an obvious transformation from infilling to edge-expansion. That would be explained by urban development theory [90,91], building main roads inside a city firstly and improving the connectivity between the urban and suburban areas, which also promote the inner-city grid gradually (Figure 6 a, b). Most newly developed impervious surfaces were distributed between the roads and filled-up blanks, resulting from the dominant urban growth and infilling (Figure 7). Subsequently, the inside city was gradually filled up, and with the continuous increase in land prices, the urban expansion type turned to edge-expansion, as shown by previous similar studies [10,23,27]. For the suburban areas, urbanization was relatively slow and natural, and there was no significant dominant urban growth type presented in the earlier period. With the three core cities built well, the expansion type was converted to edge-expansion because the capital and workforce transferred from urban to suburban [20]. In the latest period, a series high and new technology industrial development zones were designated in urban–rural fringe areas far away from the existing impervious surface (Figure 6c,d). These zones played a crucial role in both economic development and urban construction [92]. As a consequence, the urban expansion type shifted from edge-expansion to leapfrogging [61].

5.3. Urban Expansion under the Guidance of Policy

The nine regions in CZTUA had a steady urban increase over the past 17 years. The scale of urban expansion was ranked in the order of Zhuzhou County, Xiangtan County, Wangcheng District, Changsha County, Liling City, Shaoshan City, Zhuzhou City, Xiangtan City, and Changsha City with the net increase rate (2001–2017) of 105.10%, 92.79%, 71.91%, 56.80%, 47.54%, 44.56%, 28.95%, 23.64%, and 16.38%, respectively (Figure 6, Table A4). These rates were highly dependent on the administrative level, which can be roughly divided into three types of growth: the stable-growing type, including Changsha City, Zhuzhou City, and Xiangtan City; the fast-growing type, including Wangcheng District and Changsha County; and the slow-growing type, including Shaoshan City and Liling City. These characteristics of the CZTUA had a very important and close overlap with national development strategies and economic policies, as well as the local government measures and implementations [93].
Earlier national policies for urbanization in China mainly focused on coastal megacities and land-locked cities did not catch up with the pace of development, therefore some cities in CZTUA were relatively backward. Until the year 2002, the Rise of Central China policy was adopted by the central government, mainly aimed at improving the central China’s capacity for the coordinated development [2,94]. The local government of Hunan province, promoting the integration of CZTUA under a scientific and systematic urban planning, shaped up the first urban agglomeration plan in 2005. This plan considered the differences in physical geography and economic background of the three core cities, spelled out different urban designations and orientations, eventually made a significant impact on the evolution of the cities. Specifically, Changsha City is a comprehensive metropolis for the development of culture, education, finance, science, and technology, and played a leading role; Zhuzhou City focused on the development of producer services on the basis of transportation and industries; Xiangtan City was based on the heavy industry and has gradually promoted the incubation of high-tech industries, which is closer to the producer services. Three core cities along the Xiang River took the leadership in forming a megacity, while other regions were less driven by policies during this period. The two policies implemented in 2000 and 2005 promoted the growth of urban expansion from 2000 to 2010, of which Changsha City, Wangcheng District, and Changsha County contributed the largest proportion of growth, followed by Xiangtan City and Zhuzhou City, and the rest still grew slowly [95].
Later on, the resource-saving and environment friendly urban development strategy was proposed by both the central government and the local government in 2007. According to the different characteristics of the cities, different urban development goals were defined so as to achieve the suitable and sustainable development goals. It was suggested that the original policies should be continued in the three core cities and in the suburban areas, such as Shaoshan City and Liling City; also, a core conservation area connecting the three core cities has been designated as the green heart and any urban land development would be banned there (Figure 6c). Some prior urban developing regions, such as Wangcheng District, Changsha County, and Xiangtan County, have been designated primarily for economic development. In 2010, the National Economic and Technical Development Zones were approved and setup in Jiuhua, Xiangtan County, resulted in large-scale expansion of the city (Figure 5) [96]. Since 2012, the ecological red lines policy has been implemented in CZTUA, which curbed illegal and activities (e.g., mining in the core conservation regions) and even converted some urban land (e.g., brown fields) to vegetated surfaces, which leading to negative numbers during the years from 2013 to 2015 in Changsha City (Figure 5). Managing urban development in accordance with location-specific features has become the main ideology of the current policy.
The significant difference between the core cities and the surrounding cities may be caused by the guidance of the national and local policies. The observations showed that the core cities have grown steadily over the past 17 years, indicating the urban expansion rates have slowed down as these regions approach their peak in urbanization process. In the prior developing satellite cities, social capital from the core cities has been attracted to accelerate their urbanization process. We concluded this pattern as “cool center and hot edge”, describing the pace of the urban expansion in the core cities that has slowed but having been accelerated in the satellite cities. This pattern may indicate a transformation in co-evolution of multi-cities with powerful policy guidance in China.

6. Conclusions

Urbanization has been one of the most significant human impacts on the environment, and it is believed to be one of the biggest challenges for the national and local government in China. A coordinated development pattern in polycentric urban agglomeration is regarded as a solution to avoid the adverse impacts from urbanization. However, there are few studies that could reveal the spatiotemporal details of the urbanization, resulting from inferior data and inappropriate data processing tools. This study provided a continuous and comprehensive understanding of the spatiotemporal landscape dynamics in a typical urban agglomeration of China, which was timely and necessary to support the regional urban master planning.
This study used the CCDC algorithm to integrate all available Landsat images and obtain annual LULC maps. Since this algorithm was pixel-based, it required substantial computing power but could effectively capture the annual landscape dynamics in the urban area. Tracking the LULC changes could provide a unique perspective for decisionmakers and promote more sustainable, livable urban development. The results showed that CZTUA has experienced a rapid change over the past 17 years. A total 371 km2 (with annual growth rate 2.25%) impervious surface expansion was observed with cropland and forest decreasing by 169 km2 and 206 km2 in the CZTUA, respectively; most of the impervious surface was converted from cropland and forest. Annual growth rates slowed down gradually in the core cities and accelerated in the surrounding areas; we concluded this pattern as “cool center and hot edge”, which may indicate an important urbanization transformation pattern in China. Urban expansion types also had a significant transformation. The dominant urban expansion type changed from infilling to leapfrogging in the three core cities. While not significant in the earlier period, edge-expansion and leapfrogging became the main urban expansion types in the latest period in the suburban areas. The co-evolution pattern funded in this study indicated that multi-cities may experience an inevitable stage in the process of urbanization and more further studies need to be conducted to explore and summarize more extensively in different countries with different policy backgrounds and in the different stages of urban development.

Author Contributions

All the authors have made a substantial contribution towards the successful completion of this manuscript. They were all involved in designing the study, drafting the manuscript, and engaging in critical discussion. Conceptualization, S.L., M.L.; Data curation, M.L.; Formal analysis, M.L., S.L.; Funding acquisition, S.L.; Investigation, M.L., S.L.; Methodology, S.L., M.L.; Project administration, S.L.; Software, M.L.; Validation, M.L.; Visualization, M.L.; Writing—original draft, M.L.; Writing—review & editing, S.L., M.L., Y.N., Y.Z., R.V., R.G., W.T., D.M., I.R., M.K., W.H. All authors have read and approved the final manuscript.

Funding

This work was supported by the National Natural Science Foundation of China (Grant No. 41971152); the Hunan Innovative Talent Program (Grant No. 2019RS1062) to S Liu; the Scientific Innovation Fund for Post-graduates of Central South University of Forestry and Technology (Grant No. CX20202013); and the Post-graduate Scientific Research Innovation Project of Hunan Province (Grant No. CX20200726).

Acknowledgments

We would like to thank Zhe Zhu for sharing his CCDC codes. Comments from the anonymous reviewers are greatly appreciated.

Conflicts of Interest

The authors declare that they have no known competing financial interests or personal relationships that could have appeared to influence the work reported in this paper.

Appendix A

Figure A1. Overview of the data footprints and the study area boundary. The CZTUA is covered by two Landsat scenes (blue squares), and the specific study city boundary.
Remotesensing 12 02905 g0a1
Table A1. Annual LULC area (km2), Net Change area (km2) (2001–2017) and Net Change rate (%) (2001–2017) in CZTUA.
YearCroplandForestGrasslandWetlandWaterImpervious Surface
20015297435412152344808
20025298434013152346820
20035286432813151346844
20045281431713150346863
20055279430113149347881
20065273428814148346902
20075259427414147344933
20085252426614147343949
20095237425915146343971
20105229424815146343989
201152184239151463451008
201251974225151463451043
201351784202151463451084
201451744191151473441099
201551654174151473441123
201651514160151473451144
201751284147151473431179
Net Change area (km2)−169−2063−6−1371
Net Change rate (%)−3.19%−4.74%23.33%−3.70%−0.35%45.90%
Table A2. LULC transformation area (km2) matrix from 2001 to 2017 in this study
Year 2001
CroplandForestGrasslandWetlandWaterImpervious
2017Cropland4920.02166.900.114.864.6911.49
Forest69.114069.460.032.060.937.05
Grassland1.871.2410.810.050.291.13
Wetland6.431.030.01132.651.365.19
Water13.903.170.102.02318.531.57
Impervious316.57108.371.415.543.51756.24
Table A3. Annual increase (AI) impervious surface area (km2) and annual growth rate (AGR) (%) for CZTUA among 2001 to 2017.
PeriodsAIAGR
2001–200211.581.43
2002–200324.613
2003–200418.042.14
2004–200518.632.16
2005–200621.272.41
2006–200730.523.38
2007–200815.841.7
2008–200922.282.35
2009–201018.341.89
2010–201118.61.88
2011–201235.313.5
2012–201341.113.94
2013–201414.61.35
2014–201524.242.21
2015–201621.071.88
2016–201734.953.05
2001–20173712.25
Table A4. Annual impervious surface area (km2), Net increase area (2001–2017) (km2) and Net increase rate (2001–2017) (%) in different regions of CZTUA.
Region
YearChangsha CityChangsha CountyWangcheng DistrictLiling CityShaoshan CityXiangtan CityXiangtan CountyZhuzhou CityZhuzhou County
200121114512663983578231
200221514612864984588432
200322115213366986598633
200422415813868987598734
200522816014269988628935
200623216414970989649035
2007236175155711090679137
2008239178158731091699339
2009241183163741092729441
2010244187167761093749643
2011245191171801193769744
20122461971818211958310048
20132472041928612989410251
20142462071978712989710352
2015245212204881210010110457
2016245219208901210110410560
2017246227217941310311010664
Net increase area (km2)35829130420532433
Net increase rate (%)16.38%56.80%71.91%47.54%44.56%23.64%92.79%28.95%105.10%
Formulas of the Landscape metrics in this study.
P L A N D   =   P i   =   (   j   =   1 i a i j A   ×   100 %   )
P D   =   n i A  
L P I   =   m a x ( a i j ) A   ×   100 %
L S I   =   0.25   ×   E * A  
I J I   =   i = 1 m k = i + 1 m   [   (   e i k E   )   ×   l n (   e i k E   )   ] l n ( 0.5 [ m ( m 1 ) ] )   ×   100 %
C O H E S I O N   =   [ 1 j = 1 i p i j j = 1 i p i j a i j ] [ 1 1 A   ] 1   ×   100 %
where P i is the proportion of the landscape occupied by patch type i, a i j is the area (m2) of patch ij, A is the total area (m2) (A1)(A3)(A6); n i is the number of patches in the landscape of patch type i (A2); E * is the total length (m) of edge in landscape (A4); e i k is the total length (m) of edge in landscape between patch types i and k, m is the number of patch types present in the landscape (A5); p i j is the perimeter of patch ij in terms of number of cell surfaces (A6).

References

  1. UN DESA (United Nations Department of Economic and Social Affairs). World Urbanization Prospects: The 2018 Revision; United Nations: New York, NY, USA, 2019; Available online: https://www.un.org/development/desa/publications/2018-revision-of-world-urbanization-prospects.html (accessed on 7 July 2020).
  2. Zhong, Y.; Lin, A.; He, L.; Zhou, Z.; Yuan, M. Spatiotemporal Dynamics and Driving Forces of Urban Land-Use Expansion: A Case Study of the Yangtze River Economic Belt, China. Remote Sens. 2020, 12, 287. [Google Scholar] [CrossRef] [Green Version]
  3. Mbow, H.O.; Reisinger, A.; Canadell, J.; O’Brien, P. Special Report on Climate Change, Desertification, Land Degradation, Sustainable Land Management, Food Security, and Greenhouse Gas Fluxes in Terrestrial Ecosystems (SR2); IPCC: Ginevra, Switzerland, 2017. [Google Scholar]
  4. Sun, D.; Zhou, L.; Li, Y.; Liu, H.; Shen, X.; Wang, Z. New-type urbanization in China: Predicted trends and investment demand for 2015–2030. J. Geogr. Sci. 2017, 27, 943–966. [Google Scholar] [CrossRef]
  5. Stokes, E.C.; Seto, K.C. Characterizing urban infrastructural transitions for the Sustainable Development Goals using multi-temporal land, population, and nighttime light data. Remote Sens. Environ. 2019, 234, 111430. [Google Scholar] [CrossRef]
  6. Fu, Y.; Li, J.; Weng, Q.; Zheng, Q.; Li, L.; Dai, S.; Guo, B. Characterizing the spatial pattern of annual urban growth by using time series Landsat imagery. Sci. Total Environ. 2019, 666, 274–284. [Google Scholar] [CrossRef]
  7. Xu, G.; Zhou, Z.; Jiao, L.; Zhao, R. Compact Urban Form and Expansion Pattern Slow Down the Decline in Urban Densities: A Global Perspective. Land Use Policy 2020, 94, 104563. [Google Scholar] [CrossRef]
  8. Xu, G.; Jiao, L.; Liu, J.; Shi, Z.; Zeng, C.; Liu, Y. Understanding urban expansion combining macro patterns and micro dynamics in three Southeast Asian megacities. Sci. Total Environ. 2019, 660, 375–383. [Google Scholar] [CrossRef]
  9. Zhou, D.; Zhang, L.; Hao, L.; Sun, G.; Liu, Y.; Zhu, C. Spatiotemporal trends of urban heat island effect along the urban development intensity gradient in China. Sci. Total Environ. 2016, 544, 617–626. [Google Scholar] [CrossRef]
  10. Zhao, S.; Zhou, D.; Zhu, C.; Sun, Y.; Wu, W.; Liu, S. Spatial and Temporal Dimensions of Urban Expansion in China. Environ. Sci. Technol. 2015, 49, 9600–9609. [Google Scholar] [CrossRef]
  11. Nuismer, S. Introduction to Coevolutionary Theory, 1st ed.; Macmillan Higher Education: New York, NY, USA, 2017; p. 270. [Google Scholar]
  12. Madhok, A.; Liu, C. A coevolutionary theory of the multinational firm. J. Int. Manag. 2006, 12, 1–21. [Google Scholar] [CrossRef]
  13. Fang, C.; Yu, D. Urban agglomeration: An evolving concept of an emerging phenomenon. Landsc. Urban Plan. 2017, 162, 126–136. [Google Scholar] [CrossRef]
  14. Strange, W.C. Urban Agglomeration. In The New Palgrave Dictionary of Economics; Palgrave Macmillan: London, UK, 2016; pp. 1–5. [Google Scholar] [CrossRef]
  15. Vance, J.E.; Gottman, J. Megalopolis: The Urbanized Northeastern Seaboard of the United States. Econ. Geogr. 1963, 39, 183. [Google Scholar] [CrossRef]
  16. Bestor, T.C. Neighborhood Tokyo, 1st ed.; Stanford University Press: Redwood City, CA, USA, 1989. [Google Scholar]
  17. Zhu, Z.; Wulder, M.A.; Roy, D.P.; Woodcock, C.E.; Hansen, M.C.; Radeloff, V.C.; Healey, S.P.; Schaaf, C.; Hostert, P.; Strobl, P.; et al. Benefits of the free and open Landsat data policy. Remote Sens. Environ. 2019, 224, 382–385. [Google Scholar] [CrossRef]
  18. Li, F.; Zhao, M.; Zhou, Y.; Zhu, L.; Tian, H. The seasonal and annual impacts of landscape patterns on the urban thermal comfort using Landsat. Ecol. Indic. 2020, 110, 105798. [Google Scholar] [CrossRef]
  19. Kuang, W.; Zhang, S.; Li, X.; Lu, D. A 30-meter resolution national urban land-cover dataset of China, 2000–2015. Earth Syst. Sci. Data Discuss 2019, 2019, 1–33. [Google Scholar] [CrossRef] [Green Version]
  20. Wu, W.; Zhao, S.; Zhu, C.; Jiang, J. A comparative study of urban expansion in Beijing, Tianjin and Shijiazhuang over the past three decades. Landsc. Urban Plan. 2015, 134, 93–106. [Google Scholar] [CrossRef]
  21. Zou, Y.; Peng, H.; Liu, G.; Yang, K.; Xie, Y.; Weng, Q. Monitoring Urban Clusters Expansion in the Middle Reaches of the Yangtze River, China, Using Time-Series Nighttime Light Images. Remote Sens. 2017, 9, 1007. [Google Scholar] [CrossRef] [Green Version]
  22. Liu, C.; Zhang, Q.; Luo, H.; Qi, S.; Tao, S.; Xu, H.; Yao, Y. An efficient approach to capture continuous impervious surface dynamics using spatial-temporal rules and dense Landsat time series stacks. Remote Sens. Environ. 2019, 229, 114–132. [Google Scholar] [CrossRef]
  23. Meng, L.; Sun, Y.; Zhao, S. Comparing the spatial and temporal dynamics of urban expansion in Guangzhou and Shenzhen from 1975 to 2015: A case study of pioneer cities in China’s rapid urbanization. Land Use Policy 2020, 97, 104753. [Google Scholar] [CrossRef]
  24. Dou, Y.; Kuang, W. A comparative analysis of urban impervious surface and green space and their dynamics among 318 different size cities in China in the past 25 years. Sci. Total Environ. 2020, 706, 135828. [Google Scholar] [CrossRef]
  25. Yue, W.; Qiu, S.; Xu, H.; Xu, L.; Zhang, L. Polycentric urban development and urban thermal environment: A case of Hangzhou, China. Landsc. Urban Plan. 2019, 189, 58–70. [Google Scholar] [CrossRef]
  26. Unit, Economist Intelligence. Supersized Cities: China’s 13 Megalopolises. The Economist. 2012. Available online: https://www.eiu.com/public/topical_report.aspx?campaignid=Megalopolis2012 (accessed on 17 July 2020).
  27. Fei, W.; Zhao, S. Urban land expansion in China’s six megacities from 1978 to 2015. Sci. Total Environ. 2019, 664, 60–71. [Google Scholar] [CrossRef] [PubMed]
  28. Shayesteh, H.; Steadman, P. Coevolution of urban form and built form: A new typomorphological model for Tehran. Environ. Plan. B Plan. Des. 2015, 42, 1124–1147. [Google Scholar] [CrossRef]
  29. Yin, J.; Yin, Z.; Zhong, H.; Xu, S.; Hu, X.; Wang, J.; Wu, J. Monitoring urban expansion and land use/land cover changes of Shanghai metropolitan area during the transitional economy (1979–2009) in China. Environ. Monit. Assess. 2010, 177, 609–621. [Google Scholar] [CrossRef] [PubMed]
  30. Hersperger, A.M.; Oliveira, E.; Pagliarin, S.; Palka, G.; Verburg, P.H.; Bolliger, J.; Grădinaru, S.R. Urban land-use change: The role of strategic spatial planning. Glob. Environ. Chang. 2018, 51, 32–42. [Google Scholar] [CrossRef]
  31. Chakraborty, T.; Lee, X. A simplified urban-extent algorithm to characterize surface urban heat islands on a global scale and examine vegetation control on their spatiotemporal variability. Int. J. Appl. Earth Obs. Geoinf. 2019, 74, 269–280. [Google Scholar] [CrossRef]
  32. Chai, B.; Seto, K.C. Conceptualizing and characterizing micro-urbanization: A new perspective applied to Africa. Landsc. Urban Plan. 2019, 190, 103595. [Google Scholar] [CrossRef]
  33. Zhu, Z.; Woodcock, C.E.; Olofsson, P. Continuous monitoring of forest disturbance using all available Landsat imagery. Remote Sens. Environ. 2012, 122, 75–91. [Google Scholar] [CrossRef]
  34. Yan, J.; Wang, L.; Song, W.; Chen, Y.; Chen, X.; Deng, Z. A time-series classification approach based on change detection for rapid land cover mapping. ISPRS J. Photogramm. Remote Sens. 2019, 158, 249–262. [Google Scholar] [CrossRef]
  35. Xu, T.; Ma, T.; Zhou, C.; Zhou, Y. Characterizing Spatio-Temporal Dynamics of Urbanization in China Using Time Series of DMSP/OLS Night Light Data. Remote Sens. 2014, 6, 7708–7731. [Google Scholar] [CrossRef] [Green Version]
  36. Liu, X.; Huang, Y.; Xu, X.; Li, X.; Li, X.; Ciais, P.; Lin, P.; Gong, K.; Ziegler, A.D.; Chen, A.; et al. High-spatiotemporal-resolution mapping of global urban change from 1985 to 2015. Nat. Sustain. 2020, 3, 1–7. [Google Scholar] [CrossRef]
  37. Zhu, Z.; Woodcock, C.E. Continuous change detection and classification of land cover using all available Landsat data. Remote Sens. Environ. 2014, 144, 152–171. [Google Scholar] [CrossRef] [Green Version]
  38. Deng, C.; Zhu, Z. Continuous subpixel monitoring of urban impervious surface using Landsat time series. Remote Sens. Environ. 2020, 238, 110929. [Google Scholar] [CrossRef]
  39. Tang, X.; Bullock, E.L.; Olofsson, P.; Estel, S.; Woodcock, C.E. Near real-time monitoring of tropical forest disturbance: New algorithms and assessment framework. Remote Sens. Environ. 2019, 224, 202–218. [Google Scholar] [CrossRef]
  40. Zhou, Q.; Liu, S.; Hill, M.J. A Novel Method for Separating Woody and Herbaceous Time Series. Photogramm. Eng. Remote Sens. 2019, 85, 509–520. [Google Scholar] [CrossRef]
  41. Irwin, E.G.; Bockstael, N.E. The evolution of urban sprawl: Evidence of spatial heterogeneity and increasing land fragmentation. Proc. Natl. Acad. Sci. USA 2007, 104, 20672–20677. [Google Scholar] [CrossRef] [PubMed] [Green Version]
  42. Tan, Y.; Xu, H.; Zhang, X. Sustainable urbanization in China: A comprehensive literature review. Cities 2016, 55, 82–93. [Google Scholar] [CrossRef]
  43. Zhang, J.; Yu, L.; Li, X.; Zhang, C.; Shi, T.; Wu, X.; Yang, C.; Gao, W.; Li, Q.; Wu, G. Exploring Annual Urban Expansions in the Guangdong-Hong Kong-Macau Greater Bay Area: Spatiotemporal Features and Driving Factors in 1986–2017. Remote Sens. 2020, 12, 2615. [Google Scholar] [CrossRef]
  44. Kennedy, R.E.; Yang, Z.; Cohen, W.B. Detecting trends in forest disturbance and recovery using yearly Landsat time series: 1. LandTrendr—Temporal segmentation algorithms. Remote Sens. Environ. 2010, 114, 2897–2910. [Google Scholar] [CrossRef]
  45. Zhu, L.; Liu, X.; Wu, L.; Tang, Y.; Meng, Y. Long-Term Monitoring of Cropland Change near Dongting Lake, China, Using the LandTrendr Algorithm with Landsat Imagery. Remote Sens. 2019, 11, 1234. [Google Scholar] [CrossRef] [Green Version]
  46. Huang, C.; Goward, S.N.; Masek, J.G.; Thomas, N.; Zhu, Z.; Vogelmann, J.E. An automated approach for reconstructing recent forest disturbance history using dense Landsat time series stacks. Remote Sens. Environ. 2010, 114, 183–198. [Google Scholar] [CrossRef]
  47. Tong, X.; Brandt, M.; Yue, Y.; Ciais, P.; Jepsen, M.R.; Penuelas, J.; Wigneron, J.-P.; Xiao, X.; Song, X.-P.; Horion, S. Forest management in southern China generates short term extensive carbon sequestration. Nat. Commun. 2020, 11, 1–10. [Google Scholar] [CrossRef]
  48. Gómez, C.; White, J.C.; Wulder, M.A. Optical remotely sensed time series data for land cover classification: A review. ISPRS J. Photogramm. Remote Sens. 2016, 116, 55–72. [Google Scholar] [CrossRef] [Green Version]
  49. Cohen, W.B.; Healey, S.P.; Yang, Z.; Zhu, Z.; Gorelick, N. Diversity of Algorithm and Spectral Band Inputs Improves Landsat Monitoring of Forest Disturbance. Remote Sens. 2020, 12, 1673. [Google Scholar] [CrossRef]
  50. Tang, X.; Hutyra, L.R.; Arévalo, P.; Baccini, A.; Woodcock, C.E.; Olofsson, P. Spatiotemporal tracking of carbon emissions and uptake using time series analysis of Landsat data: A spatially explicit carbon bookkeeping model. Sci. Total Environ. 2020, 720, 137409. [Google Scholar] [CrossRef] [PubMed]
  51. Wang, Z.; Lechner, A.M.; Yang, Y.; Baumgartl, T.; Wu, J. Mapping the cumulative impacts of long-term mining disturbance and progressive rehabilitation on ecosystem services. Sci. Total Environ. 2020, 717, 137214. [Google Scholar] [CrossRef]
  52. Stumpf, F.; Schneider, M.K.; Keller, A.; Mayr, A.; Rentschler, T.; Meuli, R.G.; Schaepman, M.E.; Liebisch, F. Spatial monitoring of grassland management using multi-temporal satellite imagery. Ecol. Indic. 2020, 113, 106201. [Google Scholar] [CrossRef]
  53. Zhu, Z. Change detection using landsat time series: A review of frequencies, preprocessing, algorithms, and applications. ISPRS J. Photogramm. Remote Sens. 2017, 130, 370–384. [Google Scholar] [CrossRef]
  54. Zhu, Z.; Gallant, A.L.; Woodcock, C.E.; Pengra, B.W.; Olofsson, P.; Loveland, T.R.; Jin, S.; Dahal, D.; Yang, L.; Auch, R.F. Optimizing selection of training and auxiliary data for operational land cover classification for the LCMAP initiative. ISPRS J. Photogramm. Remote Sens. 2016, 122, 206–221. [Google Scholar] [CrossRef] [Green Version]
  55. Zhu, Z.; Fu, Y.; Woodcock, C.E.; Olofsson, P.; Vogelmann, J.; Holden, C.; Wang, M.; Dai, S.; Yu, Y. Including land cover change in analysis of greenness trends using all available Landsat 5, 7, and 8 images: A case study from Guangzhou, China (2000–2014). Remote Sens. Environ. 2016, 185, 243–257. [Google Scholar] [CrossRef] [Green Version]
  56. Fu, P.; Weng, Q. A time series analysis of urbanization induced land use and land cover change and its impact on land surface temperature with Landsat imagery. Remote Sens. Environ. 2016, 175, 205–214. [Google Scholar] [CrossRef]
  57. Zhu, Z.; Zhou, Y.; Seto, K.C.; Stokes, E.C.; Deng, C.; Pickett, S.T.; Taubenböck, H. Understanding an urbanizing planet: Strategic directions for remote sensing. Remote Sens. Environ. 2019, 228, 164–182. [Google Scholar] [CrossRef]
  58. Li, Z.; Jiang, W.; Wang, W.; Lei, X.; Deng, Y. Exploring spatial-temporal change and gravity center movement of construction land in the Chang-Zhu-Tan urban agglomeration. J. Geogr. Sci. 2019, 29, 1363–1380. [Google Scholar] [CrossRef] [Green Version]
  59. Liu, L.; Silva, E.A.; Wu, C.; Wang, H. A machine learning-based method for the large-scale evaluation of the qualities of the urban environment. Comput. Environ. Urban Syst. 2017, 65, 113–125. [Google Scholar] [CrossRef]
  60. Fan, S.; Kanbur, R.; Zhang, X. China’s regional disparities: Experience and policy. Rev. Dev. Financ. 2011, 1, 47–56. [Google Scholar] [CrossRef] [Green Version]
  61. Quan, B.; Ren, H.; Pontius, R.G.; Liu, P. Quantifying spatiotemporal patterns concerning land change in Changsha, China. Landsc. Ecol. Eng. 2018, 14, 257–267. [Google Scholar] [CrossRef]
  62. Berhane, T.M.; Lane, C.R.; Mengistu, S.G.; Christensen, J.R.; Golden, H.E.; Qiu, S.; Zhu, Z.; Wu, Q. Land-Cover Changes to Surface-Water Buffers in the Midwestern USA: 25 Years of Landsat Data Analyses (1993–2017). Remote Sens. 2020, 12, 754. [Google Scholar] [CrossRef] [Green Version]
  63. Masek, J.; Vermote, E.; Saleous, N.; Wolfe, R.E.; Hall, F.; Huemmrich, K.; Gao, F.; Kutler, J.; Lim, T.-K. A Landsat Surface Reflectance Dataset for North America, 1990–2000. IEEE Geosci. Remote Sens. Lett. 2006, 3, 68–72. [Google Scholar] [CrossRef]
  64. Claverie, M.; Vermote, E.; Franch, B.; Masek, J.G. Evaluation of the Landsat-5 TM and Landsat-7 ETM+ surface reflectance products. Remote Sens. Environ. 2015, 169, 390–403. [Google Scholar] [CrossRef]
  65. Roy, D.; Kovalskyy, V.; Zhang, H.; Vermote, E.; Yan, L.; Kumar, S.; Egorov, A. Characterization of Landsat-7 to Landsat-8 reflective wavelength and normalized difference vegetation index continuity. Remote Sens. Environ. 2016, 185, 57–70. [Google Scholar] [CrossRef] [Green Version]
  66. Schmidt, G.; Jenkerson, C.B.; Masek, J.; Vermote, E.; Gao, F. Landsat ecosystem disturbance adaptive processing system (LEDAPS) algorithm description. Open File Rep. 2013, 27, 2653–2662. [Google Scholar]
  67. Skakun, S.; Vermote, E.F.; Roger, J.-C.; Justice, C.O.; Masek, J.G. Validation of the LaSRC Cloud Detection Algorithm for Landsat 8 Images. IEEE J. Sel. Top. Appl. Earth Obs. Remote Sens. 2019, 12, 2439–2446. [Google Scholar] [CrossRef]
  68. Vermote, E.; Tanre, D.; Deuze, J.; Herman, M.; Morcette, J.J. Second Simulation of the Satellite Signal in the Solar Spectrum, 6S: An overview. IEEE Trans. Geosci. Remote Sens. 1997, 35, 675–686. [Google Scholar] [CrossRef] [Green Version]
  69. Qiu, S.; He, B.; Zhu, Z.; Liao, Z.; Quan, X. Improving Fmask cloud and cloud shadow detection in mountainous area for Landsats 4–8 images. Remote Sens. Environ. 2017, 199, 107–119. [Google Scholar] [CrossRef]
  70. Qiu, S.; Zhu, Z.; He, B. Fmask 4.0: Improved cloud and cloud shadow detection in Landsats 4–8 and Sentinel-2 imagery. Remote Sens. Environ. 2019, 231, 111205. [Google Scholar] [CrossRef]
  71. Xu, H.; Wei, Y.; Liu, C.; Li, X.; Fang, H. A Scheme for the Long-Term Monitoring of Impervious—Relevant Land Disturbances Using High Frequency Landsat Archives and the Google Earth Engine. Remote Sens. 2019, 11, 1891. [Google Scholar] [CrossRef] [Green Version]
  72. Gong, P.; Wang, J.; Yu, L.; Zhao, Y.; Zhao, Y.; Liang, L.; Niu, Z.; Huang, X.; Fu, H.; Liu, S.; et al. Finer resolution observation and monitoring of global land cover: First mapping results with Landsat TM and ETM+ data. Int. J. Remote Sens. 2012, 34, 2607–2654. [Google Scholar] [CrossRef] [Green Version]
  73. Zhou, Q.; Rover, J.; Brown, J.F.; Worstell, B.B.; Howard, D.; Wu, Z.; Gallant, A.L.; Rundquist, B.; Burke, M. Monitoring Landscape Dynamics in Central U.S. Grasslands with Harmonized Landsat-8 and Sentinel-2 Time Series Data. Remote Sens. 2019, 11, 328. [Google Scholar] [CrossRef] [Green Version]
  74. Valbuena, R.; Maltamo, M.; Packalén, P. Classification of forest development stages from national low-density lidar datasets: A comparison of machine learning methods. Rev. Teledetección 2016, 45, 15–25. [Google Scholar] [CrossRef] [Green Version]
  75. Awty-Carroll, K.; Bunting, P.; Hardy, A.; Bell, G. Using Continuous Change Detection and Classification of Landsat Data to Investigate Long-Term Mangrove Dynamics in the Sundarbans Region. Remote Sens. 2019, 11, 2833. [Google Scholar] [CrossRef] [Green Version]
  76. Gong, P.; Liu, H.; Zhang, M.; Li, C.; Wang, J.; Huang, H.; Clinton, N.; Ji, L.; Li, W.; Bai, Y.; et al. Stable classification with limited sample: Transferring a 30-m resolution sample set collected in 2015 to mapping 10-m resolution global land cover in 2017. Sci. Bull. 2019, 64, 370–373. [Google Scholar] [CrossRef] [Green Version]
  77. Foody, G.M. Explaining the unsuitability of the kappa coefficient in the assessment and comparison of the accuracy of thematic maps obtained by image classification. Remote Sens. Environ. 2020, 239, 111630. [Google Scholar] [CrossRef]
  78. Forman, R.T.T. Some general principles of landscape and regional ecology. Landsc. Ecol. 1995, 10, 133–142. [Google Scholar] [CrossRef]
  79. Liu, X.; Li, X.; Chen, Y.; Tan, Z.; Li, S.; Ai, B. A new landscape index for quantifying urban expansion using multi-temporal remotely sensed data. Landsc. Ecol. 2010, 25, 671–682. [Google Scholar] [CrossRef]
  80. Riitters, K.; O’Neill, R.V.; Hunsaker, C.T.; Wickham, J.D.; Yankee, D.H.; Timmins, S.P.; Jones, K.B.; Jackson, B.L. A factor analysis of landscape pattern and structure metrics. Landsc. Ecol. 1995, 10, 23–39. [Google Scholar] [CrossRef]
  81. McGarigal, K. FRAGSTATS: Spatial Pattern Analysis Program for Quantifying Landscape Structure; US Department of Agriculture, Forest Service, Pacific Northwest Research Station: Portland, OR, USA, 1995; Volume 351.
  82. Mellor, A.; Boukir, S.; Haywood, A.; Jones, S. Exploring issues of training data imbalance and mislabelling on random forest performance for large area land cover classification using the ensemble margin. ISPRS J. Photogramm. Remote Sens. 2015, 105, 155–168. [Google Scholar] [CrossRef]
  83. Jin, H.; Stehman, S.V.; Mountrakis, G. Assessing the impact of training sample selection on accuracy of an urban classification: A case study in Denver, Colorado. Int. J. Remote Sens. 2014, 35, 2067–2081. [Google Scholar] [CrossRef]
  84. Jürgens, U.; Krzywdzinski, M. Competence development on the shop floor and industrial upgrading: Case studies of auto makers in China. Int. J. Hum. Resour. Manag. 2014, 26, 1204–1225. [Google Scholar] [CrossRef]
  85. Wan, Y.; Deng, C.; Wu, T.; Jin, R.; Chen, P.; Kou, R. Quantifying the Spatial Integration Patterns of Urban Agglomerations along an Inter-City Gradient. Sustainability 2019, 11, 5000. [Google Scholar] [CrossRef] [Green Version]
  86. He, Q.; Zeng, C.; Xie, P.; Tan, S.; Wu, J. Comparison of urban growth patterns and changes between three urban agglomerations in China and three metropolises in the USA from 1995 to 2015. Sustain. Cities Soc. 2019, 50, 101649. [Google Scholar] [CrossRef]
  87. Humphrey, J.; Memedovic, O. The Global Automotive Industry Value Chain: What Prospects for Upgrading by Developing Countries. SSRN Electron. J. 2003, 2, 2–19. [Google Scholar] [CrossRef] [Green Version]
  88. Chen, J. Rapid urbanization in China: A real challenge to soil protection and food security. Catena 2007, 69, 1–15. [Google Scholar] [CrossRef]
  89. Dwyer, J.F.; Childs, G.M. Movement of people across the landscape: A blurring of distinctions between areas, interests, and issues affecting natural resource management. Landsc. Urban Plan. 2004, 69, 153–164. [Google Scholar] [CrossRef]
  90. Kahn, M.E. The environmental impact of suburbanization. J. Policy Anal. Manag. 2000, 19, 569–586. [Google Scholar] [CrossRef]
  91. Zhang, T. Community features and urban sprawl: The case of the Chicago metropolitan region. Land Use Policy 2001, 18, 221–232. [Google Scholar] [CrossRef]
  92. Hirschhorn, J.S. Environment, Quality of Life, and Urban Growth in the New Economy. Environ. Qual. Manag. 2001, 10, 1–8. [Google Scholar] [CrossRef]
  93. Tan, X.; Ouyang, Q.; An, Y.; Mi, S.; Jiang, L.; Zhou, G. Evolution and driving forces of rural functions in urban agglomeration: A case study of the Chang-Zhu-Tan region. J. Geogr. Sci. 2019, 29, 1381–1395. [Google Scholar] [CrossRef] [Green Version]
  94. Dai, Y.; Feng, L.; Hou, X.; Choi, C.-Y.; Liu, J.; Cai, X.; Shi, L.; Zhang, Y.; Gibson, L. Policy-driven changes in enclosure fisheries of large lakes in the Yangtze Plain: Evidence from satellite imagery. Sci. Total Environ. 2019, 688, 1286–1297. [Google Scholar] [CrossRef]
  95. Chen, Q.; Song, Y. Methods of dividing the boundary of urban agglomerations: Chang-Zhu-Tan Urban Agglomeration as a case. Sci. Geogr. Sin. 2010, 30, 660–666. [Google Scholar] [CrossRef]
  96. Yang, B.; Chen, Z.; Zhang, C.; Dong, J.; Peng, X. Distribution patterns and major sources of dioxins in soils of the Changsha-Zhuzhou-Xiangtan urban agglomeration, China. Ecotoxicol. Environ. Saf. 2012, 84, 63–69. [Google Scholar] [CrossRef]
Figure 1. The location of the study area: (a) the study area in China; (b) the study area in the Hunan Province; (c) the distribution of the nine regions in Chang–Zhu–Tan.
Remotesensing 12 02905 g001
Figure 2. Methodology flowchart in this study.
Remotesensing 12 02905 g002
Figure 3. Example of the CZTUA LULC change between the year of 2001 and 2017: (a) the high-technology development zone in Changsha County 28 June 2001 Landsat image with true color; (b) a Landsat image with true color 17 December 2017; (c) the Continuous Change Detection and Classification (CCDC) LULC map contemporaneous with (a); and (d) the CCDC LULC map contemporaneous with (b).
Remotesensing 12 02905 g003
Figure 4. The cumulative LULC changes in area of various land covers between 2001 and 2017 for the total CZTUA.
Remotesensing 12 02905 g004
Figure 5. Annual increase (AI) of impervious surface (km2) (left) and annual growth rate (AGR) (%) (right) for CZTUA from 2001 to 2017. The vertical gray lines are milestones of significant policies.
Remotesensing 12 02905 g005
Figure 6. The spatial distribution of the time (in year) of urban expansion (i.e., conversion from non-impervious surface to impervious surface) from 2001 to 2017: (a) Wangcheng District; (b) Changsha County; (c) the core conversation; and (d) the junction between Zhuzhou City and Xiangtan City.
Remotesensing 12 02905 g006
Figure 7. The dynamics of the three urban growth types in terms of the composition (%) of patches of newly developed impervious surface for the nine regions and total region from 2001 to 2016.
Remotesensing 12 02905 g007
Figure 8. Dynamics of the landscape metrics for the impervious surface in CZTUA from 2001 to 2017.
Remotesensing 12 02905 g008
Table 1. Landscape metrics used in this study.
Landscape MetricAbbreviationDescription
Percentage of LandscapePLANDThe percentage the landscape of the corresponding patch type.
Patch DensityPDThe number of patches of per 100 ha.
Largest Patch IndexLPIProportion of total area occupied by the largest patch of a land cover type.
Landscape Shape IndexLSIA modified perimeter-area ratio of the form that measures the shape complexity of the whole landscape or a specific cover type.
Interspersion and Juxtaposition IndexIJIThe overall distribution and juxtaposition of various patch types
Patch Cohesion IndexCOHESIONMeasuring the physical connectedness of the corresponding patch type.
Table 2. Results of the spatiotemporal accuracy assessment for the CCDC.
Year LULC
CroplandForestGrasslandWetlandWaterImpervious surface
2001Cropland11176943224
Forest349480332
Grassland1010041
Wetland6213902
Water151011321
Impervious surface202022216
Producer’s Accuracy93.63%92.76%66.67%81.25%92.31%87.80%
User’s Accuracy91.63%95.76%62.50%78.00%88.00%89.26%
Overall Agreement92.31%
2005Cropland11276943224
Forest549440521
Grassland0010001
Wetland7213930
Water21011221
Impervious surface1110022217
Producer’s Accuracy93.84%92.01%66.67%78.00%93.13%88.93%
User’s Accuracy91.70%93.84%90.91%75.00%96.06%89.67%
Overall Agreement92.20%
2010Cropland10989842325
Forest449301341
Grassland0211301
Wetland6203801
Water31021310
Impervious surface219133216
Producer’s Accuracy93.69%89.25%64.71%74.51%92.91%88.52%
User’s Accuracy89.27%94.61%64.71%80.85%95.62%85.38%
Overall Agreement90.89%
2015Cropland11158433327
Forest579240382
Grassland2712001
Wetland6203702
Water71021170
Impervious surface169334207
Producer’s Accuracy92.68%89.97%66.67%77.08%88.64%86.61%
User’s Accuracy90.28%92.96%54.55%78.72%92.13%85.54%
Overall Agreement90.44%
2017Cropland11078533325
Forest439105324
Grassland5019031
Wetland6203701
Water71021302
Impervious surface2112434214
Producer’s Accuracy93.10%90.10%61.29%77.08%91.55%86.64%
User’s Accuracy90.29%94.11%67.86%80.43%91.55%82.95%
Overall Agreement90.63%

