Article

Sensing Images for Assessing the Minimum Ecological Flux by Automatically Extracting River Surface Width

1
Faculty of Geomatics, East China University of Technology, Nanchang 330013, China
2
Key Laboratory of Digital Earth Science, Aerospace Information Research Institute, Chinese Academy of Sciences, Beijing 100049, China
3
Ministry of Ecology and Environment Center for Satellite Application on Ecology and Environment, Beijing 100094, China
4
Ministry of Ecology and Environment of the People’s Republic of China, Beijing 100006, China
5
State Key Laboratory of Simulation and Regulation of Water Cycle in River Basin, China Institute of Water Resources and Hydropower Research, Beijing 100038, China
*
Author to whom correspondence should be addressed.
Remote Sens. 2020, 12(18), 2899; https://doi.org/10.3390/rs12182899
Submission received: 13 July 2020 / Revised: 31 August 2020 / Accepted: 2 September 2020 / Published: 7 September 2020

Abstract

:
Global warming and economic development have intensified the evaporation and exploitation of river waters, resulting in reduced global river runoff. In minimum ecological flux management, objective determination of the minimum ecological flux and evaluation of whether a river complies with standards are urgently required. Satellite remote sensing allows for rapid, large-scale, and dynamic monitoring. Herein, the Tangmazhai cross-section of the Taizi River was analyzed using the Chinese Gaofen (GF) series satellite that comprises panchromatic multi-spectral sensors and the Sentinel-2 multi-spectral images to automatically extract the water surface width. We applied the Normalized Difference Water Index (NDWI)-Iterative Self-Organizing Data Analysis Technique Algorithm (ISODATA) to 225 cloudless scenes from January 2015 to November 2019. We proposed a method to evaluate the minimum ecological flux using water surface width. The river surface width at this location increased from January 2015 to November 2019, and all widths exceeded the minimum river surface water width for the month. The degree of the minimum ecological flux guarantee was determined to be satisfactory. Because there are less clouds and rain in the North China than South China, our results may be used for evaluating the degree of minimum ecological flux guarantee of many river sections in the north China through monthly monitoring.

1. Introduction

With the continuous development of society and economy, humans continue to exploit rivers in addition to constructing many water conservancy projects, deteriorating the ecological environment of rivers [1]. China has proposed the “Water Pollution Prevention Action Plan” to ensure minimum ecological flux and restore river ecology. Minimum ecological flux refers to a hydrological regime aiming to maintain the balance between social economic and environmental demands from water resources [2]. The objective determination of the minimum ecological flux and evaluation of whether a river currently complies with standards must be urgently addressed. In general, the common practice is to determine the minimum ecological flux through different methods. At present, more than 200 such determination methods have been developed, which can be divided into hydrological, hydraulic, biological habitat [3], and eco-hydraulics [4] methods. Among these, the Tennant hydrological method is a generally accepted method for calculating the minimum ecological flux nationally and internationally owing to its rapid calculations and convenient application, as field investigation and measurement are not required [5]. Traditional methods require multi-period ground measurement data to calculate the minimum ecological flux of a certain cross-section at a certain time. After the minimum ecological flux has been determined, then compared to the calculated ecological flux of a section, if the calculated ecological flux is greater, then the ecological flux is considered sufficient; otherwise, it is considered insufficient. The main problem with using traditional methods to evaluate the degree of the minimum ecological flux guarantee is the limited data from hydrological stations and the difficulty in obtaining ground observation data. Remote sensing technology can provide large-scale, low-cost, and long-term monitoring of the minimum ecological flux, which can overcome the problems associated with traditional data collection, but other challenges must be considered also. If a river cross-section is rectangular, there is no one-to-one correspondence between the river water surface width and water level, as well as between the water level and discharge flow [6]. However, whether natural or man-made channels, most river cross-sections are non-rectangular; such sections are primarily trapezoids and arcs. Therefore, in such cases, one-to-one correlations exist between the water surface width and the water level of the river, as well as between the water level and the discharge flow of the river. The minimum river surface width corresponds to the minimum ecological water level, and the minimum ecological water level corresponds to the minimum ecological flux. The minimum river surface width is regarded as an index for evaluating the minimum ecological flux. Therefore, by comparing the river surface width to the minimum river surface width, the compliance of a river to minimum ecological flux standards and the ecological health status of the river can be assessed. Many scholars have calculated river surface widths based on remote sensing data at different spatial resolutions, and some of them have extracted the water surface width of large rivers from low-resolution remote sensing images.
Water surface width can be extracted from MODIS [7,8], medium-resolution (Landsat) satellite data [9], JERS-1 [10], and other optical remote sensing images. Meanwhile, based on ERS-1 [11], RADARSAT [12], SMMR [13], and AMSR-E [14], microwave remote sensing images have been used to extract river surface width. The aforementioned optical and microwave remote sensing images do not have a high resolution, and microwave remote sensing images are further limited by unique geometric distortions and speckle noise, leading to large errors in river width measurements. Furthermore, microwave remote sensing is unable to carry out conventional monitoring of small- and medium-sized rivers. With the launch of high-resolution optical satellites, monitoring of small- and medium-sized rivers has become possible. Relatively few studies have used high-resolution remote sensing images to automatically monitor river surface width. River surface width has been extracted using Sentinel-2 [15] and worldview-1 [16] satellite data, but the degree of automation is not high.
The present study analyzed the cross-section of the state-controlled Tangmazhai Station, Taizi River as the research object based on the high-resolution Sentinel-2 (resolution 10 m) and the Chinese Gaofen (GF) series satellites that comprises panchromatic multispectral sensors (PMS, resolution from 0.8 to 2 m). The remote sensing images were used to realize an automatic method for extracting river surface width, and the width of the river surface at the cross-section of Tangmazhai Station from January 2015 to December 2019 was monitored. This method will be of great significance for assessing river surface width both in the observation area and globally. At the same time, we evaluated the relationship between river surface width extracted by remote sensing automation and the minimum river surface width to evaluate the satisfaction degree in the minimum ecological flux of the river.

2. Materials and Methods

2.1. Overview of Study Area

The Taizi River is in Liaoning Province, China. The main stream was 413 km long and runs east–west, flowing through important hydrological stations, such as Xiaoshi Station, Benxi Station, Liaoyang Station, Xiaolinzi Station, and Tangmazhai Station, and finally into Liaodong Bay of the Bohai Sea along the Daliao River (Figure 1). The cross-section of the river at Tangmazhai Hydrological Station is the research area of our study, which is between 122°32′24″ and 122°51′36″E, and 41°2′24″ and 41°22′12″N, and belongs to the plain river area [17]. According to the shape of the riverbed, the river can be divided into four categories: Wandering, branching, curved, and straight [18]. Among them, straight rivers are the simplest and are easy to study. The reach at the section at Tangmazhai Station on Taizi River was selected as a straight river.

2.2. Data Source

2.2.1. Measured Data

The measured data included both hydrological observation and field survey data. Hydrological observation data included daily discharge and water level data for the Taizi River at Tangmazhai hydrological station from January 1988 to December 2001 and from January 2006 to December 2018 for 27 years, the cross-sectional water level diagram, and measurements of the position of the cross-sectional line of the river surface width [20] (Figure 2). According to hydrological observation data over the years, May–September was a period of abundant water, while October–April was a period of water scarcity. At the same time, on 18 November 2019, the research team visited the Tangmazhai cross-section of the Taizi River to conduct on-site investigations to determine the location of measuring discharge flow and water level. The center point of the section line was 122°43′10.289″E, 41°11′8.547″N, with a total length of 1021 m.

2.2.2. Remote Sensing Images

We used both the GF series and Sentinel-2 satellite data from Tangmazhai Hydrological Station from January 2015 to November 2019 (Table 1). During data screening, data with >20% cloud cover were removed. GF series satellite data refer to remote sensing data from Chinese GF satellites equipped with PMSs, including data from six satellites (GF1A, GF1B, GF1C, GF1D, GF2, and GF6). GF series satellite data pre-processing involved fusion and geometric correction. Fusion refers to the merging of panchromatic and multi-spectral images from the same satellite. The spatial resolution of GF2 data was increased from 4 to 0.8 m, and the spatial resolution of other GF data was increased from 8 to 2 m. Affected by the cloud cover, the number of GF images of each season was relatively small. To increase the continuity of data, Sentinel-2 images (spatial resolution of 10 m) were downloaded as supplementary data. We selected the blue, green, red, near-infrared (NIR), and two short-wave infrared (SWIR) bands of the Sentinel-2 satellite multispectral imager (MSI) sensor. The Sentinel-2 data pre-processing mainly involved resampling the SWIR band with a spatial resolution of 20 m to a resolution of 10 m. Finally, the total number of images obtained were 225 scenes, including 44 scenes from the GF series and 181 scenes from Sentinel-2.

2.3. Remote Sensing Extraction Method of River Water Surface Width

2.3.1. Definition of River Surface width

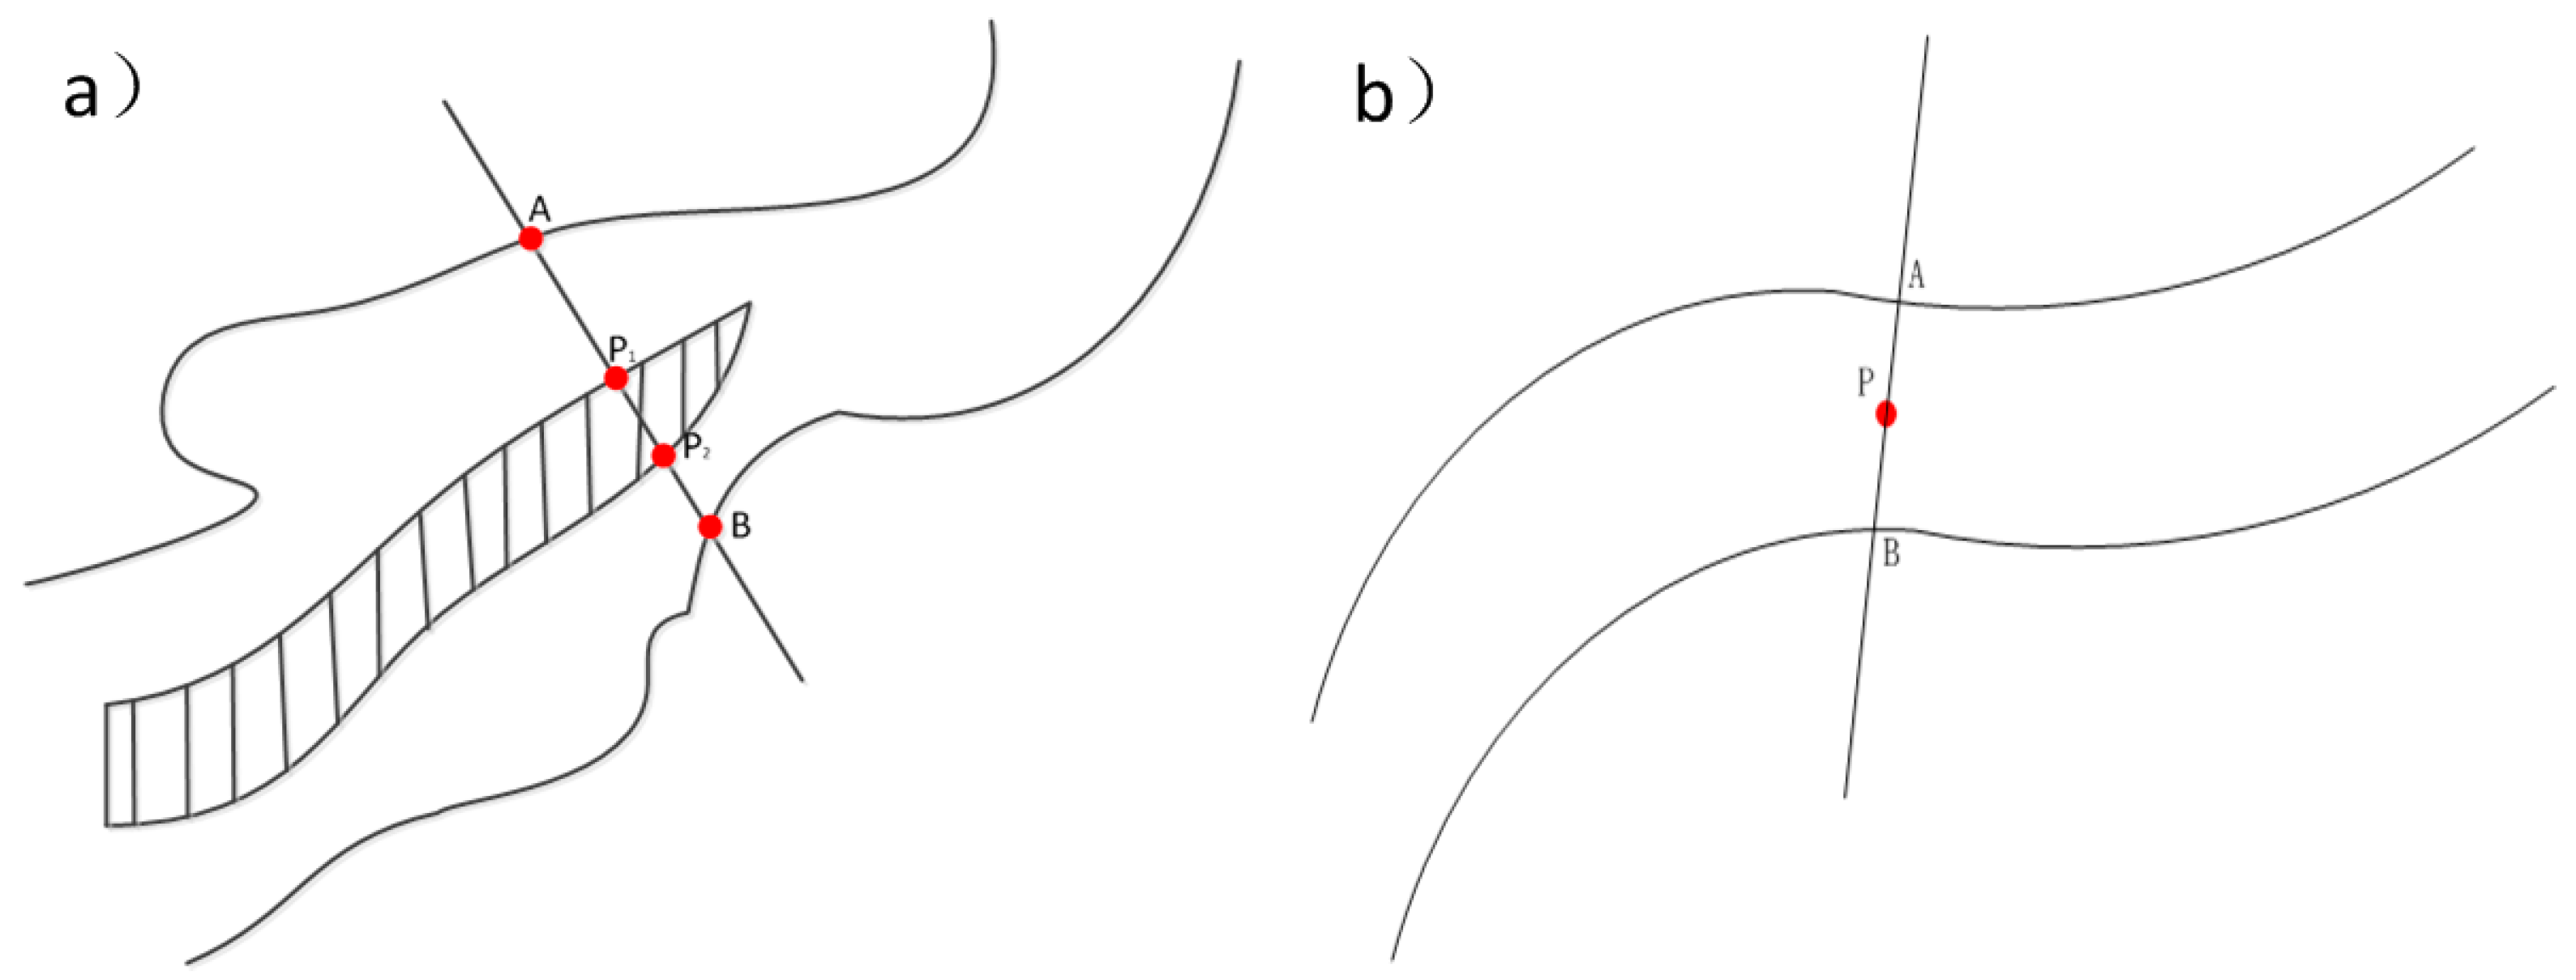
The width of the river surface refers to the width of the water surface, and it is necessary to avoid the influence of non-water bodies, such as islands and sandbars. For wandering and branching rivers, river surface width is calculated assuming that the section line is located on the surface of the river with islands and sandbars in the cross-section as the sum of AP1 and P2B (Figure 3a). For straight and curved rivers, assuming that the measured cross-sectional line passes through the known monitoring cross-section at position P and is perpendicular to both banks, then AB is the width of the river surface (Figure 3b), as in our research area at Tangmazhai Station. Generally, the cross-sectional line AB is fixed for all hydrological stations with perennial observation data, but only needs to be digitized into line vectors to facilitate subsequent remote sensing to extract the width of the water surface.

2.3.2. Automatic Extraction of River Surface Width

Identifying water pixels is a very important step in the automatic extraction of river water surface width via remote sensing. To highlight water body information and suppress non-water body pixel information, it is important to choose a suitable water body index. At present, the most widely used and relatively mature water body indexes include the normalized difference water index (NDWI), land surface water index LSWI [21], and modified normalized difference water index (MNDWI) [22]. Among them, the LSWI, ( ρ N I R ρ S W I R 1 ) / ( ρ N I R + ρ S W I R 1 ) , utilizes the reflectance of the SWIR band, which is sensitive to soil and vegetation moisture, to obtain water body information. The MNDWI, (GREEN-SWIR)/(GREEN+SWIR), is a logical operation between the green light and SWIR bands to suppress vegetation information to the greatest extent possible and obtain valuable water body information. However, China’s GF series remote sensing images do not have SWIR bands. Therefore, according to the common band information of GF series satellite data and Sentinel-2 data, we chose the NDWI to identify water body pixels. The NDWI is an algorithm based on the strong reflection of water pixels in the green band and the strong absorption in NIR bands [23]:
N D W I = ( G r e e n N I R ) ( G r e e n + N I R )
where Green and NIR represent the green band and NIR band images, respectively, of Sentinel-2 and GF series satellite data.
Once the water index is determined, it is also necessary to find a method to automatically determine the threshold. At present, the main methods that can realize batch automatic segmentation of water bodies are the Iterative Self-Organizing Data Analysis Technique Algorithm (ISODATA) method [24] and Modified Histogram Bimodal Method (MHBM) [25]. In the MHBM, the valley between the two peaks usually has to be manually selected as the best threshold, but the manual method is less efficient and has a certain contingency and randomness. However, the ISODATA algorithm only needs appropriate initial parameters to be set without manual intervention, and automatically distinguishes water bodies from other ground objects accurately. The principle of the algorithm is mainly based on the K-means algorithm, adding the two operations of merging and splitting clustering results. When the number of samples in a cluster is extremely small or when the two clusters are extremely close, the clusters are merged. When the variance within a certain characteristic class of a sample results in high clustering results, the class is split.
To ensure greater accuracy, based on the calculation of the NDWI water body index, the ISODATA method was used to extract the river water surface width automatically; this is briefly described as the NDWI-ISODATA method. The process for automatically extracting river surface width in this study—Normalized Difference Water Index-Iterative Self-organizing Data Analysis Technique Algorithm (NDWI–ISODATA)—is depicted in Figure 4. The pre-processed digital number (DN) value image of Sentinel-2 and GF series satellite data was taken as the input and cropped into a small image containing only the river. Simultaneously, the NDWI image was classified and segmented using the ISODATA method, and the vector of the water body was automatically obtained. To improve the accuracy of the calculated river surface width, the water body vector was smoothed, and the intersection model of the water body vector and the cross-section line vector was constructed to obtain the line vector of the river water surface width and perform statistical analyses; finally, the river surface width of the cross-sectional lines was obtained.
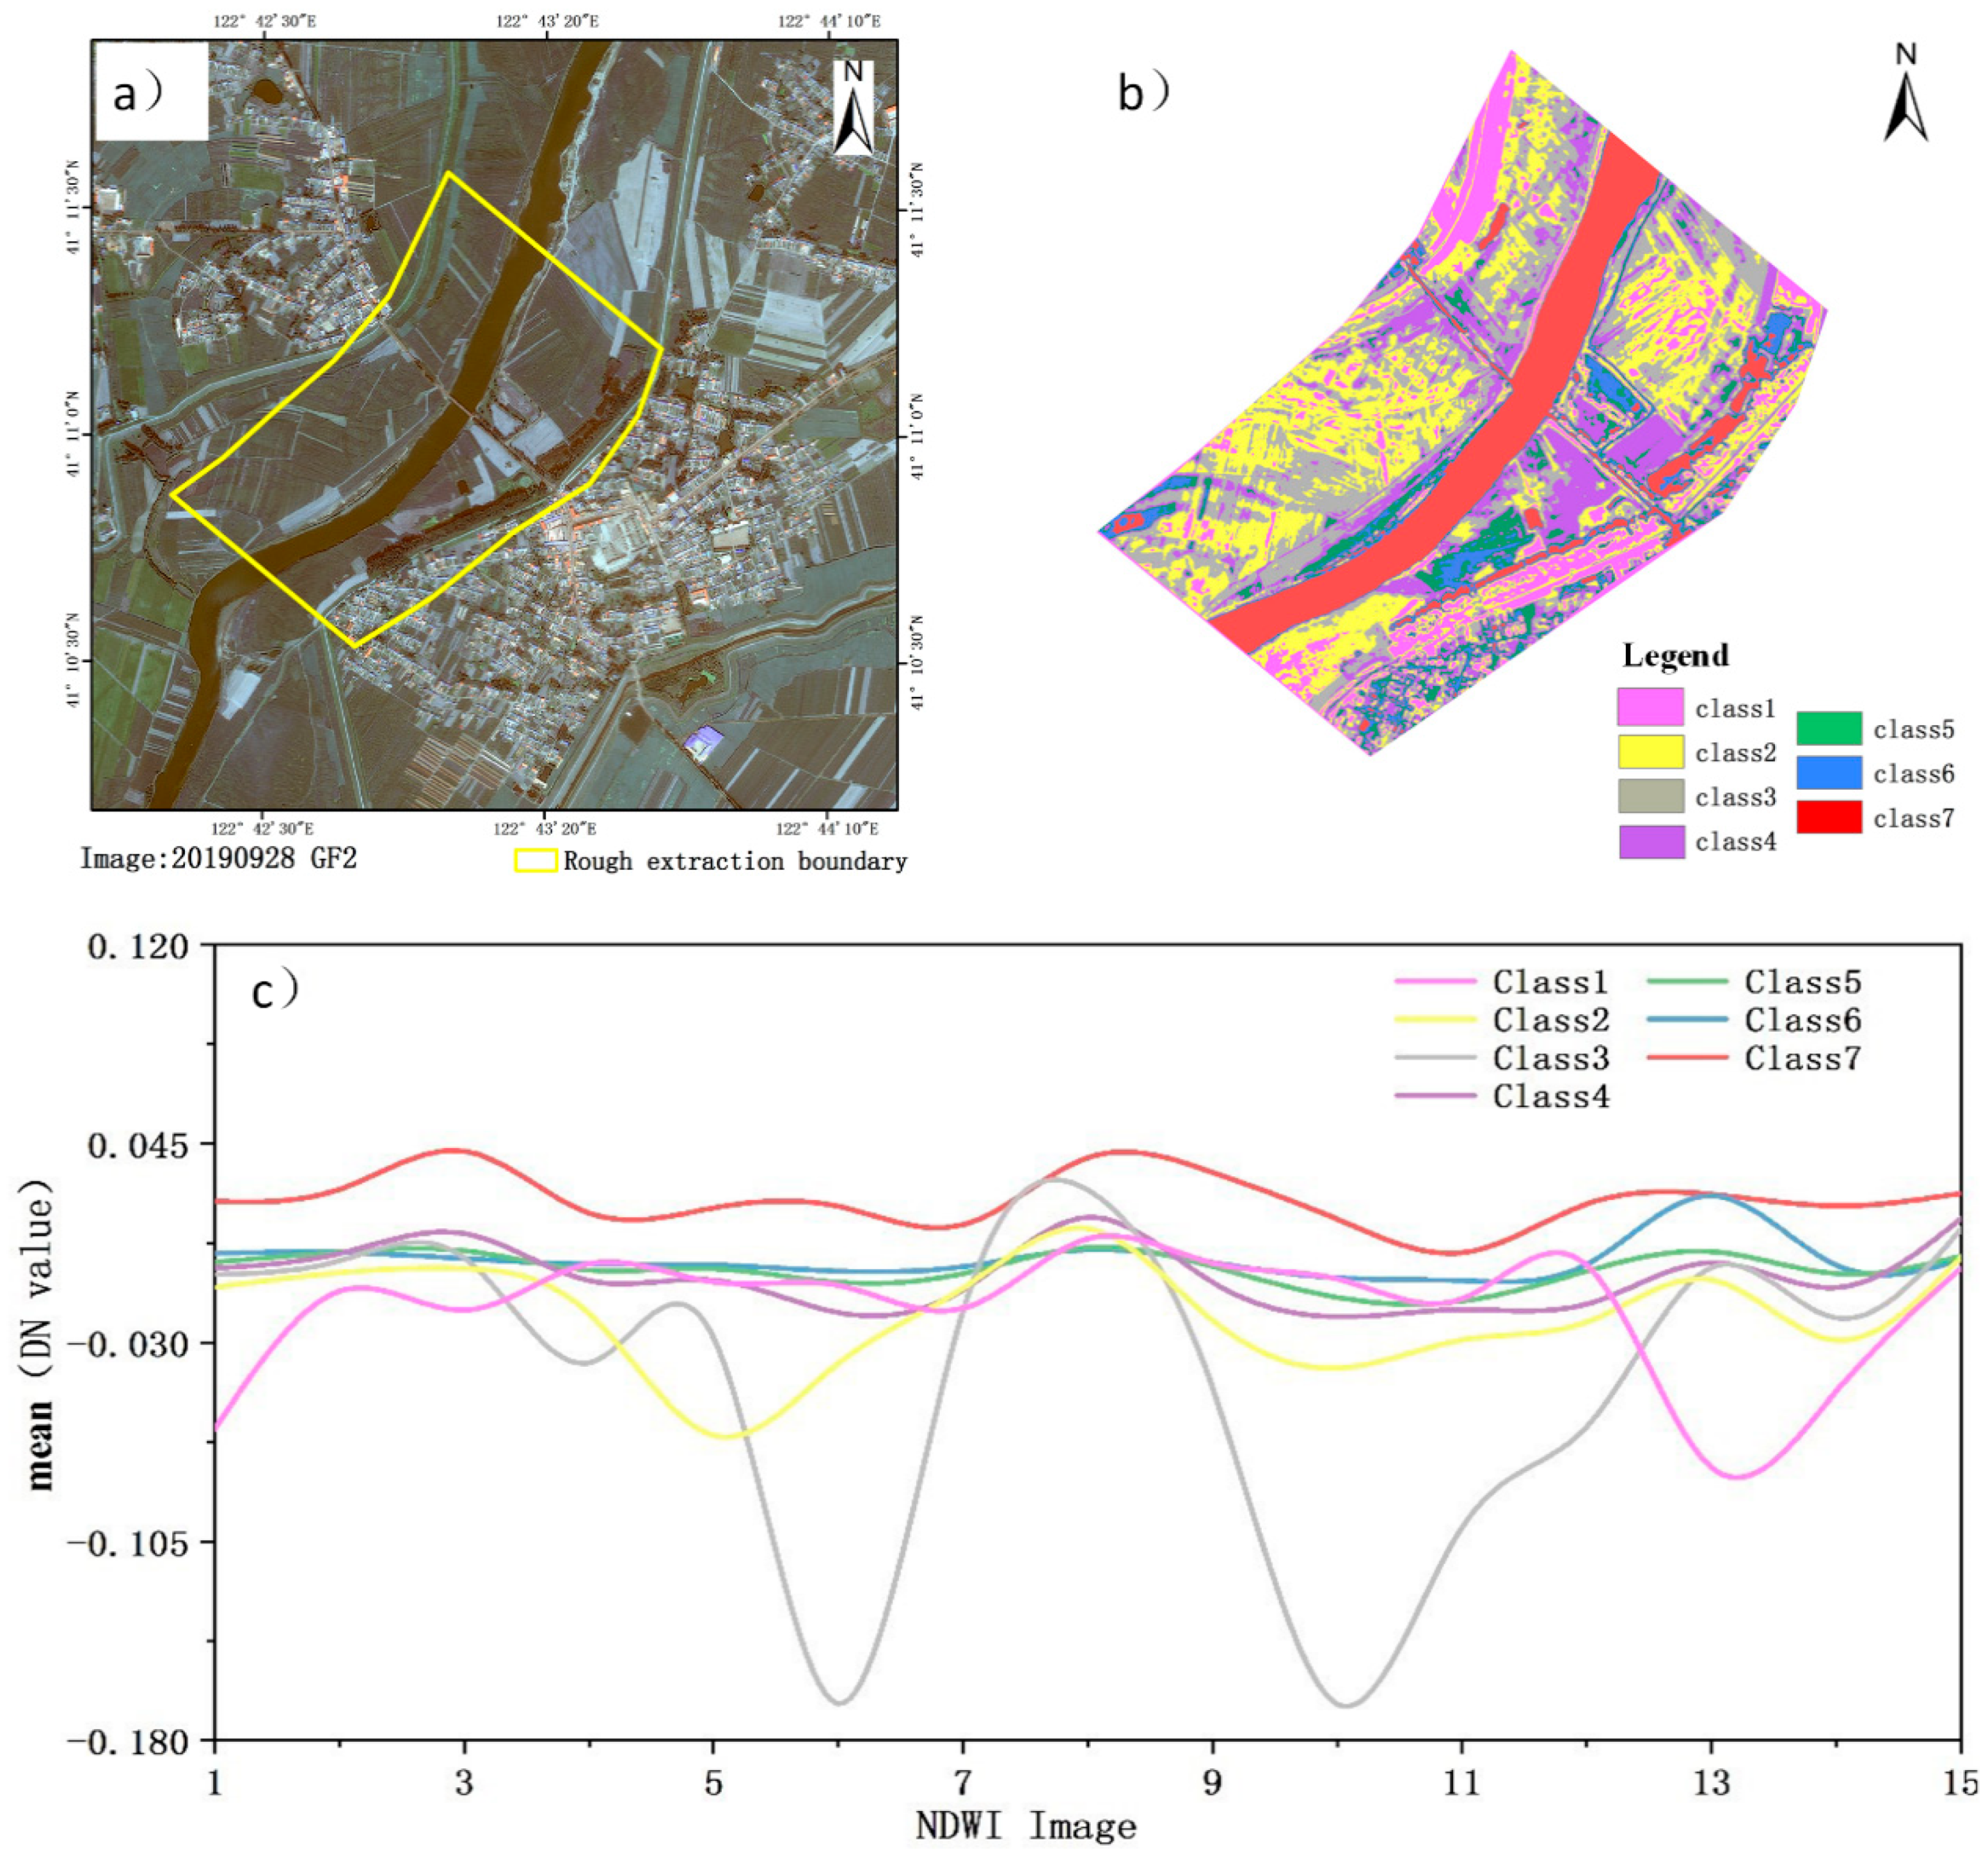
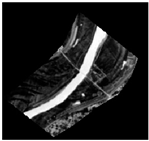
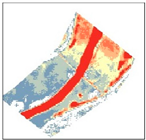
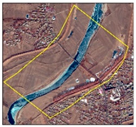
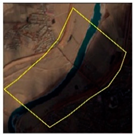
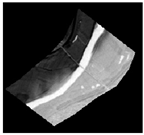
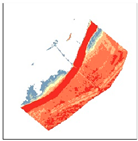
Using the Tangmazhai cross-section as an example, a scene of a GF2 image was selected and cropped with an expansion range 2–3 times that of the target water body, and the calculated NDWI image was considered as the input (Figure 5a). The ISODATA method was applied to the image, which was divided into seven categories, and the resulting classification results are shown in Figure 5b. Then, they were sorted in descending order according to the average value of the classification results [26]. The average value of NDWI in water was significantly higher than the other features. This can be derived from the NDWI statistical results of multiple scenes of different time-phase images. In Figure 5c, the average value of the seventh type of water body is significantly larger than the average value of other land types. Therefore, after sorting, according to the descending order of means, the one with the largest mean can be automatically determined as a water body. Following image segmentation, the segmentation area was determined as the target water body of the study area. The NDWI–ISODATA method does not require manual determination of the threshold; provided that the type of the largest average value is automatically defaulted to be a water body, the water body can be automatically extracted.

2.4. Minimum Ecological Flux Remote Sensing Supervision Method

After automatically extracting the river surface width using remote sensing, the correlation between the river surface width and minimum ecological flux should be established. When the river cross-section is trapezoidal, arc-shaped, or has another non-rectangular shape, there is a one-to-one correspondence between the river flow and water level and between the water level and river water surface width. Therefore, in an ideal state, the minimum ecological flow corresponds to the minimum ecological water level, which, in turn, corresponds to the smallest river water surface width. The minimum river water surface width corresponding to the minimum ecological flow is regarded as the evaluation index of ecological flow. When the river water surface width monitored via remote sensing is greater than the minimum river water surface width, the river ecological flow reaches the standard value, and the river ecological health is determined to be in a satisfactory condition.
The calculation of the minimum river surface width mainly involves three steps:
  • Calculation of the minimum ecological flux according to the minimum ecological flux threshold. The Tennant method was used to select 10% of the historical flow data as the threshold [27]. The Tennant method is the only method that can be used to determine the minimum ecological flow based on the natural hydrological rhythm. It is also one of the primary methods used by the Chinese government to evaluate ecological flow [28].
  • Calculation of the minimum ecological water level based on the flow and water level relationship and the minimum ecological flux fitted by the measured data.
  • Determination of the minimum river surface width based on the minimum ecological water level and the cross-sectional water level map.
This article takes tangmazhai station section of the Taizi River as an example to calculate the minimum river water surface width of the section from January 2015 to December 2018. The multi-year monthly average (m3/s) of the minimum ecological flux from January 2015 to December 2018 was calculated. On this basis, according to the data of the daily discharge flow (m3/s) and water level (m) in the hydrological data over 27 years from January 1988 to December 2001 and January 2006 to December 2018 at the Tangmazhai station section, the flow–water level relationship curve was constructed (Figure 6a). According to the constructed relationship curve, the corresponding minimum ecological water level value (m) under the multi-year monthly average (m3/s) of the minimum ecological flux was calculated. Using the cross-sectional water level diagram, the minimum river water surface width (m) corresponding to the multi-month average (m) at the minimum ecological water level was calculated. The cross-sectional water level diagram of the Tangmazhai cross-section is shown in Figure 6b. Assuming that the dotted line in the figure is the minimum ecological water level value M (m) in a certain month, y = M intersects with the elevation line of the Taizi River bottom and is greater than the line segment of the bottom elevation, namely the sum of P1P2, P3P4, and P5P6, and is the minimum river surface width (m).
By comparing the relationship between the width of the river surface and the minimum width of the river, the ecological environment of the aquatic animals and plants living in the river channels and the state of the river ecosystem were evaluated. When the width of the river surface, automatically extracted via remote sensing, is greater than the minimum river surface width, the monitored section of the river in the study area meets all water requirements, both inside and outside the channel. Thus, the structure and function of the river water system can be maintained. Conversely, when a section of a river falls below the minimum ecological flux for a long period of time, the width, depth, and flow rate of the river surface tend to be significantly reduced and the quality of the ecological environment inhabited by aquatic animals and plants will decline. Consequently, problems associated with poor ecological environments will continue to occur in such cases.

2.5. Accuracy Evaluation

The accuracy was evaluated by mean relative error (MRE) and root-mean-square error (RMSE) with the following formulae:
M R E = 100 % n i = 1 n | y ^ i y i y i |
R M S E = 1 n i = 1 n ( y ^ i y i ) 2
where n represents the number of points, y ^ i represents the extracted river surface width, and y i represents the true value of the river surface width.

3. Results

3.1. Results of Remote Sensing Extraction of River Water Width

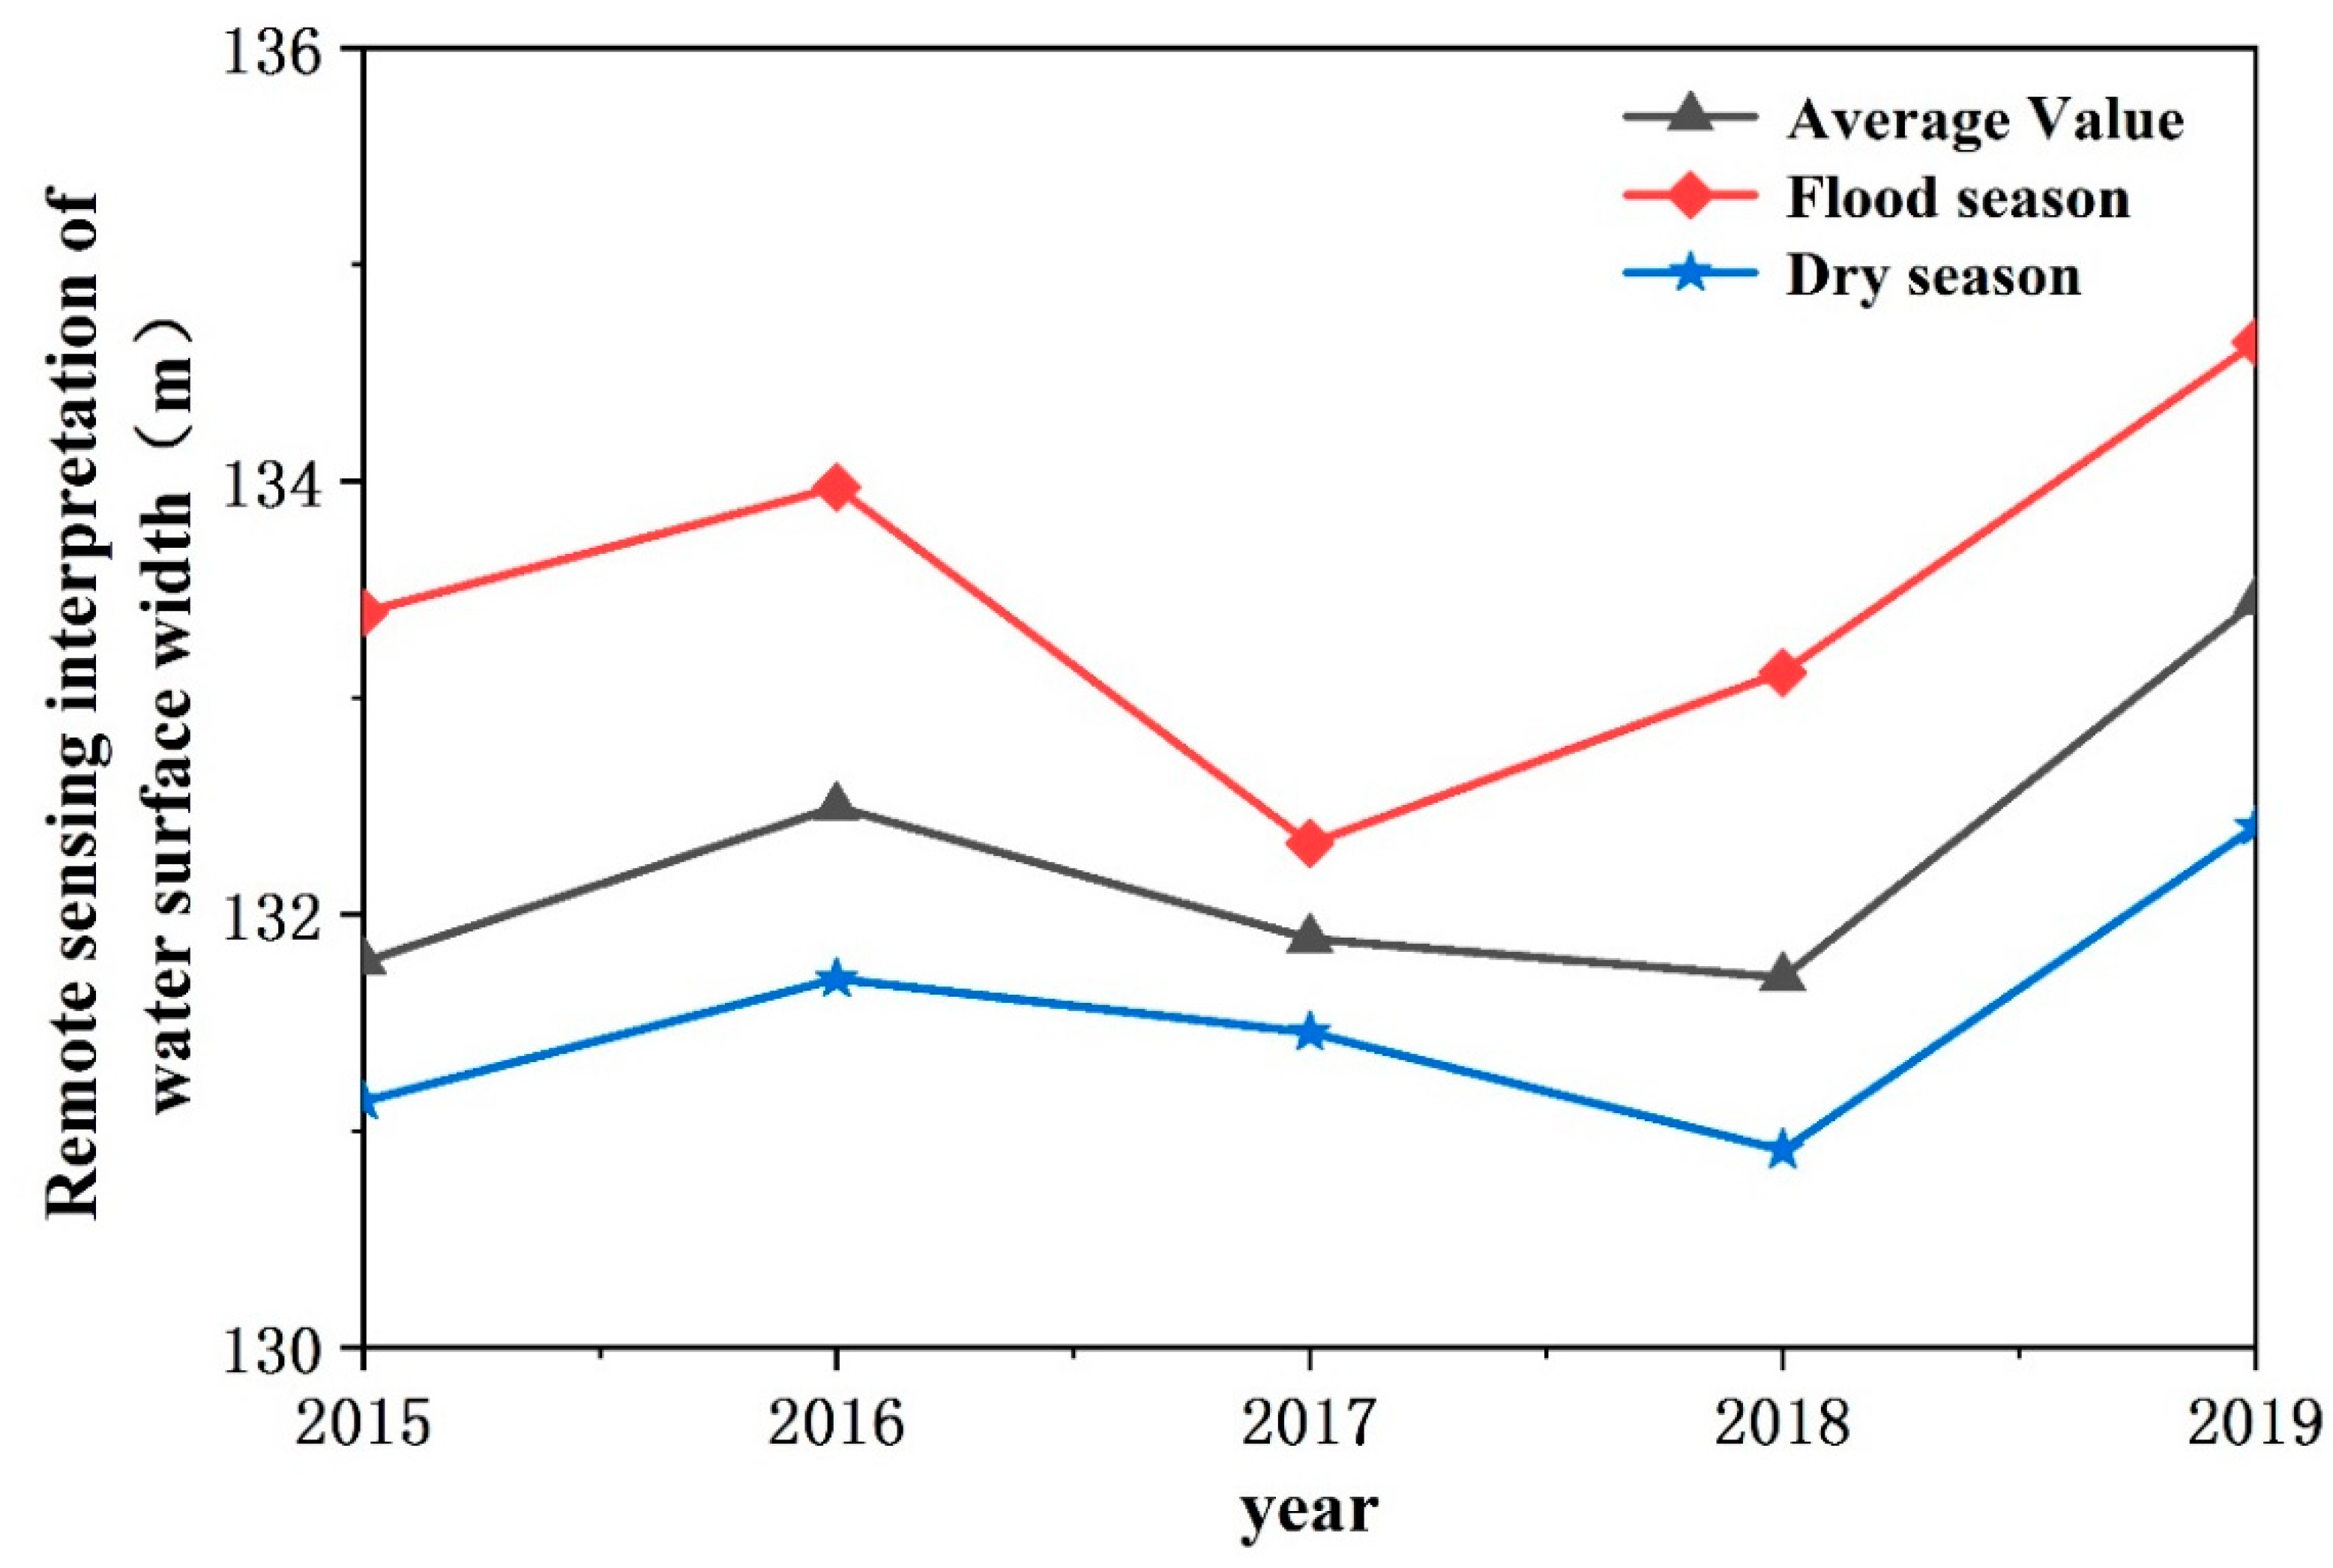
We automatically extracted the width of the river surface from January 2015 to November 2019 using the remote sensing images. The statistical results are shown in Figure 7. We found that the water surface width of the river in the study area increased from 2015 to 2016, decreased slightly from 2016 to 2018, and increased from 2017 to 2019. Among these trends, the inter-annual change in width during the flood season increased from 133.4 m in 2015 to 135.7 m in 2016, and then decreased to 132.2 m in 2017. Under the governmental requirements for improving the quality of the water environment [29], the width of the river water surface increased steadily at a low rate from 2017 to 2019. The inter-annual changes in the width of the river surface during the dry season from 2015 to 2019 were 131.14, 131.7, 131.45, 130.91, and 132.4 m, respectively. Generally, the inter-annual variability of rivers in the study area fluctuates slightly.

3.2. Supervision Result of Ecological Flow Guarantee

In the actual ecological flow monitoring process, to facilitate the monitoring operation, a trapezoidal, arc-shaped, or another non-rectangular river cross-section was selected, and 10% of the historical flow data in the study area were selected as the threshold value for the river ecological flow warning. This river had reached the minimum standard of 10% ecological flow (Table 2).
We selected the five-year data from January 2015 to November 2019 of Sentinel-2 and GF series satellite remote sensing images and automatically extracted the five-year river water surface width. By comparing the river water surface width extracted by remote sensing every day with the minimum ecological water surface width of the current month, as shown in Figure 8, we found that the river water surface width extracted by remote sensing was greater than the minimum river water surface width, meeting the minimum ecological flux guarantee. In other words, the degree of the minimum ecological flux guarantee in Taizi River in the Tangmazhai area from January 2015 to November 2019 did not exceed the limit.

3.3. Accuracy Assessment

To verify the accuracy of the NDWI–ISODATA method for automatically extracting river water surface width, the following two methods were used for comparative analysis: (1) Comparison between the river surface width based on visual extraction and automatic extraction, and (2) data for different sensors crossing the same day, Sentinel-2 compared to GF satellite.
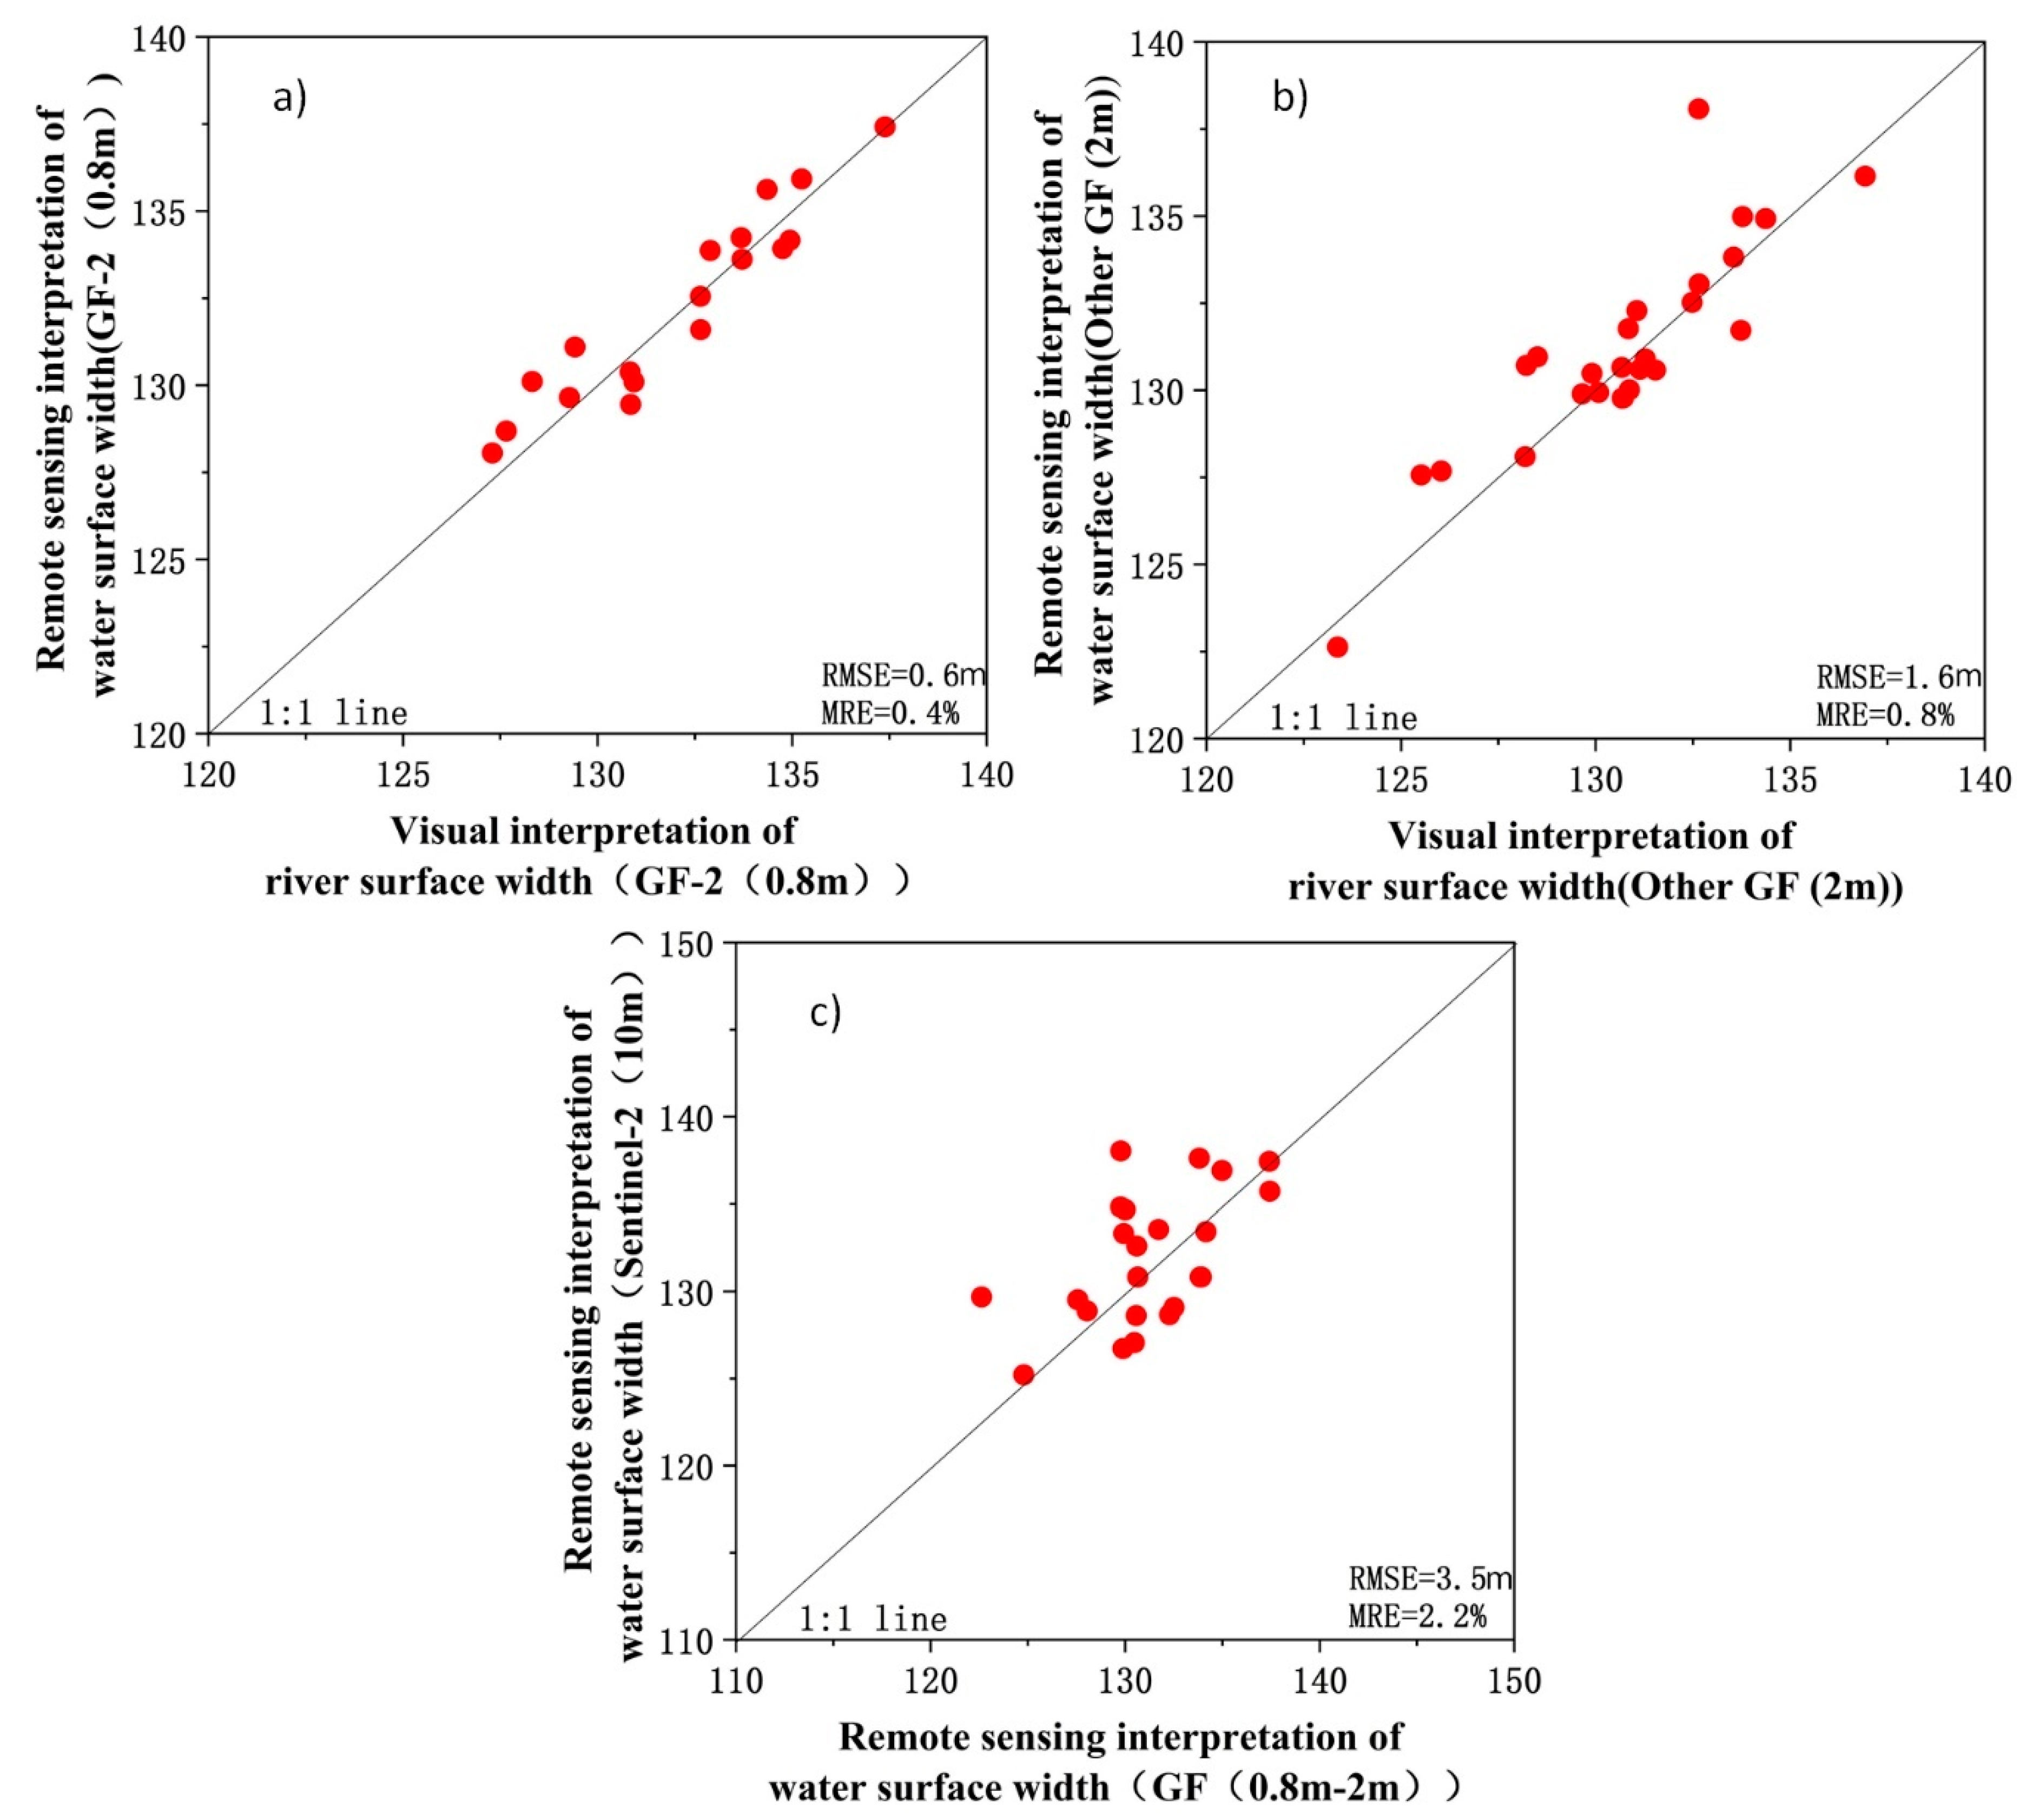
Firstly, GF-2 at 0.8 m resolution and other GF images at 2 m resolution were used to automatically extract the river water surface width and compare it to the visually extracted data, as shown in Figure 9a,b. The MRE was 0.4% and 0.8%, respectively, and the RMSE was 0.6 and 1.6 m, respectively. The errors were less than 1 pixel. The results show that the GF series data at different resolutions can automatically extract water surface widths with low errors, indicating more accurate values.
Secondly, considering the river surface width automatically extracted by GF series remote sensing images as the true value, the Sentinel-2 image at 10 m resolution within 2 days of the time difference between the GF series images was selected, and the NDWI–ISODATA method was used to extract the width of the water surface of the Tangmazhai section. A total of 22 pairs of GF and Sentinel-2 images covering the Tangmazhai cross-section within a short period of time were selected. As shown in Figure 9c, the river surface widths were automatically extracted from the different sources with low error; the MRE was 2.2%, the RMSE was 3.5 m, and the error was within 1 pixel. Therefore, when conducting long-term analysis, when the amount of GF data is insufficient due to factors such as cloudiness, the Sentinel-2 data are valuable as a reference to the relevant supplemental data in the time series.

4. Discussion

4.1. Comparison of Different Water Index Calculations

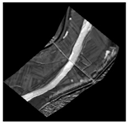
NDWI was more suitable for this study than LSWI and MNDWI. We used the Tangmazhai section of the Taizi River as an example and compared the effectiveness of NDWI, LSWI, and MNDWI in calculating the water body index from the MSI image of Sentinel-2. As shown in Figure 10, the three water body indexes can clearly highlight water bodies and land areas. The boundaries of the water body are quite obvious, from the NDWI and MNDWI images, and the contrast between water bodies and land is particularly strong. Therefore, when extracting river water surface widths from MSI images of Sentinel-2, NDWI and MNDWI calculations are more accurate than those of the LSWI. However, considering the influence of the PMS sensor’s own parameters on the GF series, such as bands, it has only five bands, namely the panchromatic, blue, green, red, and NIR bands. For extracting river water surface width, due to the lack of a SWIR band, LSWI and MNDWI are not applicable. Therefore, to use multi-source remote sensing images to extract hydrological information from long time series, we selected NDWI, which has a high extraction efficiency and is suitable for Sentinel-2 and GF series images.

4.2. Comparison of Methods for Automatically Extracting River Water Surface Width

To improve the accuracy of automatic extraction of river water surface width via remote sensing, the NDWI water body index was used as the basis of water body pixel recognition, and different automatic water body segmentation methods were used for comparison. Among them, the automatic water body segmentation methods are NDWI-MHBM and NDWI-ISODATA. Using these two methods, the results of the river water surface width were automatically extracted. A certain difference was observed between the two methods. The NDWI–ISODATA method provided more detailed results than the NDWI–MHBM method did when extracting the water boundary, and the extracted water and land boundary areas were highly similar to the actual situation (Figure 11a). Using the NDWI–ISODATA method to automatically extract the width of the river surface with long-term remote sensing data, the extraction result was highly precise, the long-term variation did not fluctuate, and the result was relatively stable. The results were basically consistent with the actual situation and agreed with the variation law of river surface width in the study area (Figure 11c). However, the NDWI–MHBM method uses artificially selected optimal thresholds to extract water bodies, resulting in subjectivity in the width of the river surface. The variation in the long time series greatly fluctuated, the result was not stable, and large differences are observed with respect to the actual situation.

4.3. Influence of Glitter, Ice, Shadow, and Clouds on Width of River Water

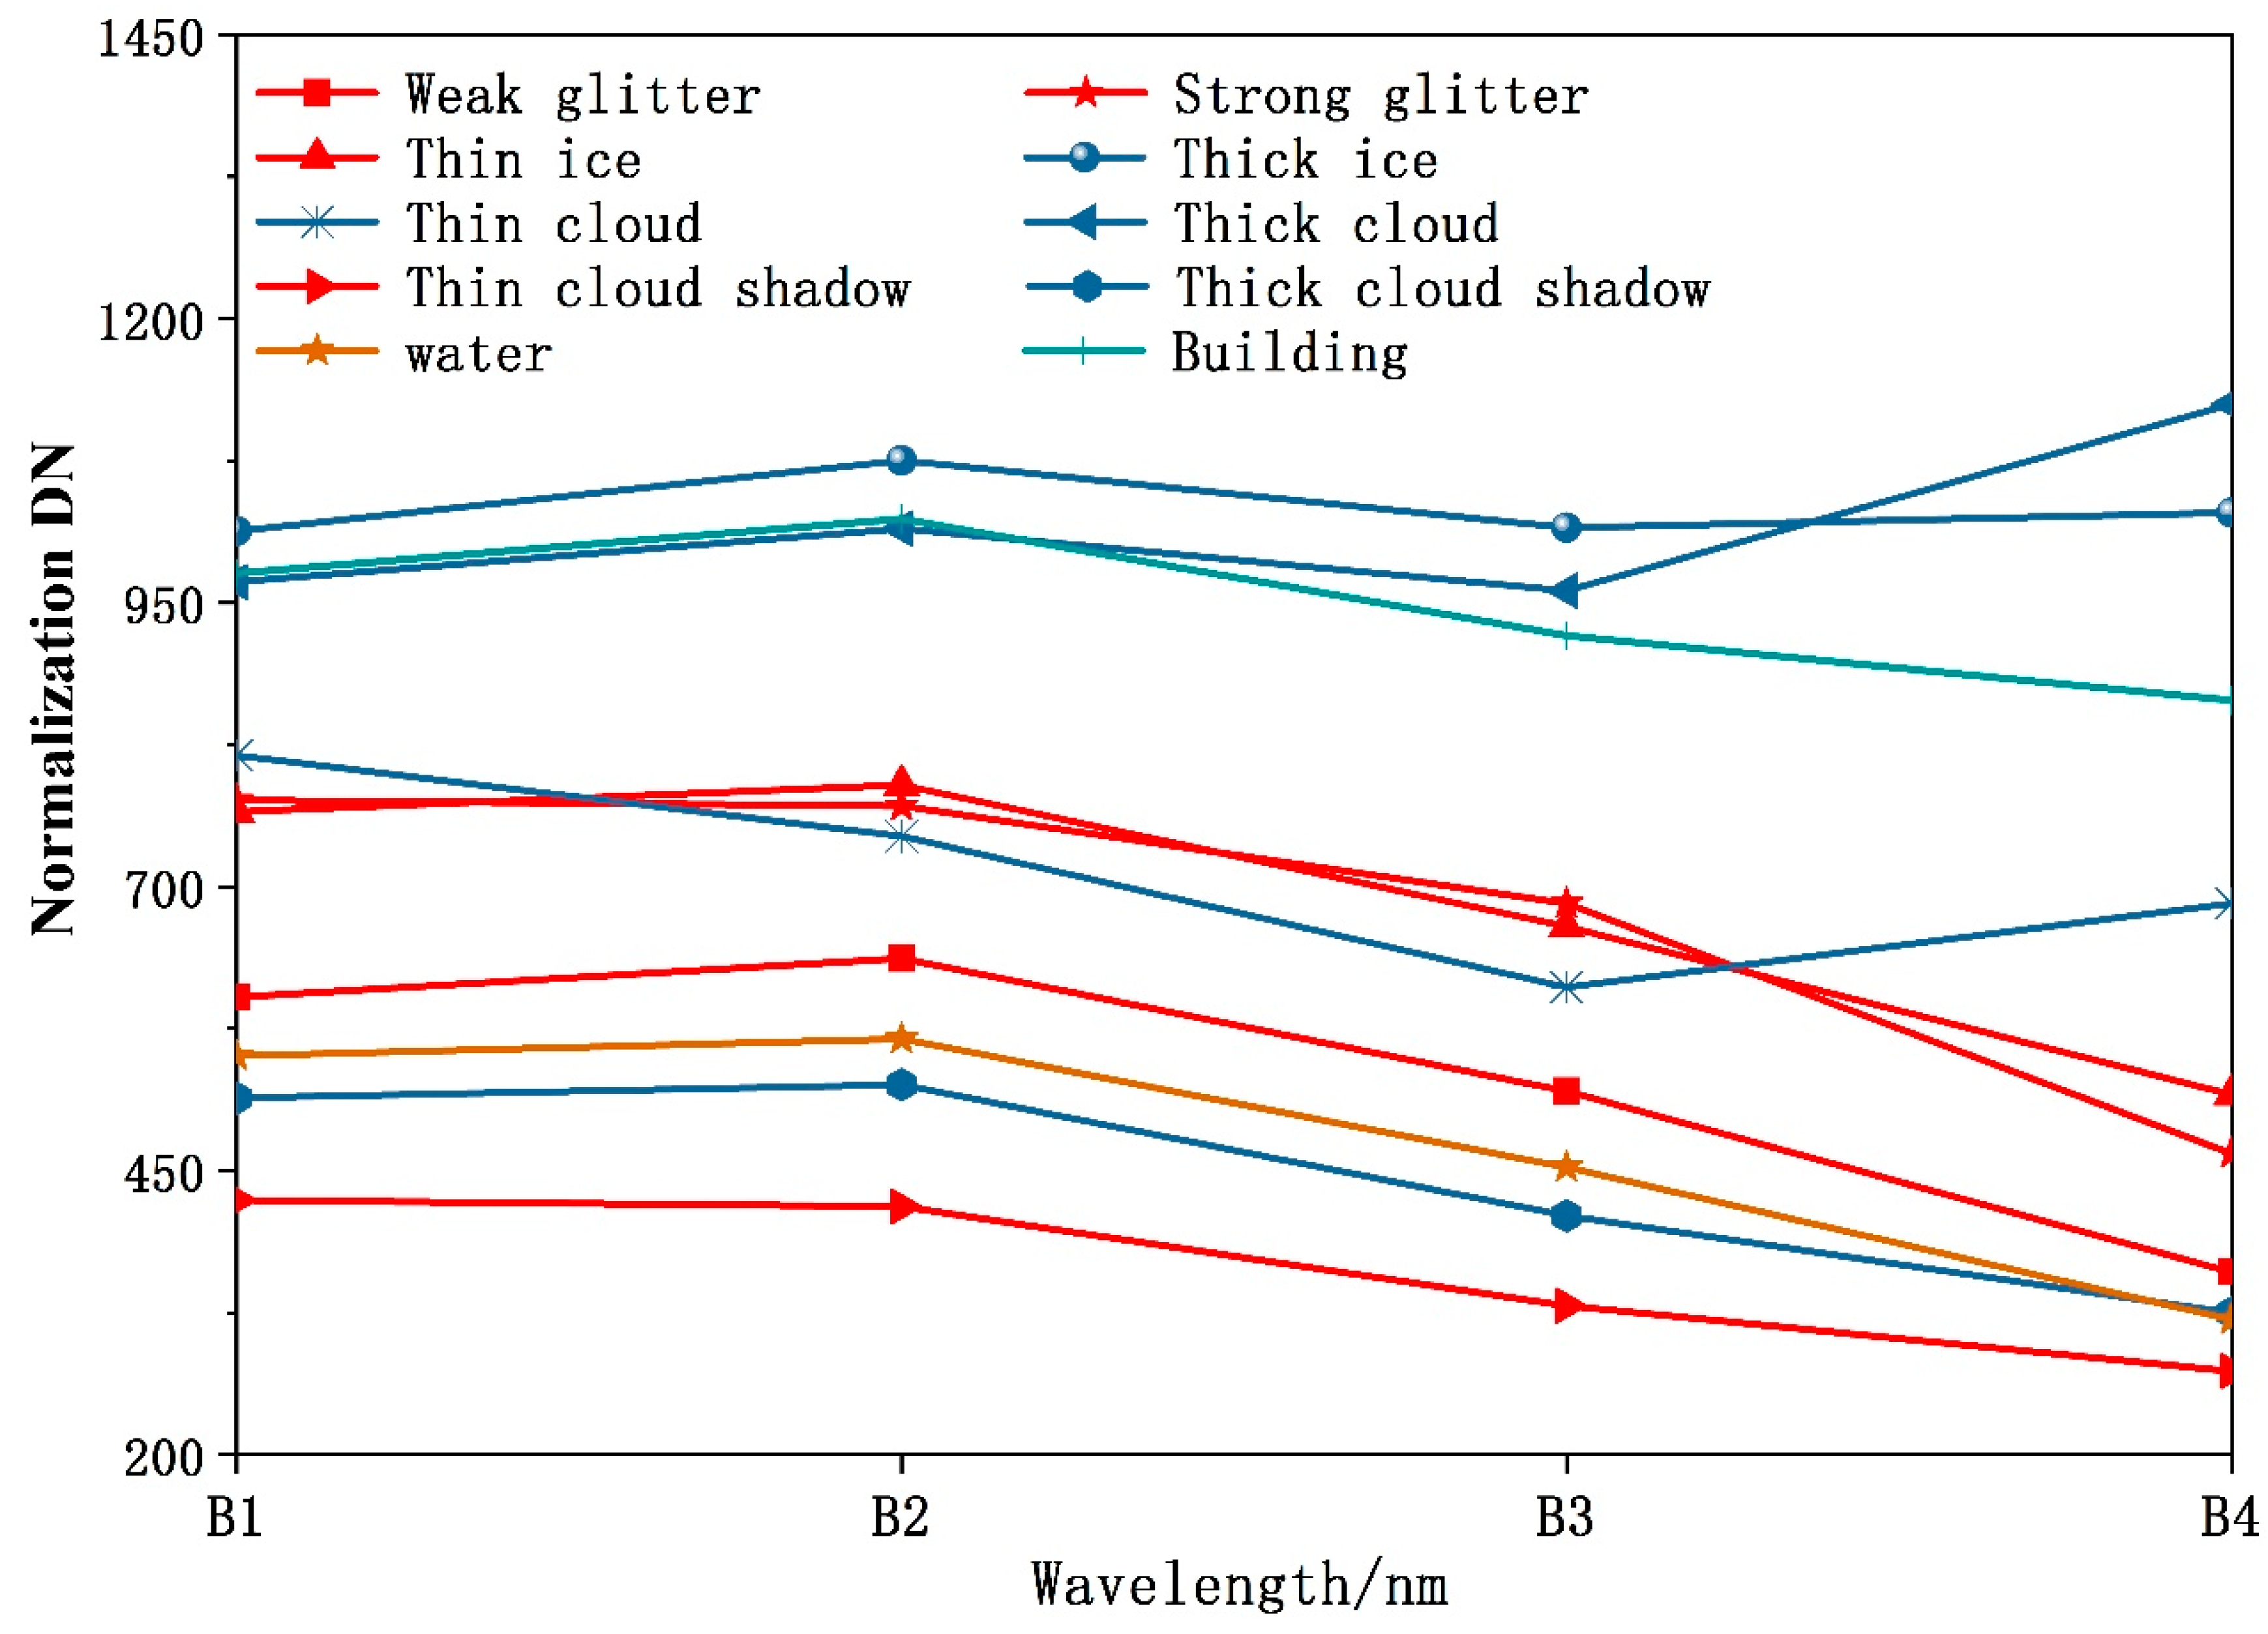
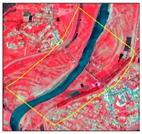
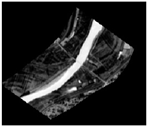
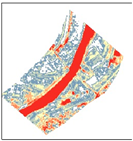
Glitter, shadow, ice, and clouds will directly affect the accuracy of extracting the river water surface width by remote sensing. When the water surface is calm, it can be regarded as a smooth surface. The strong reflection (specular reflection) that occurs when sunlight enters the water surface is called glitter. Shadows in optical remote sensing images are often due to direct sunlight being blocked by clouds, forming cloud shadows. The glitter, ice, shadow, and clouds that can appear in images are specifically classified into eight types: Strong glitter, weak glitter, thick cloud shadows, thin cloud shadows, thick ice, thin ice, thick clouds, and thin clouds. We tested the effects of these eight cases occurring in the original image, normalized water index image, and image after automatic threshold segmentation, as shown in Table 3.
The DN value of the image was dimensionless. We considered (low) normal water bodies and (high) buildings as benchmarks, and normalized the DN value as follows:
{ y 1 = a x 1 + b y 2 = a x 2 + b ( a , b )
y = a x + b
where y1 is the DN value of the normal water body, y2 is the DN value of the building, x1 is the DN value of the normal water body in the processed image, and x2 is the DN value of the building in the processed image. Further, x is the DN value of different features of the image before normalization, and y is the DN value of different features in the image after normalization (Figure 12).
Firstly, whether the eight cases only exist on the water surface is discussed. There were only strong glitter, weak glitter, thick ice, and thin ice on the water surface. Among them, the normalized DN values of strong glitter, weak glitter, and thin ice were similar to the normalized DN values of ordinary water bodies in the blue, green, red, and near-red bands, which have no effect on the water area extracted from the river and, thus, have no effect on the extraction of river width. Thick ice has a higher reflectivity in the NIR region than ordinary water bodies, which causes thick ice and water bodies to be divided into two categories, resulting in a lack of water surface areas, which affects the results of remote sensing automatic extraction of water surface width.
Secondly, thick clouds, thin clouds, thick cloud shadows, and thin cloud shadows will exist on the water. Thick and thin clouds have high overall reflectivity, and the NDWI values are similar. Therefore, when the ISODATA method was applied, thick and thin clouds were combined into one category along with the water body, changing the water surface width information. Thin cloud shadows are due to the weak intensity of the scattered light in the sky and the uneven brightness in the shadowed area. Therefore, the thin cloud shadows will show a low reflectivity state in the image, which will not have a strong effect on water body extraction. Thick cloud shadows and water bodies appear to have low brightness in the image so that the contrast with the thick cloud shadows will be greatly reduced, and the ground features will become blurred. When the water body is extracted, the recognition algorithm based on low brightness will erroneously characterize the low-brightness, thick cloud shadows as the water body, changing the water surface width information. In summary, strong glitter, weak glitter, thin ice, and thin cloud shadows will not affect the extraction of river surface width, whereas thick ice, thick clouds, thin clouds, and thick cloud shadows will directly affect water body extraction, which, in turn, affects the accuracy of the extracted river surface width. Therefore, when pre-screening data, it is necessary to avoid thick ice, thick clouds, thin clouds, and thick cloud shadows in the images.

5. Conclusions

Based on our findings, we recommend the following steps for implementing the remote sensing method to automatically extract the water surface width of a river section: (1) NDWI, MNDWI, and LSWI can be used to extract the main water body area from images. Not only does NDWI satisfy the band selection requirements for water feature extraction from multi-source remote sensing data, it also provides the best extraction efficiency. (2) To improve the accuracy and efficiency of water body extraction, we selected the ISODATA method, which can automatically divide the water body or determine the threshold value, so that the water body information is automatically extracted from the batches before the river surface width is extracted. Comparing the results of NDWI–ISODATA and NDWI–MHBM for automatically extracting the river water surface width, NDWI–ISODATA was found to be more detailed when extracting water body boundaries, and the extracted water and land boundaries were in agreement with the actual situation. The results from the automatic extraction of river surface widths were stable and reliable. (3) The monitoring range of the water surface should be limited to an area that is two to three times larger than the target water body, which can help eliminate detection errors caused by surface differences and make the results of automatic water segmentation more reliable. (4) The effects of glitter, ice, shadow, and clouds on automatic remote sensing to extract river water surface widths were discussed separately, and the algorithm we described reduced the influence of strong glitter, weak glitter, thin ice, and thin cloud shadows on the extraction results and improved the efficiency of the extraction of river surface widths.
In this study, we proposed a method using river surface width indexes, extracted by remote sensing, to evaluate whether ecological flow reaches the requested standards. The findings have deepened our understanding of multi-source remote sensing data and improved our ability to use remote sensing technology to automatically extract hydrological information. In addition, this method effectively alleviates the dependence on traditional methods for evaluating river ecological flow on ground-measured data and is of great significance for scientifically evaluating regional and global ecological river flow. Moreover, the goal of China’s assessment on ecological river flow is to meet the requirements of economic development from the perspective of water use, which needs to be considered in combination with China’s river characteristics and water demand. Under China’s river ecological flow evaluation standards, the minimum river water surface width was used as the evaluation standard to meet the requirements of China’s national conditions, and a theoretical basis was provided for effective use of river resources in China. This can enable the Chinese government [30] (The Ministry of Ecology and Environment and the Ministry of Water Resources of the People’s Republic of China) to manage water resources and river systems in the entire Chinese basin more appropriately, strengthen the adaptive management of ecological flows, establish ecological flow management strategies adapted for Chinese rivers, and coordinate economic and social relationships between river ecosystems to ensure sustainable use of water resources.

Author Contributions

Conceptualization, W.X. and Q.S.; project administration, X.W. and Q.W.; verification of the results, Y.Y. and W.H.; supervision, X.C. and J.L.; methodology, M.W. and F.Z. All authors have read and agreed to the published version of the manuscript.

Funding

This work was funded by the Strategic Priority Research Program Project of the Chinese Academy of Sciences (Grant No. XDA23040102), the National Natural Science Foundation of China (Grant Nos. 41571361 and 41871346), and IWHR Research & DevelopmentSupport Program (Grant No. WE0145B782017, WE0145B342016).

Conflicts of Interest

The authors declare no conflict of interest.

References

  1. Vörösmarty, C.J.; McIntyre, P.B.; Gessner, M.O.; Dudgeon, D.; Prusevich, A.; Green, P.; Glidden, S.; Bunn, S.E.; Sullivan, C.A.; Liermann, C.R.; et al. Global threats to human water security and river biodiversity. Nature 2010, 467, 555–561. [Google Scholar] [CrossRef] [PubMed]
  2. Jain, S.K. Assessment of environmental flow requirements. Hydrol. Process. 2012, 26, 3472–3476. [Google Scholar] [CrossRef]
  3. Yi, Y.; Zhang, S. Review of aquatic species habitat simulation method and modelling. Sci. Sin. Technol. 2019, 49, 363–377. [Google Scholar] [CrossRef]
  4. Hao, F.; Fengling, Y. Calculation of minimum discharge based on eco-hydraulics method. J. China Hydrol. 2016, 36, 40–43. [Google Scholar]
  5. Bjerklie, D.M.; Birkett, C.M.; Jones, J.W.; Carabajal, C.; Rover, J.A.; Fulton, J.W.; Garambois, P.A. Satellite remote sensing estimation of river discharge: Application to the Yukon River Alaska. J. Hydrol. 2018, 561, 1000–1018. [Google Scholar] [CrossRef] [Green Version]
  6. Zhao, C.; Yang, S.; Liu, J.; Liu, C.; Hao, F.; Wang, Z.; Zhang, H.; Song, J.; Mitrovic, S.M.; Lim, R.P. Linking fish tolerance to water quality criteria for the assessment of environmental flows: A practical method for streamflow regulation and pollution control. Water Res. 2018, 141, 96–108. [Google Scholar] [CrossRef]
  7. Pavelsky, T.M.; Smith, L.C. RivWidth: A software tool for the calculation of river widths from remotely sensed imagery. IEEE Geosci. Remote Sens. Lett. 2008, 5, 70–73. [Google Scholar] [CrossRef]
  8. Dey, A.; Bhattacharya, R.K. Monitoring of river center line and width—A study on river Brahmaputra. J. Indian Soc. Remote 2014, 42, 475–482. [Google Scholar] [CrossRef]
  9. Li, H. Research and Establishment of the Yangtze River Remote Sensing Monitoring System Based on Components—Taking the Application of Remote Sensing Monitoring in the Jiangsu Section of the Yangtze River as an Example. Ph.D. Thesis, Nanjing Normal University, Nanjing, China, 2006. [Google Scholar]
  10. Sun, W.; Ishidaira, H.; Bastola, S.; Yu, J. Estimating daily time series of streamflow using hydrological model calibrated based on satellite observations of river water surface width: Toward real world applications. Environ. Res. 2015, 139, 36–45. [Google Scholar] [CrossRef] [Green Version]
  11. Smith, L.C.; Isacks, B.L.; Forster, R.R.; Bloom, A.L.; Preuss, I. Estimation of discharge from braided glacial rivers using ERS 1 synthetic aperture radar: First results. Water Resour. Res. 1995, 31, 1325–1329. [Google Scholar] [CrossRef]
  12. Brakenridge, G.R.; Nghiem, S.V.; Anderson, E.; Mic, R. Orbital microwave measurement of river discharge and ice status. Water Resour. Res. 2007, 43, W04405. [Google Scholar] [CrossRef]
  13. Brakenridge, G.R.; Knox, J.C.; Paylor, E.D.; Magilligan, F.J. Radar remote sensing aids study of the great flood of 1993. Eos Trans. AGU 1994, 75, 521–527. [Google Scholar] [CrossRef]
  14. Smith, L.C. Satellite remote sensing of river inundation area, stage, and discharge: A review. Hydrol. Process. 1997, 11, 1427–1439. [Google Scholar] [CrossRef]
  15. Huang, Q.; Long, D.; Du, M.; Zeng, C.; Qiao, G.; Li, X.; Hou, A.; Hong, Y. Discharge estimation in high-mountain regions with improved methods using multisource remote sensing: A case study of the Upper Brahmaputra River. Remote Sens. Environ. 2018, 219, 115–134. [Google Scholar] [CrossRef]
  16. Sun, W.; Fan, J.; Wang, G.; Ishidaira, H.; Bastola, S.; Yu, J.; Fu, Y.H.; Kiem, A.S.; Zuo, D.; Xu, Z. Calibrating a hydrological model in a regional river of the Qinghai–Tibet Plateau using river water width determined from high spatial resolution satellite images. Remote Sens. Environ. 2018, 214, 100–114. [Google Scholar] [CrossRef]
  17. Li, L.; Jin, W.; Wang, B.; Xiang, Z.; Yin, X.; Xu, Z.; Zhang, Y. Relationship between land use types within riparian zones and community structure of diatom in Taizi River, China. Res. Environ. Sci. 2015, 28, 1662–1669. [Google Scholar] [CrossRef]
  18. Ning, Q. On the classification and causes of formation of different channel patterns. Acta Geol. Sin. 1985, 1, 1–10. [Google Scholar] [CrossRef]
  19. Li, G.Q.; Zhang, S.J.; Peng, W.Q.; Tan, H.W. The subdividing for instream flow calculation and the calculating of instream flow in the Taizi River Basin. J. China Inst. Water Resour. Hydropower Res. 2011, 1, 2. [Google Scholar]
  20. Wang, R.; Zheng, C. Analysis on the flow meter of Tangmazai Hydrologic Station. Mod. Agric. Sci. Technol. 2010, 227. [Google Scholar]
  21. Zhang, Y.-S.; Xie, Y.-L. Estimation of vegetation water content of NDVI and LSWI in MODIS image. Geogr. Sci. 2008, 28, 72–76. [Google Scholar]
  22. Xu, H.Q. Modification of normalised difference water index (ND-WI) to enhance open water features in remotely sensed imagery. Int. J. Remote Sens. 2006, 27, 3025–3033. [Google Scholar] [CrossRef]
  23. McFeeters, S.K. The use of the Normalized Difference Water Index (NDWI) in the delineation of open water features. Int. J. Remote Sens. 1996, 17, 1425–1432. [Google Scholar] [CrossRef]
  24. Shen, H. ENVI Remote Sensing Image Processing Method; Wuhan University Press: Wuhan, China, 2009. [Google Scholar]
  25. Zhang, F.; Li, J.; Zhang, B.; Shen, Q.; Ye, H.; Wang, S.; Lu, Z. A simple automated dynamic threshold extraction method for the classification of large water bodies from Landsat-8 OLI water index images. Int. J. Remote Sens. 2018, 39, 3429–3451. [Google Scholar] [CrossRef]
  26. Deng, S. ENVI Remote Sensing Image Processing Method; Higher Education Press: Beijing, China, 2014. [Google Scholar]
  27. Xu, Z.; Wu, W.; Yu, S. Ecological base flow: Progress and challenge. J. Hydraul. Eng. 2016, 35, 1–11. [Google Scholar] [CrossRef]
  28. Summary of Technical Policy Seminar on Water Environment and Aquatic Ecological Protection of Hydropower and Water Conservancy Construction Projects. State Environmental Protection Administration, 2006. No. 11. Available online: http://bbs.gohoedu.com/guo813081p1p1.html (accessed on 12 December 2016).
  29. Notice on Issuing the Water Pollution Prevention and Control Plan for Key River Basins (2016–2020). State Environmental Protection Administration, 2017; No. 142. Available online: http://www.mee.gov.cn/gkml/hbb/bwj/201710/t20171027_424176.htm. (accessed on 12 October 2017).
  30. Notice on Strengthening the Ecological Flow Supervision of Small Hydropower Stations in the Yangtze River Economic Zone. Agriculture, Water and Hydropower Bureau, 2019; No. 241. Available online: http://www.mwr.gov.cn/zwgk/zfxxgkml/201909/t20190902_1362055.html. (accessed on 21 August 2019).
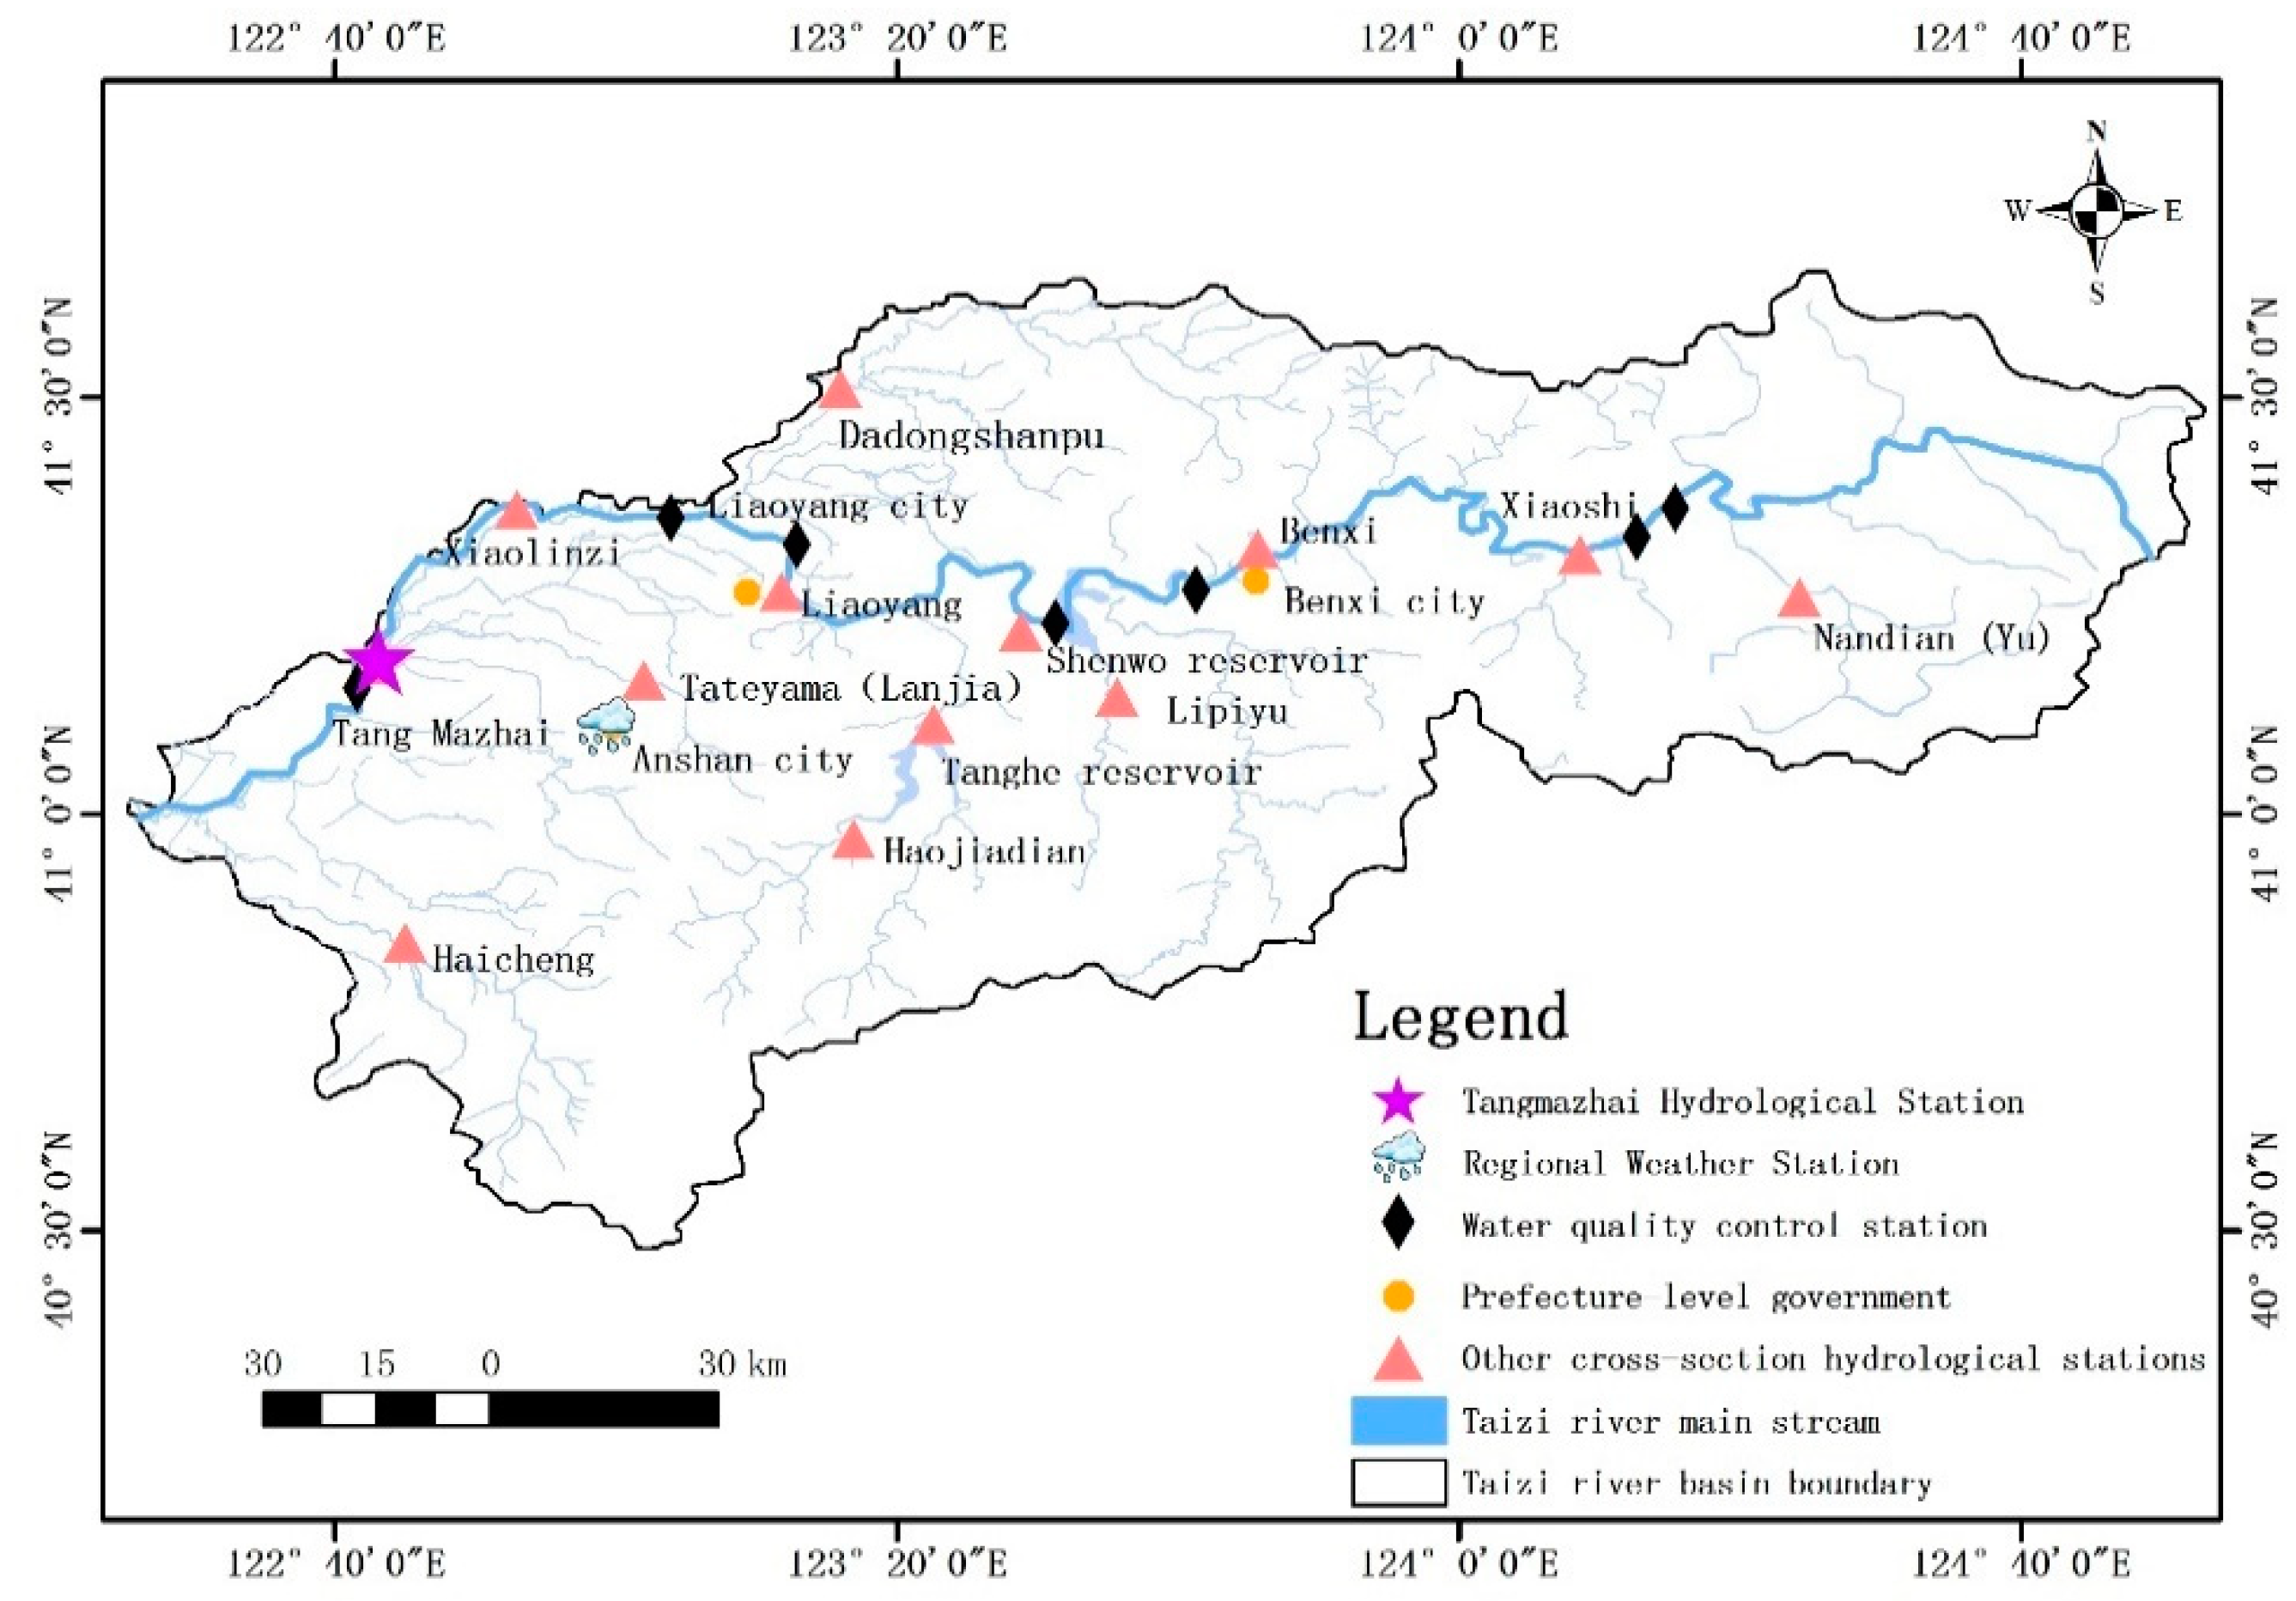
Figure 1. Map of Taizi River Basin [19].
Remotesensing 12 02899 g001
Figure 2. Satellite image and photograph of Tangmazhai cross-sectional line of Taizi River. (a) Original GF2 image (RGB: 3, 2, 1) and (b) field photo.
Remotesensing 12 02899 g002
Figure 3. River width calculations for different types of river. (a) Surface width of wandering and branching rivers and (b) width of straight and curved rivers.
Remotesensing 12 02899 g003
Figure 4. Process for automatic extraction of river surface width.
Remotesensing 12 02899 g004
Figure 5. Automatic classification of extracted water bodies (Iterative Self-Organizing Data Analysis Technique Algorithm (ISODATA)). (a) Original image (RGB: 3, 2, 1); (b) classification map of the GF2 unsupervised classification (ISODATA) of the Tangmazhai River on 28 September 2019; (c) mean value statistics of the classification results of several images from unsupervised classification (ISODATA).
Remotesensing 12 02899 g005
Figure 6. Minimum river surface width. (a) Schematic diagram of the discharge flow–water level relationship fitting curve of Tangmazhai Station on the Taizi River; (b) Water level diagram of the Tangmazhai cross-section, reflecting the relationship between water level and river width.
Remotesensing 12 02899 g006
Figure 7. Interannual variation in water surface width of the Tangmazhai cross-section of the Taizi River.
Remotesensing 12 02899 g007
Figure 8. Relationship between ecological water surface width and automated water surface width of different years.
Remotesensing 12 02899 g008
Figure 9. Accuracy assessment of river water surface width from different data sources. (a) GF-2 (0.8 m) automatic extraction and visual extraction; (b) other GF (2 m) automatic extraction and visual extraction; and (c) automatic extraction of river water surface width based on different sensors.
Remotesensing 12 02899 g009
Figure 10. Calculation of different water indexes. (a) Sentinel-2 remote sensing image data on July 26, 2019 (RGB: 4, 3, 2); (b) calculation of normalized difference water index (NDWI) water index; (c) calculation of improved normalized difference water index (modified NDWI (MNDWI)); (d) calculation of land surface water index land surface water index (LSWI).
Remotesensing 12 02899 g010
Figure 11. Comparison of water extraction methods. (a) NDWI–ISODATA automatic extraction of water bodies (RGB: 4, 3, 2); (b) NDWI–Modified Histogram Bimodal Method (MHBM) automatic extraction of water bodies (RGB: 4, 3, 2); (c) automatic extraction of river water surface width time series by remote sensing with different methods over a long time series (NDWI–MHBM and NDWI–ISODATA methods).
Remotesensing 12 02899 g011
Figure 12. Normalized digital number (DN) values for eight different situations: Strong glitter, weak glitter, thick cloud shadow, thin cloud shadow, thick ice, thin ice, thick cloud, and thin cloud.
Remotesensing 12 02899 g012
Table 1. Satellite data information.
TypesSeason2015 Year (Scene)2016 Year (Scene)2017 Year (Scene)2018 Year (Scene)2019 Year (Scene)BandBand Range/μmResolution/m
GF series (1A, 6, 1B, 1C, 1D) Spring//316Blue0.45–0.528
Summer///21Green0.52–0.598
Autumn/1/23Red0.63–0.698
Winter11345NIR0.77–0.898
Panchromatic0.45–0.902
GF-2Spring/1 1 Blue0.45–0.524
Summer1// 1Green0.52–0.594
Autumn22/11Red0.63–0.694
Winter/1 NIR0.77–0.894
Panchromatic0.45–0.900.8
Sentinel-2Spring/661821Blue0.44–0.53810
Summer/25158Green0.537–0.58210
Autumn161522/Red0.646–0.68410
Winter1492022NIR0.760–0.90810
SWIR 11.539–1.68220
SWIR 22.078–2.3220
Table 2. Minimum ecological flux, minimum ecological water level, and minimum water surface width of Taizi River from January 2015 to December 2018 (Tennant method).
Month (Month)123456789101112
Minimum ecological flux (m3/s) 2.732.752.822.7714.248.9513.7622.047.684.023.492.86
Minimum ecological water level (m) 3.13.13.13.13.33.23.33.43.23.13.13.1
Minimum river surface width (m) 84.084.084.084.0101.295.8101.2105.695.884.084.084.0
Table 3. Effects in different situations.
CategoryOriginal Image
(RGB: 4, 3, 2)
Normalized Water Index Image (NDWI) Image after Automatic Threshold Segmentation (ISODATA)
Weak glitter Remotesensing 12 02899 i001 Remotesensing 12 02899 i002 Remotesensing 12 02899 i003
Strong glitter Remotesensing 12 02899 i004 Remotesensing 12 02899 i005 Remotesensing 12 02899 i006
Thin ice Remotesensing 12 02899 i007 Remotesensing 12 02899 i008 Remotesensing 12 02899 i009
Thick ice Remotesensing 12 02899 i010 Remotesensing 12 02899 i011 Remotesensing 12 02899 i012
Thin cloudThick cloud Remotesensing 12 02899 i013 Remotesensing 12 02899 i014 Remotesensing 12 02899 i015
Thin cloud shadow Remotesensing 12 02899 i016 Remotesensing 12 02899 i017 Remotesensing 12 02899 i018
Thick cloud shadow Remotesensing 12 02899 i019 Remotesensing 12 02899 i020 Remotesensing 12 02899 i021